The Impact of the Federal Pandemic Unemployment ...
40
The Impact of the Federal Pandemic Unemployment Compensation on Job Search and Vacancy Creation * Ioana Marinescu † Daphne Skandalis ‡ Daniel Zhao § February 19, 2021 Abstract During the COVID-19 pandemic, the Federal Pandemic Unemployment Compen- sation (FPUC) increased US unemployment benefits by $600 a week. Theory predicts that FPUC will decrease job applications, and could decrease vacancy creation. We estimate the effect of FPUC on job applications and vacancy creation using granular data from the online jobs platform Glassdoor. We exploit variation in the proportional increase in benefits, in a panel at the week by local labor market level. To isolate the effect of FPUC, we flexibly allow for different trends in local labor markets differen- tially exposed to the COVID-19 crisis. We verify that trends in outcomes prior to the FPUC do not correlate with future increases in benefits, which supports our identi- fication assumption. First, we show that a 10% increase in unemployment benefits caused a 3.6% decline in applications, but did not decrease vacancy creation. Second, we document that tightness (vacancies/applications) was unusually depressed dur- ing the FPUC period: even though FPUC reduced applications, employers were still getting an unusually high number of applicants for their jobs. Overall, our results help explain the prior literature finding that FPUC did not decrease employment, and suggest that FPUC improved welfare by increasing tightness. Keywords: unemployment insurance, job vacancies, job applications, COVID-19 JEL Codes: J63, J64, J65 * We would like to thank Hyeri Choi and Jie Guan for excellent research assistance. † University of Pennsylvania & NBER ‡ University of Copenhagen, IZA. § Glassdoor, Inc.
Transcript of The Impact of the Federal Pandemic Unemployment ...
The Impact of the Federal Pandemic Unemployment
Compensation on Job Search and Vacancy Creation ∗
Ioana Marinescu† Daphne Skandalis‡ Daniel Zhao§
February 19, 2021
Abstract
During the COVID-19 pandemic, the Federal Pandemic Unemployment Compen-
sation (FPUC) increased US unemployment benefits by $600 a week. Theory predicts
that FPUC will decrease job applications, and could decrease vacancy creation. We
estimate the effect of FPUC on job applications and vacancy creation using granular
data from the online jobs platform Glassdoor. We exploit variation in the proportional
increase in benefits, in a panel at the week by local labor market level. To isolate the
effect of FPUC, we flexibly allow for different trends in local labor markets differen-
tially exposed to the COVID-19 crisis. We verify that trends in outcomes prior to the
FPUC do not correlate with future increases in benefits, which supports our identi-
fication assumption. First, we show that a 10% increase in unemployment benefits
caused a 3.6% decline in applications, but did not decrease vacancy creation. Second,
we document that tightness (vacancies/applications) was unusually depressed dur-
ing the FPUC period: even though FPUC reduced applications, employers were still
getting an unusually high number of applicants for their jobs. Overall, our results
help explain the prior literature finding that FPUC did not decrease employment,
and suggest that FPUC improved welfare by increasing tightness.
Keywords: unemployment insurance, job vacancies, job applications, COVID-19
JEL Codes: J63, J64, J65
∗We would like to thank Hyeri Choi and Jie Guan for excellent research assistance.†University of Pennsylvania & NBER‡University of Copenhagen, IZA.§Glassdoor, Inc.

1 Introduction
The coronavirus COVID-19 has had a dramatic impact on the US economy, with many
business closures and the unemployment rate skyrocketing to 14.7% in April 2020. In re-
sponse to the crisis, policy makers passed the CARES Act, which increased the level of
unemployment benefits by $600 a week (the Federal Pandemic Unemployment Compen-
sation (FPUC)). Ganong et al. (2020) find that, with FPUC, as many as two thirds of
unemployed workers have a replacement rate above 100%, i.e. they collect more in unem-
ployment benefits than their typical wage. As economic theory predicts that more generous
benefits decrease job search effort, this policy might have increased unemployment and de-
layed the recovery of the economy. However, all the early evidence suggests that there were
at most very limited effects on employment (Bartik et al. (2020); Altonji et al. (2020), Dube
(2020)). Why? We show that the FPUC did in fact have a negative effect on job search
effort, consistent with theoretical predictions. However, we also show that, first, FPUC did
not decrease vacancy creation. This finding is contrary to the theory that higher unem-
ployment insurance lowers the returns to vacancy creation, by exerting upward pressure
on wages. Second, we document that labor market tightness was unusually low during the
period when FPUC was implemented: since jobs were already receiving an unusually high
number of applications, a decrease in applications likely had limited effects on job find-
ing. Taken together, our empirical findings help understand why FPUC did not decrease
employment.
Identifying the effect of FPUC is challenging. In principle, one can estimate the effect
of FPUC by exploiting the large disparities in the proportional increase in unemployment
benefits: for workers who would have been eligible to lower weekly benefits levels before the
CARES Act, the additional $600 per week represents a larger relative increase. However,
the passage of the FPUC coincided with exceptionally large and brutal changes in the
labor market: just before the implementation of FPUC, the number of job listings collapsed
(Kahn et al., 2020), while the number of unemployed workers skyrocketed. What is more,
workers in low-paying jobs were most likely to lose their jobs, and these workers are precisely
the ones who experienced the largest increase in benefits with the FPUC. These shocks
are potential confounding factors for the identification of the effect of the FPUC on the
labor market. In this paper, we track labor market outcomes at a very granular level, which
allows us to include many controls to credibly neutralize the effect of the COVID-19 crisis.
We collect detailed data on job applications and job postings from Glassdoor.com,
for January 2018 to July 2020. We measure search effort and vacancy creation by count-
ing the number of applications and new job vacancy posting each week, in each local
labor market —defined as the interaction of state, occupations and industries and wage
deciles. To compute potential replacement rates for Glassdoor job seekers, we exploit the
rich information self-reported by Glassdoor users on their prior earnings. We then use the
1

benefits calculator created by Ganong et al. (2020), which computes unemployment ben-
efits based on individuals’ state of residence and pre-displacement quarterly earnings. To
strengthen the external validity of our analysis, we re-weigh observations such that each
State×industry×occupation reflects the proportion of the US labor force in that labor
market in the Current Population Survey (CPS) for 2018-2020.
In the first part of the paper, we estimate the impact of FPUC on search effort, job
vacancies and labor market tightness in March-July 2020. We exploit differences in propor-
tional increases in benefits across local labor markets. We include several control variables
to flexibly account for changes in the local labor market that were unrelated to the FPUC.
We allow for market-specific seasonal variation, using week-of-year by local labor market
fixed effects. We include state by week fixed effects to control for differential COVID-19
related policies across states, and other factors that change at the state level. We control
for industry by week fixed effects, which accounts for the differential impact of the crisis
by industry. Additionally, we allow for different trends in local labor markets that were
differentially exposed to the COVID-19 crisis, by including week×Exposure decile fixed ef-
fects. To measure exposure, we estimate the probability for workers of being unemployed in
January-March 2020 before the CARES Act based on local labor market’s characteristics,
using the CPS-ORG matched data (Flood et al. (2020)). We then predict the probability
of unemployment in each local labor market in our study sample using the estimated coeffi-
cients. Our identifying assumption is that, in the absence of the policy change, the outcome
variables would have evolved similarly in local labor markets with different increases in UI,
conditional on controls. We show that future increases in FPUC do not correlate with
trends in job applications, job vacancies or labor market tightness in the weeks prior to
the enactment of the FPUC. This supports the validity of our identification strategy.
We find that a 10% increase in the benefit replacement rate due to the FPUC leads
to a 3.6% decline in job applications, consistent with predictions from search models. At
the same time, we show that the FPUC had no effect on job vacancies. Therefore, a 10%
in the benefit replacement rate increased labor market tightness by 3.3%. Our finding of
no effect on vacancy creation is important to determine how FPUC affects unemployment.
Moreover, the effect on vacancies was a priori ambiguous as some models predict that
more generous UI should decrease vacancy creation through higher wage pressures, while
other models predict no effect (Landais et al., 2018). Our estimates allow us to look closely
at the timing of the effect of FPUC on job applications: the effect sharply increased in
the weeks following the CARES Act, then remained roughly constant until June, and
exhibited a slight and gradual decrease until the end of FPUC. This dynamic pattern is
consistent with the theoretical prediction that job seekers should increase their search effort
in anticipation of benefits exhaustion (Marinescu and Skandalis, 2021). Furthermore, we
show that the effects of FPUC on search effort are smaller in markets where workers are
more likely to be on temporary layoffs, and therefore exert less search effort as they expect
2

to be recalled. To confirm our main results, we use an alternative identification strategy:
we focus on the construction sector, where job loss before FPUC was not systematically
correlated with earnings and hence identification is less challenging. While the estimates
are naturally less precise than in the full sample, we see similar qualitative patterns: FPUC
decreased applications, had no effect on vacancies, and therefore ultimately increased labor
market tightness.
In the second part of the paper, we describe the context in which FPUC was imple-
mented, as it is crucial to assess the impact of FPUC on unemployment and welfare. We
document the evolution of applications, vacancies, and labor market tightness before and
during the time of the FPUC. It turns out that seasonally adjusted aggregate applications
slightly increased by 4.4% relative to January-February 2020, despite the negative effect of
FPUC on search effort. This probably reflects in part the drastic increase in the number
of unemployed workers. At the same time, job vacancies declined by 26%. As a result,
labor market tightness decreased by 31%. This implies that on average employers got more
applicants for their vacancies, and recruiting was easier. We then analyze separately the
evolution during two phases. While seasonally adjusted tightness was exceptionally low
during the first phase (March-May 2020), it came back roughly to its pre-COVID level in
the reopening phase (June-July 2020). Last, we analyze the heterogeneity in the evolution
of labor market tightness. Indeed, even though seasonally adjusted labor market tightness
was depressed during the FPUC period in the whole economy, one could be concerned
that recruitment difficulties increased in the local labor markets most affected by FPUC.
We show that even in the markets most affected by FPUC (4th quarter of the increase
in replacement rate due to FPUC), tightness during the FPUC was 19% lower than in
January-February 2020. We also document that the evolution of applications, vacancies
and labor market tightness is qualitatively similar across sectors.
We discuss how our results contribute to the understanding of the effect of unemploy-
ment insurance on the labor market. We conduct our analysis at the local labor market
level, so our approach focuses on the types of effects present in general equilibrium mod-
els. Although most models predict that more generous unemployment insurance should
decrease search, one important question in general equilibrium is to which extent unem-
ployment benefits affect vacancy creation, and hence labor market tightness. Landais et al.
(2018) formalize that higher unemployment benefits could decrease job creation because
they exert upward pressure on wages; in this case, higher unemployment benefits decrease
tightness. If higher unemployment benefits leave job creation unchanged, then tightness
increases, so labor market congestion increases for job seekers, resulting in a rat race. Our
findings confirm the empirical relevance of the rat race phenomenon as we show that FPUC
does not affect job creation and increases tightness.
We finally discuss how our results contribute to the assessment of the welfare impact
of the FPUC during the COVID-19 crisis. Landais et al. (2018) formalize that it is welfare
3

improving to increase the generosity of unemployment insurance when tightness is ineffi-
ciently low and unemployment insurance increases tightness. Our paper shows that FPUC
increased labor market tightness. Importantly, we also show that labor market tightness
was particularly low when FPUC was implemented, which suggests that the labor market
was in a region where increases in tightness were welfare improving. Taken together, our
results hence indicate that providing more generous unemployment insurance was desir-
able when FPUC was implemented, as it contributed to bringing labor market tightness
back towards a more efficient level. For a comprehensive welfare analysis of FPUC, one
should also take into account elements beyond labor market tightness, such as the welfare
gains associated with consumption smoothing for UI recipients, the stimulus effect of cash
payments, and the costs of unemployment during a pandemic. Although our findings do
not speak to these elements, we note that they would likely re-inforce our conclusion re-
garding the desirability of high unemployment insurance in the context of the COVID-19
crisis. Ganong et al. (2021) indeed show that increases in unemployment insurance had a
large effect on recipients’ consumption during the pandemic, which stimulated economic
activity and boosted employment. Moreover, having lower employment was probably not
very costly if not desirable, considering that employed workers were more at risk of getting
infected with COVID-19 and infecting others (Fang et al., 2020).
Our paper contributes to the body of work analyzing the effects the CARES Act on
employment. Several studies show no association between the extra $600 a week unem-
ployment insurance (FPUC) and employment, either using the Homebase dataset of hourly
employees in small businesses (Bartik et al., 2020; Altonji et al., 2020; Finamor and Scott,
2021) the Census Household Pulse Survey (Dube, 2020), or bank account data (Ganong
et al., 2021). Relative to this literature, we provide two major contributions. First, our
data allow us to improve the identification strategy. Measuring search effort and vacancy
creation instead of employment, and at a very granular level helps us control for variations
that are due to the COVID-19 crisis . Second, we provide explanations for the limited effect
of FPUC on employment: we show that FPUC did not affect vacancy creation; further-
more, we show that the large negative effect on search behavior happened at a time when
labor market tightness and hence returns to search were particularly low. Finally, the effect
of FPUC on search was the largest when tightness was the lowest.
Our paper also contributes to the theoretical analysis of the effect of FPUC on job
search behavior. Boar and Mongey and Petrosky-Nadeau (2020) emphasize that FPUC
should have only limited effects on job search behavior, given the temporary nature of
the CARES Act: job seekers should not turn down the long-term gains from getting a
job in a recession, for temporarily high unemployment benefits. Similarly, Mitman and
Rabinovich (2021) argue that it is important to account for workers’ expectations about
future unemployment benefits to define the optimal level and time profile of unemployment
insurance. Here, we provide suggestive evidence that the anticipation of the expiration
4
of FPUC contributed to attenuating its effects in July 2020. Our results are therefore
consistent with the idea that increases in unemployment insurance have smaller effects on
job search when workers anticipate that they are temporary.
Third, this article contributes to the empirical literature on the impact of unemployment
benefit levels on job search, and vacancy creation. The increase in the level of benefits
during the COVID-19 recession is larger than most of what the literature has been looking
at in the past (Schmieder and von Wachter, 2016). Our findings are consistent with the
estimated effect of unemployment insurance on search effort in prior literature (Krueger
and Mueller, 2010; Fradkin and Baker, 2017; Lichter and Schiprowski, 2020). They also
confirm the findings of dynamic effects in Marinescu and Skandalis (2021) and DellaVigna
et al. (2020). Moreover, our results add to the limited direct evidence on the impact of
unemployment benefits on vacancy creation: we find that the number of vacancies was
unaffected by the increase in unemployment insurance generosity, similar to what happened
during the Great Recession (Marinescu, 2017).
Last, our analysis contributes more generally to the study of the labor market during
COVID-19 (Bartik et al., 2020; Gupta et al., 2020; Cheng et al., 2020; Fairlie et al., 2020;
Montenovo et al., 2020). We add to work investigating trends in the applications and job
postings during COVID in Sweden (Hensvik et al., 2020), and job postings in the US (Kahn
et al., 2020; Campello et al., 2020; Forsythe et al., 2020a,b).
2 Data
We combine several datasets from Glassdoor, one of the world’s largest jobs and career
sites. We use job vacancy listings and job applications from Glassdoor’s online jobs platform
in April 2018 to December 2020 for the U.S. We also exploit information on self-reported
users’ salaries to measure the replacement rates they could be eligible for under the various
unemployment insurance programs.
2.1 Data on job listings and job applications
Job listings Glassdoor collects job openings from companies posting jobs directly to the
site, crawls of company career sites, direct feeds from applicant tracking systems and from
third-party job boards. Glassdoor then ties job listings data to specific industries from
employer self-reports and third-party data, and groups them into canonical occupations
that can be mapped into O*NET-SOC codes based on the job titles. In our analysis, we
focus on new job listings posted each week rather than the total stock of active job listings.
The flow of new job listings is more responsive to sharp changes in policy and labor market
conditions, and captures a disproportionate share of application activity.
Glassdoor’s job listings capture a large portion of online U.S. job listings, which them-
5

selves comprise a substantial percentage of all job openings. But job listings at very small
businesses or managed by unions that are typically not online may be underrepresented
(Chamberlain and Zhao, 2019). We hence use weights in all our analysis, based on the
average number workers in the labor force in the industry, occupation and state from the
Current Population Survey for 2018-2020. To test the validity of our data, we compare
our measure of job listings from Glassdoor with the measure from JOLTS in 2018-2020 in
Figure A.2. For both, we present the relative variation in the count of new job listing at
the monthly level, relative to the average in January-February 2020. We see that the two
measures move very closely, especially after 2019 (the correlation is 0.6 for 2019-2020). In
particular, the magnitude of the decrease in job listings in April and May is the same in
the two data sources.
Job applications To measure search effort, we take the count of applications, defined
as a user starting an application by clicking on the “Apply Now” button. Because click-
ing on the link takes users to other websites for some job listings, we do not directly
observe completed applications, but these actions should be a strong proxy for applying.
Applications provide a proxy of search effort, under the assumption that the probability of
applying on Glassdoor’s website rather than use other search channels is relatively stable
over time. We allocate applications into an industry and occupation category based on jobs
characteristics, and into a state based on applicants’ IP address.
We note that applications on Glassdoor don’t come only from unemployment benefits
recipients, therefore our estimates at the local labor market level also capture the search
effort of job seekers who do not receive UI. This is the right measure for our purpose as
it does not make a difference from the perspective of employers that applicants receive
UI or not. But we note that, as job seekers who do not receive UI should react less to
changes in the generosity unemployment insurance, these market level estimates should be
smaller than estimates of the microeconomic impact of the CARES Act on the search of
UI recipients.
2.2 Data on earnings and unemployment benefits
To study the role of UI generosity, we need to determine the “potential replacement rates”
for job seekers in our sample, i.e. the replacement rates that those eligible for unemploy-
ment insurance would receive at each point in time. The replacement rate level in normal
times depends on rules specific to each state. We use the benefits calculator created by
Ganong et al. (2020), which computes unemployment benefits based on individuals’ state
of residence and pre-displacement quarterly earnings based on UI guidance provided by
the Department of Labor. Once the standard replacement rate is determined, we just add
$600 lump-sum payments to standard weekly benefits levels to compute the replacement
rate with the FPUC.
6

We need two key pieces of information to compute the standard weekly benefits level:
the average weekly earnings before unemployment and the number of day worked for each
quarter in the year before unemployment. In our preferred wage measure, we use earnings
self-reported by Glassdoor users. Although it is not required to search for jobs on the
platform, some Glassdoor users report information on their prior jobs, including the job
title, employer, location and year associated with their wage. The wage information is very
detailed, and includes base salary and additional compensation like tips and cash bonuses.
This data hence provides rich granular information on earnings for a population relatively
close to the overall sample of applicants on Glassdoor’s search platform.1 We take the
average prior earnings for each state-occupation, using a very dis-aggregated occupation
definition (O*Net 6-digit codes, 416 categories).2 The second piece of information we need
to infer workers’ potential replacement rate is the number of days worked in each quarter
of the year before unemployment. We assume that individuals worked continuously during
the four quarters preceding unemployment. Indeed, this is the case for most individuals
eligible for unemployment insurance, given the average number of days worked reported in
the 2019 Annual Social and Economic Supplement (ASEC) of the CPS.
2.3 Panel at the week and local labor market level
We arrange our data as a panel, at the calendar week and local labor market level. To
be able to add granular fixed effects to our regressions, we define a local labor mar-
ket as the interaction of state, 2-digit occupations, 2-digit industries and wage deciles.
We keep local labor markets for which we observe at least 1000 applications in 2018-
2020, such that we are able to detect variation in weekly applications count. As men-
tioned in section 2.1, to ensure the external validity of our analysis, we re-weigh observa-
tions such that each industry×state×occupation in our sample reflects the share of that
industry×state×occupation in the labor force in the Current Population Survey for 2018-
2020. We present descriptive statistics for the main variables in Table A.1.
3 Institutional background and empirical strategy
3.1 Institutional background
The Federal Pandemic Unemployment Compensation (FPUC) The CARES Act
was signed into law on March 27 2020. It included a number of measures, including a
boost to unemployment insurance benefits, amounting to a budget item of 260 billion
1Karabarbounis and Pinto (2018) show that the average and variance of the distribution of salarieswithin geographical region and within industry are fairly representative when compared against the Quar-terly Census of Employment and Wages and Panel Study of Income Dynamics.
2We do not use industry for prior earnings because the cells become very small and most of the variationin wages is at the occupation rather than the industry level (Marinescu and Wolthoff, 2019).
7

dollars. The Federal Pandemic Unemployment Compensation (FPUC) was an additional
$600 a week of unemployment benefits for all workers eligible to unemployment insurance.
The FPUC was also available to workers who are not normally eligible for benefits, but
were eligible for Pandemic Emergency Unemployment Compensation (PEUC) benefits or
Pandemic Unemployment Assistance (PUA) benefits. PEUC provided an additional 13
weeks of benefits for those whose regular unemployment benefits have been exhausted.
PUA provided payment to workers not traditionally eligible for unemployment benefits
(self-employed, independent contractors, workers with limited work history, and others)
who were unable to work as a direct result of the coronavirus public health emergency.
The $600 FPUC amount was chosen to raise the UI replacement rate to around 100%
for the average U.S. worker. Because of technical issues in state unemployment insurance
systems, it was not possible to tailor FPUC to each worker’s prior earnings. The increase
in UI replacement rates associated with FPUC hence varied widely for two reasons. First,
a fixed $600 increase in benefits generated a larger increase in replacement rate for workers
with lower wages. Second, there were differences in the generosity of states’ pre-existing
unemployment insurance benefit formulas. Once the CARES Act was voted, on March
27, unemployed workers could anticipate their upcoming replacement rate, and potentially
adjust their behavior accordingly. But the actual payments only started in the following
weeks (Bartik et al., 2020). The last week that FPUC was paid was the week of July 20,
2020.3
Labor market shocks during the COVID-19 pandemic The enactment of FPUC
coincided with an exceptionally large and abrupt negative labor market shock, which any
analysis of FPUC must account for. In March, employment decreased precipitously and
unemployment skyrocketed (appendix Figure A.1). This shock was due to changes in eco-
nomic activities in response to the pandemic—either spontaneous or imposed by lockdown
measures. Importantly, this negative labor market shock disproportionately hit low-paying
jobs, and hence workers who experienced the largest increase in their potential replacement
rate due to FPUC. Therefore, failing to account for this shock would likely bias estimates
of the causal effect of FPUC on aggregate labor market outcomes such as employment or
labor market tightness.
3.2 Empirical strategy
Although the CARES Act increased the generosity of unemployment benefits for all workers
at the same time (up to some minor delays in implementation), there were large disparities
in the magnitude of this increase. For each local labor market, we compute a measure of
3According to the U.S. Department of Labor, “FPUC is not payable for any week of unemploymentending after July 31, 2020”. In all states the week of unemployment ends on a Saturday or a Sunday, sothe last week of FPUC was the week of July 20.
8

the relative increase in the benefits associated with FPUC: ln(UIFPUC
UI)s,o,i,w. We estimate
the association between the evolution of outcome variables relative to the week before the
CARES Act and the increase in benefits generosity.
Identification strategy We can identify the effect of the increase of FPUC under the
assumption that, in the absence of a change in unemployment insurance, the outcome
variable would have evolved similarly in local labor markets with different increases in
UI. The identification of the effect of FPUC on the outcome variables is threatened by
any factor that affects the outcomes around the date of the CARES Act and correlates
with the size of the increase in generosity in UI. These confounding factors are a major
concern as the COVID-19 epidemic caused large job destruction around that time, and
this destruction correlated with worker’s wages. We address this identification challenge in
several ways.
First, we control for various observable variables to capture the effect of the COVID-
19 crisis. As the COVID-19 crisis hit different states and industries in different ways, we
include time×state fixed effects, and time×industry fixed effects. We then go one step
further and directly detect the local labor markets that were hit the most by the COVID-
19 crisis, to allow for different trends in these markets: we predict the probability of being
unemployed prior to the CARES Act. We use the monthly CPS for January to March 2020,
matched with the Outgoing Rotation Group 2019 (ORG) (Flood et al., 2020). We predict
the probability of being unemployed in a logit model including industry, occupation, wage
decile and state fixed effects. We use the estimated coefficients from the logit regression to
predict the probability of being unemployed in our study sample. We take the deciles of
this predicted probability to proxy for the exposure to the impact of the COVID-19 crisis
on each local labor market, and we include time×Exposure decile fixed effects to control
away trends associated with the impact of the COVID-19 crisis on unemployment, rather
than the effect of FPUC.
Second, we test the plausibility of our identifying assumption by analyzing the correla-
tion between the evolution of outcomes before the CARES Act, and the magnitude of the
benefits increase induced by FPUC. If our identification strategy is valid, our pre-CARES
Act estimates should not be significant. This is equivalent to the test of the parallel trend
assumption in a differences-in-differences setup. We will show that when we implement
the various strategies to neutralize potential confounding factors, these estimates are close
to zero and insignificant. Our strategies hence seem appropriate to identify the effect of
FPUC.
Third, we conduct a robustness check where we focus on a segment of the economy
where identification problems appear less severe. Specifically, we analyze the correlation or
prior earnings with the probability to become unemployed at the onset of the COVID-19
crisis, by sector. Like for our measure of exposure to the COVID-19 crisis, we use the
9

monthly CPS for January to March 2020, matched with the Outgoing Rotation Group
2019 (ORG). Coefficients are reported in Table A.2. Consistent with descriptive statistics
presented in Figure A.1, we find that there is a strong negative relationship between prior
earnings and the risk of unemployment (coefficients are reported in Table A.2). But we see
that this correlation is small and insignificant in the Construction sector (in the Mining
sector as well, but there is virtually no applications for this sector on Glassdoor). We hence
implement a case study in the Construction sector.4 Compared to the first approach, we
do not include week by state, week by industry and week by exposure fixed effects; the
advantage of this case study is that we don’t impose any functional form to the confounding
effect of the COVID-19 crisis on outcomes. However, it restricts the sample drastically, and
we lose in precision and external validity. As the effect of the FPUC might not be completely
homogeneous across sectors, we should not expect the estimates to be exactly identical,
but it is a useful robustness check for our qualitative conclusions.
Estimation models We estimate the following model:
ln(Yt,s,o,i,w) =∑τ 6=−1
βτ · 1[t = FPUC + τ ] · ln(UIFPUCUI
)s,o,i,w + δs,o,i,w+
λweek(t),s,o,i,w + ρs,t + φi,t + ψt,Exposure(s,i) + εt,s,o,i,w
(1)
ln(Yt,s,o,i,w) denotes the logged outcome variable in calendar week t, state s, occupation
o, industry i and wage decile w. The term 1[t = FPUC + τ ] indicates that the calendar
week t is τ weeks before the start of FPUC (for τ < 0), or after (for τ ≥ 0). The βτ are the
coefficients of interest: for τ < 0, they help test the identifying assumption. For τ ≥ 0, the
coefficients represent the effect of the relative increase in weekly benefits induced by FPUC
on the outcome variable if the identification strategy is valid, and can be interpreted as an
elasticity. δs,o,i,w are local labor market fixed effects, εt,s,o,i,w is the error term. We cluster
standard errors at the state level.
Our preferred specification includes various other control variables. We include week-
of-year×local labor market fixed effect, λweek(t),s,o,i,w, to control away seasonal variations.
To isolate the effect of FPUC form the effect of the COVID-19 crisis (and potentially other
confounders), we let time t fixed effects vary by state (ρs,t), industry (φi,t) and Exposure
decile (ψt,Exposure(s,i)).
4There is substantial variation in earnings between the most frequent occupations in the constructionsector. Prior weekly earnings in CPS-ORG range around $1410 for property, real estate, and communityassociation managers ; $1020 for electricians, construction equipment operators ; $960 for constructionlaborers, carpenters and masons.
10

4 The impact of FPUC on the labor market
4.1 Main results
Pre-FPUC trends Figure 1 presents the correlation between various labor market out-
comes and the increase in UI generosity induced by FPUC, week by week. We present
our preferred specification, including the full set of controls: time×state fixed effects,
time×industry fixed effects and time×Exposure decile fixed effects. In the three panels,
we see that there is no significant correlation between applications and future benefits
increases, in weeks prior to the adoption of FPUC. This supports the credibility of our
identifying assumption that the evolution of outcomes would be similar in markets which
experienced different benefits increases in the absence of FPUC, conditional on the control
variables included. This provides support to the validity of our identification strategy, and
suggests that the coefficients we estimate for the period after the adoption of FPUC in
Figure 1 can be interpreted as the causal effect of FPUC.
11

Figure 1: The impact of FPUC on applications, vacancies and tightness, week by week
(1) Applications (2) Vacancies (3) Labor market tightness
Notes: This Figure reports the estimates from regressions of the logged count of applications, the logged count of vacancies, and the logged labormarket tightness (i.e. ratio of vacancies over applications) on the interaction of each week around the enactment of the FPUC and the potentialincrease in UI generosity ln(UIFPUC
UI ). The coefficients before the enactment of the FPUC help test our identification assumption. The coefficientsafter represent the elasticity of the outcome with respect to benefits levels. We use a panel at the calendar week and local labor market level—wherelocal labor markets are defined as as the interaction of state, 2-digit occupations and 2-digit industries and wage deciles. We include calendar weekand local labor market fixed effects. We control for seasonality using week-of-year×local labor market fixed effects. This Figure presents our preferredspecification, with the full set of controls for potential confounders: time×state fixed effects, time×industry fixed effects and time×Exposure decilesfixed effects. We use weights to reflect the proportion of the labor force in each State×industry×occupation in the CPS. Thin lines denote 95%confidence intervals, based on robust SE clustered at the state level.
12
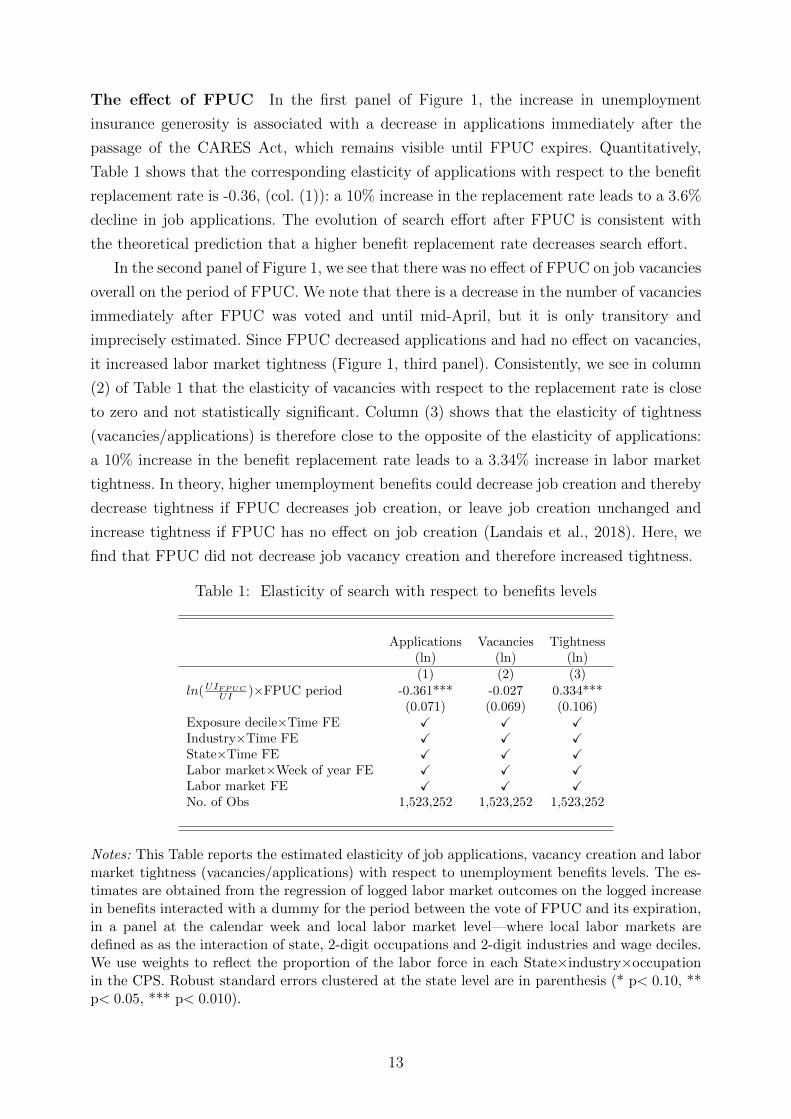
The effect of FPUC In the first panel of Figure 1, the increase in unemployment
insurance generosity is associated with a decrease in applications immediately after the
passage of the CARES Act, which remains visible until FPUC expires. Quantitatively,
Table 1 shows that the corresponding elasticity of applications with respect to the benefit
replacement rate is -0.36, (col. (1)): a 10% increase in the replacement rate leads to a 3.6%
decline in job applications. The evolution of search effort after FPUC is consistent with
the theoretical prediction that a higher benefit replacement rate decreases search effort.
In the second panel of Figure 1, we see that there was no effect of FPUC on job vacancies
overall on the period of FPUC. We note that there is a decrease in the number of vacancies
immediately after FPUC was voted and until mid-April, but it is only transitory and
imprecisely estimated. Since FPUC decreased applications and had no effect on vacancies,
it increased labor market tightness (Figure 1, third panel). Consistently, we see in column
(2) of Table 1 that the elasticity of vacancies with respect to the replacement rate is close
to zero and not statistically significant. Column (3) shows that the elasticity of tightness
(vacancies/applications) is therefore close to the opposite of the elasticity of applications:
a 10% increase in the benefit replacement rate leads to a 3.34% increase in labor market
tightness. In theory, higher unemployment benefits could decrease job creation and thereby
decrease tightness if FPUC decreases job creation, or leave job creation unchanged and
increase tightness if FPUC has no effect on job creation (Landais et al., 2018). Here, we
find that FPUC did not decrease job vacancy creation and therefore increased tightness.
Table 1: Elasticity of search with respect to benefits levels
Applications Vacancies Tightness(ln) (ln) (ln)(1) (2) (3)
ln(UIFPUC
UI )×FPUC period -0.361*** -0.027 0.334***(0.071) (0.069) (0.106)
Exposure decile×Time FE X X XIndustry×Time FE X X XState×Time FE X X XLabor market×Week of year FE X X XLabor market FE X X XNo. of Obs 1,523,252 1,523,252 1,523,252
Notes: This Table reports the estimated elasticity of job applications, vacancy creation and labormarket tightness (vacancies/applications) with respect to unemployment benefits levels. The es-timates are obtained from the regression of logged labor market outcomes on the logged increasein benefits interacted with a dummy for the period between the vote of FPUC and its expiration,in a panel at the calendar week and local labor market level—where local labor markets aredefined as as the interaction of state, 2-digit occupations and 2-digit industries and wage deciles.We use weights to reflect the proportion of the labor force in each State×industry×occupationin the CPS. Robust standard errors clustered at the state level are in parenthesis (* p< 0.10, **p< 0.05, *** p< 0.010).
13

Table 2: Additional results on the impact of FPUC on search effort
Applications (ln)(1) (2) (3) (4)
ln(UIFPUC
UI )×FPUC period, March -0.144*(0.079)
ln(UIFPUC
UI )×FPUC period, April -0.385***(0.075)
ln(UIFPUC
UI )×FPUC period, May -0.436***(0.065)
ln(UIFPUC
UI )×FPUC period, June -0.395***(0.080)
ln(UIFPUC
UI )×FPUC period, July -0.326***(0.085)
Q2 of benefits increase×FPUC period -0.113***(0.029)
Q3 of benefits increase×FPUC period -0.184***(0.037)
Q4 of benefits increase×FPUC period -0.188***(0.046)
ln(UIFPUC
UI )×FPUC period × Telework -0.382***(0.100)
ln(UIFPUC
UI )×FPUC period × Not Telework -0.311***(0.086)
FPUC period × Telework 0.131(0.141)
ln(UIFPUC
UI )×FPUC period × High Temp Layoff -0.173**(0.080)
ln(UIFPUC
UI )×FPUC period × Low Temp Layoff -0.414***(0.075)
FPUC period × High Temp Layoff -0.361***(0.107)
P-Value Test May = July .013P-Value Test Telework = Not Telework .554P-Value Test High = Low .009Exposure decile×Time FE X X X XIndustry×Time FE X X X XState×Time FE X X X XLabor market×Week of year FE X X X XLabor market FE X X X XNo. of Obs 1,523,252 1,523,252 1,496,988 1,523,252
Notes: This Table reports the estimates from the regression of logged search effort on variousindependent variables, in a panel at the calendar week and local labor market level—wherelocal labor markets are defined as as the interaction of state, 2-digit occupations and 2-digitindustries and wage deciles. We use weights to reflect the proportion of the labor force in eachState×industry×occupation in the CPS. Robust standard errors clustered at the state level arein parenthesis (* p< 0.10, ** p< 0.05, *** p< 0.010).
4.2 Additional results and robustness checks
Additional results We first analyze the timing of the effect of FPUC on search effort.
In Figure 1 (panel (1)), we see that the negative effect on search strongly increased in the
first 3 weeks. This could indicate that job seekers did not fully react until they started
to receive the $600 benefits supplement, which happened with small delays. The effect
14

then remained roughly constant until June, and exhibited a slight and gradual decrease
until the end of FPUC. To confirm this pattern, we report the estimate for the effect of
FPUC during each month separately in column (1) of Table 2. The estimated elasticity is
-0.44 in May, at its largest; in July, as the extra benefits are about to expire, the elasticity
is statistically significantly smaller in absolute value at -0.33. This is consistent with the
theoretical prediction that job seekers should increase their search effort in anticipation of
their benefits exhaustion.
We then analyze more flexibly the relationship between applications and the increase in
unemployment benefits induced by FPUC. Instead of assuming a log-linear relation between
replacement rates and applications, we look separately at the evolution of applications in
local labor markets at different quartiles of the distribution of relative increase in benefits
in column (2) of Table 2. We see that the decrease in applications was larger for labor
markets in the second, third and fourth quartile than for those in the first quartile, i.e.
those which experienced the smallest increase in benefits (which serve as reference in col
(2)). Moreover, comparing the coefficients for the second, third and fourth quartiles, we
also see that the largest increase in unemployment benefits was associated with the largest
decrease in applications.
Did the effect of FPUC on applications interact with the effect of the COVID-19 crisis?
One could expect that the reaction of job seekers to the increase in unemployment insurance
was smaller than in normal times, because COVID-19 imposed constraints on search and on
work. To examine this question, we investigate whether the elasticity of search effort with
respect to unemployment benefits was different in occupations that can only be performed
in-person. We classify all occupations as “teleworkable” or not, based on the results of
Dingel and Neiman (2020). We find in column (3) of Table 2 that the increase in search
effort in response to FPUC was larger in teleworkable occupations (elasticity of -0.38) than
in “not teleworkable” occupations (-0.31), although the difference is not significant. This
is consistent with the idea that factors specific to the COVID-19 pandemic such as the
risk of infection in certain occupations attenuated the effect of unemployment insurance
on search activities. But the effect was still there.
The situation of unemployed workers during the COVID-19 crisis was atypical, as a
large fraction of them were on temporary layoff (Birinci et al., 2021). As workers who ex-
pect to be recalled have fewer incentives to search for a job, this could also have contributed
to attenuate the effect of unemployment insurance on search effort. We investigate how the
prevalence of temporary layoffs affects our results. We estimate the chance to be on tempo-
rary layoff in the CPS for January to July 2020 conditional on being unemployed, in a logit
model with two-digit occupation, two-digit industry state and wage decile fixed effects. We
predict the probability of temporary layoff among unemployed workers in each local labor
market based on the estimated coefficients. We consider that markets above the median
have a high chance of temporary layoff, while those below the median have a low chance.
15
In col (4) of Table 2, we estimate that the effect of FPUC on search effort is significantly
smaller in markets with a high chance of temporary layoff (elasticity of -0.17) than in the
others (elasticity of -0.41). This suggests that the prevalence of temporary layoffs during
the COVID-19 crisis has contributed to attenuating the effect of unemployment insurance
on job search behavior.
Other specifications To illustrate the role of the controls we include, we present the
estimates when we add them one by one for applications in Figure A.3, for vacancies in
Figure A.4 and for tightness in Figure A.5. We see for all figures that the control variables
we successively add all contribute to making the pre-trends disappear. This confirms the
economic intuitions behind our estimation strategy. In particular, the pattern in panel (2)
of Figure A.3, obtained when we only control for seasonality, is consistent with the idea that
the coefficients before the CARES Act capture the shocks in the labor market due to the
COVID-19 crisis: we estimate a steep increase in applications correlated with the future
increase in UI generosity in the weeks before the CARES ACt, which might reflect the
abrupt surge in unemployment among low-wage workers in that period. In Figure A.4, we
see that controlling for industry by week fixed effects (panel (4)) is particularly important
for the results on vacancies: without them, it looks like the effect of FPUC on vacancies
is positive. This suggests that the COVID-19 crisis affected job creation differentially in
different industries, and not accounting for it would bias the estimate of the impact of
FPUC.
Reassuringly, we note that although the different controls seem to improve our identifi-
cation of the effect of FPUC in ways that make economic sense, our qualitative conclusions
do not crucially depend on them. The estimates obtained in all the specifications in A.3
are suggestive of a negative effect of FPUC on job search. None of the specifications in
Figure A.4 provide any indication of a negative effect on vacancy creation, as one could
have expected if the “job creation” channel had dominated Landais et al. (2018)—on the
contrary, some specifications could even have suggested a positive effect. Finally, the esti-
mates obtained in all the specifications in Figure A.5 are suggestive of a positive effect of
FPUC on tightness.
Alternative identification strategy To confirm our main results, we use an alternative
identification strategy: we focus on the construction sector, where job loss before FPUC
was not systematically correlated with earnings. While the estimates are naturally less
precise than in the full data, we see very similar qualitative patterns: FPUC decreased
applications, had no effect on vacancies, and therefore ultimately increased labor market
tightness (Figure A.6). These results are reassuring: our key results hold in a segment of
the economy where there are no substantial factors confounding the identification of the
effect of FPUC.
16

5 Labor market tightness during the FPUC
We have shown that FPUC decreased search effort but left vacancies unchanged. In order to
fully understand the impact of FPUC, it is crucial to document the labor market situation
when it was introduced. In this part, we describe the evolution of labor market tightness,
which determines workers’ ability to find jobs, and employers’ ability to fill their vacancies.
5.1 The evolution of labor market tightness relative to pre-covid
We present the evolution of seasonally adjusted applications, new vacancy postings, and
labor market tightness relative to their baseline levels in Jan-Feb 2020 in Figure 2. Despite
the negative effect of FPUC on job applications, there is no decline in aggregate job appli-
cations, likely because the number of unemployed people increased (appendix Figure A.1)
at the same time as FPUC reduced applications. In the non seasonally adjusted series (Fig-
ure A.7, left panel), applications decline a bit after FPUC, but this pattern occurs every
year (appendix Figure A.8). In contrast, the number of vacancies strongly declined both
before and right after FPUC. Since applications stayed constant, the decline in vacancies
drove the evolution of labor market tightness (vacancies/applications).
Quantitatively, seasonally adjusted labor market tightness declined by 30.6% during the
FPUC period relative to January-February 2020 (Table 3, col. 3, upper panel), reflecting a
labor market more favorable to recruiting firms, despite the large increase in unemployment
benefits. During the whole FPUC period, Applications slightly increased by 4.4% (col. 1,
upper panel), while vacancies declined by 26.2% (col. 2). During the reopening phase, in
June-July 2020, seasonally adjusted labor market tightness was similar to its level in Jan.-
Feb. 2020 (Table 3, col. 3, lower panel). Applications (col. 1) and vacancies (col. 2) were
also roughly at the same level as in Jan.-Feb. 2020.
5.2 Heterogeneity
Even though seasonally ajdusted labor market tightness remained relatively depressed
throughout the FPUC period, one could be concerned that recruitment difficulties increased
in the local labor markets most affected by FPUC. However, even in the markets most
affected by FPUC (4th quarter of the increase in replacement rate due to FPUC), tightness
during FPUC was 19% lower than in January-February 2020 (Table 3, col. 7, upper panel).
During the re-opening phase in June-July 2020, tightness was higher than during the
depth of the COVID crisis in March-May 2020, and markets with a higher increase in
the replacement rate (higher quartiles) saw a stronger rebound in tightness in June-July
2020 (Table 3, lower panel col 4-7, and Figure A.9). For the fourth quartile, which saw the
highest increase in the replacement rate, seasonally adjusted tightness in June-July 2020
was slightly higher (12.6%) than it was at the beginning of 2020 (Table 3, lower panel, col.
17

Figure 2: Changes in applications, vacancies, and labor market tightness relative toJan-Feb 2020 (seasonally adjusted)
Notes: The Figure presents the seasonally adjusted changes in the total weekly count of applica-tions, the weekly count of new posted vacancies, and labor market tightness (ratio of vacanciesover total applications), relative to their baseline levels in Jan-Feb 2020. The Figure is obtainedby regressing the logged variables on the calendar week coefficients and week-of-year fixed effectsto control for seasonal variation, and then subtracting to each calendar week coefficient the aver-age of estimates for Jan-Feb 2020. We use weights to reflect the proportion of the labor force ineach State×industry×occupation in the CPS.
18
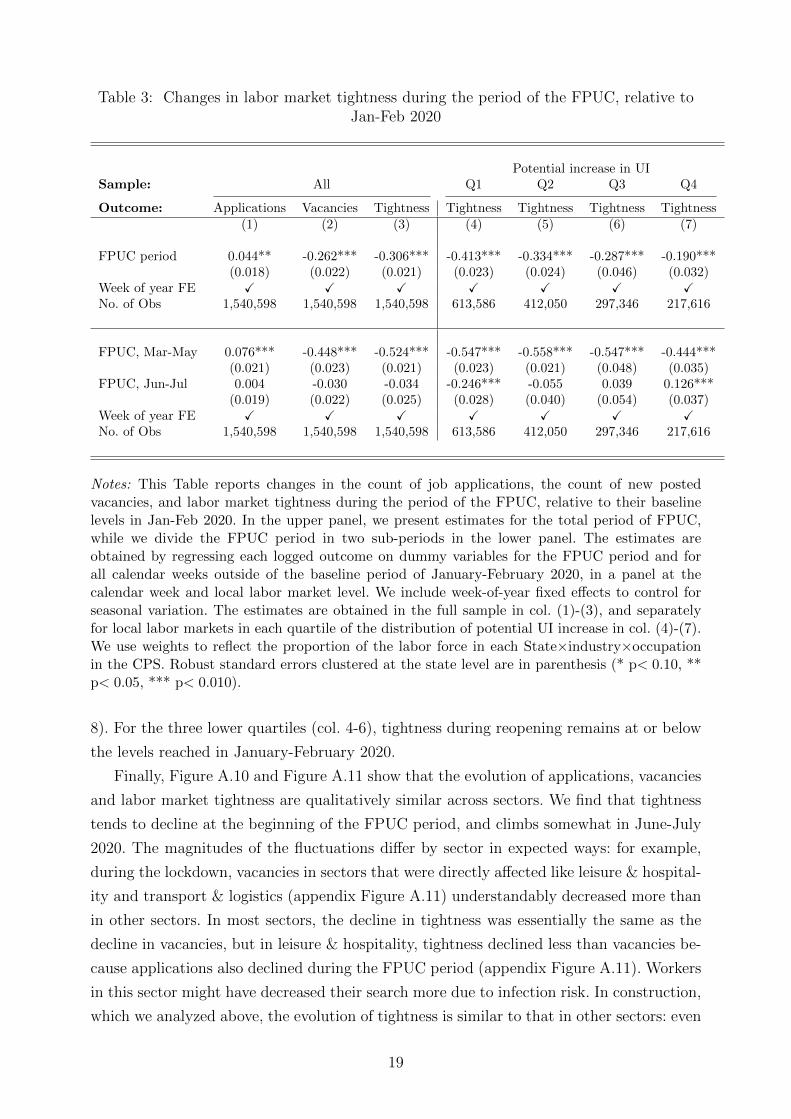
Table 3: Changes in labor market tightness during the period of the FPUC, relative toJan-Feb 2020
Potential increase in UISample: All Q1 Q2 Q3 Q4
Outcome: Applications Vacancies Tightness Tightness Tightness Tightness Tightness(1) (2) (3) (4) (5) (6) (7)
FPUC period 0.044** -0.262*** -0.306*** -0.413*** -0.334*** -0.287*** -0.190***(0.018) (0.022) (0.021) (0.023) (0.024) (0.046) (0.032)
Week of year FE X X X X X X XNo. of Obs 1,540,598 1,540,598 1,540,598 613,586 412,050 297,346 217,616
FPUC, Mar-May 0.076*** -0.448*** -0.524*** -0.547*** -0.558*** -0.547*** -0.444***(0.021) (0.023) (0.021) (0.023) (0.021) (0.048) (0.035)
FPUC, Jun-Jul 0.004 -0.030 -0.034 -0.246*** -0.055 0.039 0.126***(0.019) (0.022) (0.025) (0.028) (0.040) (0.054) (0.037)
Week of year FE X X X X X X XNo. of Obs 1,540,598 1,540,598 1,540,598 613,586 412,050 297,346 217,616
Notes: This Table reports changes in the count of job applications, the count of new postedvacancies, and labor market tightness during the period of the FPUC, relative to their baselinelevels in Jan-Feb 2020. In the upper panel, we present estimates for the total period of FPUC,while we divide the FPUC period in two sub-periods in the lower panel. The estimates areobtained by regressing each logged outcome on dummy variables for the FPUC period and forall calendar weeks outside of the baseline period of January-February 2020, in a panel at thecalendar week and local labor market level. We include week-of-year fixed effects to control forseasonal variation. The estimates are obtained in the full sample in col. (1)-(3), and separatelyfor local labor markets in each quartile of the distribution of potential UI increase in col. (4)-(7).We use weights to reflect the proportion of the labor force in each State×industry×occupationin the CPS. Robust standard errors clustered at the state level are in parenthesis (* p< 0.10, **p< 0.05, *** p< 0.010).
8). For the three lower quartiles (col. 4-6), tightness during reopening remains at or below
the levels reached in January-February 2020.
Finally, Figure A.10 and Figure A.11 show that the evolution of applications, vacancies
and labor market tightness are qualitatively similar across sectors. We find that tightness
tends to decline at the beginning of the FPUC period, and climbs somewhat in June-July
2020. The magnitudes of the fluctuations differ by sector in expected ways: for example,
during the lockdown, vacancies in sectors that were directly affected like leisure & hospital-
ity and transport & logistics (appendix Figure A.11) understandably decreased more than
in other sectors. In most sectors, the decline in tightness was essentially the same as the
decline in vacancies, but in leisure & hospitality, tightness declined less than vacancies be-
cause applications also declined during the FPUC period (appendix Figure A.11). Workers
in this sector might have decreased their search more due to infection risk. In construction,
which we analyzed above, the evolution of tightness is similar to that in other sectors: even
19
though FPUC clearly increased tightness, tightness during the FPUC period was mostly
below tightness in January-February 2020. This indicates that, in the absence of FPUC,
tightness in the construction sector would have been significantly above its pre-crisis level,
leading to a rat race for jobs.
6 Discussion
6.1 Was the impact of FPUC on the labor market consistent
with theoretical predictions?
We discuss how our results contribute to the understanding of the effect of unemployment
insurance on the labor market. Although most models predict that more generous unem-
ployment insurance should decrease search, one important question in general equilibrium
models is to which extent unemployment benefits affect vacancy creation, and hence labor
market tightness (Landais et al., 2018). In standard models, higher unemployment bene-
fits exert upward pressure on wages by raising the outside option of unemployed workers,
thereby discouraging job creation by firms. As both job search and vacancy creation de-
crease, the effect on labor market tightness is limited. In contrast, in models with labor
market rigidities (“rat race” labor market), job creation is relatively unresponsive to unem-
ployed workers’ search behavior. Higher unemployment insurance decreases search effort
without affecting vacancy creation, and therefore increases labor market tightness. This
implies that the competition for jobs decreases. Our results are consistent with the second
type of models: they suggest that during FPUC, job creation was unresponsive to unem-
ployment insurance, like in a “rat race” labor market. This is consistent with the findings
from prior unemployment benefits increases during recessions (Marinescu, 2017).
The job creation effect is important to understand the effect of FPUC on unemploy-
ment. In a “rat race” labor market although UI discourages job search, the effect of UI
on aggregate unemployment is lower than what would be predicted based on a partial
equilibrium model of individual job seeker behavior (Landais et al., 2018). Indeed, because
UI increases labor market tightness, it increases the returns to each unit of search effort.
Additionally, we documented that labor market tightness was particularly low when FPUC
was implemented, such that decreasing search effort likely had much more limited effects
on unemployment. Our findings altogether help explain why prior studies have found no
effect of FPUC on unemployment (Bartik et al., 2020; Altonji et al., 2020; Finamor and
Scott, 2021; Dube, 2020).
Additionally, we provide suggestive evidence that unemployed workers’ expectations of
their future benefits affected their behavior during FPUC. Our empirical strategy identi-
fies the effect of FPUC week by week from its enactment to its expiration. Because the
CARES Act increased benefits during the same period for all unemployed workers, the
20

changes in the effect of FPUC over time partly reflect the changes in each unemployed
worker’s behavior—of course these changes can also be affected by other factors, such
as changes in the composition of unemployed workers. Models with finite-duration ben-
efits predict that the negative effect on search effort should be large at the start, but it
should gradually dissipate as job seekers anticipate their benefits exhaustion (Marinescu
and Skandalis, 2021). Similarly, Boar and Mongey and Petrosky-Nadeau (2020) emphasize
that FPUC should have only limited effects on job search behavior because of its tem-
porary nature ; Mitman and Rabinovich (2021) incorporate workers’ expectations about
future unemployment benefits in their model to derive the optimal level and time profile
of unemployment insurance. Our results suggest that the anticipation of the expiration
of FPUC might have contributed to attenuating its effects in July 2020. Our results are
therefore consistent with the idea that increases in unemployment insurance have smaller
effects on job search when workers anticipate that they are temporary.
6.2 The impact of FPUC on welfare
Our results speak to aspects of the impact of FPUC on welfare that have to to with labor
market tightness. Landais et al. (2018) formalize that the welfare impact of unemployment
insurance depends on three elements: first, its impact on labor market tightness; second,
the impact of tightness on welfare, and third, the trade-off between consumption smoothing
and moral hazard. Our paper provides evidence on the first two. Landais et al. (2018) show
that it is welfare improving to increase tightness when it is particularly low: it strongly
decreases the cost of unemployment to job seekers without a commensurate increase in
recruitment difficulties for employers. Since FPUC decreased tightness at a time when it
was particularly low, it likely increased welfare by bringing labor market tightness back
towards a more efficient level.
While our analysis focuses on labor market tightness, one should also consider other
important elements to determine the welfare impact of FPUC. First, it is very likely that UI
recipients were liquidity constrained during the crisis, and that FPUC was hence crucial to
sustain their consumption. Second, during the COVID-19 crisis, the sanitary situation made
unemployment much more desirable than in normal times: to the extent that unemployed
workers were less likely to get infected with COVID-19 and infect others, unemployment
was associated with welfare gains (Fang et al., 2020). Third, FPUC could have a stimulus
effect. Overall, these elements all point towards the desirability of high unemployment
insurance benefits during this crisis.
21

7 Conclusion
During the COVID-19 crisis, a 10% increase in unemployment benefits due to the Federal
Unemployment Pandemic Assistance (FPUC) led to a 3.6% decline in Glassdoor job ap-
plications. Since the FPUC had no effect on vacancies, its effect on applications led to a
commensurate 3.3% increase in labor market tightness (vacancies/applications). However,
despite the negative effect of FPUC on applications, seasonally adjusted aggregate job ap-
plications remained fairly stable during the FPUC period. With a 4% increase in aggregate
applications and a steep 26% decline in job vacancies relative to January-February 2020,
seasonally adjusted labor market tightness declined by 31% during the FPUC period. Even
in the top 25% of labor markets with the highest increase in the level of unemployment
benefits, tightness still declined by 19% during the FPUC period. By decreasing applica-
tions, FPUC has thus contributed to lifting up a depressed labor market tightness, likely
increasing welfare. Our results can help explain why higher unemployment benefits had
no effect on employment after the CARES Act (Bartik et al., 2020; Altonji et al., 2020;
Dube, 2020). In a context of excessive competition for jobs among workers, more generous
unemployment insurance reduces wasteful applications and has little effect on employment.
22

Bibliography
Altonji J, Contractor Z, Finamor L, Haygood R, Lindenlaub I, Meghir C, OaDea C, ScottD, Wang L, Washington E. 2020. Employment Effects of Unemployment InsuranceGenerosity During the Pandemic : 24.
Bartik A, Bertrand M, Lin F, Rothstein J, Unrath M. 2020. Measuring the Labor Marketat the Onset of the COVID-19 Crisis. SSRN Electronic Journal ISSN 1556-5068.URL https://www.ssrn.com/abstract=3633053
Birinci S, Karahan F, Mercan Y, See K. 2021. Labor market policies during an epidemic.Journal of Public Economics 194: 104348. ISSN 0047-2727.URL https://www.sciencedirect.com/science/article/pii/S0047272720302127
Boar C, Mongey S. ???? Dynamic trade-offs and labor supply under the CARES Act : 15.
Campello M, Kankanhalli G, Muthukrishnan P. 2020. Corporate Hiring under COVID-19: Labor Market Concentration, Downskilling, and Income Inequality. SSRN ScholarlyPaper ID 3596655, Social Science Research Network, Rochester, NY.URL https://papers.ssrn.com/abstract=3596655
Chamberlain A, Zhao D. 2019. Glassdoor Job Market Report Methodology. Technicalreport, Glassdoor.URL https://www.glassdoor.com/research/glassdoor-job-market-report-methodology/
Cheng W, Carlin P, Carroll J, Gupta S, Rojas FL, Montenovo L, Nguyen TD, Schmutte IM,Scrivner O, Simon KI, Wing C, Weinberg B. 2020. Back to Business and (Re)employingWorkers? Labor Market Activity During State COVID-19 Reopenings. Working Paper27419, National Bureau of Economic Research.URL http://www.nber.org/papers/w27419
Chetty R, Friedman J, Hendren N, Stepner M, Team TOI. 2020. The Economic Impactsof COVID-19: Evidence from a New Public Database Built Using Private Sector Data.Technical Report w27431, National Bureau of Economic Research, Cambridge, MA.URL http://www.nber.org/papers/w27431.pdf
DellaVigna S, Heining J, Schmieder JF, Trenkle S. 2020. Evidence on Job Search Modelsfrom a Survey of Unemployed Workers in Germany : 49.
Dingel JI, Neiman B. 2020. How many jobs can be done at home? Journal of PublicEconomics 189: 104235. ISSN 0047-2727.URL https://www.sciencedirect.com/science/article/pii/S0047272720300992
Dube A. 2020. The Impact of the Federal Pandemic Unemployment Compensation onEmployment: Evidence from the Household Pulse Survey : 7.
Fairlie RW, Couch K, Xu H. 2020. The Impacts of COVID-19 on Minority Unemployment:First Evidence from April 2020 CPS Microdata. Working Paper 27246, National Bureauof Economic Research.URL http://www.nber.org/papers/w27246
Fang L, Nie J, Xie Z. 2020. Unemployment Insurance During a Pandemic. SSRN ScholarlyPaper ID 3666545, Social Science Research Network, Rochester, NY.URL https://papers.ssrn.com/abstract=3666545
23

Finamor L, Scott D. 2021. Labor market trends and unemployment insurance generosityduring the pandemic. Economics Letters 199: 109722. ISSN 0165-1765.URL http://www.sciencedirect.com/science/article/pii/S0165176520304821
Flood S, Warren RJ, King M, Rodgers R. 2020. Integrated Public Use Microdata Series,Current Population Survey: Version 8.0 [dataset].URL https://doi.org/10.18128/D030.V8.0
Forsythe E, Kahn LB, Lange F, Wiczer D. 2020a. Labor demand in the time of COVID-19: Evidence from vacancy postings and UI claims. Journal of Public Economics 189:104238. ISSN 0047-2727.URL https://www.sciencedirect.com/science/article/pii/S004727272030102X
Forsythe E, Kahn LB, Lange F, Wiczer DG. 2020b. Searching, Recalls, and Tightness:An Interim Report on the COVID Labor Market. Technical Report w28083, NationalBureau of Economic Research.URL https://www.nber.org/papers/w28083
Fradkin A, Baker S. 2017. The impact of unemployment insurance on job search: Evidencefrom google search data. Review of Economics and Statistics 99: 756–768. Tex.date-added: 2018-06-07 15:57:53 +0000 tex.date-modified: 2018-06-07 15:59:49 +0000.
Ganong P, Greig F, Liebeskind M, Noel P, Sullivan DM, Vavra J. 2021.Spending and Job Search Impacts of Expanded Unemployment Beneı¬ts :EvidencefromAdministrativeMicroData : 72.
Ganong P, Noel P, Vavra J. 2020. US Unemployment Insurance Replacement Rates Duringthe Pandemic. SSRN Scholarly Paper ID 3601492, Social Science Research Network,Rochester, NY.URL https://papers.ssrn.com/abstract=3601492
Gupta S, Montenovo L, Nguyen TD, Rojas FL, Schmutte IM, Simon KI, Weinberg BA,Wing C. 2020. Effects of Social Distancing Policy on Labor Market Outcomes. WorkingPaper 27280, National Bureau of Economic Research.URL http://www.nber.org/papers/w27280
Hensvik L, Le Barbanchon T, Rathelot R. 2020. Job Search during the COVID-19 Crisis.SSRN Scholarly Paper ID 3598126, Social Science Research Network, Rochester, NY.URL https://papers.ssrn.com/abstract=3598126
Kahn L, Lange F, Wiczer D. 2020. Labor Demand in the Time of COVID-19: Evidencefrom Vacancy Postings and UI Claims. Technical Report w27061, National Bureau ofEconomic Research, Cambridge, MA.URL http://www.nber.org/papers/w27061.pdf
Karabarbounis M, Pinto S. 2018. What Can We Learn from Online Wage Postings? Ev-idence from Glassdoor. SSRN Scholarly Paper ID 3322205, Social Science ResearchNetwork, Rochester, NY.URL https://papers.ssrn.com/abstract=3322205
Krueger AB, Mueller A. 2010. Job search and unemployment insurance: New evidencefrom time use data. Journal of Public Economics 94: 298–307.URL http://ideas.repec.org/a/eee/pubeco/v94y2010i3-4p298-307.html
24

Landais C, Michaillat P, Saez E. 2018. A Macroeconomic Approach to Optimal Unemploy-ment Insurance: Theory. American Economic Journal: Economic Policy 10: 152–181.ISSN 1945-7731.URL https://www.aeaweb.org/articles?id=10.1257/pol.20150088
Lichter A, Schiprowski A. 2020. Benefit duration, job search behavior and re-employment.CESifo Working Papers Tex.date-added: 2017-12-12 13:36:52 +0000 tex.date-modified:2020-05-14 14:57:32 +0000.
Marinescu I. 2017. The general equilibrium impacts of unemployment insurance: Evidencefrom a large online job board. Journal of Public Economics 150: 14–29. ISSN 0047-2727.URL http://www.sciencedirect.com/science/article/pii/S0047272717300348
Marinescu I, Skandalis D. 2021. UNEMPLOYMENT INSURANCE AND JOB SEARCHBEHAVIOR. THE QUARTERLY JOURNAL OF ECONOMICS : 45.
Marinescu IE, Wolthoff R. 2019. Opening the Black Box of the Matching Function: thePower of Words. Journal of Labor Economics ISSN 0734-306X.URL https://www.journals.uchicago.edu/doi/abs/10.1086/705903
Mitman K, Rabinovich S. 2021. Whether, When and How to Extend UnemploymentBenefits: Theory and Application to COVID-19 : 41.
Montenovo L, Jiang X, Rojas FL, Schmutte I, Simon K, Weinberg B, Wing C. 2020.Determinants of Disparities in Covid-19 Job Losses. Technical Report w27132, NationalBureau of Economic Research, Cambridge, MA.URL http://www.nber.org/papers/w27132.pdf
Petrosky-Nadeau N. 2020. Reservation Benefits: Assessing Job Acceptance Impacts of In-creased UI Payments. Technical Report 2020-28, Federal Reserve Bank of San Francisco.URL https://www.frbsf.org/economic-research/publications/working-papers/
2020/28/
Schmieder JF, von Wachter T. 2016. The Effects of Unemployment Insurance Benefits:New Evidence and Interpretation. Annual Review of Economics 8: 547–581.URL https://doi.org/10.1146/annurev-economics-080614-115758
25

Appendix
Figure A.1: Descriptive statistics on the state of the labor market when FPUC was voted
Notes: This Figure shows the evolution of the number of UI claims (new and continuing) in theupper panel. In the lower panel, it shows the evolution of employment rates among workers atdifferent parts of the wage distribution (low wage, middle wage or high wage), relative to theirlevels in January 2020. The data for the lower panel are described in Chetty et al. (2020), andmade publicly available on the website https : //tracktherecovery.org.
1

Table A.1: Descriptive statistics in our study sample
Mean SD p25 p50 p75(1) (2) (3) (4) (5)
Count of applications, each week in each local labor market 82.2 204.3 12.0 26.0 70.0Count of vacancies, each week in each local labor market 189.6 659.1 16.0 44.0 126.0Tightness (vacancies / applications) 4.7 22.6 0.7 1.4 3.4Replacement rate without FPUC 43.6 8.4 38.2 45.4 49.2Replacement rate with FPUC 146.1 47.9 107.3 143.5 173.8
Notes: This Table presents descriptive statistics in our study sample. All variables are computedfor each calendar week from January 2018 to July 2020, in each local labor market. We use weightsreflecting the size of each State×industry×occupation in the labor force in the CPS.
2

Figure A.2: Comparison of the measure of new vacancies from JOLTS and Glassdoor
Notes:The Figure presents the variation in the count of new job listing at the monthly level,relative to the average level in January-February 2020. We compare the measure of new vacanciesfrom JOLTS, to the measure from Glassdoor data—which we use in the rest of the paper. Forthe measure from Glassdoor, we present the weighted sum of job listings, using weights reflectingthe size of each State×industry×occupation in the labor force in the CPS.
3

Table A.2: The probability of unemployment in January-March 2020 depending on pastearnings, by industry
Pba Unemployed(1) (2) (3)
ln(prior earnings) -0.372***(0.024)
Agriculture × ln(prior earnings) -0.525*** -0.541***(0.198) (0.208)
Mining × ln(prior earnings) -0.061 -0.047(0.393) (0.395)
Construction × ln(prior earnings) -0.096 -0.097(0.088) (0.089)
Manufacturing × ln(prior earnings) -0.531*** -0.553***(0.097) (0.096)
Retail × ln(prior earnings) -0.433*** -0.449***(0.081) (0.081)
Transportation × ln(prior earnings) -0.521*** -0.539***(0.111) (0.110)
Information × ln(prior earnings) -0.248* -0.236*(0.130) (0.134)
Finance × ln(prior earnings) -0.266*** -0.277***(0.057) (0.059)
Business services × ln(prior earnings) -0.388*** -0.403***(0.066) (0.067)
Education & health × ln(prior earnings) -0.360*** -0.370***(0.043) (0.045)
Leisure & hospitality × ln(prior earnings) -0.262*** -0.264***(0.087) (0.088)
Consumer services × ln(prior earnings) -0.657*** -0.663***(0.132) (0.137)
Government × ln(prior earnings) -0.603*** -0.575***(0.136) (0.137)
Industry FE - X XState FE - - XNo. of Obs 54,023 54,017 54,017
Notes: This table reports the estimates from the logit regressions of a dummy for unemploymenton local labor market characteristics: prior earnings, two-digit industries and states. The informa-tion on workers’ unemployment status, industry, and state come from the monthly CPS data forJanuary-March 2020, and information on their prior earnings come from the Outgoing RotationGroup data for 2019. The two datasets are matched at the individual level. We use individualsurvey weights. Robust standard errors in parenthesis (* p< 0.10, ** p< 0.05, *** p< 0.010).
4

Figure A.3: The impact of FPUC on applications week by week
(1) No additional controls (2) Labor Market ×week-of-year FE
(3) Labor Market ×week-of-year (4) Labor Market ×week-of-year+ State ×time FE + State ×time + Industry ×time FE
(5) Labor Market ×week-of-year (6) Labor Market ×week-of-year+ State ×time FE + State ×time + Industry ×time FE
+ Exposure decile ×time FE + Exposure decile ×time FE
Notes: This Figure reports the estimates from regressions of logged count of applications onthe interaction of each week around the enactment of the FPUC and the potential increase inUI generosity ln(UIFPUC
UI ). We use a panel at the calendar week and local labor market level—where local labor markets are defined as as the interaction of state, 2-digit occupations and2-digit industries and wage deciles. All models include calendar week and local labor market fixedeffects. We also add various controls in different panels. We use weights to reflect the proportion ofthe labor force in each State×industry×occupation in the CPS. Thin lines denote 95% confidenceintervals, based on robust SE clustered at the state level.
5

Figure A.4: The impact of FPUC on new vacancies week by week
(1) No additional controls (2) Labor Market ×week-of-year FE
(3) Labor Market ×week-of-year (4) Labor Market ×week-of-year+ State ×time FE + State ×time + Industry ×time FE
(5) Labor Market ×week-of-year (6) Labor Market ×week-of-year+ State ×time FE + State ×time + Industry ×time FE
+ Exposure decile ×time FE + Exposure decile ×time FE
Notes: This Figure reports the estimates from regressions of logged count of new vacancies onthe interaction of each week around the enactment of the FPUC and the potential increase inUI generosity ln(UIFPUC
UI ). We use a panel at the calendar week and local labor market level—where local labor markets are defined as as the interaction of state, 2-digit occupations and2-digit industries and wage deciles. All models include calendar week and local labor market fixedeffects. We also add various controls in different panels. We use weights to reflect the proportion ofthe labor force in each State×industry×occupation in the CPS. Thin lines denote 95% confidenceintervals, based on robust SE clustered at the state level.
6

Figure A.5: The impact of FPUC on labor market tightness, week by week
(1) No additional controls (2) Labor Market ×week-of-year FE
(3) Labor Market ×week-of-year (4) Labor Market ×week-of-year+ State ×time FE + State ×time + Industry ×time FE
(5) Labor Market ×week-of-year (6) Labor Market ×week-of-year+ State ×time FE + State ×time + Industry ×time FE
+ Exposure decile ×time FE + Exposure decile ×time FE
Notes: This Figure reports the estimates from regressions of logged labor market tightness (va-cancies/applications) on the interaction of each week around the enactment of the FPUC and thepotential increase in UI generosity ln(UIFPUC
UI ). We use a panel at the calendar week and locallabor market level —where local labor markets are defined as as the interaction of state, 2-digitoccupations and 2-digit industries and wage deciles. All models include calendar week and locallabor market fixed effects. We also add various controls in different panels. We use weights toreflect the proportion of the labor force in each State×industry×occupation in the CPS. Thinlines denote 95% confidence intervals, based on robust SE clustered at the state level.
7

Figure A.6: The impact of FPUC on applications, vacancies and tightness in the construction sector, week by week
Applications Vacancies Labor market tightness
Notes: This Figure reports the estimates from regressions of the logged count of applications, the logged count of vacancies, and the logged labormarket tightness (i.e. ratio of vacancies over applications) in the construction sector on the interaction of each week around the enactment of the FPUCand the potential increase in UI generosity ln(UIFPUC
UI ). The coefficients before the enactment of the FPUC help test our identification assumption.The coefficients after represent the elasticity of the outcome with respect to benefits levels. We use a panel at the calendar week and local labormarket level—where local labor markets are defined as as the interaction of state, 2-digit occupations and 2-digit industries and wage deciles. Weinclude calendar week and local labor market fixed effects. We control for seasonality using week-of-year×local labor market fixed effects. We useweights to reflect the proportion of the labor force in each State×industry×occupation in the CPS. Thin lines denote 95% confidence intervals, basedon robust SE clustered at the state level.
8
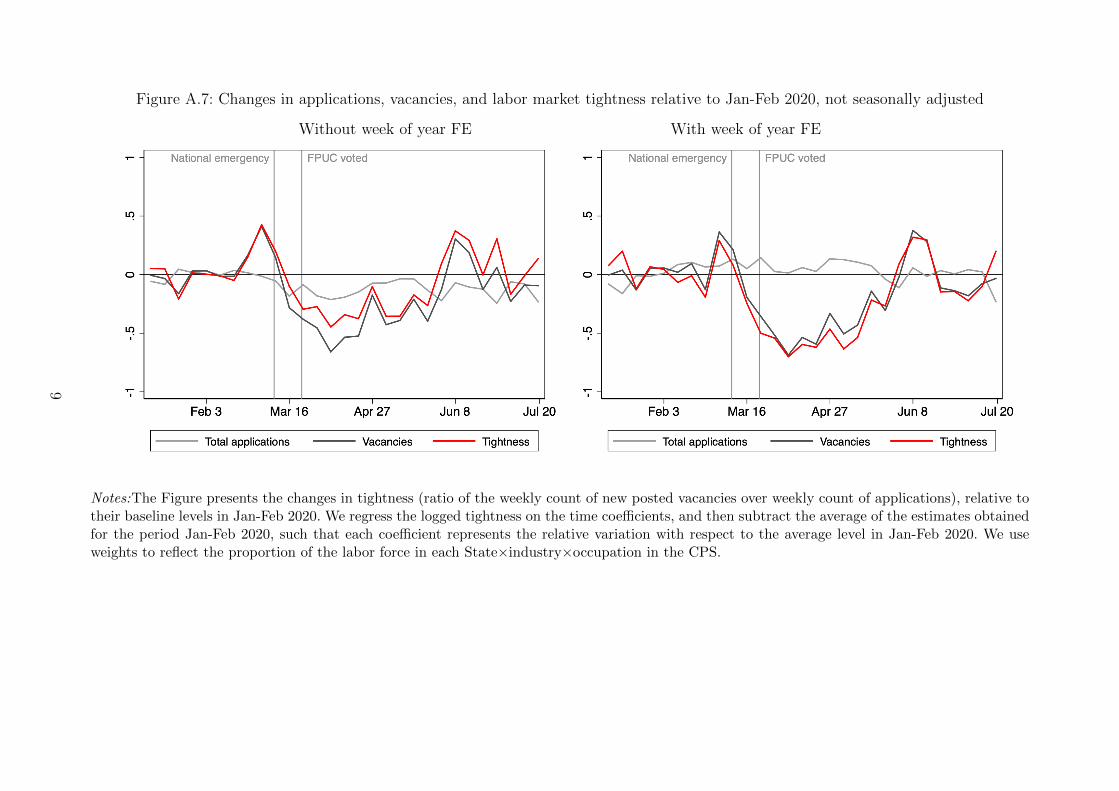
Figure A.7: Changes in applications, vacancies, and labor market tightness relative to Jan-Feb 2020, not seasonally adjusted
Without week of year FE With week of year FE
Notes:The Figure presents the changes in tightness (ratio of the weekly count of new posted vacancies over weekly count of applications), relative totheir baseline levels in Jan-Feb 2020. We regress the logged tightness on the time coefficients, and then subtract the average of the estimates obtainedfor the period Jan-Feb 2020, such that each coefficient represents the relative variation with respect to the average level in Jan-Feb 2020. We useweights to reflect the proportion of the labor force in each State×industry×occupation in the CPS.
9

Figure A.8: Weekly changes in applications, vacancies and tightness relative to Jan-Feb, each year
Applications Vacancies Tightness
Notes: The Figure presents the weekly changes in the count of applications, of new posted vacancies and of labor market tightness (ratio of the weeklycount of new posted vacancies over weekly count of applications), relative to their baseline levels in Jan.-Feb., such that each coefficient representsthe relative variation with respect to the average level in Jan.-Feb.. We present them separately for the years 2018, 2019 and 2020. We use weightsto reflect the proportion of the labor force in each State×industry×occupation in the CPS.
10

Table A.3: Changes in labor market tightness during the period of the FPUC relative toJan-Feb 2020, without accounting for seasonal variation
Potential increase in UISample: All Q1 Q2 Q3 Q4
TotalOutcome: Applications Vacancies Tightness Tightness Tightness Tightness Tightness
(1) (2) (3) (4) (5) (6) (7)
FPUC period -0.128*** -0.237*** -0.109*** -0.221*** -0.127*** -0.091* 0.004(0.021) (0.024) (0.024) (0.022) (0.032) (0.046) (0.042)
Week of year FE No No No No No No NoNo. of Obs 1,540,598 1,540,598 1,540,598 613,586 412,050 297,346 217,616
FPUC, Mar-May -0.117*** -0.415*** -0.298*** -0.356*** -0.325*** -0.310*** -0.201***(0.022) (0.023) (0.023) (0.023) (0.024) (0.043) (0.043)
FPUC, Jun-Jul -0.142*** -0.014 0.128*** -0.052** 0.121** 0.183*** 0.260***(0.022) (0.027) (0.029) (0.026) (0.046) (0.056) (0.045)
Week of year FE No No No No No No NoNo. of Obs 1,540,598 1,540,598 1,540,598 613,586 412,050 297,346 217,616
Notes: This Table presents the same estimates as Table 3, except that we do not control forseasonal variation. The Table reports changes in the count of job applications, the count of newposted vacancies, and labor market tightness during the period of the FPUC, relative to theirbaseline levels in Jan-Feb 2020. In the upper panel, we present estimates for the total period ofFPUC, while we divide the FPUC period in two sub-periods in the lower panel. The estimatesare obtained by regressing each logged outcome on a dummy for the FPUC period, and a dummyfor all calendar weeks outside of the baseline period of January-February 2020 in a panel at thecalendar week and local labor market level. The estimates are obtained in the full sample in col(1)-(3), and separately for local labor markets in each quartile of the distribution of potentialUI increase in col (4)-(7). We use weights to reflect the proportion of the labor force in eachState×industry×occupation in the CPS. Robust standard errors clustered at the state level arein parenthesis (* p< 0.10, ** p< 0.05, *** p< 0.010).
11

Figure A.9: Changes in applications, vacancies and labor market tightness relative toJan-Feb 2020, by UI increase quartile
First quartile (lowest increase) Second quartile
Third quartile Fourth quartile (largest increase)
Notes: The Figure presents, for each quartile of the increase in the replacement rate of UI, theseasonally adjusted changes in the total weekly count of applications, the weekly count of newposted vacancies, and labor market tightness (ratio of vacancies over total applications), relativeto their baseline levels in Jan-Feb 2020. The Figure is obtained by regressing the logged variableson the calendar week coefficients and week-of-year fixed effects to control for seasonal variation,and then subtracting to each calendar week coefficient the average of estimates for Jan-Feb 2020.We use weights to reflect the proportion of the labor force in each State×industry×occupationin the CPS.
12
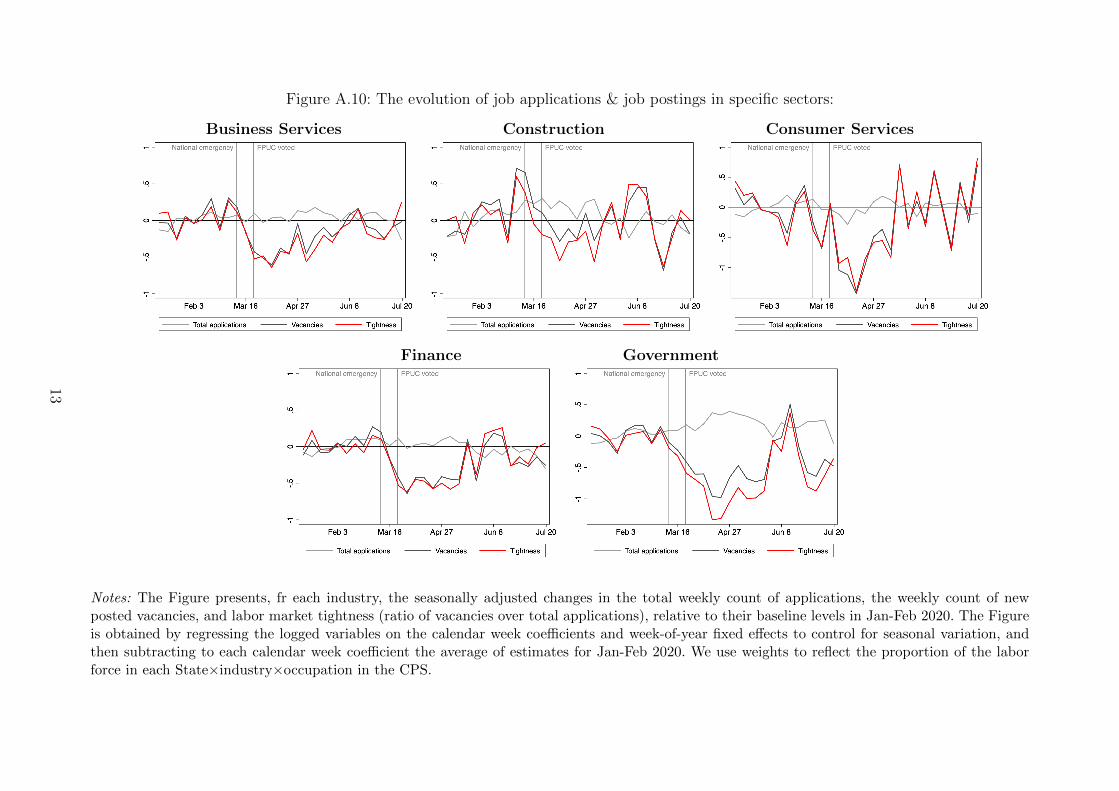
Figure A.10: The evolution of job applications & job postings in specific sectors:
Business Services Construction Consumer Services
Finance Government
Notes: The Figure presents, fr each industry, the seasonally adjusted changes in the total weekly count of applications, the weekly count of newposted vacancies, and labor market tightness (ratio of vacancies over total applications), relative to their baseline levels in Jan-Feb 2020. The Figureis obtained by regressing the logged variables on the calendar week coefficients and week-of-year fixed effects to control for seasonal variation, andthen subtracting to each calendar week coefficient the average of estimates for Jan-Feb 2020. We use weights to reflect the proportion of the laborforce in each State×industry×occupation in the CPS.
13

Figure A.11: The evolution of job applications & job postings in specific sectors:
Health, education Information Leisure & hospitality
Manufacturing Retail Transport & logistics
Notes: The Figure presents, for each industry, the seasonally adjusted changes in the total weekly count of applications, the weekly count of newposted vacancies, and labor market tightness (ratio of vacancies over total applications), relative to their baseline levels in Jan-Feb 2020. The Figureis obtained by regressing the logged variables on the calendar week coefficients and week-of-year fixed effects to control for seasonal variation, andthen subtracting to each calendar week coefficient the average of estimates for Jan-Feb 2020. We use weights to reflect the proportion of the laborforce in each State×industry×occupation in the CPS.
14