Global Capitalism and Agrarian Crisis in Developing Countries

OECD Journal on Budgeting
Volume 2010/1
© OECD 2010
The Impact of the Crisis on Budget Policy in Central and Eastern Europe
byZsolt Darvas*
This article describes the particular impacts of the financial and economic crisis onCentral and Eastern European (CEE) countries; studies pro-cyclicality of fiscalpolicies; discusses the impact of the crisis on fiscal policy; and takes a look at thepolicy response of various governments. After drawing some lessons for fiscal policyfrom previous emerging market crises, the article concludes with some thoughts onthe appropriate policy response from a more normative perspective. The keymessage of the article is that the crisis should be used as an opportunity tointroduce reforms to avoid future pro-cyclical fiscal policies, to increase the qualityof budgeting and to increase credibility. These reforms should include fiscalresponsibility laws comprising medium-term fiscal frameworks, fiscal rules andindependent fiscal councils. When fiscal consolidation is accompanied by fiscalreforms that increase credibility, non-Keynesian effects may offset the contractioncaused by the consolidation to some extent.
JEL classification: C32, E62, H60
Keywords: Crisis, budget policy, fiscal policy, Central and Eastern Europe, CEE,CESEE
* This article was prepared for the author’s keynote speech at the OECD’s 5th meeting of Senior BudgetOfficials from Central, Eastern and South-Eastern European Countries, held on 25-26 June 2009 inSt. Petersburg, Russian Federation, hosted by the Russian Ministry of Finance. The author is gratefulto Maite de Sola for her excellent research assistance, and to country delegates at the conference fortheir comments and additions to the table containing budget policy measures of CESEE countries.The author is a research fellow at Bruegel. He is also a research fellow at the Institute of Economicsof the Hungarian Academy of Sciences, and Associate Professor at the Corvinus University ofBudapest. He can be contacted at [email protected].
1

THE IMPACT OF THE CRISIS ON BUDGET POLICY IN CENTRAL AND EASTERN EUROPE
The global economic and financial crisis is having a significant impact on all countries.
However, central, eastern, and south-eastern Europe1 (CESEE) has been particularly hard
hit. The crisis poses a significant challenge to budget policies world wide, and many
countries, especially major economies, are relying not just on automatic stabilisers, but are
responding to the crisis with discretionary fiscal stimuli and support for the financial
sector. Indeed, the current economic environment would seem to call for Keynesian
policies to counterbalance both domestic and foreign demand shortages.
CESEE countries face significant budgetary challenges. Most have very limited fiscal
policy options. Many of them face significant financing constraints, are small and open,
have generally lower quality fiscal institutions than major economies and should respect
investors’ confidence. Although public debt relative to gross domestic product (GDP) is
considerably lower in most CESEE countries than in major economies, market tolerance for
public debt in emerging and developing countries is also lower.
The purpose of this article is to discuss the particular characteristics of the crisis in
CESEE countries and the crisis’ impact on budget policy. We argue that financial linkages
and, in particular, large current account deficits financed by external sources, as well as
heavy reliance on foreign trade and, in some countries, inflows of remittances, were the
major channels through which the crisis hit these countries. However, budgetary policy
also played a role: according to our econometric estimates budget policy was pro-cyclical in
many CESEE countries, reinforcing the business cycle both during the good years before the
crisis and during the current crisis as well. While some bigger countries in the region have
some space for discretionary stimulus, most countries do not; instead, many countries
should embark on significant fiscal consolidation.
A key message that emerges from this article is that the crisis should be used as an
opportunity to accelerate the process of structural reform, including fiscal reforms. With
proper fiscal consolidation and reforms, non-Keynesian effects may offset the contraction
caused by fiscal consolidation to some extent, and CESEE countries may be better
positioned for post-crisis growth than major economies, though it is unlikely that the pre-
crisis fast growth rates will return.
This article is organised as follows. Section 1 discusses the severity of the crisis for
CESEE economies and the particular characteristics of these economies that made them
vulnerable. Section 2 studies the direct role of budget policy in relation to the severity of
the crisis by analysing the pre-crisis pro-cyclicality of budget policy using structural vector-
autoregressions. This is followed, in Section 3, by a discussion of the main channels
through which the crisis impacts budget policy. Section 4 presents the policy reactions of
various governments. Section 5 draws some lessons for budget policy from previous
emerging market crises. Finally, Section 6 concludes with some thoughts on the
appropriate budget policy from a more normative perspective. Annex A details the budget
measures taken in response to the crisis for all 26 CESEE countries.
OECD JOURNAL ON BUDGETING – VOLUME 2010/1 © OECD 20102

THE IMPACT OF THE CRISIS ON BUDGET POLICY IN CENTRAL AND EASTERN EUROPE
1. The crisis in CESEE countries
1.1. Severity of the crisis: more serious than in other regions
CESEE countries have been severely hit by the crisis, though there are significant
differences within the region. Before the crisis, i.e. up to 2007, CESEE countries seemed to
be catching up with the EU15 quickly and reasonably smoothly; this was reflected in
forecasts made at that time (Figure 1). For example, in October 2007, cumulative GDP
growth from 2008 to 2010 was forecast to be 11.4% on average in the region, while, by
comparison, the EU15 was predicted to grow by 4.3% during these two years. Some CESEE
countries had built up various vulnerabilities, such as huge credit, housing and
consumption booms and thus high current account deficits and external debt. It was
widely expected that these vulnerabilities would have to be corrected at some point in
time. However, the magnitude of the correction, as also reflected by the fall in GDP, was
amplified by the global financial and economic crisis.
Figure 1. Revision of GDP growth forecasts, October 2007 and October 2009
Notes: Country group values are weighted averages (using GDP weights).CESEE26: 26 countries from central, eastern, and south-eastern Europe. Asia25: 25 countries from Asia excluding China.LATAM32: 32 countries from Latin America. Middle East13: 13 countries from the Middle East. Africa48: 48 countries fromAfrica. Country groups and non-CESEE countries are highlighted.Note that the sum of the first and the third column does not equal the second, partly because the sum of two percentages doesnot equal the total per cent effect, and partly because the October 2007 forecast level of the 2010 GDP also reflected forecastsfor 2007-08, while the October 2009 forecast is based on actual data for 2007-08.
Source: The source for the October 2007 forecast for EU member states was the European Commission Directorate General forEconomic and Financial Affairs (DG ECFIN) 2007 autumn forecasts for 2007-09; the 2010 forecast was calculated by the authorassuming that GDP growth in 2010 would be equal to the average growth during 2001-09 (including the forecasts for 2007-09).The source for the October 2007 forecast for non-EU countries was the International Monetary Fund (IMF) World EconomicOutlook (WEO) October 2007 for 2007-09; the 2010 forecast was calculated by the author assuming that GDP growth in 2010would be equal to the average growth during 2001-09 (including the forecasts for 2007-09). The source for the October 2009forecast for all countries was the IMF WEO October 2009 for 2009-10.
40
30
20
10
0
-10
-20
-30
-40
Latv
ia
Esto
nia
Lith
uania
Arm
enia
Azer
baija
n
Ukra
ine
Geo
rgia
Bulg
aria
Mold
ova
Rom
ania
Hun
gary
Cro
atia
Russia
n Fed
eratio
n
CESEE26
Turke
y
Cze
ch R
epub
lic
Serb
ia
Bos
nia/H
erzeg
ovina
Slov
enia
Mon
teneg
ro
Slovak
Rep
ublic
EU15
Bela
rus
Unit
ed States
Asia
25
Mac
edon
ia, FY
R
Pola
nd
Cyp
rus
LATA
M32
Midd
le Eas
t13
Alba
nia
Malt
a
Afri
ca48
Chin
a
Change in GDP level forecast for 2010 from October 2007 to October 2009 (in per cent)GDP level change from 2008 to 2010 as seen in October 2009 (in per cent)GDP level change from 2008 to 2010 as seen in October 2007 (in per cent)
OECD JOURNAL ON BUDGETING – VOLUME 2010/1 © OECD 2010 3

THE IMPACT OF THE CRISIS ON BUDGET POLICY IN CENTRAL AND EASTERN EUROPE
Figure 1 indicates that there were substantial downward revisions in economic growth
forecasts from October 2007 to October 2009 in all countries. The 2010 GDP level of the
CESEE country group was forecast in October 2009 to be 14.8% lower than was expected in
October 2007.2 Downward revision in other emerging and developing country groups has
been smaller, ranging from 3.3% (average of 48 African countries) to 6.9% (average of
25 Asian countries excluding China3). CESEE countries not only had to assume the largest
downward revision of their forecast GDP level, but the actual fall in GDP is also expected to
be the greatest among emerging and developing country groups. The average GDP change
in the 26 CESEE countries from 2008 to 2010 was forecast in October 2009 to be –4.3%.
Meanwhile the 25 Latin American countries were expected to maintain their GDP level, and
the 25 Asian countries, and the 48 African countries and the 13 Middle East countries were
expected to grow by between 5.2% and 6.0% during the same period.
The three Baltic countries were hit the most seriously with GDP projected to fall
between 16% and 22% from 2008 to 2010, according to October 2009 forecasts. Forecasts
made in 2007 foresaw growth of about 15% during the same period. Furthermore, growth
in 2008 was –4.6% in Latvia and –3.6% in Estonia and hence the total output fall
experienced by these countries will be even larger than the forecasts for 2009 and 2010
would imply. The downward revision of the 2010 GDP level is between 34% and 39% for the
three countries.
1.2. Why were CESEE countries the hardest hit among emerging/developing regions?
The sensitivity of CESEE countries to the crisis is mainly due to three factors:
1. capital flows and financial integration,
2. dependence on foreign trade,
3. migration and remittances.
Darvas and Veugelers (2009) demonstrate that foreign trade played a crucial role in the
pre-crisis economic growth of CESEE countries, and that their dependence on foreign trade
is greater than many other emerging and developing countries. Remittances are also very
important for some countries: Moldova (34% of GDP in 2007), Bosnia/Herzegovina (17%),
Armenia (14%), Albania (13%), Georgia (7%), Bulgaria and Romania (5%), and between 2%
and 4% for eight further CESEE countries. In this section, however, we will focus on issues
related to capital flows and financial integration.
In general, CESEE countries entered the crisis more vulnerable than other emerging
regions, although there are considerable differences within the region. A key feature of
these countries is that their pre-crisis growth was associated with rising current account
deficits (with the exception of commodity exporters), that is, the correlation between GDP
growth and the current account was negative, as the left-hand panel of Figure 2 indicates.
In contrast, correlation was positive in other emerging and developing countries as
suggested by the right-hand panel of Figure 2.
Why does the correlation between the current account (CA) and economic growth
differ? As discussed by Prasad, Rajan and Subramanian (2006) and Collins (2006), the
positive correlation in developing countries could be related to three main mechanisms:
● A demographic shift to reduce the old age dependency ratio increases the labour force,
which increases both savings and output, leading to a positive correlation between CA
and growth.
OECD JOURNAL ON BUDGETING – VOLUME 2010/1 © OECD 20104

THE IMPACT OF THE CRISIS ON BUDGET POLICY IN CENTRAL AND EASTERN EUROPE
● A productivity shock leads to higher income, but financial impediments limitinvestment and consumption, which again could lead to a positive correlation.
● A policy shift to export promotion, for example the avoidance of exchange rateovervaluation, boosts exports and output leading to a better CA position and higher growth.
On the other hand, the negative correlation observed for CESEE countries may berelated to an institutional change (relaxation of previous constraints in accessing foreigncapital) and a productivity shock:
● With the prospective and actual EU integration of ten former communist countries andwith the better EU prospects of many other CESEE countries, the previous constraints inaccessing foreign capital have relaxed or eased substantially. This has led to capitalinflows, which in turn contributed to investment, but also to consumption booms and,eventually, current account deficits.
● At the same time, and also related to capital inflows, productivity increased rapidly inmost CESEE countries, leading to higher income expectations. This in turn resulted inborrowing according to the textbook mechanism of intertemporal optimisation.
Indeed, capital inflows and GDP growth were accompanied by a substantial growth incredit (Figure 3). For example, the private sector credit to GDP ratio was 20% in Latviain 2000, rising to almost 100% of GDP by 2007. In the meantime, GDP also grew by about 10%per year in real terms on average.4
Since the banking system has a crucial role in financing CESEE economies, itsstabilisation must be a high priority. The key question is the role played by the budget inthe previous credit boom and in the stabilisation of the banking system now. The previouscredit boom was mainly related to the private sector and the ratio of government debt toGDP was generally low in the region (Figure 4). Budget deficits varied, fiscal policy was pro-cyclical in many countries (see the next section), but in general the budget was not aserious problem (apart from some outliers like Hungary). Many authors even called for anactive use of budget policy due to the large infrastructure investment needs of thesecountries, rather than for saving for rainy days. With the benefit of hindsight we of course
Figure 2. GDP growth and the current account, 2003-07
Source: Author’s calculation, based on IMF data.
10
5
0
-5
-10
-15
-20
40
30
20
10
0
-10
-20
-300 4 8 12 16 0 4-4 8 12 1620 20
Current account/GDP (average 2003-07)
Russian Federation
Ukraine
BelarusArmenia
Azerbaijan
Current account/GDP (average 2003-07)
GDP growth (average 2003-07)GDP growth (average 2003-07)
26 CESEE countries 151 other countries of the world
OECD JOURNAL ON BUDGETING – VOLUME 2010/1 © OECD 2010 5

THE IMPACT OF THE CRISIS ON BUDGET POLICY IN CENTRAL AND EASTERN EUROPE
Figure 3. Credit to private sector (% of GDP), 1995-2007
Source: Author’s calculation, based on IMF data.
Figure 4. General government gross debt (% of GDP), 1995-2010
Notes: Countries are ordered according to their 2010 debt level.CESEE26: 26 countries from central, eastern, and south-eastern Europe. Asia25: 25 countries from Asia excluding China.LATAM32: 32 countries from Latin America. Middle East13: 13 countries from the Middle East. Africa48: 48 countries from Africa.Country groups and non-CESEE countries are highlighted.
Source: Eurostat, European Bank for Reconstruction and Development (EBRD), DG ECFIN of the European Commission, IMF.2010 forecasts are from the IMF (October 2009). The 2010 forecast for Armenia and Macedonia (FYR) is not available.
200
150
100
80
60
40
20
0
100
50
0
Cyp
rus
Malt
a
Arm
enia
Azer
baija
n
Ukra
ine
Pola
nd
Bulg
aria
Mold
ova
Rom
ania
Hun
gary
Cro
atia
Russia
n Fed
eratio
n
Turke
y
Cze
ch R
epub
lic
Serb
ia
Bos
nia/H
erzeg
ovina
Eston
iaLatv
ia
Slov
enia
Lithu
ania
Slovak
Rep
ublic
Bela
rus
Georg
ia
Mac
edon
ia, FY
R
Alba
nia
1995 2000 2007
120
100
80
60
20
40
0
1995 2001 2007 2010
Latv
ia
Esto
nia
Lith
uania
Arm
enia
Azer
baija
n
Ukra
ine
Geo
rgia
Bulg
aria
Mold
ova
Rom
ania
Hun
gary
Cro
atia
Rus
sian F
edera
tion
CESEE26
Turke
y
Cze
ch R
epub
lic
Serb
ia
Bos
nia/H
erzeg
ovina
Slov
enia
Mon
teneg
ro
Slov
ak R
epub
lic E
U15
Bela
rus
Unit
ed Stat
es
Asia
25
Mac
edon
ia, FY
R
Pola
nd
Cyp
rus
LATA
M32
Midd
le Eas
t13
Alba
nia
Malt
a
Afri
ca48
OECD JOURNAL ON BUDGETING – VOLUME 2010/1 © OECD 20106

THE IMPACT OF THE CRISIS ON BUDGET POLICY IN CENTRAL AND EASTERN EUROPE
know now that budget policy should have been more conservative during the good timesin most countries to create fiscal space for counter-cyclical policy in the downturn.
There is unpleasant asymmetry regarding the banking system: it was the private
sector that incurred most of the debt, but the public sector has to adjust substantially and
clean up the mess now.5 This asymmetry is similar to the Stability and Growth Pact’s
failure (with its narrow focus on budgets) to preserve the euro area’s stability.
These factors call for strengthened regulation and supervision, as well as creation of
institutions for anti-cyclical budget policies.
Despite the low level of government debt, credit-default swaps on government bonds
(which is a measure of the cost of insurance against government default) have increased
substantially (Figure 5). The huge rise in government-default probability on the one hand,
Figure 5. Credit-default swap on five-year government bonds, 2 January 2008-6 November 2009
Source: Datastream.
1 200
1 000
800
600
400
200
0
1 200
1 000
800
600
400
200
0
500
450
400
350
300
250
200
150
50
0
5 500
4 500
5 000
3 500
4 000
2 500
3 000
1 500
1 000
2 000
500
0
Estonia
Romania
Latvia LithuaniaCroatia
Jan.
08
March 0
8
May 08
July
08
Sept. 0
8
Nov. 0
8
Jan.
09
March 0
9
May 09
July
09
Sept. 0
9
Nov. 0
9
Russian Federation
Bulgaria Hungary
Turkey
Jan.
08
March 0
8
May 08
July
08
Sept. 0
8
Nov. 0
8
Jan.
09
March 0
9
May 09
July
09
Sept. 0
9
Nov. 0
9
Slovak Republic
Poland
Slovenia
Czech Republic
Jan.
08
March 0
8
May 08
July
08
Sept. 0
8
Nov. 0
8
Jan.
09
March 0
9
May 09
July
09
Sept. 0
9
Nov. 0
9
Ukraine
Jan.
08
March 0
8
May 08
July
08
Sept. 0
8
Nov. 0
8
Jan.
09
March 0
9
May 09
July
09
Sept. 0
9
Nov. 0
9
OECD JOURNAL ON BUDGETING – VOLUME 2010/1 © OECD 2010 7
THE IMPACT OF THE CRISIS ON BUDGET POLICY IN CENTRAL AND EASTERN EUROPE
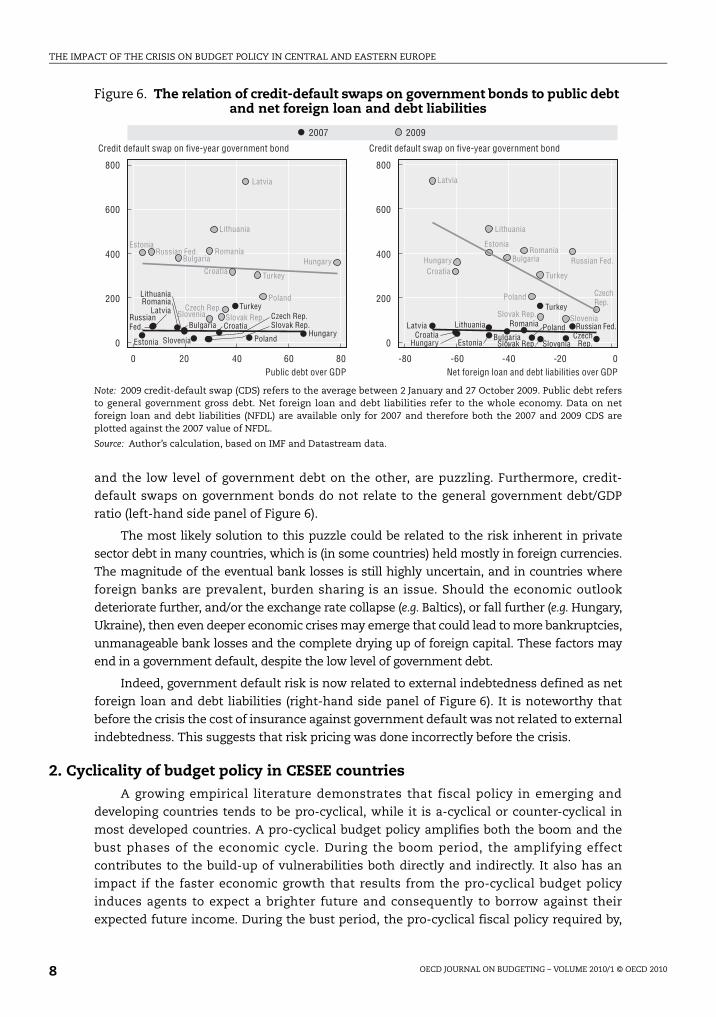
and the low level of government debt on the other, are puzzling. Furthermore, credit-
default swaps on government bonds do not relate to the general government debt/GDP
ratio (left-hand side panel of Figure 6).
The most likely solution to this puzzle could be related to the risk inherent in private
sector debt in many countries, which is (in some countries) held mostly in foreign currencies.
The magnitude of the eventual bank losses is still highly uncertain, and in countries where
foreign banks are prevalent, burden sharing is an issue. Should the economic outlook
deteriorate further, and/or the exchange rate collapse (e.g. Baltics), or fall further (e.g. Hungary,
Ukraine), then even deeper economic crises may emerge that could lead to more bankruptcies,
unmanageable bank losses and the complete drying up of foreign capital. These factors may
end in a government default, despite the low level of government debt.
Indeed, government default risk is now related to external indebtedness defined as net
foreign loan and debt liabilities (right-hand side panel of Figure 6). It is noteworthy that
before the crisis the cost of insurance against government default was not related to external
indebtedness. This suggests that risk pricing was done incorrectly before the crisis.
2. Cyclicality of budget policy in CESEE countriesA growing empirical literature demonstrates that fiscal policy in emerging and
developing countries tends to be pro-cyclical, while it is a-cyclical or counter-cyclical in
most developed countries. A pro-cyclical budget policy amplifies both the boom and the
bust phases of the economic cycle. During the boom period, the amplifying effect
contributes to the build-up of vulnerabilities both directly and indirectly. It also has an
impact if the faster economic growth that results from the pro-cyclical budget policy
induces agents to expect a brighter future and consequently to borrow against their
expected future income. During the bust period, the pro-cyclical fiscal policy required by,
Figure 6. The relation of credit-default swaps on government bonds to public debt and net foreign loan and debt liabilities
Note: 2009 credit-default swap (CDS) refers to the average between 2 January and 27 October 2009. Public debt refersto general government gross debt. Net foreign loan and debt liabilities refer to the whole economy. Data on netforeign loan and debt liabilities (NFDL) are available only for 2007 and therefore both the 2007 and 2009 CDS areplotted against the 2007 value of NFDL.
Source: Author’s calculation, based on IMF and Datastream data.
800
600
400
200
0
800
600
400
200
0
0 20 40 60 -60 -40-80 -2080 0
2007 2009
Credit default swap on five-year government bond Credit default swap on five-year government bond
Net foreign loan and debt liabilities over GDPPublic debt over GDP
Croatia
Russian Fed.
Turkey
Czech Rep.
Estonia
Hungary
Latvia
Lithuania
Poland
Romania
Slovak Rep.Slovenia
Bulgaria
CroatiaRussianFed.
TurkeyCzech Rep.
EstoniaHungary
Latvia
Lithuania
Poland
Romania
Slovak Rep.
Slovenia
BulgariaCroatia
Russian Fed.
Turkey
CzechRep.EstoniaHungary
Latvia Lithuania PolandRomania
Slovak Rep. SloveniaBulgaria
CroatiaRussian Fed.
Turkey
CzechRep.
Estonia
Hungary
Latvia
Lithuania
Poland
Romania
Slovak Rep. Slovenia
Bulgaria
OECD JOURNAL ON BUDGETING – VOLUME 2010/1 © OECD 20108

THE IMPACT OF THE CRISIS ON BUDGET POLICY IN CENTRAL AND EASTERN EUROPE
e.g. the external financial constraints, amplifies again the effect of the downturn.
Kaminsky, Reinhart and Vegh (2004) have coined this phenomenon as “when it rains, it
pours”. It cannot be optimal from any theoretical perspective to reinforce the business
cycle by expanding budget policy in good times and contracting it in bad times (see Ilzetzki
and Vegh, 2008, for further discussion).
Consequently, analysing the cyclical nature of budget policy may shed light on
whether or not budget policy in CESEE countries also contributed to the severity of the
crisis by amplifying the economic cycle during good times. It is instructive to start the
analysis with some simple correlation measures that may hint at pro-cyclicality, and then
to continue with a structural analysis.
2.1. Correlation of output and government consumption using annual data
Table 1 reports the correlation coefficient between annual real GDP and real
government consumption6 growth in four different time periods. The sample starts either
in 1995 or in 2001 and ends either in 2007 or in 2010, where available. Extending the sample
to 2010 (with available forecasts) provides an indication of how the current crisis affects the
correlation. Starting the sample in 2001 instead of 1995 eliminates the period of the Russian
Table 1. Correlation of annual real GDP and real government consumption growth
1995-2007 1995-2010 2001-07 2001-10
Bulgaria 0.81 0.77 –0.25 0.29Cyprus –0.54 –0.35 –0.37 –0.20Czech Republic –0.21 –0.08 –0.59 –0.11Estonia –0.18 0.14 –0.23 0.54Hungary 0.81 0.62 0.92 0.62Latvia 0.30 0.45 0.84 0.91Lithuania 0.69 0.83 0.13 0.90Malta n.a. n.a. –0.01 0.24Poland 0.27 0.56 0.59 0.78Romania 0.09 0.24 –0.65 0.28Slovenia –0.26 0.03 0.04 0.23Slovak Republic 0.43 0.40 –0.10 0.12Albania 0.40 n.a. 0.41 n.a.Croatia –0.03 0.04 0.67 0.27Macedonia, FYR n.a. n.a. –0.64 –0.55Turkey 0.17 0.24 0.56 0.50Russian Federation 0.24 n.a. 0.57 n.a.Armenia 0.57 n.a. 0.40 n.a.Azerbaijan –0.15 n.a. –0.29 n.a.Belarus 0.76 n.a. –0.29 n.a.Georgia –0.04 n.a. –0.35 n.a.Moldova 0.76 n.a. 0.71 n.a.Ukraine 0.78 n.a. –0.37 n.a.Euro area 12 0.04 –0.08 –0.06 –0.03Denmark 0.23 0.20 0.18 –0.08Sweden 0.05 0.02 0.03 0.07United Kingdom –0.09 –0.38 –0.03 –0.46Switzerland –0.26 –0.17 –0.55 –0.21Norway –0.12 –0.55 –0.21 –0.63Japan –0.01 0.24 –0.62 0.13United States –0.34 –0.69 –0.70 –0.77
Note: Data for Bosnia and Herzegovina, Montenegro, and Serbia are not available.Source: Author’s calculation.
OECD JOURNAL ON BUDGETING – VOLUME 2010/1 © OECD 2010 9

THE IMPACT OF THE CRISIS ON BUDGET POLICY IN CENTRAL AND EASTERN EUROPE
crisis that affected many other CESEE countries. Some earlier country-specific crises are also
eliminated (e.g. Bulgaria, Czech Republic, Romania, and Slovak Republic). Furthermore, the
transitional recession lasted till the late 1990s in the case of many CIS countries and hence
the 2001 sample starting point implies a more homogenous time period.
The general result for developed countries shown in the last eight rows of the table is
a close to zero or negative correlation, regardless of the sample period considered. Hence,
the simple correlation coefficient confirms the a-cyclical or counter-cyclical budget policy
finding that is found as a result of more structural analysis in the literature.
In contrast, the general result for many CESEE countries is a positive correlation
suggesting pro-cyclicality, though there are exceptions. Results for some CESEE countries are
different for different time periods, which make us cautious when interpreting the results.
Considering the 1995-2007 period, a negative or positive but close to zero correlation was
found for the following countries: Cyprus, Czech Republic, Estonia, Romania, Slovenia, Croatia,
Azerbaijan, and Georgia. The correlation for Turkey, the Russian Federation, Poland, Latvia,
Albania, and the Slovak Republic was positive but not large. Large positive correlations were
observed for Bulgaria, Hungary, Lithuania, Armenia, Belarus, Moldova and Ukraine.
If only the “good times” of 2001-07 are considered, the results change for several CESEE
countries. Correlation increases substantially compared to the 1995-2007 period in Latvia,
Croatia, Poland, Turkey and the Russian Federation. There are also countries in which
correlation in 2001-07 is substantially lower than in 1995-2007: Bulgaria, Lithuania,
Romania, the Slovak Republic, Belarus and Ukraine. Data for Malta are available for 2001-07
which indicate a zero correlation.
Including the recent crisis in the sample period generally increases the finding of
positive correlation for CESEE countries. For example, among the EU member states for
which forecasts up to 2010 are available, the correlation coefficient rises substantially in
the cases of Lithuania and Estonia, and to a lesser extent for Bulgaria, Malta, Romania and
Slovenia, leaving only Cyprus and the Czech Republic with negative correlations, and the
Slovak Republic with a small positive correlation.
To sum up, although there are important country-specific differences (e.g. Cyprus and
the Czech Republic were found to have negative correlations in all sample periods), many
CESEE countries indicate a positive correlation between GDP and government consumption
growth, in at least one of the sample periods we studied. In contrast, the correlation is close
to zero or negative in developed countries, irrespective of the time period studied.
2.2. Structural vector-autoregressions using quarterly data
As highlighted by Ilzetzki and Vegh (2008), a positive correlation between GDP and
government consumption does not imply causality. Pro-cyclicality would require a causal
effect from GDP growth to government consumption growth. However, a positive
correlation between the two variables may be the result of a causal effect from government
consumption to GDP, i.e. the expansionary effect of government consumption. Following
Blanchard and Perotti (2002) and Ilzetzki and Vegh (2008), we employ structural vector-
autoregressions (SVAR) to identify the effects of output shocks on government
consumption using quarterly data. The model has the following form:
t
q
jjtj
p
iitit xyy
010 BAA
OECD JOURNAL ON BUDGETING – VOLUME 2010/1 © OECD 201010

THE IMPACT OF THE CRISIS ON BUDGET POLICY IN CENTRAL AND EASTERN EUROPE
where yt is the vector of output and government consumption, which are assumed to be
endogenous, xt is the vector of exogenous variables, t is the vector of orthogonal structural
shocks, A0 is the contemporaneous impact matrix, Ai and Bj are parameter matrices. Our
sample period covers quarterly data between the first quarter of 1995 and the first quarter
of 2009, where available (Box 1 details data availabilities).7 A few key assumptions have to
be made for the use of the SVAR:
● Identification of shocks: Following Blanchard and Perotti (2002) and Ilzetzki and Vegh
(2008), we assumed that an unexpected shock8 to GDP does not have a contemporaneous
effect on government consumption, but an unexpected shock to government
consumption may affect GDP contemporaneously.
● Measurement of variables: In contrast to Ilzetzki and Vegh (2008) who de-trended GDP
and government consumption using linear and quadratic trends before making
estimates, we included the variables in log-levels. There are various de-trending
methods adopted in the literature, and empirical results might depend on the specific
filter adopted, as demonstrated in Canova (1998). Estimates for the levels, however, is
consistent irrespective of whether or not there is a co-integrating relationship among
the variables, though in small samples the estimate may be biased.
● Exogenous variable(s): We include only one exogenous variable, the weighted average of
EU15, US, Russian and Japanese GDP. The weights are proportional to trade weights. We
did not include all trading partners in the weighted foreign GDP for reasons of
endogeneity. For example, the Czech Republic and the Slovak Republic have substantial
bilateral trade relations, but, e.g. GDP development in the Slovak Republic is likely not
exogenous to GDP movements in the Czech Republic. In contrast, GDP developments in
EU15, United States, Russian Federation and Japan can be regarded as exogenous with
respect to economic developments in CESEE countries. These four main economic
regions represent, on average, 67% of total trade of the 26 CESEE countries, and hence the
bulk of external demand is captured.
● Lag length: We used Schwarz information criterion to determine the lag length.9
Figure 7 shows the response of government consumption to an unanticipated GDP
shock for the 20 CESEE countries for which quarterly data are available. The results are
broadly consistent with our earlier findings shown in Table 1. With a few exceptions,
government consumption reacted positively to unexpected GDP shocks. The most pro-
cyclical budget policy was observed in Hungary: a 1% positive GDP shock caused a more
than three percentage point rise in government consumption at the two-year horizon,
according to the point estimate, though the confidence band is very wide. The positive
effect is sizable in many other countries as well. The key exceptions are Croatia (which is
found to be a-cyclical), the Czech Republic and Estonia (in which the point estimates of the
impulse responses are very close to zero with a wide confidence band), Cyprus (which
shows an initial counter-cyclical reaction followed by a delayed pro-cyclicality at about
1.5 years after the shock10), and Romania (in which a contemporaneous pro-cyclical impact
is followed by a small and insignificant counter-cyclical response).
OECD JOURNAL ON BUDGETING – VOLUME 2010/1 © OECD 2010 11

THE IMPACT OF THE CRISIS ON BUDGET POLICY IN CENTRAL AND EASTERN EUROPE
Why would most CESEE countries, in contrast to developed countries, pursue a pro-
cyclical fiscal policy that might exacerbate the business cycle? Based on an extensive
literature review concerning fiscal policy in developing countries, Ilzetzki and Vegh (2008)
conclude that there are two main explanations:
1. Imperfections in international credit markets prevent developing countries from
borrowing in bad times.
2. Political economy explanations typically based on the idea that good times encourage
fiscal profligacy and/or rent-seeking activities.
Box 1. Data sources and availability for the empirical estimates
We aimed to collect seasonally and working-day adjusted quarterly GDP and governmentconsumption figures at constant prices for the 1995Q1-2009Q1 period. The table below details our data.
Data for the EU15, United States and Japan are from Eurostat and available for 1995Q1-2009Q1.
Country Availability Source Note
Bulgaria 1995Q1-2009Q1 Eurostat (only raw data – not seasonally and working-day adjusted – are available)
We calculated the seasonal adjustment by using the Census X12 method.
Cyprus 1995Q1-2009Q1 Eurostat
Czech Republic 1996Q1-2009Q1 Eurostat
Estonia 1995Q1-2009Q1 Eurostat
Hungary 1995Q1-2009Q1 Eurostat
Latvia 1995Q1-2009Q1 Eurostat
Lithuania 1995Q1-2009Q1 Eurostat
Malta 2000Q1-2009Q1 Eurostat
Poland 1995Q1-2009Q1 Eurostat
Romania 1998Q1-2009Q1 Eurostat (only raw data – not seasonally and working-day adjusted – are available)
We calculated the seasonal adjustment by using the Census X12 method.
Slovenia 1995Q1-2008Q4 Eurostat
Slovak Republic 1995Q1-2009Q1 Eurostat
Croatia 1997Q1-2009Q1 Eurostat (only raw data – not seasonally and working-day adjusted – are available)
Seasonal adjustment by using the Census X12 method.
Turkey 1995Q1-2009Q1 Central Statistical Office of Turkey (only raw data– not seasonally and working-day adjusted – are available at different years’ prices: series at 1987 prices is available for 1987-2007; series at 1998 prices is available for 1998-2009)
We first performed seasonal adjustment using the Census X12 method of the times series available at 1987 and 1998 years’ prices and then combined them into single time series.
Russian Federation 1995Q1-2009Q1 Federal State Statistics Service of the Russian Federation (only raw data – not seasonally and working-day adjusted – are available at different years’ prices)
We combined into single time series the data available at different years’ prices and then adjusted seasonally with the Census X12 method.
Armenia 1995Q1-2009Q1 IMF-IFS: unadjusted nominal national accounts figures and CPI
We deflated nominal figures with the CPI and then adjusted seasonally with the Census X12 method.
Belarus 1995Q1-2008Q4 IMF-IFS: unadjusted real GDP, nominal government consumption, and GDP deflator
We deflated government consumption with the GDP deflator and then adjusted seasonally along with the GDP with the Census X12 method.
Georgia 1996Q1-2008Q4 IMF-IFS: unadjusted real GDP, nominal government consumption, and CPI
We deflated government consumption with the CPI and then adjusted seasonally along with the GDP with the Census X12 method.
Moldova 2000Q1-2009Q1 IMF – IFS: unadjusted nominal national accounts figures and CPI
We deflated nominal figures with the CPI and then adjusted seasonally with the Census X12 method.
Ukraine 2001Q1-2009Q1 State Statistics Committee of Ukraine (only raw data – not seasonally and working day adjusted – are available)
We calculated the seasonal adjustment by using the Census X12 method.
OECD JOURNAL ON BUDGETING – VOLUME 2010/1 © OECD 201012

THE IMPACT OF THE CRISIS ON BUDGET POLICY IN CENTRAL AND EASTERN EUROPE
P
e timer eachre not
20
20
20
20
20
As far as imperfections in international credit markets are concerned, further
integration of CESEE countries into the EU could ease this problem. However, as the cases
of Greece and Hungary underline, it is euro-area membership that makes a difference. Both
Figure 7. Response of government consumption to a one percentage point shock in GD
Note: The panels show the response of government consumption to a one percentage point shock in GDP as a function of th(measured in quarters) after the shock. Dashed lines represent +/- two standard deviations confidence band. The sample period focountry is detailed in Box 1. Data for Albania, Azerbaijan, Bosnia and Herzegovina, Macedonia, FYR, Montenegro, and Serbia aavailable.
-1.0
-0.5
0
0.5
1.0
1.5
2.0
-0.4
-0.2
0
0.2
0.4
0.6
-0.4
-0.2
0
0.2
0.4
0.6
0.8
1.0
-0.2
-0.1
0
0.1
0.2
0.3
0.4
0.5
0
0.4
0.8
1.2
1.6
2.0
-1.5
-1.0
-0.5
0
0.5
1.0
1.5
2.0
-0.4
-0.2
0
0.2
0.4
0.6
0.8
-1.0
-0.5
0
0.5
1.0
1.5
2.0
-0.3
-0.2
-0.1
0
0.1
0.2
-0.8
-0.4
0
0.4
0.8
1.2
1.6
2.0
2.4
-3
-2
-1
0
1
2
-12
-8
-4
0
4
8
12
-0.3
-0.2
-0.1
0
0.1
0.2
0.3
0.4
0.5
0.6
-0.6
-0.4
-0.2
0
0.2
0.4
0.6
0.8
-0.4
0
0.4
0.8
1.2
1.6
2.0
-0.4
-0.2
0
0.2
0.4
0.6
0.8
-1.5
-1.0
-0.5
0
0.5
1.0
1.5
2.0
-0.1
0
0.1
0.2
0.3
0.4
0.5
0.6
0.7
-0.4
-0.2
0
0.2
0.4
0.6
0.8
1.0
1.2
1.4
-0.4
-0.3
-0.2
-0.1
0
0.1
0.2
0.3
5 10 15 20 5 10 15 20 5 10 15 20 5 10 15
5 10 15 20 5 10 15 20 5 10 15 20 5 10 15
5 10 15 20 5 10 15 20 5 10 15 20 5 10 15
5 10 15 20 5 10 15 20 5 10 15 20 5 10 15
5 10 15 20 5 10 15 20 5 10 15 20 5 10 15
Bulgaria Czech Republic Cyprus Estonia
Latvia Lithuania Hungary Malta
Poland Romania Slovenia Slovak Republic
Russian Federation Croatia Turkey Armenia
Belarus Georgia Moldova Ukraine
OECD JOURNAL ON BUDGETING – VOLUME 2010/1 © OECD 2010 13

THE IMPACT OF THE CRISIS ON BUDGET POLICY IN CENTRAL AND EASTERN EUROPE
countries are members of the EU, but only Greece is a member of the euro area. While the
main fundamentals were worse in Greece than in Hungary, Greece has fared much better
than Hungary in the first year of the post-Lehman Brothers period of the current crisis.11
On the other hand, many CESEE countries also pursued pro-cyclical policies in good
times when credit from foreign sources was abundant. Consequently, political economy
factors may be highly relevant in explaining the pro-cyclical budgetary policies of these
countries.
We return to the issue of euro-area entry and the need for improvements in budgetary
governance in the final section of this article.
3. The impact of the crisis on budget policy: main channelsThe crisis has, through various channels, had a significant impact on the budget policy
of all countries, including CESEE countries. However the strength of certain channels varies
across countries according to their specific circumstances. Figure 8 indicates the headline
budget deficit numbers for CESEE countries in comparison with some major economies.
Budget deficits outcomes are rather diverse and are related to a large number of factors, to
be discussed later.
From the perspective of most CESEE countries, the impact of the crisis can be
summarised as: 1) a significant revenue shortfall; 2) changes in the global economic
environment that have led to external financial constraints and less growth in main export
destination markets; and 3) a significant change in the medium/long-term outlook.
Figure 8. General government budget balance, 1997-2010% of GDP
Note: Countries are ordered according to their 2010 balance (except Macedonia, FYR).
Source: Eurostat, EBRD, IMF WEO (October 2009). The 2009 forecast for Macedonia, FYR is from the EBRD (spring 2009); the 2010forecast is not available.
20
15
10
5
-5
-10
0
-15
1997-2007 2008 2009 2010
Latv
ia
Esto
nia
Lith
uania
Arm
enia
Azer
baija
n
Ukra
ine
Geo
rgia
Bulg
aria
Mold
ova
Rom
ania
Hun
gary
Cro
atia
Rus
sian F
edera
tion
CESEE26
Turke
y
Slovak
Rep
ublic
Cze
ch R
epub
lic
Serb
ia
Bos
nia/H
erzeg
ovina
Slov
enia
Mon
teneg
ro E
U15
Bela
rus
Unit
ed States
Asia
25
Mac
edon
ia, FY
R
Pola
nd
Cyp
rus
LATA
M32
Midd
le Eas
t13
Alba
nia
Malt
a
Afri
ca48
OECD JOURNAL ON BUDGETING – VOLUME 2010/1 © OECD 201014

THE IMPACT OF THE CRISIS ON BUDGET POLICY IN CENTRAL AND EASTERN EUROPE
3.1. Direct fiscal impact
The most serious impact of the crisis on budget policy has been felt on the revenue
side. With declining economic activity, all kinds of tax revenues decline. Progressive
income taxes and corporate taxes act as automatic stabilisers, as do unemployment and
other welfare benefits. In addition, countries that have scope may engage in discretionary
fiscal stimulus programmes to boost domestic demand. We believe that the current
economic environment is a classical Keynesian situation that would in principle demand
such discretionary policies. However, as we will discuss in more detail in Section 6, both
the desirability of, and the scope for, such actions fundamentally depend on the
circumstances of individual countries, such as their size and openness, the credibility and
strength of fiscal institutions, and the level of government debt. Last, but not least, fiscal
support for the financial sector (which is different from discretionary fiscal stimulus) has a
crucial role, as the health of the banking system and its potential for credit expansion is
crucial for the recovery.
3.2. Changes in the global economic environment
Changes in the global economic environment have important impacts on all countries,
but especially on open economies. The crisis affects capital flows, risk premia, trade,
migration and also the outlook of major economies. These impacts in turn affect the
economies of CESEE countries, thereby limiting their budgetary policies.
First, as we have discussed in Section 1.2, countries in this region in general have
relied heavily on capital inflows to finance investment (and also consumption in many
cases). The global nature of the crisis, the ongoing de-leveraging process, and the general
reduction in global liquidity have substantially reduced capital inflows and will even lead
to capital outflows. For example, the October 2009 IMF World Economic Outlook includes a
forecast for capital flows that foresees substantial decline. These factors pose significant
constraints on the ability to raise capital.
Second, the capital that is available will be more expensive, and risk premiums are
expected to remain considerably higher than their pre-crisis levels, implying a higher cost
of capital for all economic sectors, including the government. Indicators measuring the
risk that emerging and developing countries represent for lenders, such as credit default
swaps (Figure 5) or emerging market bond indices, have shown dramatic increases,
suggesting a rise in risk perceptions. These indicators measure current risk perceptions,
but it is unlikely that risk perception will decline to pre-crisis levels in the near future.
Some authors argue that emerging market bond spreads and credit default swaps were
unjustifiably low before the crisis and hence a return to that situation is unlikely.
Third, the substantial fall in global trade, coupled with moves towards protectionism
by major destination markets, have an impact on a key pillar for economic success in the
generally small and open CESEE economies. Central and south-eastern European
economies in particular heavily depend on trade with the EU, while eastern European
countries are similarly reliant on the Russian Federation. Their previous success was partly
based on the building up of (partly inter-company) trade relations. With the recession in
western Europe and the Russian Federation, CESEE exports will be hit seriously, also
reflecting the general finding that cyclical swings in small, open economies tend to be
greater than in more advanced economies. Furthermore, many export destination
countries are considering the adoption of various subsidies for certain sectors, which could
OECD JOURNAL ON BUDGETING – VOLUME 2010/1 © OECD 2010 15
THE IMPACT OF THE CRISIS ON BUDGET POLICY IN CENTRAL AND EASTERN EUROPE
further distort trade relations. Any undermining of the close integration of production
networks within Europe, and the resulting job losses, would pose a challenge to eastern
countries. While this effect is in some respects cyclical, if recession in western Europe and
the Russian Federation is long-lasting and results in the rise of trade-distorting policies, the
challenges for CESEE countries will also be long-lasting and serious. Commodity-exporting
countries, including of course the Russian Federation, have also been hit by lower demand
and revenues for an uncertain duration. Furthermore, in some of the countries there is a
high level of specialisation/concentration of activities in a few sectors. Depending on
which sectors these are (oil, cars, pharma, high-tech services, etc.), and how important
foreign direct investment (FDI) is in these sectors, this might affect their sensitivity of those
countries to cyclical downturns, and the sustainability of their long-term growth.
Fourth, migration may also be affected. Some countries in the region have experienced
very large outflows of workers to richer economies, with citizens from the new EU member
states and western Balkan countries heading primarily to western Europe, and those of CIS
countries heading to the Russian Federation. With the economic slowdown in western
Europe and the Russian Federation, labour outflows may slow and even partially reverse.
Remittances, which play a very significant role in some of these countries, could dwindle
substantially. These developments would have additional adverse consequences. If some
of the countries in the region experience very large economic contractions over extended
periods, then migration outflows may speed up again, exacerbating the effects of the crisis
and undermining the long term prospects of some countries.12
Finally, in addition to reduced capital flows, rising risk premia, declining trade, falling
remittances and potential reverse migration, developments in the major economies may
themselves have major impacts on CESEE countries. Major economies have accumulated
huge budget deficits, as a consequence of automatic stabilisers, and also as a result of the
huge support given to the financial sector, and discretionary fiscal stimulus in some cases.
This has led to abrupt increases in government debt in major economies, which will
require more countercyclical fiscal policy in the future to maintain credibility. However,
prolonged budgetary adjustments in major economies run the risk of reducing growth for
a prolonged period (perhaps after an initial rebound immediately after the crisis due to
huge output gaps that will have likely emerged). Such a prolonged adjustment in major
economies will significantly impact CESEE countries.
3.3. Reconsideration of the medium- and long-term economic outlook
For all of the reasons discussed so far, the previous “growth model” of CESEE countries
is at risk, and substantial downgrades in growth prospects compared to the pre-crisis
outlook can be expected.13 Reconsideration of the medium- and long-term economic
outlook for these countries will have consequences for future budgetary policies. In
particular, budgetary expenditure planning must consider new revenue realities.
Furthermore, the crisis will likely have lasting negative wealth effects on these
countries. The fall in the price of certain assets, and their future outlook, should be
evaluated in the light of pre-crisis expectations for these prices. While asset prices will
likely bottom out, if they have not yet done so, their future outlook is not just uncertain, it
is also likely that there will be a downward shift in price levels compared to the pre-crisis
outlook.14
OECD JOURNAL ON BUDGETING – VOLUME 2010/1 © OECD 201016

THE IMPACT OF THE CRISIS ON BUDGET POLICY IN CENTRAL AND EASTERN EUROPE
The fall in housing prices impacts especially those countries that had huge housing
booms in previous years.15 The fall in commodity prices impacts commodity exporter
countries.16 Wherever foreign currency loans were granted and the exchange rate has
depreciated, a wealth effect operates because of the increased debt/income ratio. Increases
in the interest rate, both for domestic and foreign currency denominated loans, increases
the debt service/income ratio.
Many of the countries have funded pension systems, and the losses assumed directly
challenge those who are to retire in the coming years. The downgraded prospects
compared to pre-crisis outlooks will also have an effect.
The consequence of all of these wealth effects is a downward shift in consumption
patterns. The current crisis is different from a “regular” bust in a business cycle.
Consumption smoothing, if any, will work to a much lesser extent. Instead, heightened
falls in consumption are likely due to changed expectations about the future, to wealth
effects and also to the difficulties in obtaining credit (supply plus higher real interest rates).
4. Budget policy reactions in CESEE countriesBudget policy reactions can be understood only in the broader context of other
macroeconomic policies and constraints. Due to the substantial revenue shortfall and
external financing constraints, most countries simply do not have scope for discretionary
fiscal stimulus. In addition, many countries face significant confidence constraints as well.
Eight countries (Armenia, Belarus, Bosnia-Herzegovina, Hungary, Latvia, Romania, Serbia,
and Ukraine) have standby agreements with the IMF,17 and Turkey is in talks. The loans
granted under these agreements are conditional on the implementation of a comprehensive
economic programme aimed at ensuring fiscal consolidation, structural reform and support
for the financial system.18
On the other hand, the Russian Federation, a large and not-so-open economy with
huge fiscal reserves (and low gross government debt, see Figure 4) has scope for fiscal
stimulus, and indeed has rightly embarked on a significant fiscal stimulus programme.
However, as also highlighted by, e.g. World Bank (2009a), the scope for further fiscal
stimulus in 2009 and 2010 appears limited due to the remaining downside risks in the
global and Russian economies, and the exhaustion of a large part of Russia’s Reserve Fund.
Because of its low government debt, the Russian Federation has room to borrow externally,
which is indeed planned for 2010. But while that is being done, longer term fiscal
sustainability should be prioritised, which will require reforms to broaden the revenue
base and ensure greater efficiency in public and social programmes.
In parallel with budget constraints, monetary policy reactions were varied across
countries. Three-month interbank interest rates also reflected this (Figure 9). Some
countries (e.g. Czech Republic, Poland and Slovak Republic) cautiously cut interest rates,
while others had to raise them substantially (e.g. Hungary and Romania). Monetary policy
actions were determined by pressures on exchange rates, currency composition of debt,
and of course by the credibility of economic policies and inflation prospects. The Russian
Federation and Ukraine aimed for exchange rate stabilisation. The Russian Federation has
lost one-third of its reserves in defending the exchange rate.
A recent IMF staff position note (IMF, 2009) assessed fiscal stimuli in G20 countries and
in a few CESEE countries, while the European Commission (2009) presents assessment for
all 27 EU countries. In this section, we first report the IMF (2009) and European Commission
OECD JOURNAL ON BUDGETING – VOLUME 2010/1 © OECD 2010 17

THE IMPACT OF THE CRISIS ON BUDGET POLICY IN CENTRAL AND EASTERN EUROPE
(2009) results for CESEE countries in comparison to some G20 countries. In Annex A, we
report our own data collected from various sources, which cover all 26 CESEE countries.
Table 2 shows that the Russian Federation adopted the largest stimulus among
G20 countries in 2009, and the sixth largest for the three-year period from 2008 to 2010. In
particular, the Russian Federation’s stimulus is larger than that of the United States, and
of any single European country (as a percentage of GDP), both in 2009 and the three-year
2008-10 period.
Turkey’s discretionary fiscal stimulus is the second lowest among G20 countries. The
June 2009 stimulus, which is not included in IMF (2009) and hence Table 2, is estimated to
be 0.3% of GDP.
Table 3 indicates that most of the EU member CESEE countries have not implemented
discretionary stimulus measures.
Using a different methodology, Saha and von Weizsäcker (2009) estimate that
discretionary fiscal measures amount to 0.5% of GDP in Poland in 2009.
Annex A details the various measures adopted in response to the crisis for all 26 CESEE
countries. Budget policy reactions vary substantially across countries. The less vulnerable
countries (e.g. the Czech Republic, Malta, Poland, Slovenia) implemented discretionary
stimulus measures, but most countries instead engaged in fiscal consolidation.
Direct measures for supporting the financial sector were generally low or zero in
CESEE countries (see Tables 4 and 5 and Annex A). Four CESEE countries (Hungary, Poland,
the Russian Federation and Turkey) are included in IMF (2009) in this respect (reported in
Table 4). As an integral part of its IMF programme, Hungary gave the largest (among these
four countries, in terms of GDP) support to the financial sector that required upfront
government financing. Still, measures in all four countries have been dwarfed by the
measures that have taken in advanced G20 countries, which are reported in the last row of
Table 4. Table 5 highlights that among the EU member CESEE countries only Hungary and
Latvia provided support for the financial sector.
Figure 9. Three-month interbank interest rates, 2 January 2008-6 November 2009
Note: The Romanian rate peaked at 49.81% on 20 October 2008, but for better readability of the right-hand side panel,the vertical axis has a 30% cut-off.
Source: Datastream and National Bank of Moldova.
10
9
8
7
6
5
4
3
2
1
0
28
24
20
16
12
4
8
02008:01 2009:012008:07 2009:072008:01 2009:012008:07 2009:07
TurkeyMoldova
HungarySlovak RepublicPolandEstonia
LatviaRomaniaCzech Republic
BulgariaLithuania
Euro area Euro area
BGR
SVK
POL
TUR
MDA
EST
LTU
LVACZE
HUN
ROU
OECD JOURNAL ON BUDGETING – VOLUME 2010/1 © OECD 201018

THE IMPACT OF THE CRISIS ON BUDGET POLICY IN CENTRAL AND EASTERN EUROPE
Table 2. Estimated cost of discretionary measures in G20 countries% of GDP, relative to 2007 baseline
2008 2009 2010 All three years
Saudi Arabia 2.4 3.3 3.5 9.2
South Africa 2.3 3.0 2.1 7.4
China 0.4 3.1 2.7 6.2
Korea 1.1 3.7 1.2 6.0
Australia 1.2 2.5 2.1 5.8
Russian Federation 0.0 4.1 1.3 5.4
United States 1.1 2.0 1.8 4.9
Japan 0.3 2.4 1.8 4.5
Spain 1.9 2.3 . . 4.2
Germany 0.0 1.6 2.0 3.6
Canada 0.0 1.9 1.7 3.6
Indonesia 0.0 1.4 0.6 2.0
India 0.6 0.6 0.6 1.8
United Kingdom 0.2 1.5 0.0 1.7
Argentina 0.0 1.5 . . 1.5
France 0.0 0.7 0.8 1.5
Mexico 0.0 1.5 . . 1.5
Brazil 0.0 0.6 0.5 1.1
Turkey 0.0 0.8 0.3 1.1
Italy 0.0 0.2 0.1 0.3
Note: Countries are ordered according to the sum of the stimulus over 2008-10.Source: Extracted from Table 3.4 of IMF (2009), “Fiscal Implications of the Global Economic and Financial Crisis”, IMFStaff Position Note, June, Washington DC. See detailed notes to the table in IMF (2009).
Table 3. Fiscal stimulus measures in EU countries, 2009 and 2010% of GDP, relative to 2008 baseline
2009 2010
Total Expenditure RevenueMeasures aimed at
households
Increased spending on
labour market measures
Measures aimed at
businesses
Increased public
investment
Of which public
infrastructureTotal
Bulgaria 0.0 0.0 0.0 0.0 0.0 0.0 0.0 0.0 0.0
Cyprus 0.1 0.1 0.0 0.0 0.0 0.0 0.0 0.0 0.0
Czech Republic 1.0 0.5 0.5 0.0 0.5 0.1 0.4 0.4 0.5
Estonia 0.2 0.2 0.0 0.0 0.2 0.0 0.0 0.0 0.3
Hungary 0.0 0.0 0.0 0.0 0.0 0.0 0.0 0.0 0.0
Latvia 0.0 0.0 0.0 0.0 0.0 0.0 0.0 0.0 0.0
Lithuania 0.0 0.0 0.0 0.0 0.0 0.0 0.0 0.0 0.0
Malta 1.6 1.3 0.3 0.3 0.0 0.1 1.3 0.7 1.6
Poland 1.0 0.3 0.7 0.6 0.0 0.1 0.3 0.3 1.5
Romania 0.0 0.0 0.0 0.0 0.0 0 0.0 0.0 0.0
Slovak Republic 0.1 0.1 0.0 0.0 0.0 0.1 0.0 0.0 0.0
Slovenia 0.6 0.5 0.1 0.0 0.1 0.3 0.2 0.0 0.5
Total euro area 1.1 0.5 0.5 0.4 0.1 0.2 0.3 0.1 0.8
United Kingdom 1.4 0.4 1.0 1.2 0.0 0.0 0.2 0.0 0.0
Source: Extracted from Table I.1.1 of European Commission (2009), “Public Finances in EMU”, European Economy, 5/2009(provisional version), Directorate-General Economic and Financial Affairs of the European Commission.
OECD JOURNAL ON BUDGETING – VOLUME 2010/1 © OECD 2010 19
THE IMPACT OF THE CRISIS ON BUDGET POLICY IN CENTRAL AND EASTERN EUROPE
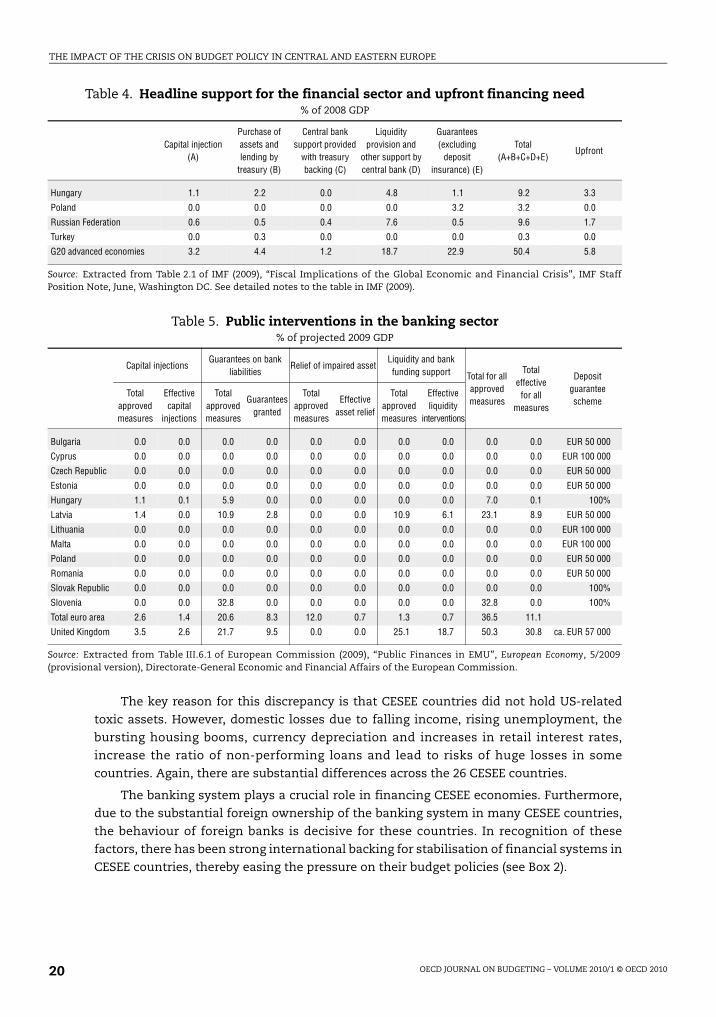
The key reason for this discrepancy is that CESEE countries did not hold US-related
toxic assets. However, domestic losses due to falling income, rising unemployment, the
bursting housing booms, currency depreciation and increases in retail interest rates,
increase the ratio of non-performing loans and lead to risks of huge losses in some
countries. Again, there are substantial differences across the 26 CESEE countries.
The banking system plays a crucial role in financing CESEE economies. Furthermore,
due to the substantial foreign ownership of the banking system in many CESEE countries,
the behaviour of foreign banks is decisive for these countries. In recognition of these
factors, there has been strong international backing for stabilisation of financial systems in
CESEE countries, thereby easing the pressure on their budget policies (see Box 2).
Table 4. Headline support for the financial sector and upfront financing need% of 2008 GDP
Capital injection (A)
Purchase of assets and lending by
treasury (B)
Central bank support provided
with treasury backing (C)
Liquidity provision and
other support by central bank (D)
Guarantees (excluding
deposit insurance) (E)
Total (A+B+C+D+E)
Upfront
Hungary 1.1 2.2 0.0 4.8 1.1 9.2 3.3
Poland 0.0 0.0 0.0 0.0 3.2 3.2 0.0
Russian Federation 0.6 0.5 0.4 7.6 0.5 9.6 1.7
Turkey 0.0 0.3 0.0 0.0 0.0 0.3 0.0
G20 advanced economies 3.2 4.4 1.2 18.7 22.9 50.4 5.8
Source: Extracted from Table 2.1 of IMF (2009), “Fiscal Implications of the Global Economic and Financial Crisis”, IMF StaffPosition Note, June, Washington DC. See detailed notes to the table in IMF (2009).
Table 5. Public interventions in the banking sector% of projected 2009 GDP
Capital injectionsGuarantees on bank
liabilitiesRelief of impaired asset
Liquidity and bank funding support Total for all
approved measures
Total effective
for all measures
Depositguaranteescheme
Total approved measures
Effective capital
injections
Total approved measures
Guarantees granted
Total approved measures
Effective asset relief
Total approved measures
Effective liquidity
interventions
Bulgaria 0.0 0.0 0.0 0.0 0.0 0.0 0.0 0.0 0.0 0.0 EUR 50 000
Cyprus 0.0 0.0 0.0 0.0 0.0 0.0 0.0 0.0 0.0 0.0 EUR 100 000
Czech Republic 0.0 0.0 0.0 0.0 0.0 0.0 0.0 0.0 0.0 0.0 EUR 50 000
Estonia 0.0 0.0 0.0 0.0 0.0 0.0 0.0 0.0 0.0 0.0 EUR 50 000
Hungary 1.1 0.1 5.9 0.0 0.0 0.0 0.0 0.0 7.0 0.1 100%
Latvia 1.4 0.0 10.9 2.8 0.0 0.0 10.9 6.1 23.1 8.9 EUR 50 000
Lithuania 0.0 0.0 0.0 0.0 0.0 0.0 0.0 0.0 0.0 0.0 EUR 100 000
Malta 0.0 0.0 0.0 0.0 0.0 0.0 0.0 0.0 0.0 0.0 EUR 100 000
Poland 0.0 0.0 0.0 0.0 0.0 0.0 0.0 0.0 0.0 0.0 EUR 50 000
Romania 0.0 0.0 0.0 0.0 0.0 0.0 0.0 0.0 0.0 0.0 EUR 50 000
Slovak Republic 0.0 0.0 0.0 0.0 0.0 0.0 0.0 0.0 0.0 0.0 100%
Slovenia 0.0 0.0 32.8 0.0 0.0 0.0 0.0 0.0 32.8 0.0 100%
Total euro area 2.6 1.4 20.6 8.3 12.0 0.7 1.3 0.7 36.5 11.1
United Kingdom 3.5 2.6 21.7 9.5 0.0 0.0 25.1 18.7 50.3 30.8 ca. EUR 57 000
Source: Extracted from Table III.6.1 of European Commission (2009), “Public Finances in EMU”, European Economy, 5/2009(provisional version), Directorate-General Economic and Financial Affairs of the European Commission.
OECD JOURNAL ON BUDGETING – VOLUME 2010/1 © OECD 201020

THE IMPACT OF THE CRISIS ON BUDGET POLICY IN CENTRAL AND EASTERN EUROPE
5. Lessons from previous emerging market crises to budget policyPrevious economic crises were a major cause of structural reforms in general, and of
the budget in particular. For example, Henriksson (2007) presents an excellent essay about
fiscal reforms in Sweden, which were prompted by the deep Swedish economic and
financial crisis of the early 1990s. Kopits (2008) lists some examples from CESEE countries.
Baksay and Kiss (2009) describe and analyse the new Hungarian fiscal responsibility law
that was adopted by the Parliament in December 2009. The law was initiated well before
the crisis but the crisis has sped up its finalisation and passing.
Let us highlight two other cases: the Russian Federation and Brazil after 1998. Both
countries experienced serious crises in 1998/99; furthermore, Brazil’s economic history since
the oil shocks was a tale of crises, instability, hyper-inflation, temporary economic booms
followed by serious busts, and serious fiscal tensions between the central and regional
governments. However, despite the global nature of the current crisis, instead of asking for
help from the IMF, both countries intend to invest USD 10 billion in notes to be issued by the
IMF to support the Fund’s activities elsewhere. The fiscal consolidation and reform, as well
as changes in monetary and exchange rate policies prompted by the 1998/99 crises, changed
the position of these countries from potential and actual recipients of IMF loans to suppliers.
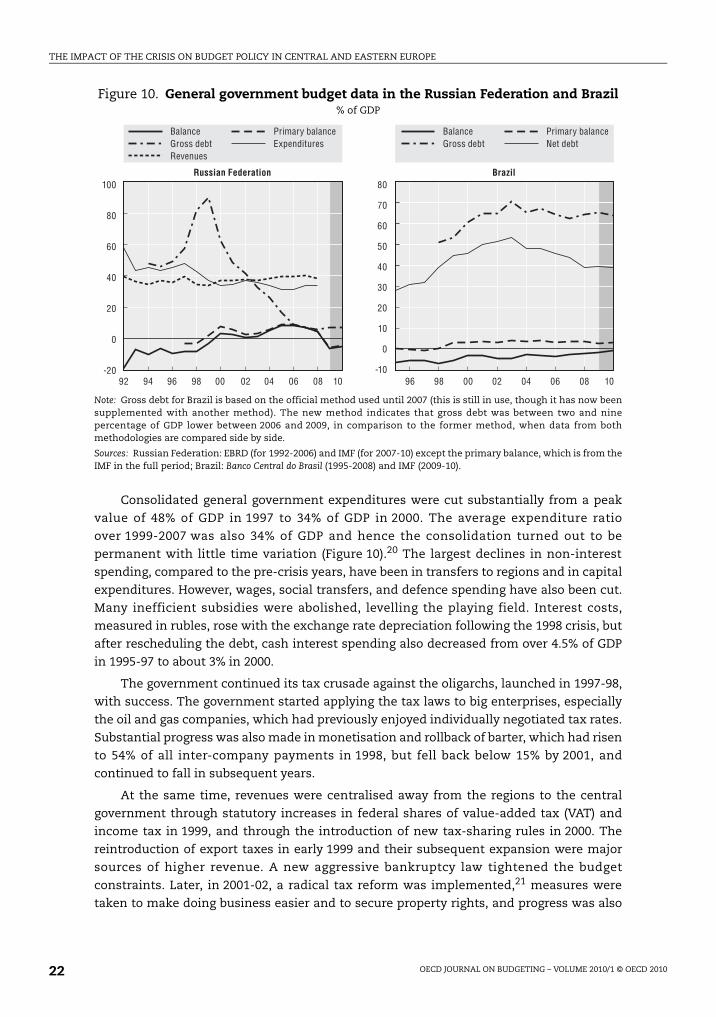
The Russian Federation’s fiscal policy was characterised by very high deficits before
the 1998 crisis, averaging 8.5% of GDP between 1993 and 1997 (Figure 10).19 Business subsidies
amounted to about 16% of GDP, with little social benefit. The external financial constraints
posed by the crisis forced substantial budget consolidation and vital fiscal reforms.
Box 2. External support for the CESEE financial sector
The EU’s commitment not to let any systemically important bank fail in the euro area, or inSweden (whose banks own most of the banking system in the Baltic countries), the commitmentthat packages designed to help international banking groups can also benefit their subsidiaries,and the European Central Bank’s liquidity support to euro-area banking groups, have also helpedtheir subsidiaries in the CESEE region.
Efforts to stabilise the financial system in CESEE countries (irrespective of the ownershipstructure) are supported by the joint action plan of the EBRD, EIB Group and World Bank Group,unveiled on 27 February 2009. This initiative aims to support the CESEE banking sectors and banklending to businesses, in particular to small and medium-sized firms, up to a level ofEUR 24.5 billion over two years in the form of equity and debt finance, credit lines, and political riskinsurance.
The so-called “Vienna Initiative”, which is a multilateral effort to secure financial sector stabilityin those CESEE countries with substantial foreign bank ownership, aims to stimulate coordinationbetween all relevant stakeholders, including international banking groups, home and host countryauthorities, international financial institutions and the EU. The aim of the initiative is to develop acommon understanding on key issues, to secure the commitments made by both internationalbanking groups and home and host country authorities, and to coordinate a fair burden-sharing.
Furthermore, agreements between central banks, most notably the euro/lats swap offered toLatvia by the Danish and Swedish central banks and the Swedish krona/Estonian kroon swapoffered by Sweden to Estonia, are also helpful for the stability of the banking sector. The option ofgetting foreign exchange liquidity in exchange for domestic currency alleviates the pressure ondomestic currency markets.
OECD JOURNAL ON BUDGETING – VOLUME 2010/1 © OECD 2010 21
THE IMPACT OF THE CRISIS ON BUDGET POLICY IN CENTRAL AND EASTERN EUROPE
Consolidated general government expenditures were cut substantially from a peak
value of 48% of GDP in 1997 to 34% of GDP in 2000. The average expenditure ratio
over 1999-2007 was also 34% of GDP and hence the consolidation turned out to be
permanent with little time variation (Figure 10).20 The largest declines in non-interest
spending, compared to the pre-crisis years, have been in transfers to regions and in capital
expenditures. However, wages, social transfers, and defence spending have also been cut.
Many inefficient subsidies were abolished, levelling the playing field. Interest costs,
measured in rubles, rose with the exchange rate depreciation following the 1998 crisis, but
after rescheduling the debt, cash interest spending also decreased from over 4.5% of GDP
in 1995-97 to about 3% in 2000.
The government continued its tax crusade against the oligarchs, launched in 1997-98,
with success. The government started applying the tax laws to big enterprises, especially
the oil and gas companies, which had previously enjoyed individually negotiated tax rates.
Substantial progress was also made in monetisation and rollback of barter, which had risen
to 54% of all inter-company payments in 1998, but fell back below 15% by 2001, and
continued to fall in subsequent years.
At the same time, revenues were centralised away from the regions to the central
government through statutory increases in federal shares of value-added tax (VAT) and
income tax in 1999, and through the introduction of new tax-sharing rules in 2000. The
reintroduction of export taxes in early 1999 and their subsequent expansion were major
sources of higher revenue. A new aggressive bankruptcy law tightened the budget
constraints. Later, in 2001-02, a radical tax reform was implemented,21 measures were
taken to make doing business easier and to secure property rights, and progress was also
Figure 10. General government budget data in the Russian Federation and Brazil% of GDP
Note: Gross debt for Brazil is based on the official method used until 2007 (this is still in use, though it has now beensupplemented with another method). The new method indicates that gross debt was between two and ninepercentage of GDP lower between 2006 and 2009, in comparison to the former method, when data from bothmethodologies are compared side by side.
Sources: Russian Federation: EBRD (for 1992-2006) and IMF (for 2007-10) except the primary balance, which is from theIMF in the full period; Brazil: Banco Central do Brasil (1995-2008) and IMF (2009-10).
100
80
60
40
20
0
-20
80
70
60
50
40
20
0
30
-10
10
92 9694 98 0200 04 0806 10 96 98 0200 04 0806 10
ExpendituresGross debtPrimary balance
Net debtGross debtPrimary balanceBalance Balance
Revenues
Russian Federation Brazil
OECD JOURNAL ON BUDGETING – VOLUME 2010/1 © OECD 201022

THE IMPACT OF THE CRISIS ON BUDGET POLICY IN CENTRAL AND EASTERN EUROPE
made with financial sector reform. Starting in 2004, most of the windfall oil revenues were
saved in a Stabilisation Fund that was later divided into a Reserve Fund and a National
Welfare Fund (of which the former was indeed used in 2009 to cover the budget deficit).
All of these factors and the related financial stabilisation of the economy have
contributed to the Russian Federation’s excellent budget performance in the post-crisis
period, and to strong economic growth.22 Still, the reforms implemented in response to
the 1998 crisis are not the end of the story. The Russian Federation still faces significant
fiscal challenges and there is much room for further improvement (see, e.g. OECD, 2009,
and World Bank, 2009a). Furthermore, as we shall demonstrate in the next section, the
Russian Federation is one of the lowest ranking of the 26 CESEE countries in terms of
preventing corruption and maintaining the rule of law. The government has a crucial role
in making improvements in these areas.
Brazil also implemented very ambitious fiscal reforms after the 1998-99 crises.23
In 1998, the federal government announced its first Fiscal Stabilisation Programme,
comprising four initiatives: 1) fiscal adjustment to increase the primary surplus of the
consolidated public sector (in contrast to the pre-crisis close-to-zero and small negative
primary balances, a primary balance target of plus 3.75% of GDP was introduced, which
was later raised to 4.25%); 2) institutional reform, including the social security system and
administrative reform; 3) redesign of fiscal federalism based on a comprehensive debt
financing and restructuring agreement with federal states and local governments;
4) reform of the budgetary process and the introduction of fiscal rules. The primary balance
targets were generally reached (Figure 10). The debt-restructuring agreement with federal
states and local governments was the basis for the change in sub-national governments’
fiscal performances after 1998. The improvements were further consolidated after the
approval of the May 2000 Fiscal Responsibility Law, which set out a general framework for
budgetary planning, execution and reporting for the three levels of government. The law
called for sustaining the structural adjustment of public finances and constraining public
indebtedness. It comprised three types of fiscal rules: general targets and limits for
selected fiscal indicators; corrective institutional mechanisms in case of non-compliance;
and institutional sanctions for non-compliance. Brazil’s public sector had substantial
foreign currency liabilities before the 1998 crisis, but it could gradually reduce the foreign
exchange exposure to less than 10% of GDP. Fiscal policy was accompanied by strict
monetary policy with inflation targeting under floating exchange rates, which was again a
fundamental revision of pre-1999 policies. Fiscal reforms played a crucial role in Brazil’s
good growth performance after 1999 and in Brazil’s resistance to the current global crisis.
6. Budget policy options in CESEE countriesIn principle, the current global economic environment calls for Keynesian policies.
Although potential output is also likely to be falling in all countries of the world, actual
output is falling to a much greater extent. As a result, in many countries large negative
output gaps are expected, and hence the fall in actual output is not just a case of correcting
pre-crisis positive output gaps that existed in many countries, including the CESEE region.
Furthermore, the development of large negative output gaps is not just the result of
domestic factors. The current crisis is likely to be a once-in-a-generation event, affecting
all countries world wide. The falls in external demand and remittances are clearly external
factors, as well as disturbances in international financial markets and the resulting global
changes in liquidity and capital flows to emerging and developing countries.
OECD JOURNAL ON BUDGETING – VOLUME 2010/1 © OECD 2010 23

THE IMPACT OF THE CRISIS ON BUDGET POLICY IN CENTRAL AND EASTERN EUROPE
Temporary discretionary fiscal actions, as well as monetary policy easing, are precisely
suitable for overcoming the demand shortage. Many countries, most notably major
economies but also many emerging economies, are rightly adopting various fiscal stimulus
measures (see Table 2).
In CESEE countries, government debt is generally low in most (but not all) cases
(see Figure 4). In principle, this would provide even more room for discretionary fiscal
stimulus.
Having said that, the viability of discretionary fiscal stimulus in CESEE countries has to
be looked at from the angle of country-specific circumstances.
First, financial constraints pose unavoidable limitations to such policies. Even
countries with low government debt levels and substantial fiscal reserves, such as Estonia,
are seriously constrained by the revenue shortfall resulting from the unexpected depth of
the recession. Contingent liabilities should also be taken into account when deciding on
discretionary measures. The crisis has substantially increased the risk of further
government intervention in the banking system. Furthermore, the debt level tolerance of
markets is lower for emerging and developing countries than it is for major economies.
Government debt defaults occurred at reasonably low debt levels (see, for example,
Sturzenegger and Zettelmeyer, 2006). For example, among recent cases of government default,
the public debt-to-GDP ratio was 37% in Ukraine, 45% in Argentina, 54% in the Russian
Federation and 66% in Ecuador, in the year before the government default.
Second, the impact of the fiscal stimulus on the domestic economy crucially depends
on whether a country is large and closed, or small and open. In small and open economies,
the effect of the stimulus can easily show up in increased imports. The Great Depression
taught us that protectionism can prolong the recession and hence this is not the path small
and open countries (and of course all other countries) should follow. On the other hand,
small and open economies can benefit from the stimulus implemented in their main
destination markets through trade and migration links.
Third, the results of the fiscal stimulus very much depend on the strength and
credibility of fiscal institutions. Figure 11 presents the four out of the six World Bank
governance indicators on which governments have the greatest impact. Although large
variation is evident, in many countries government effectiveness, regulatory quality,
control of corruption and the rule of law still lags substantially behind the EU15 and the
United States.24
Fourth, related to the previous point, the potential effect of stimulus programmes on
investors’ confidence should be considered. The weaker the credibility of the stimulus
programme is, the more likely it will result in increased risk perception and, eventually,
higher interest rates and capital outflows.
Fifth, as capital is becoming scarce, the potential for private investment to be crowded
out is also an important factor for countries facing external financing constraints.
Regarding the above list of issues, there is a key dividing line between CESEE countries.
On the one hand, the Russian Federation is big, has low debt and substantial fiscal reserves
and hence may be less exposed to the risk of loss of investors’ confidence, especially since
the rouble has been allowed to depreciate significantly. Discretionary fiscal stimulus was
the right decision for the Russian Federation. Azerbaijan also has substantial reserves and
its economy is still expected to grow by about 7.5%, both in 2009 and 2010 (see Figure 1).
OECD JOURNAL ON BUDGETING – VOLUME 2010/1 © OECD 201024

THE IMPACT OF THE CRISIS ON BUDGET POLICY IN CENTRAL AND EASTERN EUROPE
On the other hand, all other countries have much narrower or even zero scope for
discretionary measures, though there are important differences between countries. Poland
and Turkey, for example, are larger countries than most of the CESEE, and their debt levels
are around 50% of GDP. Such a debt level is higher than in many other CESEE countries, but
still at a level that does not itself pose a risk of a loss of credibility, provided that the
stimulus package is implemented in a credible and timely way. The Czech Republic,
Slovak Republic and Slovenia, the latter two of which enjoy the sheltering effect of the euro
area, also have greater scope for fiscal stimulus, as they did not accumulate significant
vulnerabilities before the crisis. However, their small and open economy characteristics
certainly limit the effectiveness of Keynesian policies on their domestic economies.
Countries that have had to rely on IMF programmes have no scope at all for stimulus, and
other CESEE countries should be very cautious as well.
The limited scope for fiscal stimulus leads us to ask if the crisis can be used as an
opportunity to reform fiscal institutions, improve their quality and embark on a necessary
budgetary consolidation. As we discussed in Section 5, many previous crises prompted
substantial fiscal reforms and serious budget cuts, despite earlier arguments that
challenging interest groups and reducing public expenditures would be impossible.
External financial constraints, while costly in the short run, help to expose the
weaknesses of fiscal institutions, and prompt reforms that have the potential of paving the
way to much better macroeconomic outcomes. The crisis is certainly very painful in many
respects. Unemployment has increased dramatically in many countries; many people have
lost their homes; many corporations have gone bankrupt, etc. However, the crisis, and
especially its global nature, also helps in communicating to the general public the need for
budgetary adjustment and structural reforms, including fiscal reforms.
Figure 11. World Bank Governance indicators, 2008
Note: The average score of all countries of the world is zero. Countries are ordered according to the average of the fourindicators.
Source: World Bank (2009), Governance Matters 2008, The World Bank, Washington DC.
2.0
1.5
1.0
0.5
-0.5
-1.0
0
-1.5
Latv
ia
Esto
nia
Lith
uania
Arm
enia
Azer
baija
n
Ukra
ine
Geo
rgia
Bulg
aria
Mold
ova
Rom
ania
Hun
gary
Cro
atia
Rus
sian F
edera
tion
CESEE26
Turke
y
Slovak
Rep
ublic
Cze
ch R
epub
lic
Serb
ia
Bos
nia/H
erzeg
ovina
Slov
enia
Mon
teneg
ro E
U15
Bela
rus
Unit
ed Stat
es
Asia
25
Mac
edon
ia, FY
R
Pola
nd
Cyp
rus
LATA
M32
Midd
le Eas
t13
Alba
nia
Malt
a
Afri
ca48
China
Government effectiveness Regulatory quality Control of corruption Rule of law
OECD JOURNAL ON BUDGETING – VOLUME 2010/1 © OECD 2010 25

THE IMPACT OF THE CRISIS ON BUDGET POLICY IN CENTRAL AND EASTERN EUROPE
Still, there are limits, and highly pro-cyclical budget cuts during a severe recession
should be avoided. For example, the latest forecasts for GDP falls in Latvia in 2009 are in the
15-20% range. The Latvian authorities decided to maintain the exchange rate peg and had
no other choice but to rely on the international community for emergency financing. As
the recession became much deeper than what had been seen up to the point when the
programme was designed, the budget deficit widened even more, requiring additional and
substantial fiscal efforts to limit it, so that Latvia could receive the subsequent tranches
provided by the financing programmes. This happened even though international financial
institutions agreed to somewhat higher deficit levels. In June 2009, the Latvian Parliament
passed a new budget law with additional cuts. While much blame can be laid on the
Latvian side for past behaviour (in particular, fiscal expenditures were increased
substantially before the crisis and little was done to limit the credit boom and the huge
current account deficit) the EU should be more flexible with regard to Baltic aspirations to
join the euro area.25
Regarding budget policy options for the future, some general principles could be laid
down:
● As a priority that is relevant both for the very short run and the longer term, the good
functioning of the financial system should be maintained. At the same time, so-called
“zombie lending” should be avoided.26
● The crisis should be used as an opportunity for structural reforms to enhance growth in
general and fiscal frameworks in particular. Reforms to avoid future pro-cyclical policies,
and to increase credibility and the quality of budgeting, such as fiscal responsibility laws
comprising medium-term fiscal frameworks, fiscal rules27 and independent fiscal
councils, should be considered where such institutions do not exist. When fiscal
consolidation is accompanied by fiscal reforms that increase credibility, non-Keynesian
effects28 may offset the contraction caused by the consolidation to some extent.
● Protection of the most vulnerable should be prioritised. Unemployment has different
social consequences in rich and poor countries. In poor countries, household saving is
typically lower and the risk of poverty is larger.
● Debates over healthcare and pension reforms should be re-opened, especially in
countries facing serious demographic pressures.
● Spending on pro-growth policies, such as education and innovation, should be
maintained but rationalised so as not to destroy the longer term post-crisis growth
prospects of these countries.
● Long-term fiscal sustainability should be highly prioritised. All of the above
recommendations would contribute to this.
How to do all of these at the same time when significant fiscal consolidation is needed
in many countries? There are some countries that did manage this during crisis episodes.
Let us quote a sentence from Henriksson’s (2007) excellent essay on “Ten Lessons About
Budget Consolidation”, which was inspired by his active involvement in the dramatic
Swedish budgetary measures that were taken after the crisis of the early 1990s:29 “The
bottom line may thus be: if you have to consolidate, wait for a deep crisis to occur, and it
will be easy to do, easy to communicate and easy to be re-elected.” The crisis is here now
and the opportunity should not be missed.
OECD JOURNAL ON BUDGETING – VOLUME 2010/1 © OECD 201026

THE IMPACT OF THE CRISIS ON BUDGET POLICY IN CENTRAL AND EASTERN EUROPE
Notes
1. This article analyses 26 countries of central, eastern, and south-eastern Europe: 12 centralEuropean and Baltic members of the EU (Bulgaria, Cyprus, Czech Republic, Estonia, Hungary,Latvia, Lithuania, Malta, Poland, Romania, Slovak Republic, Slovenia); the 7 EuropeanCommonwealth of Independent States (CIS) countries (Armenia, Azerbaijan, Belarus, Georgia,Moldova, Russian Federation, Ukraine); 5 non-EU countries of former Yugoslavia (Bosnia andHerzegovina, Croatia, FYR Macedonia, Montenegro, Serbia; data for Kosovo are not available), andTurkey and Albania.
The information in this article with reference to “Cyprus” relates to the southern part of the Island.There is no single authority representing both Turkish and Greek Cypriot people on the Island.Turkey recognises the Turkish Republic of Northern Cyprus (TRNC). Until a lasting and equitablesolution is found within the context of the United Nations, Turkey will preserve its positionconcerning the “Cyprus issue”.
2. In our view, comparison to a benchmark, i.e. the downward revision of the forecast level of GDP ata future date, is a better measure of the severity of the crisis than the actual fall in GDP. Forexample, zero growth has a different meaning for a country that has been used to growing and wasexpected to continue to grow in the future by 2% per year, than for a country in which thesenumbers are 6% per year. Nevertheless, we also show and discuss actual changes in GDP.
3. China is included separately in Figure 1.
4. See Darvas and Szapáry (2008) for further details on capital inflows and credit growth in the EUmember CESEE countries.
5. For example, Latvia is trying to implement heroic efforts to cut the budget deficit in the context ofa GDP fall of about 15-20% in a single year.
6. It is preferable to use government consumption rather than, e.g. government expenditures orbalance, for studying the pro-cyclical nature of budget policy, because these latter indicators arestrongly influenced by the business cycle (e.g. through transfers, debt service and tax revenues),while government consumption is a more direct policy tool. See Kaminsky, Reinhart and Vegh(2004) for a detailed discussion.
7. Quarterly data before 1995 are generally not available for CESEE countries, but even if available,they are likely burdened with substantial structural changes. Still, our sample starting in 1995 mayalso include structural breaks due to, for example, changes in fiscal policy regimes, which wouldnecessitate time-varying parameter SVARs. This issue is left for further research.
8. Note that impulse response functions in SVARs measure the effects of unanticipated shocks.
9. In the case of Poland, the Schwarz information criterion suggested two lags. However, with twolags the estimated model turned out to have an unstable root, and the impulse response functionsbecame explosive. We therefore used only one lag for Poland.
10. Using a panel of developed countries, Ilzetzki and Vegh (2008) also found such a pattern.
11. For example, Greece has had much higher government debt and a much higher current accountdeficit (as a percentage of GDP) than Hungary in the past few years. Immediately after the collapseof Lehman Brothers, Hungary experienced serious speculative attacks on its currency andgovernment bond markets, and had to rely on a multilateral financial assistance programme,while tensions in Greece were milder, at least till the finalisation of the article (November 2009).Hungary’s current account deficit is expected to shrink from 6% of GDP in 2007 to 3% of GDP in 2009and 2010, while Greece is still expected to have a current account deficit in excess of 11% of GDPboth in 2009 and in 2010, according to the October 2009 forecasts of the IMF. The government debt-to-GDP ratio is also expected to remain much higher in Greece than in Hungary. In June 2009 thespread over German ten-year government bond was 186 basis points for Greece and 668 basispoints for Hungary.
While macroeconomic indicators were in many cases better for Hungary than Greece, Hungarywas still one of the weakest among the new EU member states, and hence it was not surprisingthat Hungary was the first to turn to the IMF for emergency financing. Our calculations indicatethat Hungarian fiscal policy was the most pro-cyclical among the 26 CESEE countries, andgovernment debt was also the highest in 2007 (Figure 4). Government expenditure (as a percentageof GDP) was also the highest in Hungary and not just because of higher interest spending. By usinga proper method to compare government expenditures in four new EU member states, Kiss andSzemere (2009) conclude that the Hungarian government spends considerably more than itsneighbours.
OECD JOURNAL ON BUDGETING – VOLUME 2010/1 © OECD 2010 27

THE IMPACT OF THE CRISIS ON BUDGET POLICY IN CENTRAL AND EASTERN EUROPE
12. Ahearne et al. (2009) estimate the potential migration impacts of the crisis for new EU memberstates. They found that in the short run, the crisis is likely to lead to a lower stock of migrants fromthe new member states in the EU15 than would have been the case without the crisis, on accountof diminished job opportunities for migrants. By contrast, in the longer run, the crisis is set to leadto an increase in migration from the new member states, compared to what would have happenedwithout the crisis. This is because the crisis has undermined the economic growth model of thosenew member states that relied heavily on external financing to fuel their growth.
13. See Darvas and Veugelers (2009) for a detailed analysis of growth prospects of CESEE countries.
14. At time of finalising this article, November 2009, stock indices have increased substantially fromtheir bottom in February/March 2009 and currencies also have strengthened in most countries.The future outlook of asset prices is uncertain. Still, the current levels of, e.g. stock prices, are stilljust a fraction of their pre-crisis values.
15. See Égert and Mihaljek (2007) on housing prices and their determinants in some CESEE countriesduring the boom years.
16. At the same time, the fall in commodity prices improves the terms of trade of commodityimporters.
17. The IMF programme for the three EU countries (Hungary, Latvia, and Romania) was part of acoordinated international lending programme. The EU and the World Bank contribute to all threeprogrammes; the Czech Republic, Denmark, Estonia, Finland, Norway, Poland, Sweden and theEBRD have contributed to the Latvian programme; the EBRD and the European Investment Bank(EIB) have contributed to the Romanian programme.
18. As a precautionary measure, Poland has applied for, and received, the IMF’s new Flexible CreditLine, which is granted to countries that adopted sound policies in the past.
19. Main sources for the Russian summary are IMF (2000, 2001) and Åslund (2007).
20. By studying 85 fiscal consolidation episodes in 24 OECD countries since 1978, OECD (2007) findsthat consolidations based on expenditure cuts, including social spending cuts, tended to be largerand longer-lasting than consolidations based on revenue increases.
21. Key elements include reduction in, and consolidation of, social fund contributions, improvementsto VAT, sharp reduction in turnover taxes, the introduction of a flat personal income tax at areduced average rate, strengthened excise taxes, amendments to the profit tax that reduce the ratewhile eliminating most exemptions, and a new simplified system for the taxation of mineralresources.
22. As OECD (2009) emphasises, temporary factors have also contributed to the strong recovery afterthe Russian crisis of 1998, including the undervaluation of the rouble, low capacity utilisation andspare labour resources.
23. The main source for the Brazilian summary is Goldfajn and Guardia (2004).
24. A direct measure of the quality of fiscal institutions is presented in, e.g. Fabrizio and Mody (2008),for EU member countries (for which data are available). The index shows that some EU memberCESEE countries lag behind the EU15.
25. There are serious concerns with the euro accession criteria. Two decades after the designing of thecriteria and one decade since the launch of the euro, it is time to reform the criteria and tostrengthen their economic rationale. There is a straightforward way to do that: the EU treaty itselfspecifies an obligation on the Council to lay down the details of the convergence criteria and theexcessive deficit procedure. See the economic and legal aspects of reforming the criteria in Darvas(2009).
26. On zombies see, for example, Ahearne and Shinada (2005) and Caballero, Hoshi and Kashyap (2006).
27. Kopits (2004) argues that fiscal policy rules (if well designed and properly implemented) can beuseful commitment tools for emerging market economies exposed to macroeconomic volatilityand high capital mobility. They can be instrumental in avoiding myopic policies that result fromdynamic inconsistency and or/political distortions, and in a broader sense they can help todepoliticise the macroeconomic policy framework. Regarding the interaction of fiscal rules andfiscal consolidations, OECD (2007) finds that countries with fiscal rules achieved better results inconsolidating public finances. Furthermore, fiscal rules can also contribute to better performancein a monetary union. As Darvas, Rose and Szapáry (2007) have shown, when a country has achance to run a substantially and persistently higher budget deficit than other countries, it likelycreates idiosyncratic shocks that result in the business cycle deviating from that in the rest of the
OECD JOURNAL ON BUDGETING – VOLUME 2010/1 © OECD 201028

THE IMPACT OF THE CRISIS ON BUDGET POLICY IN CENTRAL AND EASTERN EUROPE
currency union. This would violate one of the most important criteria of the optimality of currencyareas: the synchronisation of business cycles.
28. The “non-Keynesian effects of fiscal consolidation” refers to increased private sector demand inresponse to cuts in government spending. If fiscal adjustment credibly signals fiscal sustainabilityand reduces the expected tax burden on the private sector, private sector demand may start againto compensate for the fall in government demand. Rzońca and Ciżkowicz (2005) present evidencethat non-Keynesian effects were indeed in force in new EU member states. Giudice and Turrini(2007) study fiscal consolidations that have been undertaken in the EU in the last 30 years andconclude that roughly half of these episodes have been followed by higher growth. Their resultsindicate that the consolidations that turned out to be expansionary were more likely to havestarted in periods with output below potential, and to have been based on expenditure cuts ratherthan on tax increases.
29. As a result of the budget consolidation measures, government debt in Sweden turned out to be 53%of GDP in 2000 instead of increasing to 128% of GDP, as was projected by the OECD in 1994(OECD Economic Outlook).
References
Ahearne, Alan, et al. (2009), “Cyclical Dimensions of Labour Mobility after EU Enlargement”, BruegelWorking Paper, No. 2009/2.
Ahearne, Alan and H. Shinada (2005), “Zombie Firms and Economic Stagnation in Japan”, Hi-StatDiscussion Paper Series 95.
Åslund, Anders (2007), Russia’s Capitalist Revolution: Why Market Reform Succeeded and Democracy Failed,Peterson Institute for International Economics, Washington DC.
Baksay, Gergely and Gábor P. Kiss (2009), “Act One, Act First – The Law on Fiscal Responsibility”, MagyarNemzeti Bank Bulletin, May, pp. 15-23.
Blanchard, Oliver and Roberto Perotti (2002), “An Empirical Characterization of the Dynamic Effects ofChanges in Government Spending on Taxes and Output”, The Quarterly Journal of Economics,Vol. 117, pp. 1329-1368.
Caballero, R., T. Hoshi and A. Kashyap (2006), “Zombie Lending and Depressed Restructuring in Japan”,NBER Working Paper, No. 12129.
Canova, Fabio (1998), “Detrending and Business Cycle Facts”, Journal of Monetary Economics 41, pp. 475-512.
Collins, Susan M. (2006), “Commentary: Patterns of International Capital Flows and Their Implicationsfor Economic Development by Prasad, Rajan, and Subramanian”, proceedings, Federal ReserveBank of Kansas City, pp. 159-167.
Darvas, Zsolt (2009), “The Baltic Challenge and Euro Area Entry”, Bruegel Policy Contribution, 2009/13.
Darvas, Zsolt and György Szapáry (2008), “Euro Area Enlargement and Euro Adoption Strategies”,European Economy – Economic Papers 304, Directorate-General for Economic and Financial Affairs,European Commission, Brussels; also published as a chapter in Marco Buti et al. (eds.) (2010), TheEuro: The First Decade, Cambridge University Press.
Darvas, Zsolt and Reinhilde Veugelers (2009), “Beyond the Crisis: Prospects for Transition Economies”,mimeo, Bruegel.
Darvas, Zsolt, Andrew K. Rose and György Szapáry (2007), “Fiscal Divergence and Business CycleSynchronization: Irresponsibility is Idiosyncratic”, in Jeffrey A. Frankel and Christopher A.Pissarides (eds.), NBER International Seminar on Macroeconomics 2005, MIT Press, Cambridge, MA,United States, pp. 261-298.
Égert, Balázs and Dubravko Mihaljek (2007), “Determinants of House Prices in Central and EasternEurope”, Bank of International Settlements Working Paper, No. 236.
European Commission (2009), “Public Finances in EMU”, European Economy, 5/2009 (provisional version),Directorate-General Economic and Financial Affairs of the European Commission.
Fabrizio, Stefania and Ashoka Mody (2008), “Breaking the Impediments to Budgetary Reforms: Evidencefrom Europe”, IMF Working Paper, No. 08/82, International Monetary Fund, Washington DC.
Giudice, Gabriele and Alessandro Turrini (2007), “Non-Keynesian Fiscal Adjustments? A Close Look atExpansionary Fiscal Consolidations in the EU”, Open Economies Review 18(5), pp. 613-630.
OECD JOURNAL ON BUDGETING – VOLUME 2010/1 © OECD 2010 29

THE IMPACT OF THE CRISIS ON BUDGET POLICY IN CENTRAL AND EASTERN EUROPE
Goldfajn, Ilan and Eduardo Refinetti Guardia (2004), “Fiscal Rules and Debt Sustainability in Brazil”, inGeorge Kopits (ed.), Rules-Based Fiscal Policy in Emerging Markets: Background, Analysis and Prospects,Macmillan Publishers Limited, pp. 114-130.
Henriksson, Jens (2007), “Ten Lessons About Budget Consolidation”, Bruegel Essay and Lecture Series.
Ilzetzki, Ethan and Carlos A. Vegh (2008), “Procyclical Fiscal Policy in Developing Countries: Truth orFiction?”, NBER Working Paper, No. 14191.
IMF (International Monetary Fund) (2000), “Russian Federation: Staff Report for the 2000 Article IVConsultation”, International Monetary Fund, Washington DC.
IMF (2001), “Russian Federation: Staff Report for the 2001 Article IV Consultation”, InternationalMonetary Fund, Washington DC.
IMF (2009), “Fiscal Implications of the Global Economic and Financial Crisis”, IMF Staff Position Note,June, International Monetary Fund, Washington DC.
Kaminsky, Graciela, Carmen Reinhart and Carlos A. Vegh (2004), “When it Rains it Pours: ProcyclicalCapital Flows and Macroeconomic Policies”, in Mark Gertler and Kenneth Rogoff (eds.), NBERMacroeconomics Annual, MIT Press, Cambridge, MA, United States.
Kiss, Gábor P. and Róbert Szemere (2009), “Apples and Oranges? A Comparison of the PublicExpenditure of the Visegrád Countries”, Magyar Nemzeti Bank Bulletin, May, pp. 35-47.
Kopits, George (2004), “Overview of Fiscal Policy Rules in Emerging Markets”, in George Kopits (ed.),Rules-Based Fiscal Policy in Emerging Markets: Background, Analysis and Prospects, Macmillan PublishersLimited, pp. 1-11.
Kopits, George (2008), “The Political Economy of Fiscal Reform in Central and Eastern Europe”, OECDJournal on Budgeting 8(3), pp. 127-137.
OECD (2007), “Fiscal Consolidation: Lessons from Past Experience”, in OECD Economic Outlook,Volume 2007 Issue 1, doi: http://dx.doi.org/10.1787/eco_outlook-v2007-1-40-en.
OECD (2009), OECD Economic Surveys: Russian Federation 2009, OECD Publishing, Paris, doi: http://dx.doi.org/10.1787/eco_surveys-rus-2009-en.
Prasad, Eswar, Raghuram G. Rajan and Arvind Subramanian (2006), “Patterns of International CapitalFlows and their Implications for Economic Development”, proceedings, Federal Reserve Bank ofKansas City, Kansas, United States, pp. 119-158.
Rzońca, Andrzej and Piotr Ciżkowicz (2005), “Non-Keynesian Effects of Fiscal Contraction in NewMember States”, ECB Working Paper, No. 519.
Saha, David and Jakob von Weizsäcker (2009), “EU Stimulus Packages”, Bruegel Policy Contribution 2009/2.
Sturzenegger, Federico and Jeromin Zettelmeyer (2006), Debt Defaults and Lessons from a Decade of Crises,MIT Press, Cambridge, MA, United States.
World Bank (2009a), “Russian Economic Report No. 19”, June, The World Bank, Washington DC.
World Bank (2009b), Governance Matters 2008, The World Bank, Washington DC.
OECD JOURNAL ON BUDGETING – VOLUME 2010/1 © OECD 201030

THE IMPACT OF THE CRISIS ON BUDGET POLICY IN CENTRAL AND EASTERN EUROPE
ANNEX A
Budget policy measures in CESEE countries
OECD JOURNAL ON BUDGETING – VOLUME 2010/1 © OECD 2010 31

TH
E IMPA
CT
OF T
HE C
RISIS O
N B
UD
GET
POLIC
Y IN
CEN
TR
AL A
ND
EAST
ERN
EUR
OPE
32
CountryStimulus packages and/or support for the most vulnerable
Spending reductions Augmentation of revenue Support for the financial sector Notes
ntees for retail bank deposits vings of individuals were sed to EUR 20 000, almost ing the previous coverage try of Finance).
IMF programme expired in January 2009, but the government has not asked for a successor programme (Economist Intelligence Unit [EIU]). The IMF is advising spending reductions (SETimes.com). Fiscal rules: 1) organic budget law stipulates that public debt, including guarantees, should not exceed 60% of GDP; and 2) the amount of budget deficit should not exceed the amount of capital expenditures. The second rule applies to central and local government. The increase in wages and pensions was made possible by the contingency fund planned for the 2009 budget (Ministry of Finance).
Emergency loans from foreign governments (Russian Federation) and international financial institutions (IFIs) (IMF standby agreement) (RGE Monitor, EIU). Pension reform to alleviate the burden on the system (www.armenianow.com). The IMF approved a USD 540 m loan (5% GDP) to Armenia in March 2009 under the Fund’s fast-track Emergency Financing Mechanism procedures, and the country let its currency fall by 21% against the dollar. This emergency funding came shortly after Armenia received poverty reduction funds (RGE Monitor). The amount was increased to USD 823 m (almost 8% GDP) in June 2009 (IMF).
The effect of lower oil prices could force transfers from the State Oil Fund (EIU).
IMF standby agreement (USD 3.52 bn, or about 7% of Belarus’ GDP) initially approved in January 2009 and increased in June. The revised arrangement will support the government’s economic programme and help Belarus contain the effects of a greater than expected impact from the global financial crisis. To reduce the resulting financing gap, the authorities will maintain a balanced budget in 2009, despite lower revenues; will keep monetary policy adequately tight; will allow more exchange rate flexibility within a fluctuation band which is now ±10% around the parity rate; and will deepen structural reforms (IMF). Belarus widened its currency bank in June 2008 (RGE Monitor).
OEC
D JO
UR
NA
L ON
BU
DG
ETIN
G – V
OLU
ME 2010/1 ©
OEC
D 2010
Albania Increase in public sector wages and pensions (Source: SETimes.com) totalling 0.7% of GDP.
2009 budget review aiming at revising/reducing overall expenditures to be finally approved during September 2009 in Parliament; Council of Ministers draft decision to prohibit tendering of investment projects after 31 July 2009; order by the Minister of Finance to prohibit extensions/reallocations after 20 July 2009; cuts in social contribution rate by 5% (Ministry of Finance).
Council of Ministers approved a law to increase excise duties on tobacco, alcoholic drinks and coffee with an impact of around 0.2% of GDP (Ministry of Finance).
Guaraand saincreadoubl(Minis
Armenia The IMF-supported programme includes an increase in social spending of about 0.3% of GDP (IMF), such as increased social payments, or subsidies for newborn children (www.armenianow.com, EIU). Credits to help SMEs (www.armenianow.com).
Postponing the disbursement of some funds for non-essential projects (EIU); practice of drawing up three-year expenditure plans ended (EIU).
The Parliament rescinded its December 2008 decision to raise excise taxes on imported alcohol and tobacco to avoid reducing imports and then tax revenues. Tax reforms (tax administration, evasion) launched in mid-2008. Reduce tax evasion through compulsory cash registers and incentives to prompt customers to ask for receipts (EIU).
Azerbaijan Increase spending on social welfare (EIU).
Belarus The government will limit reduction of social spending and income distribution. Healthcare spending, social subsidies and public sector wages are increasing (EIU). Housing assistance for families with three or more children, non-cash housing subsidies for low-income families, and unemployment assistance will be increased (IMF). Reduce burden on businesses: cuts in turnover tax and introduction of a flat rate of income tax (EIU).
Wages can be frozen; less extensive subsidies; substantial expenditure cuts are to be made: construction, maintenance costs and transport services (EIU).
Import duties and tariffs have been increased (EIU).
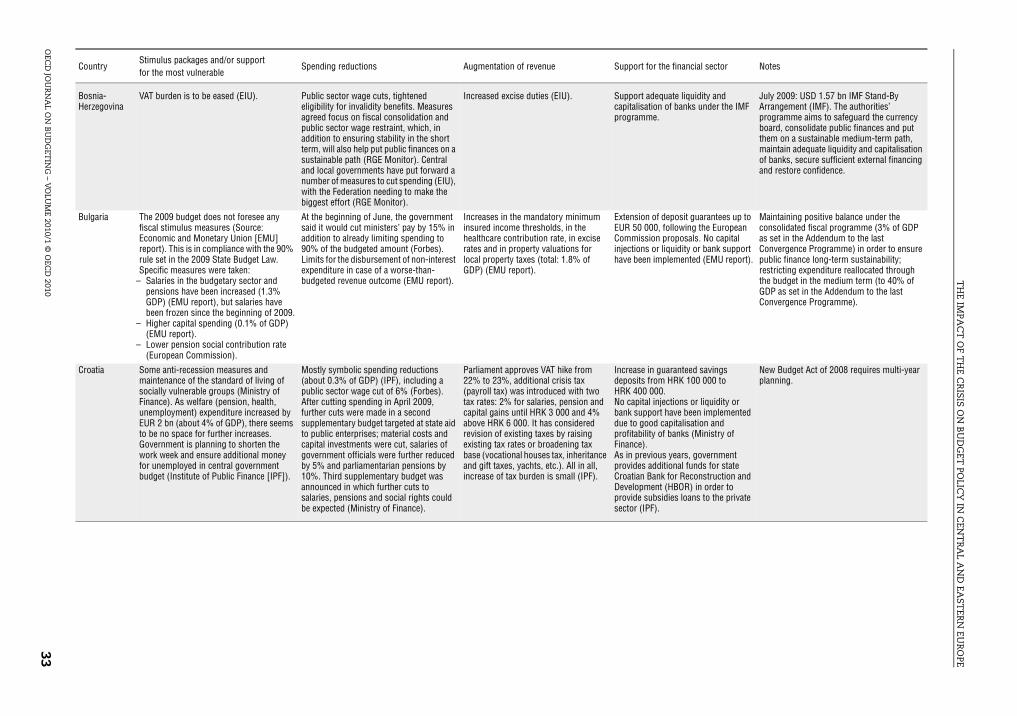
TH
E IMPA
CT
OF T
HE C
RISIS O
N B
UD
GET
POLIC
Y IN
CEN
TR
AL A
ND
EAST
ERN
EUR
OPE
OEC
D JO
rt adequate liquidity and lisation of banks under the IMF mme.
July 2009: USD 1.57 bn IMF Stand-By Arrangement (IMF). The authorities’ programme aims to safeguard the currency board, consolidate public finances and put them on a sustainable medium-term path, maintain adequate liquidity and capitalisation of banks, secure sufficient external financing and restore confidence.
ion of deposit guarantees up to 0 000, following the European ission proposals. No capital
ons or liquidity or bank support een implemented (EMU report).
Maintaining positive balance under the consolidated fiscal programme (3% of GDP as set in the Addendum to the last Convergence Programme) in order to ensure public finance long-term sustainability; restricting expenditure reallocated through the budget in the medium term (to 40% of GDP as set in the Addendum to the last Convergence Programme).
se in guaranteed savings its from HRK 100 000 to 00 000.
pital injections or liquidity or upport have been implemented good capitalisation and bility of banks (Ministry of e).
previous years, government es additional funds for state an Bank for Reconstruction and pment (HBOR) in order to e subsidies loans to the private (IPF).
New Budget Act of 2008 requires multi-year planning.
CountryStimulus packages and/or support for the most vulnerable
Spending reductions Augmentation of revenue Support for the financial sector Notes
UR
NA
L ON
BU
DG
ETIN
G – V
OLU
ME 2010/1 ©
OEC
D 2010
33
Bosnia-Herzegovina
VAT burden is to be eased (EIU). Public sector wage cuts, tightened eligibility for invalidity benefits. Measures agreed focus on fiscal consolidation and public sector wage restraint, which, in addition to ensuring stability in the short term, will also help put public finances on a sustainable path (RGE Monitor). Central and local governments have put forward a number of measures to cut spending (EIU), with the Federation needing to make the biggest effort (RGE Monitor).
Increased excise duties (EIU). Suppocapitaprogra
Bulgaria The 2009 budget does not foresee any fiscal stimulus measures (Source: Economic and Monetary Union [EMU] report). This is in compliance with the 90% rule set in the 2009 State Budget Law. Specific measures were taken:
– Salaries in the budgetary sector and pensions have been increased (1.3% GDP) (EMU report), but salaries have been frozen since the beginning of 2009.
– Higher capital spending (0.1% of GDP) (EMU report).
– Lower pension social contribution rate (European Commission).
At the beginning of June, the government said it would cut ministers’ pay by 15% in addition to already limiting spending to 90% of the budgeted amount (Forbes). Limits for the disbursement of non-interest expenditure in case of a worse-than-budgeted revenue outcome (EMU report).
Increases in the mandatory minimum insured income thresholds, in the healthcare contribution rate, in excise rates and in property valuations for local property taxes (total: 1.8% of GDP) (EMU report).
ExtensEUR 5Comminjectihave b
Croatia Some anti-recession measures and maintenance of the standard of living of socially vulnerable groups (Ministry of Finance). As welfare (pension, health, unemployment) expenditure increased by EUR 2 bn (about 4% of GDP), there seems to be no space for further increases. Government is planning to shorten the work week and ensure additional money for unemployed in central government budget (Institute of Public Finance [IPF]).
Mostly symbolic spending reductions (about 0.3% of GDP) (IPF), including a public sector wage cut of 6% (Forbes). After cutting spending in April 2009, further cuts were made in a second supplementary budget targeted at state aid to public enterprises; material costs and capital investments were cut, salaries of government officials were further reduced by 5% and parliamentarian pensions by 10%. Third supplementary budget was announced in which further cuts to salaries, pensions and social rights could be expected (Ministry of Finance).
Parliament approves VAT hike from 22% to 23%, additional crisis tax (payroll tax) was introduced with two tax rates: 2% for salaries, pension and capital gains until HRK 3 000 and 4% above HRK 6 000. It has considered revision of existing taxes by raising existing tax rates or broadening tax base (vocational houses tax, inheritance and gift taxes, yachts, etc.). All in all, increase of tax burden is small (IPF).
IncreadeposHRK 4No cabank sdue toprofitaFinancAs in providCroatiDeveloprovidsector

TH
E IMPA
CT
OF T
HE C
RISIS O
N B
UD
GET
POLIC
Y IN
CEN
TR
AL A
ND
EAST
ERN
EUR
OPE
34
ion of deposit guarantees up to 00 000, following the European ission proposals. No capital
ons or liquidity or bank support een implemented (EMU report).
Public expenditure is expected to increase only slightly, as higher social transfers are offset by savings in interest payments (EMU report).
ion of deposit guarantees up to 0 000, following the European ission proposals.
pital injections or liquidity or upport have been implemented
report).
CountryStimulus packages and/or support for the most vulnerable
Spending reductions Augmentation of revenue Support for the financial sector Notes
OEC
D JO
UR
NA
L ON
BU
DG
ETIN
G – V
OLU
ME 2010/1 ©
OEC
D 2010
Cyprus Stimulus measures: 1) infrastructure projects (0.4% of GDP) speeding up the implementation of infrastructure and other projects; 2) tourism (0.32% of GDP) – increase the budget for Cyprus Tourism Organisation, reduction of VAT rate applied to hotel accommodation from 8% to 5%, reduction of landing fees levied on airlines; 3) social cohesion (1.1% of GDP) introduction of a scheme for the provision of loans to low-income families for the acquisition of their primary residence, and promoting local tourism through grants for low-income families (Ministry of Finance).
Increase in excise duty on petrol (with compensating measures to offset it) (EMU report).
ExtensEUR 1Comminjectihave b
Czech Republic
Several stimulus packages, including higher public sector wages, infrastructure projects (0.4% of GDP), bank recapitalisation, and lower social security (SS) contributions (Ministry of Finance). Reduced SS contributions and write-down of capital goods will reduce revenue by 0.7% of GDP, while indexation of pensions will increase spending by 0.2% of GDP (EMU report). Additional spending equal to about 1.9% of GDP financed partly from the government’s reserve fund (budgeted but unused funds from previous years) (EIU). More welfare provisions for the unemployed, better protection for employees in bankrupt firms, and higher tax deductions for children (EIU). All these measures would expire at the end of 2010 (EIU). Impact on General Government Sector: 1.95% of GDP; Fiscal stimulus: 4.7% of GDP (Czech Ministry of Finance). Act on Support for Economic Growth and Social Stability, an amendment to the Act on Social Security Insurance and an amendment to the Income Tax Act, has been approved, the final decision will be made by the government formed on the basis of the early elections in autumn 2009.
Proposed public sector wage freeze and budget cuts for all ministries in 2009 (ordinary expenditures), up to 0.6% of GDP (Ministry of Finance, European Commission) and 2010 (EIU). Pensions will be increased by the minimum allowed by law (inflation) (EIU).
ExtensEUR 5CommNo cabank s(EMU
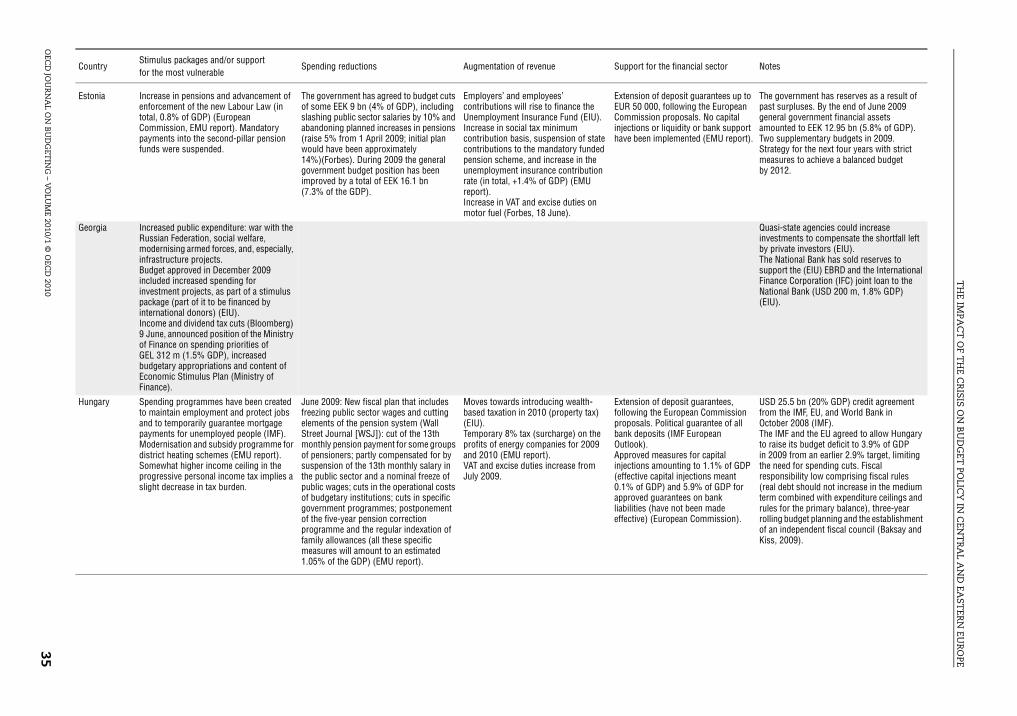
TH
E IMPA
CT
OF T
HE C
RISIS O
N B
UD
GET
POLIC
Y IN
CEN
TR
AL A
ND
EAST
ERN
EUR
OPE
OEC
D JO
ion of deposit guarantees up to 0 000, following the European ission proposals. No capital
ons or liquidity or bank support een implemented (EMU report).
The government has reserves as a result of past surpluses. By the end of June 2009 general government financial assets amounted to EEK 12.95 bn (5.8% of GDP). Two supplementary budgets in 2009. Strategy for the next four years with strict measures to achieve a balanced budget by 2012.
Quasi-state agencies could increase investments to compensate the shortfall left by private investors (EIU). The National Bank has sold reserves to support the (EIU) EBRD and the International Finance Corporation (IFC) joint loan to the National Bank (USD 200 m, 1.8% GDP) (EIU).
ion of deposit guarantees, ing the European Commission sals. Political guarantee of all eposits (IMF European k). ved measures for capital ons amounting to 1.1% of GDP tive capital injections meant of GDP) and 5.9% of GDP for ved guarantees on bank ies (have not been made ve) (European Commission).
USD 25.5 bn (20% GDP) credit agreement from the IMF, EU, and World Bank in October 2008 (IMF). The IMF and the EU agreed to allow Hungary to raise its budget deficit to 3.9% of GDP in 2009 from an earlier 2.9% target, limiting the need for spending cuts. Fiscal responsibility low comprising fiscal rules (real debt should not increase in the medium term combined with expenditure ceilings and rules for the primary balance), three-year rolling budget planning and the establishment of an independent fiscal council (Baksay and Kiss, 2009).
CountryStimulus packages and/or support for the most vulnerable
Spending reductions Augmentation of revenue Support for the financial sector Notes
UR
NA
L ON
BU
DG
ETIN
G – V
OLU
ME 2010/1 ©
OEC
D 2010
35
Estonia Increase in pensions and advancement of enforcement of the new Labour Law (in total, 0.8% of GDP) (European Commission, EMU report). Mandatory payments into the second-pillar pension funds were suspended.
The government has agreed to budget cuts of some EEK 9 bn (4% of GDP), including slashing public sector salaries by 10% and abandoning planned increases in pensions (raise 5% from 1 April 2009; initial plan would have been approximately 14%)(Forbes). During 2009 the general government budget position has been improved by a total of EEK 16.1 bn (7.3% of the GDP).
Employers’ and employees’ contributions will rise to finance the Unemployment Insurance Fund (EIU). Increase in social tax minimum contribution basis, suspension of state contributions to the mandatory funded pension scheme, and increase in the unemployment insurance contribution rate (in total, +1.4% of GDP) (EMU report). Increase in VAT and excise duties on motor fuel (Forbes, 18 June).
ExtensEUR 5Comminjectihave b
Georgia Increased public expenditure: war with the Russian Federation, social welfare, modernising armed forces, and, especially, infrastructure projects. Budget approved in December 2009 included increased spending for investment projects, as part of a stimulus package (part of it to be financed by international donors) (EIU). Income and dividend tax cuts (Bloomberg) 9 June, announced position of the Ministry of Finance on spending priorities of GEL 312 m (1.5% GDP), increased budgetary appropriations and content of Economic Stimulus Plan (Ministry of Finance).
Hungary Spending programmes have been created to maintain employment and protect jobs and to temporarily guarantee mortgage payments for unemployed people (IMF). Modernisation and subsidy programme for district heating schemes (EMU report). Somewhat higher income ceiling in the progressive personal income tax implies a slight decrease in tax burden.
June 2009: New fiscal plan that includes freezing public sector wages and cutting elements of the pension system (Wall Street Journal [WSJ]): cut of the 13th monthly pension payment for some groups of pensioners; partly compensated for by suspension of the 13th monthly salary in the public sector and a nominal freeze of public wages; cuts in the operational costs of budgetary institutions; cuts in specific government programmes; postponement of the five-year pension correction programme and the regular indexation of family allowances (all these specific measures will amount to an estimated 1.05% of the GDP) (EMU report).
Moves towards introducing wealth-based taxation in 2010 (property tax) (EIU). Temporary 8% tax (surcharge) on the profits of energy companies for 2009 and 2010 (EMU report). VAT and excise duties increase from July 2009.
Extensfollowpropobank dOutlooApproinjecti(effec0.1% approliabiliteffecti

TH
E IMPA
CT
OF T
HE C
RISIS O
N B
UD
GET
POLIC
Y IN
CEN
TR
AL A
ND
EAST
ERN
EUR
OPE
36
ber 2008: Measures designed e the JSC Parex Bank: a state ntee covering certain existing ew loans, a one-year state it to support the bank’s diate liquidity needs, and dinated loans to strengthen its l base. May 2009: The Latvian nment will acquire newly issued ry shares and subordinated ebt (www.news.cn,
eumonitor.net). of GDP would be available for l injections and 10.9% of GDP nk liability guarantees (2.8% of as been effectively used for ng guarantees). 6.1% of GDP en used for effective liquidity
entions. Deposit guarantee up to 0 000 (EMU report).
EUR 7.5 bn (36% GDP) loan from the EU, IMF; World Bank, some individual EU countries and EBRD approved in December 2008/January 2009.
there has been no need for l injections or liquidity or bank rt. However, for the purpose of rting or bailing out financial tions, the following steps have aken: deposit insurance amount has ncreased from EUR 22 000 to 00 000, equivalent to the nt in litas by paying out 100 % of sured deposit. draft Law on Financial Sector
inability has been prepared, the se of which is to enable the nment, when necessary, to take res such as state guarantees; ption of bank assets; state ement in bank capital; taking hares for public needs. They be applied to banks whose ial situation could disturb the th functioning of the banking
. guarantee limit of LTL 3 bn for received by the banks or ial liabilities assumed ise, in order to strengthen
ial stability and credibility of the g system in Lithuania.
Speed up absorption of EU funds, simplifying companies’ procedures (Ministry of Economy). Consultations with IMF and World Bank on structural reforms (healthcare, education, social security system, pensions and public sector). End of July 2009: Lithuania’s new president has admitted that her country could be forced to seek help from the International Monetary Fund if it fails in efforts to raise more money from foreign capital markets to prop up its teetering economy.
CountryStimulus packages and/or support for the most vulnerable
Spending reductions Augmentation of revenue Support for the financial sector Notes
OEC
D JO
UR
NA
L ON
BU
DG
ETIN
G – V
OLU
ME 2010/1 ©
OEC
D 2010
Latvia Social spending to increase by 1.5% of GDP between 2008 and 2009, moving closer to EU/OECD averages (IMF). Increase in the minimum wage and increase in social payments (EMU report).
Significant budget cuts, in line with the conditions offset by the international lending programme. New budgetary cuts in June to come into force on 1 July: public sector wage bill to fall by 20% – for the second time in 2009 –, pensions by 10%, and also parental benefits will be reduced. The whole budget will decrease by 10% (Source: Les Echos, 18 June 2009, Latvian Ministry of Finance). Administrative expenditures will be reduced, and boards are liquidated in state-owned capital companies (Ministry of Finance). The expenditure cuts approved in June mean 4% of GDP (Financial Times [FT]).
Increases in VAT and excise duties (2.66% of GDP; EMU report), and reduction in income tax-exempt earning level (EIU, Ministry of Finance). Dividends from state-controlled corporations will be increased (Ministry of Finance).
Novemto savguaraand ndeposimmesuborcapitagoverordinaterm dwww.1.4% capitafor baGDP hgrantihas beintervEUR 5
Lithuania In February 2009, the government adopted the Economic Recovery Plan, amounting to approximately 5 % of GDP with the aim of improving conditions for doing business, facilitating business access to borrowing and maintaining jobs. This economic recovery plan foresees accelerated use of EU financial assistance, easing of borrowing for the private sector through introduction of financial engineering and on-lending to organisations to implement public investment projects. The plan was framed with the support of loans from the European Investment Bank (Ministry of Finance). Some incentives for enterprises have also been approved (tax credits, tax exemption for firms investing in technology modernisation, and shift of public investment programmes from long-term to short-term projects), as well as measures to facilitate access to liquidity, to promote exports and investments and to improve energy performance in buildings (Ministry of Economy). The personal income tax rate was cut (EMU report).
The initial 2009 state budget, through a comprehensive tax reform and expenditure reductions, was amended leading to savings of 4% of GDP. The 2009 budget was further reviewed in May 2009 with an additional consolidating result of 3.3% of GDP, and in July (second revision of the state budget) with consolidation of 0.3% of GDP. Package of saving measures in social security funds are under consideration within government and will be presented in autumn 2009 (Ministry of Finance). The expenditure cuts included reducing public sector wages, investment and other current expenditure (European Commission). Reductions in contributions to pension funds, and in transfers to local governments (European Commission, EMU report).
The government formed in December 2008 adopted a substantial fiscal consolidation package that included both wide-ranging tax changes and major expenditure restraints. On the revenue side, the main measures included increases in VAT and excise duties (but a cut in personal income tax); increased corporate income tax and tax on dividends; most tax exemptions removed, broadening the tax base (European Commission), inclusion of some professions in the social security system (European Commission).
So farcapitasupposuppoinstitubeen t1) Thebeen iEUR 1amouthe in2) TheSustapurpogovermeasuredeminvolvbank swouldfinancsmoosystem3) Theloans financotherwfinancbankin

TH
E IMPA
CT
OF T
HE C
RISIS O
N B
UD
GET
POLIC
Y IN
CEN
TR
AL A
ND
EAST
ERN
EUR
OPE
OEC
D JO
CountryStimulus packages and/or support for the most vulnerable
Spending reductions Augmentation of revenue Support for the financial sector Notes
UR
NA
L ON
BU
DG
ETIN
G – V
OLU
ME 2010/1 ©
OEC
D 2010
37
Macedonia, FYR
Three sets of measures: initial plan in November 2008 offering around EUR 300 m (4.6% GDP) in assistance, to companies with liquidity problems as well as to companies with good financial performance. The most important measure was the change to tax on profits. Starting from 1 January 2009, profit is taxed only if distributed to capital owners; second package adopted in March 2009, adopted an ambitious seven-year programme, worth EUR 8 bn (122% of estimated 2009 GDP, 17.5% a year if evenly distributed) for infrastructure projects, although much of that programme will now need to be postponed. Third set of measures adopted in April 2009, divided into three components: a revised budget; credit support to companies, including subsidised interest rates, co-financing and credit guarantees, and other measures to support companies, including measures to facilitate exports and imports, reduce costs, etc. Social security contribution reforms, which include cuts in social contributions paid by employers (EIU) as well as introduction of the gross wage system. However, this measure was not part of the anti-crisis packages but regular structural reform (Ministry of Finance).
The revised budget (April) cut expenditure by 7% to match expected reduced revenue: reduction in current expenditure, postponement of planned increase of public administration wages, recruitment freeze in the administration until end 2009 (EIU) and reduction in expenditures with high imports component (mainly capital expenditures).

TH
E IMPA
CT
OF T
HE C
RISIS O
N B
UD
GET
POLIC
Y IN
CEN
TR
AL A
ND
EAST
ERN
EUR
OPE
38
ly measure so far undertaken to rt the banks is an extension of s deposit guarantee scheme to deposits up to EUR 100 000
ial system is not as badly hit se little western integration. hree commercial banks are d by foreign capital. The Central of Moldova has increased ty to support the credit flow to sses by commercial banks as
s reduced basic refinancing rate 21% in September 2008 to in July 2009) and mandatory es of commercial banks (from o 16%) (Ministry of Finance, l Bank).
The IMF’s three-year poverty reduction and growth facility expired in May 2009 but it seems unlikely that any further lending will be approved until a new government has been formed (EIU).
CountryStimulus packages and/or support for the most vulnerable
Spending reductions Augmentation of revenue Support for the financial sector Notes
OEC
D JO
UR
NA
L ON
BU
DG
ETIN
G – V
OLU
ME 2010/1 ©
OEC
D 2010
Malta No formal fiscal stimulus package, but targeted support, within the framework of EU regulations, to assist a number of domestic firms suffering from the slump in international trade, amounting to just EUR 3.7 m (0.06% GDP). The tourism industry, which is being hit especially hard by the economic slump, has also received some modest support, with the government having announced a capital repayment moratorium for up to one year on bank loans to hotel owners and operators, albeit on a case-by-case basis (EIU). The measures are aimed at increasing public investment in infrastructure and the environment, supporting manufacturing, tourism and small and medium-sized enterprises (SMEs), and households’ purchasing power (European Commission, EMU report).
Sharp reduction in state subsidies on LPG products (EIU) and other subsidies (1.4% of GDP) (EMU report), although this measure is not directly related to fiscal stimuli, but had a separate policy objective related to the redirection of expenditure towards other initiatives (Ministry of Finance).
Increase in excise duty and environmental measures (0.4% of GDP) (EMU report), although this measure is not directly related to fiscal stimuli, but had a separate policy objective related to the redirection of expenditure towards other initiatives (Ministry of Finance).
The onsuppoMalta’cover (EIU).
Moldova Priority investment programmes will be maintained, and social security could be enhanced. Tax amnesty, zero tax on reinvested earnings applied even before 2009, reducing the interference of controlling bodies by reducing the number of inspections. Continued support for SMEs. Imports for investment purposes are exempted from VAT. Further liberalisation of the economy (Ministry of Finance, Central Bank).
Lack of an operating parliament in the first half of 2009 hindered decision making, but government implemented budget cuts under its responsibility and prepared proposals for the new parliament. The measures include: cuts of recurrent spending by 20%, including administration spending; postponement of any new wage bill increasing; reduction of vacant positions and a recruitment freeze; revision of legislation in terms of the abolition of bonuses and privileges in the public sector; reduction of enrolment in higher and secondary special educational institutions; closure or integration of ineffective educational institutions (Ministry of Finance).
Enhanced tax administration. FinancbecauOnly tbackeBank liquidibusinewell a(from11.5%reserv22% tCentra

TH
E IMPA
CT
OF T
HE C
RISIS O
N B
UD
GET
POLIC
Y IN
CEN
TR
AL A
ND
EAST
ERN
EUR
OPE
OEC
D JO
entral Bank of Montenegro will the commercial banks to use up
of compulsory reserves for rchase of treasury bills, sing liquidity (Ministry of e).
Plans for cuts in tax and social contribution rates, and for increases in capital and social expenditure will substantially increase the deficit in 2009 and beyond, implying a risk of rapidly rising public debt (IMF).
ion of deposit guarantees, ing the European Commission sals, up to EUR 50 000 (EMU ). pital injections, liquidity support rantee on bank liabilities have pproved (EMU report), though 009) indicates guarantees nd deposit guarantees).
Other measures included further reduction in administrative burdens for businesses and measures stimulating entrepreneurship and SME activities by improving the conditions for starting up new businesses. There were also steps taken to speed up the absorption of the EU funds, encourage public-private partnership (PPP) projects and simplify public procurement rules (MoF). IMF flexible credit line in the amount of SDR 13.69 bn as a precautionary instrument only.
ion of deposit guarantees up to 0 000, following the European ission proposals (EMU report).
EUR 20 bn loan from the EU, IMF (standby agreement), World Bank, EIB and EBRD approved in May 2009. Structural reforms in education and healthcare (EIU, May 2009). Ongoing process for fiscal responsibility law and unified public wages system.
CountryStimulus packages and/or support for the most vulnerable
Spending reductions Augmentation of revenue Support for the financial sector Notes
UR
NA
L ON
BU
DG
ETIN
G – V
OLU
ME 2010/1 ©
OEC
D 2010
39
Montenegro For 2009, approximately EUR 18 m (0.5% GDP) was budgeted for projects aimed at creating jobs (training programmes) and for stimulating entrepreneurship and self-employment. The government approved measures aimed at decreasing taxes, increasing net income, early redemption of internal debt, abolishment of certain fees, support to entrepreneurship, as well as readiness to provide long-term financial assistance to domestic banks through cooperation with international financial institutions (Ministry of Finance).
Decrease public administration spending (no new public jobs, reduction of current spending) (Ministry of Finance).
The Callow to 20%the puincreaFinanc
Poland Poland introduced a stimulus package in November 2008. Budget-related measures include personal income tax reduction, more favourable tax treatment of research and development (R&D) spending, increased depreciation allowance for SMEs and new businesses and shortened period for VAT refunds. Other measures include state financial support offered to unemployed for the repayment of their mortgages. (Ministry of Finance [MoF]) Abolition of the top 40% rate of personal income tax in January 2009 (EIU). The number of brackets have streamlined, leaving only two brackets, set at 18% and 32%. (MoF) Lower taxes on business (EMU report).
Various reductions in state budget expenditures amounting to some PLN 21 bn in 2009 – compared to the original amounts planned in the state budget for 2009. Measures include reduction in subsidies and replacement of early pensions with less costly “bridge pensions”, reduction in government intermediate consumption (MoF).
Increase in excise duties (0.2% of GDP) (EMU report).
ExtensfollowproporeportNo caor guabeen aIMF(2(beyo
Romania Investment programmes will be maintained and social security enhanced. Ambitious capital expenditure programmes for infrastructure, education and health. The IMF-supported programme provides room for additional spending of RON 250 m (amounting to 0.05% of GDP) in 2009 and RON 500 m (0.1% of GDP) in 2010 to improve social protection for the most vulnerable groups during the economic downturn (EIU, IMF). Increase public investment by 1% of GDP (EMU report).
The budget was modified in April 2009 to include considerable fiscal tightening in the three final quarters of the year. Expenditure cuts were concentrated on the public sector wage bill and public sector consumption (all ministries will have budgetary cuts except for social spending) (EIU). Reductions are estimated in –2.2% of GDP (EMU report).
Flat-rate income and profit tax and VAT tax were unchanged, but introduction of a controversial “lump sum” tax (regressive turnover tax) for companies (EIU). Increase of social contribution rate and excise duties. Update of the tax base for local property taxes (in total, 1% of GDP) (EMU report).
ExtensEUR 5Comm

TH
E IMPA
CT
OF T
HE C
RISIS O
N B
UD
GET
POLIC
Y IN
CEN
TR
AL A
ND
EAST
ERN
EUR
OPE
40
l injections to banks (EIU). an government capital has gone rily to larger, more systemically tant banks as the government o restart lending to consumers mpanies. Although Russia has 000 banks, 100 of them
nt for 90% of the transactions ys). serve requirement, which was just 0.5% in October 2008, was to 1.5% in June and is uled to rise to 2.5% in August. ompares with a reserve ement of 8% before the cuts d, so the situation is still far from l (EIU).
The Russian Central Bank and the Bank for Economic Development also will provide money for government anti-crisis measures (EIU). First budgetary deficit since 1999. The deficit will be financed by drawing on the reserve fund, which manages over USD 100 bn and is one of Russia’s two sovereign wealth funds (RGE Monitor), but Russia also plans to return to the international bond market in 2010 (EIU). Exchange rate defence: one-third of foreign exchange reserves were lost. After that the rouble depreciated by about 20%. All fiscal rules were cancelled – to be restored later. Pressure to launch budget reforms discussed but not implemented for about a decade.
Standby agreement with the IMF (January 2009). In May, the agreement was extended (until March 2011) and increased up to EUR 2.9 bn (10% of Serbia’s GDP). The government’s unilateral implementation of the interim trade agreement with the EU led to a decline in customs collections (EIU).
1 January 2009, foreign bank hes that accept deposits in the Republic under an EU single g licence are permitted to join
ovak deposit protection system. easure of the National Bank of ia on the liquidity of banks and
hes of foreign banks, in effect 5 November 2008, introduced
stringent requirements on ty management, especially by of a new liquidity indicator try of Finance). ion of deposit guarantees, ing the European Commission sals (unlimited for physical ns and some categories of legal ns) (IMF European Outlook). ancial support to the banking .
Stimulus plan measures approved in November 2008 included improved absorption of EU funds. Plan followed by two other stimulus packages.
CountryStimulus packages and/or support for the most vulnerable
Spending reductions Augmentation of revenue Support for the financial sector Notes
OEC
D JO
UR
NA
L ON
BU
DG
ETIN
G – V
OLU
ME 2010/1 ©
OEC
D 2010
Russian Federation
The federal expenditure target has been increased by 7% compared with the original level of the budget (EIU). RUB 1.6tn (4.1% of GDP) are earmarked for anti-crisis measures.
Expenditure cuts: general administration, various investment programmes – road building (EIU).
One-off injection from the investment income earned by stabilisation funds (January 2009) (EIU).
CapitaRussiprimaimportries tand coover 1accou(MoodThe recut toraisedschedThis crequirstartenorma
Serbia Increase in pensions in late 2008. A stimulus package includes a cheap lending facility to Serbian companies that do not lay off workers, and for lending to stimulate exports and to grant a new consumer credit line for the purchase of construction materials (EIU).
The fiscal deficit targets for 2009-10 have been raised, but additional fiscal adjustment measures – mainly falling on recurrent spending – are also being taken (IMF).
Tax increases have been rejected by the government (EIU).
Slovak Republic
0.5% of GDP for anti-crisis measures, counterbalanced by savings in other areas (EMU report). November 2008 plan was aimed primarily at accelerating public infrastructure investments (also because of difficulties in finding private financing), energy savings and energy security, reduced taxes for low-income employees, simpler business bureaucratic procedures, legal reinforcement of EIB instruments, strengthening employment services, and speeding up payments by the state to businesses (Ministry of Finance). Measures: temporary increase in tax-free income, changes in welfare measures, subsidy for the purchase of new cars. The government may also need to provide budget financing to the social insurer (EIU). February 2009: two other stimulus packages, primarily focusing on the labour market and on boosting demand (Ministry of Finance).
Cut expenditure by savings on state consumption, merging ministries and abolishing some regional state administration offices (EIU).
Increased excise duties on tobacco and changes in social contributions and capital transfers from the second pension pillar (total: 0.6% GDP) (EMU report).
From brancSlovakbankinthe SlThe mSlovakbrancfrom 1more liquidimeans(MinisExtensfollowpropopersopersoNo finsector

TH
E IMPA
CT
OF T
HE C
RISIS O
N B
UD
GET
POLIC
Y IN
CEN
TR
AL A
ND
EAST
ERN
EUR
OPE
OEC
D JO
overnment will make available 2 bn (30% GDP) in guarantees nk loans, as well as temporary ited guarantees for all retail bank its and savings.
Consultations on structural reforms (healthcare, pensions, social security system, labour market and public sector). Implementation, if agreement is reached, will not be immediate (Slovenia is among the group of countries that will have to increase their age-related public expenditure the most) (EIU).
rious problem in the banking .
Discussions on a possible standby loan agreement with the IMF, but no apparent progress. New fiscal rule in 2010.
CountryStimulus packages and/or support for the most vulnerable
Spending reductions Augmentation of revenue Support for the financial sector Notes
UR
NA
L ON
BU
DG
ETIN
G – V
OLU
ME 2010/1 ©
OEC
D 2010
41
Slovenia Recovery package adopted in December 2008: Offset some of the shortfall in economic activity by undertaking infrastructure projects and providing liquidity to companies (EIU). Three anti-crisis packages have been implemented. Among the measures: – Elimination of payroll tax, reduction of the corporate tax rate, and additional investment allowance for companies and sole proprietors (1% GDP) (EMU report). – Wage subsidy for shorter hours worked, support for SMEs and start-up companies, subsidies for investment in new technologies and R&D (EMU report). Total estimated: 0.9% of GDP. – Implementation of a decision to eliminate “wage disparities” in public sector. – Increases in specific transfers in kind (EMU report).
Measures to restrain the wage bill (EMU report).
Increase in excise duties (0.9% of GDP) (EMU report).
The gEUR 1for baunlimdepos
Turkey Since May 2008, various measures to boost employment and regional development through public investment, to increase credit to SMEs, increased budget transfers to local governments, VAT reductions, and increased subsidies (Ministry of Finance). Various tax cuts for individuals, businesses and consumers, and cuts in social security contributions. New stimulus measures have been announced in June 2009 with a strong regional dimension (classifying provinces into four regions and imposing different tax and subsidy incentives across regions). Incentives include corporate tax cuts, exemptions for companies paying social security premiums for new workers, interest rate subsidies, increased public sector hiring, regional investment incentives for 12 specific sectors, extension of vocational education (EIU, Ministry of Finance).
No sesystem

TH
E IMPA
CT
OF T
HE C
RISIS O
N B
UD
GET
POLIC
Y IN
CEN
TR
AL A
ND
EAST
ERN
EUR
OPE
42
recapitalisation programme: the ill receive full control over the
talised bank.
IMF standby agreement approved in November 2008 (USD 16.4 bn, or 9.1% of GDP) (IMF). The authorities agreed to the introduction of a floating exchange rate, to “help the economy adjust to external shocks, discouraging dollarisation and excessive risk-taking by unhedged borrowers, and allowing monetary policy to focus on inflation objectives”, tightening monetary policy to avoid excessive exchange rate depreciation, if needed (IMF).
ostly by Maite de Sola, whose contribution is greatly appreciated.donia, FYR, Malta, Moldova, Poland, Romania, Slovak Republic,
n European Countries, held on 25-26 June 2009 in St. Petersburg,n for Croatia, which is also greatly appreciated.
CountryStimulus packages and/or support for the most vulnerable
Spending reductions Augmentation of revenue Support for the financial sector Notes
OEC
D JO
UR
NA
L ON
BU
DG
ETIN
G – V
OLU
ME 2010/1 ©
OEC
D 2010
Ukraine The IMF-supported programme maintained the inflation indexing of social spending (0.8% of GDP) (Ministry of Finance). Measures include: 1) protection of the poor against gas price increases through the life-line tariff and housing and utility allowance; 2) protection of the unemployed through the unemployment insurance system; and 3) expansion of two well-targeted social safety programmes identified by the World Bank (IMF).
A sharp tightening of fiscal policy is expected in 2009, although the IMF has agreed to a deficit of 6% of GDP instead of the initially planned 4%, due to worse than expected output decline (IMF). Much of the fiscal tightening is likely to come through reining in expenditure on goods and services in non-priority areas (EIU).
Increased pension contributions by private entrepreneurs; higher electricity and gas tariffs for those that consume more (EIU).
Bank state wrecapi
Note: Empty cells in the table indicate either no measures or lack of information. The first version of this table was compiled mComments and additions from delegates from Albania, Bulgaria, Croatia, Cyprus, Czech Republic, Estonia, Lithuania, MaceSlovenia, Turkey, and Ukraine at the OECD’s 5th Meeting of Senior Budget Officials from Central, Eastern and South-EasterRussian Federation, are also highly appreciated. Anto Bajo from the Institute of Public Finance provided additional informatio