The impact of technology acceptance and openess to ...
148
Walden University ScholarWorks Walden Dissertations and Doctoral Studies Walden Dissertations and Doctoral Studies Collection 2016 e impact of technology acceptance and openess to innovaion on soſtware implementation Michael Marin Bertini Walden University Follow this and additional works at: hps://scholarworks.waldenu.edu/dissertations Part of the Accounting Commons , Databases and Information Systems Commons , and the Library and Information Science Commons is Dissertation is brought to you for free and open access by the Walden Dissertations and Doctoral Studies Collection at ScholarWorks. It has been accepted for inclusion in Walden Dissertations and Doctoral Studies by an authorized administrator of ScholarWorks. For more information, please contact [email protected].
Transcript of The impact of technology acceptance and openess to ...
Walden UniversityScholarWorks
Walden Dissertations and Doctoral Studies Walden Dissertations and Doctoral StudiesCollection
2016
The impact of technology acceptance and openessto innovaion on software implementationMichael Marin BertiniWalden University
Follow this and additional works at: https://scholarworks.waldenu.edu/dissertations
Part of the Accounting Commons, Databases and Information Systems Commons, and theLibrary and Information Science Commons
This Dissertation is brought to you for free and open access by the Walden Dissertations and Doctoral Studies Collection at ScholarWorks. It has beenaccepted for inclusion in Walden Dissertations and Doctoral Studies by an authorized administrator of ScholarWorks. For more information, pleasecontact [email protected].

Walden University
College of Management and Technology
This is to certify that the doctoral dissertation by
Michael Bertini
has been found to be complete and satisfactory in all respects,
and that any and all revisions required by
the review committee have been made.
Review Committee
Dr. Lee Lee, Committee Chairperson, Management Faculty
Dr. Godwin Igein, Committee Member, Management Faculty
Dr. Jeffrey Prinster, University Reviewer, Management Faculty
Chief Academic Officer
Eric Riedel, Ph.D.
Walden University
2016
Abstract
The Impact of Technology Acceptance and Openness to Innovation on Software
Implementation
by
Michael M. Bertini
Doctor of Business Administration, University of Phoenix, 2007
Master of Engineering Sciences, University of New South Wales, 2004
Bachelor of Engineering-Production, University of New South Wales, 1981
Dissertation Submitted in Partial Fulfillment
of the Requirements for the Degree of
Doctor of Philosophy
Information Systems Management
Walden University
August 2016

Abstract
Senior management decisions to foster innovation and adopt new technology solutions
have serious implications for the success of their organization change initiatives. This
project examined the issue of senior management decision or reasons of their decision to
adopt new Enterprise Resource Planning (ERP) systems as a solution to solve their
business problems. This project investigated the degree that perceived ease of use and
usefulness of the ERP system influenced decisions made by senior managers to innovate.
Roger’s diffusion of innovations theory and Davis technology acceptance model theory
were used to predict when senior managers were open to innovation, and whether senior
managers made decisions to adopt new technological innovations. Out of the 3,000
randomly selected senior managers of small to medium sized organizations in the United
States who were invited via emails to participate, 154 completed the online survey.
Binary logistic regression analysis on the collected data failed to produce statistically
significant support for the claim that perceived ease of use, perceived usefulness, and
openness to innovation should impact the senior manager’s decision to innovate. The
conclusions of this study suggest further research may include a qualitative design to gain
a deeper understanding of the underlying reasons, opinions and motivations on the
emotive aspects of the decision-making process in the adoption of ERP software
innovations. It also offers a positive social change to stakeholders who are potentially
affected by technology innovation and adoption by providing empirically validated
evidence for causes of senior management technology decisions.
The Impact of Technology Acceptance and Openness to Innovation on Software
Implementation
by
Michael M. Bertini
Doctor of Business Administration, University of Phoenix, 2007
Master of Engineering Sciences, University of New South Wales, 2004
Bachelor of Engineering-Production, University of New South Wales, 1981
Dissertation Submitted in Partial Fulfillment
of the Requirements for the Degree of
Doctor of Philosophy
Information Systems Management
Walden University
August, 2016
i
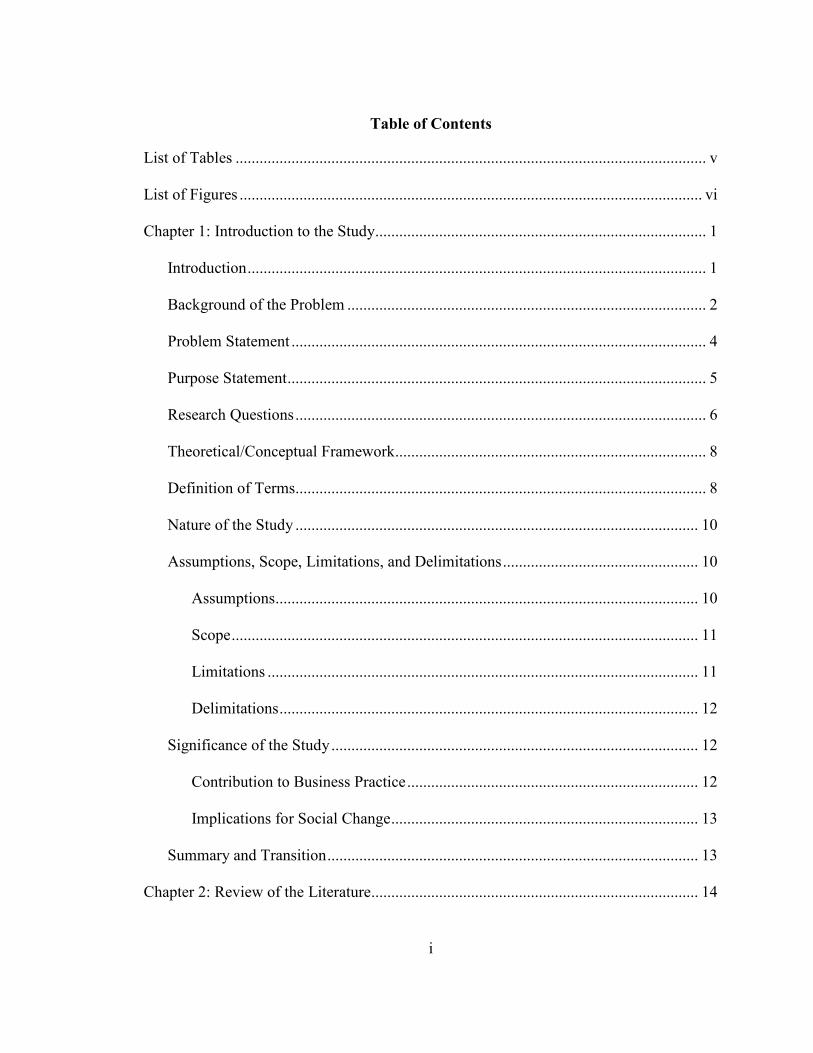
Table of Contents
List of Tables ...................................................................................................................... v
List of Figures .................................................................................................................... vi
Chapter 1: Introduction to the Study ................................................................................... 1
Introduction ................................................................................................................... 1
Background of the Problem .......................................................................................... 2
Problem Statement ........................................................................................................ 4
Purpose Statement ......................................................................................................... 5
Research Questions ....................................................................................................... 6
Theoretical/Conceptual Framework .............................................................................. 8
Definition of Terms....................................................................................................... 8
Nature of the Study ..................................................................................................... 10
Assumptions, Scope, Limitations, and Delimitations ................................................. 10
Assumptions .......................................................................................................... 10
Scope ..................................................................................................................... 11
Limitations ............................................................................................................ 11
Delimitations ......................................................................................................... 12
Significance of the Study ............................................................................................ 12
Contribution to Business Practice ......................................................................... 12
Implications for Social Change ............................................................................. 13
Summary and Transition ............................................................................................. 13
Chapter 2: Review of the Literature .................................................................................. 14
ii
Introduction ................................................................................................................. 14
Diffusion of Innovations Theory ................................................................................ 15
Definitions............................................................................................................. 16
Innovation Decision Process ............................................................................................. 19
Adopter Categories ..................................................................................................... 21
Organizational Innovativeness .................................................................................... 24
Factors that Promote Innovation in Management Accounting ................................... 26
Technology Acceptance Model (TAM) ...................................................................... 27
Technology Acceptance Model Theoretical Foundations .......................................... 27
Perceived Usefulness ............................................................................................ 29
Perceived Ease of Use ........................................................................................... 30
Integrated Theoretical Model ...................................................................................... 31
Adoption of Technology and Social Innovation ......................................................... 32
Additional Factors that Impact Decision to Innovate in SMBs .................................. 34
Type of Business ................................................................................................... 34
Impediments to Organizational Learning ................................................................... 38
Summary and Transition ............................................................................................. 39
Chapter 3: Methodology ................................................................................................... 41
Introduction ................................................................................................................. 41
Research Design.......................................................................................................... 41
Research Questions and Hypotheses .......................................................................... 42
Setting and Sample ..................................................................................................... 44

iii
Measures ..................................................................................................................... 45
Dependent Variable .............................................................................................. 45
Independent Variables .......................................................................................... 47
Statistical Controls ................................................................................................ 49
Data Collection and Data Analysis ............................................................................. 49
Ethical Protection of Participants................................................................................ 51
Summary and Transition ............................................................................................. 52
Chapter 4: Results ............................................................................................................. 53
Introduction ................................................................................................................. 53
Data Preparation.......................................................................................................... 53
Research Questions and Variables Used..................................................................... 56
Descriptive Statistics ................................................................................................... 62
Cronbach Alpha .......................................................................................................... 66
Regression Results ...................................................................................................... 67
Summary and Transition ............................................................................................. 74
Chapter 5: Discussion, Conclusions, and Recommendations ........................................... 75
Introduction ................................................................................................................. 75
Interpretation of Findings ........................................................................................... 78
Research Question 1 ............................................................................................. 78
Research Question 2 ............................................................................................. 80
Research Question 3 ............................................................................................. 81
Research Question 4 ............................................................................................. 82
iv
Possible Explanations for Statistically Non-significant Results ................................. 84
Statistical Issue...................................................................................................... 85
Methodological Issue ............................................................................................ 87
Theoretical Issue ................................................................................................... 90
Recommendations for Future Research ...................................................................... 93
Implications for Social Change ................................................................................... 95
Summary and Conclusion ........................................................................................... 97
References ....................................................................................................................... 103
Appendix A. Survey Content .......................................................................................... 118
Appendix B. Final Survey............................................................................................... 128
Appendix C. Survey Consent Form ................................................................................ 137
v
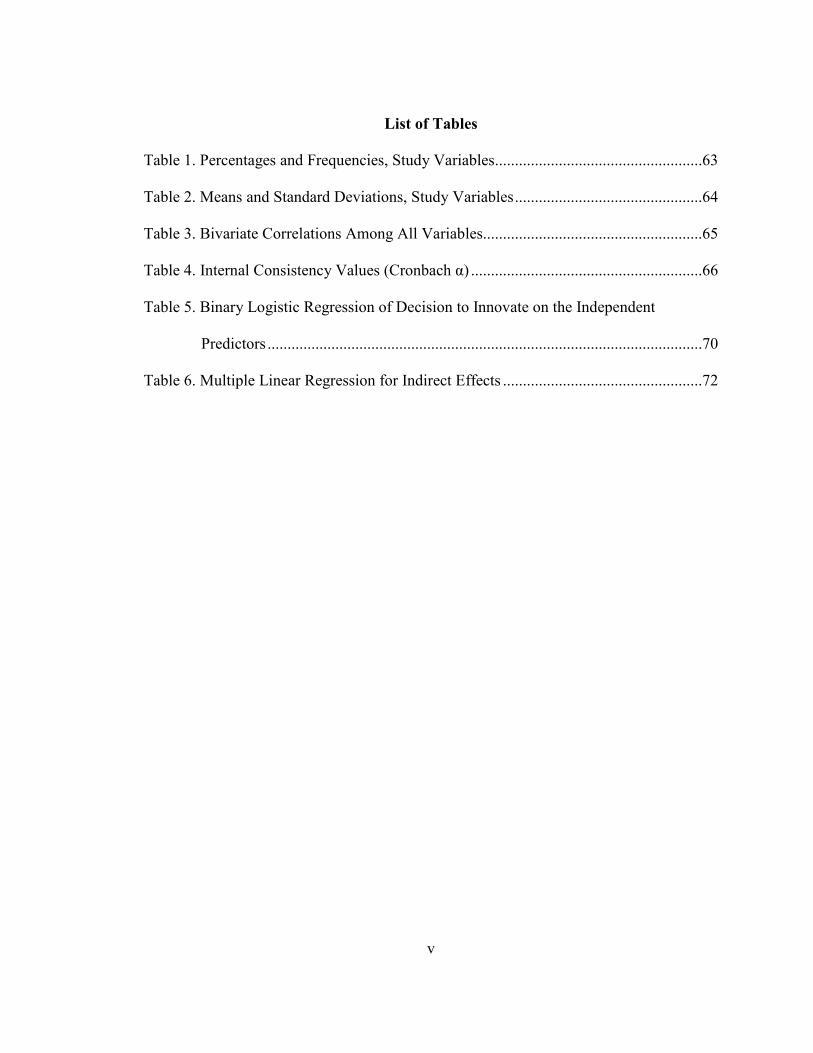
List of Tables
Table 1. Percentages and Frequencies, Study Variables ....................................................63
Table 2. Means and Standard Deviations, Study Variables ...............................................64
Table 3. Bivariate Correlations Among All Variables.......................................................65
Table 4. Internal Consistency Values (Cronbach α) ..........................................................66
Table 5. Binary Logistic Regression of Decision to Innovate on the Independent
Predictors .............................................................................................................70
Table 6. Multiple Linear Regression for Indirect Effects ..................................................72
vi
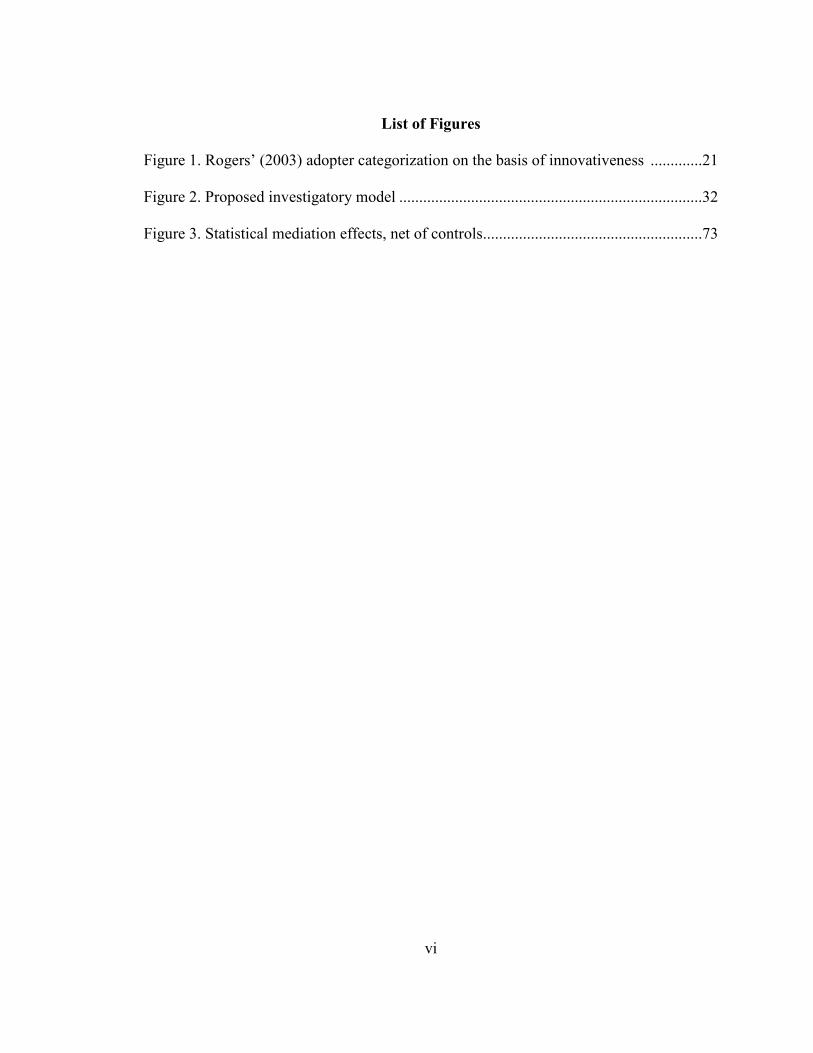
List of Figures
Figure 1. Rogers’ (2003) adopter categorization on the basis of innovativeness .............21
Figure 2. Proposed investigatory model ............................................................................32
Figure 3. Statistical mediation effects, net of controls .......................................................73

1
Chapter 1: Introduction to the Study
Introduction
I designed this research project to examine the degree to which openness to
innovation can lead to the effective implementation of enterprise research planning (ERP)
software systems in small to medium business environments. For the theoretical lens of
this investigation, I drew on the perspectives of diffusion of innovations theory (Rogers,
2003) and the technology acceptance model (Davis, 1989; Avci-Yücel & Gülbahar, 2013;
Marangunić & Granić, 2014).
When faced with issues of implementing and/or acquiring new ERP software
systems, the degree of an organization’s openness to innovation should directly impact
the success of the change initiative (Alghalith, 2012; Jayawickrama, Liu, & Smith, 2014;
Qutaishat, Khattab, Zaid, & Al-Manasra, 2012). As such, it stands to reason that the
degree to which senior managers are open to innovation will impact their decision of
whether or not to innovate. It is also reasonable to assume that when an organization
implements a piece of systems management technology, the perceived ease of use and
perceived usefulness of the innovation will also influence senior managers’ decision to
innovate (Davis, 1989; Avci-Yücel & Gülbahar, 2013; Marangunić & Granić, 2014).
Although the tenets of diffusion of innovations theory and the technology
acceptance model have been extensively used in previous investigations of software
adoption decisions (see King & He, 2006), to date there has been no investigation that
directly examines the utility of these theories in predicting whether senior managers will
choose to adopt new ERP software systems in small to medium business (SMB)
2
environments (Avci-Yücel & Gülbahar, 2013; Davis, 1989; Marangunić & Granić, 2014;
Rogers, 2003). On a theoretical level, I set about to examine the ways in which Rogers’
(2003) diffusion of innovations theory can be used to help predict when senior managers
will engage in deeper levels of organizational technology acceptance with ERP software
systems. Along these same lines, I used the technology acceptance model (TAM) to
examine how two key aspects of technology acceptance (perceived ease of use, and
perceived usefulness) directly influence both the decision to innovate and openness to
innovation among senior managers of SMBs.
Chapter 1 provides background information on the problem of technology
acceptance as it relates to ERP implementations, as well as a statement of the problem
that I investigated, and the overarching purpose and nature of the study. This chapter also
includes a statement of the relevant research questions and hypotheses, and ends with a
statement on the scope, assumptions, limitations, and delimitations of my investigation.
Background of the Problem
The pressure on senior management to effectively identify problems is essential to
their efforts in making the right decisions to foster innovation (Murray, 2012; Winsor,
2012). In the field of ERP systems implementation management, upper management
often adopts technological solutions to solve organizational problems, particularly when
seeking to create information systems that are more open, flexible, and responsive to
challenges (Bernroidera, Kochb, & Dtixc, 2013; Maditinos, Chatzoudes, & Tsairidis,
2012). Senior management may tend to frame the problems facing their organization
solely in terms of the need to acquire newer information technology, rather than

3
promoting novel and innovative technological changes that would enable elements of the
organization to share, interpret, and make better-informed decisions (Ruivo, Oliveira, &
Neto, 2012; Xu, Rondeau, & Mahenthiran, 2011).
The management belief that they can solve problems by simply purchasing more
modern technologies has deep-seated cultural roots (Nixon & Burns, 2012; Qutaishat et
al., 2012; Ward, 2012). Indeed, management can overlook more critical organizational
issues by focusing on the acquisition of newer technologies for the sake of having newer
technology, such as the need for the technology to effectively share information (Grabski,
Leech, & Schmidt, 2011; Weng & Hung, 2014). If firms do not frame their problems
correctly, they will overlook the organizational aspects of change in ERP systems
implementation, and negative consequences may follow (Hastie & Dawes, 2010).
The first concern is that organizations may not address how the technological
innovation itself may be preventing employees from solving problems by collaborating in
a flexible environment (Hastie & Dawes, 2010). The second concern is that organizations
may waste investment capital when purchasing the new software and hardware that do
not fundamentally address the needs of the SMB (Chiwamit, Modell, & Yang, 2014).
Openness to appropriate technological innovation on the part of senior management is
therefore critical if a SMB is to flourish.
It is not just openness to innovation that may drive the decision of senior
management to adopt a technological innovation in a SMB environment. Technology
acceptance may also play a part, especially as it is related to the perceived ease of use and
perceived usefulness of the technological innovation (Avci-Yücel & Gülbahar, 2013;
4
Davis, 1989; Marangunić & Granić, 2014). In 1989, Davis developed the TAM as a way
to show how a person’s perceptions and attitudes towards a new piece of technology
would predict its adoption and use. The basic principles of the TAM have been extended
by a number of authors to show how the decision by senior management to adopt a new
piece of technology also hinges upon organizational needs, whether they are real or
perceived (Ghazizadeh, Lee, & Boyle, 2012; Venkatesh, Thong, & Xu, 2012).
Implementation decisions can cost businesses millions of dollars, and senior
managers involved with improper implementation decisions can, and often do, lose their
jobs as a result (Venkatesh et al., 2012). Therefore, the identification of appropriate
technology implementation is critical in SMB environments, especially as related to ERP
systems technology. ERP systems are often perceived as areas that favor efficiency and
control in implementing organizational systems at the expense of creativity and change
(De Bernardis, 2012; Ward, 2012). De Bernardis (2012) proposed that this common
misconception overlooks the critical role that ERP systems can and do play in fostering
and supporting innovation and entrepreneurship in SMB environments. It thus stands to
reason that a senior manager’s perceptions concerning the ease of use and usefulness of
ERP systems software will guide their decision to adopt a technological innovation.
Problem Statement
In the field of technology, the ability of senior management to clearly and
accurately define problems is essential to effectively solve them (Winsor, 2012).
However, senior managers often have their problem-solving efforts occluded by their
desire to obtain popular new technological products, particularly when seeking to
5
overhaul existing information systems in SMB environments. In their search to upgrade
ERP systems software, senior management may overlook technology acceptance issues
(such as ease of use and usefulness of an innovation) when purchasing ERP system
upgrades by framing problems as the acquisition of new technology for the sake of new
technology. In light of these issues, the specific problem that I addressed in this project
was the degree to which openness to innovation might lead to the effective
implementation of ERP software systems in SMB environments.
In order to effectively address the specific problem, I sought to examine factors
that may increase the likelihood that senior executives will be open to innovation as a
function of perceived ease of use and perceived usefulness in the implementation of new
ERP systems software. Because SMBs increasingly need to adopt technological upgrades
to meet rapidly changing economic problems, the proper identification of technological
problems by management with ERP systems software is critical (Luftman et al., 2012).
The results of this study should be helpful to executives who are faced with the need to
modernize their management accounting systems, and to consultants who help clients
define and address technological problems in this area.
Purpose Statement
The purpose of this quantitative correlational study was to identify conditions in
which managers are more likely to correctly decide whether or not to adopt innovations
relating to ERP systems. Specifically, this study set out to determine whether there is a
positive relationship between the dependent variable (the decision to innovate) and the
independent variables of a perceived ease of use, perceived usefulness, and openness to

6
innovation among the entrepreneurial business leaders of SMBs in the United States.
In order to identify factors that increase the degree to which high-level managers
desire to innovate, a correlational study was conducted. Data was obtained from a survey
of 154 senior management executives using SurveyMonkey, a secure on-line survey
website. Survey invitations were sent to a sample of 3,000 individuals drawn from a
population of 30,000 senior management executives in firms that utilize ERP systems
software located in the United States. Dillman, Smyth, and Christian (2014) noted that
internet-based surveys typically yield a response rate of approximately 5%. The sample
of 154 executives was within this parameter.
All collected data was analyzed using SPSS version 22. Descriptive statistics were
calculated for all study variables; in addition, binary logistic regression was also used to
investigate the relationships among the several independent variables and the dependent
variable simultaneously. The results of this study were used to design consulting services
that will help clients solve problems and improve efficiency of their accounting systems.
Research Questions
In this study I set about to address the following research questions:
RQ1: To what extent does a senior manger’s technology acceptance, as defined by
perceived ease of use, influence the decision to implement ERP software innovations in
small to medium business settings?
H10: Perceived ease of use of ERP software does not increase the decision to
adopt ERP software.
H1a: Perceived ease of use of ERP software does increase the decision to adopt

7
ERP software.
RQ2: To what extent does a senior manger’s technology acceptance as defined by
perceived usefulness influence his or her decision to implement ERP software
innovations in small to medium business settings?
H20: As perceived usefulness of ERP software increases, the decision to adopt
ERP software will either decrease or remain unchanged.
H2a: As perceived usefulness of ERP software increases, the decision to adopt
Enterprise Resource Planning software will also increase.
RQ3: To what extent does a senior manger’s openness to innovation influence his
or her decision to implement ERP software innovations in small to medium business
settings?
H30: As openness to innovation increases, the decision to adopt ERP software will
either decrease or remain unchanged.
H3a: As openness to innovation increases, the decision to adopt ERP software will
also increase.
RQ4: To what extent does a senior manager’s openness to innovation channel the
relationship between technology acceptance (as defined by perceived ease of use and
perceived usefulness) and the decision to implement Enterprise Resource Planning
software innovations in small to medium business settings?
H40: The effect of perceived ease of use and perceived usefulness on the decision
to adopt Enterprise Resource Planning software is not mediated by openness to
innovation.

8
H4a: The effect of perceived ease of use and perceived usefulness on the decision
to adopt Enterprise Resource Planning software is mediated by openness to innovation.
Theoretical/Conceptual Framework
In this research, I drew upon two theoretical perspectives: diffusion of innovations
theory (Rogers, 2003) and the TAM (Davis, 1989; Avci-Yücel & Gülbahar, 2013;
Marangunić & Granić, 2014). The primary theoretical contribution of the study to the
existing body of knowledge is in showing how Rogers’ (2003) diffusion of innovations
theory helps to understand when senior managers will be able to correctly identify
whether their ERP systems software should, or should not, be updated.
The tenets of diffusion of innovations theory should be able to accurately predict
when a senior manager of a SMB is open to innovation, as well as whether a senior
manager of a SMB makes the correct decision on whether to adopt a new technological
innovation. A secondary theoretical contribution of this study to the extant body of
knowledge is in showing how the ideas contained within the TAM influence a senior
manager’s openness to innovation and the decision to adopt a new technological
innovation.
Definition of Terms
Double-loop learning: Organizational learning that involves “restructuring
existing overall norms and behaviors instead of specific activities so that the organization
develops new skills, culture, norms and behavior” (Sisaye & Birnberg, 2010, p. 341).
Enterprise resource planning systems software: A business management software
package that is designed to collect, interpret, store and manage data concerning costs,
9
sales, inventory, shipping, and payment from business activities (Kanellou & Spathis,
2013).
First order change: Change in organizational systems that occurs within a given
system which itself remains unchanged (Watzlawick, Weakland, & Fisch, 2011).
Individual innovativeness: A generalized willingness to change working practices,
methods, and organizational processes (Hurt, Joseph & Cook, 1977).
Management accounting: A field that utilizes accounting information to guide
decision making, and to evaluate the effects of decisions (Ward, 2012).
Organizational support for innovation: Support from formal norms and informal
networks for the adoption of new working practices, methods, and organizational
processes (Hurt et al., 1977).
Second order change: Change in an organizational system that changes the
system itself (Watzlawick et al., 2011).
Single-loop learning: Organizational learning that focuses on more effective
implementation of existing systems without changing the assumptions of those systems.
Perceived usefulness: The users’ willingness to use the system based on their
perception of whether the system will help them perform their job better (Davis, 1989).
Perceived ease of use: The systems usability, which needs to outweigh the effort
needed to adopt, despite its perceived usefulness (Davis, 1989).
Small to medium business (SMB): The United States International Trade
Commission (2011) defines a small to medium business (SMB; alternatively known as a
small to medium enterprise, or SME) as having fewer than 500 employees and an annual
10
revenue either less than or equal to $25,000,000.
Nature of the Study
I used a quantitative, cross-sectional, correlational research design to examine the
association between technological acceptance, openness to innovation, and the decision
to innovate. I chose a quantitative design because the purpose of the study was to
estimate the strength of the linear association between the constructs of technological
acceptance, openness to innovation and the decision to innovate.
I selected a cross-sectional correlational, rather than experimental, design because
my primary objective was to carry out a preliminary investigation into the associations
between quantitative constructs, rather than to test causal relationships in a laboratory
setting (Neuman, 2011). Given the descriptive nature of this study, an experimental
investigation would be premature; for the same reason, a cross-sectional design was at
this stage preferable to a more intensive and costly longitudinal study (Dixon, Singleton
& Straits, 2015).
Assumptions, Scope, Limitations, and Delimitations
Assumptions
In this study I made certain assumptions about the processes of innovation in
complex organizations. I assumed that the adoption of innovations is shaped largely in
SMBs through the actions and intentions of senior management. Further, I assumed that
the actions and intentions of senior management are constrained by cognitive processes
of problem definitions that can be measured and estimated in a survey.

11
Scope
I invited a total of 3,000 senior management executives of SMBs to participate in
the survey. The survey was restricted to participants who are part of the senior
management structure of SMBs. As per the definition of the United States International
Trade Commission (2011), the size of the organizations included in the study were those
with less than 500 employees and that had an annual revenue of less than or equal to
$25,000,000 per year. The geographical territory of the participants was restricted to the
United States.
Limitations
The major limitations of the study are the dependence on self-report survey
measures and my use of a cross-sectional correlational design. I relied upon participants
to provide accurate reports concerning their dispositions toward adopting innovation, as
well as the degree to which they report their openness to innovation. If respondents
provided answers that were intended to project a socially desirable impression of
themselves or their firm, or simply lack self-awareness, then the gathered self-report data
would be less than accurate.
My use of a cross-sectional design further imposed limitations concerning
inferences about the direction of causality between identification of the dependent
variable and the independent variables in the study. Although causality can be inferred
from a correlative study that uses survey data, causality cannot be definitively established
in a correlative study that uses survey data (Neuman, 2011). Therefore, I was only able to
show definitive associations between variables, and, as a result, will have to argue that
12
said associations may be causal in nature.
Delimitations
While I drew on the broader literature regarding technology acceptance and
innovation diffusion, I narrowed the scope of the study to issues of how aspects of
technology acceptance (i.e., perceptions of ease of technology use and usefulness of
technology) influence openness to innovation and the decision to innovate with ERP
systems software. I also limited focus to senior managers in SMBs, rather than middle or
lower-level managers in SMBs. In addition, I focused only on solving problems that are
internal to an organization, rather than ones that involve relations between organizations
or broader policy issues. Finally, I limited the study to SMBs and did not focus on large
firms (i.e., those companies with more than 500 employees and an revenue of greater
than $25,000,000 annually).
Significance of the Study
Contribution to Business Practice
I designed this study to help decision makers become more aware of factors that
promote constructive and effective identification of how to remediate problems in
management accounting. The results of this study are also intended to assist consultants
who work with organizations’ decision-makers and executives. Consultants may become
more aware of how managers may need support and coaching to effectively identify and
address the decision to adopt new technological innovations with the implementation of
ERP systems in SMBs.
13
Implications for Social Change
The results of this study may help senior managers overcome limitations in
defining problems. This may help the organizations adjust to the challenges of working in
a rapidly changing global economy. To address these challenges, senior managers need to
go beyond choosing the correct software and hardware for traditional accounting models,
and consider changes in the organization of the work place that are required for the
adoptions of effective management accounting systems.
Summary and Transition
The following chapters will provide a discussion and overview of the relevant
research literature and the methods that were used in this investigation. Chapter 2
examines in detail published investigations that speak to the TAM and diffusions of
innovations theory. Chapter 2 also contains a more detailed discussion of how openness
to innovation can lead senior managers of SMBs to adopt technological innovations, and
how a senior manager’s levels of technology acceptance may also play a part in the
process of deciding whether to adopt a technological innovation. The research design is
articulated in detail in Chapter 3. An overview of the proposed methodological approach,
the instrumentation that was used, the sampling technique, the data collection strategy,
and data analysis techniques are covered in Chapter 3.

14
Chapter 2: Review of the Literature
Introduction
The specific problem that I addressed in this project was the degree to which
openness to innovation might lead to the effective implementation of ERP software
systems in small to medium business environments. The purpose of this quantitative
correlational study was to identify conditions in which managers are more likely to
correctly decide whether or not to adopt innovations relating to ERP systems. I drew
upon the perspectives of diffusion of innovations theory and the TAM to better
understand of processes of how senior managers of organizations are open to innovation
with the effective implementation of ERP systems in SMB environments (Avci-Yücel &
Gülbahar, 2013; Davis, 1989; Marangunić & Granić, 2014; Rogers, 2003).
The main theoretical significance of the study lies in my application of Rogers’
(2003) diffusion of innovation theory to understand when senior managers will engage in
making correct decisions relating to the acquisition of ERP systems software. A
secondary theoretical contribution lies in understanding how the process of technology
acceptance among senior managers also plays a part in this process (Avci-Yücel &
Gülbahar, 2013; Davis, 1989; Marangunić & Granić, 2014). Below I provide an overview
of diffusion of innovations theory and the TAM.
In this chapter I offer a discussion and overview of the relevant research literature
and the methods that I used in this investigation. Specifically, I examine in detail
published investigations that speak to the TAM and diffusions of innovations theory. I
also offer a more detailed discussion of how openness to innovation can lead senior

15
managers of SMBs to adopt technological innovations, and how a senior manager’s
levels of technology acceptance may also play a part in the process of deciding whether
to adopt a technological innovation.
For the literature search, my strategy was to research peered reviewed journals
and articles from relevant databases, using key search items, including their components
and combinations. I used the Walden University Library, peer-reviewed search engines,
professional journals and articles, relevant books, and publications for the literature
search. I derived the key search terms from the 2 main theories (diffusion of innovation
theory, and the TAM), the many dimensions of each theory, the terms defined in Chapter
1, innovation decision process, organizational and executive learning, and decision
process for SMBs (Davies, 1989; Rogers, 2003). Over 80% of the articles I selected for
inclusion were published within the last 5 years. The literature searched provided
sufficient current research and articles for this study.
Diffusion of Innovations Theory
Rogers’ (2003) diffusion of innovation theory suggests that the adoption of any
innovation follows a bell curve, such that some individuals will consistently tend to
consider and to adopt innovations before most of their peers. Diffusion of innovation
theory further asserts that individuals who are more open to adopt innovations will be
more open to considering the fundamental second order changes in technology adoption
through the process of what is known as “double-loop learning.” As Sisaye and Birnberg
(2010) have noted, double-loop learning is a process that typically occurs at the
organizational level and involves the “restructuring [of] existing overall norms and
16
behaviors instead of specific activities so that the organization develops new skills,
culture, norms and behavior” (p. 341). In other words, the linkages between double-loop
learning and diffusion of innovations theory can be used to show how certain types of
organizations (such as SMBs) will be more likely to support and foster innovation among
senior management. Thus, the propensity to recognize the need for technology adoption
may be related to an organizational climate that supports innovation, as well as individual
psychological dispositions. I will discuss the utility of the concept of double-loop
learning within the theoretical framework of diffusion of innovations theory later in this
document.
Diffusion of innovations theory was developed from research on the process
through which individuals and organizations decide to adopt new technology (Rogers,
2003). Sahin (2006) reported that Rogers used the words “innovation” and “technology,”
which can be seen as synonymous within the theoretical framework of diffusion of
innovations theory, to refer to a tool that will advance the functionality of an
organization. Indeed, the very language used by Rogers in his conceptualization of
diffusion of innovations theory is somewhat idiosyncratic, so much so that a brief review
of key terms is warranted here.
Definitions
In his conceptualization of the diffusion of innovations theory, Rogers (2003)
defined diffusion as “the process by which innovation is communicated through channels
over time among members of a social system” (p. 5). Rogers further described diffusion
as “the process of social change by which alteration occurs in structure and function of
17
the social system” (p. 6). Rogers went on to define innovation as “an idea, practice or
project that is perceived as new by a change agent or other unit of adoption” (p. 12).
These two definitions form the cornerstone of Rogers’ theory, although they are not the
only key ideas expressed in his work. For example, the ideas of adoption, uncertainty,
communication channels, and the social system are also key elements.
Rogers (2003) defined adoption as the decision to fully utilize the innovation
selected as the best choice for the organization. This definition is somewhat the opposite
of uncertainty, which Rogers defined as an obstacle to innovation, such as lack of
predictability, structure, or information. The two terms intersect insofar as the uncertainty
of stakeholders regarding the adoption of the innovation process creates a situation in
which they might not understand the consequences of the change initiative. One thing
that helps to overcome this situation is having open communication channels, which
Rogers defined as the channels in which stakeholders share knowledge and information
between sources.
Finally, Rogers (2003) defined a social system as “a set of interrelated units
engaged in joint problem solving to accomplish a common goal” (p. 21). It is also
important to note that Rogers (2003) outlined four primary components to the diffusion
of innovation process. These four components are uncertainty, communication channels,
time, and social systems, each of which I discuss below.
Uncertainty. Uncertainty is the first element of the diffusion of innovations
process. As previously noted, uncertainty can relate to any obstacles to the innovation
process. If stakeholders in the adoption of the innovation do not understand the
18
consequences of the change initiative, they will be unsure on how to proceed. The
consequences of uncertainty can be grouped into desirable consequences versus
undesirable consequences, both of which can either be functional or dysfunctional
(Rogers, 2003). Consequences of uncertainty can also be direct versus indirect,
immediate versus delayed, as well as either recognized or unanticipated.
Communication channels. Communication is the second element of the
diffusion of innovation process. Rogers (2003) defined communication channels as the
processes in which stakeholders share knowledge and information. Diffusion is said to
occur between the source of the communication and the receiver of the communication
(Rogers, 2003). According to Sahin (2006), the successful diffusion of innovations is
predicated upon clear and open channels of communication among participants in a social
network who share similar beliefs, education levels, bias, positions and/or likes (i.e.
homophily). If the participants do not share any of those attributes (i.e. they are
heterophilous), the diffusion of innovation can be problematic (Sahin, 2006). Both Sahin
and Rogers proposed that a significant problem in the diffusion of innovation often
occurs because participants are either mostly heterophilous in nature or because they do
not effectively communicate with each other.
Rogers (2003) further classified communication channels as either localite
channels (i.e., those within the social system), or cosmopolite channels (i.e., those outside
of the social system). Interpersonal channels of communication between individuals can
also be either localite or cosmopolite, whereas mass media is cosmopolite (Sahin, 2006).
Cosmopolite channels are more significant at the knowledge stage of the diffusion of
19
innovation process, and localite channels are more needed at the persuasion and decision
stage of the innovation diffusion process (Sahin, 2006).
Time. Time is the third element of the diffusion of innovation process. Rogers
(2003) noted that the progress of time in the diffusion of innovations is often either
overlooked or outright ignored, even though time is an obvious aspect of all
communication processes. Sahin (2006) went further to argue that the time component is
the most critical factor in the diffusion of innovation process. Because time is a
fundamental process in the human condition (Richet, 2012), it is often ignored;
nevertheless, its presence in the process of diffusion must be acknowledged.
Social systems. The larger social system is the fourth element of the diffusion of
innovation process. Rogers (2003) defined a social system as “a set of interrelated units
engaged in joint problem solving to accomplish a common goal” (p. 21). Rogers argued
that the social structure, which is the arrangement of the elements of the social system,
and the nature of the social system will have an effect on the outcome of the individuals’
innovativeness.
Innovation Decision Process
The innovation decision process includes the activities of the decision-makers to
seek and process information, with the goal of eliminating uncertainty about pros and
cons concerning the adoption of an innovation (Rogers, 2003). The five stages of the
innovation decision process are knowledge, persuasion, decision, implementation, and
confirmation (Rogers, 2003). At the knowledge stage, the change agent learns the
existence of and acquires information about the new innovation (Sahin, 2006).

20
This is followed by the persuasion stage, in which the change agent determines
whether the innovation could be positive or negative (Sahin, 2006). During the decision
stage, the individual will decide to either adopt or reject the innovation (Sahin, 2006). If
the decision is to adopt the innovation, the innovation is implemented, a fact which leads
to the fifth and final stage. During the fifth stage, which is the confirmation stage, the
individual seeks support for the innovation from stakeholders (Sahin, 2006; Rogers,
2003).
Once an innovation is adopted, the diffusion of the innovation must then take
place. According to Rogers (2003), one of the problems concerning the adoption of a new
innovation is the time it takes to get others to “buy in” to the adoption of the innovation.
Even when the benefits are obvious, it is often difficult and/or time-consuming to get
others on board with the new innovation, mainly because of any uncertainty that may be
part of the adoption of the new innovation. One way to overcome the process of
uncertainty is to demonstrate the relative advantage, compatibility, complexity, trial-
ability, and observability of the new innovation (Rogers, 2003). Sahin (2006) asserted
that these five aspects of innovation diffusion will predict the rate of adoption of the new
innovation by other members within an organization.
The relative advantage attribute represents the cost or benefit of the innovation
over the current state for various stakeholders (Sahin, 2006). The compatibility attribute
refers to the degree the innovation can fit the existing values, people, and processes
(Sahin, 2006). The complexity attribute relates to the perceived degree of difficulty of the
innovation to learn or implement (Sahin, 2006). The trial-ability attribute refers to the

21
potential for the innovation to be tested in the environment before implementation (Sahin,
2006). The fifth attribute, observability, relates to the visibility of the innovation to
outside stakeholders (Sahin, 2006). Rogers (2003) argued that innovation that offers
greater relative advantage, compatibility, complexity, trial-ability, and observability has a
greater chance to succeed within an organization.
Adopter Categories
It should be noted that an innovation is never adopted universally; rather, there are
some people who will adopt an innovation before others (Cocklar, 2012). Rogers (2003)
identified five adopter categories that are shown in Figure 1. The categories include (a)
innovators, (b) early adopters, (c) early majority, (d) late majority, and (e) laggards
(Keesee & Shepard, 2011). Rogers noted that while innovators are willing to investigate
new ideas, it is the early adopters who are the most likely to be in leadership roles that
will be in support of the new innovation.
Figure 1. Rogers’ (2003) adopter categorization on the basis of innovativeness.

22
Early majority individuals are the critical change agents in a system; it should be
noted that most of these people often do not hold leadership positions (Rogers, 2003).
Late majority individuals are the members of an organization who wait for the innovation
to be adopted by most of the other members of the organization, and laggards are the
holdout skeptics who wait to adopt an innovation until it has been proven as reliable
(Rogers, 2003). The progression of adoption is depicted in Figure 1.
Innovators and early adopters tend to learn about innovations from cosmopolite
sources (i.e., those sources beyond a person’s local network, such as specialized media
and conferences). In turn, early adopters often become the opinion leaders who foster the
adoption of an innovation within an organization (Rogers, 2003). The early majority
tends to depend upon local recommendations (such as word-of-mouth) and modeling of
adoption by the early adopters (Rogers, 2003). The late majority will adopt an innovation
only when the majority people within an organization have taken it up, and laggards will
resist adoption of innovations, even when the majority has adopted and is using the
innovation in question. Indeed, laggards will change only when they are compelled to by
circumstances (Rogers, 2003).
These five categories also represent stable individual differences in willingness to
adopt innovations. Individuals who are early adopters with one innovation are thought to
be early adopters of other innovations, while those who are laggards with regard to one
innovation are more likely to be laggards with regard to other innovations. A fairly
substantial body of empirical research supports the notion that there are stable and

23
persistent differences between different levels of the adoption curve (Leite & Teixeira
2012; Manning, 2013; Pegoretti, Rentocchini, & Vittucci Marzetti, 2012).
Personal innovativeness has been found to be a stable and consistent dimension of
individual differences that moderates the impact of perceptions of technological
innovations on the adoption and utilization of those technologies. This finding has
emerged from studies of the adoption of information technology in education, healthcare,
and small business accounting software (Cocklar, 2012; Gwebu & Wang, 2011; Huang,
2013; Park & Ryoo, 2013).
The body of work on the topic has shown that early adopters can be differentiated
from later adopters by a number of personal characteristics. Early adopters tend to have
higher levels of knowledge and user experience, and a heightened sense that they control
the outcomes of their decisions (Schreier & Prügl, 2008). In addition to these personal
characteristics, early adopters may consistently be receptive to new ideas because they
have a reputation to uphold as being well informed about innovation (Schreier & Prügl,
2008). Early adopters also tend to have higher levels of certain personality traits, such as
extraversion and emotional stability (Svendsen, Johnsen, Almas-Sorenson, & Vitterso,
2011).
Empirical research concerning the diffusion of innovation in ERP systems
software also suggests that change is more likely to occur when the leaders of
organization, such as senior managers, have a general disposition toward supporting
innovation, i.e. when leaders are either innovators or early adoptions (Sisaye & Birnberg,
2010). For comprehensive and sweeping change to occur in an organization that uses

24
ERP systems software, top management must provide leadership, resources, and support
for members of the organization that champion the innovation.
These findings suggest that decision makers can be characterized as having higher
or lower levels of a psychological disposition that favours the adoption of innovation.
Knowledge of the relationship between the individual psychological disposition to adopt
innovation and a tendency to recognize elements of organizational problems may help
better predict when senior management may, and more importantly may not, be willing to
adopt an innovation. That being said, different approaches to helping a client to frame
organizational problems as a matter of the need to innovate may be necessary in order for
clients who are generally resistive to innovation to embrace the new innovation. In order
to overcome resistance on the part of the client, it is also important to recognize that
organizational culture may play a part in the decision by senior management to innovate.
Organizational Innovativeness
While Rogers (2003) suggested that there are persistent individual differences in
receptiveness to innovation, he also noted that organizational contexts may enhance or
inhibit the adoption of an innovation on the part of senior managers of an organization.
Sisaye and Birnberg (2010) suggested that second-order change and related patterns of
organizational learning are more likely to occur when organizational norms and culture
value and support innovation. It can therefore be argued that individual decision-makers
are more likely to engage in innovative behavior in their organization when the perceived
psychological climate of the organization provides support for the adoption of innovation,
and for taking the risks that are often involved in the adoption of innovation (Imran,
25
Hasan, Rizvi, & Ali, 2011).
In addition to providing support for individual innovations, organizations can also
create internal structures, such as teams, that facilitate levels of innovation that would be
difficult to sustain purely by individual efforts within existing departmental structures
(Liu & Phillips, 2011). The adoption of innovation requires support not only from those
with formal authority in the organization, but also from informal social networks (Moore
& Westley, 2011). Innovative organizations are characterized by five salient features,
which include creativity, openness to new ideas, intention to innovate, risk-taking, and
pro-activeness (Lynch, Walsh & Harrington, 2010).
Organizations that provide support for innovation tend to realize tangible benefits
(Liu & Phillips, 2011). Researchers have found perceptions of organizational
innovativeness to be correlated significantly with employees’ participation in decision-
making, job satisfaction, commitment, and performance (Das & Joshi, 2012; Kunz,
Schmitt & Meyer, 2012; Shoham, Vigoda-Gadot, Ruvio, & Schwabsky, 2012).
Cumulatively, these findings suggest that the climate of organizations can be
characterized as either offering higher or lower levels of support for the adoption of
innovation.
Knowledge of the relationship between the organizational support for innovation
and the tendency for upper level executives to recognize elements of organizational
problems may help consultants who are working with upper management in numerous
ways. Consultants should be mindful that resistance to innovation, and the tendency to
adopt purely technological definitions of organizational problems, are not necessarily

26
rooted in the psychological character of the executive; rather, the climate of the
organization must also be considered. In addition, different approaches toward helping
the senior managers to frame organizational problems may be needed depending on the
context of organizational climate.
Factors that Promote Innovation in Management Accounting
While innovations in organizations that use ERP systems software may require
changes in technological norms and organizational structures prior to the adoption of an
innovation, executive decision-makers must still narrow the focus of their change efforts
to making changes that leave established social regularities in place, rather than effecting
needed changes (Sisaye & Birnberg, 2010). One of the consequences of defining
innovation change problems in purely technological terms is that decision-makers are
often trapped in a vicious cycle. When a technological innovation fails to solve an
underlying organizational problem, decision-makers may look for a more effective
technological innovation to take the place of the one that failed, rather than reframing the
problem in ways that recognize the need for underlying changes in the norms of the
organization.
A critical factor in promoting change in organizational practices in SMBs that use
ERP systems software is the presence of support for innovation among the leadership of
the organization, as well as its organic culture (Chenhall, 2012; Sisaye & Birnberg,
2010). To the extent that these factors support innovation, decision-makers will have
more flexibility to consider alternative problem definitions that encompass innovative
and technological aspects of problem definition.
27
Technology Acceptance Model (TAM)
This research project also draws upon the tenets of the technology acceptance
model, or TAM (Davis, 1989). Two specific elements of the TAM—perceived ease of
use of a technology and perceived usefulness of a technology—are applicable when
seeking to understand the process of how senior managers of SMBs decide to adopt an
innovate change that is needed to support the effective implementation of ERP systems
software. The theoretical relevance of the TAM rests upon the understanding that the
perceptions of senior managers hold towards the implementation of ERP systems
software are antecedent to the willingness of senior managers to innovate.
Attitudes held by senior managers concerning the usefulness and ease of use of a
technological innovation will directly impact a senior manager’s openness to innovation,
as well as his or her decision to innovate. Thus it can be argued that the ideas contained
within Rogers’ (2003) diffusion of innovations theory might be improved through the
incorporation of aspects of the TAM as articulated by Davis (1989). In order to better
understand this line of thought, a thorough exploration of the TAM is in order.
Technology Acceptance Model Theoretical Foundations
One of the main aspects of technology is that it is always evolving and changing.
The fast-paced evolution of technology is best illustrated by the axiom known as
“Moore’s Law,” which essentially states that most forms of technology (such as
computers) will double in complexity approximately every 24 months (Mack, 2011). Yet

28
the fast-paced evolution of technology can be a problem for end-users of that technology,
as they must choose to adopt the new technology, squeeze more life out of existing
technology, or be left behind in the marketplace (Venkatesh et al., 2012). When
technology failures occur, millions of dollars can be lost, and the senior managers
responsible for the failures associated with technology implementation can, and often do,
lose their jobs as a result (Venkatesh et al., 2012).
It has been suggested through use of the TAM (Davis, 1989) that two perceptions
and attitudes about a particular technology (such as a piece of hardware or software) can
accurately predict whether or not said particular technological innovation will, or will
not, be successfully adopted by an organization. Indeed, it was Davis who first
demonstrated via the ideas of the TAM that the perceptions and attitudes of end users will
reliably predict or explain successful technological adoption and use.
The TAM is theoretically couched in the intellectual intersections of the theory of
reasoned action and the theory of planned Behavior (Yousafzai, Foxall, & Pallister,
2011). In short, the theory of reasoned action essentially states that a behavioral intention
(an attitude or cognition) will dictate a subsequent voluntary action (Yousafzai et al.,
2011), whereas the theory of planned behavior examines how the determinants of the
decision-making process will lead to the formation of attitudes that subsequently guide
behaviors (Yousafzai et al., 2011). Aspects of both the theory of planned behavior and
the theory of reasoned action were used in the TAM by Davis (1989) to illustrate how
attitudes towards technology will guide a person’s behavioral decisions concerning
acceptance and usage of said technology.
29
The TAM has been used with a surprising degree of accuracy to show how
attitudes on the part of technology users will predict whether or not the user will accept or
reject a new technology. Studies have shown that there is a strong relationship between
the perceptions of users towards a given technology and their actual use of the given
technology (Qutaishat, et al., 2012; Venkatesh et al., 2012). It has been suggested that
what drives the relationship between perceptions and actions in the TAM is an underlying
cost-benefit analysis, similar to what is found in behavioral decision theory (Bromiley &
Rau 2011; Powell, Lovallo & Fox, 2011; Takemura, 2014).
During the decision-making process, individuals will decide on whether or not to
adopt a given technological innovation based on the different options between the
decision to adopt and the resulting outcome of that decision (Bromiley & Rau 2011;
Powell et al., 2011; Takemura, 2014). In other words, the perceived ease of use and
perceived usefulness of a new technological innovation will guide the subjective cost-
benefit analysis associated with adoption of a new technology on the part of an end-user.
This last point is of great importance, as the two aspects of the TAM that are critical in
determining whether a person will adopt a new piece of technology are the perceived ease
of use of the technological innovation and the perceived usefulness of the technological
innovation (Davis, 1989; Avci-Yücel & Gülbahar, 2013; Marangunić & Granić, 2014;
Venkatesh et al., 2012).
Perceived Usefulness
Perceived usefulness is the first dimension of the TAM. Davis (1989) defined
perceived usefulness as a user’s willingness to engage with the new technology. The

30
willingness of the user to engage is based on their attitudes towards whether the new
technology will help them to perform their assigned tasks better. Davis specified that
users see usefulness of the new technology as a blend of whether the technological
innovation will help them to do their job more effectively, will increase their
productivity, and will save them time. Davis (1989) and other authors have shown that
perceived usefulness is the predominant variable in determining whether a person will
decide to accept a new technological innovation (Venkatesh et al., 2012).
Perceived Ease of Use
Perceived ease of use is the second of the two dimensions of the TAM that govern
whether an end-user will adopt a technological innovation. Davis (1989) defined
perceived ease of use simply as a system’s utility. Davis further proposed that a system’s
utility needs to outweigh the effort required in adopting it, despite its perceived
usefulness. Davis classified the research items for perceived ease of use into three main
clusters: physical effort, mental effort, and the direct perception of how easy a system is
to use.
Research has shown that ease of use and ease of learning are strongly related
(Davis, 1989; Venkatesh et al., 2012). According to Davis (1989), ease of use of a new
system is associated with the learning process and is therefore subject to both the ease of
use of documentation and the system guidelines. Lin, Liu and Kuo (2013) proposed that
ease of use and ease of learning are congruent, as they are not separate or disjointed
activities. The easier the system is to use, the more apt the individual is to learn the
system by using the system rather than referring to the user manuals or available training

31
provided (Lin et al., 2013).
Davis (1989) and subsequent researchers have suggested that perceived ease of
use is the weaker variable in determining technology acceptance than perceived
usefulness (Venkatesh et al., 2012). No matter how easy to use a new technology is, a
user tends to accept the technology more on the basis of a needed function for the
individual or the organization. Nevertheless, both perceived ease of use and perceived
usefulness have been shown in the literature to guide the decisions of people when it
comes time to implement a new technological innovation.
Integrated Theoretical Model
In this dissertation I set about to merge the ideas contained within diffusion of
innovations theory by Rogers (2003) with the ideas contained within the technology
acceptance model by Davis (1989) when seeking to articulate the conditions in which
senior managers of SMBs will correctly decide whether or not to adopt innovations
relating to ERP systems software. To this end, I hypothesized that perceptions concerning
ease of use and usefulness of ERP systems software on the part of senior managers will
directly influence a senior manager’s openness to innovation and his or her decision to
adopt a new ERP systems software innovation in SMBs. I also hypothesized that
openness to innovation will serve as a mediator for the impact that perceptions
concerning both ease of use and usefulness will have on a senior manager’s decision to
innovate. These hypothesized theoretical linkages are detailed in Figure 2.
Although Figure 2 explicates the main theoretical elements that I investigated in
the current project, other variables, ideas, and theoretical considerations will impact the

32
conditions under which senior managers of SMBs will make correct decisions concerning
whether or not to adopt innovations relating to ERP systems. An overview of these ideas,
variables, and considerations is therefore in order.
Figure 2. Proposed investigatory model.
Adoption of Technology and Social Innovation
Social and technological innovation in ERP systems software can be viewed
within the broader literature of innovations in organizational development and
information systems. It is important to recognize that the adoption of technology is not an
impersonal process; rather, the transfer of technology from innovators to industry
depends heavily on networks of social relationships (Cheng & Chen, 2013; Lee, 2012),
particularly when the optimal use of an innovation is predicated upon tacit knowledge
that is not easily communicated in documentation. One example of this can be found in
research conducted in the healthcare field. When evidence-based innovations in
healthcare become widely known within patients’ social networks (i.e., outside of
traditional healthcare delivery systems), they gain the potential to disrupt established
patterns of transacting business (Clavier, Senechal, Vibert, & Potvin, 2012; Rotheram-
Borus, Swenderman, & Chorpita, 2012). Indeed, several very effective medical
Perceived
Ease of Use
Perceived
Usefulness
Openness to
Innovation
Decision to
Innovate
33
treatments today are not widely utilized by practitioners due to social and organizational
limitations in scaling up and sustaining adoption of said innovations (Glasgow et al.,
2012; Scheirer & Dearing, 2011).
This example from the healthcare field shows how the adoption of technological
innovation in any business setting can be used to reinforce existing organizational
structures or to support fundamental changes in the social organization of organizational
structures. In the latter case, a firm understanding of the nature of social innovations is
needed to ensure that the correct technological innovations are adopted. Illustratively,
cloud-computing technology supports fundamental changes in organization and practice
of occupational health (Paton, 2012). This relatively new technology has supported
changes in the roles of occupational health providers who now need to be increasingly
mobile in the field and to collaborate with practitioners in related areas of healthcare.
Cloud computing has also been used in the healthcare field for storing patient information
so that it is more widely available to occupational health practitioners and their
colleagues. The qualities of omnipresence and collaborative support, found in the
example of public health, have been also cited as major factors supporting the adoption of
cloud computing to support distance education and other organizational innovations in
higher education (Park & Ryoo, 2013).
A recurrent theme in the discussion of the role of technology in social innovation
(regardless of sector of the economy) is the way in which social and organizational goals
drive the adoption of technology, and are not merely by products that follow from
technological change. In the healthcare examples offered above, an understanding of
34
needed changes in social norms and organizational structures often drives the selection
and adoption of technology. In the field of management accounting, innovations are
similarly scoped, as they often involve mutually reinforcing changes in technology and in
social organization. Examples of widely adopted innovations in ERP systems software
illustrate how these adoptions are dependent in part on changes in norms within an
organization (Chenhall, 2012; Chenhall, Kalunki & Silvola, 2011). Illustrative examples
of accounting innovations that required changes in social organization include the use of
benchmarking to measure the performance of local government organizations, and
activity based costing and activity based management (Sisaye & Birnberg, 2010; Siverbo,
2014). In each of these areas, the adoption of a new technological innovation by an
organization involved changes in the way in which information was shared among actors
in the organization, and changes in the degree to which managers at all levels of the
organization were accountable to measurable results based on such information.
Additional Factors that Impact Decision to Innovate in SMBs
Type of Business
As noted by Sisaye and Birnberg (2010), the process of double-loop learning
involves the adoption of more fundamental change in the structure of an organization,
typically under the leadership of a senior figure in the organization who serves as an
advocate for management accounting. Leadership is thus a key factor that tends to
support the efforts of the management advocate, and makes the organization more
conducive to efforts to change rather than preserve traditional norms and organizational
patterns.

35
In the present study I have drawn on the tenets of diffusion of innovations theory
(Rogers, 2003) to illustrate the process used in determining which innovations will be
implemented effectively. I also drew upon studies in which the researchers have found
that organizations often need to change their internal organization in ways that promote
more flexible collaboration in order to effectively implement ERP software systems. At
the same time, cultural practices, cognitive biases, and an aversion to innovation may
lead decision-makers to become attached to technological solutions for problems in their
organizations. By persisting with a narrow focus on technological solutions, decision-
makers may enter a trap in which they persevere in single-loop learning, and repeatedly
adopt first order changes that are designed to maintain existing relations and norms in the
organization rather than change (Sisaye & Birnberg, 2010).
Argyris and Schön (1978) suggested that organizations are constantly striving to
reduce the gap between expected and achieved ends. When errors or discrepancies are
detected between the intended or expected outcome, and the actual consequences of an
action, organizations will change their action strategies to minimize this gap. Efforts to
reduce this gap may result in single-loop or double-loop learning. In single-loop learning,
decision-makers look for another action strategy that is consistent within established
governing parameters and acceptable limits. Single-loop learning involves looking for a
more efficient method for carrying out routines and procedures that have been accepted
within the organization.
When problems prove not to be amenable to single-loop learning, organization
members may engage in double-loop learning. In this form of learning, the governing
36
parameters themselves are open to scrutiny, and basic assumptions about framing the
problems facing the organization may be challenged. Argyris & Schön (1978)
characterized the difference between single and double-loop learning in the following
way:
When the error detected and correction permits the organization to carry on its
present policies or achieve its present objectives, then that error-and-correction
process is single-loop learning. Single-loop learning is like a thermostat that
learns when it is too hot or too cold and turns the heat on or off. The thermostat
can perform this task because it can receive information (the temperature of the
room) and take corrective action. Double-loop learning occurs when error is
detected and corrected in ways that involve the modification of an organization’s
underlying norms, policies and objectives. (Argyris & Schön, 1978, pp. 2-3)
In many organizations, single-loop learning focuses on adopting technological solutions
that leave existing organizational processes (governing variables) unchanged, while
double-loop learning leads to consideration of ways in which the organization of the
workplace can be changed.
In the field of management accounting, the concepts of single- and double-loop
learning have been used to understand the ways in which organizations undertake the
changes in norms and organization that are needed to effectively implement ERP systems
software innovations. Sisaye and Birnberg (2010) suggested that single-loop learning
leads organizations to learn a more efficient way to implement existing financial
accounting practices, rather than to fully adopt ERP systems software innovations. In
37
contrast, double-loop learning promotes transformational rather than incremental change
with the adoption of any ERP systems software innovations. Sisaye and Birnberg (2010)
proposed that in double-loop learning, “adaptation may involve restructuring existing
overall norms and behaviors instead of specific activities so that the organization
develops new skills, culture, norms and behavior” (p. 341).
By using ideas couched within Sisaye and Birnberg’s (2010) broader framework,
I should be able to recognize that an essential prerequisite for double-loop thinking is
predicated upon recognition of organizational issues in the implementation of the
diffusion of innovations. Failure to recognize problems within an organizational structure
on the part of senior management will perpetuate single-loop thinking about how
organizations need to adopt innovations. According to Sisaye and Birnberg (2010),
prominent factors that encourage senior managers to recognize the need for the adoption
of innovations include having a member of upper management act as an advocate for the
adoption of an innovation, as well as having organizational norms that foster openness
and receptivity to change. Sisaye and Birnberg’s framework also suggests that managers
are more likely to identify needs for the adoption of innovations if a manager is an
advocate for innovation who works in an organization that supports said innovation.
When brought together, the ideas of Argyris and Schön (1978), Sisaye and
Birnberg (2010), and Rogers (2003) can be used to predict how single- and double-loop
learning will impact the decision to innovate on the part of senior managers of SMBs
(Argote, 2011; García-Morales, Jiménez-Barrionuevo, & Gutiérrez-Gutiérrez, 2012).
This is because single-loop learning may be favored by managers who are reluctant to
38
consider the type of systemic change that is required for the adoption of a new
innovation. In the context of management accounting, double-loop learning is often
needed, as changes in the norms and organizational structure of a firm are needed when
purchasing software or other technological changes for an organization.
Impediments to Organizational Learning
Defining both learning and organization is important to the current discussion.
Brown, Roediger, and McDaniel (2014) defined learning as a process resulting from an
experience in which an individual’s knowledge is permanently changed. Jiménez-
Jiménez and Sanz-Valle (2011) suggested that learning is a process that involves taking
in information to increase experience, and as a result, to modify knowledge, new skills, or
new competence. Weick (2013) defined an organization as a group of two or more people
who (a) share collective goals, (b) are in some type of cooperative agreement, (c) have a
division of labor, and (d) have a hierarchical structure.
According to Schilling and Kludge (2009), four psychological processes (known
collectively as the 4I framework) can be used to categorize barriers to organizational
learning. These include (1) intuiting, which relies on personal experiences to create new
insights; (2) interpreting, which is the individual describes his or her insights to others;
(3) integrating, which is the group integrates the individuals’ insights into action; and (4)
institutionalizing, which can be described as the actionable insights are implemented into
procedures, processes, systems, strategies and policies.
The 4I model can be used to better understand barriers to organizational learning.
Intuiting barriers include employee biases, employee deficiencies, lack of understanding

39
of failure analysis, lack of motivation, high level of stress, lack of measurable goals, strict
or perceived rules and regulations, complex competitive market, and difficult knowledge
acquisition (Kowta Sita & Chitale, 2012; Lucia, Leda & Silvia, 2012; Schilling &
Kludge, 2009). Interpretation barriers include fear of loss of ownership, lack of political
and social skills, low confidence, and conflicting relationship with group, failure
avoidance, a culture of silence, and conflict avoidance (Smith, 2012).
Integrating barriers include fear of team disadvantage and potential negative
repercussions; lack of authority, leadership support, participation, and recognition;
outdated core organizational and individual beliefs; inconsistent vision at different levels
of the organization; employee competition; low management turnover; long-term
organizational structure; and gap between innovation and organization’s rituals (Schilling
& Kludge, 2009). Institutionalizing barriers include innovation perceived irrelevance;
lack of innovation implementation skills and time, laissez-faire management style,
cynicism, fear of change, loss of power, and cultural differences (Schilling & Kludge,
2009). These 4I framework barriers to implementing organizational learning can be
summarized as lack of trust in the innovation, deficient skills to implement
improvements; lack of change-management skills; and resisting, counteracting, biased,
and opportunistic behavior.
Summary and Transition
This chapter provided the theoretical context to the problem of adopting
40
innovations, and a statement of the problem that will be addressed in this research. The
purpose and nature of the study was stated, and relevant empirical and theoretical
literature was reviewed. The next chapter will describe the methods and data analyses
that were employed to address the research questions that were stated in Chapter 1.
41
Chapter 3: Methodology
Introduction
In this project I set about to investigate whether openness to innovation will lead
to the effective implementation of ERP software systems in SMB environments in the
United States. The primary purpose of this study was to determine if a senior manager’s
decision to innovate is influenced by that manager’s openness to innovation, perceptions
concerning the ease of use of new technology, and perceptions concerning the usefulness
of new technology. In order to properly investigate the research questions, I used a
quantitative correlational methodological approach (Neuman, 2011) for all data collection
and data analyses.
In this chapter, I present an overview of the methodological design, as well as
information on the sampling process, sampling procedures, data collection, data analysis,
and all ethical safeguards that I employed. I also offer an explanation of the
instrumentation that I used in this project.
Research Design
I used a quantitative method for all data collection and data analysis. More
specifically, I used a quantitative correlational methodological approach (Neuman, 2011)
to investigate the tenets of the four main research questions. My choice of the research
design was predicated in part on the fact that all data was gathered via the use of an
electronic survey. Neuman (2011) noted that a quantitative approach uses procedures to
investigate questions such as experiments and surveys with the intent to statistically
analyze any and all collected data.

42
Because I used a survey technique to gather statistical data, my use of a
quantitative correlational methodological approach is sound (Neuman, 2011). A
quantitative correlational methodological approach is also appropriate for this study,
considering that I used a random sample (Neuman, 2011) as part of the data collection
technique. Finally, because I collected numeric data, that data needed to be analyzed
quantitatively. For this study, I used multivariate binary logistic regression as the primary
analysis tool to discover if relationships exist among the several independent variables
and the dependent variable in this study.
As Agresti and Franklin (2013) proposed, binary logistic regression is the correct
analysis technique to use when one has a single dependent variable and multiple
independent variables. Agresti and Franklin (2012) further noted that binary logistic
regression requires a dependent variable that is measured as a dichotomous nominal-level
indicator, a condition that is satisfied in the current analysis scenario. As such, I used
binary logistic regression to investigate the research questions below.
Research Questions and Hypotheses
This study addresses the following research questions:
RQ1: To what extent does a senior manger’s technology acceptance, as defined by
perceived ease of use, influence the decision to implement ERP software innovations in
small to medium business settings?
H10: Perceived ease of use of ERP software does not increase the decision to
adopt ERP software.
H1a: Perceived ease of use of ERP software does increase the decision to adopt

43
ERP software.
RQ2: To what extent does a senior manger’s technology acceptance as defined by
perceived usefulness influence his or her decision to implement ERP software
innovations in small to medium business settings?
H20: As perceived usefulness of ERP software increases, the decision to adopt
ERP software will either decrease or remain unchanged.
H2a: As perceived usefulness of ERP software increases, the decision to adopt
Enterprise Resource Planning software will also increase.
RQ3: To what extent does a senior manger’s openness to innovation influence his
or her decision to implement ERP software innovations in small to medium business
settings?
H30: As openness to innovation increases, the decision to adopt ERP software will
either decrease or remain unchanged.
H3a: As openness to innovation increases, the decision to adopt ERP software will
also increase.
RQ4: To what extent does a senior manager’s openness to innovation channel the
relationship between technology acceptance (as defined by perceived ease of use and
perceived usefulness) and the decision to implement Enterprise Resource Planning
software innovations in small to medium business settings?
H40: The effect of perceived ease of use and perceived usefulness on the decision
to adopt Enterprise Resource Planning software is not mediated by openness to
innovation.

44
H4a: The effect of perceived ease of use and perceived usefulness on the decision
to adopt Enterprise Resource Planning software is mediated by openness to innovation.
Setting and Sample
The population that I used for this investigation consisted of senior management
executives in SMB firms that utilize ERP systems software in the United States. Senior
management executives who were at least age 18 were invited to participate in the study.
I generated a sampling frame of 30,000 email addresses of senior management
executives, and used a simple random sample from this sampling frame to identify the
154 individuals selected into the sample. Dixon et al. (2015) defined simple random
sampling as a situation where “every possible combination of cases has an equal chance
of being included in the sample” (p. 159). Dixon et al. went on to propose that simple
random sampling is the preferred probability sampling technique for selecting a sample
that is representative of the population in question, as it is the technique most likely to
satisfy the condition of true randomness in the selection process.
I expected that a random sampling of 10% of the sampling frame would yield a
sufficient number of respondents to ensure that at least 154 viable surveys were returned.
Dillman et al. (2014) noted that internet-based surveys typically yield a response rate of
approximately 5%; given this information, it stood to reason that a random sample of
3,000 executives would result in approximately 150 completed surveys. I obtained a final
sample of 154 completed surveys, which was sufficient for the statistical analysis portion
of the project. A G*Power analysis (Faul, Erdfelder, Buchner, & Lang, 2009) suggested
that this sample size should be adequate. As part of the G*Power calculation, an alpha

45
level of 0.05, a statistical power of 0.95, a conservative effect size of 0.10 and a two-
tailed approach for a regression analysis with 15 predictors was assumed. The resultant
G*Power calculation with these parameters suggested that the minimum sample size
should be 133 respondents. Thus the final sample of 154 respondents exceeded the
minimum sample size needed to detect statistically significant effects in the multivariate
binary logistic regression analysis.
Measures
Dependent Variable
The dependent variable in this investigation was whether or not each participant
in the study made the correct decision concerning the adoption of a new technological
innovation. The question that I used to derive this information was, “In your professional
opinion, should Rockhampton Drapers proceed with the purchase of the new software?” I
coded responses for this question as either “made correct decision to innovate” or “made
incorrect decision to innovate.” The decision to innovate was ultimately based on a
respondent’s decision after reading and considering one of four scenarios linked to the
above question.
I constructed four scenarios (see Appendix A for a complete detailing of each of
the four scenarios) as a way to determine whether or not each respondent made the
correct decision regarding the adoption of a new technological innovation. Each
respondent was randomly assigned to one of the four scenarios, and each scenario asked
participants to consider whether a fictional company should upgrade its ERP systems
software.
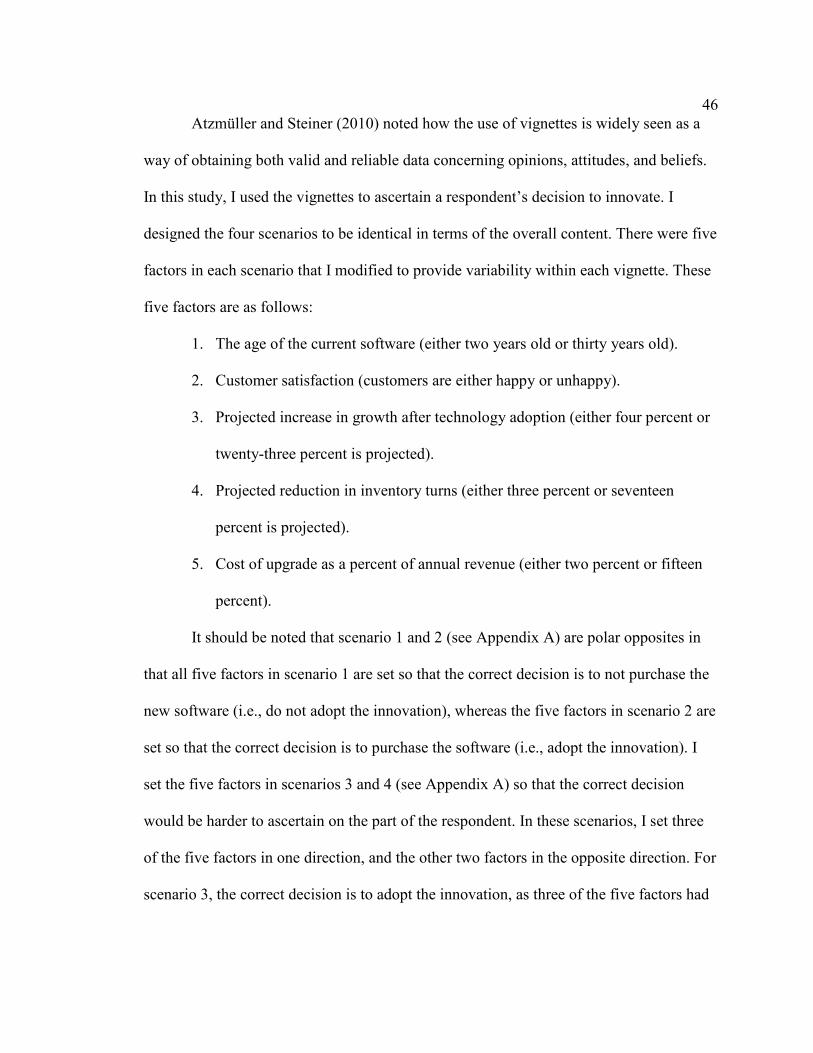
46
Atzmüller and Steiner (2010) noted how the use of vignettes is widely seen as a
way of obtaining both valid and reliable data concerning opinions, attitudes, and beliefs.
In this study, I used the vignettes to ascertain a respondent’s decision to innovate. I
designed the four scenarios to be identical in terms of the overall content. There were five
factors in each scenario that I modified to provide variability within each vignette. These
five factors are as follows:
1. The age of the current software (either two years old or thirty years old).
2. Customer satisfaction (customers are either happy or unhappy).
3. Projected increase in growth after technology adoption (either four percent or
twenty-three percent is projected).
4. Projected reduction in inventory turns (either three percent or seventeen
percent is projected).
5. Cost of upgrade as a percent of annual revenue (either two percent or fifteen
percent).
It should be noted that scenario 1 and 2 (see Appendix A) are polar opposites in
that all five factors in scenario 1 are set so that the correct decision is to not purchase the
new software (i.e., do not adopt the innovation), whereas the five factors in scenario 2 are
set so that the correct decision is to purchase the software (i.e., adopt the innovation). I
set the five factors in scenarios 3 and 4 (see Appendix A) so that the correct decision
would be harder to ascertain on the part of the respondent. In these scenarios, I set three
of the five factors in one direction, and the other two factors in the opposite direction. For
scenario 3, the correct decision is to adopt the innovation, as three of the five factors had
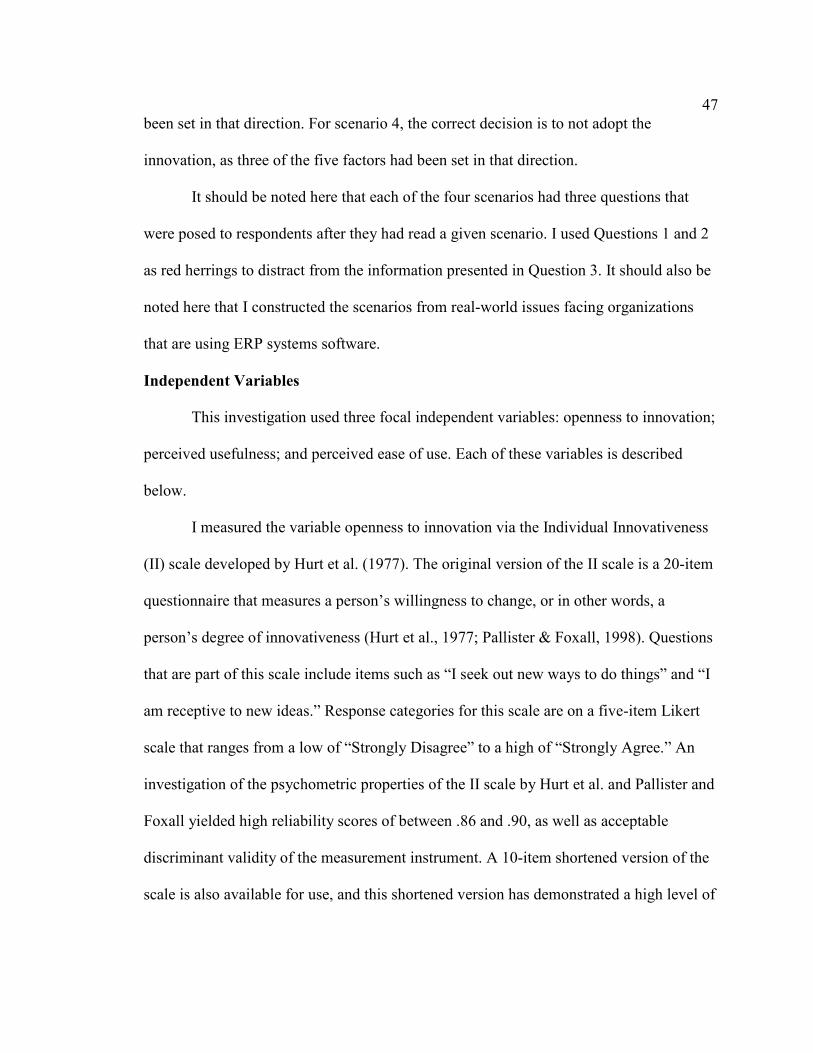
47
been set in that direction. For scenario 4, the correct decision is to not adopt the
innovation, as three of the five factors had been set in that direction.
It should be noted here that each of the four scenarios had three questions that
were posed to respondents after they had read a given scenario. I used Questions 1 and 2
as red herrings to distract from the information presented in Question 3. It should also be
noted here that I constructed the scenarios from real-world issues facing organizations
that are using ERP systems software.
Independent Variables
This investigation used three focal independent variables: openness to innovation;
perceived usefulness; and perceived ease of use. Each of these variables is described
below.
I measured the variable openness to innovation via the Individual Innovativeness
(II) scale developed by Hurt et al. (1977). The original version of the II scale is a 20-item
questionnaire that measures a person’s willingness to change, or in other words, a
person’s degree of innovativeness (Hurt et al., 1977; Pallister & Foxall, 1998). Questions
that are part of this scale include items such as “I seek out new ways to do things” and “I
am receptive to new ideas.” Response categories for this scale are on a five-item Likert
scale that ranges from a low of “Strongly Disagree” to a high of “Strongly Agree.” An
investigation of the psychometric properties of the II scale by Hurt et al. and Pallister and
Foxall yielded high reliability scores of between .86 and .90, as well as acceptable
discriminant validity of the measurement instrument. A 10-item shortened version of the
scale is also available for use, and this shortened version has demonstrated a high level of

48
validity and acceptable reliability (Pallister & Foxall, 1998). Based on this assessment,
the 10-item version of the scale was used in this study.
The variable perceived usefulness was measured via the perceived usefulness
(PU) scale developed by Davis (1989) as part of the TAM. The PU scale is a six-item
scale that is designed to evaluate “the degree to which a person believes that using a
particular [technology] would enhance his or her job performance” (Davis, 1989, p. 320).
Questions that are part of this scale include items such as “using (ITEM) would improve
my job performance” and “I would find (ITEM) useful in my job.” Response categories
for this scale are on a five-item Likert scale that ranges from a low of “Strongly
Disagree” to a high of “Strongly Agree.” The PU scale has been shown to have high
reliability scores across multiple studies (for a review, see Hess, McNab, & Basoglu,
2014). Convergent and discriminant validity of the instrument was also established in two
separate investigations by Davis (1989) and Adams et al. (1992) through the use of a
multitrait, multimethod evaluation technique.
The variable perceived ease of use was measured via the perceived ease of use
(PEU) scale that was also developed by Davis (1989) as part of the TAM. The PEU scale
is a six-item scale that is designed to evaluate “the degree to which a person believes that
using a particular [technology] would be free of effort” (Davis, 1989, p. 320). Questions
that are part of this scale include items such as “learning to operate (ITEM) would be
easy for me” and “I would find (ITEM) to be flexible to interact with.” Response
categories for this scale are on a five-item Likert scale that ranges from a low of
“Strongly Disagree” to a high of “Strongly Agree.” The PEU scale has been shown to

49
have high reliability scores across multiple studies (for a review, see Hess et al., 2014).
Convergent and discriminant validity of the instrument was also established in two
separate investigations by Davis (1989) and Adams et al. (1992) through the use of a
multitrait, multimethod evaluation technique.
Statistical Controls
Several variables were used as statistical controls because of their potential to
confound the relationships between the focal independent variables and the dependent
variable. These variables include demographic factors (such as the respondent’s age,
gender and educational attainment) and information on the nature of the SMB where the
respondent works (such as whether the SMB engages in internet-based commerce and the
number of employees at the SMB). A complete list of all statistical controls to be
employed by this investigation can be found in Appendix A.
Data Collection and Data Analysis
I collected data via an online survey that was programmed into SurveyMonkey.
Appendix A contains the content of the survey that was programmed into
SurveyMonkey. Appendix B contains a final version of the same survey. In order to
ensure that at least 150 senior executives at SMBs participated in the online survey,
survey invitations were sent via email to the 3,000 individuals who were randomly
selected into the sample. In order to maximize the response rate of the survey, a three-
push email contact method was utilized. The three-push email contact method is also
known as the Dillman Tailored Design Method (Dillman et al., 2014). This method sends
an initial invitation email to all potential respondents in a sample. The invitation email

50
contained information on the nature of the survey and a link to the online survey. After
one week elapsed, all potential respondents who did not respond to the first email survey
were re-contacted via a second invitation email. The second invitation email again
contained information on the nature of the survey and a link to the online survey. The
second email also contained additional information regarding how important it is for the
respondent to participate in the survey. After an additional week had elapsed, all potential
respondents who did not respond to the first or second survey were sent a final invitation
email. As before, the third email contained information about the survey and a link to the
survey. The third email also contained notification that the final email was the last
opportunity for the respondent to participate in the survey. All data collection was
suspended one week after the final email was sent.
Once I collected the data, I subjected it to two separate data analysis strategies via
the statistical program SPSS, version 22. The first data analysis strategy involved the
calculation of descriptive statistics, such as means, medians, modes, and standard
deviations (as appropriate). Descriptive statistics elucidate the basic patterns and trends
within the data (Agresti & Franklin, 2012). The second data analysis strategy that I used
was binary logistic regression. I used this technique to investigate whether the propensity
of senior executives to make the correct call concerning the adoption of an innovation is
predicted by the focal independent variables (i.e., openness to innovation, perceived
usefulness, perceived ease of use), net of the statistical control variables. As previously
stated, binary logistic regression is the appropriate analysis technique to use with a
dependent variable that is a dichotomous nominal-level indicator and one or more

51
independent variables (Agresti & Franklin, 2012).
Ethical Protection of Participants
I distributed invitations to participate in the online survey to all potential
respondents via email. Embedded within the invitation email was a link to the online
survey at the SurveyMonkey website. Respondents were allowed to anonymously log
into the survey, thus providing the ethical assurance of anonymity of responses. No
information was recorded in the survey that could potentially link a respondent’s email
address to his or her responses on the survey. Prior to starting the survey, respondents
were presented with an embedded consent form (see Appendix C for a copy of this
consent form). At the end of the consent form was a question that asked potential
respondents if they wished to make a voluntary and informed decision to participate in
the survey. Respondents selecting ‘no’ were directed to the final page of the survey and
thanked for their time. Respondents selecting ‘yes’ proceeded to the first page of the
survey.
All data obtained via the online survey was de-identified data, which means that I
was not able to link a respondent with his or her data. After the survey was finished, I
removed the data from the SurveyMonkey server and transferred to my personal laptop
computer. Once the data was removed from the SurveyMonkey server, I deleted the data
from the server. I subsequently kept all data on a password-protected laptop computer
owned by me. The laptop was stored in a locked cabinet at all times when not in use.
Only I knew the password to the laptop computer, and only I had a key to the locked
cabinet. All data in Chapter 4 will only be reported in aggregate, which means that no
52
data on an individual respondent will be reported. Upon completion of this dissertation
project, I will erase all data from the hard drive of my laptop computer in accordance
with proper IRB procedures.
Summary and Transition
The methodology chapter outlined the process of how participants were selected,
along with the data collection plan used by the current project. The research questions
and associated hypotheses were presented, and the method of how data were used to
investigate each hypothesis was outlined. Articulation of independent and dependent
variables, and the relationships among variables, were discussed, as was the plan to
analyze all data via SPSS version 22. Finally, measures to protect the ethical rights of
research subjects were delineated.
53
Chapter 4: Results
Introduction
The purpose of this quantitative correlational study was to examine whether
openness to innovation, perceived ease of use of a technology, and perceived usefulness
of a technology leads to the effective implementation of ERP software systems in SMB
environments, controlling for the variables of the number of employees at a company,
whether the company engages in internet commerce, and the age, gender, and educational
attainment of the respondent. The data analyses and statistical results I used to investigate
the primary research questions are presented in this chapter. I present data preparation
steps below, followed by a discussion the variables and methods I used to investigate the
specific tenets of each research question. I then present descriptive statistics and an
overview of Cronbach alpha reliability estimations, and conclude by presenting
regression in the context of the four research questions.
Data Preparation
In order to ensure that at least 150 senior executives of SMBs participated in the
online survey, I sent survey invitations via email to the 3,000 individuals who were
randomly selected into the sample. I used a three-push email contact method to maximize
the response rate of the survey. The three-push email contact method is also known as the
Dillman Tailored Design Method (Dillman et al., 2014). Using this method, I sent an
initial invitation email to all potential respondents in a sample. The invitation email
contained information about the nature of the survey and a link to the online survey. After
one week elapsed, I again contacted all potential respondents who did not respond to the
54
first email survey via a second invitation email. The second invitation email again
contained information on the nature of the survey and a link to the online survey. The
second email also contained additional information regarding how important it is for the
respondent to participate in the survey. After an additional week had elapsed, I sent a
final invitation email to all potential respondents who did not respond to the first or
second survey. As before, the third email contained information about the survey and a
link to the survey. The third email also contained notification that the final email was the
last opportunity for the respondent to participate in the survey. I suspended all data
collection one week after sending the final email.
Prior to all statistical analyses, I determined that the analyses should only be
conducted on individuals who provided complete responses to all questions in the survey.
Thus, I included in the final dataset only individuals who had valid data points for all of
the questions asked.
There were a total of 198 individuals who initiated participation in the survey. Of
these individuals, three indicated that they did not wish to proceed with the survey when
presented with the consent form. Another 41 respondents terminated their participation
prior to the completion of the survey. Thus the final sample I used for purposes of all data
analyses was 154 completed surveys. The difference between the total number of
individuals who initiated the survey and the total number of completed surveys was 44.
This difference represents a 22.2% attrition between the total number of individuals who
initiated participation within the survey and those individuals who completed all survey
questions.

55
I constructed three scales for use in this investigation: the perceived ease of use
(PEU) scale, the perceived usefulness (PU) scale, and the individual innovativeness (II)
scale. I constructed these scales by adding together all scale items and then dividing by
the total number of scale items present. For example, the PEU scale is comprised of six
questions. I added these six questions were added together, and then divided the resultant
sum by the total number of questions present (i.e., divided by 6). Using this strategy
allowed me to carry the measurement metric of the PEU scale questions through to the
final calculated scale. Thus, the PEU scale is measured on a five-point metric, where a
score of 1 equals “Strongly Disagree” and a score of 5 equals “Strongly Agree.” Higher
scores for this scale indicate higher levels of importance. The same logic articulated for
the PEU scale also applies to the PU and II scales, as they are both measured on the same
five-point metric where a score of 1 equals “Strongly Disagree” and a score of 5 equals
“Strongly Agree.”
I created the dependent variable in this investigation (whether the respondent used
the correct decision to adopt the innovation) as a combination of the scenario a
respondent was assigned and the answer the respondent provided to Question 4 of the
survey which asked, “In your professional opinion, should Rockhampton Drapers
proceed with the purchase of the new software” (see Appendix B). The correct answer for
scenarios 1 and 4 was to not adopt the innovation, whereas the correct answer for
scenarios 2 and 3 was to adopt the innovation. If the respondent made the correct decision
with his or her randomly assigned scenario, I coded the dependent variable as “1 -
Correct decision was made.” If the respondent made an incorrect decision with his or her
56
randomly assigned scenario, I coded the dependent variable as “0 - Incorrect decision was
made.”
Research Questions and Variables Used
In this study, I sought to determine whether openness to innovation, as measured
by the individual innovativeness scale, leads to the effective implementation of ERP
software systems in SMB environments (i.e., the correct decision to adopt a software
innovation), controlling for the variables perceived ease of use, perceived usefulness, the
number of employees at a company, whether the company engages in internet commerce,
and the age, gender, and educational attainment of the respondent. In order to effectively
examine these ideas, the following research questions and hypotheses were constructed.
RQ1: To what extent does a senior manger’s technology acceptance, as defined by
perceived ease of use, influence the decision to implement ERP software innovations in
small to medium business settings?
In order to empirically investigate RQ1, I developed the following hypotheses:
H10: Perceived ease of use of ERP software does not increase the decision to
adopt ERP software.
H1a: Perceived ease of use of ERP software does increase the decision to adopt
ERP software.
For the first research question, I measured the dependent variable of whether or
not a respondent made the correct decision to adopt an ERP software innovation as a
dichotomous nominal-level indicator that identified whether a responded made the
correct decision as a function of the scenario to which they were assigned. For this

57
variable, I coded making the correct decision as “1” and making the incorrect decision as
“0.”
For RQ1, I used multiple independent variables (e.g., perceived ease of use, the
number of employees at a company, whether the company engages in internet commerce,
and the age, gender, and educational attainment of the respondent) to predict whether or
not a respondent made the correct decision to adopt the ERP software innovation.
Because the dependent variable for RQ1 was a dichotomous binary indicator, and
because RQ1 used multiple independent variables, a binary logistic regression technique
was the optimal approach for investigating the above research question. As Agresti and
Franklin (2012) have proposed, binary logistic regression is the correct method to use
when one has a single dependent variable and multiple independent variables. Agresti
and Franklin (2012) further noted that binary logistic regression requires a dependent
variable that is measured at a nominal level and has been reduced to a 0/1 coding scheme,
two conditions that are satisfied in the current analysis scenario. As such, I used binary
logistic regression as the analysis technique to investigate RQ1.
RQ2: To what extent does a senior manger’s technology acceptance as defined by
perceived usefulness influence his or her decision to implement ERP software
innovations in small to medium business settings?
In order to empirically investigate RQ2, I developed the following hypotheses:
H20: As perceived usefulness of ERP software increases, the decision to adopt
ERP software will either decrease or remain unchanged.

58
H2a: As perceived usefulness of ERP software increases, the decision to adopt
Enterprise Resource Planning software will also increase.
For the second research question, the dependent variable of whether or not a
respondent made the correct decision to adopt an ERP software innovation was measured
as a dichotomous nominal-level indicator that identified whether a responded made the
correct decision as a function of the scenario to which they were assigned. For this
variable, I coded making the correct decision as “1” and making the incorrect decision as
“0.”
For RQ2 I used multiple independent variables (e.g., perceived usefulness, the
number of employees at a company, whether the company engages in internet commerce,
and the age, gender, and educational attainment of the respondent) to predict whether or
not a respondent made the correct decision to adopt the ERP software innovation.
Because the dependent variable for RQ2 was a dichotomous binary indicator, and
because RQ2 used multiple independent variables, a binary logistic regression technique
was again the optimal approach for investigating the above research question. As Agresti
and Franklin (2012) have proposed, binary logistic regression is the correct method to use
when one has a single dependent variable and multiple independent variables. Agresti
and Franklin further noted that binary logistic regression requires a dependent variable
that is measured at a nominal level and has been reduced to a 0/1 coding scheme, two
conditions that are satisfied in the current analysis scenario. As such, I used binary
logistic regression as the analysis technique to investigate RQ2.
RQ3: To what extent does a senior manger’s openness to innovation influence his
59
or her decision to implement ERP software innovations in small to medium business
settings?
In order to empirically investigate RQ3, I developed the following hypotheses:
H30: As openness to innovation increases, the decision to adopt ERP software will
either decrease or remain unchanged.
H3a: As openness to innovation increases, the decision to adopt ERP software will
also increase.
For the third research question, I measured the dependent variable of whether or
not a respondent made the correct decision to adopt an ERP software innovation as a
dichotomous nominal-level indicator that identified whether a responded made the
correct decision as a function of the scenario to which they were assigned. For this
variable, I coded making the correct decision as “1” and making the incorrect decision as
“0.”
For RQ3 I used multiple independent variables (e.g., openness to innovation, the
number of employees at a company, whether the company engages in internet commerce,
and the age, gender, and educational attainment of the respondent) to predict whether or
not a respondent made the correct decision to adopt the ERP software innovation.
Because the dependent variable for RQ3 was a dichotomous binary indicator, and
because RQ3 used multiple independent variables, a binary logistic regression technique
was the optimal approach for investigating the above research question. As Agresti and
Franklin (2012) have proposed, binary logistic regression is the correct method to use
when one has a single dependent variable and multiple independent variables. Agresti
60
and Franklin further noted that binary logistic regression requires a dependent variable
that is measured at a nominal level and has been reduced to a 0/1 coding scheme, two
conditions that are satisfied in the current analysis scenario. As such, I used binary
logistic regression as the analysis technique to investigate RQ3.
RQ4: To what extent does a senior manager’s openness to innovation channel the
relationship between technology acceptance (as defined by perceived ease of use and
perceived usefulness) and the decision to implement Enterprise Resource Planning
software innovations in small to medium business settings?
In order to empirically investigate RQ4, I developed the following hypotheses:
H40: The effect of perceived ease of use and perceived usefulness on the decision
to adopt Enterprise Resource Planning software is not mediated by openness to
innovation.
H4a: The effect of perceived ease of use and perceived usefulness on the decision
to adopt Enterprise Resource Planning software is mediated by openness to innovation.
For the fourth research question, there were two dependent variables: openness to
innovation and the decision to adopt ERP software. The first dependent variable
functioned as a mediator through which the effects of perceived ease of use and perceived
usefulness were channeled. The second dependent variable served as the penultimate
dependent variable within the statistical model; that is, the decision concerning whether
or not to adopt the ERP software innovation.
In the case where openness to innovation was the dependent variable, a multiple
linear regression was required. This is because openness to innovation is operationalized

61
via the Individual Innovativeness (II) scale. The II scale is measured on a five-point
continuous Likert scale that ranges from a low value of “Strongly Disagree” (coded as 1)
to a high value of “Strongly Agree” (coded as 5). In addition, in RQ4 I used multiple
independent variables (e.g., perceived ease of use, perceived usefulness, the number of
employees at a company, whether the company engages in internet commerce, and the
age, gender, and educational attainment of the respondent) to predict the value of
openness to innovation as measured by the II scale. Given these facts, a multiple linear
regression technique was the optimal approach for investigating the tenets of RQ4 where
openness to innovation was the dependent variable. Agresti and Franklin (2012) proposed
that multiple linear regression is the correct method to use when one has a single
dependent variable and multiple independent variables. Agresti and Franklin further
noted that multiple linear regression requires a dependent variable that is measured at
either an interval or ratio level (i.e., a continuous level), a condition that is satisfied when
using a Likert scale. As such, I used multiple linear regression as the analysis technique
to investigate the aspects of RQ4 that involved openness to innovation as the dependent
variable.
In the fourth research question I also used whether or not a respondent made the
correct decision to adopt an ERP software innovation as a dependent variable. As
previously noted, I measured this variable as a dichotomous nominal-level indicator that
identified whether a responded made the correct decision as a function of the scenario to
which they were assigned. For this variable, I coded making the correct decision as “1”
and making the incorrect decision was coded as “0.”
62
In RQ4 I used multiple independent variables (e.g., perceived ease of use,
perceived usefulness, openness to innovation, the number of employees at a company,
whether the company engages in internet commerce, and the age, gender, and educational
attainment of the respondent) to predict whether or not a respondent made the correct
decision to adopt the ERP software innovation. Because the dependent variable for the
second part of RQ4 was a dichotomous binary indicator, and because RQ4 used multiple
independent variables, a binary logistic regression technique was the optimal approach
for investigating this question in which the decision to adopt an ERP software innovation
served as the dependent variable. As Agresti and Franklin (2012) have proposed, binary
logistic regression is the correct method to use when one has a single dependent variable
and multiple independent variables. Agresti and Franklin further noted that binary logistic
regression requires a dependent variable that is measured at a nominal level and has been
reduced to a 0/1 coding scheme, two conditions that are satisfied in the current analysis
scenario. As such, I used binary logistic regression as the analysis technique to
investigate RQ4 with respect to use of the decision to adopt the ERP software innovation
as the dependent variable.
Descriptive Statistics
Table 1 presents the percentages and frequencies for all categorical variables used
in the current investigation. As Table 1 shows, two out of every three respondents
(68.8%) were male. Only four in every ten respondents (42.9%) indicated that their
company engages in Internet- based commerce. Nearly three out of every four
respondents (73.4%) have at least a bachelor’s degree, with one in five (20.1%) having a

63
master’s degree and one in every fifteen respondents having either a doctoral degree
(1.3%) or a professional degree (5.2%). With respect to the dependent variable, roughly
seven out of every ten respondents (69.5%) made the correct decision to adopt the ERP
software innovation.
Table 1
Percentages and Frequencies, Study Variables
Frequenc
y Percent
Biological sex of respondent
Male 106 68.8%
Female 48 31.2%
Company engages in Internet-based commerce
Yes 66 42.9%
No 88 57.1%
Education level of respondent in years
At least a high school diploma 9 5.8%
Some college, but no degree 32 20.8%
Bachelor’s degree 72 46.8%
Master’s degree 31 20.1%
Doctoral degree 2 1.3%
Professional degree 8 5.2%
Dependent variable: Did respondent make correct decision?
No 47 30.5%
Yes 107 69.5%
N 154 100.0%
Table 2 presents the means and standard deviations for all continuous variables
used in the current investigation. As Table 2 reveals, the average age of respondents was
just slightly more than 52 years old, with a range of 28 years old to 73 years old. The
average number of employees at a respondent’s company is 634, with a range of 1
employee to 60,000 employees.
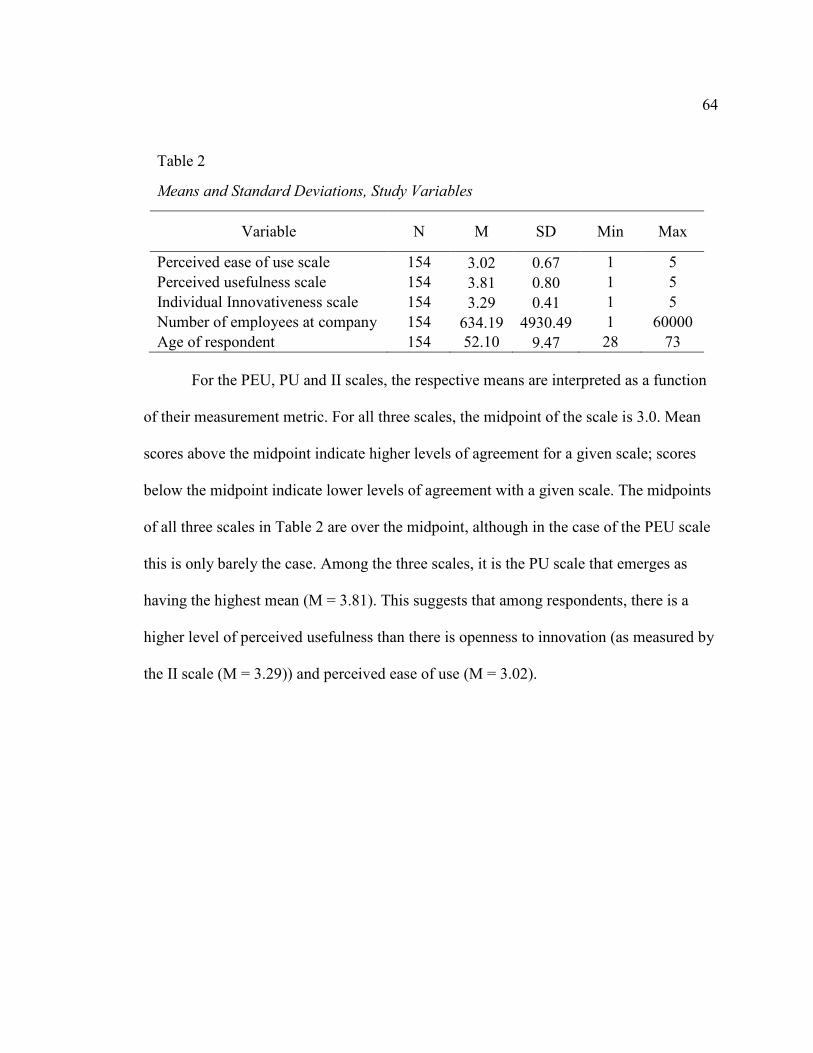
64
Table 2
Means and Standard Deviations, Study Variables
Variable N M SD Min Max
Perceived ease of use scale 154 3.02 0.67 1 5
Perceived usefulness scale 154 3.81 0.80 1 5
Individual Innovativeness scale 154 3.29 0.41 1 5
Number of employees at company 154 634.19 4930.49 1 60000
Age of respondent 154 52.10 9.47 28 73
For the PEU, PU and II scales, the respective means are interpreted as a function
of their measurement metric. For all three scales, the midpoint of the scale is 3.0. Mean
scores above the midpoint indicate higher levels of agreement for a given scale; scores
below the midpoint indicate lower levels of agreement with a given scale. The midpoints
of all three scales in Table 2 are over the midpoint, although in the case of the PEU scale
this is only barely the case. Among the three scales, it is the PU scale that emerges as
having the highest mean (M = 3.81). This suggests that among respondents, there is a
higher level of perceived usefulness than there is openness to innovation (as measured by
the II scale (M = 3.29)) and perceived ease of use (M = 3.02).

65
Table 3
Bivariate Correlations Among All Variables
Variables 1 2 3 4 5 6 7 8 9
1 1.00
2 -0.10 1.00
3 -0.10 0.28 ** 1.00
4 -0.02 0.03 0.15 1.00
5 0.06 0.00 0.13 0.05 1.00
6 0.03 0.07 0.14 0.04 0.12 1.00
7 -0.05 0.16 * 0.07 -0.13 -0.16 * -0.07 1.00
8 0.16 -0.08 -0.10 -0.20 * -0.12 -0.12 0.23 ** 1.00
9 0.00 -0.07 0.16 * 0.05 0.01 0.01 0.02 0.07 1.00
Note: * < p .05; ** < p .01; *** < p .001, two-tailed tests.
Key for variables in Table 3:
1. Dependent variable: Decision to innovate 6. Company engages in Internet-based commerce
2. Perceived ease of use scale 7. Biological sex of respondent
3. Perceived usefulness scale 8. Age of respondent
4. Individual innovativeness scale 9. Education level of respondent in years
5. Number of employees at company
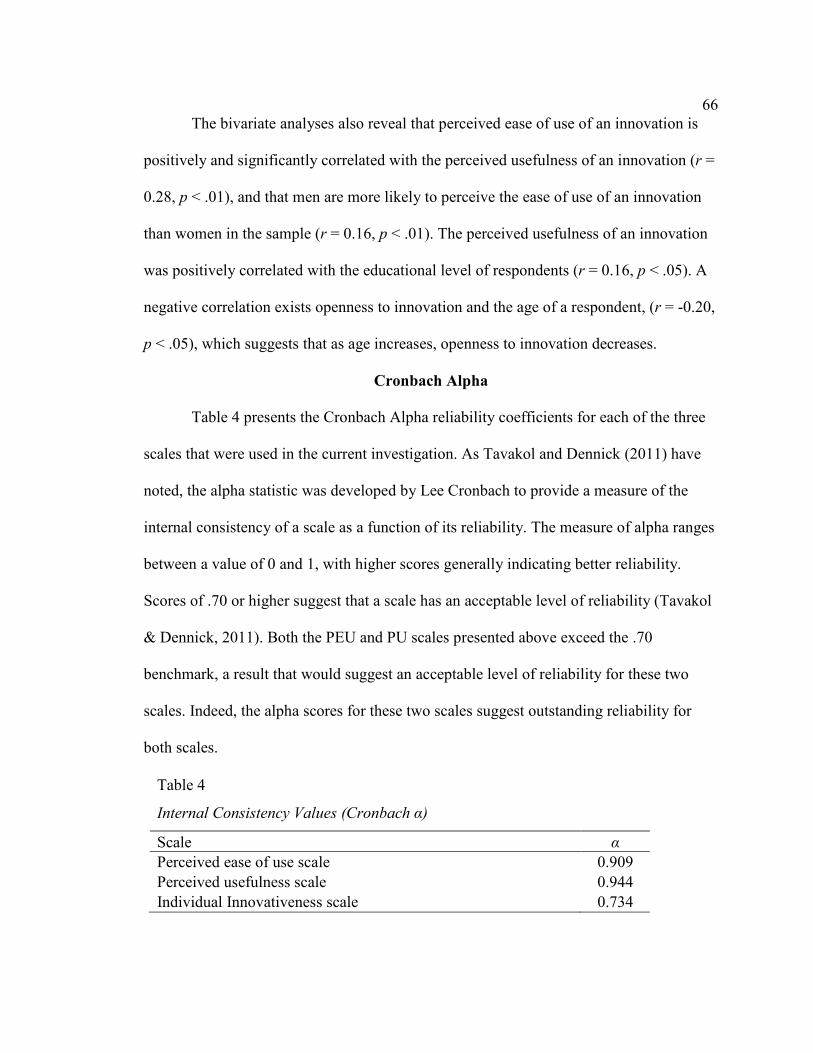
66
The bivariate analyses also reveal that perceived ease of use of an innovation is
positively and significantly correlated with the perceived usefulness of an innovation (r =
0.28, p < .01), and that men are more likely to perceive the ease of use of an innovation
than women in the sample (r = 0.16, p < .01). The perceived usefulness of an innovation
was positively correlated with the educational level of respondents (r = 0.16, p < .05). A
negative correlation exists openness to innovation and the age of a respondent, (r = -0.20,
p < .05), which suggests that as age increases, openness to innovation decreases.
Cronbach Alpha
Table 4 presents the Cronbach Alpha reliability coefficients for each of the three
scales that were used in the current investigation. As Tavakol and Dennick (2011) have
noted, the alpha statistic was developed by Lee Cronbach to provide a measure of the
internal consistency of a scale as a function of its reliability. The measure of alpha ranges
between a value of 0 and 1, with higher scores generally indicating better reliability.
Scores of .70 or higher suggest that a scale has an acceptable level of reliability (Tavakol
& Dennick, 2011). Both the PEU and PU scales presented above exceed the .70
benchmark, a result that would suggest an acceptable level of reliability for these two
scales. Indeed, the alpha scores for these two scales suggest outstanding reliability for
both scales.
Table 4
Internal Consistency Values (Cronbach α)
Scale α
Perceived ease of use scale 0.909
Perceived usefulness scale 0.944
Individual Innovativeness scale 0.734

67
It should be noted that the original alpha score of the II scale was below the
acceptable benchmark of .70. In a situation where a scale has an unacceptable level of
reliability, it is recommend that individual scale questions be removed one at a time until
there is a sufficient rise in alpha reliability to clear the .70 benchmark (Tavakol &
Dennick, 2011). To this end, I removed Question 9 from the II scale. The removal of
Question 9 from the scale resulted in an increase in Cronbach alpha reliability from .650
to .734.
Regression Results
Tables 5 and 6 present the results of the binary logistic regression and multiple
linear regression equations that were used to investigate the tenets of the four research
questions. The results of each of the four research hypothesis tests are presented below.
H10: Perceived ease of use of ERP software does not increase the decision to
adopt ERP software.
H1a: Perceived ease of use of ERP software does increase the decision to adopt
ERP software.
H20: As perceived usefulness of ERP software increases, the decision to adopt
ERP software will either decrease or remain unchanged.
H2a: As perceived usefulness of ERP software increases, the decision to adopt
Enterprise Resource Planning software will also increase.
Model 1 of Table 5 presents the binary logistic regression of decision to innovate
onto the various independent predictors. In this aspect of the analysis I focused on the
direct impact that perceived ease of use and perceived usefulness have on the decision to

68
innovate, controlling for the factors of the number of employees at a company, whether
the company engages in internet commerce, and the age, gender, and educational
attainment of the respondent. I also utilized Model 1 to investigate the tenets of
Hypothesis 1 and Hypothesis 2.
The first parameter of interest in Model 1 of Table 5 is the chi-square goodness of
fit indicator. As Agresti and Franklin (2012) noted, this statistic is an omnibus check of
the overall predictive validity of the entire model. The omnibus chi-square goodness of fit
indicator is statistically nonsignificant (Χ2 = 8.113; df = 7; p > .05), which suggests that
none of the predictors in the Model 1 equation have a statistically significant impact upon
the dependent variable in the model. As Agresti and Franklin (2012) proposed, when the
omnibus chi-square goodness of fit indicator is nonsignificant, further decomposition of
effects in a binary logistic regression equation is rendered moot. There is thus no
evidence to suggest that perceived ease of use of ERP software and perceived usefulness
of ERP software will increase the decision to adopt ERP software, controlling for the
factors of the number of employees at a company, whether the company engages in
internet commerce, and the age, gender, and educational attainment of the respondent. On
the basis of the evidence, it can be concluded that there is no support from the data for
RQ1 or RQ2.
H30: As openness to innovation increases, the decision to adopt ERP software will
either decrease or remain unchanged.
H3a: As openness to innovation increases, the decision to adopt ERP software will
also increase.

69
Model 2 of Table 5 presents the binary logistic regression of decision to innovate
onto the various independent predictors. In Model 2 I focused on the direct impact that
openness to innovation has on the decision to innovate, controlling for the factors of the
number of employees at a company, whether the company engages in internet commerce,
and the age, gender, and educational attainment of the respondent. I utilized Model 2 to
investigate the tenets of H3.
The first parameter of interest in Model 2 of Table 5 is the chi-square goodness of
fit indicator. As Agresti and Franklin (2012) noted, this statistic is an omnibus check of
the overall predictive validity of the entire model. The omnibus chi-square goodness of fit
indicator is statistically nonsignificant (Χ2 = 6.414; df = 6; p > .05), which suggests that
none of the predictors in the Model 2 equation have a statistically significant impact upon
the dependent variable in the model. As Agresti and Franklin (2012) noted, when the
omnibus chi-square goodness of fit indicator is nonsignificant, further decomposition of
effects in a binary logistic regression equation is rendered moot. There thus is no
evidence to suggest that openness to innovation will increase the decision to adopt ERP
software, controlling for the factors of the number of employees at a company, whether
the company engages in Internet commerce, and the age, gender, and educational
attainment of the respondent. On the basis of the evidence, it can be concluded that there
is no support from the data for RQ3.
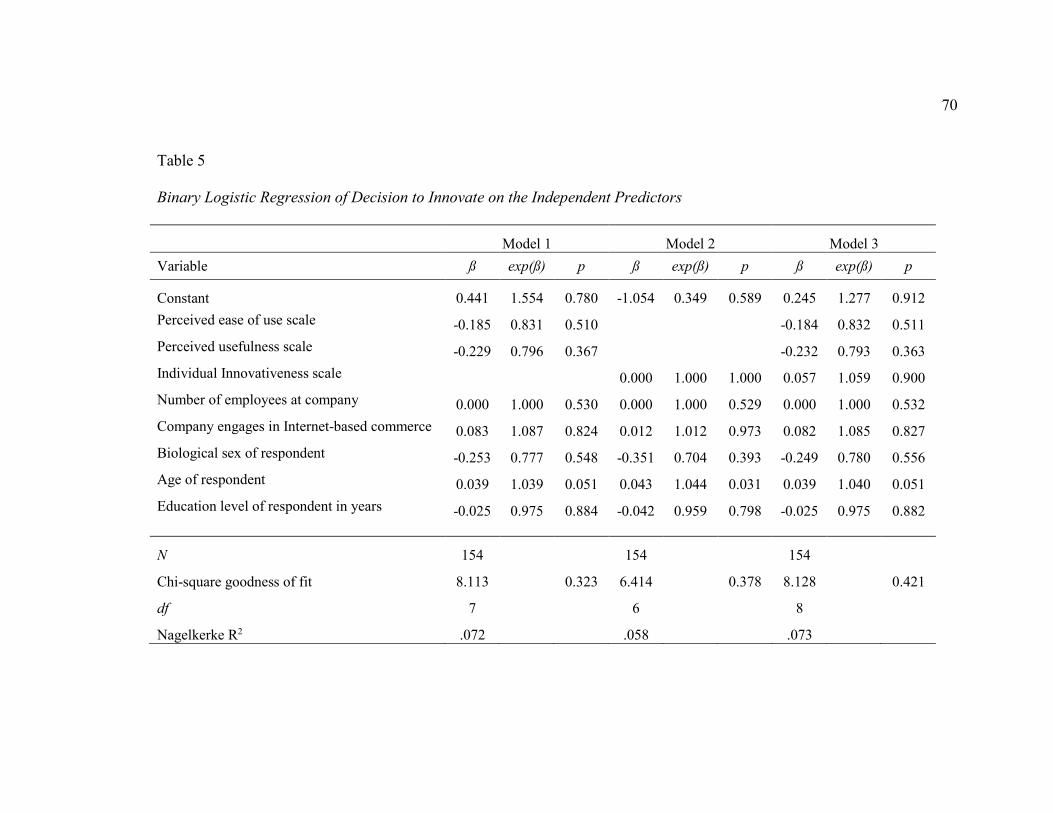
70
Table 5 Binary Logistic Regression of Decision to Innovate on the Independent Predictors
Model 1 Model 2 Model 3
Variable ß exp(ß) p ß exp(ß) p ß exp(ß) p
Constant 0.441 1.554 0.780 -1.054 0.349 0.589 0.245 1.277 0.912
Perceived ease of use scale -0.185 0.831 0.510 -0.184 0.832 0.511
Perceived usefulness scale -0.229 0.796 0.367 -0.232 0.793 0.363
Individual Innovativeness scale 0.000 1.000 1.000 0.057 1.059 0.900
Number of employees at company 0.000 1.000 0.530 0.000 1.000 0.529 0.000 1.000 0.532
Company engages in Internet-based commerce 0.083 1.087 0.824 0.012 1.012 0.973 0.082 1.085 0.827
Biological sex of respondent -0.253 0.777 0.548 -0.351 0.704 0.393 -0.249 0.780 0.556
Age of respondent 0.039 1.039 0.051 0.043 1.044 0.031 0.039 1.040 0.051
Education level of respondent in years -0.025 0.975 0.884 -0.042 0.959 0.798 -0.025 0.975 0.882
N 154 154 154
Chi-square goodness of fit 8.113 0.323 6.414 0.378 8.128 0.421
df 7 6 8
Nagelkerke R2 .072 .058 .073

71
H40: The effect of perceived ease of use and perceived usefulness on the decision
to adopt Enterprise Resource Planning software is not mediated by openness to
innovation.
H4a: The effect of perceived ease of use and perceived usefulness on the decision
to adopt Enterprise Resource Planning software is mediated by openness to innovation.
Model 3 of Table 5 presents the binary logistic regression of decision to innovate
onto the various independent predictors. In Model 3 I focused on the direct impact that
openness to innovation has on the decision to innovate, controlling for the factors of
perceived ease of use, perceived usefulness, the number of employees at a company,
whether the company engages in Internet commerce, and the age, gender, and educational
attainment of the respondent. I utilized Model 3 to investigate the tenets of H4.
The first parameter of interest in Model 3 of Table 5 is the chi-square goodness of
fit indicator. As Agresti and Franklin (2012) noted, this statistic is an omnibus check of
the overall predictive validity of the entire model. The omnibus chi-square goodness of fit
indicator is statistically nonsignificant (Χ2 = 8.128; df = 8; p > .05), which suggests that
none of the predictors in Model 3 equation have a statistically significant impact upon the
dependent variable in the model. As Agresti and Franklin (2012) proposed, when the
omnibus chi-square goodness of fit indicator is nonsignificant, further decomposition of
effects in a binary logistic regression equation is rendered moot. There is thus no
evidence to suggest that perceived ease of use, perceived usefulness, and openness to
innovation will increase the decision to adopt ERP software, controlling for the factors of
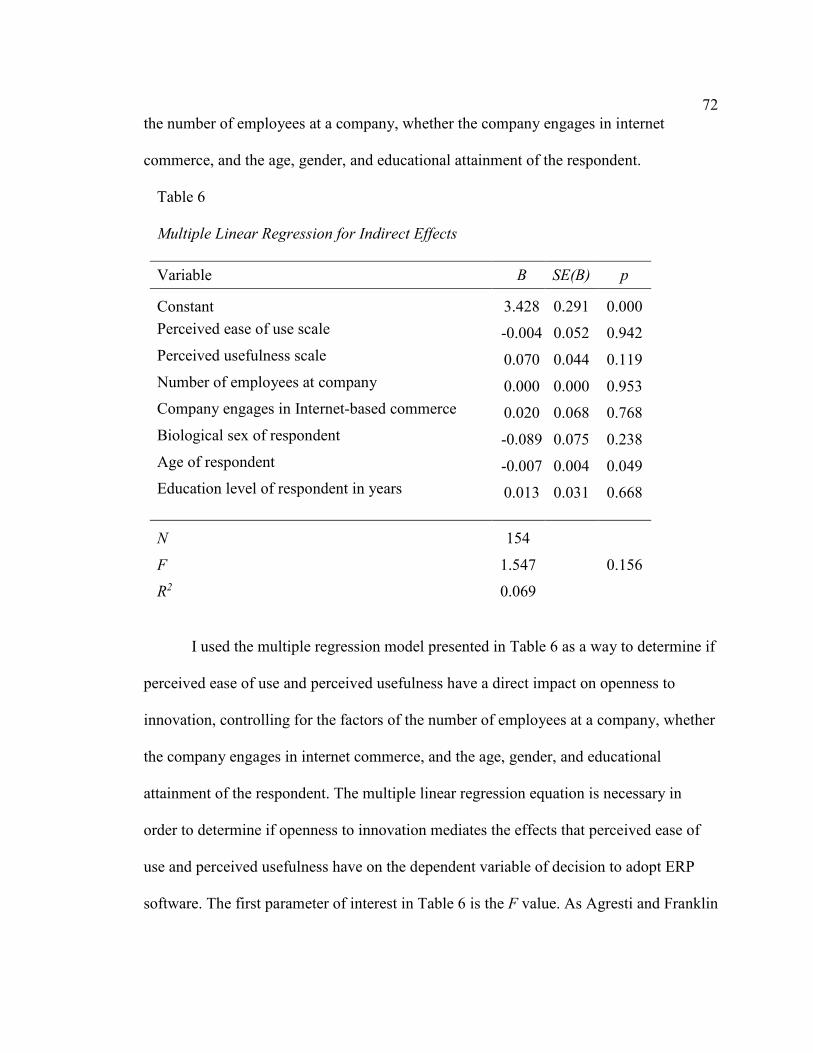
72
the number of employees at a company, whether the company engages in internet
commerce, and the age, gender, and educational attainment of the respondent.
Table 6 Multiple Linear Regression for Indirect Effects
Variable B SE(B) p
Constant 3.428 0.291 0.000
Perceived ease of use scale -0.004 0.052 0.942
Perceived usefulness scale 0.070 0.044 0.119
Number of employees at company 0.000 0.000 0.953
Company engages in Internet-based commerce 0.020 0.068 0.768
Biological sex of respondent -0.089 0.075 0.238
Age of respondent -0.007 0.004 0.049
Education level of respondent in years 0.013 0.031 0.668
N 154
F 1.547 0.156
R2 0.069
I used the multiple regression model presented in Table 6 as a way to determine if
perceived ease of use and perceived usefulness have a direct impact on openness to
innovation, controlling for the factors of the number of employees at a company, whether
the company engages in internet commerce, and the age, gender, and educational
attainment of the respondent. The multiple linear regression equation is necessary in
order to determine if openness to innovation mediates the effects that perceived ease of
use and perceived usefulness have on the dependent variable of decision to adopt ERP
software. The first parameter of interest in Table 6 is the F value. As Agresti and Franklin

73
(2012) noted, this statistic is an omnibus ANOVA F-test check of the overall predictive
validity of the entire model. As can be seen in Table 6, the F value is statistically
nonsignificant (F = 1.547; df = 7, 146; p > .05), which suggests that none of the
predictors in the Table 6 equation have a statistically significant impact upon the
dependent variable in the model. As Agresti and Franklin proposed, when the omnibus
ANOVA F-test is nonsignificant, further decomposition of effects in a multiple linear
regression equation are rendered moot. There is thus no evidence to suggest that the
effect perceived ease of use perceived usefulness have on the decision to adopt ERP
software is mediated by openness to innovation, controlling for the factors of the number
of employees at a company, whether the company engages in internet commerce, and the
age, gender, and educational attainment of the respondent.
Figure 3. Statistical mediation effects, net of controls.
When the evidence in Model 3 of Table 4 is combined with the evidence in Table
5, it can be concluded that (a) there is no statistically significant direct effect of perceived
ease of use and perceived usefulness on openness to innovation, and that (b) there is no
statistically significant direct effect of openness to innovation on the decision to adopt
Perceived
Ease of Use
Perceived
Usefulness
Openness to
Innovation
Decision to
Innovate
-0.185
-0.229
0.057
-0.004
.070

74
ERP software. By definition, the absence of direct effects in a mediation model means
that there are no indirect effects (i.e., no mediation effect) present within the model
(Hayes, 2013). Evidence of this is presented graphically in Figure 3. On the basis of the
evidence, it can be concluded that there is no support from the data for RQ4.
Summary and Transition
This chapter presented an overview of the data preparation techniques used by the
current investigation. It also included a discussion of the specific techniques used to
analyze each research question. Descriptive statistics provided information on the basic
patterns within the data for each variable, and Cronbach alpha estimates were used to
demonstrate the reliability of the three scales used in the current investigation. I
investigated all four research questions via binary logistic regression, and estimated
mediation effects via multiple linear regression. I then related the findings of the data
back to the hypotheses. In Chapter 5 I will present a discussion of the results, draw
conclusions based on the results, and offer recommendations that future researchers may
wish to consider.

75
Chapter 5: Discussion, Conclusions, and Recommendations
Introduction
The correct identification of the presence (or absence) of ERP software system
problems is essential when making decisions that will lead to software adoption and
innovation (Murray, 2012; Winsor, 2012). As I have noted throughout this dissertation,
there is thus a need for senior managers of SMBs to correctly identify whether or not
ERP software system problems exist. Instead of focusing on obtaining newly released
software innovations, researchers have suggested that senior managers should instead
seek to implement technological changes that enable the smooth and efficient operation
of an SMB (Bernroidera et al., 2013; Maditinos et al., 2012; Ruivo et al., 2012; Xu et al.,
2011).
One of the problems with any ERP software adoption is that management may
believe that purchasing new technologies will solve most (if not all) ERP software system
issues. Indeed, management sometimes obtains new software technologies for the sake of
simply having them (Grabski et al., 2011; Weng & Hung, 2014). When senior managers
of firms frame their businesses’ software problems incorrectly in their search for new
technological innovations, they may overlook the organizational aspects of change in
ERP systems implementation, as well as possible negative consequences (such as the
wasting of capital resources, the wasting of time, and the wasting of effort on improper
software adoption) that may follow (Chiwamit et al., 2014; Hastie & Dawes, 2010).
In this project, I investigated if the degree to which a senior manager is open to a
given systems management technological innovation impacts their decision concerning
76
the adoption of a technological innovation. I also investigated the problem of whether or
not the perceived ease of use and perceived usefulness of the systems management
innovation influenced a senior manager’s decision to innovate. It has been suggested that
openness to innovation, the perceived ease of a technology, and the perceived usefulness
of a technology play a part in the decision to adopt a given technological innovation
within a SMB environment (Davis, 1989; Avci-Yücel & Gülbahar, 2013; Marangunić &
Granić, 2014).
I drew from these proposals to argue that a senior manager’s perceptions
concerning the ease of use and usefulness of ERP systems software may play a part in
guiding his or her decision to adopt a new technological innovation. The purpose of this
dissertation project was to investigate if senior managers in SMBs were able to correctly
identify whether or not to adopt innovations relating to ERP systems software.
Specifically, the purpose of this quantitative study was to examine the research question
of whether openness to innovation, as measured by the individual innovativeness scale,
leads to the effective implementation of ERP software systems in SMB environments,
controlling for the variables perceived ease of use, perceived usefulness, the number of
employees at a company, whether the company engages in internet commerce, and the
age, gender, and educational attainment of the respondent.
To achieve this end, I sought to discover if there was a relationship between the
decision to innovate and a technology’s perceived ease of use, a technology’s perceived
usefulness, and a manager’s openness to innovation among senior managers of SMBs. An
investigation of this scope is important, especially when one considers that software
77
implementation decisions on the part of senior management can cause businesses to lose
significant revenue (Venkatesh et al., 2012). As such, the identification of whether senior
managers properly identify ERP software systems technology implementation decisions
is of critical importance to the health and wellbeing of SMBs.
For this study I utilized an online survey to gather data from a random sample of
154 senior executives of SMBs in the United States. I used binary logistic regression to
examine the relationship between the key independent variables of perceived ease of
technology use, perceived usefulness of the technology, openness to innovation and the
dependent variable of the decision to innovate, net of the statistical controls.
The results of this quantitative project indicated that perceived ease of use,
perceived usefulness, and openness to innovation do not impact the decision to innovate.
The positive social change outcomes of this study suggest that decision makers should
become more aware of factors that promote constructive and effective identification of
how to remediate problems in management accounting.
In Chapter 5 I present a summary of the statistical results and an interpretation of
the statistical findings in relation to the four primary research questions. I also present
and discuss possible explanations for the lack of any statistically significant results in this
investigation. This discussion is followed by recommendations for future research and an
overview of the implications for social change associated with the findings of the project.
The chapter finishes with a summary and conclusion.

78
Interpretation of Findings
In order to ensure that at least 150 senior executives of SMBs participated in the
online survey, I sent survey invitations via email to the 3,000 individuals who were
randomly selected into the sample. I used a three-push email contact method, also known
as the Dillman Tailored Design Method (Dillman et al., 2014), to maximize the response
rate. A total of 154 participants out of the 198 who responded were included in the final
data analyses because 41 did not complete the survey and three indicated that they did not
wish to proceed with the survey when presented with the consent form.
Statistical analysis of the data revealed that the average respondent was a middle-
aged male who had a college degree and worked at a company that had slightly more than
600 employees and which had no Internet commerce. Seven out of every 10 respondents
made the correct decision concerning whether or not to adopt the ERP software
innovation with respect to the vignette they were presented in the survey. I used binary
logistic regression to investigate the tenets of Research Questions 1 through 3, and used
multiple linear regression to investigate the tenets of Research Question 4. I conducted all
statistical analyses using SPSS, flagging all statistically significant results at an alpha
probability level of 0.05. I discuss the results below as a function of each research
question.
Research Question 1
With the first research question (RQ1), I sought to investigate the extent to which
a senior manger’s technology acceptance as defined by perceived ease of use would
influence the decision to implement ERP software innovations in SMB settings. In order
79
to empirically investigate the tenets of RQ1, I developed the following hypotheses:
H10: Perceived ease of use of ERP software does not increase the decision to
adopt ERP software.
H1a: Perceived ease of use of ERP software does increase the decision to adopt
ERP software.
I investigated the tenets of RQ1 using a binary logistic regression equation. I used
the multiple independent variables (e.g., perceived ease of use, the number of employees
at a company, if the company engages in internet commerce, and the age, gender, and
educational attainment of the respondent) to predict whether or not a respondent made the
correct decision to adopt the ERP software innovation. Because the dependent variable
for RQ1 was a dichotomous binary indicator, and because I used multiple independent
variables for RQ1, a binary logistic regression technique was the optimal approach for
investigating the above research question.
In Chapter 4, I presented the results of this equation in Model 1 of Table 4. My
examination of the omnibus chi-square goodness of fit statistic associated with Model 1
of Table 4 showed that the overall model was statistically non-significant. This result
means that none of the logit coefficients in Model 1 of Table 4 are statistically
significant, which in turn suggests that there is no relationship between perceived ease of
use of ERP software and the likelihood that a senior manager will adopt said innovation.
There is thus no support for Hypothesis 1, and by extension, the tenets of RQ1.
80
Research Question 2
With the second research question (RQ2), I sought to investigate the extent to
which a senior manager’s technology acceptance as defined by perceived usefulness
would influence the decision to implement ERP software innovations in SMB settings. In
order to empirically investigate the tenets of RQ2, I developed the following hypotheses:
H20: As perceived usefulness of ERP software increases, the decision to adopt
ERP software will either decrease or remain unchanged.
H2a: As perceived usefulness of ERP software increases, the decision to adopt
Enterprise Resource Planning software will also increase.
I investigated the tenets of RQ2 via a binary logistic regression equation. I used
multiple independent variables for RQ2 (e.g., perceived usefulness, the number of
employees at a company, if the company engages in internet commerce, and the age,
gender, and educational attainment of the respondent) to predict whether or not a
respondent made the correct decision to adopt the ERP software innovation. Because the
dependent variable for RQ2 was a dichotomous binary indicator, and because RQ2 used
multiple independent variables, a binary logistic regression technique was again the
optimal approach for investigating the above research question.
The results of this equation were presented in Model 1 of Table 4 in Chapter 4 of
this dissertation. An examination of the omnibus chi-square goodness of fit statistic
associated with Model 1 of Table 4 showed that the overall model was statistically non-
significant. This result means that none of the logit coefficients in Model 1 of Table 4 are
statistically significant, which in turn suggests that there is no relationship between

81
perceived usefulness of ERP software and the likelihood that a senior manager will adopt
said innovation. There is thus no support for Hypothesis 2, and by extension, the tenets of
RQ2.
Research Question 3
With the third research question (RQ3) I sought to investigate to what extent a
senior manger’s openness to innovation would influence the decision to implement ERP
software innovations in SMB settings. In order to empirically investigate the tenets of
RQ3, I developed the following hypotheses:
H30: As openness to innovation increases, the decision to adopt ERP software will
either decrease or remain unchanged.
H3a: As openness to innovation increases, the decision to adopt ERP software will
also increase.
I investigated the tenets of RQ3 via a binary logistic regression equation. I used
multiple independent variables for RQ3 (e.g., openness to innovation, the number of
employees at a company, if the company engages in internet commerce, and the age,
gender, and educational attainment of the respondent) to predict whether or not a
respondent made the correct decision to adopt the ERP software innovation. Because the
dependent variable for RQ3 was a dichotomous binary indicator, and because multiple
independent variables were used for RQ3, a binary logistic regression technique was the
optimal approach for investigating the above research question.
The results of this equation were presented in Model 2 of Table 4 in Chapter 4 of
this dissertation. An examination of the omnibus chi-square goodness of fit statistic

82
associated with Model 2 of Table 4 showed that the overall model was statistically non-
significant. This result means that none of the logit coefficients in Model 2 of Table 4 are
statistically significant, which in turn suggests that there is no relationship between
openness to innovation and the likelihood that a senior manager will adopt said
innovation. There is thus no support for Hypothesis 3, and by extension, the tenets of
RQ3.
Research Question 4
With the fourth research question (RQ4) I sought to investigate to what extent a
senior manager’s openness to innovation will channel the relationship between
technology acceptance (as defined by perceived ease of use and perceived usefulness)
and the decision to implement ERP software innovations in SMB settings. In order to
empirically investigate the tenets of RQ4, I developed the following hypotheses:
H40: The effect of perceived ease of use and perceived usefulness on the decision
to adopt Enterprise Resource Planning software is not mediated by openness to
innovation.
H4a: The effect of perceived ease of use and perceived usefulness on the decision
to adopt Enterprise Resource Planning software is mediated by openness to innovation.
I investigated the tenets of RQ4 via a binary logistic regression equation and a
multiple linear regression equation. For RQ4, there were two dependent variables:
openness to innovation and the decision to adopt ERP software. The first dependent
variable functioned as a mediator through which the effects of perceived ease of use and
perceived usefulness were channeled. The second dependent variable served as the
83
penultimate dependent variable within the statistical model; that is, the decision
concerning whether or not to adopt the ERP software innovation.
In the case where openness to innovation was the dependent variable, a multiple
linear regression was required. This was necessary because openness to innovation is
operationalized via the Individual Innovativeness (II) scale. I measured the II scale on a
five-point continuous Likert scale that ranges from a low value of “Strongly Disagree”
(coded as 1) to a high value of “Strongly Agree” (coded as 5). In addition, I used multiple
independent variables for RQ4 (e.g., perceived ease of use, perceived usefulness, the
number of employees at a company, if the company engages in internet commerce, and
the age, gender, and educational attainment of the respondent) to predict the value of
openness to innovation as measured by the II scale. Given these facts, a multiple linear
regression technique was the optimal approach for investigating the tenets of RQ4 where
openness to innovation was the dependent variable.
The results of these equations were presented in Model 3 of Table 4 and the
regression model presented in Table 5 in Chapter 4 of this dissertation. An examination
of the omnibus chi-square goodness of fit statistic associated with Model 3 of Table 4
showed that the overall model was statistically non-significant. This result means that
none of the logit coefficients in Model 3 of Table 4 are statistically significant, which in
turn suggests that there is no relationship between perceived usefulness of ERP software,
the perceived ease of use of ERP software, and the likelihood that a senior manager will
adopt said innovation.
84
There is also no relationship between a manager’s openness to innovation and that
manager’s likelihood to adopt said innovation. Further, Table 5 shows that there are no
indirect effects of perceived ease of use and perceived usefulness that are channeled via
openness to innovation, as the omnibus F-test for this model is also statistically non-
significant. When taken together, the results in Model 3 of Table 4 and the results in
Table 5 show that there is no support for Hypothesis 4, and by extension, the tenets of
RQ4.
The bivariate analyses also reveal in Table 3 that men are more likely to perceive
the ease of use of an innovation than women in the sample. From an emotional
disposition perspective, females are more prone to show trustworthiness than male
by displaying vulnerability (Davis, Matthews & Twamley. 1999; Pinquart &
Sörensen 2006). These differences peak in early adulthood and then decline slowly
but continue to exist throughout middle and late adulthood (e.g., Davis et al. 1999;
Ge et al. 2001; 2003; Russac et al. 2007). Females can develop trust by forming
smaller social networks; fewer daily interactions enable greater allocation of
intimate, time-consuming investment behaviors in individual relationships (Geary &
Flinn 2002; Vigil 2008). These emotional disposition factors may contribute to
women being less likely to perceive the ease of use of an innovation than men in the
sample.
Possible Explanations for Statistically Non-significant Results
There are three possible explanations that might account for the statistically non-
significant results associated with this project. Succinctly stated, the results are either due

85
to (a) a statistical issue, (b) a methodological issue, or (c) a theoretical issue. Each of
these potential explanations is discussed below.
Statistical Issue
One possible explanation for the results may be the inability of the statistical tests
to detect statistically significant effects within the data. The results may thus have
resulted as a function of what Neuman (2011) referred to as a Type II error. As Neuman
explained, a Type II error occurs when a researcher claims that there is no relationship in
the sample, even though the relationship may in fact exist in the larger population from
which the sample was drawn. A Type II error occurs when a researcher fails to reject a
null hypothesis that should be rejected and concludes that there is no evidence in support
of the alternative hypothesis. This type of error thus error occurs when a researcher says
there is no relationship among variables when in fact a relationship does exist among
variables within the parent population from which the sample was drawn.
In order to avoid the possibility of committing a Type II error, researchers
routinely conduct what is known as an a priori power estimation. This power estimation
is typically calculated via the G*Power 3.1 software program developed by Faul et al.
(2009), although other power programs are available for use by a researcher. As Faul et
al. noted, a priori power estimation involves the calculation of a desired sample size as a
function of a predetermined alpha probability level (typically an α = .05), a desired
statistical power (symbolized by β and nominally set at 0.95; see Cohen, 1988), and a
desired population effect size.

86
A population effect size is essentially the quantified degree to which a null
hypothesis is demonstrated to be false and evidence exists for the support of an
alternative hypothesis in a population from which a sample is drawn (Kraemer & Blasey,
2015). As Rodriguez (2007) noted, Cohen’s d is the typical measure of population effect
size used in power estimation calculations. This statistic is expressed in terms of standard
deviation units as part of the calculation used to estimate a sample size necessary to
ensure that sufficient statistical power exists to reject a null hypothesis should support for
an alternative hypothesis exist within the data. Effect sizes as represented via Cohen’s d
for a multiple linear regression equation typically run from an extremely small effect size
value of 0.2 to an extremely large effect size value of 0.35 (Faul et al., 2009).
For the current project, the a priori G*Power analysis suggested that this sample
size of 133 would be adequate to reject the null hypothesis and find support for the
alternative hypothesis, provided that a relationship between variables actually existed
within the parent population from which the sample was drawn. As part of the G*Power
calculation, I used an alpha level of 0.05, a statistical power of 0.95, a conservative effect
size of 0.10 and a two-tailed approach for a regression analysis with 15 predictors.
Although it is possible that a Type II error is the driving force behind the
statistical outcomes associated with this project, the probability of this being the driving
force is minimal. As previously noted, I conducted an a priori G*Power estimation in
order to determine optimal sample size before the onset of the data collection activities.
The G*Power estimation suggested an optimal sample size of 133; this benchmark was
exceeded with the obtained sample of 154 valid responses.

87
Because the gathered sample size was larger than the estimated sample size
projected as part of the a priori power calculation, the possibility of a Type II error was
minimal at best (Kraemer & Blasey, 2015). It must therefore be concluded that other
factors were responsible for the inability to detect statistically significant effects within
the data. Thus, given that steps were taken to minimize the potential of a Type II error,
other explanations for the statistical outcomes associated with this project must be
considered.
Methodological Issue
Another potential explanation for the statistically non-significant results
associated with this project may lie within the methodological design. In the current
project, I used a quantitative correlational methodological approach (Neuman, 2011) to
investigate the tenets of the four main research questions. I gathered the data used to
investigate the four main research questions via an online electronic survey that was
distributed to a simple random sample drawn from a sampling frame of 3,000 email
addresses of senior management executives of SMBs in the United States.
Drawing a simple random sample ensured that every potential respondent within
the sampling frame had an equal chance of being selected into the sample (Dixon et al.,
2015). Also, given that a random sample of respondents was invited to take an online
survey, it can be argued that the use of a quantitative correlational methodological
approach was sound (Neuman, 2011).
I designed the original electronic survey instrument to ensure that the primary
inclusion criteria for participation in the study would be restricted to respondents who
88
were senior management executive, such as CEOs, CFOs, COOs, in small to medium
business (SMB) firms that utilize ERP systems software in the United States. Although
this restriction for participation in the survey remained in place throughout the project,
the questions in the survey that would have identified the exact title of the senior
management executive who took the survey, and the exact company for which the
respondent worked, were deleted from the survey.
The rationale behind the deletion of these questions was that this information
could have potentially broken ethical guidelines regarding the need to maintain the
anonymity of a survey participant. The name of company where an individual worked,
when coupled with the individual’s title, might have led to the identification of that
person. Without being able to gather a respondent’s title information and organization
information, it was impossible to determine whether the nature of the company (i.e., for
what type of organization a respondent worked) and the exact managerial position of the
respondent (i.e., if they were a CEO, CFO, COO) would have an impact on the decision
to adopt ERP software innovations.
The failure to control for these two variables may have potentially caused the
non-significant statistical outcomes, as the regression models may not have fully
accounted for all relevant covariates within the prediction model (Agresti & Franklin,
2012). It may thus be the case that the results were driven by spurious factors (Neuman,
2011) that were not accounted for in the predictive model. According to Woolridge
(2013), spuriousness in a regression equation typically occurs when a regression equation
contains an independent variable that seems to be statistically related to the dependent

89
variable, but is in actuality highly correlated with another unaccounted for independent
variable. Thus, the supposed relationship between the dependent variable and the
independent variable is actually an artifact of the unaccounted for independent variable,
as this variable happens to affect both the dependent variable and the independent
variable simultaneously.
Although Woolridge (2013) framed his discussion of spuriousness within the
context of a supposedly statistically significant relationship between a dependent variable
and an independent variable being driven by an unaccounted for third variable, the
obverse also holds. The lack of a statistically significant relationship between a
dependent variable and an independent variable may thus be driven by the impact of an
unaccounted for factor within a regression equation. In the current investigation, the
possible spuriousness in the regression equations may have taken the form of what is
known as statistical confounding (MacKinnon, Krull, & Lockwood, 2000) within the
regression equation.
As MacKinnon et al. (2000) noted, statistical confounding is a form of
spuriousness in a regression equation where an unaccounted for independent variable
may be related to an accounted for independent variable and a dependent variable
simultaneously. The inability of the regression equation to control for the unaccounted
independent variable that is spurious will result in a false obscuring of the true
relationship between accounted independent variables and the dependent variable within
a regression equation. MacKinnon et al. also noted that the inclusion of the spurious
confounder within a regression equation will typically result in an undistorted estimate of

90
the relationship between the previously included independent variables and the dependent
variable.
Within the current investigation, it is possible that the variables that would have
accounted for the nature of the company (i.e., for what type of organization a respondent
worked) and the exact managerial position of the respondent (i.e., if they were a CEO,
CFO, COO) both acted as spurious confounds within the regression equation. It can be
argued that these two variables would most likely have had an impact on the decision to
adopt ERP software innovations. For example, researchers have found that the type of
organization, as well as the size of an organization, will directly impact any decisions to
adopt ERP software (Elbertsen, Benders, & Nijssen, 2006; Jeyaraj, Rottman, & Lacity,
2006). In addition, Thong and Yap (1995) found that managerial position also has an
impact on technology adoption. The failure to account for these factors may thus have
contributed to the statistically non-significant results found in the current investigation.
Theoretical Issue
The final explanation of the statistical results associated with this project may be
the fact that the theoretical framework used to investigate the decision to innovate might
not have been sufficient for the task at hand. Although the TAM as defined by Davis
(1989), and further refined by later authors, has widespread utility and applicability
within the field of technology adoption, it is nevertheless a model that is predicated on
economic rationality (Venkatesh et al., 2012). The use of the TAM model advances the
notion that the decision to adopt a given technology is predicated on usefulness and ease
91
of use, both of which rely on a rational cost-benefit analysis of the technology in question
(Bromiley & Rau 2011; Powell et al., 2011; Takemura, 2014).
While rationality undoubtedly plays a part in the decision to adopt new
technological innovations, there may also be an irrational aspect to the adoption of new
technological innovations. According to Becker, Knudsen, and Swedberg (2012), modern
economic theory assumes rational actors, yet it is often the case that irrational behaviors
will sometimes drive economic decisions. Other authors have supported this line of
thought, in that as they have found that decision-making in a business environment is
sometimes irrationally based on either emotions, so-called “gut instincts,” and/or existing
affective relationships with technology providers (Shiller, 2015; Svecova, Fotr, &
Renner, 2012).
The extant literature suggests that people who must make economically driven
decisions may be resistant to change as a function of their emotional states (Carr, 2014;
Kustubayeva, Matthews, & Panganiban, 2012). Lerner, Li, Valdesolo, and Kassam
(2015) suggested that “emotions constitute potent, pervasive, predictable, sometimes
harmful and sometimes beneficial drivers of decision making” within the business world
(p. 799).
Whether the emotional state experienced is pleasurable or unpleasant can impact
decision outcomes (Foo, 2009). Interestingly, the valence between these two states is
often the domain in which most business decisions (such as the decision to adopt new
technological advances) rests. For example, the CEO of a company may recognize that
the adoption of a ERP software innovation will help the company in the long-term, thus

92
leading to a pleasurable emotive outcome that results as a function of increased
profitability. The CEO of a company may also simultaneously experience unpleasant
feelings regarding the prospect of having to part with operating capital in order to adopt
the new innovation.
It may not be possible to entirely separate business decisions from emotional
responses (Fields & Kuperberg, 2012). Even though there is a dominance of rational
paradigms with respect to economic decisions, the role of emotions is nevertheless an
integral aspect of the decision-making process (Fields & Kuperberg). Fields and
Kuperberg further suggested that this is especially the case with respect to ERP software
selection, as the process of selecting ERP software involves risk and uncertainty.
On the basis of this line of thought, it could be argued that the failure to
theoretically and empirically account for both rational and irrational aspects of the
decision to implement ERP software innovations in SMB settings may have led to an
underspecified and ultimately statistically non-significant empirical model. The addition
of other theoretical approaches might help to more clearly articulate a successful
empirical model that can identify the underlying patterns associated with the decision to
implement ERP software innovations in small to medium business settings. To that end,
it might be fruitful to consider the role of what Meshulam, Winter, Ben-Shakhar, and
Aharon (2012) called rational emotions in the decision to adopt ERP software
innovations in the SMB environment.
According to Meshulam et al. (2012), “emotions may be directly controlled and
utilized in a conscious, analytic fashion, enabling an individual to size up a situation,

93
determine that a certain ‘mental state’ is strategically advantageous and adjust
accordingly” (p. 11). Meshulam et al.’s experimental work showed that individuals are
often able to regulate their own emotional states dependent upon the situation as a way to
make what they refer to as an “emotionally influenced decision” (p. 14). It may thus be
the case that business leaders are able to regulate and call forth emotional states as part of
their business decision process. The understanding that emotions can be actively
regulated is widely understood (see Gross, 2015). However, the idea of consciously
regulating emotions within a business context has yet to be explored.
Recommendations for Future Research
On the basis of the outcomes of this project, future researchers may wish to
consider four potential recommendations for their research endeavors. First, it is
recommended that a larger and more robust sample be obtained as a hedge to overcome
the potential Type II error that may have been associated with this project. A doubling of
the sample size used in this project should be sufficient to address any and all potential
Type II errors that may have been associated with this project.
Second, future researchers may wish to gather more specific information on their
survey subjects, especially as it pertains to title and the nature of their company.
Although the identification of both a respondent’s title and information on the company
for which they work might lead to a breach of confidentiality, the identification of either

94
one of these pieces of information may be sufficient to control for potentially spurious
factors within a predictive model.
Third, future researchers may wish to consider the introduction of new survey
instrumentation into the empirical model that was investigated within this study. The
inclusion of a survey instrument that is designed to gather information on the emotive
aspects of the decision-making process in the adoption of ERP software innovations
might be of some utility in articulating the irrational aspects associated with ERP
software adoption by senior managers of SMBs. One survey instrument that might be of
use is the Profile of Mood States (POMS) scale developed by McNair, Lorr, and
Droppleman (1981). The POMS scale was designed to measure the six affective states of
tension, depression, anger, vigor, fatigue, and confusion.
Another possibility might be a measure of emotional intelligence, a concept that
Barthwal and Som (2012) proposed is the most important element for employee
effectiveness and organizational growth. One measure of emotional intelligence that has
widespread utility is the Trait Meta-Mood Scale (TMMS) (Látalová & Pilárik, 2015).
This scale evaluates a person’s ability to perceive emotions in others, utilize emotions in
the decision-making process, understand a wide range of different emotions, and manage
their own emotive states (Látalová & Pilárik, 2015).
Finally, future researchers may wish to consider the inclusion of theoretical ideas
that lend themselves towards the rationality of emotions (Meshulam et al., 2012). As Foo
(2009) noted, even though emotions may have an impact upon entrepreneurial endeavors,
there have been few investigations that explore this possibility. The assumption of a
95
separation of rational decisions from emotive states in the business world may be unwise
and should be reconsidered by subsequent investigators.
Implications for Social Change
As previously noted in Chapter 1, I hoped that the results of this study would help
senior managers correctly choose whether or not to adopt needed ERP software and
hardware innovations so that their company can remain competitive in a globalized
economy at a time of rapid technological and social change. The statistical results of the
current investigation found that the perceived ease of use of a technology, the perceived
usefulness of a technology, and a senior manger’s openness to innovation do not play a
part in the decision to adopt ERP software innovations among senior managers of SMBs.
The results thus suggest that the rational aspects of ERP software innovation
adoption do not play a part in the decision to innovate among senior managers in SMBs.
It may then be the case that more emotionally based motives, such as affective and
cognitively based resistance to change, may instead be what determines the decision to
adopt ERP software innovations among senior managers. Croasdell, Kuechler, and
Wawdo (2013) proposed that resistance to change within an information technology
context is the adverse reaction to the desired behavior and outcome.
Studies in the area of resistance to change show that resistance can have both
affective and cognitive components. For example, Flamholtz and Randle (2011)
suggested that individuals who are faced with a change might resist the change via
cognitive mechanisms, such as a lack or commitment to the change and/or negative
evaluations about the change, as well as via emotionally based mechanisms such as fear,

96
apprehension, anxiety, and anger. It could thus be argued that resistance to change, which
is considered the opposite of openness to innovation, may be the catalyst that determines
whether or not a person decides to adopt an innovation (Flamholtz & Randle, 2011).
Consultants who understand that resistance to change is emotively and cognitively
based may be better able to sway the opinions of senior managers concerning whether or
not to adopt necessary ERP software innovations. This can be accomplished when
consultants recognize that appeals to the emotive aspects of decision-making can be just
as effective as appeals to the rational aspects of decision-making concerning the adoption
of necessary ERP software upgrades. Durkin, McKenna, and Cummins (2012) proposed
that emotions can be used to influence business decisions.
Wan and Yang (2014) proposed the adoption of ERP software is an emotional
process. However, I found no research that directly examines the role that emotion plays
in the decision to adopt ERP software innovations in SMB environments. The lack of
research in this area is curious, especially given the fact that ERP software selection is
often associated with uncertainty and risk, which could lead to negative emotive
outcomes on the part of software adopters such as anxiety, fear and apprehension (Astan,
2015).
Consultants who recognize that ERP software adoption decisions are complex
may have a better chance at convincing managers to adopt required ERP software
innovations. An appeal to both emotional concerns and rational needs may thus be a
consultant’s key advantage when seeking to convince a senior manager to adopt an ERP
software innovation that may be beneficial not only to the manager, but also to the
97
company, the employees, and clients.
Summary and Conclusion
There is a need for senior managers of SMBs to correctly identify whether or not
ERP software system problems exist. The correct identification of the presence (or
absence) of ERP software system problems is essential when making decisions that will
lead to software adoption and innovation. Instead of focusing on obtaining newer
software innovations, researchers have suggested that senior managers should instead
seek to implement technological changes that enable the smooth and efficient operation
of an SMB. One of the problems with ERP software adoption is that management may
believe that the purchasing of newer technologies will solve most (if not all) ERP
software system issues.
Management sometimes obtains new software technologies for the sake of simply
having newer technology. When senior managers of firms frame their businesses’
software problems incorrectly in their search for new technological innovations, they in
turn may overlook the organizational aspects of change in ERP systems implementation,
and negative consequences, such as the wasting of capital resources, the wasting of time,
and the wasting of effort on improper software adoption, may follow. In the current
project I drew from these understandings to argue that a senior manager’s perceptions
concerning the ease of use and usefulness of ERP systems software may play a part in
guiding his or her decision to adopt a new technological innovation.
I set about to determine whether there was a relationship between the decision to
innovate, a technology’s perceived ease of use, a technology’s perceived usefulness and a
98
senior manager’s openness to innovation among the entrepreneurial business leaders of
small to medium size businesses (SMBs) in the United States. In order to investigate this
issue, I used Roger’s (2003) diffusion of innovations theory and Davis’ (1989) TAM as
theoretical mechanisms to investigate the factors that may increase the likelihood of a
senior executive’s decision to adopt new ERP systems software.
The results of this quantitative project suggest that perceived ease of use,
perceived usefulness and openness to innovation do not impact the decision to innovate,
net of the statistical controls. Thus, results associated with the empirical investigation
suggested that neither openness to innovation nor the perceived use and usefulness of an
ERP software innovation would guide the decision to innovate among senior managers of
SMBs that use ERP software. There are three possible explanations that might account
for the statistically non-significant results associated with this project. Succinctly stated,
the results are either due to (a) a statistical issue, (b) a methodological issue, or (c) a
theoretical issue.
One possible explanation for the results may be due to the inability of the
statistical tests to detect statistically significant effects within the data. Because the
gathered sample size was larger than the estimated sample size projected as part of the a
priori power calculation, the possibility of a Type II error is minimal at best (Kraemer &
Blasey, 2015). It must therefore be concluded that other factors are responsible for the
inability to detect statistically significant effects within the data. Given that steps were
taken to minimize the potential of a Type II error, other explanations for the statistical
outcomes associated with this project must be considered.

99
Another potential explanation for the statistically non-significant results
associated with this project may lie within the methodological design. Within the current
investigation, it is possible that the variables that would have accounted for the nature of
the company (i.e., what type of organization a respondent worked for) and the exact
managerial position of the respondent (i.e., if they were a CEO, CFO, COO) acted as
spurious confounds within the regression equation. It can be argued that these two
variables would most likely have had an impact on the decision to adopt ERP software
innovations. For example, it has been found in the literature that the type of organization,
as well as the size of an organization, will directly impact any decisions to adopt ERP
software (Elbertsen et al., 2006; Jeyaraj et al., 2006). In addition, Thong and Yap (1995)
found that managerial position also has an impact on technology adoption. The failure to
account for these factors may thus have contributed to the statistically non-significant
results found in the current investigation.
The final explanation that may be driving the statistical results associated with
this project may be the fact that the theoretical framework used to investigate the decision
to innovate might not have been sufficient for the task at hand. Although the TAM, as
defined by Davis (1989), has widespread utility and applicability within the field of
technology adoption, it is nevertheless a model that is predicated on economic rationality.
While rationality undoubtedly plays a part in the decision to adopt new technological
innovations, there may also be an irrational aspect to the adoption of new technological
innovations.
100
Work by other authors supports this line of thought, insofar as the researchers
found that decision-making in the business environment is sometimes irrationally based
on either emotions, so-called ‘gut instincts’, and/or existing affective relationships with
technology providers (Shiller, 2015; Svecova et al., 2012). Whether the emotional state
experienced is either pleasurable or unpleasant can impact decision outcomes (Foo,
2009). Interestingly, the valence between these two states is often the domain in which
most business decisions (such as the decision to adopt new technological advances) rests.
Future researchers may wish to consider these issues when extending this
investigation’s line of inquiry. It is recommended that a larger and more robust sample be
obtained as a hedge to overcome the potential Type II error that may have been
associated with this project. Future researchers may also wish to gather more specific
information on their survey subjects, especially as it pertains to title and the nature of
their company. Although the identification of both a respondent’s title and information on
the company they work for might lead to a breach of confidentiality, the identification of
either one of these pieces of information may be sufficient to control for potentially
spurious factors within a predictive model.
Future researchers may also wish to consider the inclusion of new survey
instrumentation into the empirical model that was investigated within this study. The
inclusion of a survey instrument that is designed to gather information on the emotive
aspects of the decision-making process in the adoption of ERP software innovations
might be of some utility in articulating the irrational aspects associated with ERP
software adoption by senior managers of SMBs. One possible survey instrument that

101
might be of use is the POMS scale, which was designed McNair, Lorr and Droppleman
(1981) to measure the six affective states of tension, depression, anger, vigor, fatigue and
confusion.
Another possibility for future research might be a measure of emotional
intelligence, a concept which Barthwal and Som (2012) proposed is most important
element for employee effectiveness and organizational growth. One measure of
emotional intelligence that has widespread utility is the TMMS (Látalová & Pilárik,
2015). This scale evaluates a person’s ability to perceive emotions in others, utilize
emotions in the decision-making process, understand a wide range of different emotions,
and manage their own emotive states (Látalová & Pilárik, 2015).
The positive social change outcomes of this study suggest that decision makers
should become more aware of factors that promote constructive and effective
identification of how to remediate problems in management accounting. I hoped that the
results of this study would be able to help senior managers correctly choose whether or
not to adopt needed ERP software and hardware innovations so that their company can
remain competitive in a globalized economy at a time of rapid technological and social
change. The statistical results of the current investigation found that the perceived ease of
use of a technology, the perceived usefulness of a technology and a senior manger’s
openness to innovation do not play a part in the decision to adopt ERP software
innovations among senior managers of SMBs.
Consultants who recognize that ERP software adoption decisions can and often do
push senior managers “outside their comfort zone” may have a better chance at

102
convincing managers to adopt required ERP software innovations. An appeal to both
emotional concerns and rational needs may thus be a consultant’s key advantage when
seeking to convince a senior manager to adopt an ERP software innovation that may be
beneficial not only to the manager, but also to his or her company, his or her employees,
and his or her clients.

103
References
Agresti, A., & Franklin, C.A. (2012). Statistics plus MyStatLab with Pearson eText (3rd
ed.). New York, NY: Pearson.
Agresti, A., & Franklin. C. A. (2013). Statistics: The art and science of learning from
data (2nd ed.). New York, NY: Pearson.
Alghalith, N. (2012). Reengineering with ERP: The Aramco case. Journal of Strategic
Innovation and Sustainability, 8(1), 26-35.
Argote, L. (2011). Organizational learning research: Past, present and future.
Management Learning, 42(4), 439-446.
Argyris, C., & Schön, D. (1978). Organizational learning: A theory of action perspective.
Reading, MA: Addison Wesley.
Astan, G. (2015). Factors affecting technology acquisition decisions in national defense
projects. Journal of Defense Resources Management, 6(1), 97-102.
Atzmüller, C., & Steiner, P. (2010). Experimental vignette studies in survey research.
European Journal of Research Methods for the Behavioral and Social Sciences,
6(3), 128-138.
Avci-Yücel, U., & Gülbahar, Y. (2013). Technology acceptance model: A review of the
prior predictors. Journal of Faculty of Educational Sciences, 46(1), 89-109.
Barthwal, S., & Som, A. J. (2012). Emotional intelligence as a measure of an employee's
overall effectiveness. Drishtikon: A Management Journal, 3(2), 140-176.
104
Becker, M. C., Knudsen, T., & Swedberg, R. (2012). Schumpeter's theory of economic
development: 100 years of development. Journal of Evolutionary Economics,
22(5), 917-933.
Bernroidera, E. W. N., Kochb, S., & Dtixc, V. (2013). A comprehensive framework
approach using content, context, process views to combine methods from
operations research for it assessments. Information Systems Management, 30(1),
75-88.
Breakwell, G. M., Smith, J. A., & Wright, D. B. (2012). Research methods in psychology
(4th ed.). Thousand Oaks, CA: SAGE Publications.
Bromiley, P., & Rau, D. (2011). Strategic decision making. In S. Zedeck, (Ed.), APA
handbook of industrial and organizational psychology, Vol. 1: Building and
developing the organization (pp. 161-182). Washington, DC: American
Psychological Association.
Brown, P. C., Roediger, H. L., & McDaniel, M. A. (2014). Make it stick: The science of
successful learning. Boston, MA: Harvard University Press.
Carr, A. S. (2014). An examination of technology and organization's change in service
delivery to meet customer expectations. Journal of Applied Business Research,
30(3), 725-n/a.
Cheng, C. C. J., & Chen, J. (2013). Breakthrough innovation: The roles of dynamic
innovation capabilities and open innovation activities. Journal of Business &
Industrial Marketing, 28(5), 444–454.

105
Chenhall, R. H. (2012). Developing an organizational perspective to management
accounting. Journal of Management Accounting Research, 24(1), 65-76.
Chenhall, R. H., Kalunki, J. P., & Silvola, H. (2011). Exploring the relationships between
strategy, innovation, and management control systems: The roles of social
networking, organic innovative culture, and formal controls. Journal of
Management Accounting Research, 23, 99-128.
Chiwamit, P., Modell, S., & Yang, C. L. (2014). The societal relevance of management
accounting innovations: Economic value added and institutional work in the fields
of Chinese and Thai state-owned enterprises. Accounting and Business Research,
44(2), 144-180.
Clavier, C., Senechal, Y., Vibert, S. & Potvin, L. (2012). A theory based model of
translation practices in public health participatory research. Sociology of Health
and Illness, 34, 791-805.
Cocklar, A. N. (2012). Individual innovativeness levels of educational administrators.
Digital Education Review, 22, 100-110.
Cohen, J. (1988). Statistical power analysis for the behavioral sciences (2nd ed.). San
Diego, CA: Academic Press.
Croasdell, D., Kuechler, B., & Wawdo, S. (2013). Research note for: Examining
resistance to information system implementation. Journal of Information
Technology Case and Application Research, 15(3), 25-26.
106
Das, S. R., & Joshi, M. P. (2012). Process innovativeness and firm performance in
technology service firms: The effects of external and internal contingencies. IEEE
Transactions on Engineering Management, 59, 401-414.
Davis, F. D. (1989). Perceived usefulness, perceived ease of use, and user acceptance of
information technology. MIS Quarterly, 13(3), 319-340.
Davis, M. C., Matthews, K. A., & Twamley, E. W. (1999). A socio-relational framework
of sex differences in the expression of emotion. Annals of Behavioral Medicine
21(1), 83-97.
De Bernardis, L. (2012). Social dimension in ERP adoption and implementation. Journal
of Information, Communication & Ethics in Society, 10(3), 156-186.
Dillman, D., Smyth, J. D. & Christian, L. M. (2014). Internet, mail, and mixed-mode
surveys: The tailored design method (4th ed.). New York, NY: Wiley.
Dixon, J. C., Singleton, R. A., & Straits, B. C. (2015). The process of social research.
New York, NY: Oxford University Press.
Durkin, M., McKenna, S., & Cummins, D. (2012). Emotional connections in higher
education marketing. The International Journal of Educational Management,
26(2), 153-161.
Elbertsen, L., Benders, J. G. J. M., & Nijssen, E. (2006). ERP use: Exclusive or
complemented? Industrial Management & Data Systems, 106(6), 811-824.
Faul, F., Erdfelder, E., Buchner, B., & Lang, A. G. (2009). Statistical power analyses
using G*Power 3.1: Tests for correlation and regression analyses. Behavior
Research Methods, 41(4), 1149-1160.

107
Fields, E. C., & Kuperberg, G. R. (2012). It's all about you: An ERP study of emotion
and self-relevance in discourse. NeuroImage, 62(1), 562-574.
Flamholtz, E. G., & Randle, Y. (2011). Corporate culture: The ultimate strategic asset.
Stanford, CA: Stanford Business Books.
Foo, M. (2009). Emotions and entrepreneurial opportunity evaluation. Entrepreneurship
Theory and Practice, 35(2), 375-393.
García-Morales, V. J., Jiménez-Barrionuevo, M. M., & Gutiérrez-Gutiérrez, L. (2012).
Transformational leadership influence on organizational performance through
organizational learning and innovation. Journal of Business Research, 65(7),
1040-1050.
Ge, X., Conger, R. D., & Elder, G. H. (2001). A socio-relational framework of sex
differences in the expression of emotion. Developmental Psychology 37(1), 404-
17.
Geary, D. C., & Flinn, M. V. (2002). A socio-relational framework of sex differences in
the expression of emotion. Psychological Review 109(1), 745-50.
Ghazizadeh, M., Lee, J. D., & Boyle, L. N. (2012). Extending the technology acceptance
model to assess automation. Cognition, Technology & Work, 14(1), 39-49.
Glasgow, R. E., Vinson, C., Chambers, D., Khoury, M. J., Kaplan, R. M., & Hunter, C.
(2012). National Institutes of Health approaches to dissemination and
implementation science: Current and future directions. American Journal of
Public Health, 102, 1274-1281.

108
Grabski, S. V., Leech, S. A., & Schmidt, P. J. (2011). A review of ERP research: A future
agenda for accounting information systems. Journal of Information Systems,
25(1), 37-78.
Gross, J. (2015). Emotion regulation: Current status and future prospects. Psychological
Inquiry, 26(1), 1-26. doi:10.1080/1047840X.2014.940781
Gwebu, K. L., & Wang, J. (2011). Adoption of open source software: The role of social
identification. Decision Support Systems, 51, 220-229.
Hastie, R., & Dawes, R. M. (2010). Rational choice in an uncertain world: The
psychology of judgment and decision making (2nd ed.). Thousand Oaks, CA:
SAGE Publications.
Hayes, A. F. (2013). Introduction to mediation, moderation, and conditional process
analysis: A regression-based approach. New York, NY: Guilford Press.
Hess, T. J., McNab, A. L., & Basoglu, K. A. (2014). Reliability generalization of
perceived ease of use, perceived usefulness, and behavioral intentions. MIS
Quarterly, 38(1), A1-A29.
Huang, J. C. (2013). Innovative health care delivery system: A questionnaire survey to
evaluate the influence of behavioral factors on individuals’ acceptance of telecare.
Computers in Biology and Medicine, 43(4), 281-286.
doi:10.1016/j.compbiomed.2012.12.011
Hurt, H. T., Joseph, K., & Cook, C. D. (1977). Scales for the measurement of
innovativeness. Human Communication Research, 4, 58-65.
109
Imran, M., Hasan, S., Rizvi, M., & Ali, B. (2011). Impact of organizational learning on
organizational performance. International Journal of Academic Research, 3(4),
424-427.
Jayawickrama, U., Liu, S., & Smith, M. H. (2014). An ERP knowledge transfer
framework for strategic decisions in knowledge management in organizations.
International Journal of Innovation, Management and Technology, 5(4), 301-308.
Jeyaraj, A., Rottman, J. W., & Lacity, M. C. (2006). A review of the predictors, linkages,
and biases in IT innovation adoption research Journal of Information Technology,
21, 1-23.
Jiménez-Jiménez, R., & Sanz-Valle, R. (2011). Innovation, organizational learning, and
performance. Journal of Business Research, 64(4), 408-417.
Kanellou, A., & Spathis, C. (2013). Accounting benefits and satisfaction in an ERP
environment. International Journal of Accounting Information Systems, 14, 209-
234.
Keesee, G. S., & Shepard, M. F. (2011). Perceived attributes predict course management
system adopter status. Online Journal of Distance Learning Administration, 4(1),
11-14.
King, W. R., & He, J. (2006). A meta-analysis of the technology acceptance model.
Information & Management, 43, 740-755.
Kowta Sita, N. K., & Chitale, C. M. (2012). Collaborative knowledge sharing strategy to
enhance organizational learning. The Journal of Management Development,
31(3), 308-322.

110
Kraemer, H. C., & Blasey, C. (2015). How many subjects? Statistical power analysis in
research. Thousand Oaks, CA: SAGE Publications.
Kunz, W., Schmitt, B., & Meyer, A. (2012). How does perceived firm innovativeness
affect the consumer? Journal of Business Research, 64, 816-822.
Kustubayeva, A., Matthews, G., & Panganiban, A. R. (2012). Emotion and information
search in tactical decision-making: Moderator effects of feedback. Motivation and
Emotion, 36(4), 529-543.
Látalová, V., & Pilárik, L. (2015). Predicting career decision-making strategies: The role
of self-determination and perceived emotional intelligence. Studia Psychologica,
57(2), 95-114.
Lee, P. (2012). Transcending the tacit dimension: Patents, relationships, and
organizational integration in technology transfer. California Law Review, 100,
1503-1572.
Leite, R., & Teixeira, A. (2012). Innovation diffusion with heterogeneous networked
agents: A computational model. Journal of Economic Interaction and
Coordination, 7(2), 125-144.
Lerner, J. S., Li, Y., Valdesolo, P., & Kassam, K. S. (2015). Emotions and decision
making. Annual Review of Psychology, 66, 799-823.
Liu, Y., & Phillips, J. S. (2011). Examining the antecedents of knowledge sharing in
facilitating team innovativeness from a multilevel perspective. International
Journal of Information Management, 31, 44-52.

111
Lin, F., Liu, C., & Kuo, I. (2013). Moderating effect of perceived usefulness and on the
relationship between ease of use, attitude towards use, and actual system use.
International Journal of Organizational Innovation, 5(3), 180-191.
Lucia. A., Leda. P., & Silvia. I. D. (2012). Process management tasks and barriers:
Functional to processes approach. Business Process Management Journal, 18(5),
762-776.
Luftman, J., Zadeh, H. S., Derksen, B., Santana, M., Rigoni, E. H., & Huang, Z. (2012).
Key information technology and management issues 2011-2012: An international
study. Journal of Information Technology, 27(3), 198-212.
Lynch, P., Walsh, M., & Harrington, D. (2010). Defining and dimensionalizing
organizational innovativeness. In 2010 ICHRIE Annual Summer Conference &
Marketplace, 28th – 31st July 2010, San Juan, Puerto Rico.
Mack, C. A. (2011). Fifty years of Moore’s Law. IEEE Transactions on Semiconductor
Manufacturing, 24(2), 202-207.
MacKinnon, D. P., Krull, J., & Lockwood, C. M. (2000). Equivalence of the mediation,
confounding and suppression effect. Prevention Science 1(4), 173-285.
Maditinos, D., Chatzoudes, D., & Tsairidis, C. (2012). Factors affecting ERP system
implementation effectiveness. Journal of Enterprise Information Management,
25(1), 60-78.
Manning, L. (2013). A knowledge exchange and diffusion of innovation (KEDI) model
for primary production. British Food Journal, 115(4), 614-631.

112
Marangunić, N., & Granić, A. (2014). Technology acceptance model: A literature review
from 1986 to 2013. Universal Access in the Information Society, 14(1), 1-15.
McNair, P. M., Lorr, M., & Droppleman, L. F. (1981). POMS manual (2nd ed.). San
Diego, CA: Educational and Industrial Testing Service.
Meshulam, M., Winter, E., Ben-Shakhar, G., & Aharon, I. (2012). Rational emotions.
Social Neuroscience, 7(1), 11-17.
Moore, M. L., & Westley, F. (2011). Surmountable chasms: Networks and social
innovation for resilient systems. Ecology and Society, 16, 5-15.
Murray, P. (2012). Knowledge management as a sustained competitive advantage. Ivey
Business Journal, 66(4), 71-76.
Neuman, W. L. (2011). Social research methods: Qualitative and quantitative
approaches (7th ed.). New York, NY: Pearson.
Nixon, B., & Burns, J. (2012). Strategic management accounting. Management
Accounting Research, 23(4), 229-244.
Pallister, J. G., & Foxall, G. R. (1998). Psychometric properties of the Hurt–Joseph–Cook
scales for the measurement of innovativeness. Technovation, 18(11), 663-675.
Park, S. C., & Ryoo, S. Y. (2013). An empirical investigation of end-users’ switching
toward cloud computing: A two factor theory perspective. Computers in Human
Behavior, 29, 160-170.
Paton, N. (2012). IT and OH: Reaching for the sky. Occupational Health, 64, 18-20.
Pegoretti, G., Rentocchini, F., & Vittucci Marzetti, G. (2012). An agent-based model of
innovation diffusion: Network structure and coexistence under different
113
information regimes. Journal of Economic Interaction and Coordination, 7(2),
145-165.
Pinquart, M., & Sörensen, S. (2006). A socio-relational framework of sex differences in
the expression of emotion. Journal of Gerontology Series B: Psychological
Sciences and Social Sciences 61(1), 33-45.
Powell, T. C., Lovallo, D., & Fox, C. R. (2011). Behavioral strategy. Strategic
Management Journal, 32, 1369-1386.
Qutaishat, F. T., Khattab, S. A., Zaid, M. K. S. A., & Al-Manasra, E. (2012). The effect
of ERP successful implementation on employees' productivity, service quality and
innovation: An empirical study in telecommunication sector in Jordan.
International Journal of Business and Management, 7(19), 45-54.
Richet, P. (2012). A natural history of time. Chicago, IL: The University of Chicago
Press.
Rodriguez, W. (2007). Effect size. In N. Salkind & K. Rasmussen (Eds.), Encyclopedia
of measurement and statistics, Vol. 1. Thousand Oaks, CA: SAGE Publications.
Rogers, E. M. (2003). Diffusion of innovations (5th ed.). New York: Free Press.
Rotheram-Borus, M. J., Swenderman, D., & Chorpita, B. F. (2012). Disruptive
innovations for designing and diffusing evidence based interventions. American
Psychologist, 67, 463-476.
Ruivo, P., Oliveira, T., & Neto, M. (2012). ERP use and value: Portuguese and Spanish
SMEs. Industrial Management & Data Systems, 112(7), 1008-1025.

114
Russac, R. J., Gatliff, C. R. M., & Spottswood, D. (2007). A socio-relational framework
of sex differences in the expression of emotion. Death Studies 31(1), 549-61.
Sahin, I. (2006). Detailed review of Rogers’ diffusion of innovation theory and
educational technology-related studies based on Rogers’ theory. The Turkish
Online Journal of Educational Technology, 5(3), 14-23.
Scheirer, M.A., & Dearing, J.W. (2011). An agenda for research on the sustainability of
public health programs. American Journal of Public Health, 101, 2059-2067.
Schilling, J., & Kludge, A. (2009). Barriers to organizational learning: An integration of
theory and research. International Journal of Management Reviews, 11(3), 337-
360.
Schreier, M., & Prügl, R. (2008). Extending lead user theory: Antecedents and
consequences of consumers’ lead userness. Journal of Product Innovation
Management, 25, 331-346. doi:10.1111/j.1540-5885.2008.00305.xf
Shiller, R. J. (2015). Irrational exuberance (3rd ed.). Princeton, NJ: Princeton University
Press.
Shoham, A., Vigoda-Gadot, E., Ruvio, A., & Schwabsky, N. (2012). Testing an
organizational innovativeness integrative model across cultures. Management, 29,
226-240.
Sisaye, S., & Birnberg, J. G. (2010). Organizational development and transformational
learning approaches in process innovations: A review of the implications to the
management accounting literature. Review of Accounting and Finance, 9(4), 337-
362.

115
Siverbo, S. (2014). The implementation and use of benchmarking in local government: A
case study of the translation of a management accounting innovation. Financial
Accountability and Management, 30(2), 121-149.
Smith. P.A.C. (2012). The importance of organizational learning for organizational
sustainability. The Learning Organization, 19(1), 4-10.
Svecova, L., Fotr, J., & Renner, P. (2012). The influence of irrationality on the
innovativeness of variants and the quality of decision making. Social and
Behavioral Sciences, 41, 570-576.
Svendsen, G. B., Johnsen, J. K., Almas-Sorenson, L., & Vitterso, J. (2011). Personality
and technology acceptance: The influence of personality factors on the core
constructs of the technology acceptance model. Behavior and Information
Technology, 32, 323-334.
Takemura, K. (2014). Behavioral decision theories that explain decision-making
processes. Behavioral Decision Theory, 143-164.
Tavakol, M., & Dennick, R. (2011). Making sense of Cronbach's alpha. International
Journal of Medical Education, 2, 53-55.
Thong, J. Y. L., & Yap, C. S. (1995). CEO characteristics, organizational characteristics,
and information technology adoption in small businesses. OMEGA 23(4), 249-
442.
United States Trade Commission. (2011). Small and medium-sized enterprises: Overview
of participation in U.S. exports (Investigation No. 332-508: USITC Publication
4125). Retrieved from http://www.usitc.gov/publications/332/pub4125.pdf
116
Venkatesh, V., Thong, J. Y. L., & Xu, X. (2012). Consumer acceptance and use of
information technology: Extending the unified theory of acceptance and use of
technology. MIS Quarterly, 36(1), 157-178.
Vigil, J. M. (2008). A socio-relational framework of sex differences in the expression of
emotion. Evolutionary Psychology 6(1), 506-22.
Ward, K. (2012). Strategic management accounting. New York, NY: Routledge.
Watzlawick, P., Weakland, J. H., & Fisch, R. (2011). Change: Principles of problem
formation and problem resolution. New York, NY: Norton.
Weick, K. (2013). Laboratory experimentation with organizations. In J. G. March (Ed.),
Handbook of organizations (pp. 194-260). New York, NY: Routledge.
Weng, F., & Hung, M. (2014). Competition and challenge on adopting cloud ERP.
International Journal of Innovation, Management and Technology, 5(4), 309-313.
Winsor, B. (2012). Managing innovation under time pressure: A practical perspective.
Technology Innovation Management Review, 2(8), 5-9.
Woolridge, J. M. (2013). Introductory econometrics: A modern approach (5th ed.). New
York, NY: Cengage.
Xu, H., Rondeau, P. J., & Mahenthiran, S. (2011). Teaching case the challenge of
implementing an ERP system in a small and medium enterprise - A teaching case
of ERP project management. Journal of Information Systems Education, 22(4),
291-296.

117
Yousafzai, S. Y., Foxall, G. R., & Pallister, J. P. (2011). Explaining Internet banking
behavior: Theory of reasoned action, theory of planned behavior, or technology
acceptance model? Journal of Applied Social Psychology, 40(5), 1172-1202.

118
Appendix A. Survey Content
Dependent Variable
Decision to Innovate
Decision to innovate will be based on the answer to question #3 in the four scenarios posted below. Question #3 is a forced binary choice that will identify whether or not the respondent to the survey has made the correct decision concerning whether or not the technological innovation should be adopted. Questions #1 and #2 are being used as red herrings to distract from the information presented in Question #3. Each scenario below was designed to be identical in terms of content. There are only five factors in each scenario that have been modified to provide variability within each vignette. These five factors are as follows: 1) The age of the current software (either two years old or thirty years old); 2) Customer satisfaction (customers are either happy or unhappy); 3) Projected increase in growth after technology adoption (either four percent or twenty-
three percent is projected); 4) Projected reduction in inventory turns (either three percent or seventeen percent is
projected); 5) Cost of upgrade as a percent of annual revenue (either two percent or fifteen percent). It should be noted that scenario #1 and #2 are polar opposites; in other words, all five factors in scenario #1 are set so that the correct decision is to not purchase the new software, whereas the five factors in scenario #2 are set so that the correct decision is to purchase the software. The five factors in scenarios #3 and #4 have been set so that the correct decision is harder to ascertain on the part of the respondent. In these scenarios, three of the five factors have been set in one direction, while the other two factors have been set in the opposite direction. For scenario #3, the correct decision is to upgrade as three of the five factors have been set in that direction. For scenario #4, the correct decision is to not upgrade, as three of the five factors have been set in that direction.
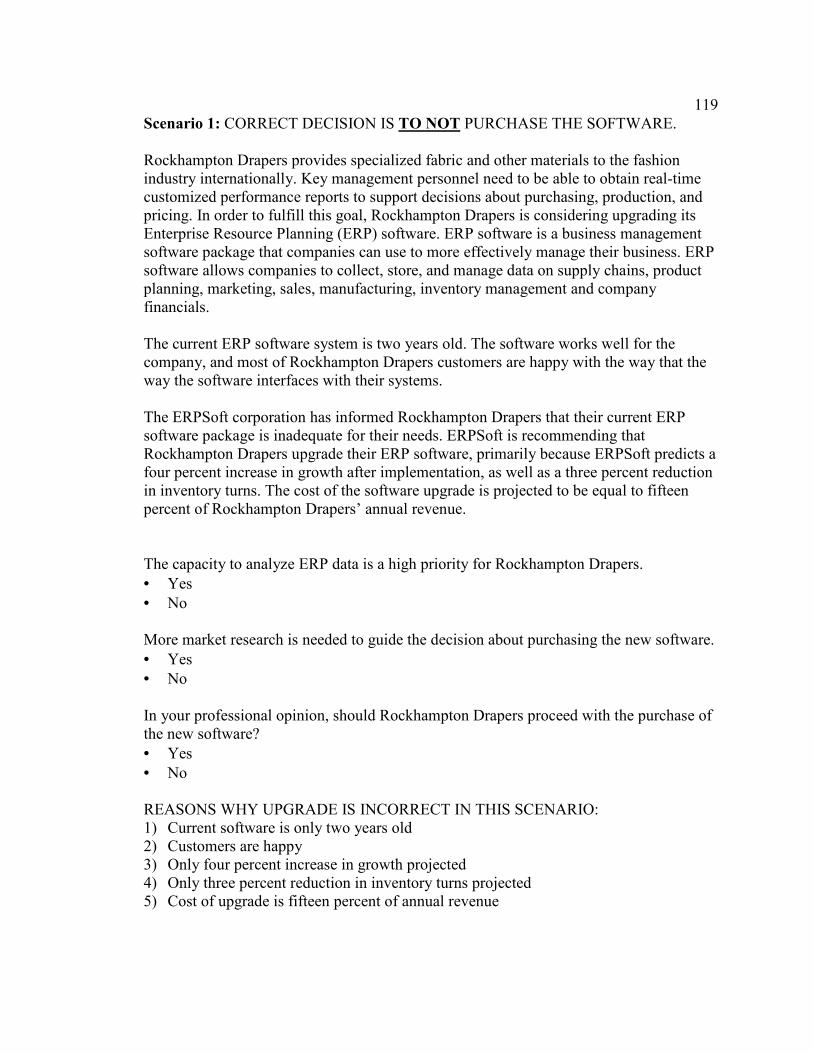
119
Scenario 1: CORRECT DECISION IS TO NOT PURCHASE THE SOFTWARE. Rockhampton Drapers provides specialized fabric and other materials to the fashion industry internationally. Key management personnel need to be able to obtain real-time customized performance reports to support decisions about purchasing, production, and pricing. In order to fulfill this goal, Rockhampton Drapers is considering upgrading its Enterprise Resource Planning (ERP) software. ERP software is a business management software package that companies can use to more effectively manage their business. ERP software allows companies to collect, store, and manage data on supply chains, product planning, marketing, sales, manufacturing, inventory management and company financials. The current ERP software system is two years old. The software works well for the company, and most of Rockhampton Drapers customers are happy with the way that the way the software interfaces with their systems. The ERPSoft corporation has informed Rockhampton Drapers that their current ERP software package is inadequate for their needs. ERPSoft is recommending that Rockhampton Drapers upgrade their ERP software, primarily because ERPSoft predicts a four percent increase in growth after implementation, as well as a three percent reduction in inventory turns. The cost of the software upgrade is projected to be equal to fifteen percent of Rockhampton Drapers’ annual revenue. The capacity to analyze ERP data is a high priority for Rockhampton Drapers.
• Yes
• No More market research is needed to guide the decision about purchasing the new software.
• Yes
• No In your professional opinion, should Rockhampton Drapers proceed with the purchase of the new software?
• Yes
• No REASONS WHY UPGRADE IS INCORRECT IN THIS SCENARIO: 1) Current software is only two years old 2) Customers are happy 3) Only four percent increase in growth projected 4) Only three percent reduction in inventory turns projected 5) Cost of upgrade is fifteen percent of annual revenue
120
Scenario 2: CORRECT DECISION IS TO PURCHASE THE SOFTWARE. Rockhampton Drapers provides specialized fabric and other materials to the fashion industry internationally. Key management personnel need to be able to obtain real-time customized performance reports to support decisions about purchasing, production, and pricing. In order to fulfill this goal, Rockhampton Drapers is considering upgrading its Enterprise Resource Planning (ERP) software. ERP software is a business management software package that companies can use to more effectively manage their business. ERP software allows companies to collect, store, and manage data on supply chains, product planning, marketing, sales, manufacturing, inventory management and company financials. The current ERP software system is thirty years old. The software works well for the company, but most of Rockhampton Drapers customers are unhappy with the way that the way the software interfaces with their systems. The ERPSoft corporation has informed Rockhampton Drapers that their current ERP software package is inadequate for their needs. ERPSoft is recommending that Rockhampton Drapers upgrade their ERP software, primarily because ERPSoft predicts a twenty-three percent increase in growth after implementation, as well as a seventeen percent reduction in inventory turns. The cost of the software upgrade is projected to be equal to two percent of Rockhampton Drapers’ annual revenue. The capacity to analyze ERP data is a high priority for Rockhampton Drapers.
• Yes
• No More market research is needed to guide the decision about purchasing the new software.
• Yes
• No In your professional opinion, should Rockhampton Drapers proceed with the purchase of the new software?
• Yes
• No REASONS WHY UPGRADE IS CORRECT IN THIS SCENARIO: 1) Current software is thirty years old 2) Customers are unhappy 3) Twenty-three percent increase in growth projected 4) Seventeen percent reduction in inventory turns projected 5) Cost of upgrade is only two percent of annual revenue
121
Scenario 3: CORRECT DECISION IS TO PURCHASE THE SOFTWARE. Rockhampton Drapers provides specialized fabric and other materials to the fashion industry internationally. Key management personnel need to be able to obtain real-time customized performance reports to support decisions about purchasing, production, and pricing. In order to fulfill this goal, Rockhampton Drapers is considering upgrading its Enterprise Resource Planning (ERP) software. ERP software is a business management software package that companies can use to more effectively manage their business. ERP software allows companies to collect, store, and manage data on supply chains, product planning, marketing, sales, manufacturing, inventory management and company financials. The current ERP software system is thirty years old. The software works well for the company, and most of Rockhampton Drapers customers are happy with the way that the way the software interfaces with their systems. The ERPSoft corporation has informed Rockhampton Drapers that their current ERP software package is inadequate for their needs. ERPSoft is recommending that Rockhampton Drapers upgrade their ERP software, primarily because ERPSoft predicts a twenty-three percent increase in growth after implementation, as well as a three percent reduction in inventory turns. The cost of the software upgrade is projected to be equal to two percent of Rockhampton Drapers’ annual revenue. The capacity to analyze ERP data is a high priority for Rockhampton Drapers.
• Yes
• No More market research is needed to guide the decision about purchasing the new software.
• Yes
• No In your professional opinion, should Rockhampton Drapers proceed with the purchase of the new software?
• Yes
• No REASONS WHY UPGRADE IS CORRECT IN THIS SCENARIO: 1) Current software is thirty years old (reason to upgrade) 2) Customers are happy (reason not to upgrade) 3) Twenty-three percent increase in growth projected (reason to upgrade) 4) Only three percent reduction in inventory turns projected (reason not to upgrade) 5) Cost of upgrade is only two percent of annual revenue (reason to upgrade)

122
Three reasons to upgrade, two reasons not to upgrade. Balance is in favor is to upgrade.

123
Scenario 4: CORRECT DECISION IS NOT TO PURCHASE THE SOFTWARE. Rockhampton Drapers provides specialized fabric and other materials to the fashion industry internationally. Key management personnel need to be able to obtain real-time customized performance reports to support decisions about purchasing, production, and pricing. In order to fulfill this goal, Rockhampton Drapers is considering upgrading its Enterprise Resource Planning (ERP) software. ERP software is a business management software package that companies can use to more effectively manage their business. ERP software allows companies to collect, store, and manage data on supply chains, product planning, marketing, sales, manufacturing, inventory management and company financials. The current ERP software system is two years old. The software works well for the company, but most of Rockhampton Drapers customers are unhappy with the way that the way the software interfaces with their systems. The ERPSoft corporation has informed Rockhampton Drapers that their current ERP software package is inadequate for their needs. ERPSoft is recommending that Rockhampton Drapers upgrade their ERP software, primarily because ERPSoft predicts a four percent increase in growth after implementation, as well as a seventeen percent reduction in inventory turns. The cost of the software upgrade is projected to be equal to fifteen percent of Rockhampton Drapers’ annual revenue. The capacity to analyze ERP data is a high priority for Rockhampton Drapers.
• Yes
• No More market research is needed to guide the decision about purchasing the new software.
• Yes
• No In your professional opinion, should Rockhampton Drapers proceed with the purchase of the new software?
• Yes
• No REASONS WHY UPGRADE IS NOT CORRECT IN THIS SCENARIO: 1) Current software is two years old (reason not to upgrade) 2) Customers are unhappy (reason to upgrade) 3) Only four percent increase in growth projected (reason not to upgrade) 4) Seventeen percent reduction in inventory turns projected (reason to upgrade) 5) Cost of upgrade is fifteen percent of annual revenue (reason not to upgrade)

124
Two reasons to upgrade, three reasons not to upgrade. Balance is in favor is to not
upgrade.
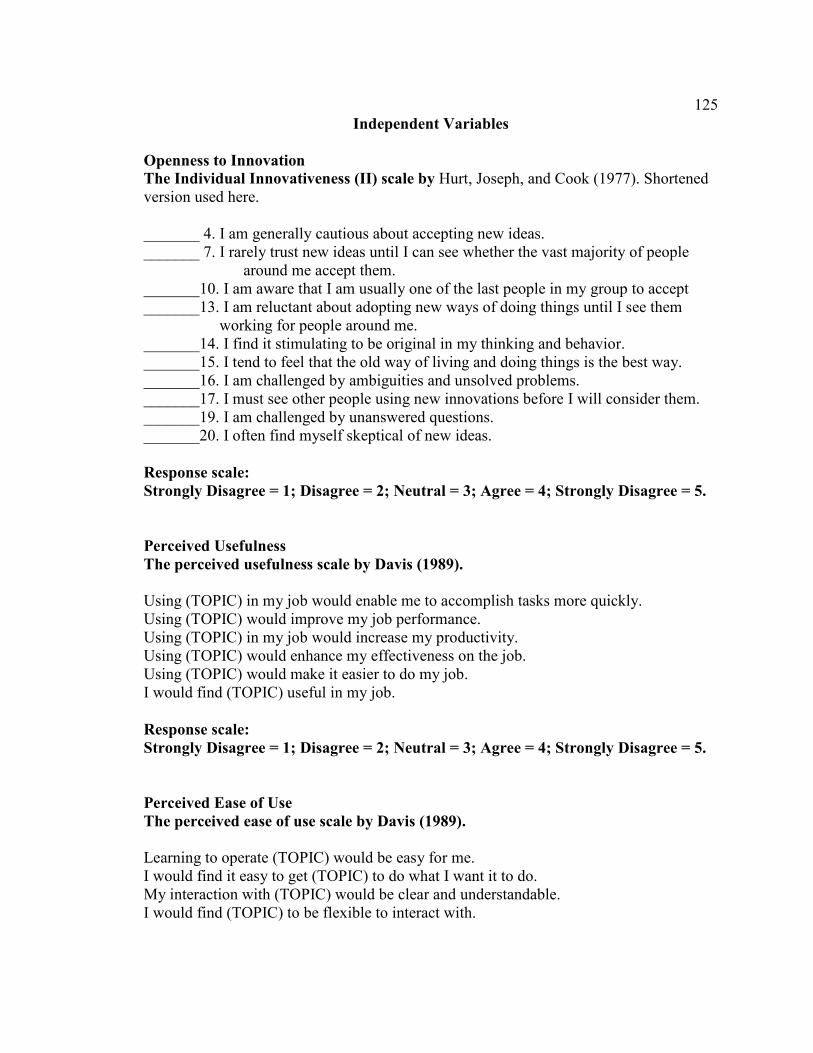
125
Independent Variables
Openness to Innovation
The Individual Innovativeness (II) scale by Hurt, Joseph, and Cook (1977). Shortened version used here.
_______ 4. I am generally cautious about accepting new ideas. _______ 7. I rarely trust new ideas until I can see whether the vast majority of people around me accept them. _______10. I am aware that I am usually one of the last people in my group to accept _______13. I am reluctant about adopting new ways of doing things until I see them working for people around me. _______14. I find it stimulating to be original in my thinking and behavior. _______15. I tend to feel that the old way of living and doing things is the best way. _______16. I am challenged by ambiguities and unsolved problems. _______17. I must see other people using new innovations before I will consider them. _______19. I am challenged by unanswered questions. _______20. I often find myself skeptical of new ideas.
Response scale: Strongly Disagree = 1; Disagree = 2; Neutral = 3; Agree = 4; Strongly Disagree = 5.
Perceived Usefulness
The perceived usefulness scale by Davis (1989). Using (TOPIC) in my job would enable me to accomplish tasks more quickly. Using (TOPIC) would improve my job performance. Using (TOPIC) in my job would increase my productivity. Using (TOPIC) would enhance my effectiveness on the job. Using (TOPIC) would make it easier to do my job. I would find (TOPIC) useful in my job.
Response scale: Strongly Disagree = 1; Disagree = 2; Neutral = 3; Agree = 4; Strongly Disagree = 5.
Perceived Ease of Use
The perceived ease of use scale by Davis (1989). Learning to operate (TOPIC) would be easy for me. I would find it easy to get (TOPIC) to do what I want it to do. My interaction with (TOPIC) would be clear and understandable. I would find (TOPIC) to be flexible to interact with.
126
It would be easy for me to become skillful at using (TOPIC). I would find (TOPIC) easy to use.
Response scale: Strongly Disagree = 1; Disagree = 2; Neutral = 3; Agree = 4; Strongly Disagree = 5. NOTE: (TOPIC) can assume whatever value we wish. In the current project, it might be best to have (TOPIC) be Enterprise Resource Planning (ERP) software. Questions can also be altered so that the company (and not the individual) is the target of the question (Davis, 1989).

127
Statistical Controls
Approximately how many employees are at your company? Please write your answer in the box below ______________ Does your company engage in any internet-based commerce?
• Yes
• No What is your gender?
• Male
• Female What is your age? Please write your answer in the box below ______________ What is the highest level of education you have achieved?
• At least a high school diploma
• Some college, but no degree
• Bachelor’s degree
• Master’s degree
• Doctoral degree
• Professional degree (such as a medical degree or law degree)
• Other (please write your answer in the box below ______________)
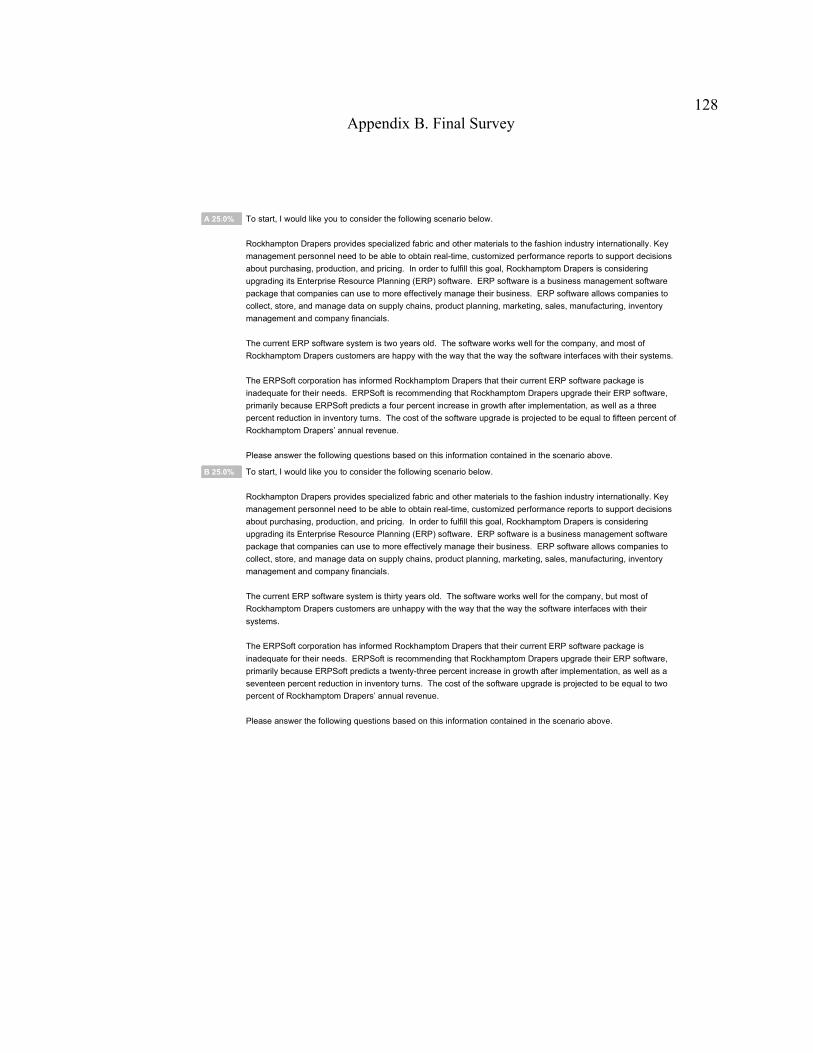
128
Appendix B. Final Survey
A 25.0% To start, I would like you to consider the following scenario below.
Rockhampton Drapers provides specialized fabric and other materials to the fashion industry internationally. Key
management personnel need to be able to obtain real-time, customized performance reports to support decisions
about purchasing, production, and pricing. In order to fulfill this goal, Rockhamptom Drapers is considering
upgrading its Enterprise Resource Planning (ERP) software. ERP software is a business management software
package that companies can use to more effectively manage their business. ERP software allows companies to
collect, store, and manage data on supply chains, product planning, marketing, sales, manufacturing, inventory
management and company financials.
The current ERP software system is two years old. The software works well for the company, and most of
Rockhamptom Drapers customers are happy with the way that the way the software interfaces with their systems.
The ERPSoft corporation has informed Rockhamptom Drapers that their current ERP software package is
inadequate for their needs. ERPSoft is recommending that Rockhamptom Drapers upgrade their ERP software,
primarily because ERPSoft predicts a four percent increase in growth after implementation, as well as a three
percent reduction in inventory turns. The cost of the software upgrade is projected to be equal to fifteen percent of
Rockhamptom Drapers’ annual revenue.
Please answer the following questions based on this information contained in the scenario above.
B 25.0% To start, I would like you to consider the following scenario below.
Rockhampton Drapers provides specialized fabric and other materials to the fashion industry internationally. Key
management personnel need to be able to obtain real-time, customized performance reports to support decisions
about purchasing, production, and pricing. In order to fulfill this goal, Rockhamptom Drapers is considering
upgrading its Enterprise Resource Planning (ERP) software. ERP software is a business management software
package that companies can use to more effectively manage their business. ERP software allows companies to
collect, store, and manage data on supply chains, product planning, marketing, sales, manufacturing, inventory
management and company financials.
The current ERP software system is thirty years old. The software works well for the company, but most of
Rockhamptom Drapers customers are unhappy with the way that the way the software interfaces with their
systems.
The ERPSoft corporation has informed Rockhamptom Drapers that their current ERP software package is
inadequate for their needs. ERPSoft is recommending that Rockhamptom Drapers upgrade their ERP software,
primarily because ERPSoft predicts a twenty-three percent increase in growth after implementation, as well as a
seventeen percent reduction in inventory turns. The cost of the software upgrade is projected to be equal to two
percent of Rockhamptom Drapers’ annual revenue.
Please answer the following questions based on this information contained in the scenario above.

129
C 25.0% To start, I would like you to consider the following scenario below.
Rockhampton Drapers provides specialized fabric and other materials to the fashion industry internationally. Key
management personnel need to be able to obtain real-time, customized performance reports to support decisions
about purchasing, production, and pricing. In order to fulfill this goal, Rockhamptom Drapers is considering
upgrading its Enterprise Resource Planning (ERP) software. ERP software is a business management software
package that companies can use to more effectively manage their business. ERP software allows companies to
collect, store, and manage data on supply chains, product planning, marketing, sales, manufacturing, inventory
management and company financials.
The current ERP software system is thirty years old. The software works well for the company, and most of
Rockhamptom Drapers customers are happy with the way that the way the software interfaces with their systems.
The ERPSoft corporation has informed Rockhamptom Drapers that their current ERP software package is
inadequate for their needs. ERPSoft is recommending that Rockhamptom Drapers upgrade their ERP software,
primarily because ERPSoft predicts a twenty-three percent increase in growth after implementation, as well as a
three percent reduction in inventory turns. The cost of the software upgrade is projected to be equal to two percent
of Rockhamptom Drapers’ annual revenue.
Please answer the following questions based on this information contained in the scenario above.
D 25.0% To start, I would like you to consider the following scenario below.
Rockhampton Drapers provides specialized fabric and other materials to the fashion industry internationally. Key
management personnel need to be able to obtain real-time, customized performance reports to support decisions
about purchasing, production, and pricing. In order to fulfill this goal, Rockhamptom Drapers is considering
upgrading its Enterprise Resource Planning (ERP) software. ERP software is a business management software
package that companies can use to more effectively manage their business. ERP software allows companies to
collect, store, and manage data on supply chains, product planning, marketing, sales, manufacturing, inventory
management and company financials.
The current ERP software system is two years old. The software works well for the company, but most of
Rockhamptom Drapers customers are unhappy with the way that the way the software interfaces with their
systems.
The ERPSoft corporation has informed Rockhamptom Drapers that their current ERP software package is
inadequate for their needs. ERPSoft is recommending that Rockhamptom Drapers upgrade their ERP software,
primarily because ERPSoft predicts a four percent increase in growth after implementation, as well as a seventeen
percent reduction in inventory turns. The cost of the software upgrade is projected to be equal to fifteen percent of
Rockhamptom Drapers’ annual revenue.
Please answer the following questions based on this information contained in the scenario above.
2. The capacity to analyze ERP data is a high priority for Rockhampton Drapers.
Yes
No
3. More market research is needed to guide the decision about purchasing the new software.
Yes
No

130
C 25.0% To start, I would like you to consider the following scenario below.
Rockhampton Drapers provides specialized fabric and other materials to the fashion industry internationally. Key
management personnel need to be able to obtain real-time, customized performance reports to support decisions
about purchasing, production, and pricing. In order to fulfill this goal, Rockhamptom Drapers is considering
upgrading its Enterprise Resource Planning (ERP) software. ERP software is a business management software
package that companies can use to more effectively manage their business. ERP software allows companies to
collect, store, and manage data on supply chains, product planning, marketing, sales, manufacturing, inventory
management and company financials.
The current ERP software system is thirty years old. The software works well for the company, and most of
Rockhamptom Drapers customers are happy with the way that the way the software interfaces with their systems.
The ERPSoft corporation has informed Rockhamptom Drapers that their current ERP software package is
inadequate for their needs. ERPSoft is recommending that Rockhamptom Drapers upgrade their ERP software,
primarily because ERPSoft predicts a twenty-three percent increase in growth after implementation, as well as a
three percent reduction in inventory turns. The cost of the software upgrade is projected to be equal to two percent
of Rockhamptom Drapers’ annual revenue.
Please answer the following questions based on this information contained in the scenario above.
D 25.0% To start, I would like you to consider the following scenario below.
Rockhampton Drapers provides specialized fabric and other materials to the fashion industry internationally. Key
management personnel need to be able to obtain real-time, customized performance reports to support decisions
about purchasing, production, and pricing. In order to fulfill this goal, Rockhamptom Drapers is considering
upgrading its Enterprise Resource Planning (ERP) software. ERP software is a business management software
package that companies can use to more effectively manage their business. ERP software allows companies to
collect, store, and manage data on supply chains, product planning, marketing, sales, manufacturing, inventory
management and company financials.
The current ERP software system is two years old. The software works well for the company, but most of
Rockhamptom Drapers customers are unhappy with the way that the way the software interfaces with their
systems.
The ERPSoft corporation has informed Rockhamptom Drapers that their current ERP software package is
inadequate for their needs. ERPSoft is recommending that Rockhamptom Drapers upgrade their ERP software,
primarily because ERPSoft predicts a four percent increase in growth after implementation, as well as a seventeen
percent reduction in inventory turns. The cost of the software upgrade is projected to be equal to fifteen percent of
Rockhamptom Drapers’ annual revenue.
Please answer the following questions based on this information contained in the scenario above.
2. The capacity to analyze ERP data is a high priority for Rockhampton Drapers.
Yes
No
3. More market research is needed to guide the decision about purchasing the new software.
Yes
No

131
4. In your professional opinion, should Rockhampton Drapers proceed with the purchase of the new
software?
Yes
No
For each of the statements below, please indicate whether you strongly agree, agree, disagree, or strongly disagree with the statement.
Please answer each statement below honestly.
5. I am generally cautious about accepting new ideas.
Strongly disagree
Disagree
Neutral
Agree
Strongly agree
6. I rarely trust new ideas until I can see whether the vast majority of people around me accept them.
Strongly disagree
Disagree
Neutral
Agree
Strongly agree
7. I am aware that I am usually one of the last people in my group to accept something new.
Strongly disagree
Disagree
Neutral
Agree
Strongly agree
8. I am reluctant about adopting new ways of doing things until I see them working for people around me.
Strongly disagree
Disagree
Neutral
Agree
Strongly agree
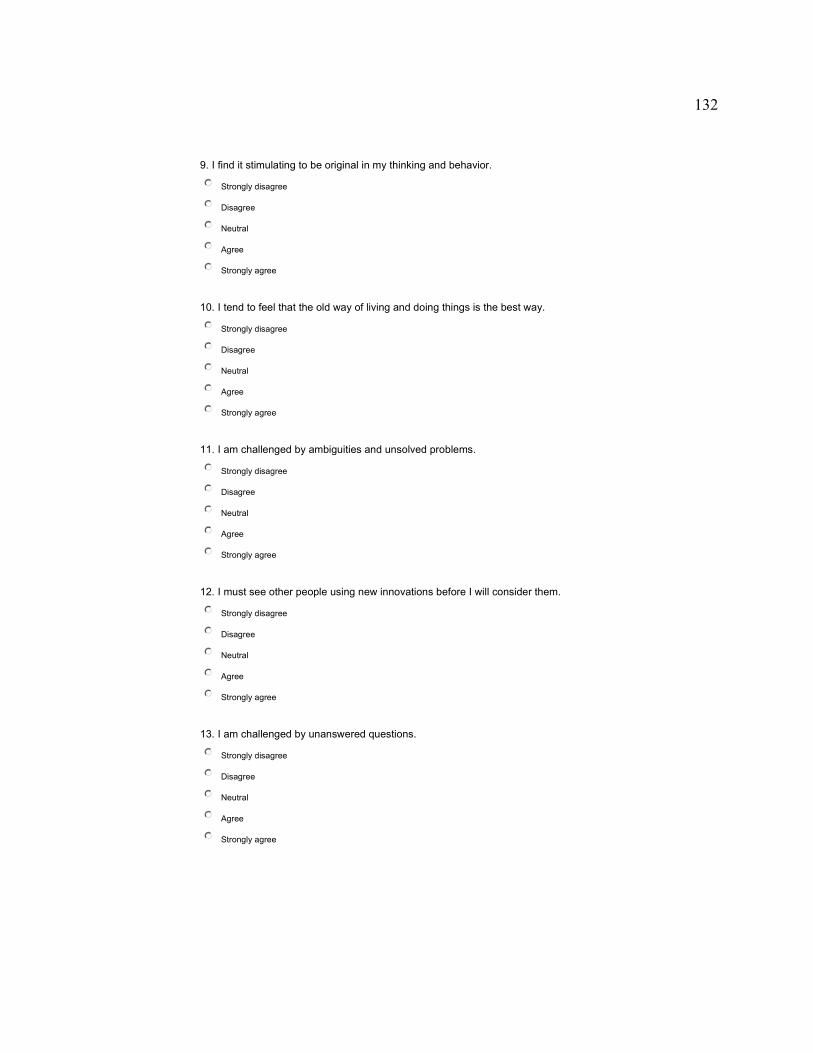
132
9. I find it stimulating to be original in my thinking and behavior.
Strongly disagree
Disagree
Neutral
Agree
Strongly agree
10. I tend to feel that the old way of living and doing things is the best way.
Strongly disagree
Disagree
Neutral
Agree
Strongly agree
11. I am challenged by ambiguities and unsolved problems.
Strongly disagree
Disagree
Neutral
Agree
Strongly agree
12. I must see other people using new innovations before I will consider them.
Strongly disagree
Disagree
Neutral
Agree
Strongly agree
13. I am challenged by unanswered questions.
Strongly disagree
Disagree
Neutral
Agree
Strongly agree
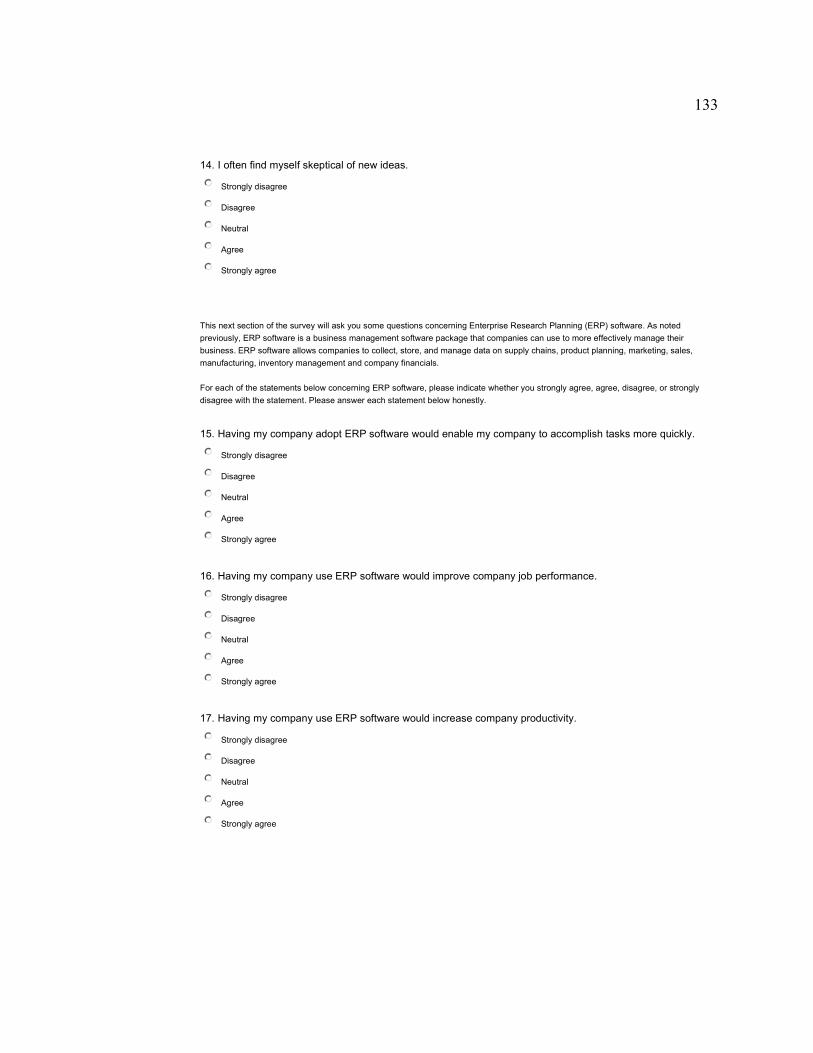
133
14. I often find myself skeptical of new ideas.
Strongly disagree
Disagree
Neutral
Agree
Strongly agree
This next section of the survey will ask you some questions concerning Enterprise Research Planning (ERP) software. As noted
previously, ERP software is a business management software package that companies can use to more effectively manage their
business. ERP software allows companies to collect, store, and manage data on supply chains, product planning, marketing, sales,
manufacturing, inventory management and company financials.
For each of the statements below concerning ERP software, please indicate whether you strongly agree, agree, disagree, or strongly
disagree with the statement. Please answer each statement below honestly.
15. Having my company adopt ERP software would enable my company to accomplish tasks more quickly.
Strongly disagree
Disagree
Neutral
Agree
Strongly agree
16. Having my company use ERP software would improve company job performance.
Strongly disagree
Disagree
Neutral
Agree
Strongly agree
17. Having my company use ERP software would increase company productivity.
Strongly disagree
Disagree
Neutral
Agree
Strongly agree
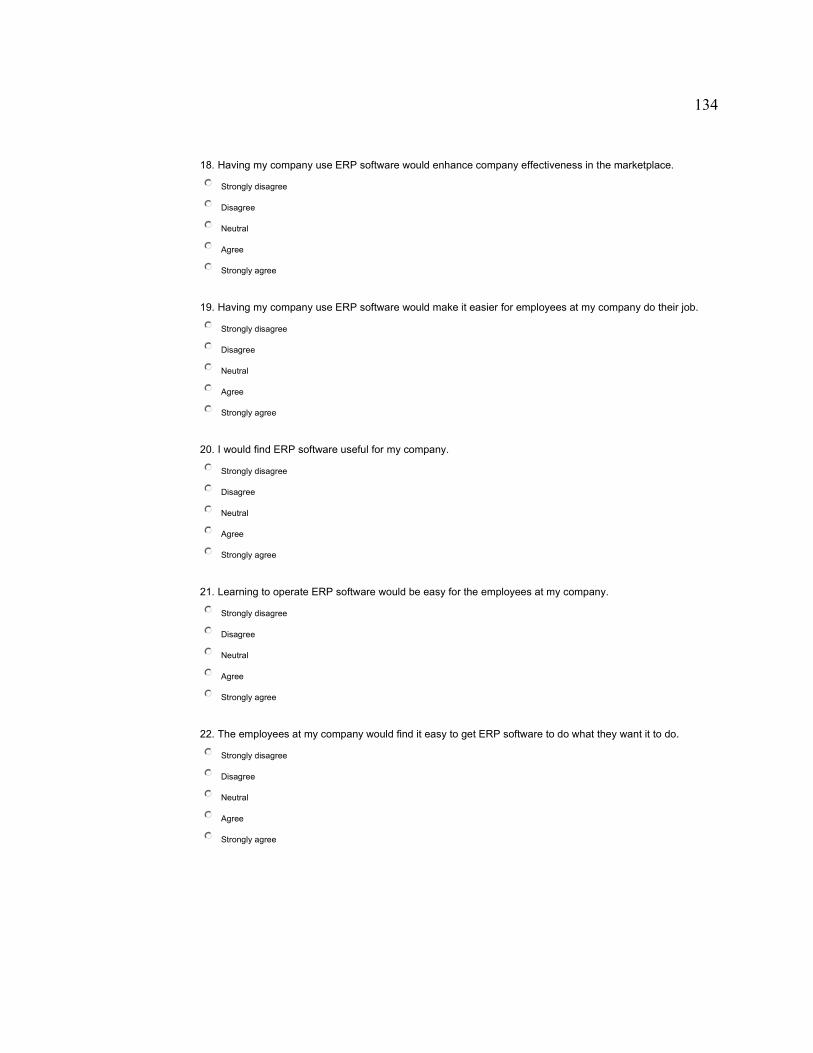
134
18. Having my company use ERP software would enhance company effectiveness in the marketplace.
Strongly disagree
Disagree
Neutral
Agree
Strongly agree
19. Having my company use ERP software would make it easier for employees at my company do their job.
Strongly disagree
Disagree
Neutral
Agree
Strongly agree
20. I would find ERP software useful for my company.
Strongly disagree
Disagree
Neutral
Agree
Strongly agree
21. Learning to operate ERP software would be easy for the employees at my company.
Strongly disagree
Disagree
Neutral
Agree
Strongly agree
22. The employees at my company would find it easy to get ERP software to do what they want it to do.
Strongly disagree
Disagree
Neutral
Agree
Strongly agree
135
28. Does your company engage in any internet-based commerce?
Yes
No
29. What is your gender?
Male
Female
30. What is your age? Please write your answer in the blank.
31. What is the highest level of education you have achieved?
Other (please write your answer in the blank)
At least a high school diploma
Some college, but no degree
Bachelor’s degree
Master’s degree
Doctoral degree
Professional degree (such as a medical degree or law degree)
Thank you for taking the time to complete this survey!

136
23. Employee interaction with ERP software would be clear and understandable.
Strongly disagree
Disagree
Neutral
Agree
Strongly agree
24. Employees at my company would find ERP software to be flexible to interact with.
Strongly disagree
Disagree
Neutral
Agree
Strongly agree
25. Employees at my company would be easy to become skillful at using ERP software.
Strongly disagree
Disagree
Neutral
Agree
Strongly agree
26. Employees at my company would find ERP software easy to use.
Strongly disagree
Disagree
Neutral
Agree
Strongly agree
You’re almost done with the survey. All that remains are a final few questions that will help me to better classify your responses.
Please remember to fill out each question below honestly, and please know that none of your answers will be linked back to you in any
way.
27. Approximately how many employees are at your company? Please write your answer in the blank.

137
Appendix C. Survey Consent Form
My name is Michael Bertini, and I am inviting you to take part in a doctoral research project study that will examine the relationship
between openness to innovation and decisions concerning innovation. The title of the project is The Impact of Technology Acceptance
and Openness to Innovation on Software Implementation.
You are being invited to participate in this survey because you are a senior management executive of a small to medium business
(SMB) firm that utilizes Enterprise Research Planning (ERP) software systems in the United States. Please know that before you can
participate, you will need to take part in a process called “informed consent” that will allow you to make a voluntary and informed
decision as to whether you would like to participate.
Please know that the purpose of this study is to identify conditions in which senior managers are likely to determine whether or not to
adopt innovations relating to ERP systems. You will be asked to participate in an online survey, and the survey will take approximately
7 to 10 minutes of your time to complete.
Voluntary Nature of the Study:
This study is voluntary in nature. Everyone will respect your decision of whether or not you choose to be in the study. No one will treat
you differently if you decide not to be in the study. If you decide to join the study now, you can still change your mind later. You may
stop at any time.
Risks and Benefits of Being in the Study:
Participation in this study involves poses no appreciable risk to you, as you will be asked to do an activity that is often encountered in
daily life (i.e., filling out an online survey). Please know that the anticipated benefits of this project for society is that we will have a
better understanding of how technology acceptance and openness to innovation impacts the decision of senior managers to adopt
software innovations.
Payment:
There will be no payment, thank you gifts, or reimbursements that will be provided to you for your participation.
Privacy:
All information that you will provide will be anonymous. The researcher will not use your personal information for any purposes outside
of this research project. Also, the researcher will not link your name, email address, computer IP address or anything else that could
identify you to the answers you provide in the survey. Data will be kept secure at all times behind a computer firewall and all data will
be password encrypted. Data will be kept for a period of at least 5 years, as required by the university.
Contacts and Questions:
If you have any questions, you may contact the primary researcher, Michael Bertini, at [email protected], or via telephone at 1-612-
805-2108. If you want to talk privately about your rights as a participant, you can also contact the chair of Walden University’s IRB,
Leilani Endicott, at [email protected]. Walden University’s approval number for this study is 05-14-15-0189242 and it expires on May
13, 2016.
Statement of Consent:
I have read the above information and I feel I understand the study well enough to make a decision about my involvement. By filling
out the online survey, I understand that I am agreeing to the terms described above.
To protect your privacy, no consent signature is requested. Instead, your completion of the survey will indicate your consent, if you
choose to volunteer. Please know that you may print a copy of this consent form or save a copy of this consent form at this time.
1. Do you wish to continue with the survey? Please know that clicking 'yes' indicates your consent to continue
with the survey. Clicking 'no' will end your participation.
Yes
No