THE IMPACT OF STATE GUARANTEES ON BANKS … of Governance and Regulation / Volume ... 2014 42 THE...
16
Journal of Governance and Regulation / Volume 3, Issue 1, 2014 42 THE IMPACT OF STATE GUARANTEES ON BANKS’ RATINGS AND RISK BEHAVIOUR Jacob Kleinow*, Andreas Horsch** Abstract State guarantees are supposed to have positive influence on banks’ ratings as they provide an additional safety net to depositors while lending the guarantor’s creditworthiness to the bank. Based hereupon, we research if and to what extent guarantees perceptibly affect market prices of securities issued by banks. Our results indicate that banks receive governmental rating subsidies of up to 7 notches depending on the region. Furthermore, literature suggests that guarantees and subsequent bailout expectations increase the risk appetite of banks enjoying this governmental support, as protected actors feel less incentivized to apply market discipline. Based hereupon, we consider the possibility of reversed causality: Is the probability of bailouts correlated to a bank’s risk taking? Analysing the drivers of governmental support for different types of banks, we find that governments are particularly willing to bail out (traditional commercial) banks with low returns on investment, or weak share performance, and a higher exposure to risk. JEL classification: G18; G33; G28 Keywords: TBTF, SIFI, Rating, Systemic Risk, Moral Hazard, Implicit Guarantee * Freiberg University, Chair of Investment and Finance, Lessingstr. 45, 09599 Freiberg, Germany Tel.: +493731392420 E-mail: [email protected] ** Freiberg University, Chair of Investment and Finance, Lessingstr. 45, 09599 Freiberg, Germany Tel.: +493731392005 E-mail: [email protected] 1. Introduction To discuss the institutional function of banks and non-bank financial institutions in ‘capitalist’-oriented states has a long tradition and gained particular momentum since the 1950s 39 . In recent years, the worldwide financial and economic crisis between 2007 and 2011 showed once again that the development of national economies depends on the well-being of particular, systemically important financial institutions 40 . Being aware of that fact, market participants tested the resilience of the banking sector, and were proven right: During the crisis, governments had been intervening in the financial market on several occasions trying to avert the insolvency of institutions they deemed global systemically important banks (G-SIBs), thereby accepting high government re-indebtedness. 41 39 See with further references Moosa (2010), p. 11; Schönfelder (2012), p. 12. 40 See for statements on level of the G20: G20 (2008), p. 1 and 3 as well as G20 (2009), p. 3. 41 For a comparative overview of (the compatibility of) European and US interventions since the financial crisis, see Goldstein/Veron (2012). However, as shown in the course of the crisis, ‘smaller’ banks received financial aid, too. If financial institutions (and, among them, mainly credit institutions) are overtly or covertly categorised as being systemically important, they gain an additional safety net shielding them from insolvency 42 . Traditionally, this approach – and its contradiction to market economic principles – is justified by politicians and regulators on the basis of the argument that the economic costs of a market exit of a systemically important bank are higher than the costs of a bailout by the government, and that the stability of the financial system is a public good anyway. Therefore, it seems obvious that some financial institutions and in particular banks receive a kind of subsidies from their governments in general. However, the value of this governmental support waits to be estimated. This paper provides a clear and traceable way for the (1) identification and (2) valuation of governmental support for banks by analysing the support embedded in their credit ratings. Prior research on the topic of implicit 42 See representatively Stern/Feldman (2004), pp. 17-18, and Moss (2009), p. 1f.
Transcript of THE IMPACT OF STATE GUARANTEES ON BANKS … of Governance and Regulation / Volume ... 2014 42 THE...

Journal of Governance and Regulation / Volume 3, Issue 1, 2014
42
THE IMPACT OF STATE GUARANTEES ON BANKS’ RATINGS AND RISK BEHAVIOUR
Jacob Kleinow*, Andreas Horsch**
Abstract
State guarantees are supposed to have positive influence on banks’ ratings as they provide an additional safety net to depositors while lending the guarantor’s creditworthiness to the bank. Based hereupon, we research if and to what extent guarantees perceptibly affect market prices of securities issued by banks. Our results indicate that banks receive governmental rating subsidies of up to 7 notches depending on the region. Furthermore, literature suggests that guarantees and subsequent bailout expectations increase the risk appetite of banks enjoying this governmental support, as protected actors feel less incentivized to apply market discipline. Based hereupon, we consider the possibility of reversed causality: Is the probability of bailouts correlated to a bank’s risk taking? Analysing the drivers of governmental support for different types of banks, we find that governments are particularly willing to bail out (traditional commercial) banks with low returns on investment, or weak share performance, and a higher exposure to risk. JEL classification: G18; G33; G28 Keywords: TBTF, SIFI, Rating, Systemic Risk, Moral Hazard, Implicit Guarantee * Freiberg University, Chair of Investment and Finance, Lessingstr. 45, 09599 Freiberg, Germany Tel.: +493731392420 E-mail: [email protected] ** Freiberg University, Chair of Investment and Finance, Lessingstr. 45, 09599 Freiberg, Germany Tel.: +493731392005 E-mail: [email protected]
1. Introduction
To discuss the institutional function of banks and
non-bank financial institutions in ‘capitalist’-oriented
states has a long tradition and gained particular
momentum since the 1950s39
. In recent years, the
worldwide financial and economic crisis between
2007 and 2011 showed once again that the
development of national economies depends on the
well-being of particular, systemically important
financial institutions40
. Being aware of that fact,
market participants tested the resilience of the
banking sector, and were proven right: During the
crisis, governments had been intervening in the
financial market on several occasions trying to avert
the insolvency of institutions they deemed global
systemically important banks (G-SIBs), thereby
accepting high government re-indebtedness.41
39
See with further references Moosa (2010), p. 11; Schönfelder (2012), p. 12.
40 See for statements on level of the G20: G20 (2008), p. 1
and 3 as well as G20 (2009), p. 3. 41
For a comparative overview of (the compatibility of) European and US interventions since the financial crisis, see Goldstein/Veron (2012).
However, as shown in the course of the crisis,
‘smaller’ banks received financial aid, too.
If financial institutions (and, among them,
mainly credit institutions) are overtly or covertly
categorised as being systemically important, they
gain an additional safety net shielding them from
insolvency42
. Traditionally, this approach – and its
contradiction to market economic principles – is
justified by politicians and regulators on the basis of
the argument that the economic costs of a market exit
of a systemically important bank are higher than the
costs of a bailout by the government, and that the
stability of the financial system is a public good
anyway.
Therefore, it seems obvious that some financial
institutions and in particular banks receive a kind of
subsidies from their governments in general.
However, the value of this governmental support
waits to be estimated. This paper provides a clear and
traceable way for the (1) identification and (2)
valuation of governmental support for banks by
analysing the support embedded in their credit
ratings. Prior research on the topic of implicit
42
See representatively Stern/Feldman (2004), pp. 17-18, and Moss (2009), p. 1f.

Journal of Governance and Regulation / Volume 3, Issue 1, 2014
43
government subsidies for banks – although with
differing approaches – has been done by Soussa
(2000), Morgan/Stiroh (2005), Rime (2005) and
Schich/Lindh (2012). To this the authors’ knowledge,
only Ueda/Weder di Mauro (2013) use a comparable
approach to valuate rating and financing subsidies for
banks.
The remainder of this paper is structured as
follows. Section 2 outlines the general rationale and
problem of governmental guarantees. In Section 3,
the type of rating used for analysis of state guarantees
is defined, followed by a descriptive presentation of
the distribution of explanatory variables of the
banking (sub-)samples. Section 4 starts with a brief
presentation of the empirical regression methodology
and subsequently depicts the results for the estimation
of governmental support. A novel connection from
rating spreads to banking financials is presented in
Section 5 to assess determinants of government
support for banks. Section 6 concludes with remarks
on policy implications.
2. The Basic Rationale and Problem of Governmental Guarantees
In a market economy, governments are allowed to
intervene only if a market failure is detected which
can be corrected effectively and efficiently by the
intervention. Regardless of these requirements,
governments de facto intervene for various reasons,
some of them still rooted in public interest
considerations, some in personal interest
considerations of political and regulatory
entrepreneurs. This is why regulation always will be
as imperfect as the markets it is aimed at – and
sometimes even worsen things.43
In most countries, the entirety of governmental
intervention in the banking market is a complex
structure of a considerable number of written and
unwritten rules and organizations executing them. As
well most countries share the basic rationale of
banking regulation, which is based on (1) depositor
protection and (2) system protection.44
Pivot human
actors are private household depositors of banks who
lend debt capital to banks in spite of the opaqueness
of these financial institutions, which exposes them to
various risks rooted in asymmetric information, i.e.
forms of adverse selection and moral hazard on the
banks’ side45
. As a bank failure would hit them
inappropriately hard, these consumers are deemed
43
On the two-sided imperfection, see in particular Benston (1998), p. 13. For an explicitly skeptical view on regulation, see the Austrian works as of von Mises, e.g. von Mises (1949), p. 854.
44 Because of their interconnectedness, and the
comparably little opaqueness of banking, depositor protection has been criticized to be no sufficient single rationale for banking regulation, see e.g. Benston (2000).
45 On the opaqueness of banks as seen by depositors, see
in particular the seminal contributions of Douglas Diamond, i.e. Diamond/Dybvig (1983); Diamond (1984); Diamond (1989).
protection-worthy; because they have limited abilities
to distinguish bad banks from good banks, and thus
base their lending on trust considerably, and are
prone to panic, they are deemed protection-needy,
too. Furthermore, protecting depositors helps to
dissuade them from starting a run on their bank,
which would inevitably lead to the institution’s
failure because of a combination of insufficient
liquidity to meet all withdrawal demands and losses
incurred during subsequent fire sales of bank assets.
In the end, depositor protection serves the aim of
system protection, too: All the banks build a closely
knit network, and a run on one bank will not remain
an isolated event, but will contagiously affect an
unknown number of connected banks thereafter. This
particularly holds for banks that are of special
meaning, making them too-important-to(-be-allowed-
to)-fail, usually abbreviated to too-big-to-fail
(TBTF)46
.
Under imperfect knowledge and fundamental
uncertainty, governmental intervention cannot
prevent any bank failure in the first place.
Consequently, most financial systems do not only
contain the continuous regulation and supervision of
banks which is designed to preclude or at least detect
unsound practices early, allowing for regulatory
countermeasures. Additionally, special institutions
are designed to prevent either a bank failure itself a
priori or too serious consequences of it a posteriori.
Partly, these special organizations are set up to rescue
a bank or its customers, i.e. deposit insurance
schemes47
and lenders-of-last-resort (LOLR)48
. The
principle of the latter can be summarized as follows:
If a bank fails, politicians and regulators have to
evaluate the probable consequences. If they conclude
that those would be more unwelcome than a rescue
mission that violates market economic principles,
they intervene in the market by bailing out the bank.
Governmental guarantees represent a particular
case of LOLR – and of insurance: The government
promises to rescue a certain bank in a situation where
its economic survival is endangered. Unfortunately,
this not only means rescue in case of urgency, but
also induces particular moral hazard before: “Any
form of insurance, and liquidity and capital support
are no exception in this respect, creates moral
hazard.”49
According to the market discipline
46
The term ‘too big to fail’ (TBTF) is misleading and is often wrongly understood, but has established itself as part of the political, and scientific discussion. For an explanation of the origins of the phrase, see Safire (2008).
47 On the (history of the) concept of deposit insurance, see
(in brief) Calomiris (1990); and (extensively) the compilation edited by Campbell et al. (2007). On the costliness of government deposit insurance, see Hogan/Luther (2014).
48 The concept goes back to Henry Thornton and – later –
Walter Bagehot and their considerations on the role of a central bank; for encompassing retrospectives including a history of thought, see Goodhart (1999), pp. 340-342; Humphrey (2010), pp. 334-352.
49 Freixas et al. (2000), p. 73.

Journal of Governance and Regulation / Volume 3, Issue 1, 2014
44
hypothesis50
this moral hazard is attributed to
guarantees because they are deemed to incentivize the
beneficiaries as well as decision-makers in banks to
reduce prudent action while engaging in riskier
activities. Normally, bank managers would measure
chances of a decision against the risk of stakeholder
pressure and job loss. But if they interpret a
governmental guarantee of their bank as a job
guarantee, they are prone to neglect (even high) risk
and to focus on return only instead. Normally,
stakeholders would sanction riskier policies by
demanding compensation, in particular by adding risk
premia to the (interest) rate they call for. But if they
are sure of the persistence of their bank due to
governmental guarantees, they might reduce their
corporate control activities and waive the necessary
risk premium.
At first sight, governmental guarantees seem to
be nothing but large-scale credit insurance, as the
government promises compensation in cases of
insolvency of the bank as the debtor. Obviously, a
bank profits from such a guarantee as part of the
creditworthiness of the guarantor is attributed to the
guarantee. Consequently, its access to capital
becomes easier and less costly. At second sight,
guarantees provide a second positive effect on a
systemic level. Also on this level, it is a characteristic
feature of these governmental guarantees that if they
seem trustworthy, they will be a promise that is not
going to be tested – because it is so widely believed,
as can be illustrated by the following example: For
reasons named above, it has been hardly discussed
that depositors of German banks had started to
withdraw funds in the autumn of 2008, after the
world had observed the insolvency of Lehman Bros.,
a company that had seemed to be a prototype of a
TBTF, thus governmentally guaranteed bank.51
The
German government decided to stop the evolving
withdrawal process by making a very encompassing
governmental guarantee explicit: Chancellor Merkel
and Minister of Finance Steinbrück appeared on TV,
stating that savings deposits of depositors were safe.52
Although it is more than doubtful that the government
would be have been able to stand up for more than €
500 billion, the general guarantee announced could
restore confidence and brought withdrawals to an
end.
The value of a guarantee depends significantly
on the confidence market participants have in it. This
leads to the question if and by which means this value
could be quantified. If a valuation turns out to be
possible, it might also allow for an analysis of drivers
of governmental support.
50
Earliest discussions go back to Merton (1977). For a current analysis of the market discipline hypothesis see Flannery (1998) and Gropp/Vesala/Vulpes (2006).
51 Probably, the insolvency of US-american Lehman Bros.
will remain the most outstanding case regarding size, speed, surprise, and consequence, see e.g. Brunnermeier (2009); Summe (2009).
52 See e.g. Dougherty (2008).
3. Data and Samples Description
The most widely known and communicated rating
class for financial institutions is the long term issuer
credit rating (LT issuer rating) that “opines on an
entity’s relative vulnerability to default on financial
obligations”53
. Besides the overall LT issuer rating,
the rating agency Fitch Ratings54
provides a viability
rating measuring an institution’s intrinsic
creditworthiness, a support rating floor and a support
rating measuring the probability of governmental /
parental support. This enables the separation of the
external support element in banks’ LT issuer ratings.
Fitch defines (1) Viability rating, (2) Support rating
floor and a (3) Support rating as follows (see also
Table 3):
1. “Viability ratings ... represent Fitch’s view
as to the intrinsic creditworthiness of an issuer. …
The [viability rating] excludes any extraordinary
support that may be derived from outside of the entity
as well as excluding potential benefits to a bank’s
financial position from other extraordinary measures,
including a distressed restructuring of liabilities.”55
2. “Support rating floors (SRFs) reflect the
agency's view about the likelihood that the rated
entity will receive extraordinary support, in case of
need, specifically from government authorities
[national authorities, international government
institutions].”56
3. “Support ratings … are Fitch Ratings’
assessment of a potential supporter’s propensity to
support a bank and of its ability to support it. …
Support Ratings do not assess the intrinsic credit
quality of a bank. Rather they communicate the …
judgment on whether a bank would receive support
should this become necessary.”57
53
Fitch Ratings (2013), p. 9. 54
Fitch, the third-largest rating agency after S&P’s and Moody’s has approx. 350,000 outstanding ratings (see SEC [2012], p. 6).
55 Fitch Ratings (2013), p. 25.
56 Ibid, p. 23.
57 Ibid, p. 24.
Journal of Governance and Regulation / Volume 3, Issue 1, 2014
45
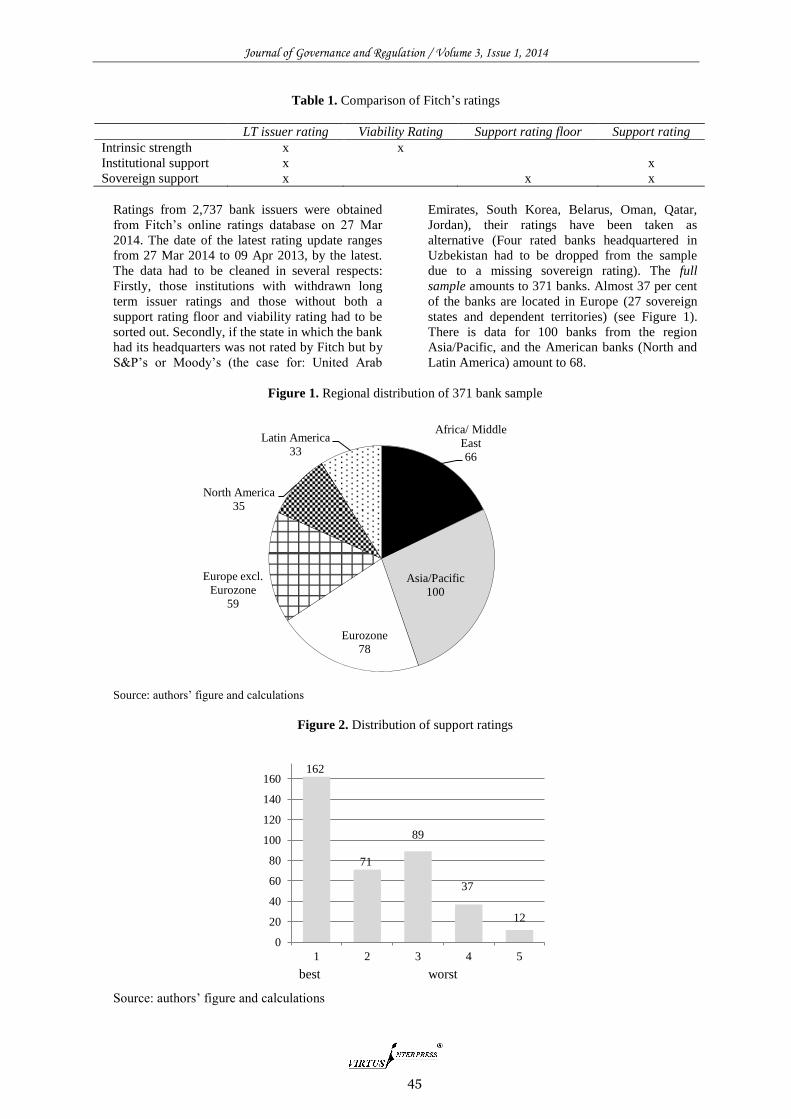
Table 1. Comparison of Fitch’s ratings
LT issuer rating Viability Rating Support rating floor Support rating
Intrinsic strength x x
Institutional support x x
Sovereign support x x x
Ratings from 2,737 bank issuers were obtained
from Fitch’s online ratings database on 27 Mar
2014. The date of the latest rating update ranges
from 27 Mar 2014 to 09 Apr 2013, by the latest.
The data had to be cleaned in several respects:
Firstly, those institutions with withdrawn long
term issuer ratings and those without both a
support rating floor and viability rating had to be
sorted out. Secondly, if the state in which the bank
had its headquarters was not rated by Fitch but by
S&P’s or Moody’s (the case for: United Arab
Emirates, South Korea, Belarus, Oman, Qatar,
Jordan), their ratings have been taken as
alternative (Four rated banks headquartered in
Uzbekistan had to be dropped from the sample
due to a missing sovereign rating). The full
sample amounts to 371 banks. Almost 37 per cent
of the banks are located in Europe (27 sovereign
states and dependent territories) (see Figure 1).
There is data for 100 banks from the region
Asia/Pacific, and the American banks (North and
Latin America) amount to 68.
Figure 1. Regional distribution of 371 bank sample
Source: authors’ figure and calculations
Figure 2. Distribution of support ratings
Source: authors’ figure and calculations
Africa/ Middle
East
66
Asia/Pacific
100
Eurozone
78
Europe excl.
Eurozone
59
North America
35
Latin America
33
162
71
89
37
12
0
20
40
60
80
100
120
140
160
1 2 3 4 5
best worst

Journal of Governance and Regulation / Volume 3, Issue 1, 2014
46
Figure 3. Distribution of support rating floors in the 371 bank sample
Source: authors’ figure and calculations
Fitch’s rating scales between different products
are matched and numerically transformed: Fitch uses
the AAA rating scale for LT issuer ratings. For
numerical reasons, numeric values from 1 to 20 are
assigned, with 20 denoting the highest rating (AAA)
and 1 denoting D (default) (Note that the modifiers
“+” or “−” may be appended to a rating to denote
relative status within major rating categories. Such
suffixes are not added to the “AAA” category, nor to
categories below “B” (see Fitch [2013], p. 10)). It is
the same with viability ratings, support rating floors
and sovereign ratings of those countries where the
respective banks are headquartered, which are used as
another input variable in the following empirical
analysis (For an overview of the assignments, see
Appendix Table 1).
Unsurprisingly, LT issuer ratings of the full
sample are – on average – higher (~1.3 notches) than
viability ratings, since they consider both the
individual strength (viability rating) and the
probability of a governmental bailout (support rating
floor), as shown in Figure 4 and Table 2. The
histogram in Figure 3 shows the distribution of the
support rating floor. There are a high number of
financial institutions (102) with a rating of “A” or
better at which “the potential provider of support is
very highly rated in its own right and has a very high
propensity to support the bank in question” (Ibid).
Figure 4. Distribution of LT issuer, and viability rating
Source: authors’ figure and calculations
1 0 0 2
31
68 60
13
24
34
52
24
14 14
22
7 5
0 0 0 0
10
20
30
40
50
60
70
AA
A
AA
+
AA
AA
-
A+ A A-
BB
B+
BB
B
BB
B-
BB
+
BB
BB
-
B+ B B-
CC
C
CC C
Def
ault
0
10
20
30
40
50
60
LT Issuer Rating
Viability Rating

Journal of Governance and Regulation / Volume 3, Issue 1, 2014
47
Table 2 below shows descriptive statistics on the
distribution of the LT issuer rating, the viability
rating, and the support rating floor in the full sample
as well as six subsamples, namely:
1. G-SIB: On 11 Nov, 2013, the Financial
Stability Board published an “Update of group of
global [sic] systemically important banks (G-SIBs)”
(Financial Stability Board (2013b), p. 4). The updated
list of that international standard-setter (closely
connected to the BIS) contains 29 global systemically
important banks (G-SIB) (For the list of G-SIB
Banks, see Appendix Table 2). During the last
financial crisis, those institutions sent “shocks
through the financial system which, in turn, harmed
the real economy” (Financial Stability Board (2013a),
p. 2). Since these institutions are deemed too big to
fail (TBTF) – by both the regulator and market
participants – they may receive extraordinarily high
government subsidies. A comparatively high mean
support rating floor of 14.59 supports this assumption
(see Table 2).
To account for regional differences, the
following regional sub-samples are applied:
1. Eurozone: This sample contains data of 78
banks from 18 members of the currency union.
2. Europe excl. Eurozone: This sample
contains data of 59 banks from the 9 sovereign states
and dependent territories on the European continent.
3. North America: This sample merges data of
35 US and Canadian banks. The sovereign ratings of
both countries are identical (Therefore, the standard
deviation is equal to 0).
4. Asia: This sample of 100 banks covers the
Asian continent (including the Pacific region).
5. Latin America: A small Latin America
sample (33 banks) is selected for comparison
purposes.
6. Africa/Middle-East: An Africa/Middle-East
sample (66 banks) is also selected for comparison
purposes.
Table 2. Summary statistics for ratings
LT issuer rating Viabilit rating
Support rating
floor Sovereign rating
Count Mean St.Dev. Mean St.Dev. Mean St.Dev. Mean St.Dev.
Full Sample 371 12.77 3.20 11.45 3.55 11.79 3.27 15.18 4.17
(1) G-SIB 29 15.24 1.15 14.48 2.01 14.59 1.02 18.24 2.50
(2) Eurozone 78 12.87 2.76 10.99 3.74 12.22 2.79 15.71 3.82
(3) Europe excl.
Eurozone 59 12.00 3.95 11.39 4.11 10.73 3.80 14.73 4.98
(4) North America 35 16.03 0.92 15.54 1.82 14.86 0.43 20 -
(5) Latin America 33 11.45 2.53 11.24 2.51 9.94 2.55 11.85 2.27
(6) Africa/ Middle-
East 66 12.82 3.65 10.12 2.95 12.59 3.86 14.85 4.41
(7) Asia/Pacific 100 12.39 2.72 11.36 3.17 11.09 2.67 14.68 3.46
Source: authors’ calculations
4. Estimation of government support for banks
4.1 Methodology
A regression analysis is applied to estimate the value
of government support on the LT issuer rating for
bank i. The dependent variable is the long term issuer
rating (LT_issuer) of bank i. This overall rating of
bank i shall be explained by the bank’s viability
rating (Viability), its support rating floor (Support
rating floor), and the sovereign rating (Sovereign) of
the country where the respective entity’s headquarters
are located. This leads to the following regression
analysis:
Since all variables only take discrete values on an
ordinal scale (1 to 20, or 1 to 5) an ordered probit
regression is applied in Stata.58
We are able to
exclude multicollinearity after calculating the
variance inflation factors and the correlations of the
estimated coefficients (see sppendix Table 4, Table
5).
58
For more information on the use and advantages of the ordered probit regression, see Boes/Winkelmann (2006).

Journal of Governance and Regulation / Volume 3, Issue 1, 2014
48
4.2 Results
Table 3 shows the results of the regression analysis
for the full 696-bank sample and the eight
subsamples. All coefficients - are significant on
a 99 % confidence level. Column 1 (full sample)
indicates that a one-notch increase of the support
rating floor ( is expected to
effect a one-notch increase of LT issuer rating
(LT_issuer) by odds of 0.6184 (= ) or with a
probability of 38.21 % (
), while the other
variables in the model are held constant. The
regression coefficients and for the full sample
have lower values and, thus, a one-notch increase of
the viability or sovereign rating is less likely to
increase the LT issuer rating for one notch (0.4288
odds, e.g. 30.01 %, or 0.3073 odds, e.g. 23.51 %,
respectively).
The subsamples bring even more interesting
results. The high support rating floor coefficient for
banks headquartered in Africa/Middle East – 4.8427
– asserts that the probability of an improvement of
the LT issuer rating caused by a one-notch increase of
the support rating floor is 82.88 % (
).
The results of the North America sample differ
in several respects from those of the other samples:
Firstly – due to comparably equal LT issuer and
support rating floor ratings as well as a low number
of observations –, the model suffers from poor
explanatory power (Pseudo R²=0.2093). Secondly, in
contrast to the rest of the samples, the results indicate
that a one notch increase of the support rating floor is
more likely to reduce (14,29%) than increase the LT
issuer rating of a North American bank. It means that
banks with highest support get lower overall ratings.
One explanation for this result could be that, should it
become necessary, US policy makers are more
willing to bail out those banks with riskiest business
models. The Latin America sample leads to
interesting results, too: A viability rating (61.81 %)
and a sovereign rating (63.82 %) improvement have a
higher impact on the banks’ issuer ratings than the
support rating floor (53.04 %), matching with Fitch’s
assessment that “the evolving dynamics of sovereign
support for senior creditors of banks are not likely to
affect Long-term Issuer […] Ratings […] of Latin
American banks”59
.
LR chi² is the Likelihood Ratio Chi-Square test
(with 2 and 3 degrees of freedom) that at least one of
the coefficients is not equal to zero.
Prob>LR chi² is the probability of obtaining the
Likelihood Ratio Chi-Square test statistic (LR chi²) if
the predictors Viability, Support rating floor and
Sovereign have, in actuality, no impact on the
independent variable LT_issuer.60
Pseudo R² is a
coefficient of determination of McFadden (1977).
Pseudo R² is not an equivalent of R² of the linear
59
Fitch Ratings (2014). 60
See UCLA (2013).
regression, and should be interpreted with great
caution.61
61
McFadden (1977), p. 307: “Values tend to be considerably lower than those of the R² index and should not be judged by the standards for a 'good fit' in ordinary regression analysis. For example, values of 0.2 to 0.4 … represent an excellent fit”.

Journal of Governance and Regulation / Volume 3, Issue 1, 2014
49
Table 3. Regression of banks’ LT issuer ratings - results ordered probit regression
Full
Sample G-SIB Eurozone
Europe
excl
Eurozone
North
America
Latin
America
Africa/
Middle
East
Asia/
Pacific
Viability
rating
0.4288***
0.5236
*** 0.4516
*** 0.9682
*** 0.4474
*** 1.6188
*** 0.8790
*** 0.5211
***
Support
rating
floor
0.6184***
0.8527*** 0.8598
*** 0.7576
***
-
0.1667***
1.1294
*** 4.8427
*** 0.5519
***
Sovereign
rating
0.3073***
0.4416
*** 0.2011
*** 0.3070
*** - 1.7657
*** 1.9493
*** 0.4430
***
cut 1 5.428 23.972 9.911 9.103 3.951 24.261 27.547 9.958
cut 2 7.144 25.323 11.514 11.486 4.939 39.235 50.677 11.414
cut 3 8.962 29.563 13.190 13.179 6.962 42.238 55.923 12.901
cut 4 9.947 30.392 15.179 14.220 - 47.598 71.708 14.330
cut 5 11.112 - 15.705 16.577 - 49.560 79.060 15.897
cut 6 12.223 - 17.381 18.277 - 53.946 81.583 17.369
cut 7 13.686 - 19.657 22.343 - 58.046 95.994 18.654
cut 8 14.722 - 21.306 25.633 - 65.670 107.356 19.923
cut 9 16.090 - 23.123 27.956 - - 114.400 21.468
cut 10 17.573 - 25.220 31.890 - - 118.640 23.406
cut 11 19.169 - 25.685 32.617 - - 128.096 23.939
cut 12 20.688 - 26.022 35.625 - - - -
cut 13 22.312 - - - - - - -
cut 14 24.072 - - - - - - -
cut 15 24.503 - - - - - - -
cut 16 25.128 - - - - - - -
No. of Obs. 371 29 78 59 35 33 66 100
LR chi² (3
df) 993 34 196 192 17
† 107 249 248
Prob>LR
chi² 0.0000 0.0000 0.0000 0.0000 0.0002 0.0000 0.0000 0.0000
Pseudo R² 0.5418 0.4223 0.5552 0.6998 0.2093 0.8281 0.8777 0.5523
*** Coefficient is significant on a 99 % confidence level. † 2 degrees of freedom (df) Source: authors’ calculations with data from Fitch’s online rating database.
Cut 1 - Cut 18 are the values of the estimated
cut points on LT_issuer when Viability, Support
rating floor and Sovereign are evaluated at zero. For
the full sample, the following statements can be
made: Because Cut 1 is 5.428 and Cut 18 is 25.128,
stepping up one notch in the LT issuer rating requires
about 1.3133 (
) of an additional score
increase, potentially drawing from Viability, Support
rating floor and / or Sovereign. Thus if Support rating
floor was the only independent variable that changed,
a one-notch increase would uplift LT_issuer in the
full sample on average by 0.4709 (
);
see Table 4.62
However, 0.4709 is an average value. The effect
of a one-notch government support rating floor
increase differs widely depending on the initial rating
level: Moving from cut 5 to cut 6 (from BB- to BB)
62
This interpretation was first suggested by Ueda/Weder di Mauro (2013), p. 3834.
requires a step of to
increase the LT issuer rating in the amount of one
notch, whereas the move from cut 13 to cut 14 (from
AA- to AA) requires a step of . This would mean that the rating subsidy is
more valuable for those banks with lower LT issuer
ratings. This relation however, does not hold true
throughout the samples. Therefore we can calculate
analogously that a one-notch support rating floor
increase for a B- rated bank is expected to increase
the rating in the amount of 0.56 notches (
).
The expected effect of a one-notch support increase
for an AA rated bank is 0.35 notches (
).

Journal of Governance and Regulation / Volume 3, Issue 1, 2014
50
Table 4. Average notch impact of a one-notch government support rating floor increase on the LT issuer rating
Full
Sample G-SIB Eurozone
Europe excl.
Eurozone
North
America
Latin
America
Africa/
Middle East
Asia/
Pacific
0.4709 0.3985 0.5869 0.3142 -0.1107 0.1909 0.4816 0.3956
Table 4 shows that the highest impact of support
rating floors can be expected for the Eurozone and for
Africa/Middle East. Again, the North American
governments are expected to give the least support
since an increased probability of Government support
is expected to lead to a lower LT issuer rating for a
bank. Latin American banks also receive little
support, perhaps because their governments have
neither the willingness nor the capacity to provide
support should it be required.
By combining the average support rating floor
for each sample (Table 2) and the average effect of a
one-notch government support rating floor increase
on the LT issuer rating in the corresponding sample
(Table 4), an estimation for the overall notch impact
of government support on the LT issuer rating can be
made (Table 5).
Table 5. Overall notch impact of support rating floor on the LT issuer rating
Full
Sample
G-
SIB Eurozone
Europe excl.
Eurozone
North
America
Latin
America
Africa/ Middle
East
Asia/
Pacific
5.552 5.814 7.172 3.371 -1.645 1.898 6.063 4.387
It means that, on average, banks headquartered
in Africa/Middle East receive a six notches higher LT
issuer rating (e.g. A instead of BB) than they would
get without government support. The Eurozone
sample receives the highest support with 7.172
notches but Asia/Pacific (4.387) and global
systemically important banks (5.814) receive a
comparably high LT issuer rating subsidy, too.
Although the levels of the governmental rating
subsidy in the subsamples are be quite remarkable,
they remain comprehensible (e.g. a negative subsidy
is observed for North America, and banks in the
Eurozone receive more subsidy than those European
banks outside the Eurozone). In periods of economic
recession, i.e. when it really matters, mean spreads
for debt yields of different rating classes are far
higher than in ‘normal times’. Governmental support
is then far higher.
A LT issuer rating uplift due to governmental
support has a direct influence on a bank’s funding
costs. Although a rating is a relative statement on the
credibility of a debtor and does not include an explicit
default probability, rating agencies do publish
empirical cumulative default rates for different rating
categories that could be used for bond price (and
financing cost) estimation. Soussa (2000) proposes a
theoretical method for the computation of structural
annualised interest rate differentials derived from the
expected present value of a bond.63
Another
preferable option would be to use market prices from
bond indexes of various rating classes to derive
interest rate differentials for different rating classes.
Market prices are ‘ideal indicators’ for the
informational content of an event, since they are the
result of human expectations, knowledge, and actions
63
In a similar paper, Ueda/Weder di Mauro (2013) also refer to Soussa (2000).
of all the market participants – concentrated in one
measure. However, this remains a task for future
research. After this valuation of government support
imbedded in banks’ ratings, we turn our attention on
the analysis of determinants for governmental support
for those banks.
5. Drivers of government support for banks
5.1 Methodology
In theory, government support can affect banks’ risk
taking in two ways working in the opposite direction.
The first, more obvious market discipline hypothesis
argues that bank risk taking increases since state
guarantees reduce market discipline [Sironi (2003),
Gropp/Vesala/Vulpes (2006)]. Shareholders and
creditors anticipate their bank’s bail-out and therefore
accept higher risk taking for increased profits.
Secondly, the charter value hypothesis suggests
decreased risk taking of banks since state guarantees
affect banks’ margins and consequently charter
values positively [Keeley (1990)]. There is broad
empirical literature on banks’ behaviour under the
influence of government support. Various measures
can serve as a surrogate for government support: As a
measure of explicit government support Demirguc-
Kunt/Detragiache (2002) use deposit insurance and
De Nicoló/Loukoianova (2007) use state ownership.
Bank size as a rather very indirect measure of support
is used by Boyd/Runkle (1993) and O’Hara/Shaw
(1990). The results of those studies are mixed,
suggesting that the net effect of government support
on banks risk behaviour is ambiguous and depends on
the extent of the two channels. Recent studies
measuring governmental support embedded in credit
ratings however have been able to prove increased

Journal of Governance and Regulation / Volume 3, Issue 1, 2014
51
risk taking by banks that receive state guarantees
[Brandao-Marques/Correa/Sapriza (2013)] and
increased risk taking by competitors of those banks
[Gropp/Hakenes/Schnabel (2010)].
This study is linked to those recent ones as it
extracts the information on bailout probability
embedded in ratings. However unlike similar studies,
we look at a reversed causality: We analyze the
determinants of government support. To put it simple:
we ask which factors drive a government’s
willingness to bailout a bank should this become
necessary?
According to theory, banks with highest risk
(and also banks with lowest earning prospects) are
most exposed to a bailout and therefore should
receive the highest portion of state guarantees. To test
those arguments, we run a simple linear OLS-
regression on three types of ratings (calculations) is
run using four measures for risk and profitability on
five-year-average basis as explanatory variables:
- Investment return (5y average) as a measure
of a bank’s efficiency at allocating capital
(
).
- Interest income ratio (5y average) as a
measure of a bank’s business model. High interest
ratios indicate traditional commercial bank
business (
)
- Share return (5y average) as a measure of
market participants’ view on future earnings
prospects of a bank (
).
- Equity ratio (5y average) as a measure for
loss absorbency potential (
).
After dropping those institutions from the 371
banks sample for which Worldscope provides no
information on the four selected explanatory variables
(5 year averages from financial statements of 2008 to
2012), a sample of 165 banks remains.
Table 6. Descriptive statistics for the bank characteristics
Mean Median Min Max St.Dev.
Investment return (5y avg.) 5.75% 4.75% -3.26% 24.35% 4.45%
Interest income ratio (5y avg.) 3.85 3.18 0.39 18.29 2.77
Share return (5y avg.) -5.54% -4.88% -67.27% 26.82% 15.66%
Equity ratio (5y avg.) 54.86% 56.58% 2.33% 100.00% 26.29%
The sample includes 165 banks.
Source: author’s calculations with data from Worldscope.
As descriptive sample statistics (Table 6) show,
the banks of the sample have been able to allocate
capital investments with positive returns of 5.75%
annually during the five financial years from 2008 to
2012. Therefore it is surprising that share returns do
not reflect this development alowing a negative trend
of -5.54% annual share price reductions (including
dividends paid). One explanation could be the overall
downward stock market trend during 2008 and 2012.
The high ratio of interest income to non-interest
income (Median 3.18) shows that the core business of
most banks of the sample is commercial banking.
However, as the standard deviation is 2.77 and the
minimum observed value is 0.39, it would appear that
the sample consist of two classes of banks:
“traditional” banks focusing on deposit/lending
activities, and “non-traditional” banks focusing on
capital market investment/funding. The common
equity ratio is comparatively high for a banking
sample. One explanation would be the high portion of
banks from developing markets that tend to have
sounder leverage levels than European/North
American banks.
Following regressions are conducted to estimate
drivers of government support for banks (for Support
Rating, definition see Section 3, we use flipped
values):
We are able to exclude multicollinearity after
calculating the variance inflation factors (see
Appendix Table 6).
5.2 Results
The results shown in table 7 present strong evidence
that banks’ risk taking drives governmental support:
The probability of a governmental bailout is expected
to decrease with increasing returns on invested
capital. A bank that has positive returns on invested
capital for a longer period of time is obviously in
healthy condition and may be less close to a
governmental bailout than banks in trouble. All three
support measures show a negative influence of
increasing returns on bailout probability, two of them
are highly significant. The interest income ratio as a
measure for a bank’s income share from traditional
lending and borrowing business has a significant

Journal of Governance and Regulation / Volume 3, Issue 1, 2014
52
impact on the probability of governmental supporting
of a bank. The positive effect of traditional bank
business on the expected government support
measured by LT issuer rating viability rating is
plausible since banks mainly involved in traditional
commercial banking have a broad customer base and
many depositors. That makes a bailout more likely.
However, the results of Interest income ratio’s impact
on Support rating floor and Support rating suggest a
contrary dependence. The return of banks’ shares
significantly negatively affect the willingness of
governments for a bail out, measured by LT issuer
rating - viability rating.
Table 7. Regression of banks’ support ratings
5 year average values of LT issuer rating -
viability rating Support rating floor Support rating
Investment return -6.920
(0.136)
-20.359***
(0.004)
-8.219***
(0.001)
Interest income ratio 0.232***
(0.000)
-0.172**
(0.032)
-0.082***
(0.004)
Share return -5.339***
(0.000)
-2.246
(0.179)
-0.413
(0.488)
Equity ratio 2.817***
(0.000)
2.131**
(0.048)
0.777**
(0.044)
No. of Obs. 165 165 165
R² 0.296 0.1314 0.149
Adj. R² 0.278 0.1097 0.128
* / ** / *** indicate significance at the 10% / 5% / 1% level. The p-values are denoted in parentheses.
Source: authors’ calculations with data from Worldscope.
All the results for Share return show negative
signs and therefore once again confirm that banks
with falling share prices (and presumably struggling
business models) are more likely to receive
governmental support should this become necessary.
The explanation of significant positive influence of
banks’ equity ratio as shown by the model is not
obvious in the first place since one would firstly
expect decreasing state support for banks with
sufficient equity capital (and risk coverage potential).
One possible explanation for this result could be the
charter value hypothesis suggesting that government
guarantees effect banks’ margins and consequently
charter values like the equity positively. Another
possible explanation would be again that banks with
high equity ratios are those that do less engage in
investment banking/proprietary trading but rather in
commercial banking with deposit activities. In those
cases, depositor protection in form of bank bailouts
seems a priority for governments. However, in most
cases the results validate our argumentation
suggesting banks’ risk taking increases governments’
willing- and preparedness for support.
6. Conclusion
In the first part, this paper provides a clear and
traceable method for the identification and valuation
of governmental support for banks. The results
indicate that banks implicitly receive rating and
funding subsidies that are neither inconsiderable nor
negligible. In the second part, we analyze which bank
determinants influence governments’ willingness to
support a bank in case of distress. Depending on the
measure for government support, we show that
governments are most willing to bail out banks with
high equity ratios. Furthermore, those banks with
lowest returns on investment and worst share price
performance receive comparably high government
support imbedded in ratings.
Market failure, which is effectively and
efficiently corrected, could justify such kind of
regulatory interventions – that are factually subsidies.
However, there are no comparable lines of argument
for those subsidies in the given case. In contrast,
governments should make every effort to diminish
their support, since it leads to a distortion market
competition on markets and to adverse effects like
moral hazards. Under these conditions, yield-oriented
decision makers of a systemically important financial
intermediary are given the incentive to choose a
riskier business strategy, since market disciplining
(e.g. through increased interest requirement
adequately reflecting enhanced risk taking) is
weakened.64
Since these processes interfere with or
even eliminate the selection function of the
(financial) market, (in particular: global systemically
important) banks are incentivized to act, i.e. invest
and grow in ways that threaten to pose
inappropriately high negative external effects on the
financial system and the economy as a whole. In the
long run, this can lead to different forms of market
failure (e.g. survival of inefficient actors, instability
64
See O'Hara/Shaw (1990), p. 1588-1589. See on the existence of moral hazard and the effectiveness of market disciplining, Nier/Baumann (2006).

Journal of Governance and Regulation / Volume 3, Issue 1, 2014
53
of the financial system), higher indebtedness of
public households and, in this way, to welfare
losses65
. Unfortunately, these losses might even turn
out bigger than those which interventionist guarantees
were meant to avoid.
References 1. Benston, George J. (1998): Regulating Financial
Markets: A Critique and some Proposals, London.
2. Benston, George J. (2000): Consumer Protection as a
Justification for Regulating Financial Services Firms
and Products, in: Journal of Financial Services
Research, Vol. 17, No. 3, pp. 277-301.
3. Boes, Stefan/Winkelmann, Rainer (2006): Ordered
Response Models, in: Hübler, Olaf / Frohn, Joachim
(Eds.), Modern Econometric Analysis, pp. 167-181.
4. Boyd, John/Runkle, David (1993): Size and
Performance of Banking Firms: Testing the
Predictions of Theory, in: Journal of Monetary
Economics, Vol. 31, pp. 47–67.
5. Brandao-Marques, Luis/Correa, Ricardo/Sapriza,
Horacio (2013): International evidence on government
support and risk taking in the banking sector,
International Finance Discussion Papers 1086, Board
of Governors of the Federal Reserve System,
Washington, D.C.
6. Brunnermeier, Markus K. (2009): Deciphering the
Liquidity and Credit Crunch 2007–2008, in: Journal of
Economic Perspectives, Vol. 23, No. 1, pp. 77–100.
7. Calomiris, Charles W. (1990): Is Deposit Insurance
Necessary? A Historical Perspective, in: Journal of
Economic History, Vol. 50, No. 2, pp. 283-295.
8. Campbell Andrew/LaBrosse, John Raymond/Mayes,
David G./Singh, Dalvinder (eds., 2007): Deposit
Insurance, Basingstoke.
9. De Nicolo, Gianni/Loukoianova, Elena (2007): Bank
Ownership, Market Structure, and Risk. Proceedings
1058, Federal Reserve Bank of Chicago, Chicago.
10. Demirguc-Kunt, Asli/Detragiache. Enrica (2002):
Does Deposit Insurance Increase Banking System
Stability? An Empirical Investigation, in: Journal of
Monetary Economics, Vol. 49, pp. 1373–1406.
11. Diamond, Douglas W. (1984): Financial
Intermediation and Delegated Monitoring, in: Review
of Economics Studies, Vol. 51, pp. 393-414.
12. Diamond, Douglas W. (1989): Reputation Acquisition
in Debt Markets, in: Journal of Political Economy,
Vol. 97, pp. 689-721.
13. Diamond, Douglas W./Dybvig, Philip H. (1983): Bank
Runs, Deposit Insurance, and Liquidity, in: Journal of
Political Economy, Vol. 91, pp. 401-419.
14. Dougherty, Carter (2008): Germany guarantees bank
deposits, NY Times, Oct 5, 2008,
http://www.nytimes.com/2008/10/05/business/worldbu
siness/05iht-hypo.4.16708030.html?_r=0.
15. European Commission (2012): Technical Fiche - Tax
Contribution of the Financial Sector, Brussels.
16. Financial Stability Board (2013a): Global systemically
important banks - updated assessment methodology
and the higher loss absorbency requirement, revised
version July 2013, Basel.
65
See Kellermann (2010), p. 18.
17. Financial Stability Board (2013b): 2013 update of
group of global systemically important banks (G-SIB),
11.11.2013, Basel.
18. Fitch Ratings (2013): Definitions of Ratings and Other
Forms of Opinion, New York/London.
19. Fitch Ratings (2014): Bank Resolution Not a Priority
in Latin America, Press release 27 Mar 2014, New
York/London.
20. Flannery, Mark (1998): Using Market Information in
Prudential Banking Supervision – A Review of U.S.
Evidence, in: Journal of Money, Credit and Banking,
Vol. 30, pp. 273-305.
21. Freixas, Xavier / Giannini, Curzio / Hoggarth, Glenn /
Soussa, Farouk (2000): Lender of Last Resort: What
Have We Learned Since Bagehot?, in: Journal of
Financial Services Research, Vol. 18, No. 1, pp. 63-84.
22. G20 (2008): Declaration (Washington) – Summit of
Financial Market and the World Economy 15 Nov
2008, Washington, D.C.
23. G20 (2009): Declaration (London) – London Summit
2 Apr 2009, London.
24. Göbel, Henning/Henkel, Knut/Lantzius-Beninga,
Berthold (2012): Berechnung der Bankenabgabe, in:
Die Wirtschaftsprüfung, Vol. 65, No. 1, pp. 27-39.
25. Goldstein, Morrís/Veron, Nicolas (2012): Too big to
fail – The transatlantic debate, Peterson Institute for
International Economics, Bruegel Working Paper
2001/03, Washington, D.C.
26. Goodhart, Charles A.E. (1999): Myths About the
Lender of Last Resort, in: International Finance, Vol.
2, No. 3, pp. 339-360.
27. Gropp, Reint/Hakenes, Hendrik/Schnabel, Isabel
(2010): Competition, Risk-shifting, and Public Bail-
out Policies, in: The Review of Financial Studies, Vol.
24, pp. 2084-2120.
28. Gropp, Reint/Vesala, Jukka/Vulpes, Guiseppe (2006):
Equity and Debt Market Signals as Indicators of Bank
Fragility, in: Journal of Money, Credit, and Banking,
Vol. 38, pp. 399–428.
29. Hogan, Thomas L./Luther, William. J. (2014): The
Explicit Cost of Government Deposit Insurance, in:
Cato Journal, Vo. 34, No. 1, pp. 145-170.
30. Humphrey, Thomas M. (2010): Lender of Last Resort:
What it is, whence it came, and why the Fed isn’t it,
in: Cato Journal, Vol. 30, No. 2, pp. 333-364.
31. Keeley, Michael (1990): Deposit Insurance, Risk, and
Market Power in Banking, in: American Economic
Review, Vol. 80, pp. 1183–1200.
32. Kellermann, Kersten (2010): Too Big To Fail - Ein
gordischer Knoten für die Finanzmarkt-aufsicht?,
KOFL Working Papers, Liechtenstein.
33. McFadden, Daniel (1977): Quantitative Methods for
Analysing Travel Behaviour of Individuals – Some
Recent Developments, in: Henscher, David / Stopher,
Peter (Eds.), Behavioural Travel Modelling, pp. 279-
318.
34. Merton, Robert (1977): An Analytical Derivation of
the Cost of Deposit Insurance and Loan Guarantees,
in: Journal of Banking and Finance, Vo1. 1, pp. 3–11.
35. Moosa, Imad A. (2010): The Myth of Too Big To Fail,
Basingstoke.
36. Morgan, Donald/Stiroh, Kevin (2005): Too Big to Fail
after All These Years, Federal Reserve Bank of New
York Staff Report, No. 220, New York.
37. Moss, David A. (2009): An Ounce of Prevention – The
Power of Public Risk Management in Stabilizing the

Journal of Governance and Regulation / Volume 3, Issue 1, 2014
54
Financial System, Harvard Business School Working
Paper 09-087, Harvard.
38. Nier, Erlend/Baumann, Ursel (2006): Market
discipline, disclosure and moral hazard in banking –
Basel II: Accounting, Transparency and Bank
Stability, in: Journal of Financial Intermediation, Vol.
15, pp. 332–361.
39. O'Hara, Maureen/Shaw, Wayne (1990): Deposit
Insurance and Wealth Effects: The Value of Being
“Too Big to Fail”, in: The Journal of Finance, Vol.
45, pp. 1587–1600.
40. Rime, Bertrand (2005): Do “Too Big to Fail”
Expectations Boost Large Banks Issuer Ratings?,
working paper, Swiss National Bank, Zurich/Bern.
41. Safire, William (2008): Too big to fail or to bail out?,
New York Times online, http://www.nytimes.com/
2008/04/06/opinion/06iht-edsafire.1.11699108.html
(24.04.1014).
42. Schich, Sebastian/Lindh, Sofia (2012): Implicit
Guarantees for Bank Debt – Where do we stand?, in:
OECD Journal – Financial Market Trends, Vol. 2012,
No. 1, pp. 45-64.
43. Schönfelder, Bruno (2012): Vom Spätsozialismus zur
Privatrechtsordnung – Eine Untersuchung über die
Interdependenz zwischen Recht und Wirtschaft am
Beispiel von Gläubigerschutz und Kredit, Berlin.
44. SEC – US Securities Exchange Commission (2012):
Summary Report Of Commission Staff’s
Examinations Of Each Nationally Recognized
Statistical Rating Organization, Washington.
45. Sironi, Andrea (2003): Testing for Market Discipline
in the European Banking Industry: Evidence from
Subordinated Debt Issues, in: Journal of Money,
Credit, and Banking, Vol. 35, pp. 443–72.
46. Soussa, Farouk (2000): Too Big to Fail: Moral Hazard
and Unfair Competition? Chapter 1 in Collective
Volume, Financial Stability and Central Banks:
Selected Issues for financial Safety Nets and Market
Discipline, Bank of England, London.
47. Stern, Gary H./Feldman, Ron J. (2004): Too big to fail
– The hazards of bank bailouts, Washington, D.C.
48. Summe, Kimberley A. (2009): Lessons Learned from
the Lehman Bankruptcy, in: Scott, Kenneth E./Shultz,
George P./Taylor, John B. (eds.): Ending Government
Bailouts as We Know Them, Hoover Institutions Press
2009, pp. 59-105.
49. UCLA – University of California (2013): Stata
Annotated Output – Ordered Logistic Regression,
www.ats.ucla.edu/stat/stata/output/stata_ologit_output.
htm.
50. Ueda, Kenichi/Weder di Mauro, Beatrice (2013):
Quantifying structural subsidy values for systemically
important financial institutions, in: Journal of Banking
and Finance, Vol. 37, pp. 3830-3842.
51. United States Securities and Exchange Commission
(2012): Annual Report on Nationally Recognized
Statistical Rating Organizations, Washington, D. C.
52. Von Mises, Ludwig (1949): Human Action – A
Treatise on Economics, New Haven.

Journal of Governance and Regulation / Volume 3, Issue 1, 2014
55
Appendix
Table 1. Rating assignments
Rating
symbol
LT issuer
Support rating
floor
Sovereign rating
AAA 20
AA+ 19
AA 18
AA- 17
A+ 16
A 15
A- 14
BBB+ 13
BBB 12
BBB- 11
BB+ 10
BB 9
BB- 8
B+ 7
B 6
B- 5
CCC 4
CC 3
C 2
RD 1
Rating
symbol Support
1 5
2 4
3 3
4 2
5 1
Table 2. Government support (support rating floor)
0 5 10 15 20
SwitzerlandKuwait
NetherlandsUAE
United StatesAustriaFinlandFrance
UKGermany
Saudi ArabiaQatarChile
BelgiumCanada
DenmarkIsrael
LuxembourgSingapore
South KoreaOman
SwedenJapan
AustraliaChina
BahrainIreland
PanamaMalaysia
MaltaMexicoNorway
ThailandIndia
Hong KongPeru
IndonesiaItaly
TaiwanTurkey
SpainMorocco
PolandSouth Africa
Costa RicaPortugal
BrazilColombia
PhilippinesRussia
BulgariaGuatemalaAzerbaijan
RomaniaJordan
SloveniaSri Lanka
NigeriaDom.Rep.
GeorgiaVietnam
KazakhstanMongolia
BelarusEgypt
JamaicaLebanonUkraine

Journal of Governance and Regulation / Volume 3, Issue 1, 2014
56
Table 3. Country list
Country Freq. Per
cent
Country Freq. Per
cent
Australia* 8 2.16 0.375 12.13 Malaysia 3 0.81 0.00 11.00
Austria* 4 1.08 3.25 15.00 Malta 1 0.27 0.00 11.00
Azerbaijan 2 0.54 3.00 8.00 Mexico* 3 0.81 0.00 11.00
Bahrain 2 0.54 1.00 12.00 Mongolia 2 0.54 0.00 5.50
Belarus 2 0.54 0.00 5.00 Morocco 1 0.27 2.00 10.00
Belgium* 3 0.81 1.33 14.00 Netherlands* 4 1.08 1.25 15.25
Brazil 9 2.43 0.00 9.56 Nigeria 8 2.16 0.75 6.38
Bulgaria 1 0.27 3.00 8.00 Norway* 5 1.35 0.00 11.00
Canada* 6 1.62 0.00 14.00 Oman 5 1.35 3.20 13.20
Chile 3 0.81 1.33 14.33 Panama 1 0.27 2.00 12.00
China 15 4.04 4.60 12.07 Peru 5 1.35 0.60 10.60
Colombia 4 1.08 0.00 9.50 Philippines 9 2.43 0.00 9.11
Costa Rica 3 0.81 0.00 9.67 Poland* 3 0.81 1.00 10.00
Denmark* 4 1.08 0.00 14.00 Portugal* 5 1.35 3.00 9.60
Dom.Rep. 1 0.27 0.00 6.00 Qatar 7 1.89 3.00 14.71
Egypt 2 0.54 0.00 5.00 Romania 1 0.27 0.00 8.00
Finland* 2 0.54 0.00 15.00 Russia 9 2.43 1.11 8.56
France* 5 1.35 0.20 15.00 Saudi Arabia 11 2.96 1.45 14.73
Georgia 3 0.81 0.00 6.00 Singapore 3 0.81 0.00 14.00
Germany* 16 4.31 3.44 14.81 Slovenia* 3 0.81 2.00 7.00
Guatemala 3 0.81 0.00 8.00 South Africa 3 0.81 0.00 10.00
Hong Kong 6 1.62 0.00 10.67 South Korea* 6 1.62 0.67 13.67
India 8 2.16 0.63 10.75 Spain* 17 4.58 1.18 10.12
Indonesia 5 1.35 0.80 10.40 Sri Lanka 3 0.81 0.33 6.67
Ireland* 2 0.54 6.00 12.00 Sweden* 5 1.35 0.00 13.20
Israel* 2 0.54 1.00 14.00 Switzerland* 3 0.81 1.33 16.67
Italy* 14 3.77 1.07 10.29 Taiwan 11 2.96 0.64 10.18
Jamaica 1 0.27 0.00 4.00 Thailand 6 1.62 0.17 10.83
Japan* 13 3.5 0.46 13.08 Turkey* 7 1.89 0.00 10.14
Jordan 2 0.54 0.00 7.00 Ukraine 2 0.54 0.00 4.00
Kazakhstan 2 0.54 0.00 5.50 UAE 13 3.5 4.85 15.08
Kuwait 8 2.16 6.38 16.13 UK* 10 2.7 1.00 14.90
Lebanon 2 0.54 0.00 4.00 United States* 29 7.82 0.59 15.03
Luxembourg* 2 0.54 0.50 14.00 Vietnam 2 0.54 1.50 6.00
Total 371 100 1.32 11.83

Journal of Governance and Regulation / Volume 3, Issue 1, 2014
57
Table 4. Variance inflation factors probit regression
VIF 1/VIF
Viability rating 1.93 0.517005
Support rating floor 2.95 0.339137
Sovereign 3.43 0.291384
Source: authors’ calculations.
Table 5. Correlations of the estimated coefficients probit regression
Viability rating Support rating floor Sovereign
Viability rating 1
Support rating floor -0.1524 1
Sovereign -0.4009 -0.6704 1
Source: authors’ calculations.
Table 6. Variance inflation factors linear regression
VIF 1/VIF
Investment return 2.11 0.473429
Interest income ratio 1.75 0.572487
Share return 1.50 0.668101
Equity ratio 1.07 0.932283
Source: authors’ calculations.