The Impact of Settlements on the Future of the Israeli Economy “The Recognition of a Palestinian...
32
Settlements on the Future of the Israeli Economy “The Recognition of a Palestinian State and the Solution of Two States: Is There Room for Hope?” Barcelona, Dr. Roby Nathanson
-
Upload
august-knight -
Category
Documents
-
view
215 -
download
2
Transcript of The Impact of Settlements on the Future of the Israeli Economy “The Recognition of a Palestinian...

The Impact of Settlements on the Future of
the Israeli Economy
“The Recognition of a Palestinian State and the Solution of Two States: Is There Room for Hope?”
Barcelona, 11.06.2015
Dr. Roby Nathanson

Israel and West Bank

Settlements and ongoing conflict costs:• Main direct costs:
‐ Investment in structures and infrastructure‐ Security costs (Military and other)‐ Government support and subsidies
(private&public)• Main indirect costs:
‐ A decline in foreign and local investments‐ A decrease in exports and economic and
scientific cooperation due to boycotts
Background

Main Objectives
Accurate as possible estimation of:• WB settlements annual costs (“extra
expenditures”)• Long term value of WB investments using the
capital stock of buildings and public initiated housing construction
• Comparison of costs of settlements east and west of the defence barrier
• The possible costs of current and future boycotts

Data
Diverse data sources:• Macro’s settlements data• Central Bureau of Statistics data:
municipalities data files, construction data, localities demographics data
• Ministries and governmental agencies data: Finance, Housing and Construction, Settlements Division
• Unique datasets: housing prices data, investment incentives data

Methodology
Wide array of technics:• “Extra expenditures”• Direct defence costs• Only disclosed and validated data• WB municipal support and national municipal
support• Creation of capital stock data from municipal
tax and construction completions
Built Environment
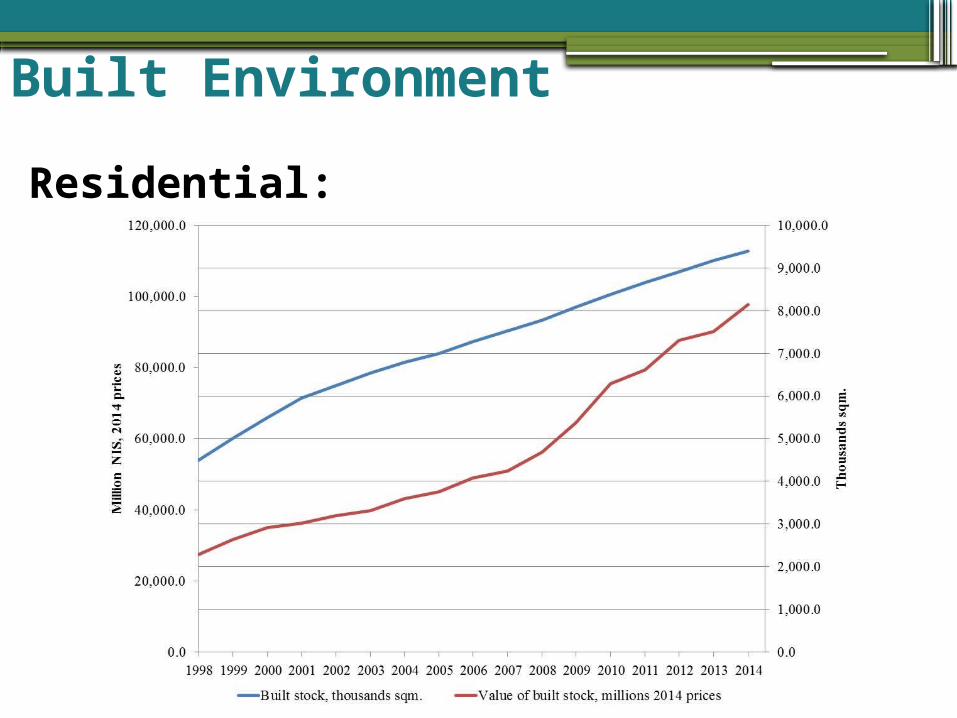
Residential:

Built Environment
Non-residential:
Built Environment
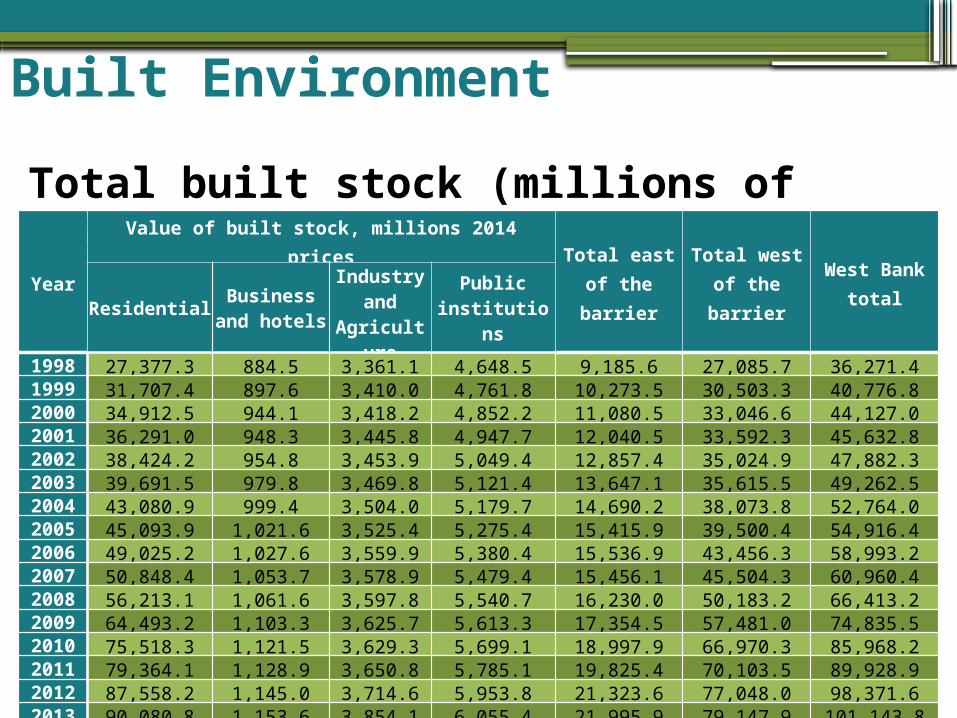
Total built stock (millions of NIS):
Year
Value of built stock, millions 2014 pricesTotal east of the barrier
Total west of the barrier
West Bank totalResidential
Business and hotels
Industry and
Agriculture
Public institutions
1998 27,377.3 884.5 3,361.1 4,648.5 9,185.6 27,085.7 36,271.41999 31,707.4 897.6 3,410.0 4,761.8 10,273.5 30,503.3 40,776.82000 34,912.5 944.1 3,418.2 4,852.2 11,080.5 33,046.6 44,127.02001 36,291.0 948.3 3,445.8 4,947.7 12,040.5 33,592.3 45,632.82002 38,424.2 954.8 3,453.9 5,049.4 12,857.4 35,024.9 47,882.32003 39,691.5 979.8 3,469.8 5,121.4 13,647.1 35,615.5 49,262.52004 43,080.9 999.4 3,504.0 5,179.7 14,690.2 38,073.8 52,764.02005 45,093.9 1,021.6 3,525.4 5,275.4 15,415.9 39,500.4 54,916.42006 49,025.2 1,027.6 3,559.9 5,380.4 15,536.9 43,456.3 58,993.22007 50,848.4 1,053.7 3,578.9 5,479.4 15,456.1 45,504.3 60,960.42008 56,213.1 1,061.6 3,597.8 5,540.7 16,230.0 50,183.2 66,413.22009 64,493.2 1,103.3 3,625.7 5,613.3 17,354.5 57,481.0 74,835.52010 75,518.3 1,121.5 3,629.3 5,699.1 18,997.9 66,970.3 85,968.22011 79,364.1 1,128.9 3,650.8 5,785.1 19,825.4 70,103.5 89,928.92012 87,558.2 1,145.0 3,714.6 5,953.8 21,323.6 77,048.0 98,371.62013 90,080.8 1,153.6 3,854.1 6,055.4 21,995.9 79,147.9 101,143.82014 97,704.1 1,163.4 3,872.5 6,132.8 23,469.8 85,403.0 108,872.8

Public construction
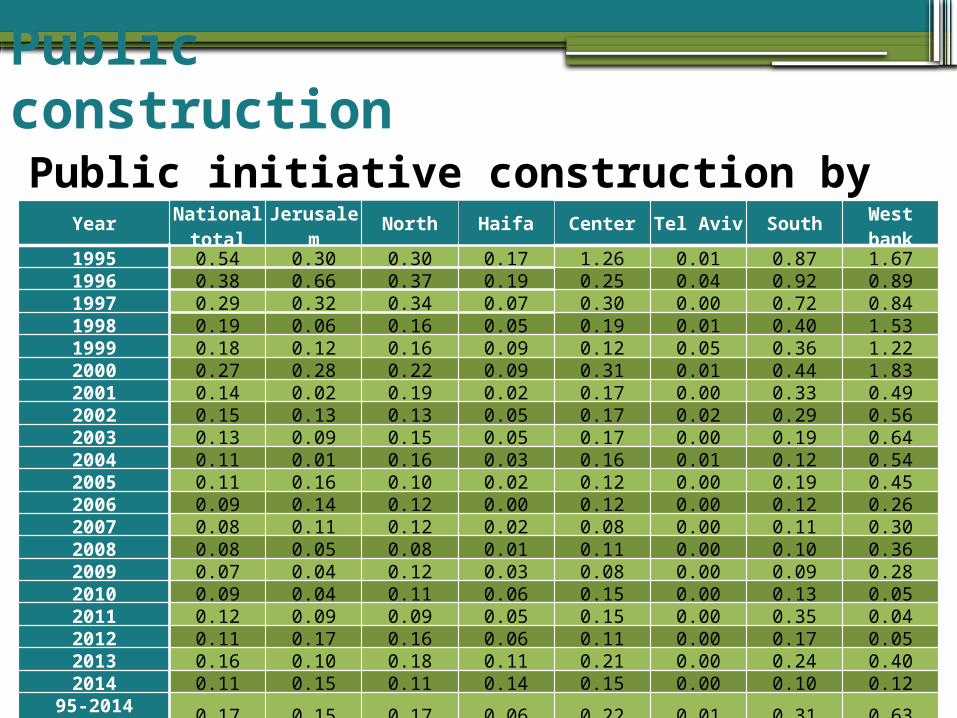
Public initiative construction by district:
Public construction
Public initiative construction by district:Year
National total
Jerusalem North Haifa Center Tel Aviv South West bank
1995 0.54 0.30 0.30 0.17 1.26 0.01 0.87 1.671996 0.38 0.66 0.37 0.19 0.25 0.04 0.92 0.891997 0.29 0.32 0.34 0.07 0.30 0.00 0.72 0.841998 0.19 0.06 0.16 0.05 0.19 0.01 0.40 1.531999 0.18 0.12 0.16 0.09 0.12 0.05 0.36 1.222000 0.27 0.28 0.22 0.09 0.31 0.01 0.44 1.832001 0.14 0.02 0.19 0.02 0.17 0.00 0.33 0.492002 0.15 0.13 0.13 0.05 0.17 0.02 0.29 0.562003 0.13 0.09 0.15 0.05 0.17 0.00 0.19 0.642004 0.11 0.01 0.16 0.03 0.16 0.01 0.12 0.542005 0.11 0.16 0.10 0.02 0.12 0.00 0.19 0.452006 0.09 0.14 0.12 0.00 0.12 0.00 0.12 0.262007 0.08 0.11 0.12 0.02 0.08 0.00 0.11 0.302008 0.08 0.05 0.08 0.01 0.11 0.00 0.10 0.362009 0.07 0.04 0.12 0.03 0.08 0.00 0.09 0.282010 0.09 0.04 0.11 0.06 0.15 0.00 0.13 0.052011 0.12 0.09 0.09 0.05 0.15 0.00 0.35 0.042012 0.11 0.17 0.16 0.06 0.11 0.00 0.17 0.052013 0.16 0.10 0.18 0.11 0.21 0.00 0.24 0.402014 0.11 0.15 0.11 0.14 0.15 0.00 0.10 0.12
95-2014 Average 0.17 0.15 0.17 0.06 0.22 0.01 0.31 0.63

Direct cost - public
Defence:• Only budget items holding significant and
direct linkage to WB settlements• Increased national security expenditures
between planned and actual – 19.8 billion NIS• WB settlements defence costs more per
person, but cannot be analyzed• The total disclosed direct defence cost of the
WB settlements is NIS 267.6 million per year

Direct cost - public
Municipality budgets:• “Extra support” compared to other regions
Total support per
person
of which:% of
support of total income
Support for education per
person
Special grants per person
WB average 3,762 1,648 454 45.8%East of the Barrier average 5,960 2,731 910 54.1%West of the Barrier average 3111 1327 318 42.2%
National total (without WB)
2,284 1,267 90 28.5%
Average extra expenditure 1,425 358 357 Average extra expenditure
East of the Barrier 3,678 1,465 820
Total extra expenditure 526,652,682 135,901,898 129,408,295

Direct cost - public
Municipality budgets:• Comparison to other parts of the country
District
Total support
per person
of which:
% of support of total income
Support for education per
person
Special grants per person
West Bank 3,762 1,648 454 45.8%Negev 3,203 1,776 122 34.9%
Galil (North district) 3,029 1,489 83 40.3%South (except Negev) 2,333 1,439 47 30.4%
Jerusalem 1,846 898 16 27.3%Tel Aviv 1,766 1,096 10 19.2%
Haifa 2,590 1,211 448 31.3%Center 1,932 1,264 19 24.1%
National total 2,284 1,267 90 28.5%

Direct cost - public
Development:• Settlement Division – establishment and
support to rural localities. All 122 localities in central region are WB settlements
• MOHC – new construction support budgets to specific settlements (Ma'ale Adummim and Geva Binyamin)
• Total government expenditure on development of WB settlements was NIS 253.6 million in the 2014 fiscal year

Direct cost - private
Households:• Housing support– new construction subsidy
( reduced land development costs) – NIS 22.9 million per year
• Income tax – an inclusion of WB settlements into the list of localities eligible to income tax deduction (currently on hold)

Direct cost - private
Business (“Law for the Encouragement of Capital Investments”):• Investment incentives– incentives for
investment in certain regions of the country, WB firms got NIS 931.8 million between 1992-2012. In recent years annual support of NIS 11 million per year
• Corporate tax – decreased corporate tax to WB located firms. A total subsidy worth NIS 18 million annually

Indirect cost
Possible impact of boycotts:• Up to the present time, they have not had a
significant impact on the Israeli economy• Not likely to have a significant impact in the
near future• Israeli’s economy is highly dependent on
exports and foreign investment (exports are 34.5% of Israel's GDP)
• Past and current global economic sanctions show that Israel is in threat

Total cost
Annual extra cost:
SectionEast of the
barrierWest of the
barrierTotal
Public support
Defence 61,155,841 206,429,159 267,585,000Municipalities
budgets299,146,263 227,506,420 526,652,682
Development 57,957,321 195,632,679 253,590,000Total 418,259,425 629,568,257 1,047,827,682
Private support
Households 5,223,770 17,632,630 22,856,400Business 6,646,121 22,433,722 29,079,843
Total 11,869,890 40,066,353 51,936,243Indirect costs Boycotting - - -
Total 430,129,315 669,634,610 1,099,763,925Total extra cost per person 5,288 2,439 3,090
Total extra cost per household 23,426 10,804 13,689

Future scenarios
Four plausible future scenarios:• “Managing the conflict" - business as usual• Partial unilateral withdrawal – withdrawal
only from highly dense Palestinian areas• Unilateral withdrawal to the security fence line
– evacuation of around 77 of 130 settlements• An agreed withdrawal to the 1967 borders – a
complete withdrawal except major settlement blocs, with agreed and mutual land swaps

Settlements Expected Future
Likely to Remain Inside Israel In Dispute Likely to be Evacuated0
20,000
40,000
60,000
80,000
100,000
120,000
140,000
160,000
0
10
20
30
40
50
60
70
80
Number of Residents Number of Settlements

Survey - Introduction
The survey was conducted among people representing the population east
of the barrier and examined the following:
▫ Perceptions about the feasibility of a peace agreement
▫ Expectations about the fate of the settlement in case of an agreement
▫ Reasons for living in the settlement
▫ Perception of quality of life in the settlement
▫ Main advantages and disadvantages in the settlement
▫ Importance attached to receiving various services in the settlement
▫ Willingness to evacuate in the case of an early evacuation-
compensation program or a post-agreement evacuation
▫ Factors likely to promote willingness to evacuate
▫ Preferences about residential locality in the event of an evacuation
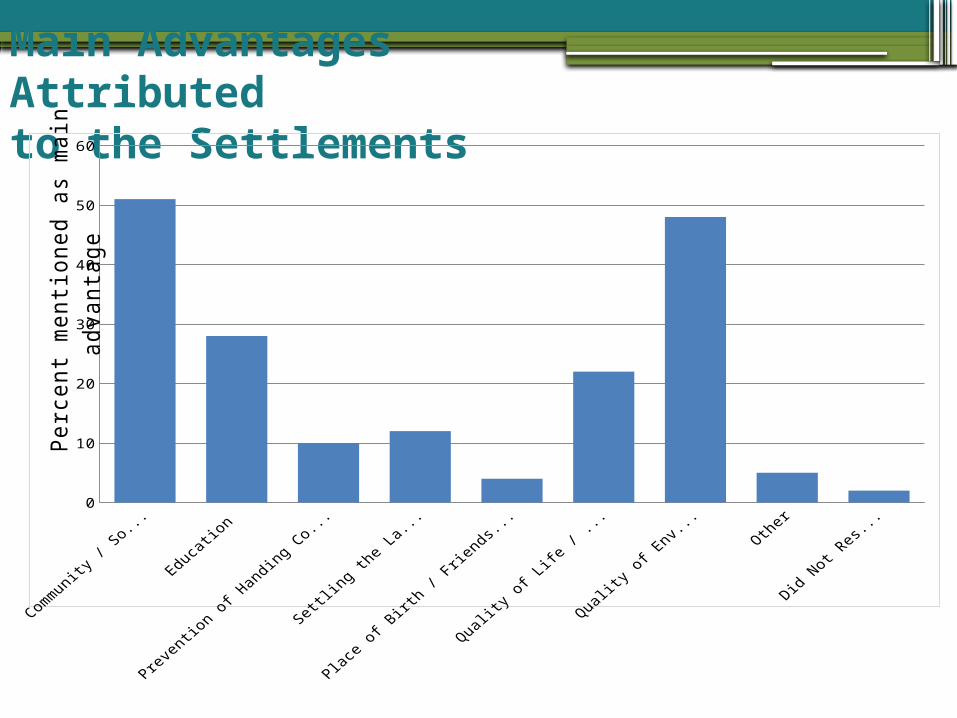
Main Advantages Attributed to the Settlements
0
10
20
30
40
50
60
Perc
ent
mentio
ned a
s m
ain
adva
nta
ge

Main Disadvantages Attributed to the Settlement
0
5
10
15
20
25
30
Per
cent
men
tione
d as
mai
n di
sadv
anta
ge
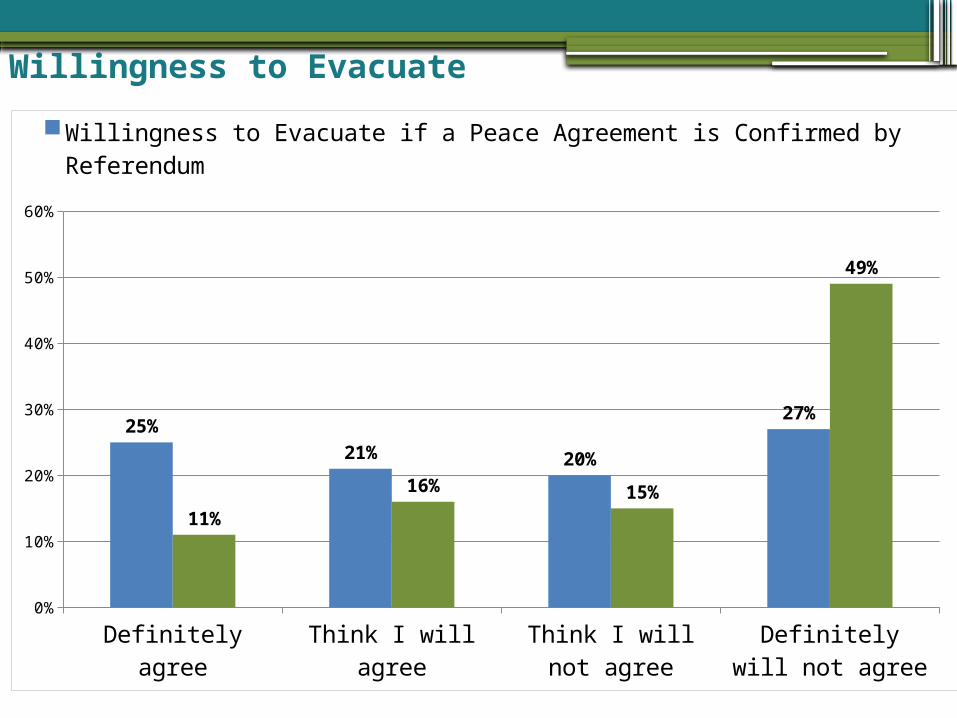
Willingness to Evacuate
Definitely agree Think I will agree Think I will not agree
Definitely will not agree
0%
10%
20%
30%
40%
50%
60%
25%
21% 20%
27%
11%
16% 15%
49%
Willingness to Evacuate if a Peace Agreement is Confirmed by Referendum
Willingness for Early Evacuation in an Evacuation-Compensation Program

Willingness to Evacuate Early in an Evacuation-Compensation Program
• 27% of the settlers east to the barrier, representing some 24,000
residents, expressed willingness to evacuate early. (will definitely
agree or think they will agree)
▫ Willingness is especially high in the Jordan Valley (45%), Ariel (44%)
and Secular Settlement (50%)
• 27% of the responders assessed that at least half of the residents
in their settlement would be willing to evacuate early
▫ 10% thought that most of the residents would be willing to move
▫ 6% thought that about two-thirds of the residents would be willing to
move
▫ 11% estimated that approximately half of the residents would be
willing to move
Willingness to Evacuate Early
• Main variables explaining the difference in
willingness to evacuate early
▫Religious affiliation
▫Political positions on the left wing - right wing
continuum
▫Assessment of the interviewee with regard to the
proportion of the residents in the settlement likely to
be prepared to evacuate
• The share willing to evacuate early is relatively
stable compared to the 2008 survey

Factors Likely to Promote Willingness to Evacuate
0
5
10
15
20
25
30
35
40
Very Great Extent

Factors Likely to Promote Willingness to Evacuate
• Top five factors among the religious and the ultra-Orthodox settlements
1. Suitable replacement housing for the family (17%)
2. Integrating children into education institutions (16%)
3. Moving the entire settlement to an are under Israeli sovereignty (16%)
4. Suitable employment (16%)
5. Compensation for loss of jobs/business (12%)
• Top five factors among secular settlements
1. Appropriate compensation level (64%)
2. Suitable replacement housing for the family (55%)
3. Suitable employment (54%)
4. Compensation for loss of jobs/buisness (52%)
5. Assurance of a pension plan (49%)

Locality Preferences in the Event of an Evacuation
Respondents who Expressed Willingness to Evacuate
Depends on Compensation Sum
Think They Will Agree Will Agree Location
28 18 12 Judea and Samaria
31 38 22 Greater Jerusalem
8 8 6South / Negev /
Arava
14 12 17 Center / Sharon
2 3 5 North and Galilee
18 35 43
Within the Green
Line (No Location
Specified)
10 7 6 Indifferent* Total is above 100% since some respondents mentioned more than one area

Conclusions
• Over the past 47 years an estimated NIS 108.9 billion were invested in WB civilian buildings
• WB settlements enjoy more publicly initiated housing construction – 0.63 sqm. per person compared to 0.17 sqm national average
• Annual governmental support is around 1 billion per year or NIS 13,689 per household
• Governmental support to WB municipalities is higher than other regions of the country including prioritized areas

Conclusions• East of the barrier settlements getting higher
support and “extra cost” than those west of the barrier – NIS 5,288 compared to NIS 2,439
• There are more costs to be analyzed - further research is needed
• Future scenarios are highly relevant to the assessment of future costs
• A Government Plan for Evacuating Settlements is needed due to the willingness of many settlers to participate in an evacuation-compensation program