The Impact of Service Quality on Customer Satisfaction...
13
Int. J. Manag. Bus. Res., 2 (2), 151- 163, Spring 2012 © IAU The Impact of Service Quality on Customer Satisfaction and Loyalty in Indian Banking Sector: An Empirical Study through SERVPERF *1 S. Vijay Anand, 2 M. Selvaraj 1 Anna University of Technology, Tamilnadu, India 2 Sona School of Management, Sona College of Technology, Tamilnadu, India ABSTRACT: This study examines the impact of service quality on customer satisfaction and Loyalty in Indian Banking sector by applying SERVPERF scale. A total of 50 customers of State bank of India, Mohan Nagar Township branch of Salem District in Tamilnadu were interviewed on convenient basis for the above purpose. Tools like Exploratory factor analysis. Inter-Correlation, Analysis of variance, Multiple Regression analysis are carried out and the result revealed that out of five service quality factors considered, Assurance is having a highest Mean score of SERVPERF (P) score and the bank should concentrate on Reliability as it has the least mean score of SERVPERF. Regarding the association between the Demographic variables and the service quality factors, it is seen that there is no significant association found between them except income in case of Empathy and Marital status in respect of all service quality factors. It is also observed that there is a significant association found between all the Service quality factors and the customer satisfaction as well as with customer Loyalty. While analyzing the antecedents of Customer satisfaction and Loyalty, factors like Responsiveness, Reliability and Empathy are significantly influenced and also explained respective percentage of relevant changes in the Independent variables considered. Keywords: Banks, SERVPERF, Competence, Service quality, Customer satisfaction, Customer loyalty, Indian banking sector, Demographic factors INTRODUCTION Banking sectors in India is having a wide range of product and services and playing an essential role in Indian economy. It started its career from 1839 and many banks were started subsequently. State Bank of India previously known as “Imperial bank” was started in 1955 and having a large number of branches in and around the nation as well as in abroad with the objective of providing banking facilities to the customers on a large scale especially in rural and semi-urban areas. In Salem District, State Bank of India comprises with 31 Branches including all categories like Metro, Urban, Semi Urban and Rural. For this study, State Bank of India, Mohan Nagar Township Branch, a leading performing branch in rural category started on 14.12.1979 was selected. The Significance of the Study Public Sector banks were enjoyed monopoly status prior to the policy of liberalization. On *Corresponding Author, Email: [email protected]
Transcript of The Impact of Service Quality on Customer Satisfaction...
Int. J. Manag. Bus. Res., 2 (2), 151- 163, Spring 2012
© IAU
The Impact of Service Quality on Customer Satisfaction and Loyalty
in Indian Banking Sector: An Empirical Study through SERVPERF
*1 S. Vijay Anand, 2
M. Selvaraj
1 Anna University of Technology, Tamilnadu, India
2 Sona School of Management, Sona College of Technology, Tamilnadu, India
ABSTRACT: This study examines the impact of service quality on customer satisfaction and Loyalty in Indian
Banking sector by applying SERVPERF scale. A total of 50 customers of State bank of India, Mohan Nagar
Township branch of Salem District in Tamilnadu were interviewed on convenient basis for the above purpose.
Tools like Exploratory factor analysis. Inter-Correlation, Analysis of variance, Multiple Regression analysis are
carried out and the result revealed that out of five service quality factors considered, Assurance is having a
highest Mean score of SERVPERF (P) score and the bank should concentrate on Reliability as it has the least
mean score of SERVPERF. Regarding the association between the Demographic variables and the service quality
factors, it is seen that there is no significant association found between them except income in case of Empathy
and Marital status in respect of all service quality factors. It is also observed that there is a significant association
found between all the Service quality factors and the customer satisfaction as well as with customer Loyalty.
While analyzing the antecedents of Customer satisfaction and Loyalty, factors like Responsiveness, Reliability
and Empathy are significantly influenced and also explained respective percentage of relevant changes in the
Independent variables considered. Keywords: Banks, SERVPERF, Competence, Service quality, Customer satisfaction, Customer loyalty, Indian
banking sector, Demographic factors
INTRODUCTION
Banking sectors in India is having a wide
range of product and services and playing an
essential role in Indian economy. It started its
career from 1839 and many banks were started
subsequently. State Bank of India previously
known as “Imperial bank” was started in 1955
and having a large number of branches in and
around the nation as well as in abroad with the
objective of providing banking facilities to the
customers on a large scale especially in rural and
semi-urban areas.
In Salem District, State Bank of India
comprises with 31 Branches including all
categories like Metro, Urban, Semi Urban and
Rural. For this study, State Bank of India,
Mohan Nagar Township Branch, a leading
performing branch in rural category started on
14.12.1979 was selected.
The Significance of the Study
Public Sector banks were enjoyed monopoly
status prior to the policy of liberalization. On
*Corresponding Author, Email: [email protected]
S. Vijay Anand; M. Selvaraj
152
implementation of Liberalisation, Privatisation
and Globalisation (LPG) during 1990‟s, many
new generation private banks and foreign banks
were tied in this sector and continuously
showing their rapid growth together and
contributed significantly to the economy of
India.
Due to this intensive competitive situation, it
is necessary for all the banks to maintain
improved service quality to the customers by
providing technologically developed innovative
instant service to satisfy them as they are often
evaluating and comparing the entire services put
forward in the competitive market. Any lack in
the services or in the quality may cause
dissatisfaction among them and may lead to
switch over to the competitors thereby causing
a horrible condition to the organization.
Owing to this, it is very important to re-
examine the present quality of service delivering
by State Bank of India to confirm whether it
gratifying the customers and its impact on
future behavioral intentions. For this, customers
of State Bank of India, Mohan Nagar Branch
were considered for this study.
Review of Literature
(Kirti Dutta and Anil Dutta, 2009) observed
that Customer expectations are higher than
perceptions and this gap varies across the
banking sector with tangibility having the
highest impact on overall customer satisfaction.
(Vanpariya and Ganguly, 2010) examined that
service quality is having a positive and
significant correlation with customer
satisfaction, positive word of mouth and loyalty
intention. (Elangovan and Sabitha, 2011) in their
empirical study found that there is no significant
difference in the level of satisfaction of the
respondents belonging to different age,
education and occupation except income.
(Dharmalingam et al., 2011) stated that all the
service quality attributes are positively
correlated with customer satisfaction.
(Gopalakrishnan et al., 2011) determined that
Service quality and customer satisfaction had a
direct positive effect on customer‟s retention
intentions out of which Customer satisfaction is
a stronger predictor for retention. (Jackie L. M.
Tam, 2004) found that customer with higher
perceptions of the value of the service results in
turn with greater satisfaction. (Llorens Montes et
al., 2003) found that Customers‟ perceptions,
attitudes and intentions are being affected by
employees‟ experiences and attitudes who are
the internal customers of the organization.
Conceptual Frame Work
In every organization, the performance of
service quality is being evaluated mainly by the
principal tool called “SERVQUAL” proposed
and designed by (Parasuraman et al., 1985;
1991). Initially, it has ten dimensions and later it
got condensed to five dimensions like
Tangibility, Reliability, Assurance,
Responsiveness and Empathy.
But some Researchers has raised question
about the application and appropriateness of
using SERVQUAL and disagree about whether
the service quality should be the difference
between expected and perceived service and
empirically proved that the measures of service
performance SERVPERF is more effective than
SERVQUAL. (Cronin and Taylor, 1992; Teas,
1993; Brown et al., 1993; Brady et al., 2002).
Weighted SERVPERF scale has been
theoretically posited to be superior to weighted
SERVQUAL Scale (Bolten and Drew, 1991a in
Jain and Gupta, 2004).
Although the five dimensions recommended
earlier provide a framework of customer
expectations and perceptions, in order to
ascertain the present position, every organization
should concentrate on its own research to
measure the relative importance of the service
dimensions among the customers and also with
market segments by comparing the performance
of the competitor. To sustain the growth in the
market, extra services should compulsorily be
provided to the customers. Hence in addition to
the existing five dimensions, one more factor
“Value Added Services” is also considered for
this study to ascertain that the value added
services now providing to the customers are up
to the level as expected by the customers or any
better services they need from the service
provider.
Int. J. Manag. Bus. Res., 2 (2), 151-163, Spring 2012
153
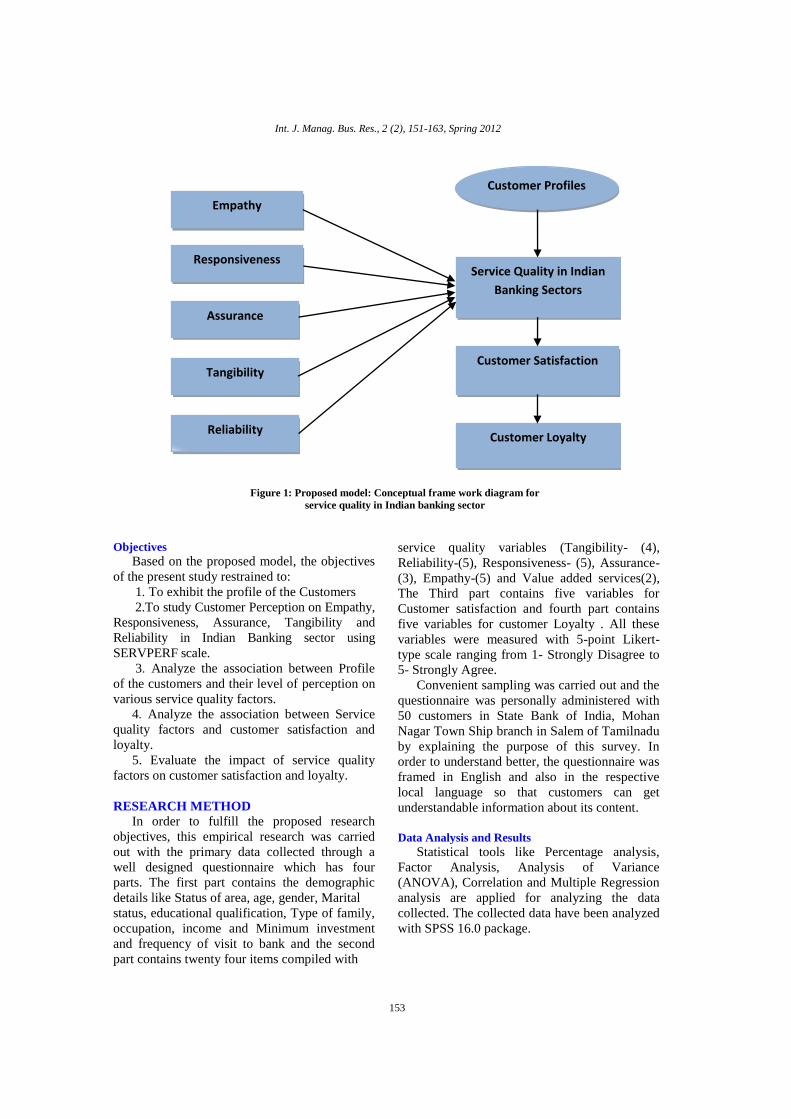
Objectives
Based on the proposed model, the objectives
of the present study restrained to:
1 . To exhibit the profile of the Customers
2.To study Customer Perception on Empathy,
Responsiveness, Assurance, Tangibility and
Reliability in Indian Banking sector using
SERVPERF scale.
3 . Analyze the association between Profile
of the customers and their level of perception on
various service quality factors.
4 . Analyze the association between Service
quality factors and customer satisfaction and
loyalty.
5. Evaluate the impact of service quality
factors on customer satisfaction and loyalty.
RESEARCH METHOD
In order to fulfill the proposed research
objectives, this empirical research was carried
out with the primary data collected through a
well designed questionnaire which has four
parts. The first part contains the demographic
details like Status of area, age, gender, Marital
status, educational qualification, Type of family,
occupation, income and Minimum investment
and frequency of visit to bank and the second
part contains twenty four items compiled with
service quality variables (Tangibility- (4),
Reliability-(5), Responsiveness- (5), Assurance-
(3), Empathy-(5) and Value added services(2),
The Third part contains five variables for
Customer satisfaction and fourth part contains
five variables for customer Loyalty . All these
variables were measured with 5-point Likert-
type scale ranging from 1- Strongly Disagree to
5- Strongly Agree.
Convenient sampling was carried out and the
questionnaire was personally administered with
50 customers in State Bank of India, Mohan
Nagar Town Ship branch in Salem of Tamilnadu
by explaining the purpose of this survey. In
order to understand better, the questionnaire was
framed in English and also in the respective
local language so that customers can get
understandable information about its content.
Data Analysis and Results
Statistical tools like Percentage analysis,
Factor Analysis, Analysis of Variance
(ANOVA), Correlation and Multiple Regression
analysis are applied for analyzing the data
collected. The collected data have been analyzed
with SPSS 16.0 package.
Figure 1: Proposed model: Conceptual frame work diagram for
service quality in Indian banking sector
Empathy
Responsiveness
Assurance
Service Quality in Indian
Banking Sectors
(SERVPERF)
Customer Profiles
Tangibility Customer Satisfaction
Customer Loyalty Reliability
S. Vijay Anand; M. Selvaraj
154
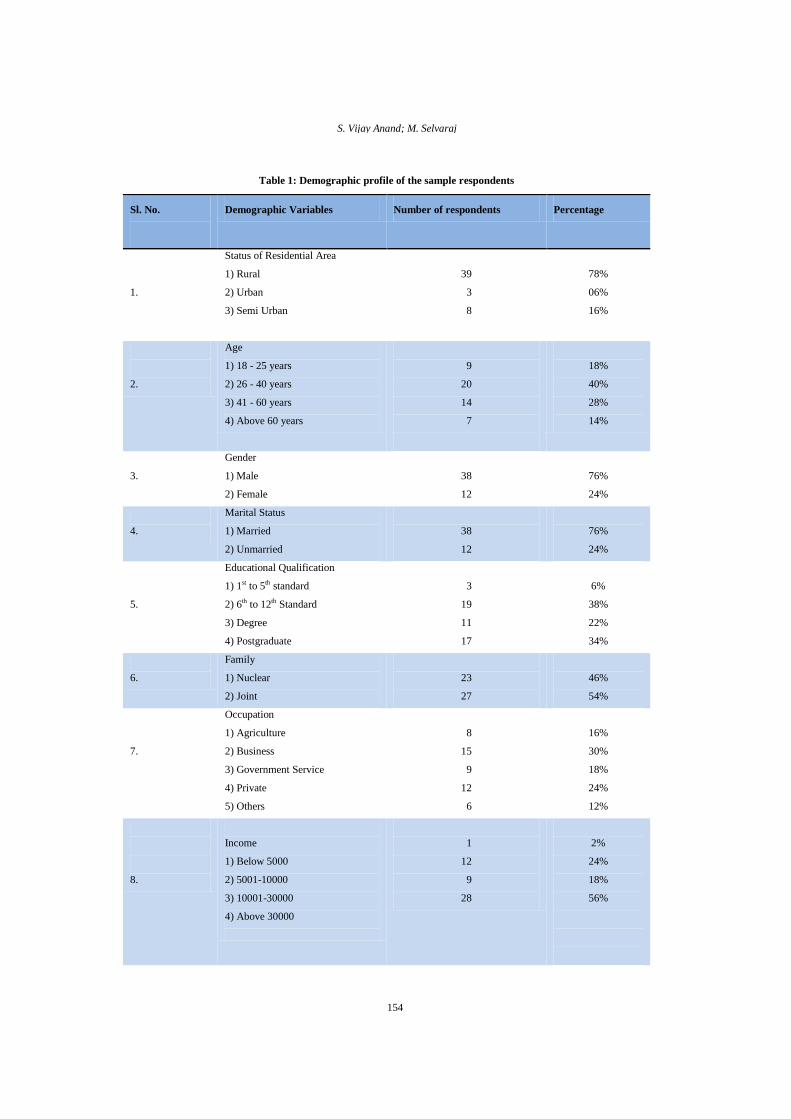
Table 1: Demographic profile of the sample respondents
Sl. No.
Demographic Variables Number of respondents Percentage
1.
Status of Residential Area
1) Rural
2) Urban
3) Semi Urban
39
3
8
78%
06%
16%
2.
Age
1) 18 - 25 years
2) 26 - 40 years
3) 41 - 60 years
4) Above 60 years
9
20
14
7
18%
40%
28%
14%
3.
Gender
1) Male
2) Female
38
12
76%
24%
4.
Marital Status
1) Married
2) Unmarried
38
12
76%
24%
5.
Educational Qualification
1) 1st to 5th standard
2) 6th to 12th Standard
3) Degree
4) Postgraduate
3
19
11
17
6%
38%
22%
34%
6.
Family
1) Nuclear
2) Joint
23
27
46%
54%
7.
Occupation
1) Agriculture
2) Business
3) Government Service
4) Private
5) Others
8
15
9
12
6
16%
30%
18%
24%
12%
8.
Income
1) Below 5000
2) 5001-10000
3) 10001-30000
4) Above 30000
1
12
9
28
2%
24%
18%
56%
Int. J. Manag. Bus. Res., 2 (2), 151-163, Spring 2012
155
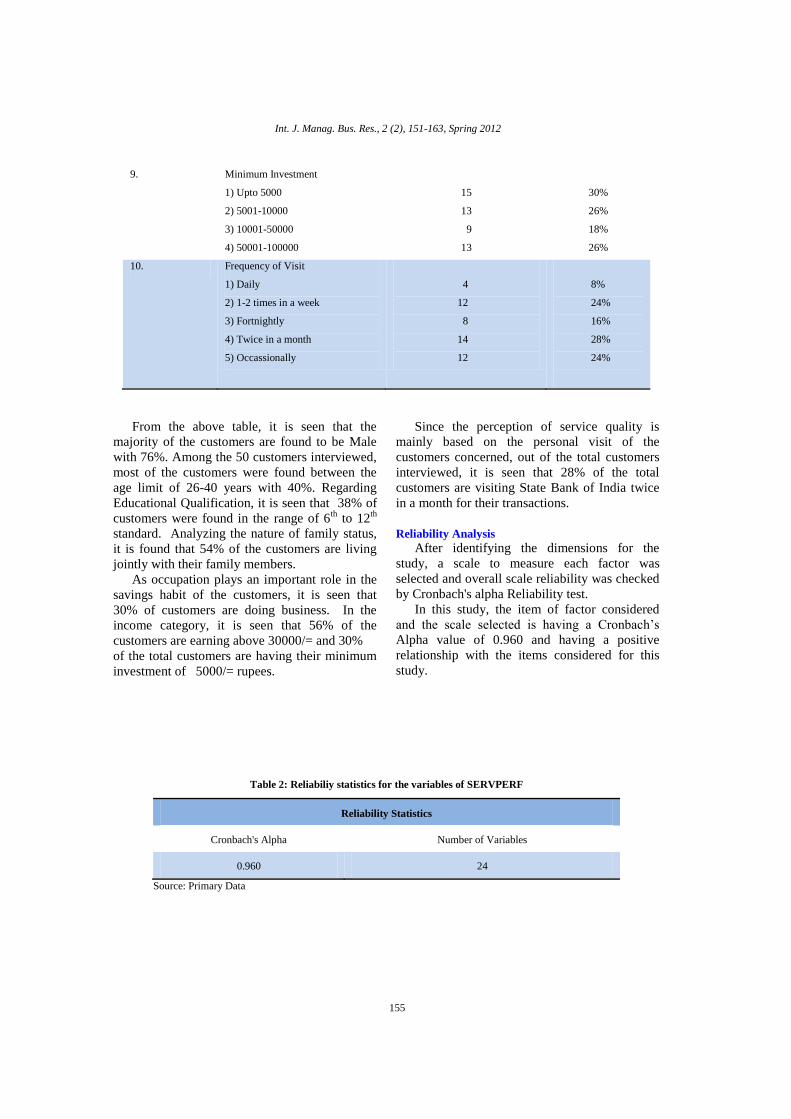
9. Minimum Investment
1) Upto 5000
2) 5001-10000
3) 10001-50000
4) 50001-100000
15
13
9
13
30%
26%
18%
26%
10. Frequency of Visit
1) Daily
2) 1-2 times in a week
3) Fortnightly
4) Twice in a month
5) Occassionally
4
12
8
14
12
8%
24%
16%
28%
24%
From the above table, it is seen that the
majority of the customers are found to be Male
with 76%. Among the 50 customers interviewed,
most of the customers were found between the
age limit of 26-40 years with 40%. Regarding
Educational Qualification, it is seen that 38% of
customers were found in the range of 6th
to 12th
standard. Analyzing the nature of family status,
it is found that 54% of the customers are living
jointly with their family members.
As occupation plays an important role in the
savings habit of the customers, it is seen that
30% of customers are doing business. In the
income category, it is seen that 56% of the
customers are earning above 30000/= and 30%
of the total customers are having their minimum
investment of 5000/= rupees.
Since the perception of service quality is
mainly based on the personal visit of the
customers concerned, out of the total customers
interviewed, it is seen that 28% of the total
customers are visiting State Bank of India twice
in a month for their transactions.
Reliability Analysis
After identifying the dimensions for the
study, a scale to measure each factor was
selected and overall scale reliability was checked
by Cronbach's alpha Reliability test.
In this study, the item of factor considered
and the scale selected is having a Cronbach‟s
Alpha value of 0.960 and having a positive
relationship with the items considered for this
study.
Table 2: Reliabiliy statistics for the variables of SERVPERF
Reliability Statistics
Cronbach's Alpha Number of Variables
0.960 24
Source: Primary Data
S. Vijay Anand; M. Selvaraj
156
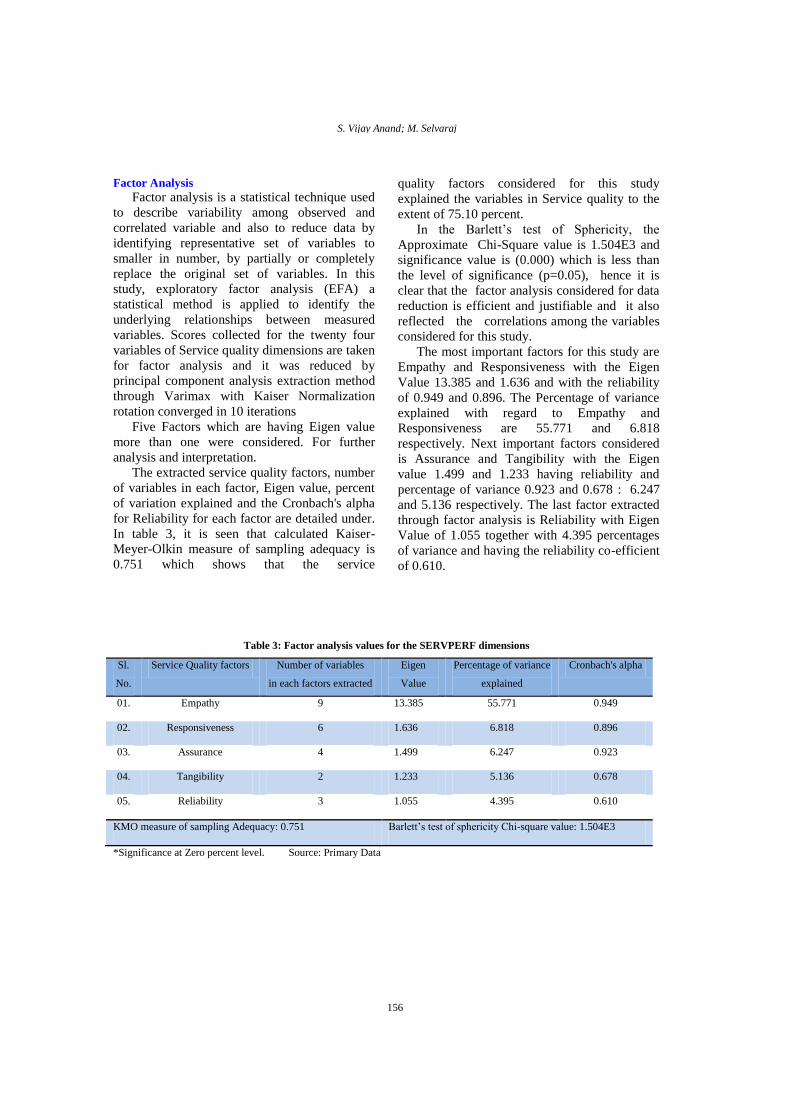
Factor Analysis
Factor analysis is a statistical technique used
to describe variability among observed and
correlated variable and also to reduce data by
identifying representative set of variables to
smaller in number, by partially or completely
replace the original set of variables. In this
study, exploratory factor analysis (EFA) a
statistical method is applied to identify the
underlying relationships between measured
variables. Scores collected for the twenty four
variables of Service quality dimensions are taken
for factor analysis and it was reduced by
principal component analysis extraction method
through Varimax with Kaiser Normalization
rotation converged in 10 iterations
Five Factors which are having Eigen value
more than one were considered. For further
analysis and interpretation.
The extracted service quality factors, number
of variables in each factor, Eigen value, percent
of variation explained and the Cronbach's alpha
for Reliability for each factor are detailed under.
In table 3, it is seen that calculated Kaiser-
Meyer-Olkin measure of sampling adequacy is
0.751 which shows that the service
quality factors considered for this study
explained the variables in Service quality to the
extent of 75.10 percent.
In the Barlett‟s test of Sphericity, the
Approximate Chi-Square value is 1.504E3 and
significance value is (0.000) which is less than
the level of significance (p=0.05), hence it is
clear that the factor analysis considered for data
reduction is efficient and justifiable and it also
reflected the correlations among the variables
considered for this study.
The most important factors for this study are
Empathy and Responsiveness with the Eigen
Value 13.385 and 1.636 and with the reliability
of 0.949 and 0.896. The Percentage of variance
explained with regard to Empathy and
Responsiveness are 55.771 and 6.818
respectively. Next important factors considered
is Assurance and Tangibility with the Eigen
value 1.499 and 1.233 having reliability and
percentage of variance 0.923 and 0.678 : 6.247
and 5.136 respectively. The last factor extracted
through factor analysis is Reliability with Eigen
Value of 1.055 together with 4.395 percentages
of variance and having the reliability co-efficient
of 0.610.
Table 3: Factor analysis values for the SERVPERF dimensions
Sl.
No.
Service Quality factors Number of variables
in each factors extracted
Eigen
Value
Percentage of variance
explained
Cronbach's alpha
01. Empathy 9 13.385 55.771 0.949
02. Responsiveness 6 1.636 6.818 0.896
03. Assurance 4 1.499 6.247 0.923
04. Tangibility 2 1.233 5.136 0.678
05. Reliability 3 1.055 4.395 0.610
KMO measure of sampling Adequacy: 0.751 Barlett‟s test of sphericity Chi-square value: 1.504E3
*Significance at Zero percent level. Source: Primary Data
Int. J. Manag. Bus. Res., 2 (2), 151-163, Spring 2012
157
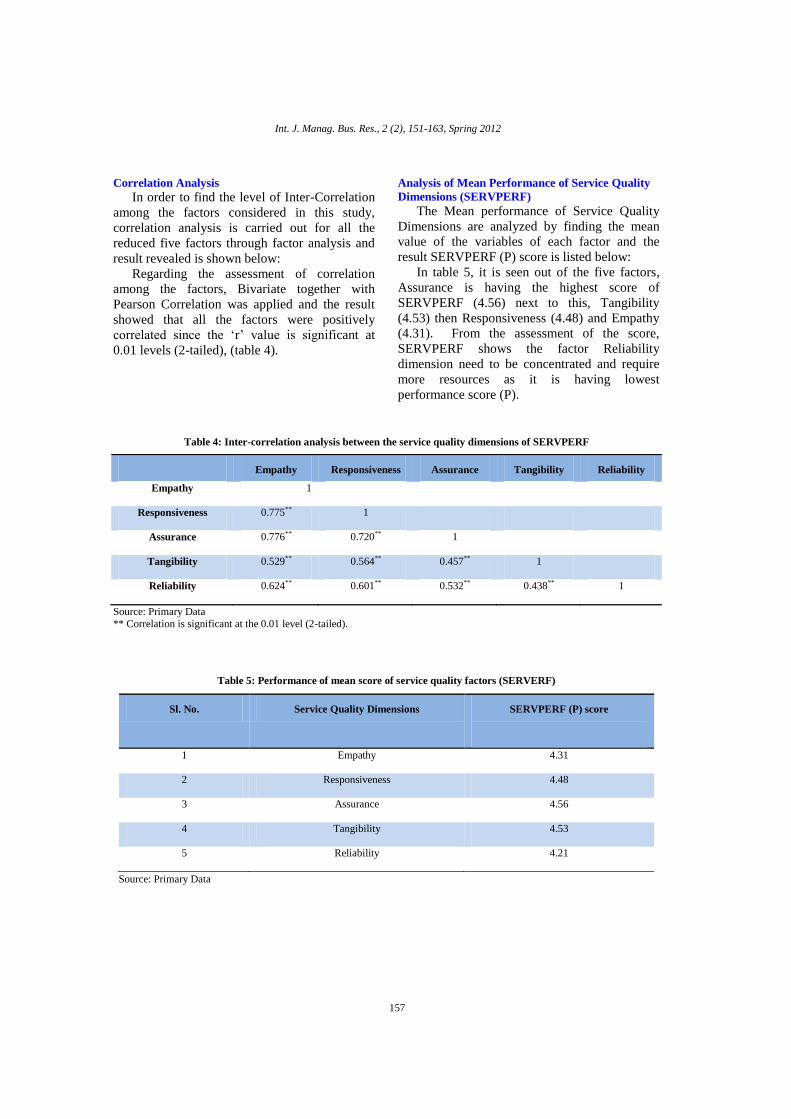
Correlation Analysis
In order to find the level of Inter-Correlation
among the factors considered in this study,
correlation analysis is carried out for all the
reduced five factors through factor analysis and
result revealed is shown below:
Regarding the assessment of correlation
among the factors, Bivariate together with
Pearson Correlation was applied and the result
showed that all the factors were positively
correlated since the „r‟ value is significant at
0.01 levels (2-tailed), (table 4).
Analysis of Mean Performance of Service Quality
Dimensions (SERVPERF)
The Mean performance of Service Quality
Dimensions are analyzed by finding the mean
value of the variables of each factor and the
result SERVPERF (P) score is listed below:
In table 5, it is seen out of the five factors,
Assurance is having the highest score of
SERVPERF (4.56) next to this, Tangibility
(4.53) then Responsiveness (4.48) and Empathy
(4.31). From the assessment of the score,
SERVPERF shows the factor Reliability
dimension need to be concentrated and require
more resources as it is having lowest
performance score (P).
Table 4: Inter-correlation analysis between the service quality dimensions of SERVPERF
Empathy Responsiveness Assurance Tangibility Reliability
Empathy 1
Responsiveness 0.775** 1
Assurance 0.776** 0.720** 1
Tangibility 0.529** 0.564** 0.457** 1
Reliability 0.624** 0.601** 0.532** 0.438** 1
Source: Primary Data
** Correlation is significant at the 0.01 level (2-tailed).
Table 5: Performance of mean score of service quality factors (SERVERF)
Source: Primary Data
Sl. No. Service Quality Dimensions SERVPERF (P) score
1 Empathy 4.31
2 Responsiveness 4.48
3 Assurance 4.56
4 Tangibility 4.53
5 Reliability 4.21
S. Vijay Anand; M. Selvaraj
158
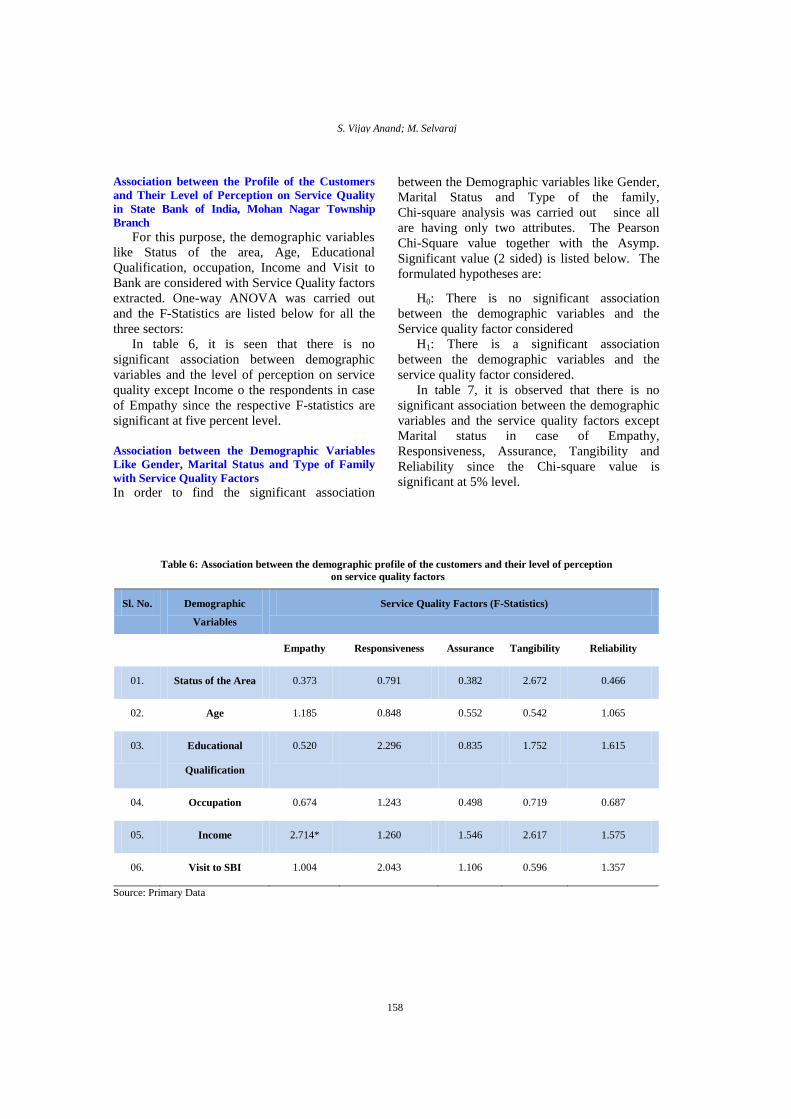
Association between the Profile of the Customers
and Their Level of Perception on Service Quality
in State Bank of India, Mohan Nagar Township
Branch
For this purpose, the demographic variables
like Status of the area, Age, Educational
Qualification, occupation, Income and Visit to
Bank are considered with Service Quality factors
extracted. One-way ANOVA was carried out
and the F-Statistics are listed below for all the
three sectors:
In table 6, it is seen that there is no
significant association between demographic
variables and the level of perception on service
quality except Income o the respondents in case
of Empathy since the respective F-statistics are
significant at five percent level.
Association between the Demographic Variables
Like Gender, Marital Status and Type of Family
with Service Quality Factors
In order to find the significant association
between the Demographic variables like Gender,
Marital Status and Type of the family,
Chi-square analysis was carried out since all
are having only two attributes. The Pearson
Chi-Square value together with the Asymp.
Significant value (2 sided) is listed below. The
formulated hypotheses are:
H0: There is no significant association
between the demographic variables and the
Service quality factor considered
H1: There is a significant association
between the demographic variables and the
service quality factor considered.
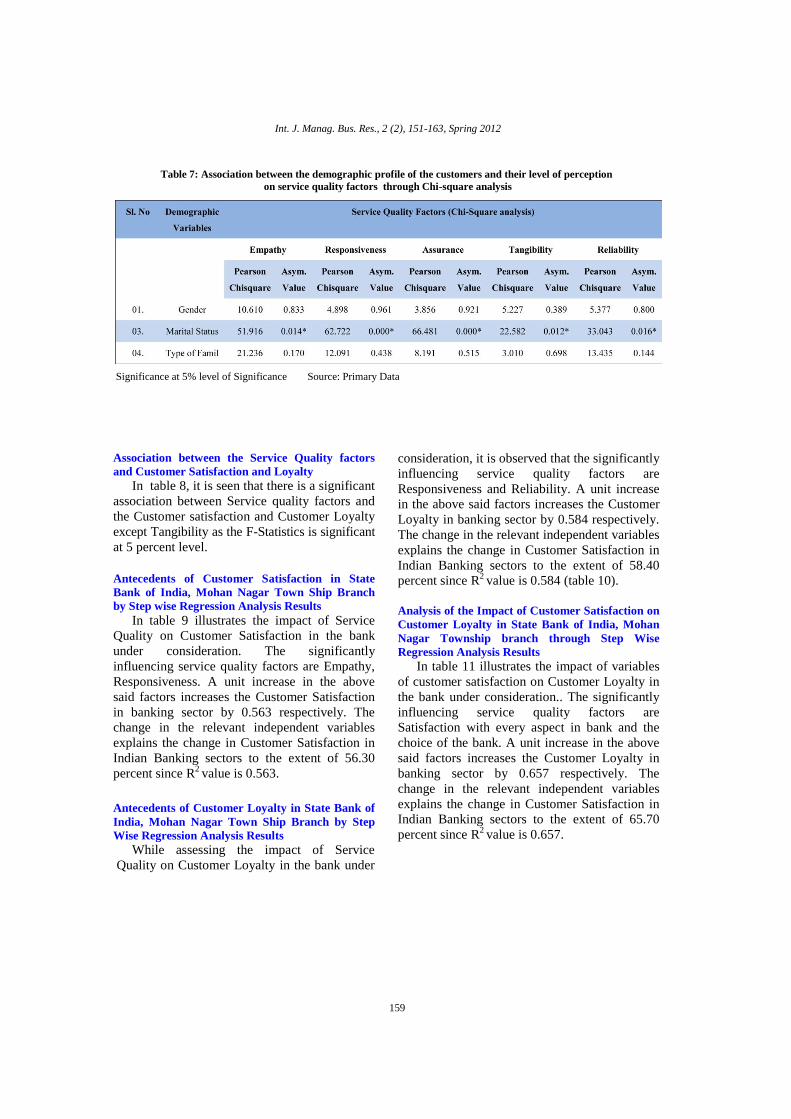
In table 7, it is observed that there is no
significant association between the demographic
variables and the service quality factors except
Marital status in case of Empathy,
Responsiveness, Assurance, Tangibility and
Reliability since the Chi-square value is
significant at 5% level.
Table 6: Association between the demographic profile of the customers and their level of perception
on service quality factors
Sl. No. Demographic
Variables
Service Quality Factors (F-Statistics)
Empathy Responsiveness Assurance Tangibility Reliability
01. Status of the Area 0.373 0.791 0.382 2.672 0.466
02. Age 1.185 0.848 0.552 0.542 1.065
03. Educational
Qualification
0.520 2.296 0.835 1.752 1.615
04. Occupation 0.674 1.243 0.498 0.719 0.687
05. Income 2.714* 1.260 1.546 2.617 1.575
06. Visit to SBI 1.004 2.043 1.106 0.596 1.357
Source: Primary Data
Int. J. Manag. Bus. Res., 2 (2), 151-163, Spring 2012
159
Table 7: Association between the demographic profile of the customers and their level of perception
on service quality factors through Chi-square analysis
Significance at 5% level of Significance Source: Primary Data
Association between the Service Quality factors
and Customer Satisfaction and Loyalty
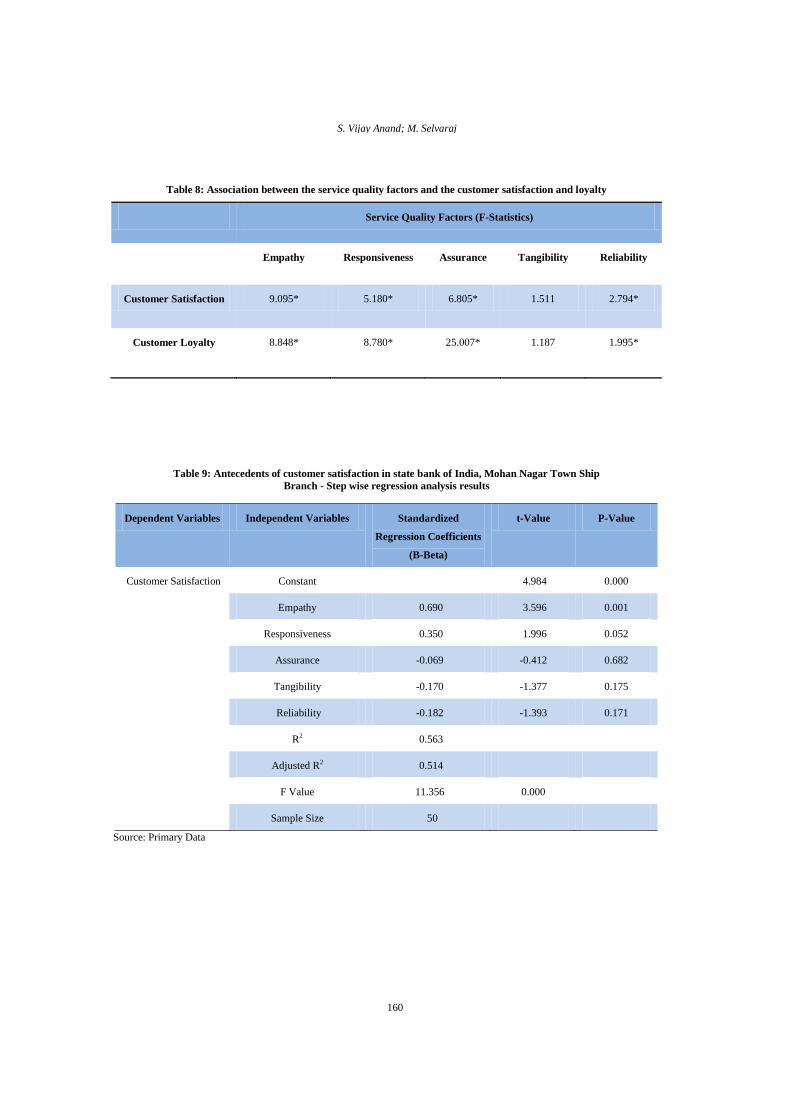
In table 8, it is seen that there is a significant
association between Service quality factors and
the Customer satisfaction and Customer Loyalty
except Tangibility as the F-Statistics is significant
at 5 percent level.
Antecedents of Customer Satisfaction in State
Bank of India, Mohan Nagar Town Ship Branch
by Step wise Regression Analysis Results
In table 9 illustrates the impact of Service
Quality on Customer Satisfaction in the bank
under consideration. The significantly
influencing service quality factors are Empathy,
Responsiveness. A unit increase in the above
said factors increases the Customer Satisfaction
in banking sector by 0.563 respectively. The
change in the relevant independent variables
explains the change in Customer Satisfaction in
Indian Banking sectors to the extent of 56.30
percent since R2 value is 0.563.
Antecedents of Customer Loyalty in State Bank of
India, Mohan Nagar Town Ship Branch by Step
Wise Regression Analysis Results
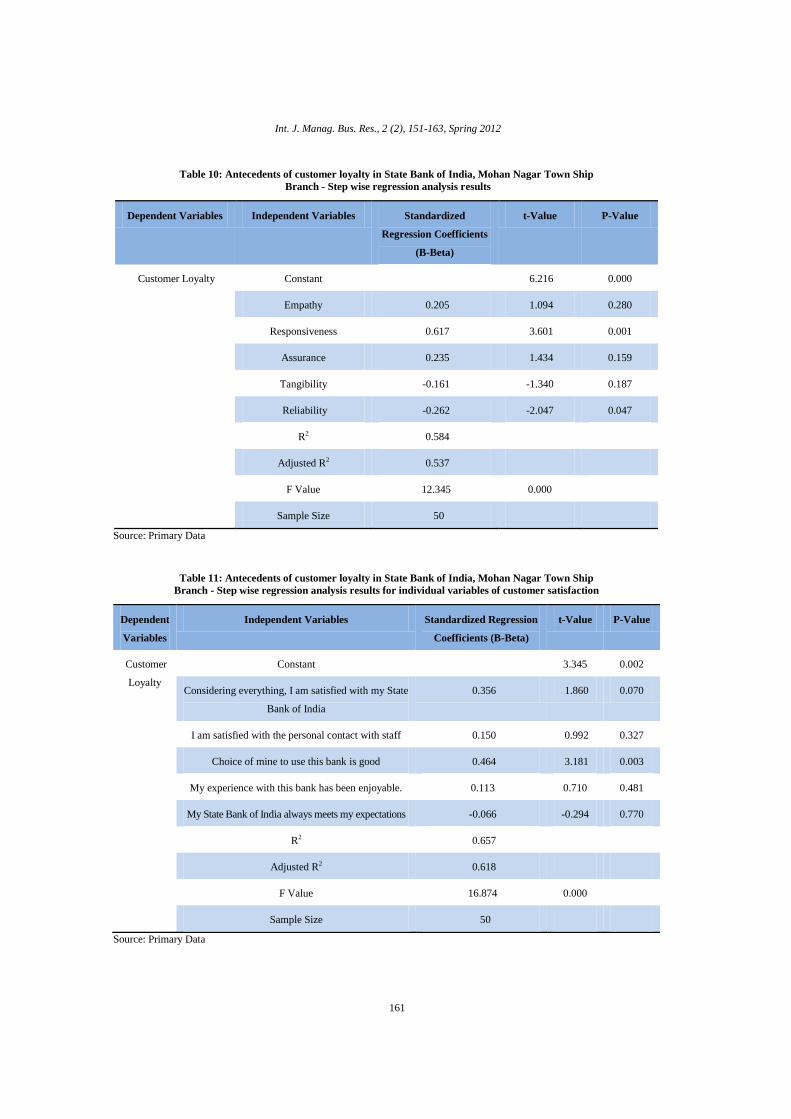
While assessing the impact of Service
Quality on Customer Loyalty in the bank under
consideration, it is observed that the significantly
influencing service quality factors are
Responsiveness and Reliability. A unit increase
in the above said factors increases the Customer
Loyalty in banking sector by 0.584 respectively.
The change in the relevant independent variables
explains the change in Customer Satisfaction in
Indian Banking sectors to the extent of 58.40
percent since R2 value is 0.584 (table 10).
Analysis of the Impact of Customer Satisfaction on
Customer Loyalty in State Bank of India, Mohan
Nagar Township branch through Step Wise
Regression Analysis Results
In table 11 illustrates the impact of variables
of customer satisfaction on Customer Loyalty in
the bank under consideration.. The significantly
influencing service quality factors are
Satisfaction with every aspect in bank and the
choice of the bank. A unit increase in the above
said factors increases the Customer Loyalty in
banking sector by 0.657 respectively. The
change in the relevant independent variables
explains the change in Customer Satisfaction in
Indian Banking sectors to the extent of 65.70
percent since R2 value is 0.657.
S. Vijay Anand; M. Selvaraj
160
Table 8: Association between the service quality factors and the customer satisfaction and loyalty
Service Quality Factors (F-Statistics)
Empathy Responsiveness Assurance Tangibility Reliability
Customer Satisfaction 9.095* 5.180* 6.805* 1.511 2.794*
Customer Loyalty 8.848* 8.780* 25.007* 1.187 1.995*
Table 9: Antecedents of customer satisfaction in state bank of India, Mohan Nagar Town Ship
Branch - Step wise regression analysis results
Dependent Variables Independent Variables Standardized
Regression Coefficients
(B-Beta)
t-Value P-Value
Customer Satisfaction Constant 4.984 0.000
Empathy 0.690 3.596 0.001
Responsiveness 0.350 1.996 0.052
Assurance -0.069 -0.412 0.682
Tangibility -0.170 -1.377 0.175
Reliability -0.182 -1.393 0.171
R2 0.563
Adjusted R2 0.514
F Value 11.356 0.000
Sample Size 50
Source: Primary Data
Int. J. Manag. Bus. Res., 2 (2), 151-163, Spring 2012
161
Table 10: Antecedents of customer loyalty in State Bank of India, Mohan Nagar Town Ship
Branch - Step wise regression analysis results
Dependent Variables Independent Variables Standardized
Regression Coefficients
(B-Beta)
t-Value P-Value
Customer Loyalty Constant 6.216 0.000
Empathy 0.205 1.094 0.280
Responsiveness 0.617 3.601 0.001
Assurance 0.235 1.434 0.159
Tangibility -0.161 -1.340 0.187
Reliability -0.262 -2.047 0.047
R2 0.584
Adjusted R2 0.537
F Value 12.345 0.000
Sample Size 50
Source: Primary Data
Table 11: Antecedents of customer loyalty in State Bank of India, Mohan Nagar Town Ship
Branch - Step wise regression analysis results for individual variables of customer satisfaction
Dependent
Variables
Independent Variables Standardized Regression
Coefficients (B-Beta)
t-Value P-Value
Customer
Loyalty
Constant 3.345 0.002
Considering everything, I am satisfied with my State
Bank of India
0.356 1.860 0.070
I am satisfied with the personal contact with staff 0.150 0.992 0.327
Choice of mine to use this bank is good 0.464 3.181 0.003
My experience with this bank has been enjoyable. 0.113 0.710 0.481
My State Bank of India always meets my expectations -0.066 -0.294 0.770
R2 0.657
Adjusted R2 0.618
F Value 16.874 0.000
Sample Size 50
Source: Primary Data
S. Vijay Anand; M. Selvaraj
162
RESULTS AND CONCLUSION By analyzing the impact of service quality on
Customer satisfaction and Loyalty in State Bank
of India, Mohan Nagar Township Branch, it is
observed that out of five service quality factors
considered, Assurance is having a high Mean
score of SERVPERF (P) score and the bank
should concentrate on Reliability as it has the
least mean score of SERVPERF. Regarding the
association between the Demographic variables
and the service quality factors, it is seen that
there is no significant association found between
them except income in case of Empathy and
Marital status in respect of all service quality
factors.
Regarding the association between the
Service quality factors and the customer
satisfaction and customer Loyalty, it is seen that
there is a significant association found between
them in respect of all the service quality
dimensions.
While analyzing the antecedents of Customer
satisfaction and Loyalty, it is seen that the
factors Responsiveness, Reliability and Empathy
are significantly influenced and also explained
the relevant changes in the Independent
variables considered.
Customer satisfaction and loyalty in services
is not only prejudiced by the objectives of the
organization and also mainly due to intangible
aspects during the service performance.
From the result of this study, it is
clearly seen that the performance of quality in
service of State Bank of India, Mohan Nagar
Town ship branch of Salem in Tamilnadu is
having a positive impact on customer
satisfaction and Loyalty.
Limitations and Future Research
Although this study dealt with the customer
perception towards service quality and its impact
on satisfaction and Loyalty in State Bank of
India, Mohan Nagar Township branch, the
sample size considered is very small and
surveyed in Salem District of Tamilnadu state
with one State Bank of India branch. The results
obtained may not be suitable as a whole having
customers with different demographic profiles.
As State Bank of India is having a large number
of branches in and around the nation, empirical
research may be conducted comparatively with
other branches or with other sectors so that
service quality and its impact on customer
satisfaction across the different contexts or
organization can be measured and can be utilized
for future development and improvement.
REFERENCES Brady, M. K., Cronin, Jr. J. and Brand, R. R. (2002).
Performance-only Measurement of Service Quality:
A Replication and Extension. Journal of Business
Research, 55 (1), pp. 27-31.
Brown, T. J., Churchill., G. A. and Peter., J. P.
(1993). Improving the Measurement of Service
Quality. Journal of Retailing, 69 (1), pp. 127-139.
Cronin, J. J. and Taylor, S. A. (1992). Measuring
Service Quality: A Reexamination and Extension.
Journal of Marketing, 56 (3), pp. 55- 67.
Dharmalingam, S., Ramesh, R. and Kannan, K.V.
(2011). Investigating the Service Quality
Dimensions to Customer Satisfaction and Loyalty
of New Private Sector Banks in Tamilnadu –An
Empirical Study. Research journal of Social
Science and Management, 4 (1), pp. 37-46.
Dutta, K. and Dutta, A. (2009). Customer
Expectations and Perceptions across the Indian
Banking Industry and the Resultant Financial
Implications. Journal of Services Research, 9(1),
pp. 31-49.
Elangovan, R., and Sabitha, K. (2011). Customers
Perception towards Internet Banking Services- A
Study with Reference to Puducherry Territory.
Sankhya-International journal of Management and
Technology, 2 (2), pp. 60-63.
Gopalakrishnan, J., Mishra, B. B., Gupta, V. K. and
Vetrivel, A. (2011). The Impact of Service Quality
and Customer Satisfaction on Customer Retention
in the Indian Banking Industry: An Empirical
Analysis. Research Journal of Social Science and
Management, 1 (3), pp. 52-68.
Jain, S. K. and Gupta, G. (2004). Measuring Service
Quality: SERVQUAL vs. SERVPERF Scales,
VIKALPA, 29 (2), pp.25-36.
Llorens Montes, F. J., Mar Fuenties, M. D. and
Molina Fernandez, L. M. (2003). Quality
Management in Banking Services: An Approach to
Employee and Customer Perceptions. Total Quality
Management, 14 (3), pp. 305–323.
Parasuraman, A., Zeithaml, V. A. and Berry, L. L.
(1985). A Conceptual Model of Service Quality
and Its Implication of Future Research, Journal of
Retail and Consumer Services, 12, pp. 373-383.
Parasuraman, A., Zeithaml, V. A. and Berry., L. L.
(1991). Refinement and Reassessment of the
SERVPERF Scale. Journal of Retailing, 67 (4),
pp. 420-450.
Tam, J. L. M. (2004). Customer Satisfaction, Service
Quality and Perceived Value: An Integrative

Int. J. Manag. Bus. Res., 2 (2), 151-163, Spring 2012
163
Model. Journal of Marketing Management, 20
(7-8), pp. 897-917.
Teas., R. K. (1993). Expectations, Performance
Evaluation, and Consumers'Perceptions of Quality.
Journal of Marketing, 57 (4), pp.18-34.
Vanpariya, B. and Ganguly, P. (2010). SERVQUAL
versus SERVPERF: An Assessment from Indian
Banking Sector. TIMS-QUEST, 1(1), pp. 3-13.