The Impact of School Quality, Socio-Economic Factors...
58
The Impact of School Quality, Socio-Economic Factors and Child Health on Students’ Academic Performance: Evidence from Sri Lankan Primary Schools Harsha Aturupane The World Bank Paul Glewwe Department of Applied Economics University of Minnesota Suzanne Wisniewski Department of Applied Economics University of Minnesota July, 2007 Abstract One of the eight Millennium Development Goals is that all children in developing countries should complete primary education. Much progress has been made toward this goal, but completing primary school does not ensure that students have attained basic literacy and numeracy skills. Indeed, there is ample evidence that many children in developing countries are not learning these skills despite years of school attendance. This raises the question: What can schools and communities do to increase the learning that takes place in schools? Sri Lanka exemplifies these issues. It has achieved universal primary completion, but many Sri Lankan primary school students perform poorly on academic tests. This paper uses an unusually rich data set from Sri Lanka to investigate the determinants of academic performance (as measured by cognitive achievement tests) of grade 4 Sri Lankan students. At the child and household level, educated parents, better nutrition, high daily attendance, enrollment in private tutoring classes, exercise books. and electric lighting and children’s books at home all increase learning, while hearing problems have a strong negative effect. Among school variables, principals’ and teachers’ years of experience, collaborating with other schools in a “school family”, and meetings between parents and teachers all have positive impacts on students’ test scores. A final section provides recommendations for education policies in Sri Lanka.
Transcript of The Impact of School Quality, Socio-Economic Factors...

The Impact of School Quality, Socio-Economic Factors and Child Health on Students’ Academic Performance: Evidence from Sri Lankan Primary Schools
Harsha Aturupane The World Bank
Paul Glewwe
Department of Applied Economics University of Minnesota
Suzanne Wisniewski
Department of Applied Economics University of Minnesota
July, 2007
Abstract
One of the eight Millennium Development Goals is that all children in developing countries should complete primary education. Much progress has been made toward this goal, but completing primary school does not ensure that students have attained basic literacy and numeracy skills. Indeed, there is ample evidence that many children in developing countries are not learning these skills despite years of school attendance. This raises the question: What can schools and communities do to increase the learning that takes place in schools? Sri Lanka exemplifies these issues. It has achieved universal primary completion, but many Sri Lankan primary school students perform poorly on academic tests. This paper uses an unusually rich data set from Sri Lanka to investigate the determinants of academic performance (as measured by cognitive achievement tests) of grade 4 Sri Lankan students. At the child and household level, educated parents, better nutrition, high daily attendance, enrollment in private tutoring classes, exercise books. and electric lighting and children’s books at home all increase learning, while hearing problems have a strong negative effect. Among school variables, principals’ and teachers’ years of experience, collaborating with other schools in a “school family”, and meetings between parents and teachers all have positive impacts on students’ test scores. A final section provides recommendations for education policies in Sri Lanka.

I. Introduction
Academic economists and international development agencies claim that an
educated population is essential for economic growth and, more generally, for a higher
quality of life (Lucas, 1988; Barro, 1991; Mankiw, Romer and Weil, 1992; UNDP, 2003;
World Bank, 2000). One of the eight Millennium Development Goals is that by 2015 all
children in developing countries should finish primary school. Yet developing country
students who finish primary school often perform poorly on academic tests (Glewwe and
Kremer, 2005), and the value of a “low quality” education may be low. This raises the
question: What can developing countries do to promote learning in their schools?
This paper investigates the determinants of learning among fourth grade students
in Sri Lanka. Sri Lanka has already attained universal primary completion (see Bruns et
al, 2003), but many Sri Lankan students display weak academic performance, and it is
unclear what education policies would improve their performance. Fortunately, there is a
rich data set that can be used to analyze the academic performance of Sri Lankan fourth
graders. It includes data on schools, child characteristics (including health and nutrition
status), and parental support for education. This paper uses these data to study the impact
of school quality, child health, and factors other on student learning in Sri Lanka.
The paper is organized as follows. Section II reviews the literature on the
determinants of academic performance in developing countries. Section III describes Sri
Lanka’s educational system. Section IV presents the data and discusses methodological
issues. Sections V and VI present the estimation results and discuss their implications for
policy. Section VII summarizes the findings and draws several conclusions.
1
II. Review of Previous Research on Academic Performance in Developing Countries
Many studies have attempted to estimate the impact of school and teacher
characteristics on student performance, yet most have serious estimation problems that
cast doubt on their results (see Glewwe, 2002, and Glewwe and Kremer, 2006). Almost
all existing studies are “retrospective,” that is based on data collected from schools as they
currently exist (in contrast to data collected from a randomized trial). Yet even the best
retrospective studies offer only limited guidance due to their estimation problems, the
most serious being omitted variable bias (unobserved school, household and child
characteristics that are correlated with observed school variables), and measurement error
in school data. This has led to wide variation in the estimated impacts of key variables.
For example, of 30 studies from developing countries reviewed by Hanushek (1995), 8
found significantly positive impacts of the teacher-pupil ratio on student learning, 8
found significantly negative impacts, and 14 found no significant impact.
In recent years researchers have turned to natural experiments and randomized
trials. Natural experiment studies use “natural” variation in a school characteristic that is
unlikely to be correlated with all other factors that determine learning. An (admittedly rare)
example is allocating students to different schools based on a lottery. Two recent natural
experiments suggest that: 1. Increases in school resources (measured by student-teacher
ratios) raise scores on reading (but not math) tests among black South African students
(Case and Deaton, 1999); and 2. Vouchers that provide funds for Colombian secondary
students to attend private schools raise reading test scores (Angrist et al, 2002). Studies
in Israel suggest that reducing class size raises reading scores and perhaps math scores,
but providing computers has no effect (Angrist and Lavy, 1999; 2002).
2
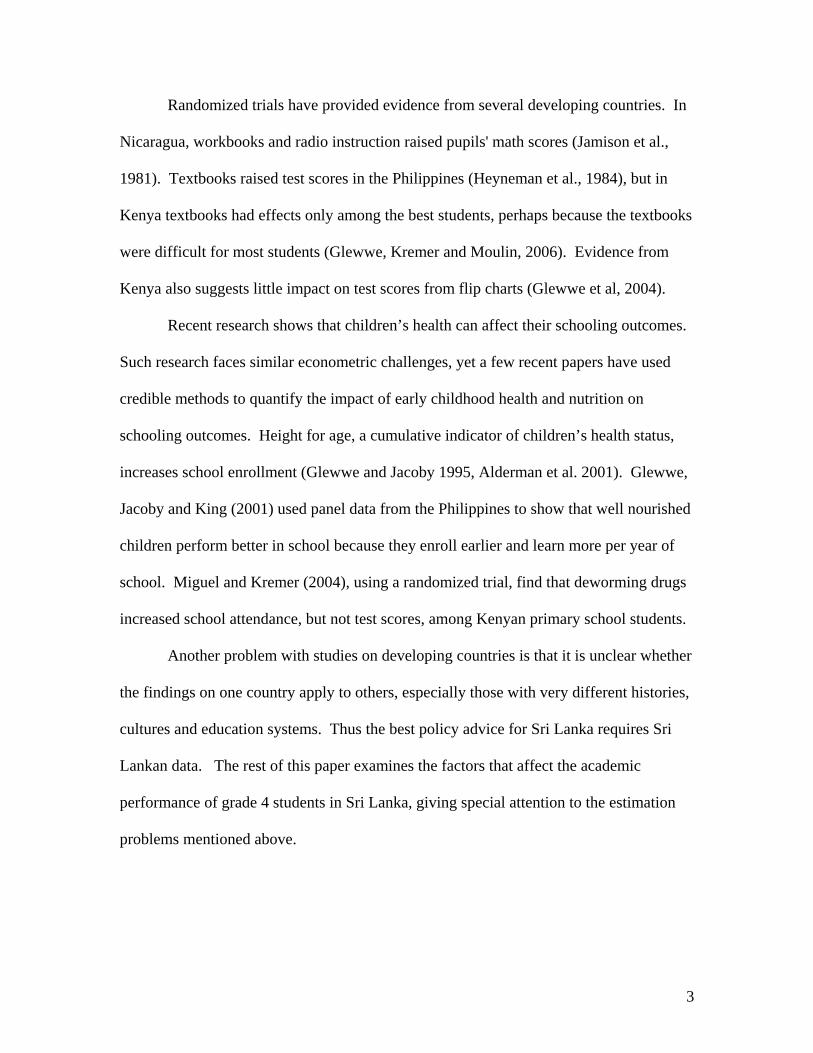
Randomized trials have provided evidence from several developing countries. In
Nicaragua, workbooks and radio instruction raised pupils' math scores (Jamison et al.,
1981). Textbooks raised test scores in the Philippines (Heyneman et al., 1984), but in
Kenya textbooks had effects only among the best students, perhaps because the textbooks
were difficult for most students (Glewwe, Kremer and Moulin, 2006). Evidence from
Kenya also suggests little impact on test scores from flip charts (Glewwe et al, 2004).
Recent research shows that children’s health can affect their schooling outcomes.
Such research faces similar econometric challenges, yet a few recent papers have used
credible methods to quantify the impact of early childhood health and nutrition on
schooling outcomes. Height for age, a cumulative indicator of children’s health status,
increases school enrollment (Glewwe and Jacoby 1995, Alderman et al. 2001). Glewwe,
Jacoby and King (2001) used panel data from the Philippines to show that well nourished
children perform better in school because they enroll earlier and learn more per year of
school. Miguel and Kremer (2004), using a randomized trial, find that deworming drugs
increased school attendance, but not test scores, among Kenyan primary school students.
Another problem with studies on developing countries is that it is unclear whether
the findings on one country apply to others, especially those with very different histories,
cultures and education systems. Thus the best policy advice for Sri Lanka requires Sri
Lankan data. The rest of this paper examines the factors that affect the academic
performance of grade 4 students in Sri Lanka, giving special attention to the estimation
problems mentioned above.
3

III. Primary Education in Sri Lanka
This section reviews education and student academic performance in Sri Lanka.
The first subsection describes Sri Lanka’s education system, focusing on its primary
schools, and the second examines the test performance of grade 4 students.
A. Sri Lanka’s Education System. Despite its low income of about $1,030 per
capita, Sri Lanka has enrolled nearly all primary aged (age 5-10) children in school; the
net primary enrolment rate is 96%, and the primary completion rate is 95%. Gender
equity also prevails; boys’ and girls’ enrollment rates are equal at the primary, secondary
and tertiary levels. These achievements reflect several policies. First, starting in the
1950s Sri Lanka established a complete, nation-wide network of free public schools.
Second, since the 1970s the government has provided free textbooks and uniforms to all
students. Third, school enrollment has been compulsory since 1997 for all children 6 to
14 years old (although generally no penalty is imposed for non-enrollment). Finally, Sri
Lankan parents have a high demand for education (Aturupane, 1999).
Sri Lanka’s education system has two unusual features. First, private schools are
rare; a law passed in the early 1960s forbids the opening of new private schools, although
existing private schools are allowed to operate). Second, most schools offer both primary
and secondary grades. In almost all urban areas the typical school offers the full cycle
(grades 1 to 13). The same is true in many rural areas, although in some rural schools the
highest grade is only grade 11. Finally, schools in the least densely populated rural areas
offer only grades 1-5 or grades 1-8. In the NEREC data (described in Section IV), 46.3%
of fourth graders attend schools that offer grades 1-13, another 33.2% attend schools that
offer grades 1-11, and only 20.5% attend schools that offer only to grades 1-5 or 1-8.
4

Prompted by recent findings of low primary student scores on achievement tests,
Sri Lankan policymakers are giving more attention to school quality (NEC, 2003). There
are several explanations for low education quality in Sri Lanka. First, the learning
competencies listed in the primary curriculum may not have been clearly communicated
to schools, and teachers may have weak training (see NEREC, 2004). Second, teacher
absenteeism is high; about 18% of teachers are absent on an average day. Third, some
schools lack sufficient funds to purchase educational materials. Fourth, many students
come from disadvantaged backgrounds, and such students often perform poorly. Fifth,
low income children may suffer from inadequate nutrition, including coming to school
without breakfast, which could reduce their class room performance.
Sri Lanka has recently introduced several policies to improve primary school
quality (NEC, 2003). First, child-friendly curricula have been introduced. Second, a
national network of education colleges and teacher centers has been set up to provide all
teachers with adequate pre-service and in-service training; this reduced the proportion of
untrained teachers from 25% in 1995 to 2% by 2003. Third, language and mathematics
skill programs have been introduced. Fourth, poor schools have received funds to
purchase essential educational material. Finally, a school meals program has been started
in poor rural areas, including the war-affected North-Eastern Province.
B. Performance of Grade 4 Students. In 2002, Sri Lanka’s National Education
Research and Evaluation Center (NEREC) collected data from a random sample of 20
grade 4 students in each of 939 randomly selected public schools (for details, see
NEREC, 2004b). The sample was drawn was all public school students in grade 4 in
2002. To measure the learning of students who had completed four years of school, the
5

sampled students were tested in mathematics, English and “first language” in March,
2003.1 The first language test was Tamil for Tamil students and Sinhala for Sinhalese
students. Each test had 40 questions, almost all of which were multiple choice.
Table 1 shows mean test scores, by socioeconomic groups. The scores on each
test are normalized to have a mean of zero and a standard deviation of one, as seen in the
first row. The second and third rows show that, on average, girls outperformed boys on
all three tests. The next nine rows give results for Sri Lanka’s nine provinces. Western
Province, which contains the two most economically advanced districts, Colombo and
Gampaha, performed best in all three subjects. Northwestern and Southern Provinces,
which border Western Province, had the next highest scores. Northern and Eastern
Provinces had the lowest scores. This probably reflects the impact of 20 years of armed
secessionist conflict on their education systems. The next lowest performance is in Uva
Province, a relatively underdeveloped province with a low per capita income.
Test scores vary widely by ethnic group. The tiny Burgher minority, descendents
of European colonists, performed the best, followed by the Sinhalese, Muslims
(Moor/Malay) and then Tamils. The low scores of Tamils reflects both the civil unrest in
the North-East, where most Tamils live, and the low incomes of Tamil tea and rubber
plantation workers in Sri Lanka’s central mountains.
Children’s test scores are highly correlated with mothers’ education, as expected.
Children whose mothers have no education have the lowest scores, followed by children
whose mothers have only primary schooling (1 to 5 years). Additional mothers’
schooling is almost always associated with higher scores.
1 A school year runs from January to December. The sample includes students who repeated grade 4 and thus were in grade 4 in both 2002 and 2003. Yet the primary repetition rate is only 3%.
6

Sri Lanka has four types of schools. Type 1AB schools teach grades 1-13 and
offer all three curriculum streams (arts, commerce and science). Type 1C schools also
teach grades 1-13 but offer only two streams (arts and commerce). Type 2 schools offer
only grades 1-11, and Type 3 are small schools that offer only grades 1-5 or 1-8. Their
full range of grades and curriculum suggests that Type 1AB schools are the best, and
indeed their students score highest on all three exams. Type 1C schools also offer all 13
grades, and their students have the second highest scores on two of the three tests (math
and first language). More curious is that, among the other schools, students’ scores in
schools that go up to grade 11 are lower than students’ scores in schools with only 5 or 8
grades. This is surprising as the latter schools are usually in remote, disadvantaged areas.
Table 1 also examines test scores by per capita expenditure, using a sub-sample of
the NEREC data with expenditure data (see Section IV). Students from wealthier families
have higher scores. For example, the scores of students in the poorest 20% of households
are about 0.4 standard deviations below the national average, while those of students in
the wealthiest group are 0.4 to 0.6 standard deviations above average.
The last three rows of Table 1 suggest an important role for health and nutrition.
The NEREC sub-sample with expenditure data has height and weight data, which were
used to calculate stunting (low height for age) and wasting (low weight for height). Both
are expressed as Z-scores that compare a child’s height and weight with the height and
weight of similar children in a reference healthy population, which has Z-scores with a
mean of zero and standard deviation of one. Low height for age indicates slow physical
growth due to poor nutrition and/or diarrhea and other illnesses during the first years of
life. Weight for height is a short-run indicator of recent malnutrition and/or recent
7

diarrhea and other illnesses. Stunted children (height for age Z-score < -2) performed
about one third of a standard deviation lower than the average student. Children with
modest stunting (Z-score from -2 to -1) scored slightly below average, and children who
were not stunted (Z-score > -1) performed above average by one fifth of a standard
deviation. Thus health during early childhood appears to influence academic skills. Yet
weight for height data show a weak relationship between current nutrition and academic
performance; the scores of children with weight for height Z-score below -2 ranged from
-0.15 to -0.05, and the scores of those with higher Z-scores were almost exactly 0.00.
IV. Data and Methodology
This section describes the approach this paper uses to estimate the impacts of
school quality, socioeconomic factors and child health on learning outcomes among
grade 4 students in Sri Lanka. There are major estimation problems, but many of them
can be reduced by fully using the unusually rich data from Sri Lanka. The following
subsections describe the data, discuss aspects of education in Sri Lanka that have
implications for estimation, provide a general framework for estimating the relationships
of interest, and explain how the framework is implemented using the Sri Lankan data.
A. Data. This paper uses three sources of data. The first is the National Education
Research and Evaluation Center (NEREC) survey of 16,383 students in 939 randomly
selected public schools. NEREC planned to sample 1880 students from each of Sri
Lanka’s nine regions, for a total sample of 16,920. In each region, about 100 schools
were sampled, and 20 students were sampled per school. Only 94 schools with 20
students are needed for 1880 students, but a few more were added since only 10 students
8

were sampled if schools had fewer than 20 fourth graders. To measure learning among
students who had completed grade 4 in December 2002, NEREC administered math,
English and first language (Sinhalese or Tamil) tests to fifth graders near the beginning
(March 8) of the 2003 school year (students who had repeated grade 4 were also tested,
but not students who repeated grade 5). NEREC also administered questionnaires to
students, parents, teachers, section heads, and principals in March, 2003.
The second source of data is from Sri Lanka’s National Education Commission
(NEC), which collected detailed information in the summer of 2003 from a random sub-
sample of the NEREC students: 2,653 students in 140 schools (about 16 schools per
province). The NEC survey collected three types of data. First, it used a household
questionnaire to collect data on each child and his or her household, including parents’
reports on their child’s health. Second, a school questionnaire was completed at each
child’s school, focusing on teachers who taught grade 4 in 2002 (including classroom
observation of those teachers). Third, in the summer of 2003 medical staff examined
each sampled child to obtain a wide variety of data on health and nutritional status.
The data collected by the NEREC and NEC questionnaires are summarized in
Appendix Tables A.1 and A.2, respectively.
The third data source is the Sri Lanka Integrated Survey (SLIS), which sampled
7,500 households in all of Sri Lanka’s provinces from October 1999 to September 2000.
Its household questionnaire collected information on employment, housing, education,
health, expenditures, and income, and a community questionnaire gathered data on
various community characteristics. Finally, a price questionnaire was used to collect
food and non-food prices.
9

B. Key Characteristics of Education in Sri Lanka. Several aspects of education
in Sri Lanka have important implications for estimation. First, recall that primary
education is virtually universal in Sri Lanka; this is supported by the SLIS data, which
show that 97.0% of children age 6-10 are enrolled in school. More remarkably, this rate
is virtually the same for all income groups, even for the poorest 20% of the population
the rate is 94.7%. Near universal enrollment implies that delayed entry into primary
school is rare; if a substantial fraction of children enter grade 1 at age 7 or age 8, instead
of age 5 or 6, the net enrollment rate would not be 97%. Thus, there is little scope for
selection bias due to delayed enrollment or non-enrollment in primary school.
Another impressive aspect of Sri Lankan schools is low grade repetition. The
primary repetition rate is 3% (World Bank, 2004). Thus almost all fifth graders enroll on
time and never repeat. Indeed, 93% of the pupils in the NEC sample were born in the 12
month time period (February 1993 to January 1994) corresponding to on time enrollment
and no repetition. Thus repetition is unlikely to lead to serious selection bias.
A final laudable success is Sri Lanka’s low primary school dropout rate. Only
1.4% of pupils fail to finish grade 5, the last year of primary school (World Bank, 2005).
Thus estimates of learning for Sri Lankan primary students are unlikely to suffer from
attrition bias. Overall, the rarity of delayed enrollment, repetition and dropping out in Sri
Lankan primary schools implies that a sample of fifth grade pupils is a random sample of
all Sri Lankan children who were nine years old at the beginning of the school year. (In
Sri Lanka, pupils start grade 1 if they are five years old at the start of the school year.)
Another important estimation issue is the extent to which parents can choose from
several nearby schools, and how frequently they exercise this option. Such choice appears
10

to be a real option; 66% of the NEC households report being within one kilometer of the
nearest school, and 86% report being within two kilometers. Yet most children attend the
nearest school. The NEC data show that between 56%, and 81%, of Sri Lankan fourth
graders attend the nearest school (the variable indicating attendance at the nearest school
is missing for 25% of the sample). In contrast, only 15% report not attending the nearest
school and doing so for reasons of school quality. A far more common way for parents to
address school quality concerns is to enroll their children in private tutoring (“tuition”)
classes offered by teachers and others, for a fee, outside of school hours. According to
the NEC data, 74% of grade 4 students attend these classes.
A related issue is whether parents can alter the quality of their children’s schools.
There seems to be little scope for this. Teachers are assigned at the national level. The
main focus of parent-teacher associations (PTAs) is to support the school, e.g. fund
raising. The NEC data reflect this apparent inability of parents to change their children’s
schools. When asked “how often do you participate in school activities related to your
child?” 81% of parents responded “only if the school requires it”. A more drastic way to
alter school quality, moving to an area with better schools, is very rare. About 72% of
children live in their place of birth (SLIS data). Only 29% of adults report living away
from their place of birth, and the main reasons for moving are marriage (9%), land
availability (8%) and work (6%). Also, parents rarely send their children to boarding
schools; 94% of the children in the NEC sample lived with one or both parents.
In summary, neither selection nor attrition bias appear likely in the Sri Lankan
context. It is also unlikely that school quality is endogenous due to parents directly
changing school quality by bypassing the closest school. Finally, two recent studies found
11

no evidence of selection bias in estimates of student academic achievement (Glewwe and
Jacoby, 1994, and Glewwe et al., 1995).
C. Analytical Framework.2 Estimation of the impact of education policies on
learning requires a clear framework to guide, and interpret, the estimates. Assume that
parents maximize life-cycle utility, which is a function of goods and services at each point
in time, child health at each point in time, and each child’s final educational attainment and
socioeconomic success. The constraints faced are production functions for academic skills
(learning) and for child health, the impacts of years in school and skills on children’s future
incomes, a life-cycle budget constraint, and possibly inter-temporal credit constraints.
The learning production function is a structural relationship. It can be depicted as:
A = apf(C, FS, MS, Q; S, H, EI) (1)
where A is skills acquired (“achievement”), “pf” denotes a production function, C is a
vector of fixed child characteristics (mainly “innate ability” and motivation/preferences),
FS and MS are fathers’ and mothers’ years of schooling, Q (“quality”) is a vector of
school, teacher and principal characteristics, S is the child’s years in school, H is a vector
of child health variables, and EI is all education “inputs” under parental control (e.g. time
children spend studying at home, education materials at home, and time in tuition classes).
For estimation, consider which variables are endogenous and which are exogenous.
The child characteristics in C, innate ability and motivation/tastes for schooling, are all
exogenous. Parental schooling is exogenous. Although in one sense it is an intermediate
input for very detailed educational inputs (EI), such as hours of “high quality” parental 2 The discussion in this subsection is adapted from Glewwe (2005) and Glewwe and Kremer (2006).
12

homework assistance, it is more practical, and unlikely to be misleading, to define the EI
variables more broadly (e.g. time parents spend helping with homework) and interact them
with parents’ schooling. The vector Q is all school, teacher or principal characteristics that
affect student learning. The sampled students are young, so the Q variables can be treated
as time invariant. They can also be treated as exogenous, since most children attend the
nearest school and parents do little else to alter the quality of their children’s schools.
Turn next to potentially endogenous variables. In most developing countries years
of schooling (S) is endogenous since many children start late, repeat and/or drop out. Yet
these are all rare in Sri Lanka, so years in school is exogenous for primary school pupils.
In fact, this variable has no variation since all sampled children were in grade 4 in 2002; the
point is that exogeneity of years in school rules out bias from sample selection or attrition.
The last two sets of variables are clearly endogenous. Children’s health status (H)
can directly affect their learning (Glewwe, 2005). Serious child health problems are poor
nutrition in early childhood, malnutrition while in school, parasitic infections, vision and
hearing problems, and micronutrient deficiencies. Educational inputs (EI) are everyday
activities and materials that help children learn, such as daily school attendance, enrollment
in tuition (tutoring) classes, and purchases of textbooks and other educational items.
Several variables that determine educational outcomes are excluded from equation
(1) because their effects are only indirect; they change A only by changing choices of S, H
and EI. They are school prices (denoted by PS), health care prices (PH), dwelling and local
environment characteristics that affect child health (DLE), household income (Y),
household productive assets that may affect children’s time allocation (PA), and parental
“tastes” for educated children (T). Schooling prices (PS) include school fees, prices of
13

school supplies, tuition class fees, and travel time to the school (if it affects absences or
tardiness). Health care prices (PH) include prices for both adult and child health care, and
distances to health care facilities. Dwelling and local environment characteristics include
source of drinking water, type of toilet, and the local prevalence of infectious diseases.
Household income (Y) can indirectly affect children’s learning via purchases of
educational inputs. Income may be endogenous because working children (who
presumably study less) increase household income. Yet Sri Lankan primary school age
children rarely work. Only 8% of children in the NEC data worked on family economic
activities (family farm or business) when school was in session, and only 0.5% worked
more than six hours per week. Wage work is even rarer; only 2.1% report such work when
school is in session, and only 0.2% work more than six hours per week.
Sri Lankan households’ main productive asset (PA) is land. Parents with land may
expect their children to work on it, reducing their time in school and time studying at home.
According to the NEC data, 13% of children in households with agricultural land did self-
employment work while in school, compared to 6% in households without land. Yet the
children of parents engaged in nonagricultural self-employment (who may own assets that
increase their children’s productivity) work at the same rate as children whose parents do
not do such work. In any case, the hours Sri Lankan children work when in school are very
low, as shown above, so the impact of productive assets on learning is probably small.
Parents’ choices regarding years of schooling (S), child health (H) and educational
inputs (EI) based on C, FS, MS, Q, PS, PH, DLE, Y, PA and T can be expressed as:
S = s(C, FS, MS, Q, PS, PH, DLE, Y, PA, T) (2)
14

H = h(C, FS, MS, Q, PS, PH, DLE, Y, PA, T) (3)
EI = ei(C, FS, MS, Q, PS, PH, DLE, Y, PA, T) (4)
Inserting (2), (3) and (4) into (1) gives the reduced form equation for (A):
A = arf(C, FS, MS, Q, PS, PH, DLE, Y, PA, T) (5)
Equation (5) is a causal relationship, but it is not a production function because it reflects
household preferences and includes prices as arguments. The “rf” (reduced form)
subscript distinguishes it from the production function (“pf”) relationship in equation (1).
Policymakers are mostly concerned with the impact of education policies on years
of schooling, S, and academic achievement, A. Examples of such policies are raising
teacher quality, which affects Q, and changing school costs (PS). Equation (5) shows how
such changes affect A. If the costs of such changes can be calculated, they can be
compared to the benefits in terms of increases in A. Of course, policy costs should
include costs borne by households, so changes in EI, as given in (4), and in household
leisure must be included in the total cost.
To clarify the difference between the production function in (1) and the reduced
form relationship in (5), consider a change in one element of Q, call it Qi. Equation (1)
shows how changing Qi affects A holding constant all other variables that directly affect
learning. This is the partial derivative of A with respect to Qi. In contrast, (5) shows the
impact on A after allowing S, H and EI to change in response to changes in Qi. This is
the total derivative of A with respect to Qi. For example, parents may respond to higher
15
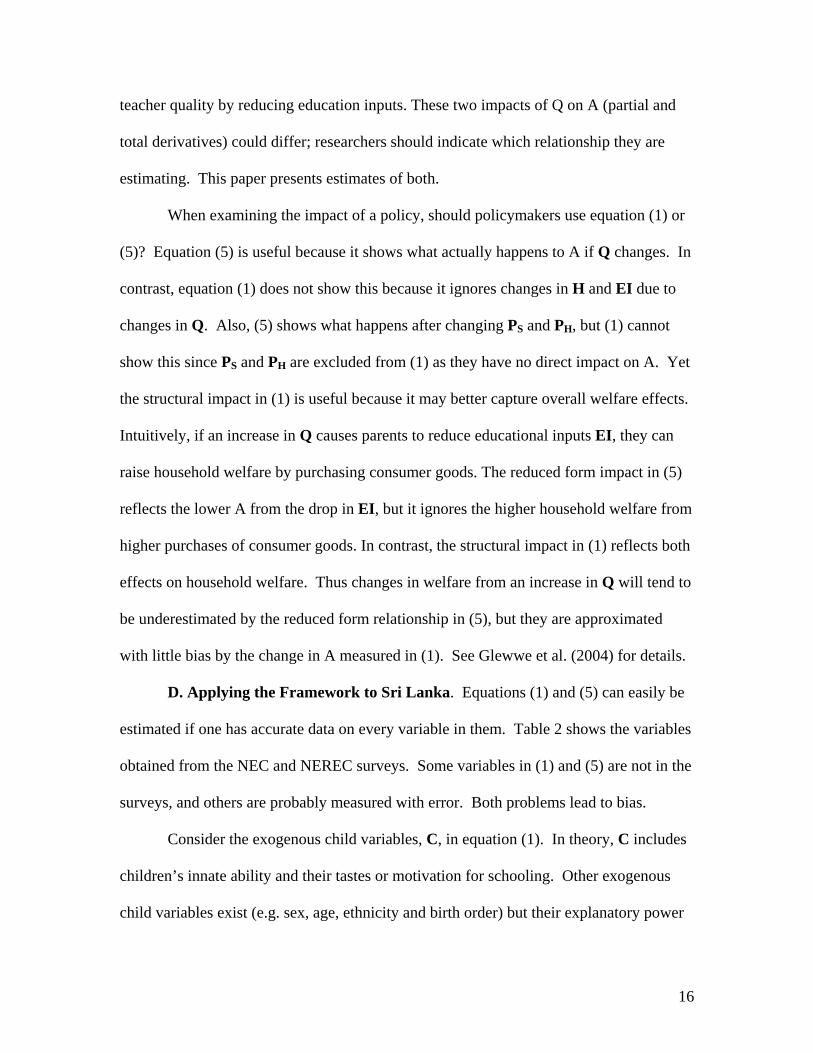
teacher quality by reducing education inputs. These two impacts of Q on A (partial and
total derivatives) could differ; researchers should indicate which relationship they are
estimating. This paper presents estimates of both.
When examining the impact of a policy, should policymakers use equation (1) or
(5)? Equation (5) is useful because it shows what actually happens to A if Q changes. In
contrast, equation (1) does not show this because it ignores changes in H and EI due to
changes in Q. Also, (5) shows what happens after changing PS and PH, but (1) cannot
show this since PS and PH are excluded from (1) as they have no direct impact on A. Yet
the structural impact in (1) is useful because it may better capture overall welfare effects.
Intuitively, if an increase in Q causes parents to reduce educational inputs EI, they can
raise household welfare by purchasing consumer goods. The reduced form impact in (5)
reflects the lower A from the drop in EI, but it ignores the higher household welfare from
higher purchases of consumer goods. In contrast, the structural impact in (1) reflects both
effects on household welfare. Thus changes in welfare from an increase in Q will tend to
be underestimated by the reduced form relationship in (5), but they are approximated
with little bias by the change in A measured in (1). See Glewwe et al. (2004) for details.
D. Applying the Framework to Sri Lanka. Equations (1) and (5) can easily be
estimated if one has accurate data on every variable in them. Table 2 shows the variables
obtained from the NEC and NEREC surveys. Some variables in (1) and (5) are not in the
surveys, and others are probably measured with error. Both problems lead to bias.
Consider the exogenous child variables, C, in equation (1). In theory, C includes
children’s innate ability and their tastes or motivation for schooling. Other exogenous
child variables exist (e.g. sex, age, ethnicity and birth order) but their explanatory power
16

in (1) is due only to their correlation with innate ability, tastes and motivation. Yet innate
ability, tastes and motivation are very difficult to measure, so other variables must be
added to “control for” them. First-born children may have higher ability, perhaps due to
lower maternal nutrient depletion (King, 2003), so that variable may reflect innate ability.
Girls may have more innate reading talent, and boys may have more math talent, so a sex
variable helps control for child ability. A third ability indicator is age (in months); older
children have had more time to develop their innate ability. Another indicator of ability,
and perhaps of tastes and motivation, is parents’ education. Parents’ ability, tastes and
motivation presumably affected their own years of schooling, and all may be inherited by
their children. Thus parental schooling partially reflects those three variables.
The parental schooling variables (FS and MS) also enter equation (1) directly.
There are two issues regarding these variables. The first is their interpretation; since child
ability, tastes and motivation are not well measured, the estimated impacts of parents’
education partly reflect those child variables. The second is that parents’ education may
be measured with error. Fortunately, both the NEC and the NEREC surveys record this
variable, so the NEREC data can be used to instrument the NEC variable. If measurement
errors are random, instrumental variable estimation will yield consistent estimates.
Both the NEREC and NEC data have many variables that describe each child’s
school, teacher, and principal (Q). School data include school type (see subsection III.B),
the student-teacher ratio, whether textbooks and teacher’s guides arrived at the start of the
school year, whether student desks, blackboards, computers and toilets are adequate,
electricity, access to drinking water, and whether the school is for boys only or girls only.
17

The NEC surveyed teachers who taught the sampled students when they were in
grade 4, but most schools had multiple grade 4 teachers, so the data do not link children
to their teachers. For such schools, grade 4 teacher characteristics were averaged. Teacher
variables include sex, general education, teacher education, years of teaching experience,
teaching experience in primary schools, years at the present school, days absent (reported
by the principal), number of in-service training sessions attended, number of visits from
“in service advisors” (school inspectors), divisional directors and directors of education,
parent-teacher meetings held, whether the teacher teaches students after school, whether
adequate equipment and materials were received, and the extent to which students had
class books, workbooks, exercise books, pens, pencils and other materials. Lastly, in
2003 trained observers visited these teachers’ classrooms. They recorded teachers’
preparation, pedagogical methods, use of learning materials, interactions with students,
use of English, evaluation methods, and overall enthusiasm.
Principals have similar quality variables, including gender, general education,
teacher education, years of experience (including years as a teacher), years of experience
as a principal, experience as a principal in the current school, frequency of inspecting
teachers’ lesson plans and supervising teachers, frequency of staff meetings on education
matters, whether the school belongs to a “school family” (explained in Section V), school
family meetings attended, parent-teacher meetings attended, educational reform programs
attended at the district, zone and division levels, and parent awareness programs.
The NEREC principal, section head and teacher questionnaires also collected
school data. Yet many NEREC variables had inconsistent and/or missing values, perhaps
because school personnel filled out the NEREC questionnaires without assistance. In
18

contrast, the NEC school questionnaire was filled in by trained enumerators who
interviewed teachers and principals, so these data have fewer problems. Unless otherwise
specified, school and teacher variables are from the NEC school questionnaire (except for
a few NEREC variables not in the NEC data).
The NEC survey collected detailed child health (H) data by interviewing parents
and by conducting medical exams. The household questionnaire solicited the following
information on children from their parents: illness in the past month, illnesses in the past
year that led to school absences, any illness ever that lasted more than two weeks, bouts
of malaria (and if so how many times in total, in last year, and in last 3 months), worms
in child’s stools (and if so, how many times in last 3 months and in last year), use of de-
worming medicine in the past year, and whether the child has vision problems, hearing
problems, and a physical or mental disability. Data were also collected on children’s
diets and eating and health habits.
The NEC survey employed trained field personnel who obtained direct physical
measurements from 2459 of the 2653 pupils. The data include children’s height, weight,
Bitot’s spot in eyes (to check Vitamin A deficiency), goiter (to check iodine deficiency),
visual acuity (with glasses on, using Snellen chart),3 hemoglobin (iron) level in blood (by
a finger prick), and pinworm, roundworm, whipworm and hookworm (fecal samples).
These data indicate that several health problems are very rare and so are unlikely
to explain student learning. Only 8 students (0.3%) had Bitot spot. Only 11 (0.5%) had
moderate roundworm infections, and none had heavy infections; 97.4% had no infections
at all. Only 10 (0.4%) had moderate whipworm infections, and none had heavy
infections (95.9% had no infections). Only 5 (0.2%) had moderate hookworm infections 3 There are no data on which students wear eyeglasses.
19
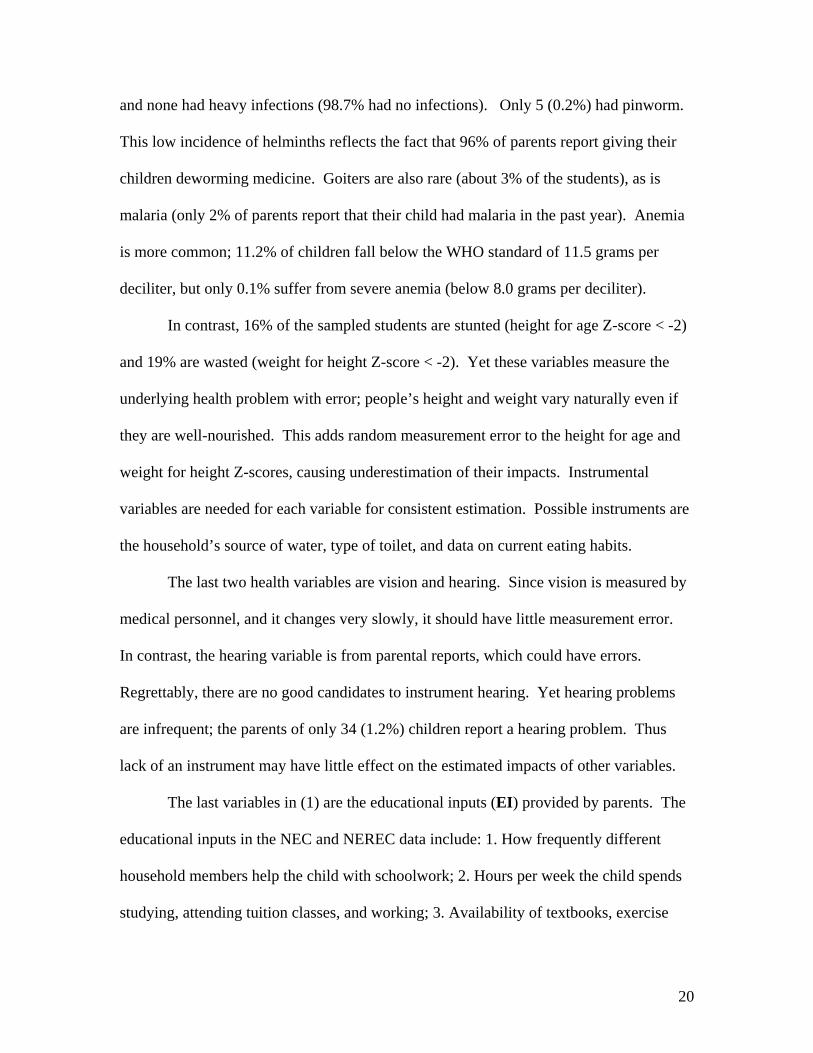
and none had heavy infections (98.7% had no infections). Only 5 (0.2%) had pinworm.
This low incidence of helminths reflects the fact that 96% of parents report giving their
children deworming medicine. Goiters are also rare (about 3% of the students), as is
malaria (only 2% of parents report that their child had malaria in the past year). Anemia
is more common; 11.2% of children fall below the WHO standard of 11.5 grams per
deciliter, but only 0.1% suffer from severe anemia (below 8.0 grams per deciliter).
In contrast, 16% of the sampled students are stunted (height for age Z-score < -2)
and 19% are wasted (weight for height Z-score < -2). Yet these variables measure the
underlying health problem with error; people’s height and weight vary naturally even if
they are well-nourished. This adds random measurement error to the height for age and
weight for height Z-scores, causing underestimation of their impacts. Instrumental
variables are needed for each variable for consistent estimation. Possible instruments are
the household’s source of water, type of toilet, and data on current eating habits.
The last two health variables are vision and hearing. Since vision is measured by
medical personnel, and it changes very slowly, it should have little measurement error.
In contrast, the hearing variable is from parental reports, which could have errors.
Regrettably, there are no good candidates to instrument hearing. Yet hearing problems
are infrequent; the parents of only 34 (1.2%) children report a hearing problem. Thus
lack of an instrument may have little effect on the estimated impacts of other variables.
The last variables in (1) are the educational inputs (EI) provided by parents. The
educational inputs in the NEC and NEREC data include: 1. How frequently different
household members help the child with schoolwork; 2. Hours per week the child spends
studying, attending tuition classes, and working; 3. Availability of textbooks, exercise
20

books and workbooks, by subject; 4. Number of children’s books at home; 5. Whether
parents obtain library books for their child; 6. School attendance in 2002 (from school
records); 7. Language spoken at home; and 8. Parent provided “educational trips”.4
The NEC data may measure educational inputs with substantial error. Luckily,
the NEREC parent and child questionnaires provide duplicate measurements for almost
all of them. If measurement errors are random and uncorrelated across the two surveys
(the NEREC questionnaires were filled in by parents and children in March 2003, while
the NEC questionnaire was completed by trained interviewers in the summer of 2003),
the NEREC data can be used to instrument the NEC data.
More specifically, the education inputs were instrumented as follows. Hours per
week studying and in tuition classes were instrumented by a dummy variable in the NEC
data indicating that the child goes to tuition classes, a similar variable from the NEREC
data, and two variables (described below) indicating parents’ tastes for educated children.
Children’s books at home were instrumented by a similar variable in the NEREC survey.
Exercise books are instrumented by two NEREC variables: frequency (reported by the
child) that the teacher uses exercise books and uses the blackboard. Preschool is
instrumented by a similar variable in the NEREC data.
Turn next to equation (5); H and EI in (1) are replaced by the PS, PH, Y, DLE,
PA and T variables. Sri Lanka’s public schools are free and provide free textbooks and
uniforms. The prices of workbooks and exercise books vary little by region, so the only
school price (PS) variables are the cost of tuition classes, distance to the nearest primary
school, and distance (from school) to the nearest public library. The NEC data on pupils’
4 Similar data are also available for “workbooks”, but these were never statistically significant and the data were available only for English and mathematics, not native language (Sinhalese or Tamil).
21
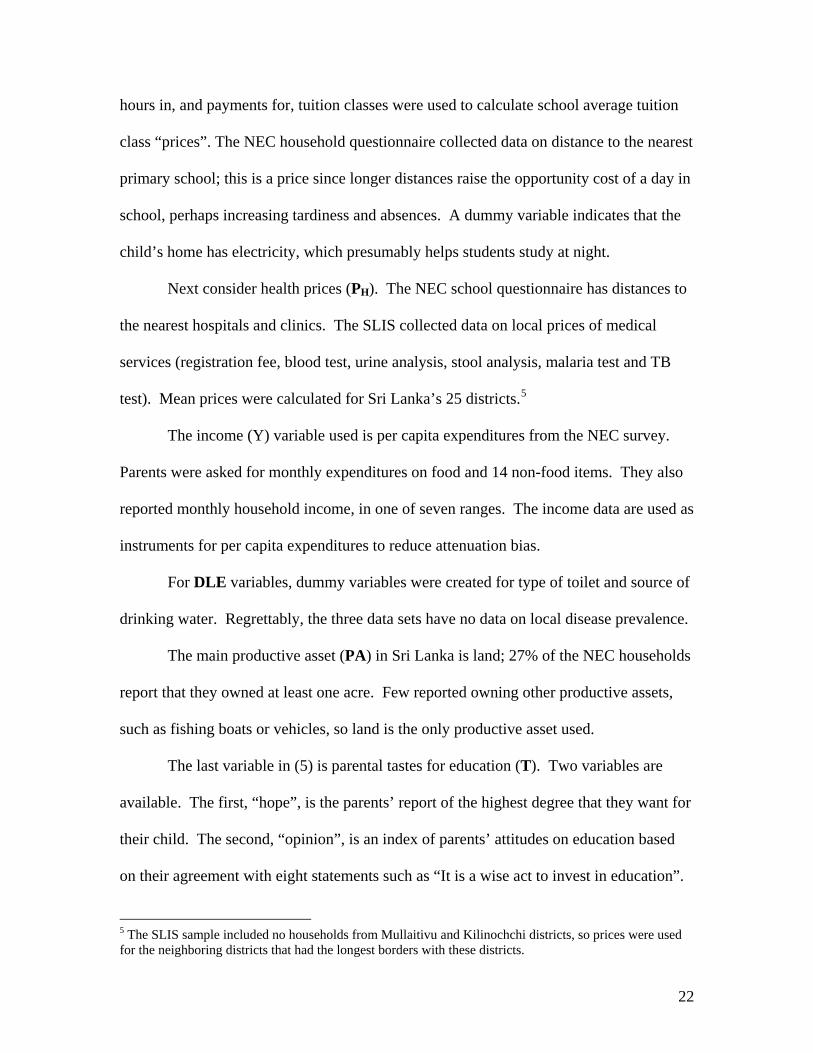
hours in, and payments for, tuition classes were used to calculate school average tuition
class “prices”. The NEC household questionnaire collected data on distance to the nearest
primary school; this is a price since longer distances raise the opportunity cost of a day in
school, perhaps increasing tardiness and absences. A dummy variable indicates that the
child’s home has electricity, which presumably helps students study at night.
Next consider health prices (PH). The NEC school questionnaire has distances to
the nearest hospitals and clinics. The SLIS collected data on local prices of medical
services (registration fee, blood test, urine analysis, stool analysis, malaria test and TB
test). Mean prices were calculated for Sri Lanka’s 25 districts.5
The income (Y) variable used is per capita expenditures from the NEC survey.
Parents were asked for monthly expenditures on food and 14 non-food items. They also
reported monthly household income, in one of seven ranges. The income data are used as
instruments for per capita expenditures to reduce attenuation bias.
For DLE variables, dummy variables were created for type of toilet and source of
drinking water. Regrettably, the three data sets have no data on local disease prevalence.
The main productive asset (PA) in Sri Lanka is land; 27% of the NEC households
report that they owned at least one acre. Few reported owning other productive assets,
such as fishing boats or vehicles, so land is the only productive asset used.
The last variable in (5) is parental tastes for education (T). Two variables are
available. The first, “hope”, is the parents’ report of the highest degree that they want for
their child. The second, “opinion”, is an index of parents’ attitudes on education based
on their agreement with eight statements such as “It is a wise act to invest in education”.
5 The SLIS sample included no households from Mullaitivu and Kilinochchi districts, so prices were used for the neighboring districts that had the longest borders with these districts.
22
V. Empirical Results
This section presents estimates of equations (1) and (5) for Sri Lanka using the
NEC and NEREC data. The first subsection focuses on child and household variables,
controlling for school characteristics using fixed effects. The second subsection adds the
school variables. The sample size drops from 2653 to less than 2450 because of variables
with missing data (mother’s age, use of libraries, and children’s books in the household).
Instrumental variable estimates reduce the sample size to slightly less than 2400.
A. School Fixed Effects. The first three columns of Table 3 give OLS estimates,
with school fixed effects, of production functions for test scores in math, English and first
language, respectively. The first four variables control for children’s innate ability and
motivation for schooling (C). Girls outperform boys in all three subjects. Girls may have
more reading talent than boys, but this may not explain the math score; perhaps girls are
more motivated than boys to study all three subjects. Age has a significantly positive
impact, which suggests that students’ intellectual abilities increase with age. Firstborn
children perform relatively better; this may reflect higher innate ability due to biological
factors and/or greater attention they receive from parents in the first years of life (relative
to later-born children). Finally, mother’s age has a positive impact on test scores; early
childbearing may have negative biological impacts on children’s innate ability (Pevalin,
2003), but social factors can also play a role. A quadratic mother’s age term has an
insignificant negative coefficient, showing no negative impact of late childbearing.
Next are three ethnic dummy variables, with Sinhalese as the omitted category.
(A fourth ethnic dummy, “other”, was never significant and thus was dropped.) Table 1
showed large differences in test scores by ethnic group. If the NEC and NEREC data
23
include most or all of the variables in equation (1), then these dummy variables should be
insignificant. For English, none of the ethnic variables is significant, but in first language
Tamils and Moors do worse, even after controlling for the language spoken at home, and
Moors have lower mathematics scores. Overall, most of the ethnic group differences in
Table 1 appear to be captured by the other variables in Table 3.
Both mothers’ (MS) and fathers’ (FS) schooling have large and statistically
significant impacts on all test scores. For each test, the father’s education has a larger
impact than the mother’s, a surprising result since mothers presumably spend more time
with their children. Perhaps father’s education also reflects family income, which may be
significant it is used to purchase other, unobserved educational inputs. Yet adding per
capita expenditure as a regressor (not shown) changes the coefficient neither on father’s
education nor on any other regressor. (The expenditure variable was significant at the
5%, but not the 1%, level suggesting only weak evidence of omitted educational inputs).
The next three variables measure child health (H), and a fourth indicates missing
data for child height (in which case height for age is replaced by its mean).6 Children
who are not stunted (high height for age), and thus had better nutrition in their first years
of life, scored higher on all three tests; a one standard deviation increase raises each test
score by about 0.1 standard deviations. In contrast, weight for height, an indicator of
current nutritional status, had a much smaller and statistically insignificant impact and so
was dropped as a regressor. Even if weight for height were significant, the estimated
impact was very small; a one standard deviation increase raises test scores by only 0.01
6 Preliminary regressions added variables for worm egg counts and visual acuity. Egg counts were almost never statistically significant, which reflects the low incidence of helminth infections in Sri Lanka. Similarly, the visual acuity variable was always insignificant, presumably because only about 1% of the sampled children had serious vision problems (a Snellen ratio below 6/12 for both eyes).
24

or 0.02 standard deviations. Even if it has measurement error, doubling its estimated
coefficient still yields small impacts; thus it is excluded from all subsequent regressions,
freeing it to be an instrument to reduce attenuation bias in the height for age variable.
Turning to the other health variables, the few children with hearing problems (as
reported by parents) have significantly lower test scores, with drops of 0.4 to 0.6 standard
deviations. Children who have ever had a serious (more than two week) illness had
significantly lower math and first language scores (negative impacts of -0.12 and -0.13,
respectively) but not English scores. Lastly, the goiter, malaria and hemoglobin variables
never had any explanatory power and so are excluded from all regressions in this paper.
Finally, consider educational inputs (EI). Hours in tuition classes has a strong
and statistically significant positive effect on all three test scores, as does hours studying
for the math and first language scores. Yet hours working has no significant impact
(though its impact was negative), which probably reflects Sri Lanka’s low incidence of
child labor; this variable is excluded from Table 3 and all subsequent tables.
The time mothers spend helping their children with schoolwork has a positive and
statistically significant impact on all three test scores, but time spent by fathers has a
(weakly) significant impact only on first language. Interaction terms between parents’
schooling and time spent helping children were all statistically insignificant. The weak
impact of fathers’ time may simply reflect lack of variation: 60% of mothers, but only
19% of fathers, report regularly helping their child with schoolwork.
Days in school has a strong positive impact on all three tests, as expected, as do
children’s books in the house and borrowing of library books. Frequency of “educational
25
trips” also has positive, but marginally significant, effect. Finally, both exercise books
and preschool attendance have significantly positive effects.
The R2 coefficients show that these regressions account for 23 to 27 percent of the
within-school variation (variation that remains after controlling for school fixed effects)
in the test scores. Since the test scores probably contain substantial measurement error,
the amount of “true” variation explained by these regressions is likely much higher.
Many of the explanatory variables in Table 3 may be measured with error, leading
to underestimation of the true impacts. Columns 4-6 of Table 3 report estimates (with
school fixed effects) that attempt to remove bias by instrumenting five variables: hours in
tuition classes, hours studying, children’s books in the home, preschool attendance, and
exercise books. The instruments used were discussed in subsection IV.D.
The instrumental variable (IV) estimates passed several specification tests. First,
overidentification tests do not reject the assumption that the residuals in the mathematics
and first language production functions are uncorrelated with the instruments, though this
hypothesis was rejected at the 95% level (but not the 99% level) for the English test.
Second, a check for weak instruments shows that, for all but one of the instrumented
variables, the (excluded) instruments have high predictive power, with F-tests ranging
from 6.64 (preschool) to 98.12 (father’s years of education). The sole exception is hours
studying; its F-test was 3.21. Third, Hausman tests comparing the fixed effects results in
columns (1) – (3) with the IV fixed effects results in columns (4) – (6) decisively reject
the null hypothesis that the parameters are equal (the p-values were 0.0000 for all three
subjects). Fourth, six other potentially endogenous variables (height for age, father helps
child with schoolwork, mother helps child with schoolwork, use of library books,
26

educational trips and the serious illness variable) passed the (joint) Hausman test; their
coefficients were not affected by IV estimation.7
Most of the uninstrumented variables have impacts similar to those in columns (1)
- (3) of Table 3, with four exceptions. First, the effect of the first-born variable drops and
loses significance in the math regression. Second, the effects of mother’s age decline and
lose significance for math and first language. Third, the three ethnic group variables have
smaller impacts and all lose statistical significance. Finally, the effects of mothers helping
children, library books and educational trips drop and lose significance.
For the variables that were instrumented, the impacts of parental education are a
bit larger, though in two of three cases mother’s education loses significance due to lower
precision. The impact of hours in tuition classes is 4-5 times higher and still significant.
In contrast, hours studying loses all significance due to much higher standard errors that
probably reflect weak instruments. Children’s books in the household has coefficients
that are 3-4 times higher and still significant (although marginally so for math). The
impacts of exercise books increase 2-3 fold (and remain statistically significant), but the
effect of preschools is imprecisely estimated and thus insignificant.
Overall, the IV results suggest that measurement error leads to serious attenuation
bias in OLS estimates of the impacts of tuition classes, children’s books in the household
and subject-specific exercise books. The IV impacts are quite large; raising time in tuition
classes from 1-3 to 4-6 hours per week increases test scores by 0.27 to 0.38 standard
7 This Hausman test examines whether additional variables should be treated as exogenous, conditional on the first five already being specified as endogenous (see Davidson and MacKinnon, 1993, pp.241-242). The additional instruments used were the weight for height z-score, whether the parent is a member of a library, expenditures for educational trips, the main water source is a tubewell, variables indicating how regularly the child eats meals, distance to the nearest health clinic, missing school frequently due to illness in the last year, parents helping children with schoolwork (NEREC data), and whether the parents are alive.
27

deviations, and subject specific exercise books increase test scores by 0.24 to 1.13
standard deviations.
As explained in Section IV, the reduced form impacts of variables of interest may
differ from their production function impacts. Also, variables with only indirect effects
on learning are not in the production function, yet their reduced form (indirect) impacts
may be of interest. Table 4 presents such estimates; note that the health (H) and education
input (EI) variables in equation (1) are replaced by income (Y), dwelling characteristics
(DLE), productive assets (PA) and parental tastes for education (T).
Exogenous child characteristics (C) and parental education (FS and MS) appear in
both the production function and the reduced form. The main changes in the OLS results
are that the impacts of child age, sex, first-born status and maternal age at birth are
smaller. This suggests that parents help “less able” children to compensate for their
lower innate ability. Note also that mother’s education has larger effects, suggesting that
better educated mothers provide more education inputs and have healthier children.
Turning to the additional variables, which have only indirect effects, agricultural
land has a positive but statistically insignificant impact, indicating little role for child
labor. Electric lighting at home has a large, statistically significant impact, raising test
scores by 0.21 to 0.26 standard deviations; presumably such lighting helps children study.
Reduced form estimates partially confirm this; electricity increases hours spent studying,
but this impact is not quite significant (t-statistic of 1.60). Household expenditure per
capita is also highly significant, but its positive impact is smaller than that of electricity; a
one standard deviation increase raises scores by 0.07 to 0.08 standard deviations.
28

Two variables indicate parents’ tastes for education. The one measuring parents’
hopes for their child’s education is highly significant, while the other (general opinion on
education) is less significant, and not at all significant for math. Finally, children whose
drinking water is from a river or stream have significantly lower math scores, and
children in households with “pit” latrines for toilets do worse in English; presumably
these effects reflect lower child health.
Columns (4)-(6) of Table 4 examine whether the OLS results change significantly
when per capita expenditures, parental education and parental tastes for education are
instrumented to reduce measurement error. The impact of per capita expenditures is very
imprecisely estimated, so little can be said. The impacts of parents’ education and
especially parental tastes increase, suggesting attenuation bias in the OLS estimates. The
other results change little, except that electricity has somewhat weaker effects.
B. School and Teacher Characteristics. Table 5 replaces the school fixed effects
in the Table 3 specifications with school and teacher characteristics from the NEC data.
Columns 1-3 present OLS estimates, and columns 4-6 use IVs to reduce attenuation bias,
instrumenting the same variables (using the same instruments) as in Table 3. The NEC
data have many school, teacher and principal variables, but with a sample of only 140
schools the number of school variables must be limited. Thus variables no explanatory
power for any of the tests are dropped from Table 5. The impacts of child and household
variables are similar to those in Table 3, so the discussion focuses on school variables.
The only school variable measuring physical facilities or equipment that has any
significant impact is school desks. About 39% of principals report not having adequate
29

desks for students. Adequate desks is estimated to increase all three test scores, but the
only statistically significant impact is thean increase of 0.15 standard deviations for math.
About 83% of Sri Lankan pupils attend schools that belong to a “school family”, a
cluster of schools that share resources and activities. Teachers within a “family” meet to
discuss teaching methods, share solutions to problems and exchange books and reading
material, while principals discuss school organization and administration issues and share
ideas for improvement. The OLS results in Table 5 indicate that belonging to a school
family increases all three test scores by about 0.2 standard deviations, but this impact is
halved and loses statistical significance when IVs are used to reduce attenuation bias.
The next two school variables indicate single sex schools. Even after controlling
for the sex of each student, boys enrolled in all boys schools (14 of the 140 schools) do
significantly worse on all three academic tests, with impacts from -0.16 to -0.33. Girls in
the eight girls schools, in contrast, do much better in English, with an impact of 0.46. Yet
the IV estimates show no impact of all girl schools on English scores, although the
negative impacts of all boys schools remain statistically significant. These results reflect
some aspects of all boy schools that are not reflected in the data. Perhaps boys’ behavior
is worse without girls in the classroom, but this is speculative.
The last three variables pertain to teachers and principles. Students appear to do
better on all three tests when they have more experienced teachers, but this impact
declines and loses significance after using IVs. Similarly, teacher-parent meetings appear
to increase all three test scores, but the estimated effects decline and lose significance
after instrumenting. Finally, principals’ years of experience (as principals) has a positive
and statistically significant effect on English, but only for the IV estimates.
30

To summarize the impact of school and teacher characteristics, two variables have
significant positive impacts on students’ test scores: student desks (math scores only) and
principal years of experience (English only). One variable had negative impacts on all
three scores: all boys schools. The OLS regressions explain much of the variance in test
scores: 37 to 43 percent. Since test scores probably have random errors the “true”
variation explained is probably much higher.
Table 6 shows the reduced form impacts of school variables. In principle, parents’
responses to variation in school characteristics can lead to different results in Tables 5
and 6. Turning directly to the IV estimates, the positive impact of student desks on math
scores is a bit smaller and loses significance. Yet the school family variable has a larger
impact and becomes significant. The negative influence of all boys schools increases and
remains significant. The effect of parent-teacher meetings rises and acquires statistical
significance. In contrast, the impact of the principal’s experience is no longer significant.
Comparing the results of Tables 5 and 6, some school variables seem to substitute
for parental inputs while others are complements. More specifically, parents seem to
reduce educational inputs when schools have more desks or more experienced principals.
In contrast, schools that belong to school families and parent teacher meetings appear to
persuade parents to increase their efforts for their children’s education.
Tables 7 and 8 show the sensitivity of the IV results in Tables 5 and 6 to omitted
variable bias. Columns 1-3 of Table 7 reproduce the IV estimates from Table 5 of the
impact of school variables. Suppose that one has no data on parent-provided educational
inputs (EI). Dropping those variables yields the results in columns 4-6 of Table 7. The
impact of the school family variable increases and becomes (marginally) statistically
31

significant, as do the girls school dummy variable (English only) and parent teacher
meetings. Overall, lack of data on educational inputs moves the results in the direction of
the reduced form estimates.
Table 8 repeats this exercise for the IV estimates in Table 6 of the (reduced form)
impact of school variables on test scores. In this case the two parental taste variables are
dropped. The impact of boys schools is reduced by half, and the impact of parent-teacher
meetings is reduced by more than half and loses much of its statistical significance.
Overall, the results in Tables 7 and 8 show substantial omitted variable bias in estimates
of the impact of school characteristics on student performance; data sets without
information on parental attitudes and detailed data on parents’ educational inputs may
yield biased, or at least fragile, results.
VI. Policy Implications
The results in Section V suggest several policy initiatives that could help improve
learning outcomes. First, linking schools within a school family network appears to raise
the quality of education. This effect may be due to provision of opportunities for teachers
and principals from different schools to learn from others’ experiences, enabling them to
adapt good practices from some schools to all schools within the “family”. School family
networks in Sri Lanka are currently informal arrangements. An official policy to promote
school families, if accompanied by additional resources, and managerial and technical
assistance, could raise learning outcomes.
Second, interactions between teachers and parents through parent-teacher
associations appear to raise test scores. More specifically, parent-teacher meetings
32

appear to influence parents to do more for their children’s schooling (this variable was
not significant in the production function estimates but was significant in the reduced
form estimates). As explained in subsection IV.B, most parents do little to change the
quality of their local school. One policy worth exploring is to get parents more direct
involved in raising school quality, and more generally in holding principals and teachers
accountable for their children’s school performance. Policies to strengthen school-
community relationships in this direction could increase school quality.
Higher student attendance also increases learning. This finding is not surprising,
but it highlights the need for policies that promote school attendance. Currently, Sri
Lanka offers several incentives for children to enroll in school, such as free tuition,
textbooks, and uniforms. It also encourages daily attendance through subsidized transport
and mid-day meals in poor areas. Yet daily attendance is low in many areas, especially
poor areas. This suggests that cash transfers conditional on daily school attendance, a
policy that has been implemented in several Latin American countries, should be
considered in areas where student attendance is low.
Students who use exercise books and attend schools with enough desks also learn
more. Thus priority should be given to equipping schools with basic learning equipment,
such as pupil desks and chairs, and ensuring that all children have basic writing materials.
Children attending schools with experienced principals appear to perform better,
at least in English. The quality of school management and leadership provided by
principals is likely to be an important factor affecting school performance. Sri Lanka has
a principals training center that provides off-site training for principals. Yet no program
provides on-site support for principals, which may be more effective than periodic off-
33

site training. A policy to ensure that principals, especially less experienced principals,
receive on-site training and support should be seriously considered.
Many aspects of child health also contribute to learning. Sri Lanka already has
basic school health programs; health workers visit schools regularly to test children for a
variety of illnesses, and mid-day meals are provided to poor children. Expanding these
school health programs could lead to large improvements in learning. Yet the strong
impact of height for age suggests that programs to improve the nutritional status of
infants and very young children are also needed. Several programs currently exist, such
as the Thriposha program, which provides foodstuffs to pregnant and lactating women, to
infants between 6-11 months of age, and to older children who display growth faltering
(as certified by a medical health officer), and the Samurdhi poverty reduction program,
which provides income supplements to poor families, especially those with malnourished
children. The impacts of these and other programs should be rigorously evaluated; if
they are effective they should be expanded.
Children who enroll in private tuition classes have higher learning outcomes.
However, these classes have not only direct costs but also opportunity costs since they
crowd out extra curricular and co-curricular activities. Tuition classes could also lead to
undesirable incentives for teachers, who may reduce the quality of their classroom
teaching to increase the demand for their services as after school tuition teachers. Further
research on this phenomenon, which is essentially an informal market in Sri Lanka, is
needed to understand the costs and benefits of these classes.
VII. Conclusion
34
This paper has used an unusually rich data set from Sri Lanka to investigate the
determinants of acquisition of reading and mathematics skills if fourth grade students in
Sri Lanka. Several conclusions stand out. First, most of the differences in scores among
different ethnic groups are accounted for by differences in school characteristics and
observed family characteristics; once these are controlled for ethnicity has little
explanatory power. Second, parents’ education plays a large role, but the mechanisms
are not clear, especially for father’s education. Third, early childhood nutrition, as
measured by height for age, has a sizeable impact on children’s test scores, which is
consistent with results from Pakistan (Alderman, et al., 2001) and the Philippines
(Glewwe, et al., 2001). Poor hearing also has strong negative effects, but this condition
applies to only 1-2% of the population. Many other health conditions, such as iron
deficiencies and current nutritional status (measured by weight for height), had little
explanatory power. Fourth, hours spent in tuition classes has a strong positive effect.
This result suggests that, despite Sri Lanka’s attempt to provide equal access to
education, better off students can “buy” a higher quality education. Fifth, electric
lighting in households appears to help students, presumably by providing better
opportunities to study at night.
There are also some interesting results concerning school and teacher
characteristics. Principals’ and teachers’ years of experience, collaborating with other
schools in a “school family”, and meetings between parents and teachers all have positive
impacts on students’ test scores. For boys, attending an all boys school has a negative
impact, although the reasons for this are not understood.
35

While these results lead to some useful policy recommendations, as explained in
the previous sections, there are still many unanswered questions. First, much more
thinking needs to be done on the pervasive role of tuition classes. In essence these
classes amount to a partial privatization of education services in Sri Lanka. Second,
much remains to be learned about which school (and teacher) characteristics and policies
are most effective in promoting learning. Given the econometric problems involved, a
series of randomized interventions are likely to provided the strongest evidence on the
impact of particular policies. Third, more remains to be learned about the role of child
health, and on what policies (either in the school or in the community) are most effective
at addressing children’s health problems. While Sri Lanka’s accomplishments in
education are the envy of many other developing countries, there is still much room for
further progress.
36

References: Alderman, H., J.R. Behrman, V. Lavy, and R. Menon "Child Health and School
Enrollment: A Longitudinal Analysis." Journal of Human Resources 36 (2001):185-205.
Angrist, Joshua, Eric Bettinger, Erik Bloom, Elizabeth King and Michael Kremer (2002)
“Vouchers for Private Schooling in Colombia: Evidence from a Randomized Natural Experiment,” American Economic Review, 92(5): 1535-1558.
Angrist, Joshua and Victor Lavy (1999) “Using Maimonides’ Rule to Estimate the Effect
of Class Size on Children’s Academic Achievement,” Quarterly Journal of Economics, 114(2): 533-576.
Angrist, Joshua and Victor Lavy (2002) “New Evidence on Classroom Computers and
Pupil Learning,” The Economic Journal, 112(482): 735-786. Aturupane, Harsha (1999), “ Econometric Analysis and Planning in the Social Sectors:
An Application to Education in Sri Lanka “, in Quantitative Tools in Economic Planning: Applications and Issues in Asia, United Nations Centre for Regional Development, Nagoya, Japan.
Barro, Robert (1991) “Economic Growth in a Cross-Section of Countries,” Quarterly
Journal of Economics, 106(2): 407-443. Becker, G.S. (1965), “A theory of the allocation of time”, Economic Journal 75:493-517 Bruns, Barbara, Alain Mingat and Ramahatra Rakotomalala. 2003. Achieving Universal
Primary Education by 2015: A Chance for Every Child. The World Bank. Washington, DC.
Case, Anne and Angus Deaton (1999) “School Inputs and Educational Outcomes in
South Africa,” Quarterly Journal of Economics, 114(3): 1047-1085.
Glewwe, Paul. 2002. "Schools and Skills in Developing Countries: Education Policies
and Socioeconomic Outcomes" Journal of Economic Literature 40(2):436-482. Glewwe, Paul. 2005. “The Impact of Child Health and Nutrition on Education in
Developing Countries: Theory, Econometric Issues and Recent Empirical Evidence.” Food and Nutrition Bulletin 26(2):S235-S250.
Glewwe, P. , M. Grosh, H. Jacoby, M. Lockheed (1995) “An Eclectic Approach to
Estimating the Determinants of Achievement in Jamaican Primary Education”, The World Bank Economic Review 9:231-258
37

Glewwe, P., and H.G. Jacoby "An economic analysis if delayed primary school enrollment in a low income country: The role of Early Childhood Nutrition." Review of Economics & Statistics 77 (1995):156.
Glewwe, P., H.G. Jacoby, and E.M. King "Early childhood nutrition and academic
achievement: a longitudinal analysis." Journal of Public Economics 81 (2001):345-68.
Glewwe, Paul, and Michael Kremer. 2006. “Schools, Teachers and Education Outcomes
in Developing Countries.” Forthcoming in E. Hanushek and F. Welch, eds., Handbook of the Economics of Education. North Holland.
Glewwe, Paul, Michael Kremer and Sylvie Moulin. 2006. “Textbooks and Test Scores:
Evidence from a Randomized Evaluation in Kenya”. Department of Applied Economics. University of Minnesota.
Glewwe, Paul, Michael Kremer, Sylvie Moulin and Eric Zitzewitz. (2004) “Retrospective
vs. Prospective Analyses of School Inputs: The Case of Flip Charts in Kenya,” Journal of Development Economics.
Grossman, M. (forthcoming), Education and Nonmarket Outcomes, paper prepared for
Handbook of the Economics of Education, edited by Erik Hanushek and Finis Welsch (Noth-Holland, Elsevier Science, Amsterdam)
Hanushek, Eric. 1995. “Interpreting Recent Research on Schooling in Developing
Countries,” World Bank Research Observer 10(2):227-246. Heyneman, Stephen, Dean Jamison and Xenia Montenegro. 1984. “Textbooks in the
Philippines: Evaluation of the Pedagogical Impact of a Nationwide Investment.” Educational Evaluation and Policy Analysis 6(2): 139-150.
Jamison, Dean, Barbara Searle, Klaus Galda, and Stephen Heyneman (1981) “Improving
Elementary Mathematics Education in Nicaragua: An Experimental Study of the Impact of Textbooks and Radio on Achievement,” Journal of Educational Psychology, 73(4): 556-567.
King, Janet C. 2003. “The Risk of Maternal Nutritional Depletion and Poor Outcomes
Increases in Early or Closely Spaced Pregnancies.” Journal of Nutrition, 133:1732S-1736S.
Lucas, Robert (1988) “On the Mechanics of Economic Development,” Journal of
Monetary Economics, 22: 3-42. Mankiw, N. Gregory, David Romer and David Weil (1992) “A Contribution to the
Empirics of Economic Growth,” Quarterly Journal of Economics, 107(2): 407-437.
38

Michael, R.T. (1972), The Effect of Education on Efficiency in Consumption (Columbia
University Press for the National Bureau of Economic Research, New York) Michael, R.T. (1973), “Education in nonmarket production”, Journal of Political
Economy 81:306-327 Miguel, E., and M. Kremer "Worms: Identifying Impacts on Education and Health in the
Presence of Treatment Externalities." Econometrica 72 (2004):159-217. National Education Commission. 2003. “Envisioning Education for Human
Development: Proposals for a National Policy Framework on General Education in Sri Lanka “, National Education Commission, Colombo, Sri Lanka.
National Education Commission. 2004. “An Inter-Sectoral Study of Education and
Health Factors and Student Learning.” National Education Commission, Colombo Sri Lanka.
National Education Research and Evaluation Center. 2004a. “Management Practices in
Sri Lankan Schools“, National Education Research and Evaluation Center (mimeo), University of Colombo, Colombo, Sri Lanka.
National Education Research and Evaluation Center. 2004b. Achievement After Four
Years of Schooling: National Report.. National Education Research and Evaluation Center, Faculty of Education, University of Colombo.
Pevalin, David. 2003. “Outcomes in Childhood and Adulthood by Mother’s Age at
Birth: Evidence from the 1970 British Cohort Study.” Institute for Social and Economic Research (ISER) Working Paper No. 2003-31., University of Essex, UK.
United Nations Development Program. 2003. Human Development Report 2003:
Millenium Development Goals: A Compact among Nations to End Poverty.. Oxford: Oxford University Press.
World Bank. 2005. “Treasures of the Education System in Sri Lanka: Restoring
Performance, Expanding Opportunities and Enhancing Prospects.” South Asia Region. The World Bank. Washington, DC.
World Bank. 2001. World Development Report 2000/2001: Attacking Poverty,
Washington, DC.
39

Table 1: Standardized NEREC Test Scores by Geographic and Socioeconomic Groups
Math English First Language n Mean Std. Dev Mean Std. Dev Mean Std. Dev
All Students 16,383 0 1 0 1 0 1 Boys 8,299 -.09 1.05 -.12 .99 -.14 1.03 Girls 8,084 .09 .94 .12 .99 .15 .95
Region
Western 1,842 .29 .88 .44 1.00 .33 .88 Central 1,816 -.12 1.00 -.08 .96 -.11 1.01
Southern 1,808 .08 1.01 .01 1.04 .04 1.05 Eastern 1,814 -.39 1.03 -.34 .91 -.37 1.02
Northern 1,857 -.40 1.03 -.34 .91 -.35 .97 North-Central 1,828 .09 .93 -.09 .91 -.02 .92 North-Western 1,820 .12 .93 -.04 .93 .10 .93 Sabaragamuwa 1,793 .02 1.02 -.05 .98 .02 1.00
Uva 1,805 -.14 1.03 -.19 .94 -.17 1.05
Sinhalese 10,999 .16 .95 .09 1.01 .15 .97 Tamil 3,561 -.52 1.03 -.36 .90 -.49 1.00
Moor/Malay 1,715 -.18 .95 .01 .96 -.18 .91 Burgher 17 .46 .89 .68 .82 .32 .85 Other 7 -.23 1.08 .25 1.44 -.47 1.13
Mother’s Educ.
None 1,029 -.69 1.01 -.63 .73 -.73 1.00 Grade 1-5 3,970 -.42 1.00 -.43 .81 -.45 .99 Grade 6-10 6,036 -.05 .97 .13 .90 -.05 .95
O level 3,452 .37 .82 .37 .98 .39 .82 A level 1,667 .60 .76 .79 1.00 .65 .76
Post-grad 229 .62 .77 .93 1.01 .66 .72
School Type Grades 1-13, 3 subj 2,673 .43 .82 .60 1.02 .46 .82 Grades 1-13, 2 subj 4,909 .03 .97 -.07 .93 .03 .97
Grades 1-11 5,448 -.25 1.01 -.31 .86 -.28 1.00 Grades 1-5, 1-8 3,353 -.03 1.04 .06 1.05 -.02 1.03
Expend. Quintiles
1 534 -.39 1.04 -.41 .86 -.41 1.04 2 526 -.22 1.02 -.33 .85 -.26 1.00 3 534 -.06 .98 -.13 .91 -.10 .98 4 526 .08 .94 .11 .96 .12 .93 5 533 .53 .76 .68 1.00 .58 .72
Total 2653
40
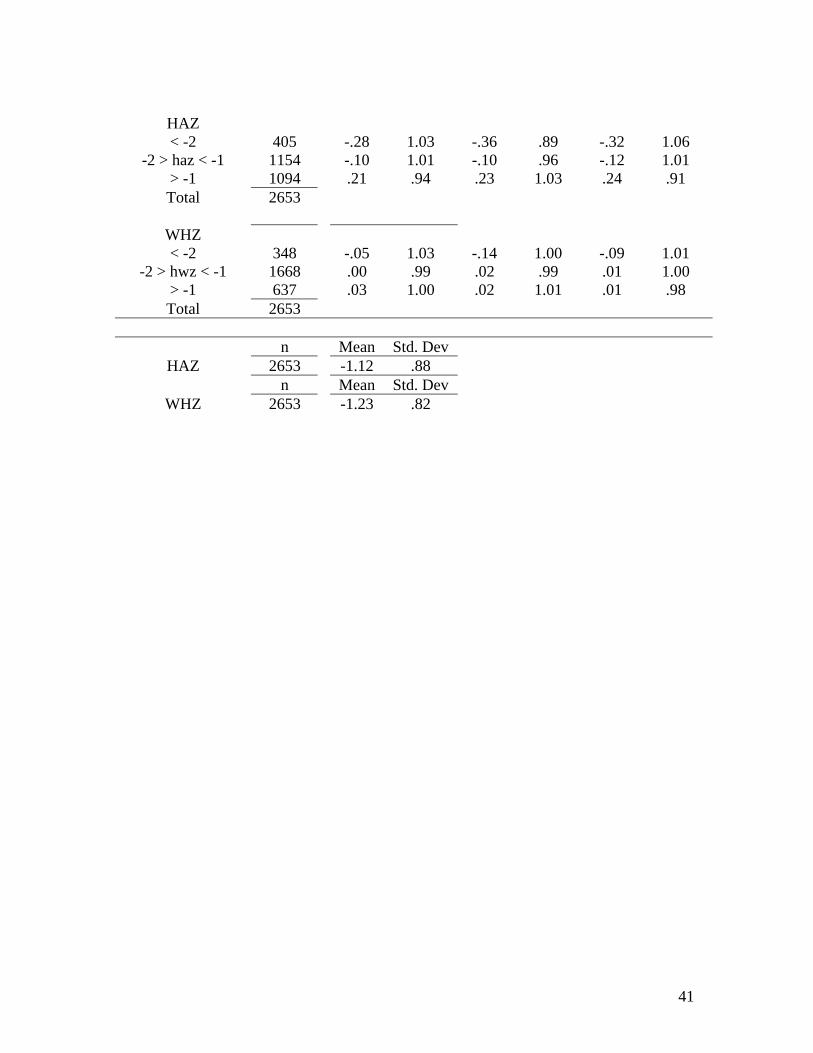
HAZ < -2 405 -.28 1.03 -.36 .89 -.32 1.06
-2 > haz < -1 1154 -.10 1.01 -.10 .96 -.12 1.01 > -1 1094 .21 .94 .23 1.03 .24 .91 Total 2653
WHZ < -2 348 -.05 1.03 -.14 1.00 -.09 1.01
-2 > hwz < -1 1668 .00 .99 .02 .99 .01 1.00 > -1 637 .03 1.00 .02 1.01 .01 .98 Total 2653
n Mean Std. Dev
HAZ 2653 -1.12 .88 n Mean Std. Dev
WHZ 2653 -1.23 .82
41

Table 2: Description of Explanatory Variables
Variable Description n Mean Std. Dev
Child Characteristics (C) Sex Dummy variable: 1=boy, 0=girl 2653 .55 .50 Age (months) Child age at time of household interview (grade 5) 2649 293.9 13.8First-born Dummy variable indicating child is first born 2653 .40 .49 Mother age Age of mother at time child was born 2584 26.96 5.98Sinhalese Dummy variable indicating child is Sinhalese 2653 .65 7 .47 Tamil Dummy variable indicating child is Tamil 2653 .20 .40 Moor Dummy variable, child is Moor or Malay (Muslim) 2653 .13 .34 Burgher Dummy variable indicating child is Burgher/other 2653 .00 .04 Household Characteristics (FS, MS, Y, PA, T) Mother yr ed Mother’s years of education 2653 8.99 3.61Father yr ed father's years of education 2653 8.80 3.67HH expend. Log of household monthly expenditures per capita 2653 7.21 .60 Log of acres Log of agricultural acres owned by household 2653 1.18 2,11Drinks from river
Dummy variable indicating child drinks from a river or stream
2634 .02 .12
Pit latrine Dummy variable indicating pit latrine 2537 .17 .38 Electricity Dummy variable indicating dwelling has electricity 2653 .72 .45 Hope Indicator of highest expectation parent has for child,
1=other or no special expectation, 2= complete primary 3=below GCE O/L, 4=Pass GCE O/L, 5=Pass GCE A/L, 6= Technical/vocational, 7=First degree, 8=Other professional (e.g. law, accounting, medicine, engineering), 9=Postgraduate degree
2635 5.13 2.26
Opinion parents opinion of the value of education 2609 27.03 3.03Medunone mother has no education, 1=yes, 0=otherwise 2653 .05 .23 medu15 highest education achieved by mother was grade 1-
5, 1=yes, 0=otherwise 2653 .22 .42
medu610 highest education achieved by mother was grade 6-10, 1=yes, 0=otherwise
2653 .36 .48
Meduol highest education achieved by mother was OL level, 1=yes, 0=otherwise
2653 .22 .41
Medual highest education achieved by mother was AL level, 1=yes, 0=otherwise
2653 .13 .34
medupost highest education achieved by mother was degree or post graduate degree, 1=yes, 0=otherwise
2653 .02 .13
dedunone father has no education, 1=yes, 0=otherwise 2653 .04 .19 dedu15 highest education achieved by father was grade 1-5,
1=yes, 0=otherwise 2653 .26 .44
dedu610 highest education achieved by father was grade 6-10, 1=yes, 0=otherwise
2653 .35 .48
42

deduol highest education achieved by father was OL level, 1=yes, 0=otherwise
2653 .21 .41
dedual highest education achieved by father was AL level, 1=yes, 0=otherwise
2653 .11 .31
dedupost highest education achieved by father was degree or post graduate degree, 1=yes, 0=otherwise
2653 .03 .17
hhinc Indicator for household income in Rs: 1=<5,000, 2=5,001-7,000, 3=7,001-10,000, 4=10,001-15,000, 5=15,001-25,000, 6=25,001-50,000, 7=>50,001
2612 2.56 1.45
nerechope Indicator of highest expectation parent has for child, 1=other or no special expectation, 2= complete primary 3=below GCE O/L, 4=Pass GCE O/L, 5=Pass GCE A/L, 6= Technical/vocational, 7=First degree, 8=Other professional (e.g. law, accounting, medicine, engineering), 9=Postgraduate degree (NEREC survey)
2601 2.44 1.66
nerecopin parents opinion of the value of education (NEREC survey)
2623 27.55 4.75
Child Health (H) Height/age Z-sc
Height for age Z-score 2653 -1.12 .89
Weight/age Z-sc
Weight for age Z-score 2653 -1.48 .81
Weight/height Z-sc
Weight for height Z-score 2653 -1.23 .82
Severe Ill Dummy for child has ever had a serious illness that lasted more than 2 weeks
2625 .15 .36
Hearing Prob.
Dummy variable Indicating parents’ report of whether child has any problem with hearing
2627 .01 .12
Educational Inputs Chosen by the Parents (EI) Hours tuition class
hours spent in tuition class (1=0 hours, 2=up to 3 hours per week, 3=3-6 hours per week, 4=>6 hours per week)
2643 2.59 1.19
Hours study hours spent studying at home (1=0 hours, 2=up to 3 hours per week, 3=3-6 hours per week, 4=>6 hours per week)
2643 3.27 .89
Father help 0=dad does not help child with homework, 1=dad helps sometimes, 2=dad helps regularly
2653 .79 .74
Mother help 0=mom does not help child with homework, 1=mom helps sometimes, 2=mom helps regularly
2653 1.35 .84
Days present number of days child was present in school in 2002 2637 163.02 29.08
Children’s books
How many books child has to read at home other than school text books
2599 1.95 .96
43

Library books
Dummy for parents are members of the library and get the child library books
257 .09 .28
Educ. trips Dummy for parents have taken child on trips with educational benefits during the last year
2653 .40 .49
Exercise book
Dummy for child owns a math exercise book 2653 .81 .40
Exercise book
Dummy for child owns a English exercise book 2653 .80 .40
Exercise book
Dummy for child owns a First Langauge exercise book
2653 .77 .42
Preschool Dummy for child attended preschool (NEC) 2628 .89 .31 Engl. at home
Dummy for parents say they speak English always 2634 .12 .32
Sin/Tam at home
Dummy for the language that the test was taken is the same that the parents report speaking always at home
2634 .97 .17
ptuition Indicator for parents stated they try and send their child to tuition classes, 1=yes, 0=no (NEREC)
2653 .73 .44
stuition Indicator for child stated that they attend tuition classes, 1=yes, 0=no (NEREC)
2458 .66 .47
Pbook Indicator for number of books available for the child to read at home, 1= zero books, 2= less than 10 books, 3=10-20 books, 4=21=30 books, 5=31-40 books, 6=more than 40 books (NEREC)
2653 2.17 1.07
nursery Indicator for child states they attended nursery school, 1=yes, 0=no (NEREC)
2541 .77 .42
tuseexer Indicator for students states their child frequently uses the exercise book when teaching, 1=yes, 0=no (NEREC)
2653 .35 .48
Tuseblack Indicator for students states their child frequently uses the black board when teaching, 1=yes, 0=no (NEREC)
2653 .64 .48
School and Teacher Characteristics (Q) Desks Dummy variable indicating school has adequate
student desks 2653 .58 .49
Sch Family Dummy variable indicating whether school is member of school family
2653 .83 .37
Boys school Dummy for school is a boy’s school 2653 .11 .32 Girls school Dummy for school is a girl’s school 2653 .07 .25 Teach yrs exp total years of service as a primary teacher 2615 12.81 6.18Par-teach mtg Number of parent-teacher meetings held by teacher 2573 3.92 2.11Princ yrs exp Principal’s total years of service as a principal 2633 9.08 5.99
44
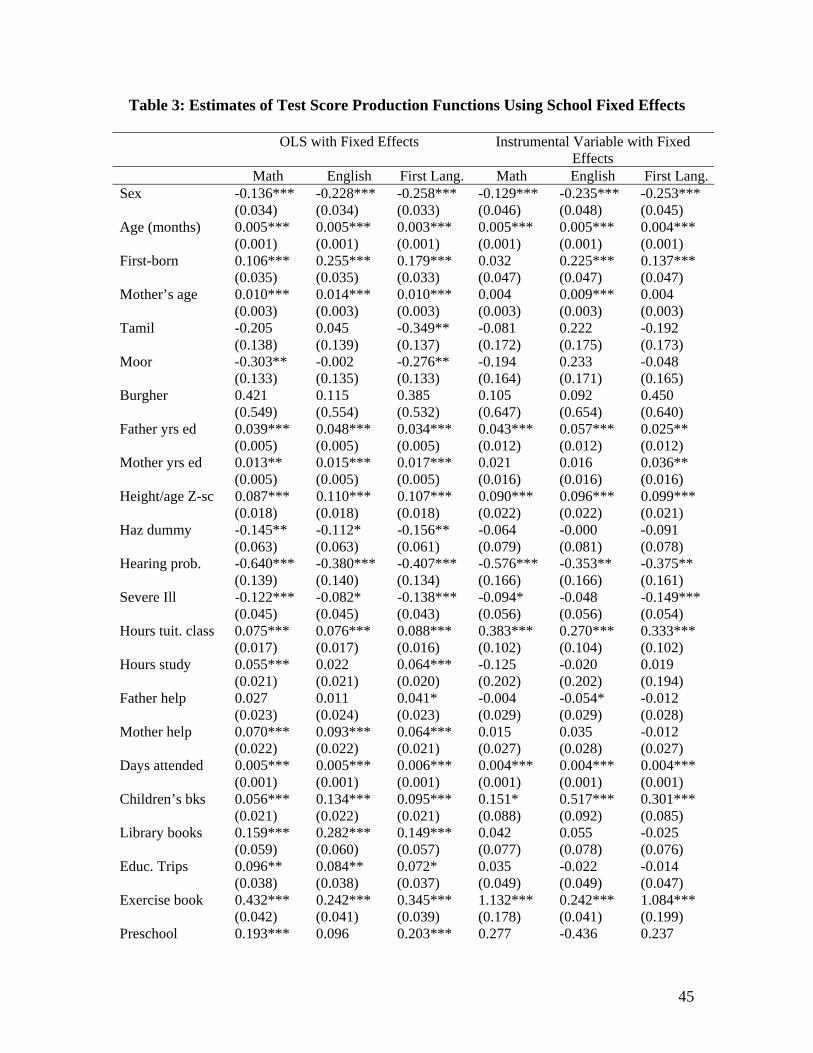
Table 3: Estimates of Test Score Production Functions Using School Fixed Effects OLS with Fixed Effects Instrumental Variable with Fixed
Effects Math English First Lang. Math English First Lang.Sex -0.136*** -0.228*** -0.258*** -0.129*** -0.235*** -0.253*** (0.034) (0.034) (0.033) (0.046) (0.048) (0.045) Age (months) 0.005*** 0.005*** 0.003*** 0.005*** 0.005*** 0.004*** (0.001) (0.001) (0.001) (0.001) (0.001) (0.001) First-born 0.106*** 0.255*** 0.179*** 0.032 0.225*** 0.137*** (0.035) (0.035) (0.033) (0.047) (0.047) (0.047) Mother’s age 0.010*** 0.014*** 0.010*** 0.004 0.009*** 0.004 (0.003) (0.003) (0.003) (0.003) (0.003) (0.003) Tamil -0.205 0.045 -0.349** -0.081 0.222 -0.192 (0.138) (0.139) (0.137) (0.172) (0.175) (0.173) Moor -0.303** -0.002 -0.276** -0.194 0.233 -0.048 (0.133) (0.135) (0.133) (0.164) (0.171) (0.165) Burgher 0.421 0.115 0.385 0.105 0.092 0.450 (0.549) (0.554) (0.532) (0.647) (0.654) (0.640) Father yrs ed 0.039*** 0.048*** 0.034*** 0.043*** 0.057*** 0.025** (0.005) (0.005) (0.005) (0.012) (0.012) (0.012) Mother yrs ed 0.013** 0.015*** 0.017*** 0.021 0.016 0.036** (0.005) (0.005) (0.005) (0.016) (0.016) (0.016) Height/age Z-sc 0.087*** 0.110*** 0.107*** 0.090*** 0.096*** 0.099*** (0.018) (0.018) (0.018) (0.022) (0.022) (0.021) Haz dummy -0.145** -0.112* -0.156** -0.064 -0.000 -0.091 (0.063) (0.063) (0.061) (0.079) (0.081) (0.078) Hearing prob. -0.640*** -0.380*** -0.407*** -0.576*** -0.353** -0.375** (0.139) (0.140) (0.134) (0.166) (0.166) (0.161) Severe Ill -0.122*** -0.082* -0.138*** -0.094* -0.048 -0.149*** (0.045) (0.045) (0.043) (0.056) (0.056) (0.054) Hours tuit. class 0.075*** 0.076*** 0.088*** 0.383*** 0.270*** 0.333*** (0.017) (0.017) (0.016) (0.102) (0.104) (0.102) Hours study 0.055*** 0.022 0.064*** -0.125 -0.020 0.019 (0.021) (0.021) (0.020) (0.202) (0.202) (0.194) Father help 0.027 0.011 0.041* -0.004 -0.054* -0.012 (0.023) (0.024) (0.023) (0.029) (0.029) (0.028) Mother help 0.070*** 0.093*** 0.064*** 0.015 0.035 -0.012 (0.022) (0.022) (0.021) (0.027) (0.028) (0.027) Days attended 0.005*** 0.005*** 0.006*** 0.004*** 0.004*** 0.004*** (0.001) (0.001) (0.001) (0.001) (0.001) (0.001) Children’s bks 0.056*** 0.134*** 0.095*** 0.151* 0.517*** 0.301*** (0.021) (0.022) (0.021) (0.088) (0.092) (0.085) Library books 0.159*** 0.282*** 0.149*** 0.042 0.055 -0.025 (0.059) (0.060) (0.057) (0.077) (0.078) (0.076) Educ. Trips 0.096** 0.084** 0.072* 0.035 -0.022 -0.014 (0.038) (0.038) (0.037) (0.049) (0.049) (0.047) Exercise book 0.432*** 0.242*** 0.345*** 1.132*** 0.242*** 1.084*** (0.042) (0.041) (0.039) (0.178) (0.041) (0.199) Preschool 0.193*** 0.096 0.203*** 0.277 -0.436 0.237
45

(0.063) (0.064) (0.061) (0.416) (0.419) (0.414) Engl. at home 0.149*** -0.081 (0.056) (0.074) Sin/Tam at hm 0.280** 0.340** (0.127) (0.154) Constant -3.908*** -3.862*** -3.615*** -4.621*** -4.766*** -4.941*** (0.394) (0.399) (0.402) (0.830) (0.825) (0.794) Observations 2428 2424 2424 2397 2393 2393 R-squared 0.23 0.27 0.27 Standard errors in parentheses. * significant at 10%; ** significant at 5%; *** significant at 1%. Instrumented variables (columns 4-6): Father yrs ed, Mother yrs ed, Hours tuit class, Hours study, Children’s bks, Exercise book, Preschool. Instruments: Dadedu15, Dadedu610, Dadeduol, Dadedual, Dadedupost, Mommedu15, Momedu610, Momeduol, Momedual, Momedupost, Ptuition, Stuition, Hope, Opinion, Electric, Pbook, Tuseexer, Tuseblack, Nursery.
46

Table 4: Estimates of Test Score Reduced Form Equations with School Fixed Effects
OLS with Fixed Effects Instrument Variable with Fixed Effects
(1) (2) (3) (4) (5) (6) Math English First Lang. Math English First Lang.
Sex -0.168*** -0.280*** -0.297*** -0.132*** -0.221*** -0.244*** (0.036) (0.036) (0.035) (0.043) (0.051) (0.043) Age (months) 0.003*** 0.003** 0.001 0.005*** 0.005*** 0.003* (0.001) (0.001) (0.001) (0.001) (0.002) (0.001) First-born 0.170*** 0.298*** 0.240*** 0.140*** 0.218*** 0.210*** (0.036) (0.036) (0.035) (0.042) (0.051) (0.043) Mother’s age 0.012*** 0.015*** 0.014*** 0.010** 0.007 0.011*** (0.003) (0.003) (0.003) (0.004) (0.005) (0.004) Tamil -0.288** -0.000 -0.393*** -0.198 0.019 -0.318* (0.144) (0.145) (0.145) (0.160) (0.194) (0.168) Moor -0.306** 0.025 -0.275* -0.269* 0.254 -0.246 (0.140) (0.142) (0.143) (0.161) (0.199) (0.170) Burgher 0.062 -0.246 -0.084 -0.237 -0.603 -0.486 (0.471) (0.476) (0.460) (0.513) (0.618) (0.521) Father yrs ed 0.038*** 0.052*** 0.036*** 0.058*** 0.074*** 0.051*** (0.005) (0.005) (0.005) (0.011) (0.013) (0.011) Mother yrs ed 0.019*** 0.020*** 0.024*** 0.039** 0.020 0.049*** (0.006) (0.006) (0.005) (0.017) (0.021) (0.018) Engl. at home 0.155*** -0.058 (0.058) (0.087) Sin/Tam at hm 0.231* 0.261* (0.133) (0.156) Log of acres 0.009 0.011 0.012 0.009 0.002 0.016 (0.009) (0.009) (0.009) (0.010) (0.013) (0.010) Electricity 0.248*** 0.209*** 0.261*** 0.186*** 0.064 0.207*** (0.045) (0.045) (0.044) (0.058) (0.070) (0.059) HH expenditure 0.111*** 0.139*** 0.116*** -0.047 0.063 -0.115 (0.036) (0.037) (0.035) (0.093) (0.113) (0.095) Hope 0.052*** 0.043*** 0.044*** 0.180** 0.176* 0.213*** (0.009) (0.009) (0.008) (0.078) (0.094) (0.079) Opinion 0.004 0.014** 0.015** 0.032 0.236** 0.052 (0.007) (0.007) (0.007) (0.078) (0.098) (0.081) Drink from river -0.375** -0.113 -0.149 -0.379** -0.182 -0.183 (0.154) (0.156) (0.151) (0.168) (0.204) (0.171) Pit latrine -0.007 -0.147*** -0.052 0.003 -0.118* -0.034 (0.053) (0.054) (0.052) (0.058) (0.071) (0.059) Constant -2.876*** -3.384*** -2.696*** -3.947** -10.037*** -3.761* (0.479) (0.488) (0.487) (1.988) (2.535) (2.046) Observations 2454 2450 2450 2373 2369 2369 R-squared 0.12 0.19 0.17 Standard errors in parentheses. * significant at 10%; ** significant at 5%; *** significant at 1% Instrumented (columns 4-6): Father yrs ed, Mothers yrs ed, HH expenditure, Hope, Opinion. Instruments: Dadedu15, Dadedu610, Dadeduol, Dadedual, Dadedupost, Momedu15, Momedu610, Momeduol, Momedual, Momedupost, Hhinc, Nerechope, Nerecopin.
47

Table 5: Estimates of Test Score Production Functions with School Characteristics
OLS Instrument Variables (1) (2) (3) (4) (5) (6) Math English First Lang. Math English First Lang.
Sex -0.135*** -0.236*** -0.268*** -0.184*** -0.322*** -0.320*** (0.038) (0.039) (0.044) (0.049) (0.056) (0.053) Age (months) 0.006*** 0.005*** 0.005*** 0.007*** 0.004*** 0.006*** (0.001) (0.001) (0.001) (0.002) (0.002) (0.002) First-born 0.129*** 0.308*** 0.189*** 0.069 0.242*** 0.129*** (0.036) (0.039) (0.038) (0.047) (0.052) (0.045) Mother’s age 0.015*** 0.020*** 0.016*** 0.008** 0.012*** 0.009** (0.003) (0.003) (0.003) (0.004) (0.004) (0.003) Tamil -0.291*** -0.079 -0.237*** -0.423*** -0.006 -0.343*** (0.072) (0.092) (0.072) (0.116) (0.139) (0.115) Moor -0.283*** 0.012 -0.223*** -0.355*** -0.031 -0.296** (0.101) (0.110) (0.081) (0.126) (0.159) (0.126) Burgher 0.657 0.502 0.640** 0.236 0.525 0.421 (0.546) (0.527) (0.247) (0.462) (0.530) (0.342) Father yrs ed 0.046*** 0.058*** 0.046*** 0.046*** 0.063*** 0.039*** (0.007) (0.008) (0.006) (0.013) (0.014) (0.012) Mother yrs ed 0.016*** 0.016*** 0.021*** 0.022 0.004 0.028* (0.006) (0.006) (0.006) (0.017) (0.017) (0.017) Height/age Z-sc 0.102*** 0.133*** 0.120*** 0.092*** 0.109*** 0.103*** (0.021) (0.023) (0.019) (0.026) (0.027) (0.023) Haz dummy -0.057 -0.003 -0.055 -0.001 0.096 -0.000 (0.084) (0.083) (0.076) (0.105) (0.105) (0.091) Hearing prob. -0.592*** -0.320* -0.340* -0.492*** -0.236 -0.255 (0.179) (0.168) (0.173) (0.162) (0.163) (0.172) Severe Ill -0.100** -0.049 -0.094* -0.052 0.004 -0.072 (0.049) (0.043) (0.048) (0.066) (0.061) (0.060) Hours tuit class 0.098*** 0.074*** 0.109*** 0.396*** 0.323*** 0.396*** (0.019) (0.020) (0.019) (0.088) (0.090) (0.086) Hours study 0.066*** 0.014 0.068*** -0.351* -0.346 -0.264 (0.021) (0.023) (0.020) (0.201) (0.222) (0.191) Father help 0.024 -0.015 0.023 -0.004 -0.093** -0.022 (0.024) (0.031) (0.025) (0.034) (0.040) (0.033) Mother help 0.078*** 0.113*** 0.072*** 0.014 0.049 -0.003 (0.025) (0.026) (0.024) (0.032) (0.035) (0.029) Days present 0.005*** 0.004*** 0.005*** 0.004*** 0.004*** 0.004*** (0.001) (0.001) (0.001) (0.001) (0.001) (0.001) Children’s bks 0.068** 0.133*** 0.113*** 0.166 0.585*** 0.278*** (0.026) (0.032) (0.021) (0.101) (0.103) (0.091) Library books 0.146*** 0.303*** 0.135** 0.055 0.055 -0.001 (0.052) (0.059) (0.052) (0.082) (0.100) (0.085) Educ. trips 0.152*** 0.129*** 0.112*** 0.110* 0.009 0.046 (0.041) (0.048) (0.040) (0.056) (0.061) (0.055) Exercise book 0.367*** 0.199*** 0.246*** 0.763*** 0.423** 0.676*** (0.050) (0.049) (0.050) (0.192) (0.199) (0.192) Preschool 0.148** 0.056 0.153** -0.006 -0.309 0.047
48

(0.067) (0.063) (0.069) (0.319) (0.334) (0.295) Engl. at home 0.190*** -0.101 (0.067) (0.088) Sin/Tam at hm 0.338** 0.287 (0.165) (0.219) Desks 0.147** 0.070 0.084 0.130* 0.044 0.069 (0.058) (0.059) (0.057) (0.074) (0.076) (0.072) School Family 0.220*** 0.205*** 0.197*** 0.101 0.066 0.101 (0.067) (0.071) (0.069) (0.107) (0.114) (0.101) Boys school -0.262*** -0.155* -0.131 -0.330*** -0.230** -0.193** (0.085) (0.078) (0.085) (0.106) (0.091) (0.096) Girls school 0.101 0.462*** 0.145 -0.033 0.128 -0.030 (0.107) (0.127) (0.094) (0.171) (0.186) (0.155) Teacher yrs exp 0.009** 0.010** 0.007* 0.003 0.007 0.001 (0.004) (0.005) (0.004) (0.006) (0.007) (0.006) Par-teach mtg 0.032*** 0.045*** 0.030** 0.018 0.030 0.017 (0.011) (0.015) (0.012) (0.017) (0.020) (0.017) Princ. years exp 0.005 0.007 0.004 0.008 0.013** 0.007 (0.005) (0.005) (0.005) (0.006) (0.006) (0.006) Constant -5.065*** -4.631*** -4.895*** -4.324*** -3.863*** -4.587*** (0.457) (0.440) (0.516) (1.034) (1.167) (0.925) Observations 2305 2301 2301 2275 2271 2271 R-squared 0.37 0.43 0.42 0.14 0.18 0.21 Robust standard errors in parentheses * significant at 10%; ** significant at 5%; *** significant at 1% Instrumented (columns 4-6): Father yrs ed, Mother yrs ed, Hours tuit class, Hours study, Children’s bks, Exercise book, Preschool. Instruments: Dadedu15, Dadedu610, Dadeduol, Dadedual, Dadedupost, Momedu15, Momedu610, Momeduol, Momedual, Momedupost, Ptuition, Stuition, Hope, Opinion, Electric, Pbook, Tuseexer, Tuseblack, Nursery.
49

Table 6: Estimates of Test Score Reduced Form Equations with School Characteristics
OLS Instrument Variable (1) (2) (3) (4) (5) (6) Math English First Lang. Math English First Lang.
Sex -0.166*** -0.272*** -0.293*** -0.106* -0.211*** -0.233*** (0.043) (0.043) (0.047) (0.057) (0.065) (0.056) Age (months) 0.003** 0.002* 0.001 0.007*** 0.006** 0.005** (0.001) (0.001) (0.002) (0.002) (0.003) (0.002) First-born 0.213*** 0.360*** 0.268*** 0.162*** 0.265*** 0.224*** (0.039) (0.041) (0.040) (0.049) (0.058) (0.047) Mother’s age 0.017*** 0.022*** 0.020*** 0.013*** 0.017*** 0.015*** (0.004) (0.003) (0.003) (0.005) (0.005) (0.004) Tamil -0.217*** -0.055 -0.181** -0.443*** -0.317* -0.446*** (0.082) (0.098) (0.078) (0.149) (0.173) (0.143) Moor -0.342*** -0.109 -0.288*** -0.646*** -0.518** -0.626*** (0.097) (0.106) (0.088) (0.206) (0.245) (0.201) Burgher 0.456* 0.289 0.299*** 0.176 0.225 -0.049 (0.239) (0.311) (0.083) (0.336) (0.375) (0.152) Father yrs ed 0.050*** 0.060*** 0.050*** 0.053*** 0.068*** 0.049*** (0.007) (0.008) (0.007) (0.015) (0.016) (0.014) Mother yrs ed 0.028*** 0.025*** 0.033*** 0.055*** 0.044* 0.057*** (0.006) (0.006) (0.007) (0.018) (0.023) (0.018) Engl. at home 0.222*** -0.051 (0.069) (0.124) Sin/Tam at hm 0.379** 0.132 (0.170) (0.237) Log of acres 0.007 -0.002 0.004 -0.012 -0.036** -0.012 (0.012) (0.008) (0.011) (0.013) (0.016) (0.014) Electricity home 0.300*** 0.330*** 0.299*** 0.228*** 0.223*** 0.226*** (0.058) (0.059) (0.058) (0.068) (0.084) (0.069) Hope 0.048*** 0.045*** 0.045*** 0.079 0.026 0.126 (0.012) (0.012) (0.011) (0.108) (0.131) (0.096) Opinion 0.001 0.012 0.010 0.192*** 0.302*** 0.182** (0.008) (0.008) (0.008) (0.073) (0.089) (0.073) HH expenditure 0.131*** 0.165*** 0.145*** -0.130 0.087 -0.152 (0.038) (0.039) (0.039) (0.151) (0.183) (0.142) Drink from river -0.411*** -0.251 -0.260** -0.441** -0.291 -0.359** (0.132) (0.161) (0.111) (0.174) (0.182) (0.150) Pit latrine -0.111* -0.124** -0.153** 0.001 0.084 -0.039 (0.063) (0.061) (0.062) (0.103) (0.133) (0.099) Desks 0.087 0.025 0.016 0.111 0.044 0.043 (0.064) (0.058) (0.064) (0.088) (0.110) (0.085) Sch Family 0.160** 0.170** 0.150* 0.246** 0.265* 0.247** (0.079) (0.073) (0.077) (0.109) (0.136) (0.112) Boys school -0.251** -0.140* -0.138 -0.472*** -0.464** -0.320** (0.102) (0.077) (0.091) (0.166) (0.211) (0.153) Girls school 0.079 0.460*** 0.130 0.068 0.353 0.150 (0.089) (0.126) (0.083) (0.193) (0.261) (0.166) Teach yrs exp 0.007 0.009* 0.006 0.017** 0.023** 0.016*
50

(0.005) (0.005) (0.005) (0.008) (0.010) (0.008) Par-teach mtg 0.032** 0.048*** 0.032** 0.066** 0.086** 0.070*** (0.012) (0.014) (0.012) (0.028) (0.037) (0.026) Pr yrs exp -0.001 0.001 -0.002 -0.005 -0.003 -0.007 (0.005) (0.005) (0.005) (0.008) (0.009) (0.007) Constant -3.657*** -4.325*** -3.857*** -8.470*** -12.913*** -7.817*** (0.566) (0.489) (0.629) (2.094) (2.601) (2.084) Observations 2329 2325 2325 2252 2248 2248 R-squared 0.29 0.39 0.34 0.04 Robust standard errors in parentheses * significant at 10%; ** significant at 5%; *** significant at 1% Instrumented (columns 4-6): Father yrs ed, Father yrs ed, HH expenditure , Hope, Opinion. Instruments: Dadedu15, Dadedu610, Dadeduol, Dadedual, Dadedupost, Momedu15, Momedu610, Momeduol, Momedual, Momedupost, Hhinc, Erechope, Nerecopin
51

Table 7: Production Function, Instrument Variable Regression with School Variables
Table 5 Results Table 5 dropped educational inputs (1) (2) (3) (7) (8) (9) Math English First Lang. Math English First Lang.
Desks 0.130* 0.044 0.069 0.125** 0.068 0.059 (0.074) (0.076) (0.072) (0.062) (0.063) (0.063) Sch Family 0.101 0.066 0.101 0.147** 0.143* 0.130* (0.107) (0.114) (0.101) (0.071) (0.074) (0.074) Boys school -0.330*** -0.230** -0.193** -0.312*** -0.198** -0.190** (0.106) (0.091) (0.096) (0.100) (0.078) (0.089) Girls school -0.033 0.128 -0.030 0.037 0.418*** 0.099 (0.171) (0.186) (0.155) (0.101) (0.131) (0.093) Teach yrs exp 0.003 0.007 0.001 0.009** 0.010* 0.007 (0.006) (0.007) (0.006) (0.004) (0.005) (0.004) Par-teach mtg 0.018 0.030 0.017 0.026** 0.040** 0.024* (0.017) (0.020) (0.017) (0.012) (0.016) (0.012) Pr yrs exp 0.008 0.013** 0.007 -0.002 -0.000 -0.003 (0.006) (0.006) (0.006) (0.005) (0.005) (0.005) Constant -4.324*** -3.863*** -4.587*** -3.353*** -3.723*** -3.194*** (1.034) (1.167) (0.925) (0.445) (0.421) (0.516) Observations 2275 2271 2271 2430 2426 2426 R-squared 0.14 0.18 0.21 0.24 0.33 0.28
Robust standard errors in parentheses. * significant at 10%; ** significant at 5%; *** significant at 1%
Table 8: Reduced Form, Instrument Variable Regression with School Variables
Table 6 Results Table 6, dropped taste for education (1) (2) (3) (4) (5) (6) Math English First Lang. Math English First Lang.
Desks 0.111 0.044 0.043 0.082 0.016 0.014 (0.088) (0.110) (0.085) (0.062) (0.060) (0.062) Sch Family 0.246** 0.265* 0.247** 0.128* 0.109 0.112 (0.109) (0.136) (0.112) (0.071) (0.068) (0.071) Boys school -0.472*** -0.464** -0.320** -0.296*** -0.202*** -0.175* (0.166) (0.211) (0.153) (0.102) (0.076) (0.093) Girls school 0.068 0.353 0.150 -0.006 0.336*** 0.053 (0.193) (0.261) (0.166) (0.100) (0.128) (0.091) Teach yrs exp 0.017** 0.023** 0.016* 0.006 0.008 0.005 (0.008) (0.010) (0.008) (0.005) (0.005) (0.005) Par-teach mtg 0.066** 0.086** 0.070*** 0.020* 0.031** 0.018 (0.028) (0.037) (0.026) (0.012) (0.015) (0.012) Pr yrs exp -0.005 -0.003 -0.007 -0.002 -0.000 -0.004 (0.008) (0.009) (0.007) (0.005) (0.005) (0.005) Constant -8.470*** -12.913*** -7.817*** -3.776*** -5.066*** -3.762*** (2.094) (2.601) (2.084) (0.622) (0.562) (0.697) Observations 2252 2248 2248 2337 2333 2333 R-squared 0.04 0.25 0.35 0.30
Robust standard errors in parentheses. * significant at 10%; ** significant at 5%; *** significant at 1%
52

Table A.1 Information Collected in NEREC Questionnaires I. Child Questionnaire (completed by child at school) Age, sex, number of older brothers and sisters, and younger brothers and sisters Lives with one or both parents, or somewhere else Languages spoken at home School days without breakfast, and without meal after school Availability of desk and/or chair at school Means of transport to travel to school, and travel time required Grade first entered current school, and whether attended preschool Access to different types of textbooks and workbooks Person at home who assists with schoolwork Whether attends private tuition (tutoring) classes, and attitudes on those classes Days absent from school, and reasons for absences Watching TV and listening to radio, and if so favorite programs Availability of newspapers at home Whether teacher uses various books and/or visual aids in class Attitudes toward school subjects and other aspects of school II. Parent Questionnaire (completed by having parent come to the school) Relationship to the child (father, mother, other types of relatives, nonrelative Age (of respondent) Parents of child are still alive, and current marital status of parents Father and mother live with child, or somewhere else Race and religion of both parents Number of male and female children in family, and how many now in school Where child lives while attending school Type of dwelling, and whether child has bedroom, room for toys/books, garden Dwelling has water, electricity, toilets, telephone, various durable goods Education of mother, father, and older children, and occupation of each parent Sources and amount (by 6 categories) of family income School expenses of different types, and who pays for those expenses Whether something interfered with child’s education in 2002. Languages used at home Child’s after school activities Availability of newspapers in the household, and types of newspapers Number of books in household, and whether use is made of libraries TV programs watched by child, and total hours per day child watches TV Other activities of child (e.g. cultural, religious, vacation) Discussions with child’s teacher, with child; child participates in school activities Who helps child with schoolwork, hours per day child does school work at home Participation by child in tuition classes, including cost and hours per week Any discussions on education with child’s friends’ parents Educational aspirations for child, and opinions on child’s education
53

III. Teacher Questionnaire Age (10 year ranges) and sex Type of living quarters, distance and travel time from living quarters to school Class and grade of teacher training, highest educational and professional degrees Years experience as teacher, as primary teacher, and as teacher in current school Days trained in teaching of math, English and local language, by training institute Possession of teacher handbook, skill list, class book and workbook, by subject Main sources of knowledge about teaching and learning of grade 4 students Grades taught in 2002 Class size and prevalence of student absences, for grade 4 in 2002 Adequacy of 11 types of equipment (chairs, desks, blackboard, cupboard, etc.) Receipt of money for “Quality Inputs” in 2002, and how many is spent Opinion of teaching environment (space, ventilation, noise, etc.) Who monitors teaching, and how often, and benefits provided by monitors Fraction of students reaching “required level” in math, English and local language How often leave is taken Frequency of using various teaching methods, & when began to prepare for 2002 Number of students in special categories (dropout, repeat, orphan, disabled, etc.) Fraction of students who do not eat breakfast, do not have exercise books, pencils Opinions about grade 4 syllabus, by subject (math, English, local language) Opinions about grade 4 “class books”, by subject (math, English, local language) Opinions about grade 4 suggested activities, by subject Opinions on “list of essential learning skills”, & on how often to evaluate students IV. Sectional Head Questionnaire Sex, and current position/post held Years of experience as deputy principal and sectional head Highest educational and professional degrees Facilities to conduct duties (room, storage area) Sufficiency of teacher handbooks, textbooks, and workbooks, by subject Were 10 procedures followed in grade 4 in 2002 (recordkeeping, discussions, etc.) Opinion of grade 4 teachers’ performance in 2002 in 13 different categories/tasks Opinion of grade 4 teachers’ monitoring of students performance (9 activities) Opinion of grade 4 teachers’ ability/activities in influencing student learning Opinion on teacher evaluation methods Agreement with 12 statements on improvements in the school and on monitoring V. Principal Questionnaire “Council”, age, and type of school Total number of students and number of grade 4 students and classes, all in 2002 Age (10 year ranges), sex and general education level of principal Principal’s educational schooling and special training
54

Principal’s position (permanent or temporary), “grade” & education service grade Years of experience as principal, overall and in this school Whether principal lives in this school Number of grade 4 teachers, by sex and level of vocational/educational training Frequency with which grade 4 teachers take leave Frequency that grade 4 teachers participate in voluntary training Number of classes and classrooms, by grade, and numbers of other types of rooms Opinion on sufficiency of sports grounds, playground, and school garden Sufficiency of 12 types a facitlies/equipment (e.g. water, electricity, telephones) Adequacy of toilets Distances traveled by students and teachers to come to school Distance from school of 7 types of public amenities (clinic, post office, bus, etc.) Frequency of bad behavior and thefts at school, and assessment of school security Sources of financial support Participation of principal in 7 activities (teaching, supervision, meet parents, etc.) Opinion/Satisfaction regarding 10 general issues
55

Table A.2 Information Collected in NEC Questionnaires I. Household Questionnaire (administered by interviewer at the child’s home)) Child’s age, sex, whether lives at home, and contact with home of not living there Basic information on all household members (eg. age, sex, education, occupation) Whether parents are alive, and whether they live with the child Dwelling amenities for child (room, area for books/toys, garden, play area) Method child uses to go to school, and times he/she leaves home & returns home Hours per week in 11 after school activities (studying, working, playing, etc.) Frequency that child reads newspapers Books at home that child can read, and child’s access to library books Types of radio and television programs that child listens to or watches Cultural activities that family takes the child to (7 types) Parental contact with teachers and participation in school activities Who helps the child with schoolwork done at home, and how frequently. Participation in tuition (private tutoring classes), by academic subject Contact between child’s parents and the parents of child’s friends Parental expectations for child’s education, and why parents value education Reasons child has missed school in past year Agreement with 17 statements regarding education and the child’s school Absence from school in past year due to health problems Has child ever had a serious illness (one that lasted more than 2 weeks) Illnesses during the past month (diarrhea, cold, asthma, fever) Number of child bouts of malaria (ever, last 3 months) Number of times that child has had worms (ever, last 3 months, last year) Whether child has vision, hearing or other disability/problem. Adequacy of child’s diet, and events that lead to household food shortages Detailed list of foods eaten by child in the previous day Child health habits (drink boiled water, use of latrine, hours of sleep) Dwelling information (type, number of rooms, water source, toilet, energy source) Consumer durable (20 items) & productive assets (11 items) owned by household Distance from dwelling to nearest, and most often used, of 7 amenities Household monthly expenditures on food and 13 non-food items Household income in past year, by source of income, and self-perceived status Detailed expenditure on health and education items, for child and for others Credit and savings history in past 5 years, and current savings Whether household had a negative income shock, and what effect it had Have any children dropped out of school Household participation in community organizations/societies Languages spoken at home, and family activities and discussion topics Newspapers read, and books owned or borrowed, by family members Methods used to discipline and reward the child
56

II. School Questionnaire (administered at the child’s school) Location and type of school Where students come from, and whether any reside at the school Distance from school to closest of 14 amenities (clinic, market, govt. office) Student enrollment by grade and sex Number of teachers, by sex and educational background Number of grade 4 teachers, by training Leave (absences) taken by grade 4 teachers ni 2004, by type of leave Adequacy of supplies of 15 kinds of items (desks, blackboards, cupboards, etc.) Availability of larger items in 2002 (reading room, garden, first aid box, etc.) Whether textbooks were received on time in 2002, and if not how late Existence of protective wall for school, and adequacy of toilets for children Sex, educational background, and type of appointment of school principal Years of experience of school principal Where principal lives, and distance and travel time to school Leave (absences) taken by principal in 2002 Frequency with which principal supervises “key stage 2 teachers” Frequency of school staff meetings to discuss education issues Questions on “school family” activities Number of PTA meetings and school developing society meetings held in 2002 Number of times principal attended education reform programs in 2002 Parental awareness programs held in 2002, and reasons for them Special projects undertaken in 2002 by school development society Sex, educational background, and type of appointment of all grade 4 teachers Years of service and marital status of all grade 4 teachers Where each grade 4 teacher lives, and distance and travel time to school In service training and school inspectors visits for all grade 4 teachers Questions on “school family” activities for all grade 4 teachers Hours grade 4 teachers teach students “after hours”, why and which subjects Methods teacher uses to inform parents of children’s progress Adequacy of equipment and materials of grade 4 teachers in 2002 Adequacy of grade 4 student textbooks, class books, workbooks & pens in 2002 Child’s sex, language spoken at home and attendance of pre-school Child’s favorite play activities, favorite school subjects, and activities after school Childs scores on “grade 4 learning competencies” (language, numeracy, environ.) Student prizes/awards, and bad behavior Student attendance in 2002 (from school records), and date of birth Classroom observation of grade 4 teachers (11 categories)
57