Technical Risk Management on Enterprise Integration Projects

ijcrb.webs.com
INTERDISCIPLINARY JOURNAL OF CONTEMPORARY RESEARCH IN BUSINESS
COPY RIGHT © 2013 Institute of Interdisciplinary Business Research 12
AUGUST 2013
VOL 5, NO 4
The impact of risk management on construction projects success
from the employees perspective
Dr. Haitham H. Al-Shibly
Associate prof. / MIS
Dean of Amman College
Al-Balqa Applied University
Dr. Basem M. Louzi
Associate prof. / Financial Economics
Department of Finance
Al-Balqa Applied University
Mohammad A. Hiassat
Al-Balqa Applied University
Abstract
The main objective of this research was to study the impact of risk management on
construction projects success. The survey which was directed to the participants was
developed according the research design, approach, and data. This survey includes two
major sections. The first section asked about the procedure followed in the organization to
manage the risk. In section two, the survey attempts to specify if the project they
experienced achieved the success criteria, this was according 7 criteria factors were defined
for construction project success listed in the questionnaire. The distributed questionnaires
were 230 questionnaires and got 200 questioners back with percentage of 87.4%. The
results of the current study indicate that there is an impact exists between both Risk
identification and Risk assessment on project success, scheduled time, planned budget, and
the ability to comply with technical specifications. While there is no impact between Risk
assessment and avoiding lawsuits or claims. Also the study indicate that there is an impact
of Risk response on project success, meeting the scope of work, scheduled time, and
achieving the quality standards.
Keywords: Impact ; Risk management ; Construction projects ; Success; Employees
perspective
Introduction
The Hashemite Kingdom of Jordan is attractive country for investment, such as
construction projects; that because of its strategic location, political stability and cultural
particularities. All of this is essential for a successful experience. Because of the above
mentioned reasons, the construction projects are rapidly increasing in Jordan as well as
other investments. In addition, the construction industry has changed rapidly over the past

ijcrb.webs.com
INTERDISCIPLINARY JOURNAL OF CONTEMPORARY RESEARCH IN BUSINESS
COPY RIGHT © 2013 Institute of Interdisciplinary Business Research 13
AUGUST 2013
VOL 5, NO 4
10 years; companies are faced with more risk and uncertainty than ever before. Clients
expect more, most importantly, they do not want surprises, and are more likely to engage in
litigation when things go wrong, these things make the project managers in Jordan and
worldwide to think more about the relationship between these new risks and uncertainties
and the success of the project they are managing and forced them to ask ―Does risk
management contribute to project success?‖.
Risk management has become an important part of the management process for any
project. In fact, Risk management came into the foreground of business literature during
the last two decades of the 20th century (Loosemore et al., 2006). Actually, Akintoye et al.
(2003) believes that the circumstances within the construction industry had led to adopting
risk management and analysis into practice. Risk is one of key factors that can positively
affect working effectively inside the firm if it was practiced in the proper way. By doing
such organization can achieve capital value of rareness and capital value of limitability via
which the firm can build stronger competitive advantage by developing maintaining and
retaining core competencies; which can in its turn maximize the organization’s market
share, reputation maximize share holder equity and stake holder goals and maintaining the
maturity stage of the firm’s life cycle in which it can maintain the peak stage for all of its
activities by recognizing, encouraging and retaining the peak performance.
An effective use of project management techniques such as risk and value management
are considered as key supporting processes and to add to them quality, cost, time and
change control (Fewings, 2005); all together generate an integrated approach to the project
success. While, project risk management is a scalable activity and should be commensurate
with the size and complexity of the project under consideration. Yet, simpler projects
means utilizing simple qualitative analysis such as Project Management Online Guide in
the Risk Management Plan spreadsheet, in similar vein, Larger more complex projects may
wish to use more robust analysis techniques via Monte-Carlo simulation models. Risk
management requires top-level management support, acknowledgment that risks are
realities, and a commitment to identify and manage them. One discriminator of a successful
organization or project is the use of risk management to anticipate potential negative
conditions, problems, and realities. Ineffective projects are forced to react to problems;
effective projects anticipate those (Loosemore et al., 2006).
The main challenges facing management are to estimate the level risk by the position
holder, also to estimate whether the management is aware of the risk and are they implying
their knowledge in the avoiding risks. Top management should investigate various types of
ijcrb.webs.com
INTERDISCIPLINARY JOURNAL OF CONTEMPORARY RESEARCH IN BUSINESS
COPY RIGHT © 2013 Institute of Interdisciplinary Business Research 14
AUGUST 2013
VOL 5, NO 4
risks facing it is business , and how to manage the risk via education or past experience and
other sources, also we can know how risk can affect the success degree of projects.
Accordingly, this research sets sights on introducing the impact of risk management on
construction projects success from the owners’ and employees’ perspectives.
Research objectives
The main objective of this research is to study the impact of risk management on
construction projects success. The study also aims at:
Studying and identifying the nature of relationship between implementing effective risk
management and construction projects success.
Identifying key risk factors that could stand in front of construction processes by reviewing
the literature.
Assessing the severity and the allocation of each identified risk factor
Investigating management awareness of risk management, and applying their knowledge
while managing these projects.
Identifying the success criteria that were achieved in construction projects.
Research importance
This research importance stems from the essence of risk management itself, for the reason
that risk management has been identified as one of the most important tools in determining
any project success; yet, few studies investigate the nature of this relationship (Fewings,
2005). As a result, this research will drive the attention to the importance of a high level of
awareness to risk management problems. In addition, studying the relation between risk
management and project’s success is important because most of projects are operating in a
very dynamic and rapidly changing environment not always fixed circumstances and
uncertainty factors are surrounding the firm, in such environment adopting changes very
quickly is a must for the project overall to grow or even survive. Adopting overall project
changes can’t be applicable without the management ability to adapt model in risk
management and make the new changes. Accordingly, the results of this research may help
the managers to better evaluate the risks around them and better respond to these risks, and
present them methods that may enhances their projects risk management.
Research Design and Approach
This study examines the impact of risk management on construction project success. A
Likert scale survey was used to measure the dependent variable of project success and the

ijcrb.webs.com
INTERDISCIPLINARY JOURNAL OF CONTEMPORARY RESEARCH IN BUSINESS
COPY RIGHT © 2013 Institute of Interdisciplinary Business Research 15
AUGUST 2013
VOL 5, NO 4
independent variable of Risk Management. The participants were employees in Consulting
and Contracting companies who experienced previous project.
Response choices on the questionnaire were coded as 1 (Highly Agree), 2 (Agree), 3
(Neutral), 4 (Disagree) and 5. (Highly Disagree).
Sampling techniques
The survey which was directed to the participants was developed according the research
design, approach, and data. This survey includes two major sections. The first section
asked about the procedure followed in the organization to manage the risk, and
investigation on if their organization practices effective risk management. In section two,
the survey attempts to specify if the project they experienced achieved the success criteria,
this was according 7 criteria factors were defined for construction project success listed in
the questionnaire. These questions were analyzed to determine impact of risk management
on construction project success. The survey was directed to employees who in companies
that worked on Construction Projects in Amman. These companies were consultant
Companies and contracting Companies.
Research Population
The scope of this research includes construction projects in Jordan. It was necessary to
sample this research because it is impossible to conduct all the construction companies, the
population consists of 4 leader consulting and contracting companies in Amman including
21 construction projects in Jordan. These companies are Sigma Consulting Engineers,
Concorde Construction Company, Consolidated Contractors and Jo- Sadeen Contracting
Company.
Research sample
The sample consists of employees who are related to risk management, in order to make
sure about the quality of collected data. The sample consists of two hundred and thirty
questionnaires, which were handled to various employees with deferent level of education,
positions and experiences. To assure the maximum level of research sample engagement,
the questionnaire was translated from English to Arabic which can help employees with
various levels and backgrounds to better understand the phrases within the questionnaire
that can lead to maximize their participation.
The distributed questionnaires were 230 questionnaires and got 200 questioners back with
percentage of 87.4%.

ijcrb.webs.com
INTERDISCIPLINARY JOURNAL OF CONTEMPORARY RESEARCH IN BUSINESS
COPY RIGHT © 2013 Institute of Interdisciplinary Business Research 16
AUGUST 2013
VOL 5, NO 4
Data Collection Method
The data for this research are collected via primary and secondary sources. The primary
data was developed by questionnaire which was directed to the employees in the
construction companies in order to collect data for statistical analysis of the research in
order to test the hypothesis. Secondary Sources can be gained from book, specialized
International Journals, Publications and the World Wide Web; also the researcher can make
use of what was written in the literature in similar fields.
Research Hypothesis:
The following hypotheses were tested:
Ha1: There is an impact exists between Risk identification and project success.
Ha1-1: There is an impact exists between Risk Identification and the scheduled time.
Ha1-2: There is an impact exists between Risk Identification and the planned budget.
Ha1-3: There is an impact exists between Risk Identification and the ability to comply with
technical Specifications.
H a2: There is an impact exists between Risk Assessment and project success.
Ha2-1: There is an impact exists between Risk Assessment and planned budget.
Ha2-2: There is an impact exists between Risk Assessment and avoiding lawsuits or claims.
Ha2-3: There is an impact exists between Risk Assessment and the ability to keep future
work with other entities involved with this project was important
H a3: There is an impact exists between Risk Response and project success.
Ha3-1: There is an impact exists between Risk Response and achieving the quality standards
which was originally specified in the specifications
Ha3-2: There is an impact exists between Risk Response and meeting the scope of work.
Ha3-3: There is an impact exists between Risk Response and the scheduled time
Theoretical model and variables
Three independent variable and seven dependent variable are in this research, the
independent variables are: Risk Identification, Risk Assessment and Risk Response for the
Construction Companies, the dependant variable are: Achieve the quality standards,
Comply with technical Specifications, Adherence to Schedule, No lawsuits or claims,
Within the planned Budget, Scope definition and Ability to keep future work
Theoretical Research Model
The model of this research consists of two types of variables, the independent variable and
dependent as shown at the following figure:

ijcrb.webs.com
INTERDISCIPLINARY JOURNAL OF CONTEMPORARY RESEARCH IN BUSINESS
COPY RIGHT © 2013 Institute of Interdisciplinary Business Research 17
AUGUST 2013
VOL 5, NO 4
Fig. 1: Theoretical Research Model
By the researcher
Literature Review
Mudau; Pretorius (2009) aim in their study ―Project control and risk management for
project success: A South African case study‖ to assess the extent to which project control
and risk management contribute to, and how it can be used effectively in ensuring project
success and identify the factors that contribute to project success. The results of the
questionnaire were processed and analyzed by using a spreadsheet application. The main
findings indicated that project controlling and risk management have a significant influence
on performance of the project and therefore on the success of the company. It was also
found that effective earned value management contributes positively to the project success.
By strengthening and focusing more on project controlling and risk management methods
and processes, the performance of projects should improve.
Ewer (2008) explain in their study ―The Impact of Risk Management on IS Projects
Success in Syria‖ the impact of the risk management, on information systems projects in
Syria. It uses questionnaire to get information from IS managers and developers in Syria.
The conclusion of this research presents that many of Syrian IS companies don't have a
formal risk method, and using risk management will increase the success rate of IS project.
Bakker and Wortmann (2010) present in their paper ―Does risk management contribute to
IT project success? A meta-analysis of empirical evidence‖ a meta-analysis of the
empirical evidence that either supports or opposes the claim that risk management
Risk Identification
Risk Assessment
Risk Response
Within the planned Budget
Adherence to Schedule
Achieve the quality standards
Comply with technical Specifications
No lawsuits or claims
Scope definition
Ability to keep future work

ijcrb.webs.com
INTERDISCIPLINARY JOURNAL OF CONTEMPORARY RESEARCH IN BUSINESS
COPY RIGHT © 2013 Institute of Interdisciplinary Business Research 18
AUGUST 2013
VOL 5, NO 4
contributes to IT project success. In addition, this paper also investigates the validity of the
assumptions on which risk management is based. The analysis leads to remarkable
conclusions. Over the last 10 years, much has become known about what causes IT projects
to fail. However, there is still very little empirical evidence that this knowledge is actually
used in projects for managing risks in IT projects. This paper concludes with indicating
new directions for research in the relation between risk management and project success.
Key elements are stakeholder perception of risk and success and stakeholder behavior in
the risk management process.
Because the delay in construction projects in developing countries which cause financial
losses, Luu et al. (2009) described the Bayesian Belief Network (BBN) in their paper
―Quantifying schedule risk in construction projects using Bayesian belief networks‖ and it
was applied to quantify the delays in construction projects probabilities in developing
counties. The research identified sixteen factors that cause the delay in such projects, those
sixteen factors were identified through a questionnaire survey of 166 professionals. The
study found that more than half of the first respondents and functional and top managers
(48%) and 10% from functional managers. From this percentage, we can make sure that the
collected data is real and can be used to identify factors affecting construction delay.
Zou et al. (2007) in their paper ―Understanding the key risks in construction projects in
China‖ aim to investigate the key risk in construction projects in China in order to develop
strategies to manage them. The researcher classifies the risk according to their significance
of the influences of typical project objective in terms time, quality, safety and
environmental sustainability, and then to investigate from the stakeholders perspective. The
researcher achieved his goal and collected data by questionnaire survey, total 25 key risks
were ascertained. And then the researchers compared these risks which found with the
same survey in construction projects in Australian to find the unique risks in construction
projects in China. The researcher conclude that the responsibility must be held by the
clients, designers and government in order to manage their risk and to address potential risk
on time, the risk must be minimized in construction projects ad carried out safe, efficient
and quality by the contractors and subcontractors with robust construction and management
knowledge.
In this study Karimi, Azari et al. (2011) obtain Decision criteria from the nominal group
technique (NGT). The proposed method can discriminate successfully and clearly among
risk assessment methods. This Study concludes that the identification and assessment of
project risk are the critical procedures for projecting success, and this study conclude that

ijcrb.webs.com
INTERDISCIPLINARY JOURNAL OF CONTEMPORARY RESEARCH IN BUSINESS
COPY RIGHT © 2013 Institute of Interdisciplinary Business Research 19
AUGUST 2013
VOL 5, NO 4
there must be in Construction project between dissimilar, yet contractually integrated
parties, owners, designers, contractors, sub-contractors, suppliers, manufacturers, and
others.
Bates (2009) analyzed and predicted in his research ―The owners’ role in project success‖
project success through providing an efficient method for project success. The objective of
the research is to investigate the effect of owner’s decisions and actions that occur during a
construction project. The research investigated two models; One is classical statistical
technique—multiple regression, the other is a modern artificial intelligence technique—
neural networks. Both traditional regression analysis and artificial neural networks were
beneficial for success analysis. This study shows that the combination of use statistical and
artificial neural network yield the best results, while each is appropriate for distinct types of
problems because each has unique advantages and disadvantages. The study concludes
that the most owners have to focus during the execution of a capital facility project on the
following three statements:
1 – Practice the most appropriate level of "owner involvement" during the project.
2 – Focusing on safety must be practiced by owners at every aspect of the project.
3 - Define goals and objectives, a sense of urgency, and emphasize safety.
Culler (2009) defined in his dissertation ―The degree of relationship between critical
success factors and information technology project performance‖ study was to define the
relationships between the 10 critical success factors and information technology project
performance. The current research data supported associations between 10 critical success
factors and information technology project performance. The current research data
confirmed that there is relationship between 10 critical success factors and information
technology project performance. This research examined deeper the affect of project
demographics on relationships between 10 critical success factors and information
technology project performance. This research found that the examination of the data
analysis failed to support a significant affect by project demographics on the relationships
between 10 critical success factors and performance of information technology project.
Theoretical Framework
Construction Industry Definition: The construction projects can be defined as the
industry that creates infrastructure for cities, towns and industries, and considered to be one
of the largest industries in the world. This industry is made out of many types of buildings
in addition to civil Engineering jobs. This industry contains carpentry, construction of
roads, developing bridges and designing homes.
ijcrb.webs.com
INTERDISCIPLINARY JOURNAL OF CONTEMPORARY RESEARCH IN BUSINESS
COPY RIGHT © 2013 Institute of Interdisciplinary Business Research 20
AUGUST 2013
VOL 5, NO 4
Types of construction projects
There are different types of construction projects according to Grace F. M. (2010):
1- Residential: This type of construction projects includes different types of buildings such
as houses, townhouses, apartments, and subdivisions. The process to design the houses is
done, in general, by the architects and engineers and the builders (or may hire
subcontractors) do structural, electrical, mechanical and other specialty work in the
construction process of these houses. Local building authority regulations and codes must
be applied in these buildings. The market of this type of building is highly competitive and
high risks as well as high rewards.
2- Building: The most popular type of construction project is the Building construction. It
can be defined as ―is the process of adding structure to real property‖ (Grace F. M., 2010).
The building projects in the most cases are adding a new room and making small
renovations. Most new building construction projects are building sheltered enclosures in
order to house people, equipment or machinery. Installation of utilities and equipment is
included.
3- Institutional and Commercial: A great variety of institutional and commercial building
are available in this industry with different types and sizes such as schools, universities,
hospitals, clinics, sports facilities, stadiums, large shopping centers and retail chain stores,
light manufacturing plants and warehouses and skyscrapers for offices and hotels. The
designs of such building must be done by specialty architects and engineers who are often
hired for designing such buildings. Few competitors are competing in this market of these
types of buildings because of the high capital needed in addition this type is sophisticated
compared to residential construction projects.
4- Industrial: This type represents small percentage of the whole industrial construction.
while it is a very important part of the industry. The owners of such projects are generally
big, profit, industrial corporations and institutions such as manufacturing, power
generation, medicine, petroleum, etc. highly specialized expertise processes in planning,
cost estimating, design, and construction are required for these industries.
5- Specialized Industrial Construction: Very large scale projects represent this type of
construction project and involve high degree of technological complexity such as nuclear
power plants, chemical processing plants, steel mills and oil refineries.
6- Highway Construction: Highway construction ―involves the construction, alteration, or
repair of roads, highways, streets, alleys, runways, paths, parking areas, etc‖ (Grace F. M.,
2010).

ijcrb.webs.com
INTERDISCIPLINARY JOURNAL OF CONTEMPORARY RESEARCH IN BUSINESS
COPY RIGHT © 2013 Institute of Interdisciplinary Business Research 21
AUGUST 2013
VOL 5, NO 4
7- Heavy Construction: All the projects that are not properly classified as either "building"
or "highway are the heavy construction projects. Such as water and sewer line projects,
dams, dredging projects flood, control projects, sewage treatment plants and facilities, and
water treatment plants and facilities.
Construction processes
1- Design Team: The main purpose of the design team is to assemble and to plan the
procedures, and to integrate those procedures with the other parts. The designers prepare
the drawings and specifications, which represent the contents of the design. A design team
including surveyors, civil engineers, cost engineers (or quantity surveyors), mechanical
engineers, electrical engineers, structural engineers and fire protection engineers, and it
depends on the construction size.
2- Financial advisors. The Financial advisors can be defined as is one or group of
professional/s, who can advise the investment of the project. The investment advice
involves planning process which is created by mortgage bankers, accountants, and cost
engineers and the financial advisors.
3- Legal considerations: It can be defined as is a set of laws that deals all the issues
construction buildings and deals with all of their components. In each country, there are
zoning and building code requirements, these zoning and building code are defined by the
government in this country. So, the construction project must follow these zoning and
building codes.
4- Interaction of different parties: The design that is prepared by the designers must take
into consideration that the design is applicable; it means that it must be appropriate for the
use and location, and meets the legal consideration of the country that is built in and it must
be financially possible to build in order to be economic visible for the owners.
5- Procurement: Different types of procurement in the construction projects, these types
according to Constructing Excellence, 2004 are Traditional or Design-Bid-Build, Two
stage tender , and Design-Build
Risk Management
Definition of risk and risk management: The royal society (1991) had defined the risk as
―The probability that a particular adverse event occurs during a stated period of time‖.
Akintoye et al (2003) emphasized this definition because the probability of happening
harmful impact and the duration of exposure were included in his study.
The source of risk can’t be specified; sometimes, its source is employees’ and managers’
limited knowledge, limited experience and information cause to arise the risk. The source

ijcrb.webs.com
INTERDISCIPLINARY JOURNAL OF CONTEMPORARY RESEARCH IN BUSINESS
COPY RIGHT © 2013 Institute of Interdisciplinary Business Research 22
AUGUST 2013
VOL 5, NO 4
of the risk may be changes in the parties included in construction process. Sometimes the
risk come from financial markets, project failures, legal liabilities, credit risk, accidents,
natural causes and disasters and from competitors.
Sources of risks: A lot of studies worldwide aim to define the sources of studies. Research
Week International Conference, 2005 categorized the sources of risks into two groups: (1)
Internal Source and External sources. The Internal (controllable) sources are Client
system, Consultants, Contractors and subcontractors and Suppliers. While the external
Sources are Economic and globalization dynamics, Unforeseen circumstances,
Government/ statutory/ political controls, Environmental constraints, Health and safety
issues outside the control of the project team and Socio-cultural issues
Risk assessment
The risk management aims to identify the undesired event to estimate risk, and it aims to
like hood the unfavorable event to occur. The risk assessment helps in risk management by
measuring, conducting quantitatively and qualitatively in order to estimate the significance
level of the industrial risk factors to the project and then to estimate of the risk of the
potential factors to project success. The result of this step determines the input to make the
optimum decision.
After the risks have been identified, it can be evaluated regarding its impact on the projects
and the probability of its occurrence. This step is very critical to evaluate and expect the
probability of occurrence of the risk and the impact of this risk and its effect on the
different components of construction projects.
Table 2.2: Various risk assessment techniques.
Qualitative Quantitative
a. Direct judgment e. Probability analysis
b. Ranking options f. Sensitivity analysis
c. Comparing options g. Scenario analysis
d. Descriptive analysis h. Simulation analysis
(Ward and Chapman, 1997)
Qualitative Risk Analysis
In qualitative risk analysis, risk management acts to define the characteristics of each risk
(Kuismanen et al, 2002). The qualitative assessment involves the identification of: (1)
Risks’ hierarchy which is based on the probability of risk’s occurrence and its impact on
the project and employees, (2) Risks’ scope, and (3) Risk occurrence factors (Lowe, 2002).
Qualitative risk analysis assesses the risk according to its probability of occurrence and its

ijcrb.webs.com
INTERDISCIPLINARY JOURNAL OF CONTEMPORARY RESEARCH IN BUSINESS
COPY RIGHT © 2013 Institute of Interdisciplinary Business Research 23
AUGUST 2013
VOL 5, NO 4
impact in order to enable the decision makers to prioritize the risks which have a high
probability of occurrence and big impact on the project and response to them accordingly.
Steps of risk analysis are (Kindinger & Darby, 2000):
· List activities, tasks, or elements that make up the project.
· Identify applicable risk factors.
· Develop risk-ranking scale for each risk factor.
· Rank risk for each activity for each risk activity.
· Document the results and identify potential risk-reduction actions.
Quantitative Risk Analysis
In quantitative risk analysis, the risk is assessed numerically by estimating the probability
that a project will success in meeting the planned budget and time schedule. Quantitative
Risk Analysis process involves evaluation of the impact of all identified and quantified
risks. The results of quantitative Risk Analysis process are more objective than those from
qualitative risk analysis if enough data are available for the decision maker. In addition the
personal judgment and previous experience are factors that affect this process. (Ahmed et
al, 2001).
Quantitative risk analysis suggested statistical techniques that are most easily used with
specialized software (Office of Project Management Process Improvement, 2003).
According to (Abu Rizk, 2002), the quantitative risk analysis contains assigning
probabilities or likelihood to different factors of risks and the impact of these factors in
order to define the severity for each factor (Abu Rizk, 2002).
Risk Attitudes
Risk attitude is defined as ―chosen state of mind with regard to those uncertainties that
could have a positive or negative effect on objective‖. (hillsor and Murray – Webster,
2007). So the employees risk attitudes is affected by different characteristics such as;
personal and experience characteristics, economic, environment of management that they
belong to and the policy that around them. In addition, the individual’s positive and
negative evaluation of characteristics of different types of behaviors represents the base of
the attitude (Te o and Loose more, 2001).
Research findings
The study aims at identifying the opinions of the study sample about ―The impact of risk
management on construction projects success‖. And to achieve this end we have developed
a questionnaire to review the opinions of the study sample. After questionnaires were
distribution Answers were recoded into SPSS program, then we have adopted an

ijcrb.webs.com
INTERDISCIPLINARY JOURNAL OF CONTEMPORARY RESEARCH IN BUSINESS
COPY RIGHT © 2013 Institute of Interdisciplinary Business Research 24
AUGUST 2013
VOL 5, NO 4
appropriate statistical analysis it test the study hypotheses. Cronbach's Alpha used to
Reliability test it reaches 96.5% for all statements which is very good due to that it is more
than excepted value 60%.
Statistical Analysis:
The characteristics of study subjects were described using frequency and means,
distribution. Categorical variables were described by frequencies and percentages.
The Demographical Properties:
1) Gender
Table 5.1: Gender
Percent Frequency Gender
71.5 143 Male
28.5 57 Female
%100 200 Total
The table shows disruption of the sample according to Gender.
The table shows disruption of the sample according to Gender.
The table shows that males were more than females. They were (143) with a (%71.5).
Females were (57) with a (%28.5).
2) Age:
Table 5.2: Age
The table shows disruption of the sample according to Age.
The above table shows that:
50.5% of the sample less than 30 years old.
33.5% of the sample 30-39 years old.
10.5% of the sample 40-49 years old.
5.5% of the sample 50-59 years old.

ijcrb.webs.com
INTERDISCIPLINARY JOURNAL OF CONTEMPORARY RESEARCH IN BUSINESS
COPY RIGHT © 2013 Institute of Interdisciplinary Business Research 25
AUGUST 2013
VOL 5, NO 4
2) Level of education
Table 5.3: Education
education
14 7.0 7.0 7.0
5 2.5 2.5 9.5
142 71.0 71.0 80.5
39 19.5 19.5 100.0
200 100.0 100.0
Master
High Diploma
Bachelors
Diploma
Total
Valid
Frequency Percent Valid Percent
Cumulat iv e
Percent
The table shows disruption of the sample according to Level of education.
The above table shows that:
7% of the sample has Master.
2.5% of the sample has High Diploma.
71% of the sample has Bachelors.
19.5% of the sample has Diploma.
Table 5.4: Job Title
Percent Frequency Job Title
6 12 manager
12.5 25 Head of department
3 6 Head of section
24 48 Administrative clerk
54.5 110 Other
100 200 Total
Table (4) shows disruption of the sample according to Job Title.
The above table shows that:
6% of the samples are managers.
12.5% of the samples are Head of department.
3% of the samples are Head of section.
24% of the samples are Administrative clerk.
54.5% of the samples have other Job title.

ijcrb.webs.com
INTERDISCIPLINARY JOURNAL OF CONTEMPORARY RESEARCH IN BUSINESS
COPY RIGHT © 2013 Institute of Interdisciplinary Business Research 26
AUGUST 2013
VOL 5, NO 4
Table 5.5: Experience
Percent Frequency Experience
5.5 11 5-9
20.5 41 10-14
42.5 85 15-19
31.5 63 20-24
100.0 200 Total
Table (5) shows disruption of the sample according to experience. The table
shows that (%5.5) of the samples were 5-less than 10 years of experience at the
current position, (%20.5) have 10-less than 15 years, (%42.5) have 15-less than 20
years of experience at the current position, (%31.5) have 20-less than 25 years of
experience at the current position.
6) Total experience including the current position
Table (6): Total experience including the current position
Percent Frequency experience
2.5 5 less than 5
5 10 5-9
24 48 10-14
39.5 79 15-19
29 58 20-24
100.0 200 Total
Table (6) shows disruption of the sample according to experience including the
current position. The table shows that (%27.3) of the samples were less than 5
years of experience including the current position, (%26.4) have 5-9 years,
(%30.7) have 10-14 years of experience including the current position.
Descriptive Statistics
Mean & St. Deviation were calculated & Arranged by the most important statement
to the less, Depending on means

ijcrb.webs.com
INTERDISCIPLINARY JOURNAL OF CONTEMPORARY RESEARCH IN BUSINESS
COPY RIGHT © 2013 Institute of Interdisciplinary Business Research 27
AUGUST 2013
VOL 5, NO 4
Aims to investigate the Risk Management
Risk Identification
Table 5.7: Mean & St. Deviation of Risk Identification Arranged by the
most important statement to the less, Depending on means
Statements
Risk Identification mean St. Deviation Importance
Your organization has identified and applied
procedures for the systematic identification of
opportunities
4.23 0.854841 High
The management tends to identify the losses of risk 4.16 0.864951 High
The management tends to identify how and why risks
arise? 4.154364 0.874648 High
The management used the experience of the
organization to identify the risk. 4.147963 0.881597 High
The management used analyzing process to identify
the risk. 4.134464 0.854741 High
The management used scenario analysis to identify the
risk. 4.1 0.808249 High
The management tends to identify the area of risk’s
impact 3.918036 0.924213 High
The management used physical inspection to identify
the risk. 3.9 1.012485 High
The management tends to identify the risk’s source 3.898036 0.922211 High
The management used questionnaires to identify the
risk. 3.8375 0.882817 High
The management used interview to identify the risk. 3.767273 0.862663 High
The management used brainstorming to identify the
risk 3.52625 1.085436 High
The management used SWOT Analysis to identify the
risk 3.484444 1.077533 Medium
The management used examination of local/overseas
experience to identify the risk 3.43963 1.197862 Medium
Total 3.906997 0.936018 High
The above table indicates that there is a high rate of Risk Identification mean was (3.906)
which is less than the agree line (3.50).

ijcrb.webs.com
INTERDISCIPLINARY JOURNAL OF CONTEMPORARY RESEARCH IN BUSINESS
COPY RIGHT © 2013 Institute of Interdisciplinary Business Research 28
AUGUST 2013
VOL 5, NO 4
Risk Assessment
Table:8.5: Mean & St. Deviation of Risk Assessment Arranged by the most
important statement to the less, Depending on means
Question
mean St. Deviation Importance
analyses and evaluates opportunities it has
to achieve objectives 4.448182 0.691473 High
Your organization tries to identify the
strengths and weaknesses of the risk
management systems of other
organizations it works with
4.252778 0.829757 High
Your Organization collates risks in order to
develop decision making on appropriate
actions`
4.172963 0.820708 High
The risk is analyzed according to
likelihood 4.164821 0.725424 High
The risk is analyzed according to
consequence 4.081 0.791574 High
Your organization assess the risk by
quantitative analysis methods 4.048214 0.80063 High
The risk is analyzed according to
reputation impact 3.947909 1.019391 High
The risk is analyzed according to
achievement of objectives 3.925 1.051142 High
The risk is analyzed according to financial
impact 3.898529 0.9822 High
Your organization assess the risk by
qualitative analysis methods 3.87 0.963192 High
Total 4.08094 0.867549 High
The above table indicates that there is a high rate of Risk Assessment
mean was (4.08) which is more than the agree line (3.50).

ijcrb.webs.com
INTERDISCIPLINARY JOURNAL OF CONTEMPORARY RESEARCH IN BUSINESS
COPY RIGHT © 2013 Institute of Interdisciplinary Business Research 29
AUGUST 2013
VOL 5, NO 4
Risk Response
Table 5.9: Mean & St. Deviation of Risk Response Arranged by the most
important statement to the less, Depending on means
Statement mean St. Deviation Importance
Your organization identified risk
management plan 4.21 0.780349 High
Your organization takes into consideration
the limits to achieve risk management
objective.
4.148 0.693233 High
To evaluate the costs and benefits of
identifying risks 4.075444 0.637543 High
Finding out the effectiveness of available
controls and risk management responses 4.018039 0.792385 High
Your management prioritize of risks that
cause a great losses 3.981852 0.764066 High
Your organization identified up to date
business continuity plan 3.613 0.984036 High
Total 4.007723 0.775269 High
The above table indicates that there is a high rate of Risk Response
mean was (4.00) which is more than the agree line (3.50).

ijcrb.webs.com
INTERDISCIPLINARY JOURNAL OF CONTEMPORARY RESEARCH IN BUSINESS
COPY RIGHT © 2013 Institute of Interdisciplinary Business Research 30
AUGUST 2013
VOL 5, NO 4
To what extent does organization use the risk treatment option?
Table 5.10: Mean & St. Deviation Arranged by the most important
statement to the less, depending on means
Statement mean St. Deviation Importance
The responsible managers must
understand the risks faced by the
organization
4.362143 0.654243 High
Senior management are responsible
regarding communications about risk 4.345 0.830314 High
Your Organization support the effective
management of risk between staff and
management
4.294018 0.753017 High
The organization provides appropriate
level of control regarding risks that it
faces
4.211321 0.965474 High
transferring the risk 4.13 0.869991 High
Reducing the risk? 4.106339 0.926312 High
Monitoring the effectiveness of risk
management is an integral part of
routine management reporting.
4.08 1.029026 High
Avoiding the risk? 3.965 0.931727 High
accepting/retaining the risk 3.568 1.143753 High
Total 4.11798 0.900429 High
The above table shows what extent does organization uses the risk
treatment option:
The First option was the responsible managers must understand the
risks faced by the organization.
Second option senior management are responsible regarding
communications about risk.
Third Your Organization support the effective management of risk
between staff and management.

ijcrb.webs.com
INTERDISCIPLINARY JOURNAL OF CONTEMPORARY RESEARCH IN BUSINESS
COPY RIGHT © 2013 Institute of Interdisciplinary Business Research 31
AUGUST 2013
VOL 5, NO 4
Forth the organization provides appropriate level of control regarding
risks that it faces.
Fifth option transferring the risk.
Sixth option monitoring the effectiveness of risk management is an
integral part of routine management reporting.
Seventh option avoiding the risk.
Eighth option: accepting/retaining the risk.
Success Criteria
Table 5.11: Mean & St. Deviation of Success Criteria
Arranged by the most important to the less, Depending on means
Degree Statement mean St. Deviation Importance
1 Scope
definition/management—well
defined and maintained (no
changes)
4.3 0.832747 High
2 Comply with technical
Specifications 4.274911 0.786436 High
3 The project is within the
planned Budget 4.208571 0.643489 High
4 Achieve the quality standards
which was originally specified
in the specifications
4.187679 0.736734 High
5 Adherence to Schedule—
―Bring the project on or ahead
of schedule.‖
4.116339 0.757898 High
6 Future work with other entities
involved with this project was
important
4.04 0.735599
7 No lawsuits or claims. 4.025 0.746432 High
Total 4.164643 0.748476 High

ijcrb.webs.com
INTERDISCIPLINARY JOURNAL OF CONTEMPORARY RESEARCH IN BUSINESS
COPY RIGHT © 2013 Institute of Interdisciplinary Business Research 32
AUGUST 2013
VOL 5, NO 4
The above table shows degree each of the critical success factors
applied and achieved.
HYPOTHESIS
Ha1: There is an impact exists between Risk identification and project success.
To test this hypothesis, Regression was used to find out if there is impact
exists between Risk identification and project success.
Table 5.12: Regression
sig f R Square R
0.000 15.126 0.071 0.266
The Examined (F) value was equal to (15.126) with possibility value (0.000)
and it is lower than the specific value (0.05), and that shows that there is a
significant impact exists between Risk identification and project success.
So we accept the hypothesis:
There is an impact exists between Risk identification and project success.
Ha1-1: There is an impact exists between Risk Identification and the scheduled time.
To test this hypothesis, Regression was used to find out if there is impact
exists between Risk Identification and the scheduled time.
Table 5.13: Regression
sig f R Square R
0.000 19.889 0.091 0.302
The Examined (F) value was equal to (19.889) with possibility value (0.000)
and it is lower than the specific value (0.05), and that shows that there is a
significant impact exists between Risk Identification and the scheduled time..

ijcrb.webs.com
INTERDISCIPLINARY JOURNAL OF CONTEMPORARY RESEARCH IN BUSINESS
COPY RIGHT © 2013 Institute of Interdisciplinary Business Research 33
AUGUST 2013
VOL 5, NO 4
So we accept the hypothesis:
There is an impact exists between Risk Identification and the scheduled time.
Ha1-2: There is an impact exists between Risk Identification and the planned budget.
To test this hypothesis, Regression was used to find out if there is impact exists between
Risk Identification and the planned budget.
Table 5.14: Regression
sig f R Square R
0.000 29.884 0.131 0.362
The Examined (F) value was equal to (29.884) with possibility value (0.000) and it is lower
than the specific value (0.05), and that shows that there is a significant impact exists
between Risk Identification and the planned budget.
So we accept the hypothesis:
There is an impact exists between Risk Identification and the planned budget.
Ha1-3: There is an impact exists between Risk Identification and the ability to comply with
technical Specifications
To test this hypothesis, Regression was used to find out if there is impact exists between
Risk Identification and the ability to comply with technical Specifications.
Table 5.15: Regression
sig f R Square R
0.000 19.228 0.089 0.298
The Examined (F) value was equal to (19.228) with possibility value (0.000) and it is lower
than the specific value (0.05), and that shows that there is a significant impact exists
between Risk Identification and the ability to comply with technical Specifications.
So we accept the hypothesis:
There is an impact exists between Risk Identification and the ability to comply with
technical Specifications.
H a2: There is an impact exists between Risk Assessment and project success.
To test this hypothesis, Regression was used to find out if there is impact exists between
Risk Assessment and project success.

ijcrb.webs.com
INTERDISCIPLINARY JOURNAL OF CONTEMPORARY RESEARCH IN BUSINESS
COPY RIGHT © 2013 Institute of Interdisciplinary Business Research 34
AUGUST 2013
VOL 5, NO 4
Table 5.16: Regression
sig f R Square R
0.000 17.859 0.083 0.288
The Examined (F) value was equal to (17.859) with possibility value (0.000) and it is lower
than the specific value (0.05), and that shows that there is a significant impact exists
between Risk Assessment and project success.
So we accept the hypothesis:
There is an impact exists between Risk Assessment and project success.
Ha2-1: There is an impact exists between Risk Assessment and planned budget.
To test this hypothesis, Regression was used to find out if there is impact exists between
Risk Assessment and planned budget.
Table 5.17: Regression
sig f R Square R
0.000 28.975 0.128 0.357
The Examined (F) value was equal to (28.975) with possibility value (0.000) and it is lower
than the specific value (0.05), and that shows that there is a significant impact exists
between Risk Assessment and planned budget.
So we accept the hypothesis:
There is an impact exists between Risk Assessment and planned budget.
Ha2-2: There is an impact exists between Risk Assessment and avoiding lawsuits or claims.
To test this hypothesis, Regression was used to find out if there is impact exists between
Risk Assessment and avoiding lawsuits or claims.
Table 5.18: Regression
sig f R Square R
0.100 2.736 0.014 0.117
ijcrb.webs.com
INTERDISCIPLINARY JOURNAL OF CONTEMPORARY RESEARCH IN BUSINESS
COPY RIGHT © 2013 Institute of Interdisciplinary Business Research 35
AUGUST 2013
VOL 5, NO 4
The Examined (F) value was equal to (2.736) with possibility value (0.100) and it is higher
than the specific value (0.05), and that shows that there is no significant impact exists
between Risk Assessment and avoiding lawsuits or claims.
So we refuse the hypothesis:
There is no impact exists between Risk Assessment and avoiding lawsuits or claims.
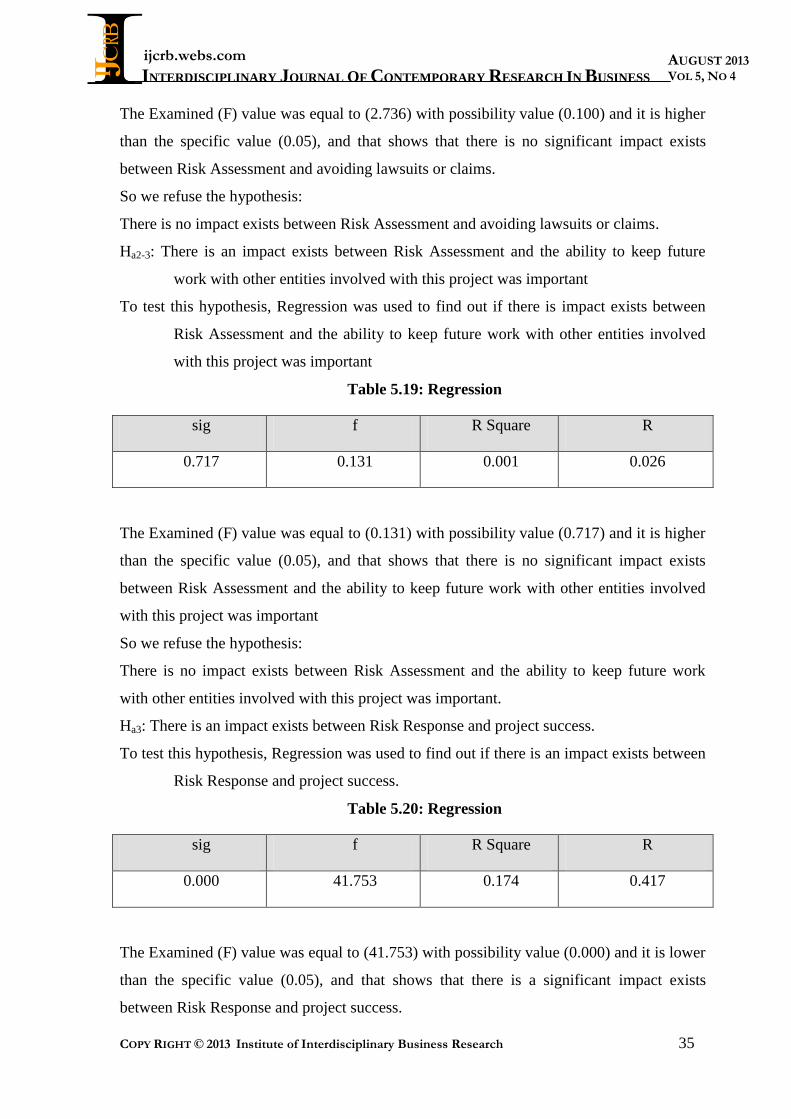
Ha2-3: There is an impact exists between Risk Assessment and the ability to keep future
work with other entities involved with this project was important
To test this hypothesis, Regression was used to find out if there is impact exists between
Risk Assessment and the ability to keep future work with other entities involved
with this project was important
Table 5.19: Regression
sig f R Square R
0.717 0.131 0.001 0.026
The Examined (F) value was equal to (0.131) with possibility value (0.717) and it is higher
than the specific value (0.05), and that shows that there is no significant impact exists
between Risk Assessment and the ability to keep future work with other entities involved
with this project was important
So we refuse the hypothesis:
There is no impact exists between Risk Assessment and the ability to keep future work
with other entities involved with this project was important.
Ha3: There is an impact exists between Risk Response and project success.
To test this hypothesis, Regression was used to find out if there is an impact exists between
Risk Response and project success.
Table 5.20: Regression
sig f R Square R
0.000 41.753 0.174 0.417
The Examined (F) value was equal to (41.753) with possibility value (0.000) and it is lower
than the specific value (0.05), and that shows that there is a significant impact exists
between Risk Response and project success.

ijcrb.webs.com
INTERDISCIPLINARY JOURNAL OF CONTEMPORARY RESEARCH IN BUSINESS
COPY RIGHT © 2013 Institute of Interdisciplinary Business Research 36
AUGUST 2013
VOL 5, NO 4
So we accept the hypothesis:
There is an impact exists between Risk Response and project success.
Ha3-1: There is an impact exists between Risk Response and achieving the quality standards
which was originally specified in the specifications
To test this hypothesis, Regression was used to find out if there is an impact exists between
Risk Response and achieving the quality standards which was originally specified
in the specifications.
Table 5.21: Regression
Sig f R Square R
0.000 27.725 0.123 0.350
The Examined (F) value was equal to (27.725) with possibility value (0.000) and it is lower
than the specific value (0.05), and that shows that there is a significant impact exists
between Risk Response and achieving the quality standards which was originally specified
in the specifications.
So we accept the hypothesis:
There is an impact exists between Risk Response and achieving the quality standards
which was originally specified in the specifications.
Ha3-2: There is an impact exists between Risk Response and meeting the scope of work.
To test this hypothesis, Regression was used to find out if there is an impact exists between
Risk Response and meeting the scope of work.
Table 5.22: Regression
Sig f R Square R
0.046 4.026 0.020 0.141
The Examined (F) value was equal to (4.026) with possibility value (0.046) and it is lower
than the specific value (0.05), and that shows that there is a significant impact exists
between Risk Response and meeting the scope of work.
So we accept the hypothesis:
There is an impact exists between Risk Response and meeting the scope of work.
Ha3-3: There is an impact exists between Risk Response and the scheduled time

ijcrb.webs.com
INTERDISCIPLINARY JOURNAL OF CONTEMPORARY RESEARCH IN BUSINESS
COPY RIGHT © 2013 Institute of Interdisciplinary Business Research 37
AUGUST 2013
VOL 5, NO 4
To test this hypothesis, Regression was used to find out if there is an impact exists between
Risk Response and the scheduled time.
Table 5.23: Regression
Sig f R Square R
0.000 21.196 0.097 0.311
The Examined (F) value was equal to (21.196) with possibility value (0.000) and it is lower
than the specific value (0.05), and that shows that there is a significant impact exists
between Risk Response and the scheduled time.
So we accept the hypothesis:
There is an impact exists between Risk Response and the scheduled time.
Conclusion
After analyzing the data and testing the hypotheses, the following results were reached:
1. There is an impact exists between Risk identification and project success,
The Examined (F) value was equal to (15.126) with possibility value
(0.000) and it is lower than the specific value (0.05)
2. There is an impact exists between Risk Identification and the scheduled time, The
Examined (F) value was equal to (19.889) with possibility value (0.000) and it is lower
than the specific value (0.05)
3. There is an impact exists between Risk Identification and the planned
budget, The Examined (F) value was equal to (29.884) with possibility
value (0.000) and it is lower than the specific value (0.05)
4. There is an impact exists between Risk Identification and the ability to comply with
technical Specifications, The Examined (F) value was equal to (19.228) with possibility
value (0.000) and it is lower than the specific value (0.05)
5. There is an impact exists between Risk Assessment and project success, The Examined (F)
value was equal to (41.753) with possibility value (0.000) and it is lower than the
specific value (0.05).
6. There is an impact exists between Risk Assessment and planned budget, The Examined (F)
value was equal to (28.975) with possibility value (0.000) and it is lower than the
specific value (0.05)

ijcrb.webs.com
INTERDISCIPLINARY JOURNAL OF CONTEMPORARY RESEARCH IN BUSINESS
COPY RIGHT © 2013 Institute of Interdisciplinary Business Research 38
AUGUST 2013
VOL 5, NO 4
7. There is no impact exists between Risk Assessment and avoiding lawsuits or claims, The
Examined (F) value was equal to (2.736) with possibility value (0.100) and it is higher
than the specific value (0.05).
8. There is no impact exists between Risk Assessment and the ability to keep future work with
other entities involved with this project was important.
9. There is an impact exists between Risk Response and project success, The Examined (F)
value was equal to (41.753) with possibility value (0.000) and it is lower than the
specific value (0.05).
10. There is an impact exists between Risk Response and achieving the quality standards
which was originally specified in the specifications, The Examined (F) value was equal
to (27.725) with possibility value (0.000) and it is lower than the specific value (0.05).
11. There is an impact exists between Risk Response and meeting the scope of work, The
Examined (F) value was equal to (4.026) with possibility value (0.046) and it is lower
than the specific value (0.05).
12. There is an impact exists between Risk Response and the scheduled time, The Examined
(F) value was equal to (21.196) with possibility value (0.000) and it is lower than the
specific value (0.05).
Recommendations
1. The responsible managers must understand the risks faces by the
organization.
2. Senior managers are responsible regarding communications about risk and
management of risk between staff and management.
3. The organization should provide appropriate level of control regarding
risks that it is faces, which include ( transferring the risk and reducing the
risk).
4. Monitoring the effectiveness of risk management is an integral part of
management reporting as risk treatment option.
5. To management the risk effectively and efficiently, the contractor must
understand risk responsibilities, risk event conditions, risk preference, and
risk management capabilities.

ijcrb.webs.com
INTERDISCIPLINARY JOURNAL OF CONTEMPORARY RESEARCH IN BUSINESS
COPY RIGHT © 2013 Institute of Interdisciplinary Business Research 39
AUGUST 2013
VOL 5, NO 4
References
1- Loosemore, M., Raftery, J., Reilly, C. & Higgon, D., 2006. Risk Management In
Projects. 2nd Ed. Abengdon, Oxon: Taylor & Francis.
2- Akintoye, A., Beck, M. & Hardcastle, C., 2003. Public Private Partnership:
Managing Risks & Opportunities. 1st Ed. Oxford: Blackwell.
3- Fewings, P., 2005. Construction Project Management: An Integrated Approach.
Abingdon: Taylor And Francis.
4- Loosemore, M., Raftery, J., Reilly, C. & Higgon, D., 2006. Risk Management In
Projects. 2nd Ed. Abengdon, Oxon: Taylor & Francis.
5- Mudau, R. And Pretorius, L. (2009). Project Control And Risk Management For
Project Success: A South African Case Study. Proceeding Of The Portland
International Conference, 1409-1414, Portland, OR.
6- Ewer, Y. Mustafa, M.M. (2008) The Impact Of Risk Management On IS Projects
Success In Syria, Proceeding In International Conference On Telecommunication
Technology And Applications, 1-6, Damascus.
7- Lee-Anne Perry And Bed (Hons) (2007). The Impact Of Risk Management On The
Changing Nature Of Principal’s Work, Ph.D. Thesis, Queensland University Of
Education.
8- Bakker, K.B. & Wortmann, Hans. (2010). Does Risk Management Contribute To
IT Project Success? A Meta-Analysis Of Empirical Evidence "International Journal
Of Project Management, 28: 493-503.
9- Abu Mousa, J. (2008). Risk Management In Construction Projects From
Contractors And Owners" Perspectives, Master Thesis, Islamic University Of Gaza
10- Luu V., Kim S., Tuan N., Ogunlana S., 2009, ―Quantifying Schedule Risk In
Construction Projects Using Bayesian Belief Networks‖, International Journal Of
Project Management, 29 (2): 209–219
11- Wang J, Yuan H, 2011, ―Factors Affecting Contractors’ Risk Attitudes In
Construction Projects: Case Study From China‖, International Journal Of Project
Management 29(2): 209–219
12- Oztas, A. Okmen O., 2005, Judgmental Risk Analysis Process Development In
Construction Projects, Building And Environment, 40 (9): 1244–125
13- Zou P., Zhang G., Wang J., (2007), ―Understanding The Key Risks In Construction
Projects In China‖, International Journal Of Project Management, 25 (6): 601–614

ijcrb.webs.com
INTERDISCIPLINARY JOURNAL OF CONTEMPORARY RESEARCH IN BUSINESS
COPY RIGHT © 2013 Institute of Interdisciplinary Business Research 40
AUGUST 2013
VOL 5, NO 4
14- Nieto-Morote A., Ruz-Vila F., 2011, ―A Fuzzy Approach To Construction Project
Risk Assessment‖ International Journal Of Project Management, 29 (2): 220–231
15- Dikmen I., Birgonul M.T., Anac C., Tah J, Aouad G. 2008, ―Learning From Risks:
A Tool For Post-Project Risk Assessment‖, Automation In Construction, 18 (1):
42–50
16- Karimi A., Mousavi N., Mousavi S., Hosseini S. (2011), ―Risk Assessment Model
Selection In Construction Industry‖, Expert Systems With Applications, 38 (2):
9105–9111.
17- El-Sayegh S., (2008), ―Risk Assessment And Allocation In The UAE Construction
Industry‖, International Journal Of Project Management, 26 (4): 431–438
18- Pinto A., Nunes I., Ribeiro R., 2011, ―Occupational Risk Assessment In
Construction Industry – Overview And Reflection‖, Safety Science, 49 (5): 616–
624.
19- Bakker K., Boonstra A., Wortmann H., (2010), ―Does Risk Management Contribute
To IT Project Success? A Meta-Analysis Of Empirical Evidence‖, International
Journal Of Project Management, 28 (5): 493–503
20- Bryan Scott Canada The Role Of Leadership And Management Skills In The
Success Of Construction Project Managers, Degree Master Of Science, Arizona
State University 2009.
21- Canada B., (2009), ―The Role Of Leadership And Management Skills In The
Success Of Construction Project Managers‖ Master Thesis, Arizona State
University
22- Boetti V., (2008), ―Use Of Social Network Analysis As A Tool To Evaluate
Success On Construction Projects And Team Interactions‖. Master Thesis,
University Of Colorado.
23- Nwagbogwu D., (2011), ―The Correlation Between Project Management
Effectiveness And Project Success‖. Ph.D Thesis, Walden University
24- Andrew J. Bates, 2009, ―The Owners Role In Project Success‖, Ph.D Thesis,
Polytechnic University
25- Culler S.& Watson E., (2009), ―The Degree Of Relationship Between Critical
Success Factors And Information Technology Project Performance‖. Ph.D Thesis,
University Of Phoenix February.

ijcrb.webs.com
INTERDISCIPLINARY JOURNAL OF CONTEMPORARY RESEARCH IN BUSINESS
COPY RIGHT © 2013 Institute of Interdisciplinary Business Research 41
AUGUST 2013
VOL 5, NO 4
26- Alkhathami M., 2004, ―EXAMINATION OF THE CORRELATION OF
CRITICAL SUCCESS AND DELAY FACTORS IN CONSTRUCTION
PROJECTS IN THE KINGDOM OF SAUDI ARABIA‖, Ph.D Thesis, University
Of Pittsburghm
27- ZAFAR H., 2010, ―CRITICAL SUCCESS FACTORS FOR AN EFFECTIVE
SECURITY RISK MANAGEMENT PROGRAM IN AN ORGANIZATION: AN
EXPLORATORY CASE STUDY‖. Ph.D Thesis, The University Of Texas
28- G. Sweis, R. Sweis, A. Abu Hammad, A. Shboul, 2008, ―Delays In Construction
Projects: The Case Of Jordan‖, International Journal Of Project Management, 26
(6): 665–674.
29- Hillson D., 2006, Integrated Risk Management As A Framework For
Organisational Success, PMI Global Congress Proceedings, Seattle Washington
30- Aaron T., Shenhar J., Dvir D.2002, ―Risk Management, Project Success, And
Technological Uncertainty‖, Journal R&D Management, Vol. 32 (2): 101-109
31- Didenko I. & Konovets I., 2008, ―Success Factors In Construction Projects: A
Study Of Housing Projects In Ukraine‖, Master Thesis. Umeå University
32- Amr A., El Nemr H, El Nemr W., 2008, ―Claims Management In The Egyptian
Industrial Construction Sector: A Contractor’s Perspective‖ Journal Of
Engineering, Construction And Architectural Management, 15 (5): 456-469
33- Massingham P., 2010, ―Knowledge Risk Management: A Framework‖, JOURNAL
OF KNOWLEDGE MANAGEMENT, 14 (3): 464-485
34- Holmes T., ―What Is Construction Industry?‖, Available Online June, 4th 2011,
From: Http://Www.Wisegeek.Com/What-Is-The-Construction-Industry.Htm.
35- The State Of Queensland (Department Of Justice And Attorney-General), 2009,
―What Is Construction Industry?‖, ‖, Available Online June, 9th 2011,From:
Http://Www.Deir.Qld.Gov.Au/Workplace/Business/Construction/Whatis/Index.Ht
m
36- Sidwell A., 2005, "The Regulation Of Superstores: The Legality Of Zoning
Ordinances Emerging From The Skirmishes Between Wal-Mart And The United
Food And Commercial Workers Union", Available Online June, 15th 2011,From
Http://Www.Rics.Org/Site/Download_Feed.Aspx?Fileid=2870&Fileextension=PD
F.

ijcrb.webs.com
INTERDISCIPLINARY JOURNAL OF CONTEMPORARY RESEARCH IN BUSINESS
COPY RIGHT © 2013 Institute of Interdisciplinary Business Research 42
AUGUST 2013
VOL 5, NO 4
37- Akintoye, A., Beck, M. & Hardcastle, C., 2003. Public Private Partnership:
Managing Risks & Opportunities. 1st Ed. Oxford: Blackwell.
38- New South Wales Treasury, 2004, ―Risk Management Guideline‖, Available
Online June, 15th, 2011, From:
Http://Www.Treasury.Nsw.Gov.Au/__Data/Assets/Pdf_File/0009/5103/Risk_Mana
gement.Pdf
39- Research Week International Conference, 2005, Available Online June, 15th 2011,
From
40- Http://Www.Rics.Org/Site/Download_Feed.Aspx?Fileid=2870&Fileextension=PD
F
41- Dennenberg, H.S., Eilers, R.D., Hoffman, G.W., Kline, C.A., Melone, J.J., Snider,
H.W. (1964). Risk And Insurance, Prentice Hall, Inc., Englewood Cliffs, NJ.
42- Vaughan, E.J. And Vaughan, T.M. (2002), Fundamentals Of Risk Management
And Insurance, Wiley, New York, NY.
43- Project Management Institute PMI, 1996, Project Management Body Of
Knowledge, PMI.
44- Isaac I., 1995, ―Training In Risk Management‖ International Journal Of Project
Management 13 (14): 225-229
45- Zeng, J., An, M., & Smith, N. J. (2007). Application Of A Fuzzy Based Decision
Making Methodology To Construction Project Risk Assessment. International
Journal Of Project Management, 25(6): 589–600.
46- White, D. (1995). Application Of Systems Thinking To Risk Management: A
Review Of The Literature. Management Decision, 3(10), 35–45.
47- Huang, D., Chen, T., & Wang, M.-J. (2001). A Fuzzy Set Approach For Event Tree
Analysis. Fuzzy Sets And Systems, 118 (1): 153–165.
48- Gelbard, R. & Carmeli, A. (2009). The interactive effect of team dynamics and
organizational support on ICT project success. International Journal of Project
Management, 27(2), 464 -470. doi:10.1016/j.ijproman.2008.07.005
49- Schachter, D. (2004). Managing your library's technology projects. Information
Outlook, 8(12), 10-12. Retrieved from Business Source Complete database. (AN
154519 06)
50- http://www.ehow.com/facts_4987709_define-budget-planning.html
51- Robson, C., 1993. Real World Research. Oxford: Blackwell.
52- http://www.ccjo.com/

ijcrb.webs.com
INTERDISCIPLINARY JOURNAL OF CONTEMPORARY RESEARCH IN BUSINESS
COPY RIGHT © 2013 Institute of Interdisciplinary Business Research 43
AUGUST 2013
VOL 5, NO 4
53- http://www.sigma.jo/about
54- http://www.elconcorde.com/elconcorde//construction/whoweare