The impact of repowering of wind farms on birds and bats
38
The impact of repowering of wind farms on birds and bats By Dr. Hermann Hötker Michael-Otto-Institute within NABU - Research and Education Centre for Wetlands and Bird Protection - Research commissioned by Landes- amt für Natur und Umwelt des Landes Schleswig-Holstein. Translated by Solveigh Lass-Evans Supported by Natural England Contract SAE03-C2-124 Bergenhusen, October 2006
Transcript of The impact of repowering of wind farms on birds and bats

The impact of repowering of wind farmson birds and bats
ByDr. Hermann Hötker
Michael-Otto-Institute within NABU- Research and Education Centre forWetlands and Bird Protection -
Research commissioned by Landes-amt für Natur und Umwelt des LandesSchleswig-Holstein.
Translated by Solveigh Lass-EvansSupported by Natural EnglandContract SAE03-C2-124
Bergenhusen, October 2006

Contents1 Introduction ..................................................................................................3
2 Material and methods ..................................................................................4
3 Analysed wind turbines...............................................................................6
4 Impacts of wind turbines on birds ..............................................................84.1 Non-lethal impacts of windturbines on birds ............................................84.1.1 Change in distribution due to wind turbines .............................................84.1.2 Minimum avoidance distance of birds to wind turbines .........................104.2 Collision of birds and bats with wind turbines .......................................144.2.1 Collision of birds with wind turbines........................................................144.2.2 Collision of bats with wind turbines .........................................................16
5 Estimated impacts of repowering .............................................................185.1 Repowering and disturbance of birds .....................................................195.2 Repowering and collisions of birds and bats ..........................................24
6 Discussion and research requirements...................................................25
7 Acknowledgements ...................................................................................26
8 Summary ....................................................................................................26
9 References .................................................................................................27
10 Appendix ....................................................................................................35

The impact of repowering of wind farms on birds and bats
3
1 Introduction
Wind energy generation has developed in Germany into by far the most importantsource of renewable energy production. Over 18,000 wind turbines with an in-stalled capacity of over 19,000 MW are now in operation (status 30.6.2006, Bun-desverband Windenergie, http://windenergie.de/de/statistiken/). The wind-richoffshore areas are seen as the best opportunity to increase the generation of windenergy. On the mainland, however, the expansion of wind energy is becomingincreasingly more difficult, as most of the best sites are already taken and furtherextension of existing wind farms is restricted by the lack of wind in most of theinland regions, as well as planning restrictions for interests (protection of the envi-ronment, nature conservation and landscape). Therefore, „repowering“ provides apossibility to increase the production of electricity without simultaneously increa-sing the space required. „Repowering“ means that older, smaller and less powerfulwind turbines are replaced by newer and more powerful ones. These new turbinesare much higher than older ones - heights above 100m are now the norm.
The literature review of Hötker et al. (2005) (hereafter called the NABU-BfN re-port), which was funded by the German Agency for Nature Conservation (BfN),showed that wind turbines have only a relatively small disturbance effect on bree-ding birds, although many potentially sensitive species have not yet been ana-lysed. Resting birds, in particular geese, ducks and waders responded sensitivelyto wind turbines and could be displaced from their resting areas. Wind turbines atcertain sites, especially on bare mountain ridges and water bodies, are a collisionrisk for birds. In particular, birds of prey were affected, in Germany notably RedKite and White-tailed Eagle. Bats were also killed by wind turbines, especiallywhen these were located close to or within woodlands. The extent to which windturbines have a harmful impact on the natural environment is mainly determined bytheir location. Practically the only effective means of avoiding damage was appro-priate site selection.
The references used by Hötker et al. (2005) were generally studies which hadbeen carried out on older, relatively small wind turbines. Although one could esti-mate a relationship between the size of wind turbines and the disturbance impactor collision risk for birds and bats, these relationships were not (with some excep-tions) statistically significant. In order better to assess the impacts of the newgeneration of wind turbines on birds and bats, this report will analyse the morerecent publications (up to summer 2006). The main emphasis was in particular theextent to which the danger for birds and bats caused by wind turbines is expectedto change due to repowering. In this report, collisions of birds and bats and thedisplacement of birds by wind turbines have been considered as the potentialimpacts on these taxa. To our knowledge, no further essential studies about thedisplacement of bats and other mammals by wind turbines have been carried outrecently (Bach & Rahmel, 2004) and therefore this aspect is not dealt with in thisreport.

The impact of repowering of wind farms on birds and bats
4
2 Material and Methods
The methods used in this report are the same as the ones of the NABU-BfN report,so that the collected material of the NABU-BfN report could be included here. Inaddition, ca. 60 new publications were analysed, which had been derived from 45individual studies. Data from each wind farm was treated as a single study, even ifthe data were gathered in different years and by different observers, to ensure theindependence of the data and to avoid analysing the same study more than once.
The following publications were used in the NABU-BfN-report:Ahlén, 2002; Albouy et al., 1997; Albouy et al., 2001; Anderson et al., 2000; Bachet al., 1999; Bach, 2001;Bach, 2002; Barrios & Rodriguez, 2004; Bergen, 2001a;Bergen, 2001b; Bergen, 2002a; Bergen, 2002b; Bergh et al., 2002; Boone, 2003;Böttger et al., 1990; Brauneis, 1999; Brauneis, 2000; Clemens & Lammen, 1995;De Lucas et al., 2004; Dulas Engineering Ltd, 1995; EAS, 1997; Erickson et al.,2003; Everaert, 2003; Everaert et al., 2002; Förster, 2003; Gerjets, 1999; Gharad-jedaghi & Ehrlinger, 2001; Guillemette & Larsen, 2002; Guillemette et al., 1999;Hall & Richards, 1962; Hormann, 2000; Hydro Tasmania; Isselbächer & Isselbä-cher, 2001; Janss, 2000; Johnson, 2002; Johnson et al., 2003; Johnson et al.,2000; Kaatz, 2000; Kaatz, 2002; Kerlinger, 2000; Ketzenberg et al., 2002; Koop,1997; Koop, 1999; Korn & Scherner, 2000; Kowallik & Borbach-Jaene, 2001;Kruckenberg & Borbach-Jaene, 2001; Kruckenberg & Jaene, 1999; Leddy et al.,1999; Lekuona, 2001; Meek et al., 1993; Menzel, 2002; Menzel & Pohlmeier,1999; Musters et al., 1996; Orloff & Flannery, 1996; Osborn et al., 1996; Peder-sen& Poulsen, 1991; Percival, 2000; Phillips, 1994; Reichenbach, 2002; Reichen-bach, 2003a; Reichenbach & Schadek, 2003; Reichenbach & Sinning, 2003;Sachslehner & Kollar, 1997; Scherner, 1999; Schmidt et al., 2003; Schreiber,1992; Schreiber, 1993a; Schreiber, 1993b; Schreiber, 1999; Schreiber, 2002;SEO, 1995; SGS Environment, 1994; Sinning, 1999; Sinning & Gerjets, 1999;Smallwood & Thelander, 2004; Sommerhage, 1997; Steiof et al., 2002; Still et al.,1996; Strickland et al., 2001; Stübing & Bohle, 2001; Thelander & Rugge, 2000;Thelander et al., 2003; Trapp et al., 2002; van der Winden et al., 1999; Vierhaus,2000; Walter & Brux, 1999; Winkelman, 1989; Winkelman, 1992a; Winkelman,1992b; Young et al., 2003a; Young et al., 2003b.
And the following sources were included in this report:Behr & Helversen, 2005; Brandt et al., 2005a; Brinkmann & Schauer-Weisshahn,2006; Everaert & Stienen, 2006; Grünkorn et al., 2005; Handke et al., 2004a, b, c,d; Kerns et al., 2005; Koford et al., 2003; Lucas et al., 2005; Petersen et al., 2004;Reichenbach & Steinborn, 2006; Sinning, 2004a, b, c; Sinning & Bruyn, 2004;Sinning et al., 2004; Traxler et al., 2004.
As with the NABU-BfN report, the intention was to produce a report primarily rele-vant to Germany, and therefore the main emphasis was on research from Germa-ny. The number of studies included from other countries also partly reflects herethe scale of the research carried out in each country (Tab.1).

The impact of repowering of wind farms on birds and bats
5
Most of the new studies cover several bird or bat species. For each species oftenseveral parameters were analysed (e.g. minimum distance to wind turbines andchange in resting populations after installation of a wind farm; for further detailssee below). The division of species and parameters led to a data matrix with 207data sets. Combined with the 1,789 data sets of Hötker et al. (2005), in total1,996 data sets were available.
Most of the new data sets are quantitative analyses and only a few are „singleobservations“. Many of these „single observations“ have their source in systematicsurveys, in the framework of which certain bird species were observed only rarely.
In spite of the addition of new references, the data material was still not suitablefor a formal meta-analysis (Fernandez-Duque & Valeggia, 1994). Therefore, aswith the NABU-BfN report, all the available results were included in the analysis.No distinction was made between results derived from systematic surveys andthose based on only a few casual observations. The disadvantage of using allavailable studies is that, in statistical terms, casual observations are given equalweight to extensive research. It cannot be ruled out that „extreme“ observationshave been recorded more frequently that less spectacular events. Also, additionalfactors, which could have been important in individual cases, may not have beenfully considered. However, the advantage of this method is that the number ofstudies included in the analysis is large and therefore the results are less depen-dent on single, well-researched, but possibly atypical, studies. The independenceof the data is also guaranteed. With a large number of studies, there is a greaterchance that confounding factors may cancel each other out.
Unless stated otherwise, the statistical tests in this report use the „null-hypothesis“that wind turbines have no influence on the parameter under consideration (forexample population size before and after wind farm installation). The alternativehypothesis is that wind turbines do have an influence. In order to carry out thestatistical tests, it was determined how many studies had a negative or positiveeffect (e.g. decrease or increase of population). As mentioned above, neither thestrength of effect, nor statistical significance were considered. Neutral results (e.g.constant population) were classified as positive, in order to avoid any false asso-ciation of wind energy with negative impacts. At the same time, statistically signifi-cant negative effects are made in this way more convincing and safer, and are not„diluted“ by the inclusion of neutral results. If wind power has no influence on birdpopulations, one would expect roughly equal proportions of positive and negative
Table 1: Countries of the 180 studies evaluated inthis report.
Country Number of studies Belgium 8 Germany 107 Denmark 3 France 2 Great Britain 6 Netherlands 5 Austria 5 Spain 11 USA 31 Australia 2

The impact of repowering of wind farms on birds and bats
6
effects. If the frequency of positive and negative effects differs strongly, someimpact of wind energy can be assumed. In these cases, the statistical test used isthe binomial test. Because not all of the available information is used in this pro-cedure (for example the strength of the effects), it is very conservative, meaningthat differences and trends are only classified as significant when they are verystrong. The statistical tests were carried out using SPSS 7.5 statistical software.
Because the individual bird and bats species differ greatly in their biology andtheir use of habitat, whenever possible the evaluation was carried out for separatespecies. In cases when such differentiation was not possible, species were grou-ped.
It is assumed that animals which are relatively tied to their breeding areas reactdifferently to wind turbines than those, which only pass through areas outside thebreeding season, when they are less tied to a single area and lack local know-ledge. Therefore a distinction was made between studies carried out during andoutside the breeding season (definition varies, depending on the species concer-ned). Most studies did not indicate what activities the animals were carrying out atthe time of observation (e.g. foraging, resting, roosting) and so this factor couldnot be considered in this report.
3 Analysed wind turbines
A substantial objective of this report was to estimate the impact that larger „newgeneration“ wind turbines have on birds and bats, as most of the data from thestudies used by Hötker et al. (2005) was based on small wind turbines. For thisreason, first of all the wind turbines used in this report shall be described and theirdifferent characteristics related to each other.
This report covers almost the whole spectrum of operational wind turbines used,from the beginning of wind energy production until the middle of 2006. The powercapacity of the turbines ranges from less than 0.1 MW up to 2.0 MW. There was asimilar spread for turbine hub height (22m to 114m), rotor diameter (14m to 80m)and accordingly total height (30m to 146m) to blade tip. As expected, the parame-ters capacity, hub height, rotor diameter and total height are closely correlated(Fig. 1-3). The relationship between the power capacity of the wind turbines andthe remaining parameters can be described by the following equation, whereasthe choice of the regression equation had been chosen in a way that the definingR2 value was maximised (n=741):
Hub height (m) = 28.98 * power capacity (MW) + 30.29R2 = 0.67 (p<0.001)
Total height (m) = 87.01 * power capacity (MW)0.382
R2 = 0.73 (p<0.001)
Rotor diameter (m) = 54.75 * power capacity (MW)0.382
R2 = 0.79 (p<0.001)

The impact of repowering of wind farms on birds and bats
7
In these equations and in Fig. 1-3, all available data points were used. Single windturbines were thus counted repeatedly if more data analyses were available. Thisprocedure was chosen because, first of all, it was necessary to clarify the relation-ships between the individual parameters within the data material, rather than todescribe the technical development of the wind energy production.
Power capacity and turbine size define strong linear trends in the early stages oftechnical development. However, from a capacity of around 1 MW, wind turbinesize remains nearly constant as capacity increases.
Within the framework of this study, it was assumed that the overall height of a windturbine is the parameter, most likely to determine if it has a disturbance impactand therefore in this report, the total height of turbines was the main parameteranalysed.
Figure 1: The relationship between powercapacity of wind turbines and theirhub height.
Figure 2: Relationship between the powercapacity of wind turbines and theirrotor diameter.
Figure 3: Relationship between the powercapacity and the total height of windturbines.
0
20
40
60
80
100
120
0,0 0,5 1,0 1,5 2,0 2,5
capacity (MW)
turb
ine
hu
b h
eig
ht
(m)
0
10
20
30
40
50
60
70
80
90
0,0 0,5 1,0 1,5 2,0 2,5
capacity (MW)
roto
r d
iam
eter
(m
)
0
20
40
60
80
100
120
140
160
0,0 0,5 1,0 1,5 2,0 2,5
capacity (MW)
tota
l h
eig
ht
to b
lad
e ti
p (
m)

The impact of repowering of wind farms on birds and bats
8
4 Impacts of wind power on birds4.1 Non-lethal impacts of wind turbines on birds (disturbance,
displacement, habitat loss)4.1.1 Change in distribution due to wind turbines
Because more material was available for this report than for the NABU-BfN report,the question of whether wind turbines have an impact on bird populations could betested more thoroughly. Only activity taking place on the ground or in vegetationhas been considered (breeding, resting, foraging). Despite the better availabilityof data, only a small number of studies permitted before-after-control impact com-parison, and therefore studies that compare bird populations on the wind farm sitewith bird populations at similar sites in the surrounding area were also taken intoaccount. As the analysed studies differ greatly from each other, it was only consi-dered whether wind turbines had „positive“ or „negative“ effects. Negative effectsare: (1) population decline after installation of the wind turbines; or (2) reducednumbers of birds within wind farms or the surrounding area, in comparison tocontrol areas. Positive effects are accordingly population increase after installati-on of turbines, or increased bird numbers around the wind farm. The strength ofthe effects was not considered. If no population differences were detected, theeffects were classified as positive in order to avoid falsely inflating the impact ofnegative effects (see above).
If wind energy has no impact, equal ratios of positive or negative effects are ex-pected and statistical significance of these expectations was tested using a bino-mial test (for which the null hypothesis is that data are randomly distributed) (Tab.2).
For 52 species or species groups enough studies (at least six) were of goodenough quality to be included in statistical tests. Negative population impacts ofwind farms during the breeding season could not be verified for any bird species.Only quail, redshank and lapwing displayed reduced numbers in connection withwind farms. The summarised material of all analysed studies on waders showed astatistically significant majority of negative reactions towards wind turbines. Posi-tive or neutral effects predominate for the remaining species. Two species, whichbreed in reeds (marsh warbler and reed bunting) as well as stonechat even sho-wed significantly more positive or neutral reactions towards wind turbines thannegative ones.
One of the reasons for this phenomenon (i.e. „positive effects“) could be that dueto construction of wind farms and their supply roads, trenches and high shrubfields had developed, which had not existed before in the uniform farmland andmeadows. It is unlikely that these particular species are especially attracted towind turbines themselves.
Studies carried out outside the breeding season show a very different picture andnegative impacts of wind turbines predominate. Wigeon, Lapwing, Common Snipeand Golden Plover display significantly more negative than positive effects. Thesame applies to wildfowl which have been summarised according to their habitsas followed: Geese (White-fronted Goose, Bean Goose, Greylag Goose, BrentGoose and Barnacle Goose), dabbling ducks (apart from Wigeon: Pintail, Shove-

The impact of repowering of wind farms on birds and bats
9
Table 2: Impacts of wind turbines on bird populations showing the number of studies with positi-ve or negative effects as revealed from literature (for details see text). The last columngives the result of sign tests (ns: not significant). Grey shading indicates predominatelynegative effects.
Breeding season Positive effect
Negative effect
Significance
Carrion/Hooded Crow Corvus corone 6 2 ns All Waders 30 53 0,016
Blackbird Turdus merula 6 4 ns
Oystercatcher Haematopus ostralegus 6 8 ns
White Wagtail Motacilla alba 4 4 ns
Blue Tit Parus caeruleus 4 3 ns
Whinchat Saxicola rubetra 2 7 ns
Chaffinch Fringilla coelebs 2 4 ns
Common Whitethroat Sylvia communis 8 5 ns Skylark Alauda arvensis 18 16 ns
Willow Warbler Phylloscopus trochilus 4 2 ns
Yellowhammer Emberiza citrinella 4 6 ns
Linnet Carduelis cannabina 3 6 ns
Northern Lapwing Vanellus vanellus 12 23 ns
Common Buzzard Buteo buteo 3 3 ns
Grey Partridge Perdix perdix 5 5 ns
Reed Bunting Emberiza schoeniclus 11 2 0,022
Redshank Tringa totanus 2 9 ns
Yellow Wagtail Motacilla flava 8 3 ns
Sedge Warbler Acrocephalus schoenobaenus 10 0 0,002
Stonechat Saxicola torquata 8 1 0,039 Mallard Anas platyrhynchos 7 6 ns
Marsh Warbler Acrocephalus palustris 7 4 ns
Reed Warbler Acrocephalus scirpaceus 7 1 ns
Black-tailed Godwit Limosa limosa 5 7 ns
Quail Coturnix coturnix 1 6 ns
Meadow Pipit Anthus pratensis 16 8 ns
Wren Troglodytes troglodytes 6 1 ns
Chiffchaff Phylloscopus collybita 4 2 ns
Outside breeding season Carrion/Hooded Crow Corvus corone 13 8 ns
Oystercatcher Haematopus ostralegus 4 3 ns
Common Snipe Gallinago gallinago 0 6 0,05
Skylark Alauda arvensis 5 2 ns
Geese 2 12 0,013
Golden Plover Pluvialis apricaria 8 23 0,012
Grey Heron Ardea cinerea 5 1 ns
Curlew Numenius arquata 13 19 ns
Dabbling Ducks (except Wigeon) 3 15 0,008
Northern Lapwing Vanellus vanellus 13 30 0,015 Black-headed Gull Larus ridibundus 15 5 0,041
Common Buzzard Buteo buteo 13 12 ns
Wigeon Anas penelope 0 9 0,004
Tufted Duck Aythya fuligula 2 6 ns
Wood Pigeon Columba palumbus 2 7 ns
Red Kite Milvus milvus 3 4 ns
Swans 2 6 ns
Herring Gull Larus argentatus 2 5 ns
Starling Sturnus vulgaris 17 6 0,035
Mallard Anas platyrhynchos 3 8 ns
Common Gull Larus canus 3 6 ns
Diving Ducks 2 12 0,013
Kestrel Falco tinnunculus 15 7 ns
Fieldfare Turdus pilaris 1 6 ns
The impact of repowering of wind farms on birds and bats
10
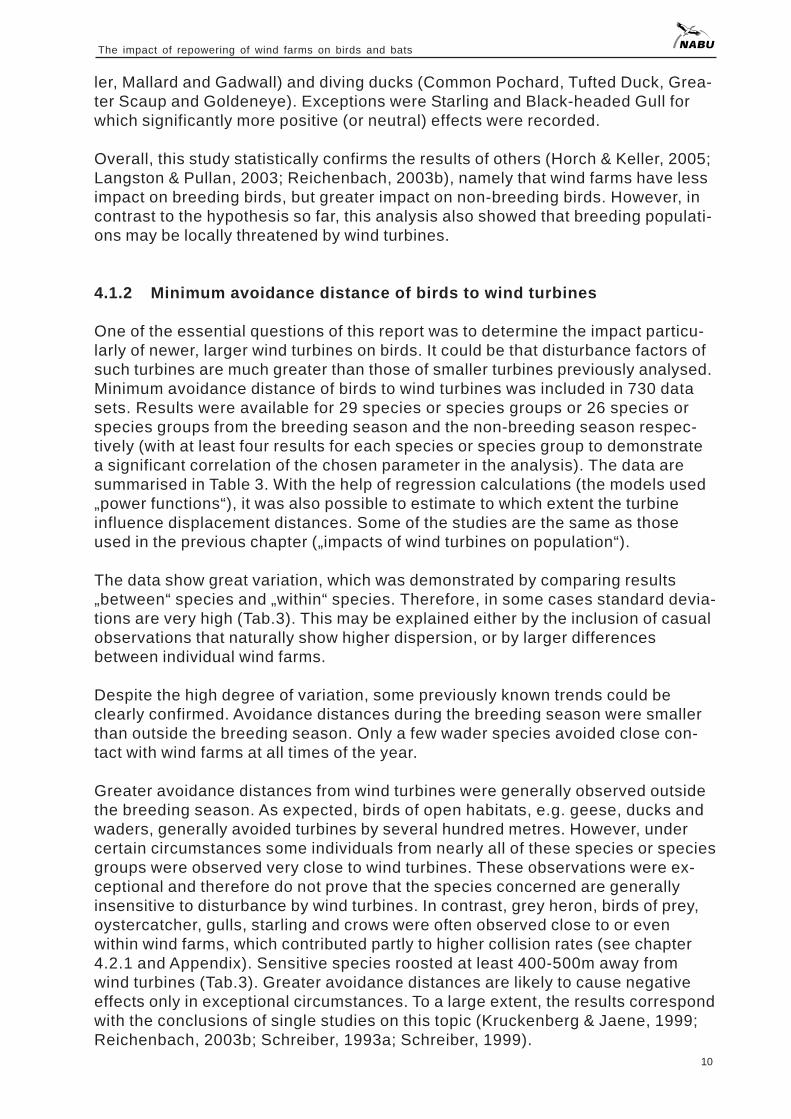
ler, Mallard and Gadwall) and diving ducks (Common Pochard, Tufted Duck, Grea-ter Scaup and Goldeneye). Exceptions were Starling and Black-headed Gull forwhich significantly more positive (or neutral) effects were recorded.
Overall, this study statistically confirms the results of others (Horch & Keller, 2005;Langston & Pullan, 2003; Reichenbach, 2003b), namely that wind farms have lessimpact on breeding birds, but greater impact on non-breeding birds. However, incontrast to the hypothesis so far, this analysis also showed that breeding populati-ons may be locally threatened by wind turbines.
4.1.2 Minimum avoidance distance of birds to wind turbines
One of the essential questions of this report was to determine the impact particu-larly of newer, larger wind turbines on birds. It could be that disturbance factors ofsuch turbines are much greater than those of smaller turbines previously analysed.Minimum avoidance distance of birds to wind turbines was included in 730 datasets. Results were available for 29 species or species groups or 26 species orspecies groups from the breeding season and the non-breeding season respec-tively (with at least four results for each species or species group to demonstratea significant correlation of the chosen parameter in the analysis). The data aresummarised in Table 3. With the help of regression calculations (the models used„power functions“), it was also possible to estimate to which extent the turbineinfluence displacement distances. Some of the studies are the same as thoseused in the previous chapter („impacts of wind turbines on population“).
The data show great variation, which was demonstrated by comparing results„between“ species and „within“ species. Therefore, in some cases standard devia-tions are very high (Tab.3). This may be explained either by the inclusion of casualobservations that naturally show higher dispersion, or by larger differencesbetween individual wind farms.
Despite the high degree of variation, some previously known trends could beclearly confirmed. Avoidance distances during the breeding season were smallerthan outside the breeding season. Only a few wader species avoided close con-tact with wind farms at all times of the year.
Greater avoidance distances from wind turbines were generally observed outsidethe breeding season. As expected, birds of open habitats, e.g. geese, ducks andwaders, generally avoided turbines by several hundred metres. However, undercertain circumstances some individuals from nearly all of these species or speciesgroups were observed very close to wind turbines. These observations were ex-ceptional and therefore do not prove that the species concerned are generallyinsensitive to disturbance by wind turbines. In contrast, grey heron, birds of prey,oystercatcher, gulls, starling and crows were often observed close to or evenwithin wind farms, which contributed partly to higher collision rates (see chapter4.2.1 and Appendix). Sensitive species roosted at least 400-500m away fromwind turbines (Tab.3). Greater avoidance distances are likely to cause negativeeffects only in exceptional circumstances. To a large extent, the results correspondwith the conclusions of single studies on this topic (Kruckenberg & Jaene, 1999;Reichenbach, 2003b; Schreiber, 1993a; Schreiber, 1999).

The impact of repowering of wind farms on birds and bats
11
Table 3: Minimum distances of different bird species from wind turbines according to differentliterature studies. The equations (minimum distance = coefficient * wind turbine height-exponent) demonstrate the relationship between the total height of wind turbines and theminimum distance of birds. Grey shading indicates cases where distance has increasedwith turbine height. SD: standard deviation. F: values of the variance-analyses in orderto verify the regression coefficients.
Breeding season Species n Median Mean SD Coefficient Exponent p F
Blackbird Turdus merula 5 100 82 76 108812 -0,2290 ns Oystercatcher Haematopus ostralegus 9 50 81 106 638,605 -0,7214 ns White Wagtail Motacilla alba 5 50 72 51 5324,82 -1,0720 ns Bluethroat Luscinia svecica 8 25 63 92 0,0004 2,5573 ns Curlew Numenius arquata 4 125 163 144 83000000 -3,3837 ns Whinchat Saxicola rubetra 5 125 155 60 125,073 0,0378 ns Common Whitethroat
Sylvia communis 12 70 75 57 852,679 -0,6752 ns
Skylark Alauda arvensis 26 105 120 116 3814,46 -0,9397 ns Finches 12 125 104 64 1659,37 -0,7498 ns Willow Warbler Phylloscopus trochilus 5 50 42 40 59,5263 -0,0269 ns Garden Warbler Sylvia borin 4 55 72 83 2179,7 -1,0076 ns Icterine Warbler Hippolais icterina 4 30 40 45 372,29 -0,6644 ns Yellowhammer Emberiza citrinella 6 85 89 58 149062 -1,6940 ns Corn Bunting Miliaria calandra 4 88 94 88 1773392 -2,3029 ns Linnet Carduelis cannabina 6 138 138 27 90,2427 0,0968 ns Northern Lapwing Vanellus vanellus 21 125 134 119 0,3942 1,1575 ns Grey Partridge Perdix perdix 4 100 125 96 9634801 -2,5701 ns Reed Bunting Emberiza schoeniclus 16 50 86 139 2614,95 -1,0739 ns Redshank Tringa totanus 6 188 183 111 1186,16 -0,4883 ns Yellow Wagtail Motacilla flava 11 50 111 141 501,227 -0,5251 ns Sedge Warbler
Acrocephalus schoenobaenus
10 25 45 76 0,4507 0,9194 ns
Stonechat Saxicola torquata 5 50 104 150 50852,4 -1,5484 ns Starling Sturnus vulgaris 4 75 71 62 4571,61 -1,0901 ns Mallard Anas platyrhynchos 10 113 133 123 29,6433 0,2527 ns Marsh Warbler Acrocephalus palustris 13 50 67 64 0,0032 2,1691 ns Reed Warbler Acrocephalus
scirpaceus 13 50 62 69 4288,03 -1,1862
ns
Black-tailed Godwit Limosa limosa 7 250 369 315 7826198 -2,3505 ns Meadow Pipit Anthus pratensis 13 50 82 100 1111,88 -0,7998 ns Wren Troglodytes troglodytes 5 50 90 96 0,0053 2,1329 ns Chiffchaff Phylloscopus collybita 5 50 42 40 59,5263 -0,0269 ns Non-breeding season Carrion/Hooded Crow
Corvus corone 17 0 77 139 5E-09 5,0093 0,033 5,66
Oystercatcher Haematopus ostralegus 6 15 55 81 3293811 -2,8716 ns Common Snipe Gallinago gallinago 6 325 394 199 911,611 -0,2126 ns Coot Fulica atra 4 138 136 99 1424,8 -0,6019 ns Curlew Numenius arquata 25 200 222 178 236,007 -0,1474 ns Skylark Alauda arvensis 6 0 38 59 0,0021 1,9466 ns Finches 14 45 58 59 1,6E-08 4,9391 <0,001 214,39
Geese 15 300 347 230 0,577 1,4018 ns Golden Plover Pluvialis apricaria 24 150 202 190 0,004 3,0760 <0,001 21,14
Grey Heron Ardea cinerea 7 60 120 170 3739,06 -1,0940 ns Northern Lapwing Vanellus vanellus 36 175 273 390 0,000055 3,4002 <0,001 30,66
Black-headed Gull Larus ridibundus 16 0 91 205 0,0114 1,7282 ns Common Buzzard Buteo buteo 17 100 76 93 0,6489 0,9307 ns Gulls 32 25 120 208 0,3189 1,0722 ns Wigeon Anas penelope 9 300 311 163 661,776 -0,2093 ns Wood Pigeon Columba palumbus 6 100 175 178 4,9E-08 4,7582 ns Swans 8 125 150 139 5,4086 0,6210 ns Herring Gull Larus argentatus 5 200 285 323 41,4305 0,2309 ns Starling Sturnus vulgaris 18 0 38 58 0,000033 2,9925 0,036 5,4
Mallard Anas platyrhynchos 9 200 161 139 1987,79 -0,8288 ns Common Gull Larus canus 7 100 118 139 2,1054 0,7213 ns Diving Ducks 12 213 219 122 111,351 0,0673 ns Kestrel Falco tinnunculus 16 0 36 53 2,2685 0,4728 ns

The impact of repowering of wind farms on birds and bats
12
When assessing the results, it should be remembered that some potentially sensi-tive species have still only been analysed rarely or not at all. This is particularly thecase for the more controversial species (storks, birds of prey, cranes and corncra-ke) and therefore the list of species sensitive to disturbance is not complete.
As mentioned above, wind farms vary greatly with regard to their impacts on birdpopulations. It appears that the size of the turbine is at least partly responsible forthese differences. The question of how turbine size affects minimum avoidancedistances of birds to turbines is also relevant to repowering.
For bird species for which minimum avoidance distances were observed at leastfour different wind farms (the minimum number needed to obtain a statisticallysignificant result), the relationship between turbine height and minimum avoidancedistance was calculated and is presented in Table 3. This report could for the firsttime (compared with the NABU-BfN report) also include substantially more datarelating to larger wind turbines.
Even though the remaining results presented in Tab. 3 are in most cases not stati-stically significant, overall this analysis still confirms other previous conclusions.Breeding birds were less disturbed by larger wind turbines than by smaller ones.21 out of 29 species tended to use habitat closer to larger turbines than smallerones. This was also the case for rather sensitive wader species, such as Black-tailed Godwit, Curlew and Redshank.
Outside the breeding season 16 out of 23 cases showed an increase in minimumavoidance distance with increased turbine size. For Lapwing, Golden Plover,Carrion Crow, Starling and Finches the results were statistically significant (Fig. 4-8).
In seven cases a negative correlation was noticeable, meaning that larger windturbines had a smaller displacement effect. This also applies to species or spe-cies groups, which are more sensitive to disturbance, such as Wigeon, CommonSnipe and Curlew.

The impact of repowering of wind farms on birds and bats
13
Figure 4: Relationship between minimumdistance kept by Lapwings from windturbines outside the breeding seasonin relation to total turbine height.
Figure 5: Relationship between minimumdistance kept by Golden Plover fromwind turbines outside the breedingseason in relation to total turbineheight.
Figure 6: Relationship between minimumdistance kept by Finches from windturbines outside the breeding seasonin relation to total turbine height.
Figure 7: Relationship between minimumdistance kept by Starling from windturbines outside the breeding seasonin relation to total turbine height.
Figure 8: Relationship between minimumdistance kept by Carrion/HopodedCrow from wind turbines outside thebreeding season in relation to totalturbine height.
Northern Lapwing
0100200300400500600700800900
0 20 40 60 80 100 120 140 160
turbine height (m)
avo
idan
ce d
ista
nce
(m
)
Golden Plower
0100200300400500600700800900
0 20 40 60 80 100 120
turbine height (m)
avo
idan
ce d
ista
nce
(m
)
Finches
0
20
40
60
80
100
120
140
0 20 40 60 80 100 120
turbine height (m)
avo
idan
ce d
ista
nce
(m
)
Starling
0
20
40
60
80
100
120
140
160
0 20 40 60 80 100 120 140
turbine height (m)
avo
idan
ce d
ista
nce
(m
)
Carrion/Hooded Crow
0
100
200
300
400
500
0 20 40 60 80 100 120 140
turbine height (m)
avo
idan
ce d
ista
nce
(m
)

The impact of repowering of wind farms on birds and bats
14
4.2 Collision of birds and bats with wind turbines4.2.1 Collision of birds with wind turbines
The NABU-BfN report included mainly observations available from the USA, so itwas possible for this report to add some studies from Europe, which had beengathered particularly at relatively large and new wind turbines. Data were onlyincluded in the analysis if there were regular controls and if account was taken ofthe likelihood that carcasses disappeared from the study area (Anderson et al.,1999; Morrison, 2002). The mortality rates of Grünkorn et al. (2005) do not coverthe whole year, but were still included in the analysis. Therefore, the data in Tab. 4tend to underestimate rather than overestimate actual collision rates.
Some wind farms were represented in several studies, so that the present datasets partly overlap with each other. To guarantee the independence of the datasets, each wind farm was included only once in the statistical analysis, using eitherthe most recent report, or that including the most extensive observations.
Collision rates varied greatly between different wind farms. For some wind farmsno collisions or nearly none occurred. At other wind farms, collisions occurred at afrequency of more than 60 per turbine per year. Mass collisions, similar to thoseknown from lighthouses or other buildings (Crawford & Engstrom, 2001; Ericksonet al., 2002; Manville, 2001; Ugoretz, 2001) could not be identified for individualturbines within wind farms. In most of the studies the casualty rate is one bird perturbine per year; the median was 1.8 and the mean 6.9 victims per turbine peryear.
Figure 9: Collision rates of birds with wind turbines at different wind farm sites in relation to totalturbine height.
0
10
20
30
40
50
60
70
0 50 100 150
turbine height (m)
coll
isis
on
s/tu
rbin
e/ye
ar
Normallandschaft
Gewässer
Gebirgsrücken
nomal landscape
waterbodies
mountain ridges

The impact of repowering of wind farms on birds and bats
15
Table 4: Collision rates birds (mean number of victims per turbine per year) at different windfarms.
Country Wind farm Habitat Collisions / Turbine / Year
Comments Source
Australia Tasmania Coast 1,86 Hydro Tasmania
Belgium Boudewijnkanaal te Brugge Wetland 35 Other studies in different years
Everaert et al., 2003
Belgium Elektriciteitscentrale te Schelle Wetland 18 Other studies in different years
Everaert et al., 2003
Belgium Gent Industrial 2 Everaert in litt
Belgium Kleine Pathoekeweg, Brugge Industrial 32 Everaert in litt
Belgium Kluizendok, Gent Industrial 8 Everaert in litt
Belgium Nieuwkapelle, Diksmuide Wet grassland 1 Everaert in litt
Belgium Oostdam te Zeebrugge Wetland 24 Other studies in different years
Everaert, Devos & Kuijken, 2003
Denmark Tjaereborg Wetland 3 Pedersen & Poulsen, 1991b
Germany Breklumer Koog Fields >7,5 Study period less than 1 year
Grünkorn et al, 2005
Germany Bremerhaven-Fischereihafen Wetland 9 Scherner, 1999b
Germany Friedrich-W ilhelm-Lübke-Koog Fields >2,6 Study period less than 1 year
Grünkorn et al, 2005
Germany Simonsberger Koog Fields >2,2 Study period less than 1 year
Grünkorn et al, 2005
Netherlands Kreekraak sluice Wetland 3,7 Musters et al., 1996
Netherlands Oosterbierum Grassland 1,8 Winkelman, 1992a
Netherlands Urk Coast 1,7 W inkelman, 1989
Austria Obersdorf Woodland edge, fields
1,49 Traxler et al., 2005
Austria Prellenkirchen Fields 13,93 Traxler et al., 2006
Austria Steinberg-Prinzendorf Woodland edge, fields
2,99 Traxler et al., 2004
Sweden Näsudden Grassland 0,7 Percival, 2000
Spain Alaiz-Echague Mountain ridges 3,56 Lekuona, 2001
Spain E3, Energia Eólica del Estrecho Mountain ridges 0,03 Barrios & Rodriguez, 2004; SEO, 1995
Spain El Perdón Mountain ridges 64,26 Lekuona, 2001
Spain Guennda Mountain ridges 8,47 Lekuona, 2001
Spain Izco-Albar Mountain ridges 22,63 Lekuona, 2001
Spain PESUR, Parque Eólico del Sur and
Mountain ridges 0,36 Barrios & Rodriguez, 2004;
Parque und Parque Eólico de SEO, 1995
Levantera Spain Salajones Mountain ridges 21,69 Lekuona, 2001
Spain Tarifa 0,03 Janss, 2000
UK Blyth Wetland 1,34 Still et al., 1996
UK Bryn Tytli Moor, grassland 0 Phillips, 1994
UK Burgar Hill, Orkney Moor, grassland 0,15 Percival, 2000
UK Cemmaes Moor, grassland 0,04 Percival, 2000
UK Haverigg, Cumbria Moor, grassland 0 Percival, 2000
UK Ovenden Moor Moor, grassland 0,04 Percival, 2000
USA Altamont Mountain ridges 0,87 Other studies in different years
Smallwood & Thelander, 2004
USA Buffalo Ridge Grassland 0,98 Other studies in different years
Erickson et al., 2001
USA Foote Creek Rim Prairie 1,75 Other studies in different years
Erickson et al., 2001
USA Green Mt, Searsburg Mountain ridges 0 Erickson et al., 2001
USA IDWGP, Algona Mountain ridges 0 Erickson et al., 2001
USA Mountaineer Mountain ridges 4,04 Kerns & Kerlinger, 2004
USA Nine Canyon W ind Project Prairie 3,59 Other studies in different years
Erickson et al., 2003
USA San Gorgino Mountain ridges 2,31 Erickson et al., 2001
USA Solano County Mountain ridges 54 Erickson et al., 2001
USA Somerset County Mountain ridges 0 Erickson et al., 2001
USA Top of Iowa Prairie 0,415 Koford et al., 2003
USA Vansycle Fields, grassland
0,63 Other studies in different years
Erickson et al., 2001

The impact of repowering of wind farms on birds and bats
16
One of the main emphases of this report was the issue of the extent to which colli-sion rates were dependent on turbine size. The worry was that relatively morebirds are killed by particularly large wind turbines than at smaller ones. Collisionrates correlate significantly with hub and total height (Fig. 9, Tab.5).
It is already know from previous analyses that collision rates were particularly highat certain locations, such as bare mountain ridges and water bodies. It was alsopossible to confirm these results in this report. Giving equal weight to „habitat“(category high risk: mountain ridges and water bodies; category low risk: otherhabitats) and „turbine height“, a GLM-analysis identified both habitat and turbineheight as significant (F1 = 7.96; p = 0.007) or nearly significant impact parameters(F1 = 3.37; p = 0.074), respectively. Wind farms located in low-risk „normal“ land-scapes show a relationship between collision rate and the size of wind turbines(Fig. 9) that is statistically significant (Tab.5). If considering the turbine size de-pendancy of bird casualties within the two habitat-types wetlands and normal land-scape, there was no significant result in either case.
In order to address the issue of what species are particularly affected by windturbines, the comprehensive statistical analyses of T. Dürr (Staatliche Vogel-schutzwarte Brandenburg) should be pointed out, and the latest version was inclu-ded in this report. The species composition of collision victims has not fundamen-tally changed. In Germany, birds of prey dominate with very high numbers of RedKites and White-tailed Eagles.
4.2.2 Collision of bats with wind farmsTable 5: The relationship between collision rates of birds and hub height, rotor diameter and
total height of wind turbines. In addition, the relationship between collision rates ofbirds and total turbine height in different habitat types is included.
It has been know for some time that bats can also be killed by wind turbines. Morerecent studies (Brinkmann & Schauer-Weisshahn, 2006) have improved the qualityof data. As for the NABU-BfN report, data were only analysed if the number ofvictims per turbine per year could be calculated. As with the bird analyses, ac-count was also taken of the possibility that bat carcasses could have been remo-ved by scavengers. Because bats were mainly killed in summer and early autumn,only observations from this time period were included. In order to ensure the inde-pendence of the data, only one value per wind farm was used, as for the bird ana-lyses.
Collision rates for bats (Tab.6) show even more variation than collision rates forbirds (Tab.4). Even though at many wind farms no bats or only a few were killed,
Type Parameter n R2 Regression equation F p
All data Hub height 43 0,110 Y = 0,0006 x 1,948 0,431 0,030 All data Rotor diameter 43 0,084 Y = 0,0007 x 1,966 3,75 0,06
All data Total height 43 0,105 Y = 0,0002 x 2,022 4,78 0,034 “Normal” landscape Total height 24 0,360 Y = 0,00000017 x 3,978 12,39 0,002
Wetlands Total height 8 0,167 Y = 0,0303 x 1,302 1,20 0,32 Mountain ridges Total height 11 0,146 Y = 0,0000032 x 3,240 1,53 0,25

The impact of repowering of wind farms on birds and bats
17
other wind farms showed high mortality rates. The results for 34 wind farms rangedbetween 0 and 134 victims (median: 6.4; mean: 13.3; standard deviation: 13.3 forkilled bats per turbine per year), and the highest rates exceed the highest rates forbirds.
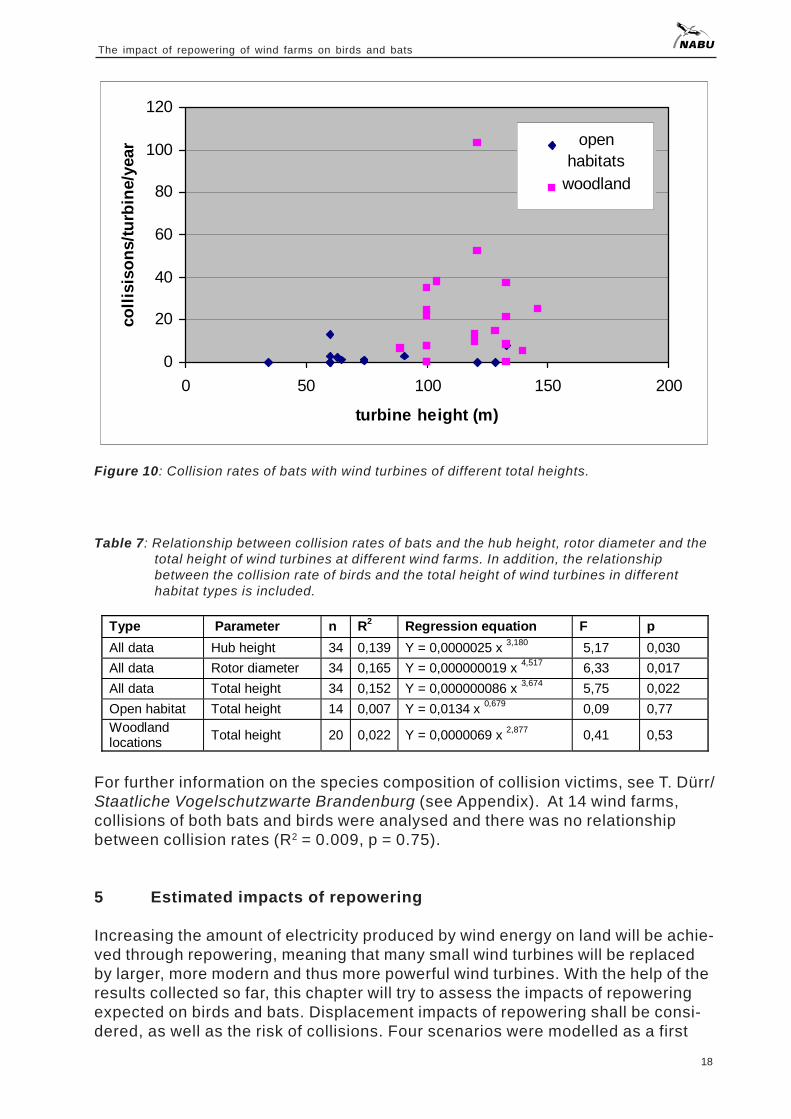
Furthermore, there was a statistically significant relationship between the numberof bats killed and hub height, rotor diameter and wind turbine height (Fig. 10, Tab.7). However, if one takes into account the fact that bats are killed more frequentlyat sites close to woodlands, then the influence of turbine size disappears. A GLM-analysis shows that the factor „habitat“ (woods and other habitats) had an almostsignificant influence on the collision rates (F
1 = 3.801; p = 0.06), while turbine
height showed no influence (F1 = 0.17; p = 0.69). Considering turbine height and
collision rates separately for sites close to woodlands and in other locations, thenno significant relationship is noticeable (Tab.7).
Table 6: Collision rates of bats (average number of victims per turbine per year) at different windfarms.
Country Windfarm Habitat Collisions / Turbine / Year
Source
Australia Tasmania Coast 1,86 Hydro Tasmania Germany Ettenheim Brudergarten 1 Woodland 35,18 Brinkmann & Schauer Weisshahn, 2005 Germany Ettenheim Brudergarten 2 Woodland 24,12 Brinkmann & Schauer Weisshahn, 2005 Germany
Ettenheim Brudergarten 3 Woodland/ windthrow
22,04 Brinkmann & Schauer Weisshahn, 2005
Germany Ettenheim Mahlberg 1 Windthrow 13,02 Brinkmann & Schauer Weisshahn, 2005 Germany Ettenheim Mahlberg 2 Woodland 9,62 Brinkmann & Schauer Weisshahn, 2005 Germany Ettenheim Mahlberg 3 Woodland 14,64 Brinkmann & Schauer Weisshahn, 2005 Germany Freiamt Hohe Eck Woodland 52,34 Brinkmann & Schauer Weisshahn, 2005 Germany Freiamt Schillinger Berg 1 Woodland 103,16 Brinkmann & Schauer Weisshahn, 2005 Germany Freiamt Schillinger Berg 2 Meadow 0 Brinkmann & Schauer Weisshahn, 2005 Germany Fürstenberg Meadow 0 Brinkmann & Schauer Weisshahn, 2005 Germany Horben Holzschlägermatte 1 Woodland 37,56 Brinkmann & Schauer Weisshahn, 2005 Germany Horben Holzschlägermatte 2 Woodland 8,02 Brinkmann & Schauer Weisshahn, 2005 Germany
Rosskopf Woodland, mountain ridges
21,5 Behr & Helversen, 2005
Germany Simonswald Plattenhöfe 2
Meadow/ woodland
7,59 Brinkmann & Schauer Weisshahn, 2005
Germany Simonswald Plattenhöfe 3
Meadow/ woodland
7,94 Brinkmann & Schauer Weisshahn, 2005
Germany Simonswald Plattenhöfe 4 Meadow 0 Brinkmann & Schauer Weisshahn, 2005 Germany
St. Peter Plattenhöfe 1 Meadow/ woodland
0 Brinkmann & Schauer Weisshahn, 2005
Austria Obersdorf
Woodland edge, fields
0 Traxler et al., 2005
Austria Prellenkirchen Fields 8 Traxler et al., 2005 Austria
Steinberg-Prinzendorf Woodland edge, fields
5,33 Traxler et al., 2005
Spain Alaiz-Echague Mountain ridges 0 Lekuona, 2001 Spain El Perdón Mountain ridges 0 Lekuona, 2001 Spain Guennda Mountain ridges 0 Lekuona, 2001 Spain Izco-Albar Mountain ridges 3,09 Lekuona, 2001 Spain Salajones Mountain ridges 13,36 Lekuona, 2001 USA Altamont Mountain ridges 0,0035 Smallwood & Thelander, 2004 USA Buffalo Ridge Grassland 2,3 Osborn et al., 1996 USA Foote Creek Rim Prairie 1,34 Young et al., 2003a USA Mautaineer Wind Energy Facility
Blackwater Falls Woodland 50 Boone, 2003
USA Meyersdale Woodland, mountain ridges
25 Kerns et al., 2005
USA Mountaineer Woodland, mountain ridges
38 Kerns & Kerlinger, 2004
USA Nine Canyon Wind Project Pairie 3,21 Erickson et al., 2003
USA Top of Iowa Woodland, mountain ridges
6,432 Koford et al., 2003
USA Vansycle Fields, grassland 0,4 Strickland et al., 2001b
The impact of repowering of wind farms on birds and bats
18
For further information on the species composition of collision victims, see T. Dürr/Staatliche Vogelschutzwarte Brandenburg (see Appendix). At 14 wind farms,collisions of both bats and birds were analysed and there was no relationshipbetween collision rates (R2 = 0.009, p = 0.75).
5 Estimated impacts of repowering
Increasing the amount of electricity produced by wind energy on land will be achie-ved through repowering, meaning that many small wind turbines will be replacedby larger, more modern and thus more powerful wind turbines. With the help of theresults collected so far, this chapter will try to assess the impacts of repoweringexpected on birds and bats. Displacement impacts of repowering shall be consi-dered, as well as the risk of collisions. Four scenarios were modelled as a first
Table 7: Relationship between collision rates of bats and the hub height, rotor diameter and thetotal height of wind turbines at different wind farms. In addition, the relationshipbetween the collision rate of birds and the total height of wind turbines in differenthabitat types is included.
Figure 10: Collision rates of bats with wind turbines of different total heights.
Type Parameter n R2 Regression equation F p
All data Hub height 34 0,139 Y = 0,0000025 x 3,180 5,17 0,030
All data Rotor diameter 34 0,165 Y = 0,000000019 x 4,517 6,33 0,017
All data Total height 34 0,152 Y = 0,000000086 x 3,674 5,75 0,022
Open habitat Total height 14 0,007 Y = 0,0134 x 0,679 0,09 0,77 Woodland locations Total height 20 0,022 Y = 0,0000069 x 2,877 0,41 0,53
0
20
40
60
80
100
120
0 50 100 150 200
turbine height (m)
coll
isis
on
s/tu
rbin
e/ye
ar Offenland
Wald
open habitats
woodland

The impact of repowering of wind farms on birds and bats
19
step towards understanding the impacts of repowering. Scenarios 1 and 2 assumethat 0.3 MW wind turbines are replaced by 1.5 MW and 2.0 MW turbines respec-tively, while in scenarios 3 and 4, 0.5 MW turbines are replaced by 1.5 MW and2.0 MW wind turbines respectively. For each scenario, the model simulates va-rious increases in capacity (ranging between no increase (factor 1) up to a five-times increase).
In order to assess impacts on birds and bats, first of all the expected turbineheight was calculated using the relationship between turbine capacity and height(see chapter 3).
5.1 Repowering and disturbance of birds
The relationship between total turbine height and minimum distances birds arefound from turbines, combined with the relationship between turbine height andcapacity, allows the effects of repowering on the spatial distribution of birds to beestimated. Hence, the following simple hypotheses are assumed:
1 No birds use the area within the radius of the minimum distance (disturbancearea); outside this radius turbines have no effect.
2 Scenarios consider single, standalone wind turbines. Because wind farmsvary greatly in layout, effects cannot be generalised. The effect of layout mustbe considered separately for each wind farm.
Impacts can only be estimated by comparing the size of the disturbed areas. Forexample, at one wind farm 20 x 0.3MW wind turbines shall be replaced by 8 x1.5MW turbines. The capacity of the wind farm increases by a factor of 2. Therepowering has a negative effect for a bird species, if the sum of the disturbancefactors from 8 x 1.5MW wind turbines is bigger than the sum of disturbance factorsfrom 20 x 0.3MW turbines.
The disturbance influence radii of wind turbines of different heights can be calcula-ted using the data in Table 3. Examples of model calculations are summarised inTable 8. The results of the different scenarios are not substantially different fromeach other. In most cases breeding birds reacted positively to repowering, whilevisiting birds showed a variable picture in which repowering had a negative effecton sensitive species, such as geese, Golden Plover and Lapwing.

The impact of repowering of wind farms on birds and bats
20
Table 8: Estimates of disturbance factors for birds after repowering, using model calculationsunder different scenarios. Positive (+) means a smaller area of disturbance, whilenegative (-) means a larger area of disturbance after repowering. See text for moredetails.
Breeding season; Scenario: 0,3 MW to 1,5 MW
Species Increase in output (factors): 1 1,5 2 2,5 3 3,5 4 4,5 5 Oystercatcher Haematopus ostralegus + + + + + + + + + White Wagtail Motacilla alba + + + + + + + + + Bluethroat Luscinia svecica - - - - - - - - - Curlew Numenius arquata + + + + + + + + + Whinchat Saxicola rubetra + + + + + + + + - Common Whitethroat
Sylvia communis + + + + + + + + +
Skylark Alauda arvensis + + + + + + + + + Finches + + + + + + + + + Willow Warbler Phylloscopus trochilus + + + + + + + + + Garden Warbler Sylvia borin + + + + + + + + + Icterine Warbler Hippolais icterina + + + + + + + + + Yellowhammer Emberiza citrinella + + + + + + + + + Corn Bunting Miliaria calandra + + + + + + + + + Linnet Carduelis cannabina + + + + + + + - - Northern Lapwing Vanellus vanellus + - - - - - - - - Grey Partridge Perdix perdix + + + + + + + + + Reed Bunting Emberiza schoeniclus + + + + + + + + + Redshank Tringa totanus + + + + + + + + + Yellow Wagtail Motacilla flava + + + + + + + + + Sedge Warbler Acrocephalus schoenobaenus + + - - - - - - - Stonechat Saxicola torquata + + + + + + + + + Starling Sturnus vulgaris + + + + + + + + + Mallard Anas platyrhynchos + + + + + + - - - Marsh warbler Acrocephalus palustris - - - - - - - - - Reed warbler Acrocephalus scirpaceus + + + + + + + + + Black-tailed godwit Limosa limosa + + + + + + + + + Meadow pipit Anthus pratensis + + + + + + + + + Wren Troglodytes troglodytes - - - - - - - - - Chiffchaff Phylloscopus collybita + + + + + + + + +
Outside the breeding season; Scenario: 0,3 MW to 1,5 MW
Species Increase in output (factors): 1 1,5 2 2,5 3 3,5 4 4,5 5 Carrion/Hooded Crow
Corvus corone - - - - - - - - -
Blackbird Turdus merula + + + + + + + + + Oystercatcher Haematopus ostralegus + + + + + + + + + Common Snipe Gallinago gallinago + + + + + + + + + Coot Fulica atra + + + + + + + + + Curlew Numenius arquata + + + + + + + + + Chaffinch Fringilla coelebs - - - - - - - - - Skylark Alauda arvensis - - - - - - - - - Finches - - - - - - - - - Geese - - - - - - - - - Golden Plover Pluvialis apricaria - - - - - - - - - Grey Heron Ardea cinerea + + + + + + + + + Northern Lapwing Vanellus vanellus - - - - - - - - - Black-headed Gull Larus ridibundus - - - - - - - - - Common Buzzard Buteo buteo + + - - - - - - - Gulls + - - - - - - - - Wigeon Anas penelope + + + + + + + + + Wood Pigeon Columba palumbus - - - - - - - - - Swans + + + - - - - - - Herring Gull Larus argentatus + + + + + + - - - Starling Sturnus vulgaris - - - - - - - - - Mallard Anas platyrhynchos + + + + + + + + + Common Gull Larus canus + + + - - - - - - Diving Ducks + + + + + + + + - Kestrel Falco tinnunculus + + + + - - - - -

The impact of repowering of wind farms on birds and bats
21
Breeding season; Scenario: 0,3 MW to 2,0 MW
Species Increase in output (factors):
1 1,5 2 2,5 3 3,5 4 4,5 5
Oystercatcher Haematopus ostralegus + + + + + + + + + White Wagtail Motacilla alba + + + + + + + + + Bluethroat Luscinia svecica - - - - - - - - - Curlew Numenius arquata + + + + + + + + + Whinchat Saxicola rubetra + + + + + + + + + Common Whitethroat
Sylvia communis + + + + + + + + +
Skylark Alauda arvensis + + + + + + + + + Finches + + + + + + + + + Willow Warbler Phylloscopus trochilus + + + + + + + + + Garden Warbler Sylvia borin + + + + + + + + + Icterine Warbler Hippolais icterina + + + + + + + + + Yellowhammer Emberiza citrinella + + + + + + + + + Corn Bunting Miliaria calandra + + + + + + + + + Linnet Carduelis cannabina + + + + + + + + + Northern Lapwing Vanellus vanellus + - - - - - - - - Grey Partridge Perdix perdix + + + + + + + + + Reed Bunting Emberiza schoeniclus + + + + + + + + + Redshank Tringa totanus + + + + + + + + + Yellow Wagtail Motacilla flava + + + + + + + + +
Sedge Warbler Acrocephalus schoenobaenus
+ + - - - - - - -
Stonechat Saxicola torquata + + + + + + + + + Starling Sturnus vulgaris + + + + + + + + + Mallard Anas platyrhynchos + + + + + + + + - Marsh Warbler Acrocephalus palustris - - - - - - - - - Reed Warbler Acrocephalus scirpaceus + + + + + + + + + Black-tailed Godwit Limosa limosa + + + + + + + + + Meadow Pipit Anthus pratensis + + + + + + + + + Wren Troglodytes troglodytes - - - - - - - - - Chiffchaff Phylloscopus collybita + + + + + + + + +
Outside the breeding season; scenario: 0,3 MW to 2,0 MW
Species Increase in output (factors): 1 1,5 2 2,5 3 3,5 4 4,5 5 Carrion/Hooded Crow
Corvus corone - - - - - - - - -
Blackbird Turdus merula + + + + + + + + + Oystercatcher Haematopus ostralegus + + + + + + + + + Common Snipe Gallinago gallinago + + + + + + + + + Coot Fulica atra + + + + + + + + + Curlew Numenius arquata + + + + + + + + + Chaffinch Fringilla coelebs - - - - - - - - - Skylark Alauda arvensis - - - - - - - - - Finches - - - - - - - - - Geese - - - - - - - - - Golden Plover Pluvialis apricaria - - - - - - - - - Grey Heron Ardea cinerea + + + + + + + + + Northern Lapwing Vanellus vanellus - - - - - - - - - Black-headed Gull Larus ridibundus - - - - - - - - - Common Buzzard Buteo buteo + + - - - - - - - Gulls + - - - - - - - - Wigeon Anas penelope + + + + + + + + + Wood Pigeon Columba palumbus - - - - - - - - - Swans + + + + - - - - - Herring Gull Larus argentatus + + + + + + + + - Starling Sturnus vulgaris - - - - - - - - - Mallard Anas platyrhynchos + + + + + + + + + Common Gull Larus canus + + + - - - - - - Diving Ducks + + + + + + + + + Kestrel Falco tinnunculus + + + + + - - - -

The impact of repowering of wind farms on birds and bats
22
Breeding season; scenario: 0,5 MW to 1,5 MW
Species Increase in output (factors): 1 1,5 2 2,5 3 3,5 4 4,5 5 Oystercatcher Haematopus ostralegus + + + + + + + + + White Wagtail Motacilla alba + + + + + + + + + Bluethroat Luscinia svecica - - - - - - - - - Curlew Numenius arquata + + + + + + + + + Whinchat Saxicola rubetra + + + + - - - - - Common Whitethroat
Sylvia communis + + + + + + + + +
Skylark Alauda arvensis + + + + + + + + + Finches + + + + + + + + + Willow Warbler Phylloscopus trochilus + + + + + - - - - Garden Warbler Sylvia borin + + + + + + + + + Icterine Warbler Hippolais icterina + + + + + + + + + Yellowhammer Emberiza citrinella + + + + + + + + + Corn Bunting Miliaria calandra + + + + + + + + + Linnet Carduelis cannabina + + + + - - - - - Northern Lapwing Vanellus vanellus + - - - - - - - - Grey Partridge Perdix perdix + + + + + + + + + Reed Bunting Emberiza schoeniclus + + + + + + + + + Redshank Tringa totanus + + + + + + + - - Yellow Wagtail Motacilla flava + + + + + + + + - Sedge Warbler Acrocephalus schoenobaenus + - - - - - - - - Stonechat Saxicola torquata + + + + + + + + + Starling Sturnus vulgaris + + + + + + + + + Mallard Anas platyrhynchos + + + - - - - - - Marsh Warbler Acrocephalus palustris - - - - - - - - - Reed Warbler Acrocephalus scirpaceus + + + + + + + + + Black-tailed Godwit Limosa limosa + + + + + + + + + Meadow Pipit Anthus pratensis + + + + + + + + + Wren Troglodytes troglodytes - - - - - - - - - Chiffchaff Phylloscopus collybita + + + + + - - - -
Outside the breeding season; scenario: 0,5 MW to 1,5 MW
Species Increase in output (factors): 1 1,5 2 2,5 3 3,5 4 4,5 5 Carrion/Hooded Crow
Corvus corone - - - - - - - - -
Blackbird Turdus merula + + + + + + - - - Oystercatcher Haematopus ostralegus + + + + + + + + + Common Snipe Gallinago gallinago + + + + + + - - - Coot Fulica atra + + + + + + + + - Curlew Numenius arquata + + + + + - - - - Chaffinch Fringilla coelebs - - - - - - - - - Skylark Alauda arvensis - - - - - - - - - Finches - - - - - - - - - Geese + - - - - - - - - Golden Plover Pluvialis apricaria - - - - - - - - - Grey Heron Ardea cinerea + + + + + + + + + Northern Lapwing Vanellus vanellus - - - - - - - - - Black-headed Gull Larus ridibundus + + - - - - - - - Common Buzzard Buteo buteo + - - - - - - - - Gulls + - - - - - - - - Wigeon Anas penelope + + + + + + - - - Wood Pigeon Columba palumbus - - - - - - - - - Swans + + - - - - - - - Herring Gull Larus argentatus + + + - - - - - - Starling Sturnus vulgaris - - - - - - - - - Mallard Anas platyrhynchos + + + + + + + + + Common Gull Larus canus + - - - - - - - - Diving Ducks + + + + - - - - - Kestrel Falco tinnunculus + + + - - - - - -

The impact of repowering of wind farms on birds and bats
23
Breeding season; scenario: 0,5 MW to 2,0 MW
Species Increase in output (factors): 1 1,5 2 2,5 3 3,5 4 4,5 5 Oystercatcher Haematopus ostralegus + + + + + + + + + White Wagtail Motacilla alba + + + + + + + + + Bluethroat Luscinia svecica - - - - - - - - - Curlew Numenius arquata + + + + + + + + + Whinchat Saxicola rubetra + + + + + + - - - Common Whitethroat
Sylvia communis + + + + + + + + +
Skylark Alauda arvensis + + + + + + + + + Finches + + + + + + + + + Willow Warbler Phylloscopus trochilus + + + + + + + + + Garden Warbler Sylvia borin + + + + + + + + + Icterine Warbler Hippolais icterina + + + + + + + + + Yellowhammer Emberiza citrinella + + + + + + + + + Corn Bunting Miliaria calandra + + + + + + + + + Linnet Carduelis cannabina + + + + + + - - - Northern Lapwing Vanellus vanellus + - - - - - - - - Grey Partridge Perdix perdix + + + + + + + + + Reed Bunting Emberiza schoeniclus + + + + + + + + + Redshank Tringa totanus + + + + + + + + + Yellow Wagtail Motacilla flava + + + + + + + + + Sedge Warbler Acrocephalus schoenobaenus + + - - - - - - - Stonechat Saxicola torquata + + + + + + + + + Starling Sturnus vulgaris + + + + + + + + + Mallard Anas platyrhynchos + + + + + - - - - Marsh Warbler Acrocephalus palustris - - - - - - - - - Reed Warbler Acrocephalus scirpaceus + + + + + + + + + Black-tailed Godwit Limosa limosa + + + + + + + + + Meadow Pipit Anthus pratensis + + + + + + + + + Wren Troglodytes troglodytes - - - - - - - - - Chiffchaff Phylloscopus collybita + + + + + + + + +
Outside the breeding season; scenario: 0,5 MW to 2,0 MW
Species Increase in output (factors): 1 1,5 2 2,5 3 3,5 4 4,5 5 Carrion/Hooded Crow
Corvus corone - - - - - - - - -
Blackbird Turdus merula + + + + + + + + + Oystercatcher Haematopus ostralegus + + + + + + + + + Common Snipe Gallinago gallinago + + + + + + + + + Coot Fulica atra + + + + + + + + + Curlew Numenius arquata + + + + + + + + - Chaffinch Fringilla coelebs - - - - - - - - - Skylark Alauda arvensis - - - - - - - - - Finches - - - - - - - - - Geese - - - - - - - - - Golden Plover Pluvialis apricaria - - - - - - - - - Grey Heron Ardea cinerea + + + + + + + + + Northern Lapwing Vanellus vanellus - - - - - - - - - Black-headed Gull Larus ridibundus - - - - - - - - - Common Buzzard Buteo buteo + + - - - - - - - Gulls + - - - - - - - - Wigeon Anas penelope + + + + + + + + + Wood Pigeon Columba palumbus - - - - - - - - - Swans + + - - - - - - - Herring Gull Larus argentatus + + + + + - - - - Starling Sturnus vulgaris - - - - - - - - - Mallard Anas platyrhynchos + + + + + + + + + Common Gull Larus canus + + - - - - - - - Diving Ducks + + + + + + - - - Kestrel Falco tinnunculus + + + - - - - - -

The impact of repowering of wind farms on birds and bats
24
5.2 Repowering and collisions of birds and bats
Following a similar procedure to that in the previous section it is possible to calcu-late collision rates for the different scenarios, using the relationship between windturbine capacity and turbine height, and turbine height and collision rates. Theestimates presented in Tab. 9 are for wind turbines in „normal“ landscape. Asshown in chapter 4.2, considerably higher collision rates of birds and bats wouldoccur at wind farms located close to water bodies or woodlands, respectively. Inboth habitats, no wind farms should be installed or replaced by repowering andtherefore these habitats were not considered further.
The results of modelling show that in all cases repowering has a negative impacton birds – larger wind turbines have higher collision rates than smaller ones (seealso chapter 4.2).
Bats show a different picture. The relationship between wind turbine height andthe number of casualties is very weak. The extent to which repowering has animpact depends on the factor by which the power capacity is increased. Up to adoubling in capacity, casualties should be less, while larger increases in capacitywould result in increased mortality rates.
Table 9: Assessment of collision rates of birds and bats following repowering using model calcu-lations. Positive impacts (+) mean a reduced collision risk while negative impacts (-)indicate increased risk. For more details see text.
Scenario 1 1,5 2 2,5 3 3,5 4 4,5 5 0,3 MW to 1,5 MW - - - - - - - - - 0,3 MW to 2,0 MW - - - - - - - - - 0,5 MW to 1,5 MW - - - - - - - - - 0,5 MW to 2,0 MW - - - - - - - - -
Changes in collision rates of birds with increased wind farm output (factors)
Scenario 1 1,5 2 2,5 3 3,5 4 4,5 5 0,3 MW to 1,5 MW + + + - - - - - - 0,3 MW to 2,0 MW + + + - - - - - - 0,5 MW to 1,5 MW + + - - - - - - - 0,5 MW to 2,0 MW + + - - - - - - -
Changes in collision rates of bats with increased wind farm output (factors)
Collision rates of birds
Collision rates of bats

The impact of repowering of wind farms on birds and bats
25
6 Discussion and research requirements
Newly published results regarding the issue of birds, bats and wind farms allow abetter understanding of the impacts of larger, more modern wind turbines, whichcould not be considered previously (e.g. NABU-BfN report (Hötker et al. 2005)).Many previous results were confirmed by this study. It seems that wind turbineshave a small impact on breeding birds, apart from particularly sensitive species(waders). However, there is still not much data available to show how other poten-tially sensitive species, or species of particular nature conservation interest (e.g.large birds and most bird of prey) react to wind turbines.
Wind turbines displace birds from their resting and feeding areas outside thebreeding season. This has been confirmed for ducks, geese and some waderspecies. No new findings have been published regarding minimum displacementdistances of birds from wind turbines. Starling and finches, but not Lapwings,showed a significant relationship between turbine height and avoidance distance.The new generation of wind turbines does not have a more disturbing effect onbreeding birds than smaller less powerful turbines. This is due to the fact thatincreases in energy efficiency are proportionally greater than increases in turbinesize alone. Among other things, birds, in particular breeding birds, seem to bedisplaced less by larger turbines than by smaller or middle-sized ones, in contrastto visiting birds, which were more sensitive to larger wind turbines. There was nochange to the list of species previously classified as sensitive; the comprehensivecase studies were confirmed. However, the particular noticeable results of Brandtet al. (2005b) at the Wybelsumer Polder are in strong contrast to other publicati-ons. Unfortunately, the presentation of data in that report did not allow a furtheranalysis and could not be included in the database.
With respect to collision rates, the assumption that the choice of the wind farm sitehas a significant influence on the impacts of wind turbines was confirmed. Highcasualty rates for birds occur at wind farms on bare mountain ridges and waterbodies, and close to woodlands for bats. Mass mortalities were still not reportedfor migrating birds. Taking into account the influence of habitat, it can be shownthat a clear relationship exists for birds between turbine height and collision rate.A wind turbine 100m high is responsible on average for five bird casualties peryear. Despite the better data, no statistically significant relationship between turbi-ne height and mortality rate for bats could be found. Habitat choice is the domi-nant influence for bats.
Most of the results used in this report are based on only a small number of studies:this applies to avoidance distances as well as to collision rates, and thereforefurther research is necessary to confirm the results to date. In particular, no datahas been published so far which studies the collision rates at large wind turbinesat well-known migration hotspots. The numerous existing wind farms in Schleswig-Holstein on migration routes could help to determine whether wind farms have animpact on migrating birds.
Studies analysing the behaviour of large birds particularly birds of prey at windfarms are urgently needed. Birds of prey are strongly affected (see Appendix) andin Germany Red Kites and White-tailed Eagles have especially high number of

The impact of repowering of wind farms on birds and bats
26
casualties. Using either automatic recording equipment or targeted observations,it should be possible to determine the situations in which these species are parti-cularly threatened, and thus the collision rates of red kites and sea eagles couldhopefully be reduced in the long term.
As there are many wind farms in Schleswig-Holstein, particularly on the grazingmarshes at the west coast, it is necessary to study the extent to which the pres-ence of wind farms may already have influenced the habitats of species occupyingthese areas.
7 Acknowledgements
For supporting our work with discussions and encouragement, for courteouslyproviding data and literature as well as other help, we would like to thank: UlrichBrandt, Tobias Dürr, Joris Everaert, Berd Hälterlein, Gunnar Hannebeck, HeikeJeromin, Ismene Mertens, Rowena Lanston and Kai-Michael Thomsen. We thankNatural England (Contract SAE03-02-124) for the financial support of the translati-on.
8 Summary
The impact of repowering of wind farms on birds and bats
The references used by Hötker et al. (2005) in the NABU-BfN report and 45 newstudies were analysed in order better to assess the impacts of large, more mo-dern wind turbines on both birds and bats.
This analysis basically confirmed the results of the NABU-BfN report. Wind turbi-nes have small impacts on breeding birds, apart from waders, which were signifi-cantly displaced by wind turbines during the breeding season. However, windturbines have very large impacts on migrant birds outside the breeding seasonand for ducks, geese and some other waders species a displacement effect couldstatistically be proven.
Estimates of avoidance distances of larger wind turbines have not changed as aresult of this analysis. Birds of open habitats (especially ducks, geese and somewaders species) in most cases kept an avoidance distance of several hundredmetres from wind turbines. Lapwing, Golden Plover, Carrion Crow, Starling andfinches showed significant relationships between turbine height and avoidancedistance outside the breeding season. During the breeding season, however, itwas not possible to determine whether new generation wind turbines have greaterdisturbance effects than smaller, less powerful turbines.
Collision rates for birds and bats depend on the choice of wind farm site. Windfarms located close to water bodies or bare mountain ridges were responsible forsignificantly more bird casualties than others, while wind farms located close towoodlands showed high collision rates for bats. Collision rates at these sensitivesites were many times higher than at other less sensitive sites, so that, for examp-

The impact of repowering of wind farms on birds and bats
27
le, at some wind turbines more than 100 bats were killed per year. Taking habitatchoice into account, there was a significant relationship between collision risk andwind turbine height for birds, but not for bats.
With regard to repowering, the results imply that possible disturbance effects needto be assessed differently, depending on the range of bird species occurring on aparticular wind farm site. For most breeding birds repowering has a positive ef-fect, while outside the breeding season further species-specific evaluations arenecessary, as repowering might increase the collision risk for some birds. If thecapacity of a wind turbine is more than doubled, then collision rates for batsshould also increase. The differences are, however, minor.
This report also identifies gaps in knowledge, as well as future research require-ments.
9 References
Ahlén, I. (2002). Fladdermöss och fåglar dödade av vindkraftverk. Fauna och Flora, 97, 14-21.
Albouy, S., Clément, D., Jonard, A., Massé, P., Pagès, J.-M., & Neau, P. (1997). Suiviornithologique du parc éolien de Porte-la-Nouvelle (Aude) - Rapport final. ABIES,LPO, Gardouch.
Albouy, S., Dubois, Y., & Picq, H. (2001). Suivi ornithologique des parcs éoliens du plateaude Garrigue Haute (Aude) - Rapport final. ABIES, LPO, Gardouch.
Anderson, R.L., Strickland, M.D., Tom, J., Neumann, N., Erickson, W.P., Cleckler, J.,Mayorga, G., Nuhn, G., Leuders, A., Schneider, J., Backus, L., Becker, P., & Flagg, N.(2000). Avian Monotoring and Risk Assessment at Tehachapi Pass and SanGorgonio Pass Wind Resource Areas, California. In: Proceedings of National Avian -Wind Power Planning Meeting III (ed PNAWPPM-III), pp. 31-46. Prepared for theAvian Subcommittee of the National Wind Coordinating Committee by LGL Ltd., KingCity, Ont., San Diego, California.
Bach, L. (2001). Fledermäuse und Windenergienutzung - reale Probleme oder Einbildung?Vogelkundliche Berichte aus Niedersachsen, 33, 119-124.
Bach, L. (2002). Auswirkungen von Windenergieanlagen auf das Verhalten von Fledermäu-sen am Beispiel des Windparks „Hohe Geest“, Midlum. Bericht der Arbeitsgemein-schaft zur Förderung angewandter biologischer Forschung im Auftrag der KWMidlum GmbH & Co. KG, Freiburg, Niederelbe.
Bach, L., Handke, K., & Sinning, F. (1999). Einfluss von Windenergieanlagen auf die Ver-teilung von Brut- und Rastvögeln in Nordwest-Deutschland. Bremer Beiträge fürNaturkunde und Naturschutz, 4, 107-122.
Bach, L. & Rahmel, U. (2004). Überblick zu Auswirkungen von Windkraftanalgen auf Fle-dermäuse - eine Konfliktabschätzung. Bremer Beiträge für Naturkunde und Natur-schutz, 7, 245-252.
Barrios, L. & Rodriguez, A. (2004). Behavioural and environmental correlates of soaringbird mortality at on-shore wind turbines. Journal of Applied Ecology, 41, 72-81.
Behr, O. & Helversen, O.V. (2005). Gutachten zur Beeinträchtigung im freien Luftraumjagender und ziehender Fledermäuse durch bestehende Windkraftanlagen -Wirkungskontrolle zum Windpark „Rosskopf“ (Freiburg i. Br.). Univ. Erlangen-Nürnberg, Inst. für Zoologie.

The impact of repowering of wind farms on birds and bats
28
Bergen, F. (2001a). Untersuchungen zum Einfluss der Errichtung und des Betriebs vonWindenergieanlagen auf Vögel im Binnenland. Ph D thesis, Ruhr Universität,Bochum.
Bergen, F. (2001b). Windkraftanlagen und Frühjahrsdurchzug des Kiebitz (Vanellusvanellus): eine Vorher/Nacher-Studie an einem traditionellen Rastplatz in Nordrhein-Westfalen. Vogelkundliche Berichte aus Niedersachsen, 33, 89-96.
Bergen, F., ed. (2002a). Einfluss von Windenergieanlagen auf die Raum-Zeitnutzung vonGreifvögeln, pp 86-96. Technische Universität Berlin, Berlin.
Bergen, F., ed. (2002b). Windkraftanlagen und Frühjahrsdurchzug des Kiebitz (Vanellusvanellus): eine Vorher-Nachher-Studie an einem traditionellen Rastplatz in Nord-rhein-Westfalen, pp 77-85. Technische Universität Berlin, Berlin.
Bergh, L.M.J.v.d., Spaans, A.L., & Swelm, N.D.v. (2002). Lijnopstellingen van windturbinesgeen barrière voor voedselvluchten van meeuwens en sterns in de broedtijd. Limosa,75, 25-32.
Boone, D. (2003). Bat kill at West Virginia windplant, Maryland.Böttger, M., Clemens, T., Grote, G., Hartmann, G., Hartwig, E., Lammen, C., Vauk-Hentzelt,
E., & Vauk, G., eds. (1990). Biologisch-Ökologische Begleituntersuchungen zum Bauund Betrieb von Windkraftanlagen. NNA.
Brandt, U., Butenschön, S., Denker, E., & Ratzbor, G. (2005a). Brütend unterm Windrad -Entwicklung eines national bedeutsamen Brutvogelbiotops am Dollart.
Brandt, U., Butenschön, S., Denker, E. & Ratzbor, G. (2005b). Rast am Rotor - Gastvogel-Monitoring im und am Windpark Wybelsumer Polder. UVP-Report 19: 170 - 174.
Brauneis, W. (1999). Der Einfluss von Windkraftanlagen auf die Avifauna am Beispiel der„Solzer Höhe“ bei Bebra-Solz im Landkreis Hersfeld-Rotenburg. Untersuchung imAuftrag des Bundes für Umwelt und Naturschutz (BUND) Landesverband Hessen e.V.- Ortsverband Alheim-Rotenburg-Bebra, Bebra.
Brauneis, W. (2000). Der Einfluss von Windkraftanlagen (WKA) auf die Avifuna, dargestelltinsb. am Beispiel des Kranichs Grus grus. Ornithologische Mitteilungen, 52, 410-415.
Brinkmann, R. & Schauer-Weisshahn, H. (2006). Untersuchungen zu möglichen betriebs-bedingten Auswirkungen von Windkraftanlagen auf Fledermäusse im Regierungsbe-zirk Freiburg. Regierunspräsidium Freiburg, Stiftung Naturschutzfonds Baden-Würtemberg, Grundelfingen.
Clemens, T. & Lammen, C. (1995). Windkraftanlagen und Rastplätze von Küstenvögeln -ein Nutzungskonflikt. Seevögel, 16, 34-38.
Crawford, R.L. & Engstrom, R.T. (2001). Characteristics of avian mortality at a northFlorida television tower: a 29-year study. Journal of Field Ornithology, 72, 380-388.
De Lucas, M., Janss, G.F.E., & Ferrer, M. (2004). The effects of a wind farm on birds in amigration point: the Strait of Gibraltar. Biodiversity and Conservation, 13, 395-407.
Dulas Engineering Ltd (1995). The Mynydd y Cemmaes windfarm impact study. Vol. IID -Ecological impact - final report. ETSU report: W/13/00300/REP2D.
EAS (1997). Ovenden Moor Ornithological Monitoring. Report to Yorkshire Windpower.Keighly: Ecological Advisory Service.
Erickson, W., Johnson, G., Young, D., Strickland, D., Good, R., Bourassa, M., Bay, K., &Sernka, K.J. (2002). Synthesis and comparison of baseline avian and bat use, raptornesting and mortality information from proposed and existing wind developments.Report for Bonneville Power Administration, Portland, Oregon.
Erickson, W., Kronner, K., & Gritski, B. (2003). Nine Canyon Wind Power Project. Avianand Bat Monitoring Report. September 2002 - August 2003. Prepared for NineCanyon Technical Advisory Committee by West, Inc., Cheyenne.

The impact of repowering of wind farms on birds and bats
29
Everaert, J. (2003). Collision victims on 3 wind farms in Flanders (Belgium) in 2002.Instituut voor Naturbeheer, Brussel.
Everaert, J., Devos, K., & Kuijken, E. (2002). Windturbines en vogels in Vlaanderen, Rep.No. 2002.3. Instituut voor Natuurbehoud, Brussels.
Everaert, J. & Stienen, E.W.M. (2006). Impact of wind turbines on birds in Zeebrugge(Belgium) - Significant effects on breeding tern colony due to collisions. Biodiversityand Conservation, in press.
Fernandez-Duque, E. & Valeggia, C. (1994). Meta-analysis: a valuable tool in conservationresearch. Conservation Biology, 8, 555-561.
Förster, F. (2003). Windkraft und Fledermausschutz in der Oberlausitz. In: Kommen dieVögel und Fledermäuse unter die (Wind)räder?, Dresden, 17.-18.11.2003.
Gerjets, D. (1999). Annäherung wiesenbrütender Vögel an Windkraftanalagen - Ergebnis-se einer Brutvogeluntersuchung im Nahbereich des Windparks Drochtersen. BremerBeiträge für Naturkunde und Naturschutz, 4, 49-52.
Gharadjedaghi, B. & Ehrlinger, M. (2001). Auswirkungen des Windparks bei Nitzschka(Lkr. Altenburger Land) auf die Vogelfauna. Landschaftspflege und Naturschutz inThüringen, 38, 73-83.
Grünkorn, T., Diederichs, A., Stahl, B., Poszig, D., & Nehls, G. (2005). Entwicklung einerMethode zur Abschätzung des Kollisionsrisikos von Vögeln an Windenergieanlagen.Bio Consult SH im Auftrag des Landesamts für Natur und Umwelt Schleswig Holst-ein, Hockensbüll.
Guillemette, M. & Larsen, J.K. (2002). Postdevelopment experiments to detectanthropogenic disturbances: the case of sea ducks and wind parks. EcologicalApplications, 12, 868-877.
Guillemette, M., Larsen, J.K., & Clausanger, I. (1999). Assessing the impact of the TunøKnob wind park on sea ducks: the influence of the food ressources, Rep. No.Technical Report No. 263. National Environmental Research Institute, Denmark.
Hall, L.S. & Richards, G.C. (1962). Notes on Tadarida australis (Chiroptera: molossidae).Australian Mammology, 1, 46.
Handke, K., Adena, J., Handke, P., & Sprötge, M. (2004a). Einfluss von Windenergiean-lagen auf die Verteilung ausgewählter Brut- und Rastvogelarten in einem Bereich derKrummhörn (Jennelt/Ostfriesland). Bremer Beiträge für Naturkunde und Naturschutz,7, 47-58.
Handke, K., Adena, J., Handke, P., & Sprötge, M. (2004b). Räumliche Verteilung ausge-wählter Brut- und Rastvogelarten in Bezug auf vorhandene Windenergieanlagen ineinem Bereich der küstennahen Krummhörn. Bremer Beiträge für Naturkunde undNaturschutz, 7, 11-44.
Handke, K., Adena, J., Handke, P., & Sprötge, M. (2004c). Untersuchungen an ausgewähl-ten Brutvogelarten nach Errichtung eines Windparks im Bereich der Stader Geest(Landkreis Rotenburg/Wümme und Stade). Bremer Beiträge für Naturkunde undNaturschutz, 7, 69-75.
Handke, K., Adena, J., Handke, P., & Sprötge, M. (2004d). Untersuchungen zum Vorkom-men von Kiebitz (Vanellus vanellus) und Großem Brachvogel (Numenius arquata) vorund nach Errichtung. Bremer Beiträge für Naturkunde und Naturschutz, 7, 61-66.
Horch, P. & Keller, V. (2005). Windkraftanlagen und Vögel - ein Konflikt? Eine Literatur-recherche. Schweizerische Vogelwarte Sempach, Sempach.
Hormann, M. (2000). Schwarzstorch - Ciconia nigra. In Avifauna von Hessen, 4. Lieferung.HGON.
Hötker, H., Thomsen, K.-M., & Köster, H. (2005). Auswirkungen regenerativer Energie-gewinnung auf die biologische Vielfalt am Beispiel der Vögel und der Fledermäuse.Bundesamt für Naturschutz, BfN-Skripten 142, Bad Godesberg.

The impact of repowering of wind farms on birds and bats
30
Hydro Tasmania. Bird and bat monitoring. Hydro Tasmania.Isselbächer, K. & Isselbächer, T. (2001). Vogelschutz und Windenergie in Rheinland-Pfalz,
Oppenheim.Janss, G. (2000). Bird Behaviour In and Near a Wind Farm at Tarifa, Spain: Management
Considerations. In: Proceedings of National Avian - Wind Power Planning Meeting III(ed PNAWPPM-III), pp. 110-114. Prepared for the Avian Subcommittee of the Natio-nal Wind Coordinating Committee by LGL Ltd., King City, Ont., San Diego,California.
Johnson, G.D. (2002). What is known and not known about impacts on bats? In:Proceedings of the Avian Interactions with Wind Power Structures, October 16-17,2002 (in press), Jackson Hole, Wyoming.
Johnson, G.D., Erickson, W.P., Strickland, D.M., Shepherd, M.F., Shepherd, D.A., &Sarappo, S.A. (2003). Mortality of Bats at a Large-scale Wind Power Developmentat Buffalo Ridge, Minnesota. Am. Midl. Nat., 150, 332-342.
Johnson, G.D., Young, D.P., Erickson, W.P., Derby, C.E., Strickland, M.D., & Good, R.E.(2000). Wildlife monitoring studies Sea West Windpower Project, Carbon County,Wyoming. Western EcoSystems Technology, Inc., Cheyenne.
Kaatz, J. (2000). Untersuchungen zur Avifauna im Bereich des Windparks Badeleben imBördekreis - Standort- und zeitbezogene Habitatnutzung von Brut- und Rastvögeln imPrä-Post-Test-Verfahren. IHU Geologie und Analytik, Neuruppin.
Kaatz, J., ed. (2002). Artenzusammensetzung und Dominanzverhältnisse einerHeckenbütergemeinschaft im Windfeld Nackel, pp 113-124. Technische UniversitätBerlin, Berlin.
Kerlinger, P. (2000). An Assessment of the Impacts of Green Mountain PowerCorporation’s Searsburg, Vermont, Wind Power Facility on Breeding and MigratingBirds. In: Proceedings of National Avian - Wind Power Planning Meeting III (edPNAWPPM-III), pp. 90-96. Prepared for the Avian Subcommittee of the NationalWind Coordinating Committee by LGL Ltd., King City, Ont., San Diego, California.
Kerns, J., Erickson, W.P., & Arnett, E.B. (2005). Bat and bird fatality at wind energyfacilities in Pennsylvania and West Virginia. In: Relationship between bats and windturbines in Pennsylvania and West Virginia: an assessment of bat fatality searchprotocols, patterns of fatality, and behavioral interactions with wind turbines. A finalreport submitted to the Bats and Wind Energy Cooperative. (ed E.B. Arnett), pp. 24-95. Bat conservation International, Austin, Texas (cited in Brinkmann & Schauer-Weisshahn 2006).
Ketzenberg, C., Exo, K.-M., Reichenbach, M., & Castor, M. (2002). Einfluss vonWindenergieanlagen auf brütende Wiesenvögel. Natur und Landschaft, 77, 144-153.
Koford, R., Jain, A., Zenner, G., & Hancock, A. (2003). Avian mortality associated with theTop of Iowa Wind Farm. Progress Report Calendar Year 2003. Iowa State University,Ames.
Koop, B. (1997). Vogelzug und Windenergieplanung. Beispiele für Auswirkungen aus demKreis Plön (Schlewsig-Holstein). Naturschutz und Landschaftsplanung, 29, 202-207.
Koop, B. (1999) Windkraftanlagen und Vogelzug im Kreis Plön. Bremer Beiträge für Natur-kunde und Naturschutz, 4, 25-32.
Korn, M. & Scherner, R. (2000). Raumnutzung von Feldlerchen (Alauda arvensis) in einemWindpark. Natur und Landschaft, 75, 74-75.
Kowallik, C. & Borbach-Jaene, J. (2001). Windräder als Vogelscheuchen? - Über denEinfluss der Windkraftnutzung in Gänserastgebieten an der nordwestdeutchen Küste.Vogelkundliche Berichte aus Niedersachsen, 33, 97-102.

The impact of repowering of wind farms on birds and bats
31
Kruckenberg, H. & Borbach-Jaene, J. (2001). Auswirkungen eines Windparks auf dieRaumnutzung nahrungssuchender Blessgänse - Ergebnisse aus einemMonitoringprojekt mit Hinweisen auf ökoethologischen Forschungsbedarf.Vogelkundliche Berichte aus Niedersachsen, 33, 103-109.
Kruckenberg, H. & Jaene, J. (1999). Zum Einfluss eines Windparks auf die Verteilungweidender Bläßgänse im Rheiderland (Landkreis Leer, Niedersachsen). Natur undLandschaft, 74, 420-427.
Langston, R.W.H. & Pullan, J.D. (2003). Wind farms and birds: an analysis of the effects ofwind farms on birds, and guidance on environmental assessment criteria and siteselection issues. Report written by BirdLife International on behalf of the BernConvention, Sandy.
Leddy, K.L., Higgins, K.F., & Naugle, D.E. (1999). Effects of wind turbines on uplandnesting birds in Conservation Reserve Program grasslands. Wilson Bulletin, 111,100-104.
Lekuona, J.M. (2001). Uso del espacio por la avifauna y control de la mortalidad de aves ymurciélagos en los parques eólicos de Navarra durante un ciclo anual. DireccionGeneral de Medio Ambiente, Gobierno de Navarra, Pamplona.
Lucas, M.d., Janss, G.F.E., & Ferrer, M. (2005). A bird and small mammal BACI and IGdesign studies in a wind farm in Malpica (Spain). Biodiversity and Conservation, 14,3289-3303.
Manville, A.M. (2001). Communication Towers, Wind Generators, and Research: AvianConservation Concerns. In: Proceedings of National Avian - Wind Power PlanningMeeting IV (ed PNAWPPM-IV), pp. 152-159. Prepared for the Avian Subcommitteeof the National Wind Coordinating Committee by RESOLVE, Inc., Washington, D.C.,Susan Savitt Schwartz, Carmel, California.
Meek, E.R., Ribbands, J.B., Christer, W.G., Davey, P.R., & Higginson, I. (1993). The effectsof aero-generators on moorland bird populations in the Orkney Islands, Scotland.Bird Study, 40, 140-143.
Menzel, C. (2002). Rebhuhn und Rabenkrähe im Bereich von Windkraftanlagen im nieder-sächsischen Binnenland, pp 97-112. Technische Universität Berlin, Berlin.
Menzel, C. & Pohlmeier, K. (1999). Indirekter Raumnutzungsnachweis verschiedenerNiederwildarten mit Hilfe von Losungsstangen („dropping marker“) in Gebieten mitWinkraftanlagen. Z. Jagdwiss., 45, 223-229.
Musters, C.J.M., Noordervliet, M.A.W., & Keurs, W.J.T. (1996). Bird casualities caused bya wind energy project in an estuary. Bird Study, 43, 124-126.
Orloff, S. & Flannery, A. (1996). A continued examination of avian mortality in the AltamontPass Wind Ressource Area. California Energy Commission, Sacramento; Bio-Systems Analysis, Inc., Santa Cruz, California.
Osborn, R.G., Higgins, K.F., Dieter, C.D., & Usgaard, R.E. (1996). Bat collisions with windturbines in Southwest Minnesota. Bat Research News, 37, 105-108.
Pedersen, M.B. & Poulsen, E. (1991). Impact of a 90m/2 MW wind turbine on birds. Avianresponses to the implementation of the Tjaereborg Wind Turbine at the DanishWadden Sea. Dansk Vildtundersogelser Kalø, 47.
Percival, S.M. (2000). Birds and wind turbines in Britain. British Wildlife, 12, 8-15.Petersen, I.K., Clausager, I., & Christensen, T.K. (2004). Bird numbers and distribution in
the Horns Rev offshore wind farm area. NERI - report.Phillips, J.F. (1994). The effects of a windfarm on the upland breeding bird communities of
Bryn Titli, Mid Wales: 1993-1994. Royal Society for the Protection of Birds, TheWelsh Office, Bryn Aderyn, The Bank, Newtown, Powys.

The impact of repowering of wind farms on birds and bats
32
Reichenbach, M. (2002). Windenergie und Wiesenvögel - wie empfindlich sind dieOffenlandbrüter?, pp 52-76. Technische Universität Berlin, Berlin.
Reichenbach, M. (2003a). Auswirkungen von Windenergieanlagen auf Vögel - Ausmaßund planerische Bewältigung, Technische Universität Berlin, Berlin.
Reichenbach, M. (2003b). Windenergie und Vögel - Ausmaß und planerische Bewältigung.Dissertation, Technische Universität, Berlin.
Reichenbach, M. & Schadek, U. (2003). Langzeituntersuchungen zum Konfliktthema„Windkraft und Vögel“. 2. Zwischenbericht. Unveröffentlichtes Gutachten im Auftragdes Bundesverbandes Windenergie.
Reichenbach, M. & Sinning, F. (2003). Empfindlichkeiten ausgewählter Vogelarten gegen-über Windenergieanlagen - Ausmaß und planerische Bewältigung. In: Kommen dieVögel und Fledermäuse unter die (Wind)räder?, Dresden, 17.-18.11.2003.
Reichenbach, M. & Steinborn, H. (2006). Langzeituntersuchungen zum Konfliktthema„Windkraft und Vögel“. ARSU GmbH, Oldenburg.
Sachslehner, L. & Kollar, H.P. (1997). Vogelschutz und Windkraftanlagen in Wien. StadtWien, Wien.
Scherner, E.R. (1999). Windkraftanlagen und „wertgebende Vogelbestände“ beiBremerhaven: Realität und Realsatire? Beträge zur Naturkunde Niedersachsens, 52,121-156.
Schmidt, E., Piaggio, A.J., Bock, C.E., & Armstrong, D.M. (2003). National WindTechnology Center Site Environmental Assessment: Bird and Bat Use and Fatalities -Final Report; Period of Perfomance: April 23, 2001 - December 31, 2002. NREL/SR-500-32981.
Schreiber, M. (1992). Rastvögel und deren Habitatwahl im Bereich „Westermarsch“ (Land-kreis Aurich) im Jahr 1992. Unveröff. Gutachten im Auftrag der Ingenieurs-gemeinschaft agwa.
Schreiber, M. (1993a). Windkraftanlagen und Watvogel-Rastplätze - Störungen undRastzplatzwahl von Brachvogel und Goldregenpfeifer. Naturschutz und Landschafts-planung, 25, 133-139.
Schreiber, M. (1993b). Zum Einfluß von Störungen auf die Rastplatzwahl von Watvögeln.Informationsd. Natursch. Nieders., 13, 161-169.
Schreiber, M. (1999). Windkraftanalagen als Störungsquelle für Gastvögel am Beispiel vonBlessgans (Anser albifrons) und Lachmöwe (Larus ridibundus). Bremer Beiträge fürNaturkunde und Naturschutz, 4, 39-48.
Schreiber, M.(2002). Einfluss von Windenergieanlagen auf Rastvögel und Konsequenzenfür EU-Vogelschutzgebiete, Technische Universität Berlin, Berlin.
SEO (1995). Effects of wind turbine power plants on the Avifauna in the Campo deGibraltar region, Rep. No. Report to the Environmental Ageny. Sociedad Espanolade Ornitologia SEO.
SGS Environment (1994). Haverigg windfarm ornithological monitoring programme.Report to Windcluster LTD.
Sinning, F. (1999). Ergebnisse von Brut- und Rastvogeluntersuchungen im Bereich desJade-Windparks und DEWI-Testfelds in Wilhelmshaven. Bremer Beiträge für Natur-kunde und Naturschutz, 4, 61-70.
Sinning, F. (2004a). Bestandsentwicklung von Kiebitz (Vanellus vanellus), Rebhuhn,(Perdix perdix) und Wachtel (Coturnix coturnix) im Windpark Lahn (Niedersachsen,Lkrs. Emsland) - Ergebnisse eine 6-jährigen Untersuchung. Bremer Beiträge fürNaturkunde und Naturschutz, 7, 97-103.

The impact of repowering of wind farms on birds and bats
33
Sinning, F. (2004b). Kurzbeitrag zum Vorkommen der Grauammer (Miliaria calandra) undweiterer ausgewählter Arten an Gehölzreihen im Windpark Mallnow (Brandenburg,Landkreis Märkisch Oderland). Bremer Beiträge für Naturkunde und Naturschutz, 7,193-196.
Sinning, F. (2004c). Kurzbeitrag zum Vorkommen des Schwarzkehlchens (Saxicolatorquata) und weiterer ausgewählter Arten in zwei norddeutschen Windparks (Nieder-sachen, Landkreise Ammerland, Leer und Stade). Bremer Beiträge für Naturkundeund Naturschutz, 7, 199-203.
Sinning, F. & Bruyn, U.d. (2004). Raumnutzung eines Windparks durch die Vögel währendder Zugzeit - Ergebnisse einer Zugvogel- Untersuchung im Windpark Wehrder(Niedersachsen, Landkreis Wesermarsch). Bremer Beiträge für Naturkunde undNaturschutz, 7, 157-179.
Sinning, F. & Gerjets, D. (1999). Untersuchungen zu Annäherung rastender Vögel in Wind-parks in Nordwestdeutschland. Bremer Beiträge für Naturkunde und Naturschutz, 4,53-59.
Sinning, F., Sprötge, M., & Bruyn, U.d. (2004). Veränderung der Brut-und Rastvogelfaunanach Errichtung des Windparks Abens-Nord (Niedersachsen,Landkreis Wittmund).Bremer Beiträge für Naturkunde und Naturschutz, 7, 77-91.
Smallwood, K.S. & Thelander, C.G. (2004). Developing methods to reduce bird mortality inthe Altamont Pass Wind Ressource Area. Final report by BioResource Consultants tothe California Energy Commission.
Sommerhage, M. (1997). Verhaltensweisen ausgesuchter Vogelarten gegenüber Wind-kraftanlagen auf der Vaßbecker Hochfläche (Landkreis Waldeck-Frankenberg).Vogelkundliche Hefte Edertal, 23, 104-109.
Steiof, K., Becker, J., & Rathgeber, J. (2002). Ornithologische Stellungnahme zur Erweite-rung der Windenergieanlage bei Mildenberg (Kreis Oberhavel, Land Brandenburg).Gutachten im Auftrag der Windenergie Wenger-Rosenau GmbH, Berlin.
Still, D., Little, B., & Lawrence, E.S. (1996). The effect of wind turbines on the birdpopulation at Blyth Harbour, Northumberland. ETSU W/13/00394/REP.
Strickland, M.D., Johnson, G., Erickson, W.P., & Kronner, K. (2001). Avian Studies at WindPlants Located at Buffalo Ridge, Minnesota and Vansycle Ridge, Oregon. In:Proceedings of National Avian - Wind Power Planning Meeting IV (ed PNAWPPM-IV), pp. 38-52. Prepared for the Avian Subcommittee of the National WindCoordinating Committee by RESOLVE, Inc., Washington, D.C., Susan SavittSchwartz, Carmel, California.
Stübing, S. & Bohle, H.W. (2001). Untersuchungen zum Einfluss von Windenergieanalgenauf Brutvögel im Vogelsberg (Mittelhessen). Vogelkundliche Berichte aus Nieder-sachsen, 33, 111-118.
Thelander, C.G. & Rugge, L. (2000). Avian risk behavior and fatalities at the Altamont WindResource Area, March 1998 to February 1999. NREL/SR-500-27545.
Thelander, C.G., Smallwood, K.S., & Rugge, L. (2003). Bird risk behaviors and fatalities atthe Altamont Pass Wind Resource Area. Period of performance: March 1998 -December 2000. NREL/SR-500-33829.
Trapp, H., Fabian, D., Förster, F., & Zinke, O. (2002). Fledermausverluste in einem Wind-park. Naturschutzarbeit in Sachsen, 44, 53-56.
Traxler, A., Wegleiter, S., & Jaklitsch, H. (2004). Vogelschlag, Meideverhalten & Habitat-nutzung an bestehenden Windkraftanlagen Prellenkirchen - Obersdorf - Steinberg/Prinzendorf. Biome, Gerasdorf.

The impact of repowering of wind farms on birds and bats
34
Ugoretz, S. (2001). Avian Mortalities at Tall Structures. In: Proceedings of National Avian -Wind Power Planning Meeting IV (ed PNAWPPM-IV), pp. 165-166. Prepared for theAvian Subcommittee of the National Wind Coordinating Committee by RESOLVE,Inc., Washington, D.C., Susan Savitt Schwartz, Carmel, California.
van der Winden, J., Spaans, A.L., & Dirksen, S. (1999). Nocturnal collision risks of localwintering birds with wind turbines in wetlands. Bremer Beiträge für Naturkunde undNaturschutz, 4, 33-38.
Vierhaus, H. (2000). Neues von unseren Fledermäusen. ABU Info, 24, 58-60.Walter, G. & Brux, H. (1999). Erste Ergebnisse eines dreijährigen Brut- und
Gastvogelmonitorings (1994-1997) im Einzugsbereich von zwei Windparks im Land-kreis Cuxhaven. Bremer Beiträge für Naturkunde und Naturschutz, 4, 81-106.
Winkelman, J.E. (1989). Vogels in het windpark nabij Urk (NOP): aanvaringsslachtoffers enverstoring van pleisternde eenden, ganzen en zwanen. RIN-rapport 89/15, Arnhem.
Winkelman, J.E. (1992a). De invloed van de Sepproef Windcentrale te Oosterbierum (Fr.)op vogels. 1: aanvaringsslachtoffers. DLO Instituut voor Bos- en Natuuronderzoek(Hrsg.), Arnhem.
Winkelman, J.E. (1992b). De invloed van de Sep-proefwindcentrale te Oosterbierum (Fr.)op vogels, 4: verstoring. RIN-rapport92/5, Arnhem.
Young, D.P., Erickson, W.P., Good, R.E., Strickland, M.D., & Johnson, G.D. (2003a). Avianand bat mortality associated with the initial phase of the Foote Creek Rim Wind-power project, Carbon County, Wyoming. Final report. Western EcoSystemsTechnology, Inc., Wyoming.
Young, D.P., Erickson, W.P., Strickland, M.D., Good, R.E., & Sernka, K.J. (2003b).Comparison of avian responses to UV-light-reflective paint on wind turbines. WesternEcoSystems Technology, NREL/SR-500-32840, Cheyenne.

The impact of repowering of wind farms on birds and bats
35
10 Appendix
Bird casualties at wind turbines in Germany and casualties of bats at wind turbi-nes worldwide. Total of findings since 1989 (intensive search since 2002). Datafrom the central card index of the state bird protection office in the Landesumwelt-amt (state environment department) Brandenburg. Compiled by : Tobias Dürr, asof 16.10.2006.

The impact of repowering of wind farms on birds and bats
36
Bird casualties at wind turbines in Germany Data from the central card index of the state bird protection office
In the Landesumweltamt (state environment department) Brandenburg Compiled by: Tobias Dürr; as of: 16. October 2006
State/Land Tot.
Species BB ST SN TH MV SH NI HB NW HE SL BW Gavia stellata Red-throated Diver 1 1 Phalacrocorax carbo
Cormorant 2 2
Ciconia ciconia White Stork 4 3 1 1 9
Ciconia nigra Black Stork 1 1
Cygnus cygnus Whooper Swan 1 1
Cygnus olor Mute Swan 2 1 1 1 5 10
Anser anser Greylag Goose 1 1
Anser fabalis Bean Goose 1 1
Anser albifrons White-fronted Goose 1 1
Anser fabalis / albifrons
Bean-/White-fronted Goose 1 1 2
Branta leucopsis Barnacle Goose 6 6
Tadorna tadorna Shelduck 1 1
Anas crecca Teal 1 1 Anas platyrhynchos
Mallard 3 1 6 1 2 13
Anas clypeata Shoveler 1 1
Aythya fuligula Tufted Duck 1 1 Haliaeetus albicilla
White-tailed Eagle 4 2 9 8 1 24
Milvus milvus Red Kite 33 22 8 3 1 2 1 6 76
Milvus migrans Black Kite 6 1 7
Accipiter gentilis Goshawk 2 1 3
Accipiter nisus Sparrowhawk 1 1 2
Buteo buteo Common Buzzard 37 14 3 2 1 4 1 1 1 64
Buteo lagopus Rough-legged Buzzard
1 1
Circus aeruginosus
Marsh Harrier 1 1
Circus pygargus Montagu’s Harrier 1 1
Falco subbuteo Hobby 2 2
Falco columbarius Merlin 1 1
Falco tinnunculus Kestrel 7 7 1 1 16 Falconiformes spp.
Raptor spp.. 1 1
Perdix perdix Grey Partridge 1 1 Phasianus colchicus Pheasant 1 1 1 1 4
Fulica atra Coot 3 1 4 Haematopus ostralegus
Oystercatcher 2 1 3
Pluvialis apricaria Golden Plover 2 8 10
Vanellus vanellus Northern Lapwing 3 3 Gallinago gallinago
Common Snipe 1 1
Larus ridibundus Black-headed Gull 4 12 2 2 20
Larus argentatus Herring Gull 12 2 1 15
Larus fuscus Lesser Black-backed Gull
1 1
Larus canus Common Gull 3 6 2 2 13
Chlidonias niger Black Tern 1 1
Uria aalge Guillemot 1 1 Columba livia f. domestica Feral Pigeon 14 1 2 17
Columba oenas Stock Dove 3 3 Columba palumbus
Wood Pigeon 14 2 16
Tyto alba Barn Owl 1 1
Asio otus Long-eared Owl 1 1
Asio flammea Short-eared Owl 2 2
Bubo bubo Eagle Owl 2 3 1 6
Cuculus canorus Cuckoo 1 1
Apus apus Swift 11 2 1 1 2 17
Apus melba Alpine Swift 1 1
Apus spec. Swift sp. 1 1
Picus viridis Green Woodpecker 1 1
Dendrocopus major
Great Spotted Woodpecker 1 1
Nonpasseriformes spec.
1 1

The impact of repowering of wind farms on birds and bats
37
State/Land Tot. Species BB ST SN TH MV SH NI HB NW HE SL BW Alauda arvensis Skylark 19 3 22
Lullula arborea Woodlark 1 1 Eremophila alpestris
Shorelark 1 1
Anthus trivalis Tree Pipit 1 1
Hirundo rustica Barn Swallow 3 1 4
Delichon urbica House Martin 3 3 6
Motacilla alba White Wagtail 1 1
Motacilla flava Yellow Wagtail 1 1 Troglodytes troglodytes Wren 1 1
Acrocephalus palustris
Sedge Warbler 1 1
Hippolais polyglotta
Melodious Warbler 1 1
Sylvia curruca Lesser Whitethroat 1 1
Sylvia atricapilla Common Whitethroat 2 2
Regulus regulus Goldcrest 2 1 1 4 Regulus ignicapillus Firecrest 1 1
Regulus spec. Goldcrest/Firecrest. 1 1 Ficedula hypoleuca Pied Flycatcher 3 3
Saxicola rubetra Whinchat 1 1 Erithacus rubecula
Robin 2 2
Turdus pilaris Fieldfare 1 1 2 Turdus philomelos
Song Thrush 1 1
Turdus iliacus Redwing 1 1
Turdus merula Blackbird 2 1 3
Parus major Great Tit 1 1 Emberiza calandra Corn Bunting 13 13
Emberiza citrinella Yellowhammer 6 1 7
Carduelis chloris Greenfinch 2 2 Carduelis flavirostris
Twite 1 1
Fringilla coelebs Chaffinch 2 1 1 4
Passer montanus Tree Sparrow 2 2 Passer domesticus
House Sparrow 1 1
Sturnus vulgaris Starling 11 1 1 1 3 17
Lanius collurio Red-backed Shrike 1 1 Garrulus glandarius Jay 2 2
Pica pica Magpie 1 1
Corvus corax Raven 10 10 Corvus frugilegus
Rook 1 1
Corvus corone Carrion/Hooded crow 6 1 7
Corvus spec. Crow spp. 1 1 2
257 61 20 14 17 80 26 14 9 9 1 11 517
BB = Brandenburg, ST = Sachsen-Anhalt, SN = Sachsen, TH = Thüringen, MVP = Mecklenburg-Vorpommern, SH = Schleswig-Holstein, NI = Niedersachsen, HB = Hansesatdt Bremen, NW = Nordrhein-Westfalen, HE = Hessen, SL = Saarland, BW = Baden-Württemberg

Ba
t c
as
ua
ltie
s a
t w
ind
tu
rbin
es
Co
mp
iled
by:
To
bia
s D
ürr
, La
nd
esu
mw
elta
mt B
ran
de
nb
urg
-R
ef.
Ö2
/ S
taa
tlic
he
Vo
ge
lsch
utz
wa
rte
, Bu
cko
we
r D
orf
stra
ße
34
, D-1
47
15
Ne
nn
ha
u (
as
of
22
Se
pte
mb
er
20
06
) e
-ma
il:
tors
ten
.la
ng
ge
ma
ch@
lua
.bra
nd
en
bu
rg.d
e; F
AX
: 03
38
78
-60
60
0
BB
= B
ran
de
nb
urg
, S
T =
Sa
chse
n-A
nh
alt
, S
N =
Sa
chse
n,
TH
= T
hü
rin
ge
n,
MV
= M
eck
len
bu
rg-V
orp
om
me
rn,
SH
= S
chle
swig
-Ho
lste
in,
NI
= N
ied
ers
ach
sen
,N
W =
No
rdrh
ein
-We
stfa
len
, R
P =
Rh
ein
lan
d-P
falz
, H
E =
He
sse
n,
BW
= B
ad
en
-Wü
rtte
mb
erg
, S
L =
Sa
arl
an
d,
BY
= B
aye
rn;
ES
P =
Sp
ain
, P
OR
= P
ort
ug
al,
A =
Au
stri
a,
FR
A =
Fra
nce
, S
WE
= S
we
de
n,
US
A =
Un
ite
d S
tate
s o
f A
me
rica
, A
US
= A
ust
ralia
Sp
ecie
s
BB
ST
SN
TH
MV
SH
NI
NW
RP
HE
BW
SL
BY
D g
es.
Nyc
talu
s n
oct
ula
No
ctul
e11
02
294
65
31
160
Nyc
taul
s la
sio
pte
rus
Gre
ater
No
ctul
e0
N. l
eisl
erii
Lei
sler
’s B
at9
23
13
1634
Ep
tesi
cus
sero
tin
usS
ero
tine
63
12
113
E. n
ilsso
nii
No
rthe
rn B
at1
1
Ves
per
tilio
dis
colo
rP
arti
-co
lour
ed B
at7
75
12
22
Myo
tis
myo
tis
Mo
use-
eare
d B
at0
M. d
asyc
nem
eP
ond
Bat
11
M. d
aub
ento
nii
Dau
ben
ton’
s B
at1
11
3
M. b
ran
dti
iB
rand
t’s
Bat
11
Pip
istr
ellu
s p
ipis
trel
lus
Co
mm
on
Pip
istr
elle
222
134
61
310
115
2
P. n
ath
usii
Nat
husi
us’s
Pip
istr
elle
654
3311
19
11
112
6
P. p
ygm
aeus
So
pra
no P
ipis
trel
le6
17
P. k
uhlii
Kuh
l’s P
ipis
trel
le0
Pip
istr
ellu
s sp
.P
ipis
trel
lus
sp.
31
48
Hyp
sug
o s
avii
Sav
i’s B
at0
Ple
cotu
s au
stri
acus
Gre
y L
ong
-ear
ed B
at5
16
Ple
cotu
s au
ritu
sB
row
n L
ong
-ear
ed B
at1
12
Tad
arid
a te
nio
tis
Bul
ldo
g B
at0
Min
iop
teru
s sc
hre
iber
siS
chre
iber
’s L
ong
-fi
nger
ed B
at0
Ch
iro
pte
ra s
p.
Bat
sp
ez.
22
21
21
10
Las
iuru
s ci
ner
eus
Ho
ary
Bat
L. b
ore
alis
Red
Bat
Las
ion
yter
is n
oct
ivag
ans
Silv
erha
ired
Bat
Ep
tesi
cus
fusc
usB
ig b
row
n B
at
spec
. ?S
out
hern
Bro
wn
Bat
Myo
tis
luci
feru
sL
ittl
e B
row
n B
at
M. s
epte
ntr
ion
alis
No
rthe
rn L
ong
-ear
ed
M. e
voti
sL
ong
Ear
ed
M. s
pec
.M
yoti
s sp
.
Pip
istr
ellu
s su
bfl
avus
Eas
tern
Pip
istr
elle
Tad
arid
a b
rasi
lien
sis
Mex
ican
Fre
e-ta
iled
Bat
Tad
arid
a au
stra
lisA
ustr
alia
n F
ree-
taile
d B
at
Ch
alin
olo
bus
mo
rio
Cho
cola
te-W
attl
ed B
at
236
1392
289
242
122
212
50
154
6
ES
PP
OR
AF
RA
SW
EU
SA
AU
Sg
es.
13
31
168
11
135
114
89
123
11 1 3 1
12
115
61
305
162
18
11
412
33
17 2
11
11
141
3060
115
637
637
341
341
9696
2222
5555
8888
66
11
22
108
108
11
2929
11
251
540
4714
1629
2110


![[GE Innovation Forum 2015] Repowering by Seunghyun, Ju](https://static.fdocuments.in/doc/165x107/55c2c1b9bb61eb0b0c8b45ca/ge-innovation-forum-2015-repowering-by-seunghyun-ju.jpg)