The Impact of Powder River Basin Coal Exports on Global ...
81
The Impact of Powder River Basin Coal Exports on Global Greenhouse Gas Emissions A report prepared for The Energy Foundation San Francisco, CA www.ef.org by Thomas Michael Power, Ph.D. Research Professor and Professor Emeritus Economics Department, The University of Montana Donovan S. Power, M.S. Power Consulting, Inc. 920 Evans Missoula, MT 59801 www.powereconconsulting.com May 2013
Transcript of The Impact of Powder River Basin Coal Exports on Global ...
The Impact of Powder River Basin Coal Exports on Global Greenhouse Gas Emissions
A report prepared for
The Energy Foundation
San Francisco, CA www.ef.org
by
Thomas Michael Power, Ph.D. Research Professor and Professor Emeritus
Economics Department, The University of Montana
Donovan S. Power, M.S. Power Consulting, Inc.
920 Evans
Missoula, MT 59801 www.powereconconsulting.com
May 2013
PRB Coal Exports and GHG Emissions April 2013 TM Power & DS Power Page i
About the Authors:
Thomas Michael Power is a Research Professor and Professor Emeritus in the Economics Department at The University of Montana where he has been a researcher, teacher, and administrator for over 40 years. He is also the Principal in Power Consulting, Inc. He received his undergraduate degree in Physics from Lehigh University and his MA and PhD in Economics from Princeton University. Donovan S. Power received his undergraduate degree in Geosciences at the University of Montana and his M.S. in Geology from the University of Washington. He has been the principal scientist at Power Consulting, Inc. for the past four years.
PRB Coal Exports and GHG Emissions April 2013 TM Power & DS Power Page ii
TableofContents
Executive Summary ...................................................................................................... 1
1. Controversy over the Export of American Coal to Asia ......................................................... 1
2. The Focus of Our Analysis .................................................................................................... 2
3. PRB Coal Exports Will Not Simply Displace Coal That Would Otherwise Be Burned. PRB Coal Exports Will Increase the Amount of Coal That Is Burned. ............................................... 3
4. PRB Coal Will Be Highly Competitive in Southeastern Coastal Chinese Markets, Pushing Coal Costs There Downward .................................................................................................... 4
5. Increases in PRB Mine Mouth Coal Prices Will Not Cause a Shift from Coal to Natural Gas in Generating American Electricity because PRB Mine Mouth Coal Prices Represent a Small Part of the Total Cost of Using PRB Coal. ................................................................................ 4
6. Coal Prices Will Have Different Impacts on Coal Usage in the United States and China ..... 5
7. Emphasizing the Export of Raw Coal to Developing Countries Is Unlikely to Be a Productive Economic Strategy for the United States ................................................................ 7
I. Introduction: Will the Export of Powder River Basin Coal to China Have an Impact on Worldwide Greenhouse Gas Emissions? ........................................... 9
1. Taking into Account of the Impacts of Competing Coal Supplies .......................................... 9
2. Will PRB Coal Exports Have a “Green” Impact on GHG Emissions? A Summary .............. 11
II. Powder River Basin Coal Exports to China: Resource, Cost, and Competitiveness on the South China Coast ...................................................... 14
1. The Powder River Basin Coal Resource ............................................................................. 14
2. The Size of the Part of the Chinese Market Accessible to PRB Coal.................................. 16
3. The Cost Competitiveness of PRB Coal Exported to the Southern China Coast ................ 18
III. The Sensitivity of Chinese Coal Use to the Cost of Coal .................................... 23
1. Downward Competitive Pressure on the Cost of Coal on China’s South Coast.................. 23
2. The Determinants of Coal Usage ........................................................................................ 25
PRB Coal Exports and GHG Emissions April 2013 TM Power & DS Power Page iii
3. The Sensitivity of Coal Consumption to Cost ...................................................................... 26
4. The Potential Impact of a Significant Decline in the Cost of Coal on Coal Consumption and GHG Emissions in the South China Coastal Market ............................................................... 27
IV. The Impact of the Relative Prices of Natural Gas and Coal on the Combustion of Coal for the Generation of Electricity in the United States ........................... 33
1. The Determinants of Fuel Choice for Electric Generation ................................................... 36
i. The Role of Transportation Costs in Determining the Delivered Cost of Coal .................. 37
ii. Life-Cycle Costs of Electric Generation versus Fuel Costs of Generation ....................... 38
iii. The Costs of Meeting Environmental Quality Regulations .............................................. 41
2. The Potential for Changing the Intensity of Use of Coal- and Natural Gas-Fired Electric Generators as Fuel Costs Change .......................................................................................... 43
i. The Impact of Increased PRB Coal Production on Coal Costs ......................................... 44
ii. The Impact of Short Run Coal Cost Increases on Utility Use of Coal .............................. 48
iii. Other Modeling of the Impact of Increased PRB Coal Production on Coal Prices .......... 52
iv. Competitive U.S. Coal Market Assumptions ................................................................... 53
V. Comparing the Role of Coal Costs in Coal Use Decisions in the United States and China .............................................................................................................. 55
1. Comparing Coal Use Decisions in the United States and China ......................................... 55
2. China’s Efforts to Improve the Fuel Efficiency of Its Electric Generating Fleet ................... 57
3. Other Chinese Efforts to Improve the Efficiency of Energy Production and Use ................. 61
4. China’s Efforts to Expand Non-Fossil Fuel Energy Supplies .............................................. 62
VI. Exporting Raw Materials Rather Than New Technology, Goods and Services 64
1. The Need for the United States to Focus on the Development of Clean Energy Technologies ........................................................................................................................... 64
2. Coal Mining and Rail and Ocean Shipping Are Mature Industries with Relatively Low Employment Potential ............................................................................................................. 68
Bibliography ................................................................................................................ 71
1
The Impact of Powder River Basin Coal Exports on Global Greenhouse Gas Emissions
Executive Summary
1. Controversy over the Export of American Coal to Asia American coal companies, facing a relatively flat future demand for coal for domestic electricity production in the United States, have turned their attention to the developing countries of Asia, especially China, where coal consumption is expected to continue to grow rapidly. The west coast of North America provides the closest geographic location for American exports to China’s coast. The North American west coast is also relatively close to some of the largest, cheapest, and lowest sulfur coal deposits in the world, the Powder River Basin (PRB) in Wyoming and Montana. As a result, several proposals for new or expanded coal ports have been made for the west coast of North America. This has resulted in considerable controversy over the likely environmental impacts associated with the expanded surface mining, the transportation of large volumes of coal by rail over very long distances, and the coal ports themselves. These are important local environmental impacts with which this report does not deal. The potential impacts of the combustion of large amounts of additional PRB coal on worldwide greenhouse gas (GHG) emissions and the resulting contribution to global warming have also been a point of contention. It is on that potential global environmental impact that this report focuses. Recently there has been a lot of concern about the GHG implications of increased mining, export, and combustion of American coal, focused on the simple fact that more American coal will be burned. This increase in the burning of American coal should be especially disturbing to Americans who have worked over the past few decades to reduce the burning of coal, the most GHG-intensive of the fossil fuels. From the U.S. point of view, at the very moment that we and our colleagues in other developed countries have succeeded in discouraging the construction of new coal-fired electric generators and encouraging the retirement of older, less efficient, and dirtier coal-fired generators, there are proposals for a major expansions of coal mining in the United States and the accompanying expansion of the combustion of that American coal elsewhere in the world. Coal companies, some independent energy experts, and government representatives from major coal-mining states have disputed these concerns about increased GHG emissions due to expanded American coal exports. Some have argued that increased American coal production and exports will have no net impact on global GHG
PRB Coal Exports and GHG Emissions April 2013 TM Power & DS Power Page 2
emissions. Others have gone further and argued that such exports would actually reduce global GHG emissions. This report analyzes and responds to these arguments that there will be no net increase in global GHG emissions as a result of the expansion of PRB coal mining and the construction of rail and port infrastructure on the west coast to support the export of that coal to Asia.
2. The Focus of Our Analysis It is important to understand the focus and scope of our analysis. We are specifically focused on a particular source of American coal, a particular set of export facilities, and a particular part of the Chinese market for coal. We are not analyzing a hypothetical “boom” in American coal exports from all of the coal fields across the nation.1 We are primarily focused on exports from the Powder River Basin that would be facilitated by the building of two proposed coal ports on the west coast of Washington (Longview and Cherry Point) where the permitting process is already underway and detailed information is available.2 We emphasize this because PRB coal has very particular geological, economic, and geographic characteristics that are important. In addition, the proposed ports and port expansions involve coal companies, investors, and governments specifying quantitatively their initial export plans and “putting their money where their mouth is.” Over the next ten years, these ports could support the export of about 140 million tons of PRB coal.3 Finally, we are focused on a relatively small part, less than a fifth, of the total Chinese market for coal, namely the industrial and population concentrations on 1 In 2011 and 2012 there was considerable enthusiasm among American thermal coal companies to refocus their attention on exporting their coal to other countries. This has partially been tied to the stabilization and/or decline in domestic demand for coal as well as very high import prices being paid for coal in Asia. The current and future profit potential appeared to be much higher in the global export as opposed to the domestic coal market. As a result, proposals have been made to build new or expand existing coal ports on the west, Gulf, and east coasts of the United States. If the capacity of all of these proposed new and expanded export facilities were actually realized and utilized, a considerable share of the nation’s coal production would be exported and the domestic price of coal might rise dramatically. This paper does not analyze this contemporary “bubble” of enthusiasm for coal exports across the nation. It is highly unlikely that all of this coal port expansion on all three of the nation’s coasts will be realized. Many of the Gulf and east coast proposals are premised on the lack of west coast coal export facilities. If west coast export facilities are constructed it is questionable whether thermal coal exports from the Gulf or east coasts would be competitive in Asia. If those west coast coal ports are not built, the much higher costs of both mining coal and shipping it to Asia from the east and Gulf costs will limit the competitiveness of that coal in Asia. 2 As this report was being written, two other ports have been proposed in the American Pacific Northwest: Coos Bay, Oregon, and a proposal that would link the Port of Morrow in the Boardman, OR, area where coal would be unloaded from trains onto barges which would travel down the Columbia River to the Port of St. Helens where the coal would be loaded on ocean-going ships. In addition, two existing coal ports on the coast of British Columbia, at Vancouver and Prince Rupert, have announced expansion plans. 3 All of the proposals taken together could support more than the 140 million tons of coal that we chose to model in this paper. For reasons that will be discussed in detail later, we will focus on 140 million tons of PRB coal for export.
PRB Coal Exports and GHG Emissions April 2013 TM Power & DS Power Page 3
the southern coast of China, where most of the coal is currently delivered by ocean-going ships. This is the part of the market where PRB coal is likely to be most competitive. It is important to note that although this part of the Chinese thermal coal market is just a fraction of total Chinese coal consumption, it is a third larger than all PRB coal production in 2010 and is equal to about half of the total international coal trade.
3. PRB Coal Exports Will Not Simply Displace Coal That Would Otherwise Be Burned. PRB Coal Exports Will Increase the Amount of Coal That Is Burned.
The core assertion that the export of PRB coal will simply displace coal from other sources that would otherwise be burned in China is partially true but ignores the basic economic principles of supply and demand. The coal companies of the PRB want to export their coal to China because they know that they can undersell domestic Chinese coal sources, and current exporters serving the industrial and population centers on the southern coast of China, where almost all coal is delivered by ocean-going ships. PRB coal can gain access to Chinese coastal markets only if it can reduce the cost of using coal there. China will not import the coal unless it has a lower price and/or it is less costly to use because of its quality. Because the PRB is one of the largest, cheapest, and lowest-sulfur sources of coal in the world, PRB coal mining companies expect to be able to do exactly that. As they compete for a share of that market, the cost of coal to Chinese coastal coal users will decline. That is exactly what competition for customers is expected to do. The lower cost of coal to coastal Chinese customers will ultimately encourage the increased use of coal and products made from burning coal, especially electricity. A half-century of studies of the role of energy prices on energy consumption have repeatedly documented this, including studies of the Chinese energy economy. Lower coal cost will have very long run implications because they influence the decisions as to what type of electric generating plants to build, including what fuel to use and how efficient to make the plants. In addition the lower costs of electricity will influence the energy efficiency of appliances that use electricity and the number, variety, and size of those appliances. Those investment decisions in electric generators that have 30 to 50 year lives and machinery and appliances that have lives of one to several decades will commit electric generators and customers to particular levels of coal consumption well into the future. We model the export of 140 million tons of PRB coal to the south coast of China which currently consumes about 660 million tons of coal delivered by ship. Taking into account the sensitivity of both demand and supply to price, we found that these exports would lower the delivered cost of coal by about 12 percent and ultimately lead coal consumption to increase by about 15 percent. As a result, coal consumption was
PRB Coal Exports and GHG Emissions April 2013 TM Power & DS Power Page 4
expected to rise by 98 million tons. That is, about 70 percent of the PRB coal exports would represent net additional coal consumption and GHG emissions. Only 30 percent of the PRB exports displace other sources of coal. The 98 million ton increase in annual coal consumption will release about 183 million tons of CO2. That is the equivalent of the coal consumption and GHG emissions of 14 electric generating plants the size of the Centralia plant in Washington. The Centralia plant has been schedule for retirement by the Washington state government to reduce GHG emissions.
4. PRB Coal Will Be Highly Competitive in Southeastern Coastal Chinese Markets, Pushing Coal Costs There Downward
Our analysis of the cost of mining an additional 140 million tons of coal in the PRB and shipping it by rail and ship from the proposed new and expanded coal ports on the U.S. and British Columbian west coast found that PRB coal can be delivered at a much lower cost than either domestic Chinese coal or the current major sea-borne exporters of coal to that market, Indonesia and Australia. Using conservative assumptions, PRB coal could, if it had to, undersell current suppliers to the south coast of China by as much as 40 percent. Given the expected ongoing rapid growth in coal consumption in this coastal market, this means that PRB coal could ultimately export much more coal that the 140 million tons we have considered and drive the cost of coal to this part of the Chinese market much lower than the 12 percent we have calculated. That would increase coal consumption and GHG emission even more. We analyzed the incremental costs associated with expanded PRB mining and found that due to the geologic and economic characteristics of that coal (large quantities, thick seams, close to the surface, etc.) annual production can increase with only modest impacts on the cost of production. Substantial increases in PRB coal production can take place without driving the PRB mine mouth coal costs significantly upward. Other studies have confirmed this. Just as important, past coal production in the PRB supports the same conclusion: While PRB coal production has increased many fold over the last four decades, the real mine mouth coal price declined for most of that period and remains the lowest in the country today.
5. Increases in PRB Mine Mouth Coal Prices Will Not Cause a Shift from Coal to Natural Gas in Generating American Electricity because PRB Mine Mouth Coal Prices Represent a Small Part of the Total Cost of Using PRB Coal.
The cost of transporting PRB coal to distant electric generators in the eastern U.S. largely determines the delivered cost of that coal, not the mine mouth price back in Wyoming and Montana. As much as two-thirds of the delivered costs are transportation costs. In addition, increasingly stringent air emission standards being imposed on coal-fired electric generators represent substantial costs that have discouraged the building
PRB Coal Exports and GHG Emissions April 2013 TM Power & DS Power Page 5
of new coal-fired generators and encouraged the retirement of older ones. Coal-fired generators also cost much more and take longer to build. These costs are incurred in order to use a cheaper fuel, coal, but are substantial costs nonetheless, which make the total costs of coal-fired generation higher than the costs of natural gas-fueled electric production despite the higher cost of natural gas as a fuel. The recent drop in natural gas prices and projections that they will stay low has further undermined the competitiveness of coal as a fuel for electric generation. Finally, coal-fired generation is less flexible and, therefore, more costly to use to complement intermittent renewable energy resources. In the context of all of these significant costs associated with coal-fired generation, the projected increases in the mine mouth cost of PRB coal due to increased demand for that coal due to export will have little or no impact of the use of coal for electric generation in the United States. Almost all new electric generation that is planned is gas-fired or renewable, not coal-fired. We have modeled the impact of the increased PRB mine mouth coal costs that would be associated with the west coast coal ports’ planned levels of exports on the usage of coal by U.S. electric generators, looking at each power plant and its cost characteristics. We found that even in the regions of the United States where electric generation would be most vulnerable to increases in the delivered costs of PRB coal, the impact of the likely PRB mine mouth cost increases on the quantity of domestic use of that coal is likely to be very small. The export of PRB coal will not lead to significant additional reductions in the use of coal domestically beyond those already underway because of the increase in the other costs of using coal.
6. Coal Prices Will Have Different Impacts on Coal Usage in the United States and China
It is the relative price of coal compared to alternative energy products that might be used to accomplish the same purpose that determines how changes in coal prices affect coal usage. When the set of alternatives open to coal users are dramatically different, the response to changes in coal prices is also likely to be different. That is the case in China and the United States. In particular, the United States has had a large, readily available, relatively low-cost domestic alternative to the use of coal for the generation of electricity, namely natural gas. China, on the other hand, has had a much more limited and higher cost set of alternatives given its historical limited supplies of both natural gas and petroleum. This is reflected in the relative dependence of the two countries on coal for the generation of electricity. Until 2012 the United States got approximately 45 percent of its electricity by burning coal while China depends on coal for almost 80 percent of its electricity. Similarly, before 2012, the United States obtains about 21 percent of its electricity by
PRB Coal Exports and GHG Emissions April 2013 TM Power & DS Power Page 6
burning natural gas while China obtains only about 1 percent of its electricity from natural gas.4 In that setting it is not surprising that the important economic issues about coal usage in the United States have been how the total costs associated with coal-fired generation compared to the total costs associated with natural-gas-fired generation. Since at least 1985 this comparison has favored natural gas over coal and the percentage of new generation that has been fueled by natural gas has steadily risen. The mine-mouth cost of coal was not the dominant determinant of the choice of natural gas as the fuel: Capital investment, environmental control, and fuel delivery costs, as well as the efficiency, modular nature, and construction times of natural gas generators were at least as important. As a result, even when relative coal costs declined dramatically because natural gas costs per million Btu rose relative to coal, natural gas remained the preferred fuel. In China, with limited low-cost alternatives to coal, the focus has been on improving the fuel efficiency of the coal-fired electric generators on which China is going to have to rely for many decades into the future. Chinese energy policy has also focused on improving the efficiency with which coal is produced and delivered to industrial facilities including electric generators. This is not to say that China has not been attempting to diversify its energy supply in order to at least moderate somewhat its dependence on coal. China has also made major investments in non-coal sources of electricity including nuclear, wind, and solar electric facilities. The primary focus, however, has been on improving the efficiency with which coal and electricity are produced, transported, and used. During the 2000 to 2010 period the cost of Chinese domestic coal rose sharply. This led China to shift from being a net exporter of coal to a net importer of coal. The cost of coal imports also rose because of supply disruptions and increased demand. These higher coal costs have led the Chinese to build some of the most energy efficient coal-fired electric generators in the world. Although these investments in new coal-fired generation represent a 30 to 50 year commitment to burning coal, they also represent long-term investments in reducing the amount of coal those plants will burn. Because the rational level of investment in improving the fuel efficiency of those electric generators is tied to the expected cost of coal, reductions in coal costs will discourage such coal-saving investments and increase coal combustion and GHG emissions. Although parts of the Chinese economy are centrally planned by the national or provincial governments, much of that economy is open to market forces. The Chinese economy would not have been able to grow as rapidly and consistently as it has over the last several decades if government economic policy was simply irrational. Economic
4 For a brief period in April 2012 coal and natural gas were the source of about the same share of U.S. net electric generation, about one third each. By November 2012 the shares were back closer to historical averages, 44 percent of net generation from coal and 25 percent from natural gas. Very low natural gas prices were encouraging increased utilization of natural gas relative to coal. http://www.eia.gov/totalenergy/data/monthly/pdf/sec7_4.pdf
PRB Coal Exports and GHG Emissions April 2013 TM Power & DS Power Page 7
planners as well as the managers of both state-owned and privately-owned enterprises pay attention to costs and innovate in order to improve efficiency. As a result, it is not just clothing we import from China but also much of our high-tech electronic devices. Chinese coal consumption cannot be analyzed by simply saying that China has to consume exactly the amount of coal it currently is consuming or is projected to consume in order to fuel its future economy. The Chinese are regularly making economic choices about investments in improved efficiency in their development and use of coal and electricity. Consideration of a broad range of cost and benefits, including the cost of using coal, will inform and influence those decisions.
7. Emphasizing the Export of Raw Coal to Developing Countries Is Unlikely to Be a Productive Economic Strategy for the United States
The recent emphasis on boosting employment and income by exporting coal to Asia is unlikely to have much of a payoff in solving American economic problems. Coal mining has become an increasingly capital and energy intensive process that employs fewer and fewer workers. Changes in the loading, operating, and unloading of trains has also allowed railroads to significantly reduce their workforces. Finally, ports have also adopted technologies that have dramatically reduced their number of employees. These labor-saving innovations have included reliance on shipping cargos in standardized containers and the use of automated bulk cargo loading equipment. As a result, the employment associated with coal exports has declined dramatically and can be expected to decline further in the future. There is also something counter-intuitive about the suggestion that the way to compete with the developing Chinese economy is to export to them unprocessed raw materials and use the proceeds from those exports to pay for our imports of Chinese manufactured goods. That, in the past, was the role that under-developed “colonies” played for developed nations. It represents a dramatic reversal of roles for the United States. The questionable efficacy of this reversal of role is dramatized by the fact that while we propose to export coal to China, China has become the world leader in the manufacturing of wind electric turbines and solar electric panels along with other clean energy technologies. The United States plans to export raw coal while importing clean energy technologies. This is problematic from both an environmental and economic point of view. The U.S. is importing clean energy technologies from China and other nations partially because we have not developed a large enough market in the United States to support such manufacturing. Our ongoing commitment to the combustion of fossil fuels is the source of that under-developed domestic market.

PRB Coal Exports and GHG Emissions April 2013 TM Power & DS Power Page 8
From an economic point of view, this is a concern because the development and installation of clean energy technologies could be the basis for a major innovative industry in the U.S. that would allow it to increase its technological and manufacturing base and boost its manufactured exports to the rest of the world. That path would offer the potential for dramatically more jobs than a focus on coal exports. It would also represent a return to the type of leadership that the American economy showed in other technology areas: aerospace, pharmaceuticals, microchip, and computer software development.
PRB Coal Exports and GHG Emissions April 2013 TM Power & DS Power Page 9
I. Introduction: Will the Export of Powder River Basin Coal to China Have an Impact on Worldwide Greenhouse Gas Emissions? This report analyzes and responds to various arguments that the expansion of PRB coal mining and the construction of rail and port infrastructure on the west coast of North America to support the export of that coal to Asia will not cause a net increase in global GHG emissions and global warming.5 This report is an extension of an earlier report The Greenhouse Gas Impact of Exporting Coal from the West Coast: An Economic Analysis that was published by the Sightline Institute of Seattle in July 2011.6 That report conceptually analyzed the GHG impacts of coal exports in the same way this report does. The earlier report, however, did not attempt to quantify the impact of those exports both in China and in the United States. This study takes a more quantitative look at the same issues.
1. Taking into Account of the Impacts of Competing Coal Supplies The coal industry’s primary response to concerns about the GHG implications of increased American coal mining for export is that if China does not get some of its coal from the United States, China will simply get the equivalent amount of coal from some other coal source. That alternative coal supply would come from either within China or from some other coal-exporting nation. In that sense increased American coal mining for export is said to simply displace coal mining that would have taken place at some other global location. The total amount of coal burned and the associated GHG emissions, it is claimed, will be the same, with or without U.S. coal exports. The potential substitution of one coal source for another among competing suppliers certainly has to be taken into account. In general, it is not accurate to assume that every additional ton of coal mined means the GHG emissions will increase by the carbon content of that ton of coal. Substitution effects do have to be accounted for. In that sense it is economically naïve to assume that exported coal is not being sold into a competitive market where one country’s exports tend to displace some other country’s potential exports. However, it is equally economically naïve to ignore the impact of
5 We will focus on the GHG emissions associated with the combustion of coal. There are also GHG emissions associated with the mining and shipping of coal. We do not analyze the shipping-related GHG emissions for two reasons. First, they are much smaller that the GHG emissions associated with the burning of the coal. Second, it is the difference in the GHG emissions associated with coal being delivered from alternative sources that matters. The part of the Chinese coal market on which we focus, the southeastern coast of China, is remote from all sources of coal, including Chinese domestic sources. For that reason, the differences in transportation-related GHG emissions are likely to be small, especially compared to those associated with the burning of the coal. We discuss this more fully later in this report. Similar points can be made about the GHG emissions associated with coal mining. It is the difference in emissions between two alternative mines that matter and this difference is likely to be small compared to the combustion emissions. 6 http://www.sightline.org/research/energy/coal/Coal-Power-White-Paper.pdf
PRB Coal Exports and GHG Emissions April 2013 TM Power & DS Power Page 10
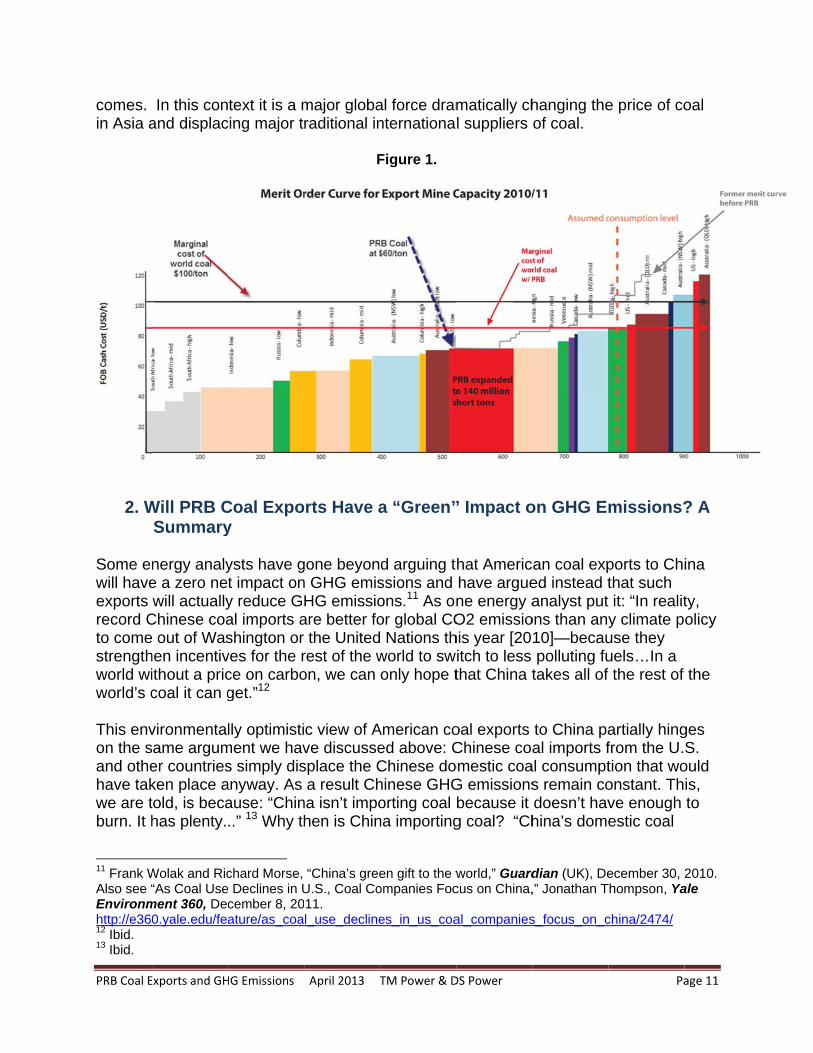
competition to supply coal to a particular market on the cost of that coal to consumers. It is also economically naïve to ignore the impact of that competition among coal exporting nations on global efforts to control GHG emissions. Competition among suppliers to serve particular markets tends to reduce the cost that customers have to pay. That is the positive function that competition among suppliers is supposed to play. Reduction in the cost of supply also has a predictable impact on the quantity consumed: It increased the quantity consumed. That is why demand curves are drawn sloping downward to the right. In that sense, competition to supply markets tends to boost consumption, in this case coal consumption and combustion and GHG emissions. As was discussed in detail in our earlier report, that impact of lower energy costs on energy consumption has been repeatedly studied and confirmed over the last half-century.7 Increased competition among coal suppliers to serve the growing demand for coal in the port cities on the southern coast of China will reduce the cost of coal. The cost will be reduced below what it otherwise would have been and will lead to higher levels of coal combustion than would have taken place if that competition had not lowered the cost of coal. This point can be clearly illustrated by viewing Figure 1 below. The figure is an augmented version of a Merit Order Curve produced by the Energy Policy Research Foundation8 from an article in which the analysts argue that PRB coal exports to Asia from the U.S. will not affect the price of coal in Asia. They argue that since the PRB is an infra-marginal supplier it will displace only the high cost coal that Asia is currently not buying. What they failed to consider was the potential scope of PRB exports. If one considers PRB exports to the southeastern coast of China of 140 million short tons9, as we consider in this paper, the price change is actually dramatic. The U.S. is still an infra-marginal supplier of coal, however the high end price of coal drops from just over $100/ton to just over $80/ton, or a price change of about $18/ton. In this context it becomes clear that PRB coal will not simply displace the high end suppliers of coal to Asia, but it will dramatically affect the price of coal paid in Asia, and where that coal comes from.10 In this new view of coal supply to Asia, coal that was being supplied by the U.S. (mid), Australia (QLD), and Canada (mid) no longer can compete in Asia. Those suppliers are effectively “priced out” of the market by the low cost PRB coal. The PRB is not a minor infra-marginal player that does not affect the price of coal or from where that coal
7 ”The Greenhouse Gas Impact of Exporting Coal from the West Coast: An Economic Analysis,” Thomas M. Power, 2011, Sightline Institute, pp. 5-11. http://www.sightline.org/research/energy/coal/Coal-Power-White-Paper.pdf 8 Energy Policy Research Foundation “The Economic Value of American Coal Exports” August 2012. http://eprinc.org/2012/08/the-economic-value-of-american-coal-exports/ 9 We explain the 140 million short tons of exports later in this report. It is tied to the capacity of the most developed west coast coal port proposals. 10 The change in price becomes even more dramatic if more coal is allowed to move out of the PRB to Asia. If 275 million short tons of coal are allowed into the merit order curve, the price changes from just over $100/ton to just over $70/ton showing a price drop of just over $30/ton.
PRB Coal E
comes. in Asia a
2. W
Some enwill haveexports record Cto comestrengthworld wiworld’s c This envon the sand othehave takwe are tburn. It h
11 Frank WAlso see “Environmhttp://e36012 Ibid. 13 Ibid.
Exports and GH
In this conand displac
Will PRB CSummary
nergy analye a zero newill actually
Chinese coa out of Was
hen incentivithout a priccoal it can g
vironmentalame argumer countriesken place atold, is becahas plenty.
Wolak and Ric“As Coal Use
ment 360, Dec0.yale.edu/fea
HG Emissions
text it is a mcing major t
Coal Expoy
ysts have gt impact ony reduce Gal imports ashington or ves for the rce on carboget.”12
lly optimistiment we havs simply disanyway. As ause: “Chin..” 13 Why th
chard Morse, Declines in Ucember 8, 20ature/as_coa
April 2013 T
major globaraditional in
F
orts Have a
gone beyonn GHG emisHG emissioare better fo
the Unitedrest of the won, we can
c view of Ave discussesplace the Ca result Ch
na isn’t impohen is Chin
“China’s greeU.S., Coal Co11. l_use_decline
TM Power & D
al force dramnternationa
Figure 1.
a “Green”
d arguing tssions and ons.11 As onor global CO Nations th
world to swonly hope t
American coed above: CChinese dohinese GHGorting coal na importing
en gift to the wompanies Foc
es_in_us_coa
DS Power
matically chl suppliers
” Impact o
hat Americhave arguene energy aO2 emissiohis year [20itch to less that China t
oal exports Chinese coaomestic coaG emissionsbecause it g coal? “Ch
world,” Guardcus on China,
al_companies
hanging theof coal.
on GHG Em
can coal exped instead tanalyst put
ons than any10]—becaupolluting fu
takes all of
to China paal imports f
al consumpts remain codoesn’t havhina’s dome
dian (UK), De,” Jonathan T
s_focus_on_c
Pa
e price of co
missions?
ports to Chthat such it: “In reality climate puse they uels…In a f the rest of
artially hingfrom the U.tion that woonstant. Thve enough estic coal
ecember 30, 2Thompson, Ya
china/2474/
age 11
oal
? A
ina
ty, olicy
the
ges S.
ould is, to
2010. ale
PRB Coal Exports and GHG Emissions April 2013 TM Power & DS Power Page 12
prices are now the highest in the world, which allows Chinese companies to save money by purchasing coal from overseas.”14 There is a contradiction built into the economic assumptions being made in this argument. Higher coal costs in developed countries lead electric generators to abandon coal for lower-carbon energy sources such as natural gas and renewable energy. But in China, when Chinese coal users can reduce their coal costs by importing coal from other nations, that lower cost has no impact on their coal consumption. Coal users around the world are sensitive to the cost of coal, but Chinese coal users are not. This makes no economic sense. The Chinese import coal because, as the quote above makes clear, it is a cheaper source of supply. Other nations can sell coal to China only because they can undersell the domestic Chinese cost of coal. Exports of coal to China have to reduce the cost of coal to those parts of the Chinese market that can access the seaborne trade in coal.15 Otherwise the Chinese would not import the coal. The Chinese are as business-like as energy users in the rest of the world. They adjust their investments in energy using (and saving) technologies and their levels of resource consumption depending on the structure of costs they face. We will discuss the evidence of Chinese cost minimizing behavior, economic pricing to guide consumption decisions, and investment objectives later in this report. It is important to note that we are not focused on the entire market for coal throughout China. Across most of China, PRB coal exports have no chance of successfully competing against domestic Chinese coal or coal imported overland from Mongolia. The transportation costs of hauling PRB coal delivered to the coast of China inland to most of the Chinese coal market would be much too high. PRB exports would be competitive primarily on the south coast of China that primarily gets its coal, even its domestic Chinese coal, from ocean going ships. This part of the Chinese coal market receives about 660 million tons of coal by sea, most of it from Chinese domestic sources delivered to coal ports on the northern coast of China. In 2010 total Chinese coal consumption was about 3,500 million tons. Thus we are focused on less than one-fifth of the total Chinese coal market. Exports to China will lower the cost of coal use in the industrial and population centers on the southeastern coast of China. As will be discussed in more detail below, this low cost can be expected to encourage more coal consumption than otherwise would have taken place there because the incentives to conserve on coal use will be somewhat relaxed. With that higher level of coal consumption will come higher levels of GHG emissions. We will analyze the potential size of the coal cost reduction to coal users on the southern coast of China and the likely impact of that cost reduction on coal consumption.
14 Ibid. 15 By reducing the pressure on domestic coal supply in China, imports to the southern coast also are likely to have a small impact on coal prices elsewhere in China too.
PRB Coal Exports and GHG Emissions April 2013 TM Power & DS Power Page 13
The other primary assumption on which the environmental optimism about the impact of coal exports to China is based is that exports to China will drive up coal costs in the United States. Of course, if the supply of coal in the U.S. were fixed and Chinese demand for that coal was not limited by the high cost of most of that coal, Chinese competition to buy that coal would certainly drive up the cost of coal to American customers, possibly to very high levels. But the cost of production for much of America’s thermal coal supply does not make it an attractive source to Asia, especially if coal ports on the west coast provide more direct Chinese access to PRB coal. In addition, the coal supply in the United States is not fixed. PRB coal companies want to expand their coal production in order to export coal to China and other U.S. domestic coal mines that over the last several decades have had to cut back production due to competition from PRB coal would also like to expand production if they could be competitive in Asian or other world markets. In that setting, how much coal prices would rise in the U.S. as a result of such PRB coal exports would depend on how much more costly it will be to expand production at existing mines and to open up new mines. This is an empirical question that we will explore in detail in this report. Here we will just point out that the PRB contains a very large and very low cost coal resource that has been able to respond to increased demand for its coal by expanding its scale of production many fold over the last several decades while also reducing the real mine mouth price of that coal. In addition, much of the PRB coal supply that in the northern part of the Powder River Basin in Montana has not faced significant development pressure over the last forty years because it was at a transportation cost disadvantage relative to Wyoming coal in reaching the fastest growing American markets. As a result, Wyoming produces ten times as much coal as Montana even though Montana has the larger economic reserves. For exports to Asia from the west coast of North America, Montana coal resources are likely to have the cost advantage. Another important assumption in the environmentally optimistic view of the impact of PRB exports to China is that it is primarily the mine mouth cost of coal that determines whether coal or natural gas is burned by U.S. electric generators. This too is an empirical question that we will explore in some detail. What we will conclude is that the shift from coal-fired to natural gas-fired electric generation has been underway for many years in the United States despite the relatively low cost of coal and, until recently, the relatively high cost of natural gas as a fuel for electric generation. Changes in the mine mouth cost of the PRB within the range expected due to PRB coal exports will have little or no impact on the fuel choices being made by American electric generators. It is other costs, transportation, capital, environmental, and regulatory, that are driving a shift towards natural gas as the fuel for electric generation that is already well underway.
PRB Coal Exports and GHG Emissions April 2013 TM Power & DS Power Page 14
II. Powder River Basin Coal Exports to China: Resource, Cost, and Competitiveness on the South China Coast
1. The Powder River Basin Coal Resource
The Powder River Basin (PRB) is one of the world’s largest deposits of coal. The PRB runs from northeastern Wyoming to southeastern Montana and holds the thickest beds of coal in the United States.16 The PRB is primarily composed of sub-bituminous coal noted for some of the lowest sulfur content in the country (an average value of 0.48 percent).17 Although the heat content average (8,800 Btu) is not high, the relative abundance of the coal deposits near or at the surface allow for some of the cheapest mine mouth prices for coal in the entire world. Because the coal deposits are so abundant with relatively small overburdens, surface mining is dominant across the PRB. The PRB has steadily increased its share of the coal market in the United States since it began producing coal in the 1970s. Coal production from the PRB represents about half of all US production (on a Btu basis) and is projected by the Energy Information Administration (EIA) to continue to expand its share of U.S. coal production through 2035.18
The PRB is estimated by the EIA to have “recoverable reserves” of 162 billion tons.19 At current mining levels of approximately 500 million tons per year, this coal resource would last more than three centuries.20 With essentially flat coal consumption predicted by the EIA through 2035 for the United States, and energy use per capita predicted to decline, it is not surprising that the major coal producers in the PRB are anxious to secure new customers, including overseas customers, for their coal.21
The relatively flat projection of U.S. coal consumption (0.2 percent annual growth) can be juxtaposed to China’s coal consumption for electricity that is estimated by the EIA to grow at 3 percent annually through 2035.22 Other sources have China’s growth rate for thermal coal consumption as high as 8 percent per year.23 At a 3 percent growth rate China would double its coal consumption in 24 years and an 8 percent growth rate would double its coal consumption in less than 10 years.
16 http://pubs.usgs.gov/pp/p1625a/Chapters/PQ.pdf and http://www.epa.gov/ogwdw/uic/pdfs/cbmstudy_attach_uic_attach05_powder.pdf 17 http://pubs.usgs.gov/pp/p1625a/ES/ESpt2.html 18 Annual Energy Outlook 2011 page 85. 19 David Scott and James Luppens. “Assessment of Coal Geology, Resources, and Reserve Base in the Powder River Basin, Wyoming and Montana.” U.S. Department of the Interior and U.S. Geologic Survey, February 2013. 20 EIA and USGS define “recoverable reserve” and “recoverable resource” differently. In general these measures of available coal take into account restrictions on mining coal deposits, coal mining losses, and represent coal that could be mine if coal prices were high enough and/or technological change reduced the cost of that mining. 21 Annual Energy Outlook 2011 page 62 and 63. This comparison is coal use in the electricity sector. 22 http://www.eia.gov/forecasts/ieo/pdf/0484percent282011percent29.pdf page 71 23 http://resourceinvestingnews.com/21056-chinese-coal-imports-surge.html
PRB Coal E
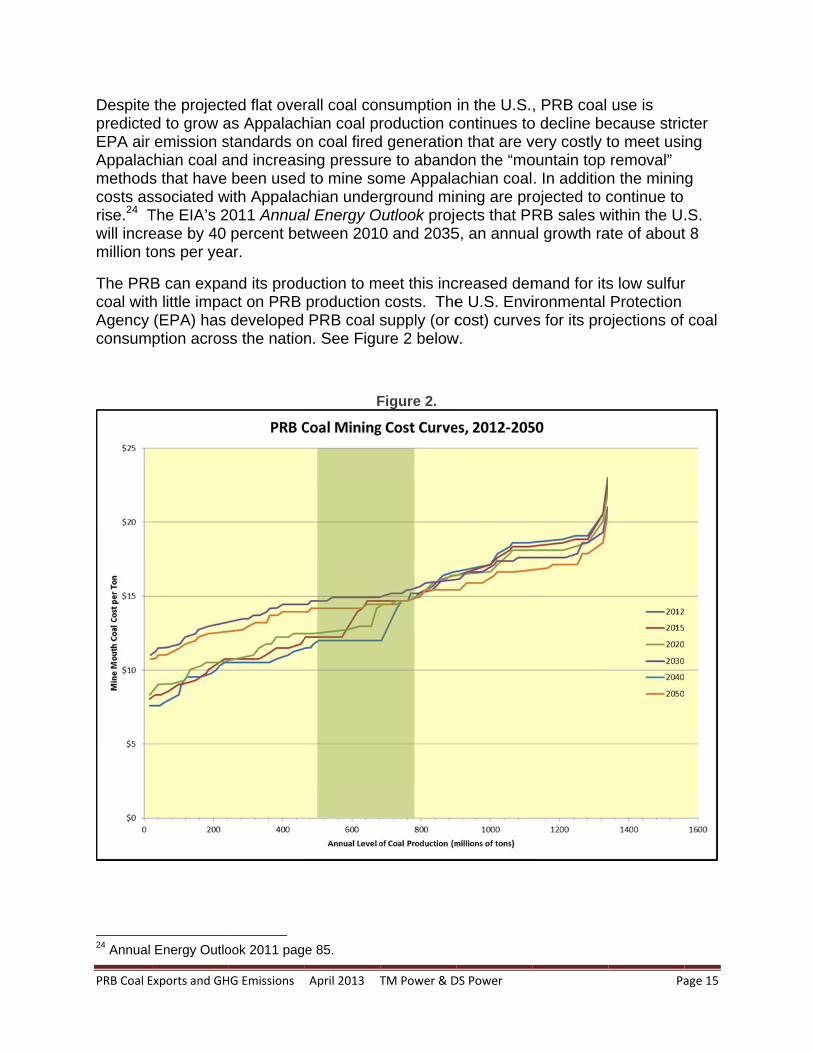
Despite predicteEPA air Appalacmethodscosts asrise.24 Twill incremillion to
The PRBcoal withAgency consum
24 Annual
Exports and GH
the projectd to grow aemission s
chian coal as that have ssociated wThe EIA’s 2ease by 40 ons per yea
B can expah little impa(EPA) has ption acros
Energy Outlo
HG Emissions
ted flat overas Appalachstandards oand increas
been usedwith Appalac
011 Annuapercent be
ar.
and its prodact on PRB
developed ss the natio
ook 2011 pag
April 2013 T
rall coal conhian coal pr
on coal fireding pressur
d to mine sochian underal Energy Oetween 2010
uction to mproductionPRB coal s
n. See Figu
F
e 85.
TM Power & D
nsumption roduction c
d generationre to abandome Appalarground min
Outlook proje0 and 2035
meet this inccosts. The
supply (or cure 2 below
Figure 2.
DS Power
in the U.S.continues ton that are vdon the “moachian coalning are proects that PR
5, an annua
creased deme U.S. Envicost) curve
w.
, PRB coal o decline bevery costly tountain top . In additionojected to cRB sales w
al growth ra
mand for itsironmental s for its pro
Pa
use is ecause stricto meet usiremoval” n the minincontinue to
within the Uate of about
s low sulfurProtection
ojections of
age 15
cter ng
g
.S. t 8
r
coal
PRB Coal Exports and GHG Emissions April 2013 TM Power & DS Power Page 16
Those supply curves clearly show that in any given year the PRB could ramp up production by more than 250 million tons (the green shaded area) with a corresponding cost increase of a few dollars per ton of coal. It should be noted that as a percentage of the PRB mine mouth price, a $3 per ton increase is “significant” in the sense that it represents about a 30 percent increase from a $10 mine mouth coal price. But in terms of the delivered cost of coal or the cost of coal in the eastern U.S. where PRB coal would be competing, such cost increases are quite modest.
These supply curves show the incremental mining costs as the level of annual production is increased. Each supply curve shows the estimated incremental mining costs for different years in the future. Note that most of this PRB coal cost increase is not associated with higher levels of annual production but with the increase in the real cost of mining over time at almost any level of annual production.25 This increase in PRB coal mining costs over time compared to the cost increase associated with higher annual production levels is highlighted by the flatness of the respective curves in the shaded area (current production plus 250 million tons) when comparing 2012 values to the projected 2020 to 2050 values.26
We have highlighted in green in Figure 2 the current annual level of PRB coal production plus 250 million additional tons of annual production to indicate the potential impact of both the expanded PRB production to serve U.S. domestic coal markets between 2010 and 2025 (an additional 110 million tons per year) as well at an expansion of up to 140 million tons to serve Asian export markets by 2025. Clearly the PRB has the ability to expand its coal production by 250 million tons between now and 2025 and beyond without a dramatic increase in costs of production. That is, rising PRB mine mouth production costs are unlikely to be a barrier to effectively competing for market share both in Asia and elsewhere in the United States.
With the U.S. market for that coal essentially flat but with China’s coal consumption increasing at an exponential rate, it is not surprising that the largest coal companies in the PRB and the United States are looking to China to dramatically increase their sales. The question we wish to explore is whether potential PRB coal exports to the southern coast of China can be competitive with other international sources of coal vying to serve those same import market as well as Chinese domestic sources of coal.
2. The Size of the Part of the Chinese Market Accessible to PRB Coal
Before we discuss the costs associated with delivering coal to China, it is important to quantify and examine the part of the Chinese coal market in which the PRB coal could be competitive. China consumed approximately 3.3 billion tonnes of coal in 2010.27 (Note the shift from the American measure “short tons” to “metric tonnes” the unit which
25 http://www.epa.gov/airmarkets/progsregs/epa-ipm/docs/v410/Chapter9.pdf 26 These cost curves come from an EPA model (v.4.10) that was designed to predict coal use in the U.S. 27 http://www.worldcoal.org/coal/coal-mining/ and http://www.worldcoal.org/coal/market-amp-transportation/
PRB Coal Exports and GHG Emissions April 2013 TM Power & DS Power Page 17
most of the rest of the world uses. A metric tonne is about 1.1 tons.) Of course the PRB could not compete with most of that coal because of the high cost of moving that coal great distances inland within China in addition to the transportation costs to reach the North American coast and then the shipping costs to reach the coast of China. PRB coal would only be able to be competitive in the highly industrial areas on the southern coast of China, where the vast majority of the coal consumed, whether it is domestic Chinese coal or imported coal, is already delivered by ship. In 2010 and 2011 the southern coastal region of China received at least 600 million tonnes of coal by ocean-going ships.28 Of that more than 600 million tonnes of coal, 150 to 200 million tonnes were foreign imports and the rest was domestic Chinese coal shipped from coal ports on the northeastern coast of China.29
Note that this part of the Chinese coal market represents a relatively small part of total Chinese coal consumption, less than a fifth, although it represents a large volume of coal from the perspective of total international coal trade (1,100 million tonnes) and current PRB coal production (455 million tonnes when expressed in metric terms).30 It is important to understand that we are not talking about PRB coal competing to displace domestic Chinese coal consumption across the whole of China.
According to Jeff Watkins, of Wood Mackenzie Research and Consulting, data on the cost of delivering coal to the southern coast of China, from various sources both within China and from various coal fields around the world, show that imported international coal will be far more competitive than Chinese coal in the near future in serving these southern coastal industrial and population centers.31 Foreign coal will be so much more competitive than Chinese domestic coal that it could cost-effectively serve the vast majority of southern China’s coastal demand.
Currently, imported coal only makes up 5.3 percent of all of the coal that is consumed in China. However, coal imported by China is projected by the EIA to grow at an annual rate of 6.5 percent through 2035.32 Considering that Chinese coal production is forecasted to grow by 2 percent, the EIA implicitly projects that imported coal will make up 14.3 percent of China’s total consumption by 2035 with more than 850 million tons imported.33 The EIA and Wood Mackenzie analyses clearly show that the Chinese market in the near and long term is likely to rely on increasing quantities of imported coal to meet the demand on the southern coast of China.
28 Coal Markets: Near-Term Headwinds but Strong Global Fundamentals,” Jacob Williams, Peabody Energy, 2012 Analyst and Investor Forum, June 27, 2012. “Expanding Markets and Peabody Growth Opportunities” presented by Rick Navarre President of Peabody. 2010. 29 Ibid. Slide 11 for 2011 and Slide 21 for 2010.. 30 World Coal Association, http://www.worldcoal.org/coal/market-amp-transportation/. Data for 2010. 31 Trends in Global Coal Markets. Jeff Watkins. January 2012, slide 20. 32 IEO 2011. Figure 71. 33 IBID. Table 8.
PRB Coal Exports and GHG Emissions April 2013 TM Power & DS Power Page 18
3. The Cost Competitiveness of PRB Coal Exported to the Southern China Coast
The real price of shipping PRB coal by rail in the U.S. for the last 10 years has remained at around 1 cent per ton mile.34 The EIA estimates that there will be an average annual growth rate in rail shipping costs of between -0.9 percent and +1.1 percent and adopt a reference level of 0.2 percent per year for Western railroads.35 A 1.1 percent annual increase would mean a cost increase from 1 cent per ton mile in 2009 to 1.3 cents per mile in 2035. According to the EIA then, the cost of the delivery of PRB coal to the west coast will not change appreciably in the next 25 years. To be conservative we choose to use a PRB coal shipping value of 1.5 cents per ton mile. It is approximately 1,300 miles from the PRB to Bellingham, Washington, the site of the proposed Cherry Point Gateway Pacific coal port. This would add $19.50 per ton to the mine mouth cost of PRB coal that is shipped to the west coast of the U.S.
The potential for profitably shipping coal out of the PRB towards the west coast of the U.S. has not escaped the eyes of some very important market players. In 2009 Warren Buffet bought Burlington Northern Santa Fe, which owns the tracks that travel from the southern PRB in Wyoming north through the northern PRB in Montana and then west to the west coast of the U.S.36 With two large coal port proposals on the west coast (Longview near the mouth of the Columbia River and Cherry Point near Bellingham, Washington) in which Arch Coal and Peabody Energy, respectively, are heavily invested, the idea of shipping PRB coal to the west coast for export to Asia obviously has the attention of some the nation’s largest coal companies. As of March 23, 2012, the spot mine mouth price of a ton of PRB coal was $7.58, down from $12.16 at the beginning of January 2012.37 Since 1990 the average price for a ton of PRB coal in 2009 dollars has been less than $15.38 In nominal terms the average price of sub-bituminous coal has been less than $15 since 1979.39 If we are conservative and choose a price almost twice the current sport market mine mouth price for PRB coal, $15 dollars per ton, the price to deliver PRB coal to the west coast would be $34.50.
The cost of shipping coal from the Prince Rupert, BC, Ridley terminal to southeast China was $13 dollars per ton as of September 16th, 2011.40 That coal, which shipped in October of 2011, was 8,800 BTU coal, likely from the PRB. Since we cannot get a quoted price from a terminal that has yet to be built (Longview or Cherry Point), we choose to use the Ridley shipping price quote plus two dollars to make up for the fact that it is slightly farther to ship from Bellingham or Longview, Washington, to southeastern China than it is to ship from Prince Rupert. That makes our estimated ocean shipping cost $15 per ton. Seeking Alpha, a highly regarded investment analysis 34 http://www.eia.gov/coal/transportationrates/pdf/waybill.pdf 35 Annual Energy Outlook 2011 with Projections to 2035. Table D23. 36 http://www.msnbc.msn.com/id/33599744/ns/business-us_business/t/buffett-buying-burlington-northern-railroad/#.Tw388fmwWXI and Cloud Peak Energy Investor Presentation November 2011 slide 22. 37 http://205.254.135.7/coal/nymex/ 38 http://www.eia.gov/FTPROOT/coal/05842009.pdf 39 EIA Table 7.9 coal Prices, 1949-2010. 40 http://www.ecoalchina.com/english/news/gnmtxw/957746.shtml
PRB Coal Exports and GHG Emissions April 2013 TM Power & DS Power Page 19
website, recently retrospectively looked back at some of their shipping cost projections from 2008-2010 and concluded that the shipping costs, for the near future, would likely remain the same. They also indicated that Panamax vessels, because of their high number, versatility and age, were much less at risk for shipping price volatility in the next several years.41
Currently China imposes a value added tax (VAT) of 17 percent on all foreign coal that is imported as well as a port fee of about $5.40.42 The VAT is under serious debate within the Chinese government and may be changed to a 13 percent tax in the near future, similar to the VAT on many other goods and the former VAT for coal before 2009. This would no doubt encourage more foreign coal imports.43 However, in our calculations we choose to use the more conservative 17 percent tax since the VAT has not actually been lowered yet.
We have not explicitly included a port fee for the coal loading on the west coast of North America. Although the port site itself is often publicly owned, the terminal facilities that actually load the coal onto ships often are owned or co-owned by coal mining companies. For instance Amber Energy and Arch Coal would own the proposed Longview, WA, coal port and Peabody Coal plans to invest heavily in the proposed coal port north of Bellingham, WA. This makes the terminal facility charges somewhat of an internal administrative price for the coal companies. As private businesses the charges for loading services are negotiated and considered proprietary information. A national study of the economics of expanded coal ports in the United States estimated the port fees to be about $2 per ton in 2012 dollars.44 Since our conservative estimates of the mine mouth cost of the coal, shipping costs, etc. already have much more than this level of error on the upside built into them, we have not explicitly included the North American terminal charges.
From this PRB coal and shipping information, we can calculate a cost to ship coal to ports in southeastern China from the PRB. With $15 dollars per ton for the mine mouth price of the coal, $19.50 to ship the coal via BNSF railway to the west coast, $15 dollars to ship the coal to southeastern China, a 17 percent VAT, a $5.40 port fee, and a conversion from tons to metric tonnes, the total cost to ship a tonne of coal from the PRB to SE China is approximately $70 dollars.45 That can be compared to the benchmark domestic thermal coal price in China as of January 20, 2012, of $115 dollars per tonnne.46 This would leave a margin of 64 percent or $45 dollars before the
41 http://seekingalpha.com/article/232661-our-dry-bulk-shipping-projections-sink-or-swim 42 http://china.org.cn/english/LivinginChina/202770.htm and http://en.in-en.com/article/policy/html/2011062725430.html and Morse, R. Schernikau, L. Asia’s Changing Landscape. World Coal. October, 2011. 43 http://www.chinamining.org/Policies/2011-08-04/1312443953d48628.html 44 Modeling U.S. Coal Export Planning Decisions, 1991, Michael Kuby, Samuel Ratick and Jeffrey Osleeb, Annals of the Association of American Geographers, 81(4): 627-649, pp. 632 and 640. The costs were in 1985 dollars that were converted to 2012 dollars using the PPI Index for all commodities. The cost was then converted from dollars per short ton to dollars per metric tonne. 45 This is a relatively modest assumption based on an August 2012 report that pegs the price of PRB coal delivered to Asian markets at $54/ton. EPRINC’s “The Economic Value of American Coal Exports.” 46 http://in.reuters.com/article/2012/01/20/coal-asia-idINL3E8CK2ED20120120
PRB Coal Exports and GHG Emissions April 2013 TM Power & DS Power Page 20
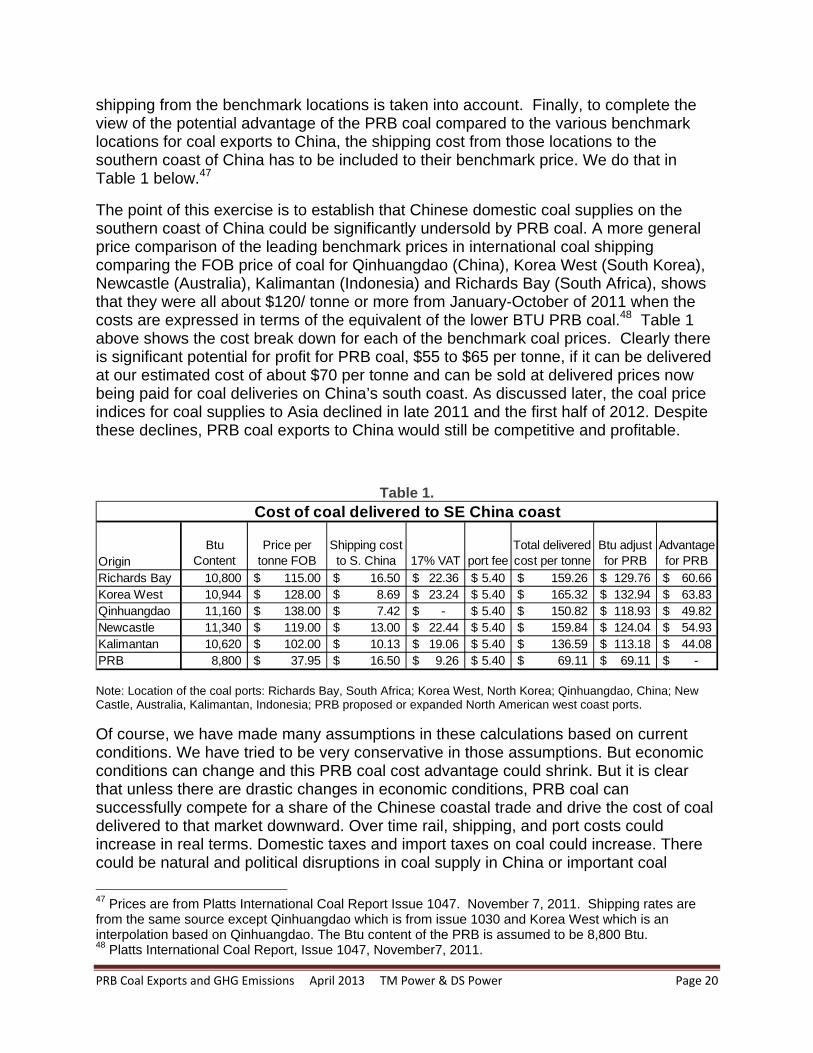
shipping from the benchmark locations is taken into account. Finally, to complete the view of the potential advantage of the PRB coal compared to the various benchmark locations for coal exports to China, the shipping cost from those locations to the southern coast of China has to be included to their benchmark price. We do that in Table 1 below.47
The point of this exercise is to establish that Chinese domestic coal supplies on the southern coast of China could be significantly undersold by PRB coal. A more general price comparison of the leading benchmark prices in international coal shipping comparing the FOB price of coal for Qinhuangdao (China), Korea West (South Korea), Newcastle (Australia), Kalimantan (Indonesia) and Richards Bay (South Africa), shows that they were all about $120/ tonne or more from January-October of 2011 when the costs are expressed in terms of the equivalent of the lower BTU PRB coal.48 Table 1 above shows the cost break down for each of the benchmark coal prices. Clearly there is significant potential for profit for PRB coal, $55 to $65 per tonne, if it can be delivered at our estimated cost of about $70 per tonne and can be sold at delivered prices now being paid for coal deliveries on China’s south coast. As discussed later, the coal price indices for coal supplies to Asia declined in late 2011 and the first half of 2012. Despite these declines, PRB coal exports to China would still be competitive and profitable.
Table 1.
Note: Location of the coal ports: Richards Bay, South Africa; Korea West, North Korea; Qinhuangdao, China; New Castle, Australia, Kalimantan, Indonesia; PRB proposed or expanded North American west coast ports.
Of course, we have made many assumptions in these calculations based on current conditions. We have tried to be very conservative in those assumptions. But economic conditions can change and this PRB coal cost advantage could shrink. But it is clear that unless there are drastic changes in economic conditions, PRB coal can successfully compete for a share of the Chinese coastal trade and drive the cost of coal delivered to that market downward. Over time rail, shipping, and port costs could increase in real terms. Domestic taxes and import taxes on coal could increase. There could be natural and political disruptions in coal supply in China or important coal
47 Prices are from Platts International Coal Report Issue 1047. November 7, 2011. Shipping rates are from the same source except Qinhuangdao which is from issue 1030 and Korea West which is an interpolation based on Qinhuangdao. The Btu content of the PRB is assumed to be 8,800 Btu. 48 Platts International Coal Report, Issue 1047, November7, 2011.
OriginBtu
ContentPrice per
tonne FOBShipping cost to S. China 17% VAT port fee
Total delivered cost per tonne
Btu adjust for PRB
Advantage for PRB
Richards Bay 10,800 115.00$ 16.50$ 22.36$ 5.40$ 159.26$ 129.76$ 60.66$ Korea West 10,944 128.00$ 8.69$ 23.24$ 5.40$ 165.32$ 132.94$ 63.83$ Qinhuangdao 11,160 138.00$ 7.42$ -$ 5.40$ 150.82$ 118.93$ 49.82$ Newcastle 11,340 119.00$ 13.00$ 22.44$ 5.40$ 159.84$ 124.04$ 54.93$ Kalimantan 10,620 102.00$ 10.13$ 19.06$ 5.40$ 136.59$ 113.18$ 44.08$ PRB 8,800 37.95$ 16.50$ 9.26$ 5.40$ 69.11$ 69.11$ -$
Cost of coal delivered to SE China coast
PRB Coal Exports and GHG Emissions April 2013 TM Power & DS Power Page 21
exporting countries. Changes in the relative value of US and Chinese currencies could affect PRB competitiveness. Chinese and other coal suppliers, in response to competition, could improve the efficiency with which they produce their coal. However, given what we know now, it seem highly likely that PRB will be a highly competitive new source of coal to the industrial and population centers on the southeast coast of China.
Many other coal and investment analysts have made calculations that are similar to those presented here, also emphasizing that shipping PRB coal to the southern coast of China could be a very lucrative business.49 More tangible evidence of the potential profit that can be made from exporting North American coal to Asia from the west coast is provided by the PRB coal that the U.S. is currently shipping to China. Although Prince Rupert, BC, is 1,900 miles and the Westshore Terminal in Vancouver, B.C. is 1,600 miles from the Spring Creek Mine in Montana, Cloud Peak Energy shipped 4.5 million tons of coal from the PRB to Asia through these west coast ports in 2011.50 This very long overland transportation path bypasses the entire west coast of the United States due to the current lack of coal ports there.
The coal ports of Virginia Beach, Virginia, experienced massive delays in 2011 because the port was trying to operate well over capacity, partially to take advantage of the weather-related disruptions in international coal exports from Indonesia and Australia that shifted demand to the United States and other countries.51 Spurred by over-used port capacity at U.S. ports up and down the eastern seaboard, the major US coal companies began scrambling to ship coal in large volumes out ports on the Gulf of Mexico. “Despite taking more than 45 days to reach Asia, coal shipments from the U.S. have surged into Asia. But with huge queues off the busy East coasts ports of Newport News and Baltimore, shippers and producers are developing new capacity out of the Gulf of Mexico.”52 By contrast it would take less than half that time (approximately 21 days) to ship coal from the coast of Washington to southeastern China.53
Although the US is shipping coal to China through many different ports right now, and although we can show that it is a lucrative proposition for the coal companies to send PRB coal to China, there currently is no large scale American west coast coal port that allows the relatively close proximity of PRB coal to the west coast and the travel distance advantage of reaching China from the west coast. The existing North American west coast ports in Canada are too crowded and their shipping capacity is too small to accommodate a significant increase in coal exports. If significant volumes of coal from
49 http://www.wusa9.com/news/local/story.aspx?storyid=124286 and http://daily.sightline.org/2010/12/10/cooooooal-train/ and http://seekingalpha.com/article/225244-thermal-coal-as-u-s-export-industry 50 Cloud Peak Energy Investor Presentation November 2011. 51 http://hamptonroads.com/2011/02/coal-ships-create-sight-hampton-roads-waters 52 http://www.coalage.com/index.php/features/1087-coal-producers-a-shippers-work-to-increase-export-capacity.html 53 It takes approximately 20 days to ship coal from the Ridley Terminal in Prince Rupert, BC and come back. It is approximately one day farther from Vancouver, B.C. which we use as a proxy for the Bellingham area than from the Ridley Terminal. http://www.ecoalchina.com/english/news/gnmtxw/957746.shtml Also see: http://www.cn.ca/en/shipping-china-asia-north-america-coal.htm .
PRB Coal Exports and GHG Emissions April 2013 TM Power & DS Power Page 22
the PRB are going to move out of North America, new ports will have to be built. If new ports are not built, PRB coal will likely continue to be limited to serving existing U.S. markets which, while projected by EIA to be relatively flat in the aggregate, are likely to support significant additional PRB production.54 A major additional expansion of PRB coal sales beyond US domestic markets through exports to Asia largely hinges on the ability of the U.S. to ship PRB coal out of new or expanded ports on the west coast of North America.
The proposed coal shipping ports of Longview and Cherry point together represent some 130 million tons of additional coal shipping capacity.55 The Westshore Terminals in Vancouver, BC, plans to expand its export capacity from 24 to 33 million tons and the Port Ridley in northern British Columbia plans an expansion of from 12 to 24 million tons.56 In addition, Ambre Energy and Kinder Morgan Terminals have proposed a coal export project at the Port of St. Helens upstream from Longview on the Oregon side of the Columbia and an undisclosed company has proposed developing a coal port at Coos Bay, Oregon. Considering only those facilities that have developed detailed plans, the combined new export capacity on the west coast of North America has the potential to exceed 150 million tons of coal per year in the near future. In the analysis below we have assumed that 140 million tons per year of PRB coal will be exported from west coast ports to Asia by 2025. Stanford University’s Program on Energy and Sustainable Development has modeled the market for PRB coal at current ocean shipping costs and concluded that 163 million tons of PRB coal would have been competitive in Asian markets in 2009 if there were no port or other constraints on shipping coal from the west coast.57
54 EIA projects that in order to meet tightening EPA air quality standards and offset declines in central Appalachian coal production due to rising costs of production, the demand for PRB coal within the US will expand between 2010 and 2035 at a rate of about 10 million tons per year, raising PRB coal production from about 500 million tons per year in 2010 to about 700 million tons in 2035 despite static aggregate coal consumptions levels in the United States. 55 The Bellingham Herald reports that the Gateway Pacific terminal could ship 50 million tons at maximum capacity. The Seattle PI reported in internal emails from Ambre (Millennium’s corporate parent) revealed that they planned to ship 80 million tons from the proposed port facility. http://www.bellinghamherald.com/2011/08/11/2137016/cherry-point-cargo-terminal-could.html and http://blog.seattlepi.com/seattlepolitics/2011/03/15/strategic-withdrawal-for-longview-coal-exporter/ 56 Slide 15 of Cloud Peak Energy’s Annual Stockholder Meeting from 2011 shows that these expansions are underway. 57 Asia’s Changing Landscape. Richard Morse and Lars Schernikau. World Coal. October 2011. http://hms-ag.com/fileadmin/user_upload/pdf/2011-10b_WorldCoal_LS_Article_Asian_Coal.pdf. Also see, "US Coal: A Stranded Asset Ready for Export?", presentation at IEA Outlook for Coal Industry and Markets, Richard Morse, April 14, 2011, Beijing. Dated 12/04/2011, http://www.iea.org/work/2011/WEO_Coal/03_02_MORSE.pdf .
PRB Coal Exports and GHG Emissions April 2013 TM Power & DS Power Page 23
III. The Sensitivity of Chinese Coal Use to the Cost of Coal
1. Downward Competitive Pressure on the Cost of Coal on China’s South Coast
In the analysis above, we have estimated that at current shipping costs and PRB mine mouth coal prices, PRB coal could be sold to coal users on China’s southern coast at significant margins above the costs of production and transportation: $50 to $60 per metric tonne. Stated somewhat differently, PRB coal could potentially undersell domestic Chinese coal and the major existing international exporters delivering coal to the southern China coast by 40 to 50 percent. Note that this calculation is not very sensitive to the mine mouth cost of PRB coal. We assumed a real price of $16.50 per metric tonne for our modeling while in late March 2012 PRB coal was selling for about $8.34 per metric tonne on the spot market and has sold for less than $16.50 for the last several decades. In addition, the mine mouth costs make up less than a quarter of the cost of delivering the coal to the south coast of China. Modest changes in the PRB mine mouth price will not significantly affect our results. Ocean shipping rates have been volatile in the past although in late January 2012 they were falling dramatically because of the lingering effects of the Great Recession and uncertainty as to whether a new recession might be developing in various important global trading countries. The large fleet of under-utilized Panamax ships is likely to keep international dry bulk shipping rates relatively stable for the foreseeable future. If and when the global economy recovers completely and begins growing rapidly, ocean freight rates could, ultimately, be expected to rise at least in the short run. If international trade were expanding and higher freight rates were being earned, however, more dry bulk ships would be built and shipping rates would move down again. The assertion that the entry of PRB coal into the world coal market on a relatively large scale (100 to 200 million tons per year) will have an impact on the price of sea-borne coal delivered to Asian markets should not be controversial. The sea-borne coal trade represents only a small part of total coal consumption in the world. Most countries rely primarily on their own domestic sources and then either import or export as attractive opportunities present themselves. As a result, a modest change in the volume of coal entering the world market can have significant impacts on world coal trade prices (see Figure 1 above). This potential was clearly recognized during 2011 and the first half of 2012 when U.S. coal exports increased significantly. One force driving the increase in U.S. exports
PRB Coal Exports and GHG Emissions April 2013 TM Power & DS Power Page 24
despite limited increases in coal demand worldwide was the decline in the demand for coal within the United States as very inexpensive natural gas displaced coal for electric generation. Commentators worried that this “dumping” of U.S. coal on the world market was one of the sources driving the value of internationally traded coal in Asia downward.58 Between mid-February and mid-May 2012 the seaborne thermal coal price indices for the primary countries exporting to Asia plunged from relative peaks in the $100 to $120 per tonne range to the $80 to $85 range. The price for Australian coal fell about 30 percent, that for Indonesian coal 25 percent, and that for South African coal 20 percent.59 The Chinese coal price index for domestic Chinese coal delivered to the Bohai ports in northeastern China (Qinhuangdao Index) also declined 20 percent between November of 2011 and June of 2012. Looking forward, world coal market analysts project that the despite the depressed world coal prices in the first part of 2012, the declining domestic demand for coal within the U.S. will motivate continued interest in expanding American coal port export capacity significantly, including new and expanded coal ports on the west coast. That export capacity combined with the low cost of PRB coal will put downward pressure on world coal prices and prevent them from rebounding to their previous highs. As a UBS Securities analyst put it:60
We believe the new [US coal export] capacity will not bode well for international pricing. Once international prices rise to a certain level, it becomes economical for US producers to enter the export market. The impact on international pricing may have been muted in the past due to [U.S.] port capacity constraints. With 270 million tons of export capacity, US producers would be able to quickly flood the international market with coal once pricing becomes attractive. Theoretically, this would quickly put a cap on international [coal] pricing.
It is clear that PRB coal could put significant downward pressure on the price of coal being delivered to the industrial and population centers on the southern coast of China. It is important to understand that we are focused on a distinct part of total Chinese coal consumption: the coastal areas of China that already receive their coal from ocean-going ships even when it is domestic Chinese coal that is being delivered. It is important to reiterate that we are not treating China as one big market that is potentially open to PRB coal. Nor are we suggesting that PRB exports to China would dramatically change the price of coal across China. Neither of these is a likely outcome of PRB exports. Instead, we have focused on a relatively small (with respect to total Chinese thermal coal consumption) and well defined Chinese coal market that is responsible for less than a fifth of total Chinese coal consumption. We are not suggesting that PRB coal exports would fundamentally change the economics of coal use across China. What we 58 This was almost certainly an over-simplification. Growth in Chinese coal consumption had slowed and Europe was teetering on the edge of a recession. So there were forces other than expanded American exports pushing world coal trade prices down. 59 UBS Investment Research, Coal, “Floor-seeking in Thermal Coal,” Tom Price, June 25, 2012. 60 “Some Coal Export and Port Capacity Math,” Shneur Z. Gershuni, UBS Investment Research, US Coal, May 21, 2012. www.ubs.com/investmentresearch.com .
PRB Coal Exports and GHG Emissions April 2013 TM Power & DS Power Page 25
are analyzing is the impact of an additional low-cost competitor with the potential for a very large increment of supply entering a relatively small market, compared to the entire Chinese domestic market, where Chinese domestic coal, Australian, and Indonesian coal already compete to serve coal users. As pointed out above, the 600 million tonnes of coal consumed in this south eastern Chinese coal market is large relative to total PRB production, total U.S. consumption, and total international trade in coal.
2. The Determinants of Coal Usage Economists typically discuss the markets for a product in terms of supply and demand interacting to determine the price. Alternatively, they analyze how a change in price can lead to changes in the quantity of a product consumed (demand) or the quantity of a product produced (supply). To many this sounds like a fairly abstract theoretical way to look at much more complex business decisions, suggesting that only markets and prices matter. In the real world where complex judgments are made in particular political, social, and technological settings, such an emphasis only on markets and prices would be naive and potentially misleading. We agree, but that is not what the study of economic demand and supply does. It is important to understand that economic analysis in terms of markets, supply, demand, and price are not intended as narrow theoretical concepts. They are better thought of as discussing categories of important forces that influence decisions about how to use available resources. The idea is not to narrowly focus on one economic force to the exclusion of others but to systematically evaluate all of the relevant forces. The economic concept of demand, for instance, does not involve a focus only on the price and quantity purchased of a particular commodity. Rather the demand for a particular commodity is seen as determined by a broad variety of different economically relevant considerations: income levels, the growth of the economy, changing tastes, existing technologies, government regulations limiting or encouraging use, etc. The same is true of the economic concept of supply: It is not simply the relationship between the amounts supplied by producers at a given price. Supply involves the existing structure of costs of production, how technological change is modifying those production costs, what drives that technological change, how government regulation impacts production processes, the degree of competition among suppliers, etc. The recent history of coal mining in the Powder River Basin underlines the complex interaction of these different types of economic forces. One of the most powerful forces driving the expansion of the market for PRB coal, an expansion that has led it to become the dominant source of coal supply in the United States, was the Clean Air Act that limited the emissions of sulfur into the atmosphere. Achieving the mandated reductions in emissions from coal-fired power plants required either installation of emissions control technologies that captured the sulfur or shifting to a type of coal that contained less sulfur or some combination of the two. The lowest cost alternative often involved power plants shifting the source of at least some of their coal supply to PRB coal and using less of the higher-sulfur eastern coals. This shift in supply and demand
PRB Coal Exports and GHG Emissions April 2013 TM Power & DS Power Page 26
involved relatively complicated analyses of the costs associated with various technologies, the development of low cost coal mining technologies in the PRB, as well as the development of efficient coal train technologies. The development of much more efficient electric generators burning natural gas was also important given that pipeline-quality natural gas is very low in sulfur. This development of a non-coal alternative generating technology also led to eastern coal sources being displaced in the generation of electricity. The increasingly strict regulation of sulfur emissions drove what amounted to a restructuring of U.S. coal markets. Clearly major change in U.S. coal markets was not simply a matter of the cost of PRB coal being low. Environmental regulations and technological developments were powerful forces too. As we will discuss in more detail below, much more than just price or cost drive coal consumption decisions although, ultimately, price or cost plays an important role in almost any resource use decision whether that decision is being made by a government agency, a state owned enterprise operating in a mixed market-regulator regime, or a private commercial firm.
3. The Sensitivity of Coal Consumption to Cost The way in which commodity purchasers adjust their use in response to changes in the cost of using a commodity has been the focus of empirical economic analysis for a century or more. The analysis of how energy users adjust their usage in response to changes in the cost of that energy has received considerable careful empirical analysis since the first modern energy crisis in the mid-1970s. The response of Chinese coal users to changes in coal costs has also been the subject of empirical analysis. Our earlier report on PRB coal exports summarized forty years of studies of the sensitivity of energy use to the costs of that use.61 What almost all of those studies show is that given sufficient time to adjust to changes in energy costs, energy usage is significantly guided by energy costs. Higher energy costs discourage energy use; lower energy costs stimulate energy use. The reason time is important in terms of facilitating flexibility in energy usage is that the level of energy use is often dictated by the characteristics of the energy-using technology already in place. Once a particular set of technologies is in place, energy usage often can be adjusted up or down only by adjusting production up or down. Over time, however, the energy efficiency of those technologies can be modified, at a cost, moving energy usage up or down more substantially and permanently.
61”The Greenhouse Gas Impact of Exporting Coal from the West Coast: An Economic Analysis,” Thomas M. Power, 2011, Sightline Institute, pp. 5-11. http://www.sightline.org/research/energy/coal/Coal-Power-White-Paper.pdf
PRB Coal Exports and GHG Emissions April 2013 TM Power & DS Power Page 27
Specific empirical analysis of coal usage in China, found that a 10 percent change in the cost of coal led, over time, to a 12 percent change in coal consumption, in the opposite direction.62 Many other studies of energy usage in the United States and Europe have found similar long run sensitivities of energy use to energy costs: A one per cent change in energy cost resulting, ultimately, in a one percent change in energy usage in the opposite direction. It is important to understand that statements about the sensitivity of energy use to energy cost do not necessarily mean that when energy prices go up, energy consumption will actually go down. As pointed out above, if incomes are rising, people may choose to consume more energy. Similarly, if technological change and consumer preferences have led households to own an expanded set of energy using technologies, energy usage may still increase despite higher energy costs. This does not contradict the assertion that actual data on energy user behavior clearly indicates that low energy costs encourage energy usage and higher energy costs discourage energy usage. Even if changes in income, rate of economic growth, consumer preferences, etc. encourage increased energy usage, the increase in energy usage would have been even higher if it were not for the increase in energy cost. That is, energy usage remains sensitive to energy cost, but other changes in the economy can mask but not eliminate that effect of higher energy costs.
4. The Potential Impact of a Significant Decline in the Cost of Coal on Coal Consumption and GHG Emissions in the South China Coastal Market
As we have discussed above, there is the potential for substantial competition among the current and potential future coal suppliers to the industrial and population centers on the southern coast of China. The various PRB coal companies could potentially ship their coal through a variety of proposed and existing coal ports on the North American west coast using a variety of rail networks at a much lower cost than existing coal suppliers to the south China coastal market. The PRB can deliver that coal at costs 40 percent or more below most existing sources of supply including domestic Chinese coal delivered by ship from China’s northeast coal ports, Australia, and Indonesia.63 See Table 1 above. PRB coal companies, of course, hope to pocket as profits the difference between current suppliers’ delivered costs and PRB delivered costs. Competition, however, will almost certainly put pressure on current suppliers to reduce their costs to remain competitive. The various PRB mining companies seeking access to Chinese coastal markets will compete with each other by offering lower prices. The existing coal
62 “The structural break and elasticity of coal demand in China: empirical findings from 1980-2006,” Jiao, J-L, Fan, Y. and Wei, Y-M, International Journal of Global Energy Issues 31(3/4):331-344, 2009, p. 340. 63 There are supply sources that are competitive with PRB coal delivered to the southern coast of China. They, however, make up only about a third of the 600 million tonnes of coal currently being delivered by ship there. See Wood Mackenzie, Trends in Global Coal Markets, Jeff Watkins, January 2012, slide 20.
PRB Coal Exports and GHG Emissions April 2013 TM Power & DS Power Page 28
companies that have been serving these markets are unlikely to simply surrender those markets. Competition among alternative suppliers can be expected to push the coal costs faced by customers on the south coast of China downwards. The domestic Chinese cost of coal delivered to the southern coast has risen substantially in recent years as has the cost of imports to China from other countries.64 The high costs of coal delivered to the south China coast is one of the things that makes PRB coal companies eager to tap into those markets. Those recently high costs of Chinese imported coal also suggest that a large new source of supply, large relative to the approximately 600 million tons of coal current being delivered to the south China coast, such as PRB coal, could put significant downward pressure on the current cost of delivered coal there. If competition completely eliminated the advantage PRB coal had by reducing the delivered cost of coal to the south coast of China by approximately 40 percent relative to Chinese domestic, Australian, and Indonesian sources,65 that could be a powerful stimulus to use more coal just as the recent increases in the cost of coal to those customers have served as a powerful stimulus to invest in improving the energy efficiency of coal-consuming production processes. Resulting changes in the cost of the goods produced by coal-intensive processes would also, ultimately, be conveyed through changes in product prices, encouraging or discouraging consumption of those products.
If, as the study of Chinese coal usage cited above concluded, a 10 percent change in price ultimately results in a 12 percent change in coal usage in the opposite direction66, a 40 percent decline in the cost of using coal in this particular small part of the overall Chinese coal market, would result ultimately in a 50 percent increase in the burning of coal. The impact is proportional to the price decline: If coal prices on the south China coast decline 20 percent, coal consumption could increase by about a quarter. Etc. Chinese domestic coal prices and the coal prices of major coal exporting countries do move substantially depending on market conditions. As a result of the 2008 financial crisis and recession in the U.S. and other countries, coal spot market prices at the coal ports in Qinhuangdao, China, Newcastle, Australia, and Richards Bay, South Africa, plunged 50 percent or more between the summer of 2008 and the spring of 2009. In the fall of 2009 coal export prices began to rise again, regaining a significant part of the losses. In late 2011 and 2012, however, coal prices in China, Australia, Indonesia, and South Africa declined 10 to 20 percent.67
64 Bloomberg spot market quotes for Qinhuangdao, China, Richards Bay, South Africa, and Newcastle, Australia. Five year charts March 9, 2007, through February 3, 2012. 65 Indonesian coal is the coal source most competitive with PRB coal. See Table 1 above. It is also the largest sea-borne exporter of coal to China. Its supply, however, has been relatively unreliable. That has led Chinese purchasers to discount the price they are willing to pay for it, which partially explains its lower delivered cost. See Manila Bulletin, March 27, 2010, “Indonesia’s new price reference expected to benefit coal miners,” Fitri Wulandari, www.mb.com.ph/node/249806/indonesia . 66 “The structural break and elasticity of coal demand in China,” op. cit. 67 China Daily, June 29, 2012, “Coal Prices Drop to Record Low,” Du Juan. Platts International Coal Report, Issue 1047, November 7, 2011; Bloomberg spot market coal price quotes, steam coal, FOB
PRB Coal Exports and GHG Emissions April 2013 TM Power & DS Power Page 29
However, the export of 127 million metric tonnes (140 million short tons) of PRB coal to markets on the south China coast that receive 600 million tonnes of coal from sea-borne trade would not drive delivered costs of coal down 40 percent since most of the market would still have to be served by other, more costly, sources. Our modeling indicates that PRB exports at that level would reduce coal prices by 12.4 percent from $126 to $110 per metric ton.68 That would lead consumption to increase by 14.9 percent, from 600 to 690 million tonnes.69 That is, the export of 127 million metric tonnes would lead to an increase in coal consumption of about 90 million tonnes of coal. Coal consumption would increase by about 70 percent of the coal exported and the GHG emissions would increase by a similar percentage, representing an annual increase in GHG emissions of about 183 million tons of CO2. This is over 14 times the coal consumption and GHG emissions of Washington’s Centralia electric generating plant that has been scheduled for closure to reduce Washington’s GHG emissions. As mentioned repeatedly above, this does not mean that coal usage on the south China coast would suddenly swing one direction or the other. It is the growth in electricity consumption and, with it, the growth in coal consumption that will dominate coal usage, especially in the short run. The cost of coal will affect the investments made in the energy efficiency of new or retrofitted electric generators. That, in turn, will determine the long run energy usage associated with the technology that those investments put in place. As coal prices affect electric prices, they will also affect the investments made in the electric efficiency of production processes and appliances. It is largely through those business investment decisions that long-run energy consumption patterns are determined. This is important to keep in mind. Lowering costs to industrial coal and electricity users on the south China coast now will lead to investment decision in long-lived production facilities that will commit those customers to higher levels of coal and electricity consumption and GHG emissions for a third- to a half-century into the future. The price of coal will not be the only economic force guiding coal use decisions in China. In addition the ongoing expansion of the Chinese economy, the rising standard of living, and the increased purchase of electric-using appliances is certain to continue to push the demand for electricity and with it the demand for coal upwards. That, however, as pointed out above is not evidence that higher or lower coal costs do not matter. It is simply evidence that many things matter, one of which is energy cost. coal ports in various countries: http://www.bloomberg.com/quote/CLSPAUNE:IND/chart ; http://www.bloomberg.com/quote/CLSPCHQI:IND/chart . 68 Delivered price per ton has been adjusted, as in Table 1, to reflect the same cost per million Btu as PRB coal. Hence the “prices” discussed here are below the actual delivered costs per tonne of the higher Btu Asian and Australian coals. 69 The price elasticity of demand was assumed to be -1.2 as cited earlier. The price elasticity of supply was assumed to be 0.5. See “Coal Markets, Carbon Leakage and the Kyoto Protocol,” Miles K. Light et al., Discussion Papers in Economics, Working Paper No. 99-23, Center for Economic Analysis, Department of Economics, University of Colorado at Boulder, 1999, p. 4; “World fossil fuel subsidies and global carbon emissions,” Bjorn Larsen and Anwar Shah, World Bank, Working Papers, 1992, p. 13. Lars Schernikau Estimated world thermal coal supply elasticities in the 0.75 to 0.9 range for 2005-2006. See Economics of the International Coal Trade: The Renaissance of Steam Coal, 2010, New York: Springer, p.134, Figure 5.16. We have calculated the elasticity as the percentage increase in supply that is possible for a given increase in price to cover production costs.
PRB Coal Exports and GHG Emissions April 2013 TM Power & DS Power Page 30
From the point of view of the carbon emissions associated with PRB coal exported to Asian markets, what these results indicate is that most of the carbon associated with the combustion of that coal represents net additions to global greenhouse gas emission. That is, only about 30 percent of the carbon emissions from the combustion of that coal are offset by reductions in the use of other coal sources. The other 70 percent is a long run burden on the global atmosphere due to the reductions in the cost of coal to consumers on the south China coast. There is a substantial net increase in greenhouse gas emissions associated with the export of PRB coal. It is important to note that PRB coal mines earn substantial profits if the price of coal delivered to the south China coast only declines about 12 percent while PRB delivered coal costs remain fixed at over 35 percent below that price. In that setting, PRB coal mines will seek to increase their share of the southeastern Chinese coastal trade by offering even lower prices, thus encouraging even more coal consumption and GHG emissions. The volume of the Chinese coastal trade is also likely to increase significantly. Wood Mackenzie, for instance, projects that Chinese sea-borne thermal coal imports will rise from less than 200 million tonnes in 2010 to 1,200 million tonnes by 2030. Total Pacific sea-borne thermal coal trade was projected to increase from about 500 million tonnes to 2,000 million tonnes over the same time period. Wood Mackenzie project that 600 million tonnes of that Pacific sea-borne thermal coal trade could be supplied by the United States by 2030, a gigantic increase in U.S. Asian thermal coal exports compared to the 74 million total tons of coal exported by the U.S. in 2010.70 Most of that was not thermal coal and not exported to Asia. Thus the PRB exports to China and other Asian countries in the future could far exceed the 140 million tons we have modeled here if infrastructure in the U.S. Pacific Northwest is built to facilitate that export. As a result the ultimate impact on GHG emissions could also be many times what we have discussed here.
It should be noted that our analysis above focused on the impact of competition to serve the south China coastal coal markets on GHG emissions where the coal is burned. We did not include the impact on GHG emissions associated with the different transportation modes and routes that might be used to deliver that coal to the south China coast.
We do not believe that the exclusion of those potential GHG effects leads to a significant understatement the GHG emissions. The direct combustion of the large volumes of coal we were analyzing produces far more GHG emissions than the shipping of the coal. The coal is almost exclusively shipped by rail and water routes. These transportation modes of shipping are the most energy efficient modes available. They are significantly more energy efficient than, for instance, highway truck traffic.
70Trends in Global Coal Markets, Jeff Watkins, presentation at Meet Alaska 2012, January 2012, Slides 9, 10, and 15. For 2010 U.S. coal exports see http://www.worldcoal.org/coal/market-amp-transportation/ .
PRB Coal Exports and GHG Emissions April 2013 TM Power & DS Power Page 31
In our analysis, the shipping from the PRB to the southern coast of China added about 5 percent to the GHG impacts compared to the impacts of increased coal combustion there.71
However, what is relevant is the difference in carbon emissions for transportation from the alternative sources of coal mine southeastern Chinese coastal industrial centers. The long transportation route from the PRB to the southeastern coast of China is not unique. All routes to the SE coast of China from both domestic Chinese and alternative coal exporting counties are also long. For instance, the new sources of coal being developed in Mongolia are being trucked, a high carbon alternative, into China, transferred to trains for shipment to the northeastern Chinese ports, and then loaded on ships for delivery to the southeastern coast cities such as Hong Kong and Shanghai. Australia’s coal ports are about the same distance to SE China as North American west coast ports are and involve significant rail distances although not as long as for PRB coal to the west coast. If the transportation GHG impacts of the alternative sources of supply were half that of the transportation from the PRB, an assumption that we believe understates the alternative coal delivery costs, the additional GHG emissions from transportation of PRB coal to the southern coast of China would be less than 3 percent of the GHG impacts of the combustion of that coal. This is definitely a second- or third-order impact.72
Finally, comparing Chinese GHG emissions for transportation from mine to port is problematic because the efficiency of Chinese and American transportation systems is not the same. One cannot just use the differences in rail distances to compare US to Chinese transportation GHG emission. The same is true of Indonesia which is closer to southeastern China but has higher GHG emissions both at the mine sites and in transporting coal to ports because of lower efficiency. China is investing in Russian Siberian and eastern Russian coastal coal and coal ports: the Russian Republic of Tuva north of Mongolia and the Russian island of Sakhalin northwest of Japan. The
71 For a reference point, the combustion of PRB coal releases 1.87 tons of CO2 equivalent per ton of coal burned. Shipping PRB coal by rail 1,100 miles to the west coast (and returning the train an equal distance) releases 0.061 tons of CO2 equivalent per ton of coal. Shipping the coal 4,000 nautical miles to China emits 0.009 tons of CO2 equivalent per ton of coal. The transportation adds a bit less than 0.07 tons of CO2 equivalent for each ton shipped. This is 3.7 percent of the combustion emissions of a ton of coal. However, while 140 million tons of PRB coal are shipped, only 98 million tons of additional coal is burned because of the displacement effects. (Steven J. Davis, Department of Global Ecology, Stanford University and Joint Institute for the Study of the Atmosphere and Ocean, Climate Impacts Group, University of Washington. http://earthfix.kuow.org/energy/article/earthfix-conversations-counting-up-coals-co2/ .) Thus the transportation costs are a higher percentage of the coal combustion impacts, 5.3 percent, if the transportation GHG emissions for alternative sources of coal supply are zero, which, of course, is not the case. In fact, it is likely that those transportation emissions are likely to be similar for alternative sources and, therefore, the likely net transportation emissions impacts are likely to be quite small. 72 A “second order impact” is one that is less than a tenth of the impact of the base level. A third-order impact would be one that is only one-one-hundredth of the base level. The gap between these reference points the difference between 1 and 10 percent. GHG coal transportation impacts compared to coal combustion impacts (2.7 percent) are closer to the 1 percent than to 10 percent, and, in that sense, are a third-order impact.

PRB Coal Exports and GHG Emissions April 2013 TM Power & DS Power Page 32
transportation challenges and the transportation GHG emissions for those developments to serve Chinese markets are also huge.
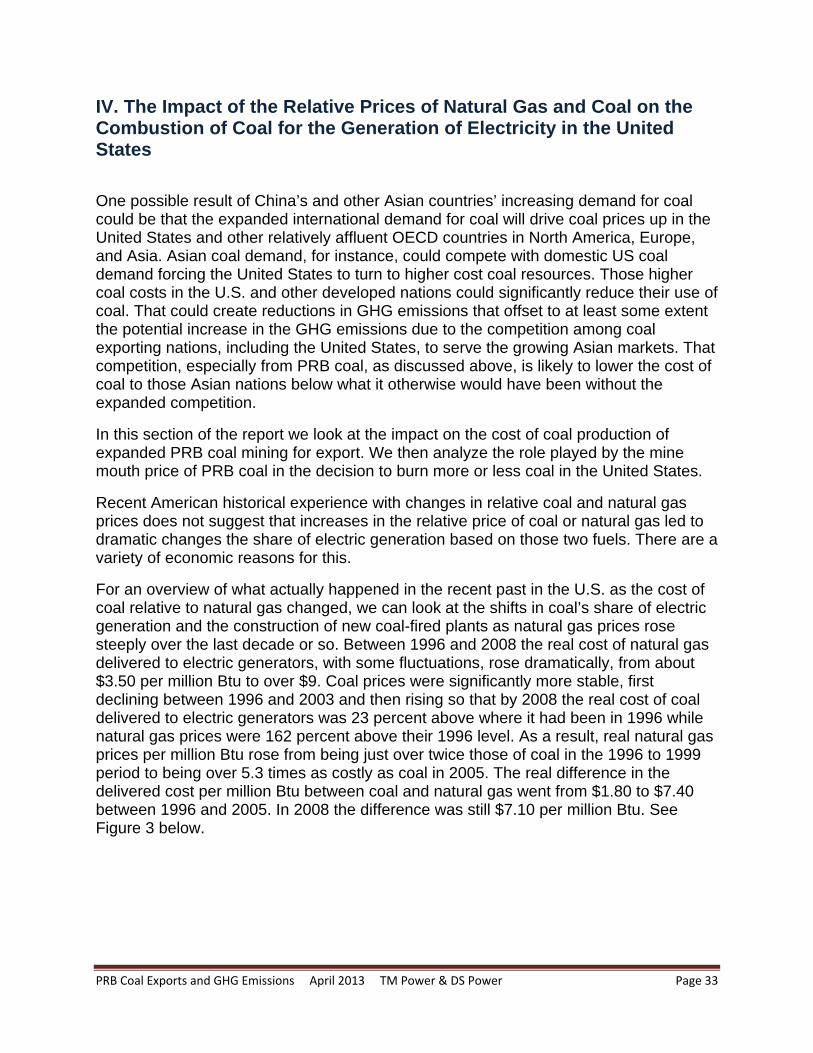
PRB Coal Exports and GHG Emissions April 2013 TM Power & DS Power Page 33
IV. The Impact of the Relative Prices of Natural Gas and Coal on the Combustion of Coal for the Generation of Electricity in the United States
One possible result of China’s and other Asian countries’ increasing demand for coal could be that the expanded international demand for coal will drive coal prices up in the United States and other relatively affluent OECD countries in North America, Europe, and Asia. Asian coal demand, for instance, could compete with domestic US coal demand forcing the United States to turn to higher cost coal resources. Those higher coal costs in the U.S. and other developed nations could significantly reduce their use of coal. That could create reductions in GHG emissions that offset to at least some extent the potential increase in the GHG emissions due to the competition among coal exporting nations, including the United States, to serve the growing Asian markets. That competition, especially from PRB coal, as discussed above, is likely to lower the cost of coal to those Asian nations below what it otherwise would have been without the expanded competition.
In this section of the report we look at the impact on the cost of coal production of expanded PRB coal mining for export. We then analyze the role played by the mine mouth price of PRB coal in the decision to burn more or less coal in the United States.
Recent American historical experience with changes in relative coal and natural gas prices does not suggest that increases in the relative price of coal or natural gas led to dramatic changes the share of electric generation based on those two fuels. There are a variety of economic reasons for this.
For an overview of what actually happened in the recent past in the U.S. as the cost of coal relative to natural gas changed, we can look at the shifts in coal’s share of electric generation and the construction of new coal-fired plants as natural gas prices rose steeply over the last decade or so. Between 1996 and 2008 the real cost of natural gas delivered to electric generators, with some fluctuations, rose dramatically, from about $3.50 per million Btu to over $9. Coal prices were significantly more stable, first declining between 1996 and 2003 and then rising so that by 2008 the real cost of coal delivered to electric generators was 23 percent above where it had been in 1996 while natural gas prices were 162 percent above their 1996 level. As a result, real natural gas prices per million Btu rose from being just over twice those of coal in the 1996 to 1999 period to being over 5.3 times as costly as coal in 2005. The real difference in the delivered cost per million Btu between coal and natural gas went from $1.80 to $7.40 between 1996 and 2005. In 2008 the difference was still $7.10 per million Btu. See Figure 3 below.
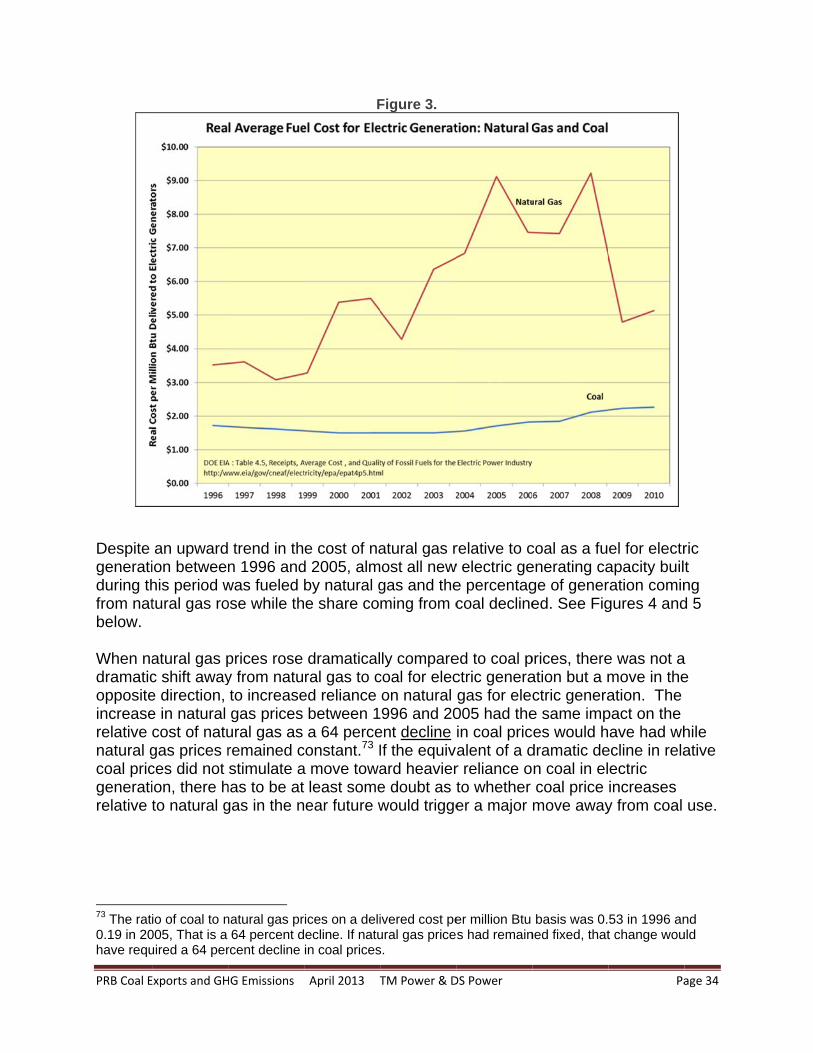
PRB Coal E
Despite generatiduring thfrom natbelow. When nadramaticoppositeincreaserelative natural gcoal pricgeneratirelative t
73 The rat0.19 in 20have requ
Exports and GH
an upwardion betweenhis period wtural gas ro
atural gas pc shift awaye direction, e in natural cost of natugas prices rces did not ion, there hto natural g
io of coal to n
005, That is a uired a 64 per
HG Emissions
trend in thn 1996 and
was fueled ose while th
prices rose y from natuto increasegas prices
ural gas as remained cstimulate a
has to be atgas in the n
natural gas pr
64 percent drcent decline
April 2013 T
F
e cost of nad 2005, almby natural ge share co
dramaticalral gas to c
ed reliance between 1a 64 perce
constant.73 Ia move towa
least someear future w
ices on a deliecline. If natuin coal prices
TM Power & D
Figure 3.
atural gas rost all newgas and theming from c
ly comparecoal for elecon natural 996 and 20
ent decline If the equivard heaviere doubt as twould trigge
ivered cost peural gas prices.
DS Power
relative to cw electric gee percentagcoal decline
ed to coal pctric generagas for elec005 had thein coal pricalent of a dr reliance oto whether er a major
er million Btu s had remain
coal as a fuenerating cage of genered. See Fig
prices, thereation but a mctric generae same impces would hdramatic den coal in elcoal price move away
basis was 0.ned fixed, that
Pa
el for electrapacity builration comingures 4 and
e was not amove in theation. The pact on the ave had wh
ecline in relaectric increases y from coal
53 in 1996 ant change wou
age 34
ric t ng d 5
a e
hile ative
use.
nd uld
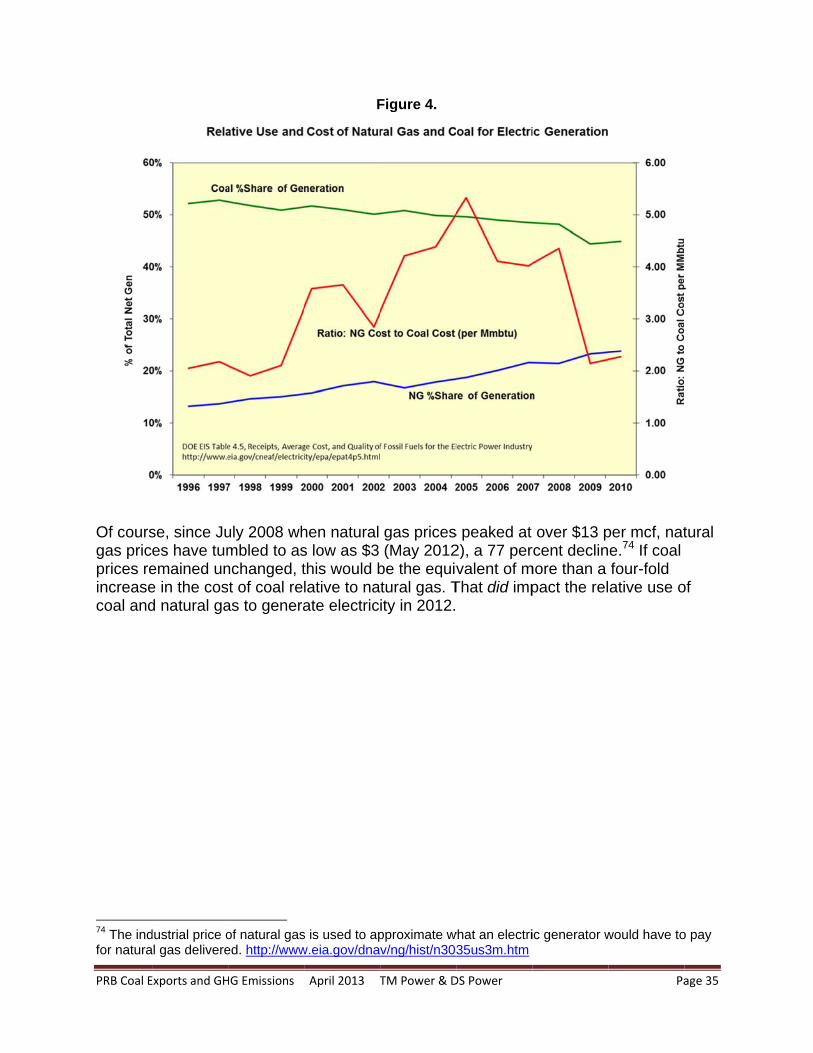
PRB Coal E
Of coursgas pricprices reincreasecoal and
74 The indfor natura
Exports and GH
se, since Jues have tumemained une in the cosd natural ga
dustrial price oal gas delivere
HG Emissions
uly 2008 whmbled to asnchanged, tt of coal rel
as to genera
of natural gased. http://www
April 2013 T
F
hen natural s low as $3 this would blative to naate electric
s is used to apw.eia.gov/dna
TM Power & D
Figure 4.
gas prices(May 2012
be the equivtural gas. Tity in 2012.
pproximate wv/ng/hist/n303
DS Power
s peaked at 2), a 77 pervalent of m
That did imp
what an electri35us3m.htm
over $13 prcent declin
more than a pact the rel
ic generator w
Pa
per mcf, nate.74 If coal four-fold ative use o
would have to
age 35
tural
of
o pay
PRB Coal Exports and GHG Emissions April 2013 TM Power & DS Power Page 36
Figure 5.
As emphasized earlier, this is not evidence that energy costs do not matter, just that the relationship between fuel prices and fuel choice has multiple dimension to it that have to be taken into account in order to see that relationship. We turn to those determinants of fuel choice in electric generation in the following sections.
1. The Determinants of Fuel Choice for Electric Generation
There are several distinctions that need to be made in order to understand the forces determining the use of coal to generate electricity in the United States.
First, cost does matter. However, as in all of economics, it is the relative cost that matters, the cost relative to the cost of the alternative. In this case the costs associated with using coal relative to the costs of using natural gas to generate electricity. In addition, the price of a fuel is only part of the cost of generating electricity. It is the whole range of costs associated with using a fuel to produce electricity that matters in the economic choice of fuels. In addition to the mine-mouth or well-head price of the fuel, there are significant other costs that determine how attractive a fuel is for electric generation. Some of the more significant non-fuel costs include the following:
Source: Annual Energy Outlook 2011, DOE-EIA, p. 74
PRB Coal Exports and GHG Emissions April 2013 TM Power & DS Power Page 37
i. The transportation costs associated with delivering coal or natural gas to an electric generating facility often can represent a significant part of the delivered cost of coal, reducing the relative importance of the mine-mouth or well-head prices.
ii. The different capital investment and annual operation and maintenance costs associated with generators using different fuels can be a large part of the total costs of generation with a particular fuel.
iii. The capital and operational costs associated with using the fuel while meeting environmental regulations and public expectations about air and water quality can be substantial. In some settings, burning coal is simply not permittable.
iv. The mix of coal- and natural gas-fired generators in the existing fleet of electric generators may limit the ability of that fleet to shift generation from generators powered by one of the fuels to generators powered by the other when the relative price of the two fuels changes. The intensity of the use of one type of plant as opposed to another based on the variable costs of operation is called economic dispatch.
v. The relative efficiency of the conversion of the heat content of the fuel into electricity differs for the technologies using the different fuels.
vi. The risks associated with the reliability of fuel supply and stability of future fuel prices is important in electric generation investment decisions.
vii. The limitations associated with long-term contracts with fuel suppliers, pipeline delivery systems, and rail lines can limit adjustments to changes in relative fuel prices. There may also be political pressure to use local, in-state, fuels.
i. The Role of Transportation Costs in Determining the Delivered Cost of Coal
Powder River Basin coal, at the mine, is one of the cheapest sources of coal energy in the world, largely because it is located close to the surface in relatively thick seams that can be surface mined. As a result, as discussed earlier, the mine mouth price of PRB coal, after taking into account its lower energy (Btu) content, has been the cheapest coal in the United States. The average cost per million Btu over the last 15 years has been about a third of the mine-mouth cost of the alternative thermal coal, bituminous coal, which is largely found east of the Mississippi. See Figure 6 below.
The PRB coal, however, is located at considerable distance from most of the nation’s electric generating facilities. As a result, transportation cost make up much of the delivered cost of PRB coal, especially to generating facilities the furthest from the PRB, such as the southeastern United States. In 2010, for instance, two-thirds of the cost per million Btu of PRB coal delivered to the southeastern states represented transportation
PRB Coal Exports and GHG Emissions April 2013 TM Power & DS Power Page 38
costs, $1.38 out of the $2.12 per million Btu delivered cost of the PRB coal.75 That is, the delivered price of PRB coal to electric generators the furthest distance from the PRB was three times the mine mouth price of that coal. Because the mine mouth cost of the coal is only a fraction of the delivered price of the coal, small increases in the mine mouth cost will have a muted effect on the delivered cost of the coal and likely on the domestic consumption of the coal. Despite that transportation cost disadvantage, PRB coal has been increasingly competitive across the United States. This has not been just because of the low mine mouth cost. It is also tied to the very low sulfur content that makes PRB coal a low cost way of meeting electric generator air emission regulations. This will be discussed below.
ii. Life-Cycle Costs of Electric Generation versus Fuel Costs of Generation The relative costs of fuel on a Btu basis or on the basis of fuel cost per megawatt hour generated cannot by themselves indicate which fuel will generate electricity at the lowest cost. One cannot produce electricity by burning fuel in the open atmosphere. Substantial capital investments must be made in electric generating equipment as well as supporting facilities. In general the capital costs associated with coal-fired generation are substantially higher than the capital costs associated with natural gas-fired generation. It also takes a considerably longer period of time to design, site, permit, and construct a coal-fired facility. This too adds to the capital costs and capital risk. The trade-off that justifies these higher capital costs is that coal has been a much less expensive fuel and could be converted to electricity more efficiently than early single-cycle natural gas plants. That is, the higher capital costs are incurred to reduce the fuel cost per unit of electricity produced.
75 US DOE, EIA-923 and EIS-860, 2010, Monthly Time Series File. The combination of Montana and Wyoming coal was used to approximate the PRB. Delivered cost Montana and Wyoming coal to the South Atlantic and East South Central utilities was compared to the mine mouth price of coal per mmBtu to estimate the transportation costs.
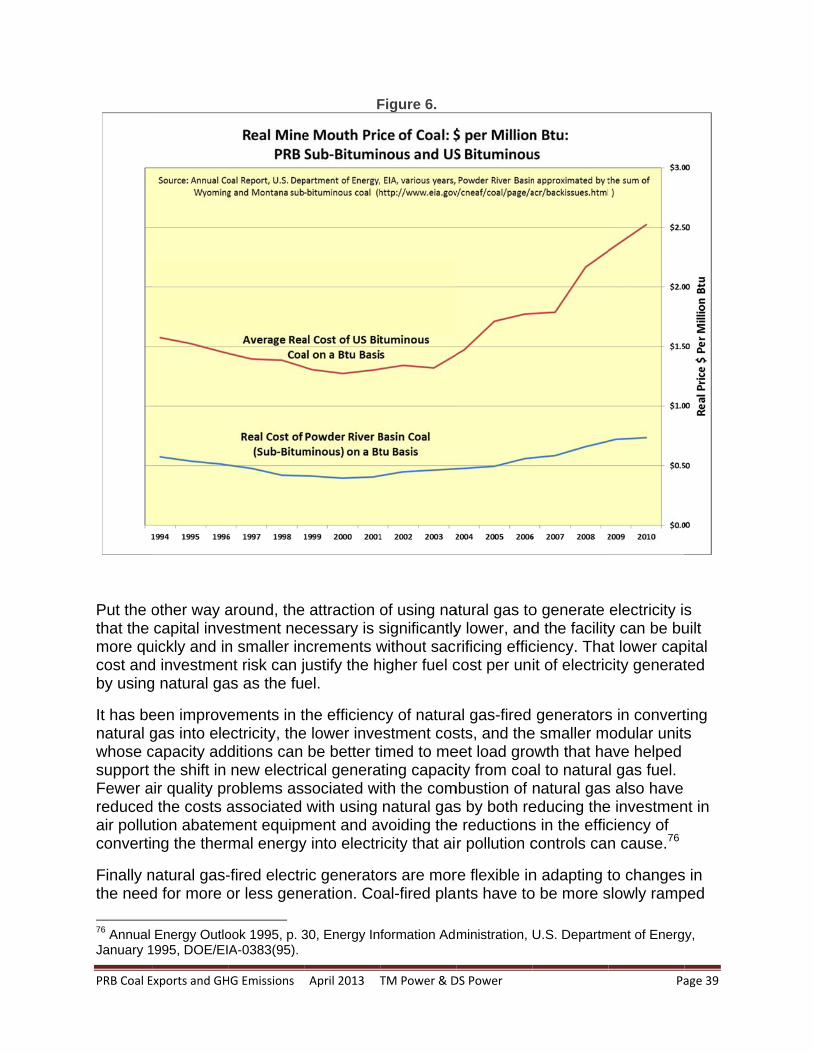
PRB Coal E
Put the othat the more qucost andby using
It has benatural gwhose csupport Fewer areducedair pollutconverti
Finally nthe need
76 Annual January 1
Exports and GH
other way acapital inve
uickly and ind investmeng natural ga
een improvegas into elecapacity addthe shift in
air quality prd the costs ation abatemng the ther
natural gas-d for more o
Energy Outlo995, DOE/EI
HG Emissions
around, theestment necn smaller innt risk can jas as the fu
ements in tectricity, theditions can new electr
roblems asassociated
ment equipmmal energy
-fired electror less gen
ook 1995, p. 3A-0383(95).
April 2013 T
F
e attraction ocessary is s
ncrements wustify the hel.
the efficience lower inve
be better tical generasociated wwith using
ment and ay into electr
ric generatoeration. Co
30, Energy In
TM Power & D
Figure 6.
of using nasignificantlywithout sachigher fuel c
cy of naturaestment cosimed to me
ating capaciith the comnatural gasvoiding the
ricity that ai
ors are moroal-fired pla
formation Ad
DS Power
atural gas toy lower, andrificing efficcost per un
al gas-fired sts, and theeet load groity from coa
mbustion of s by both ree reductionsr pollution c
re flexible innts have to
ministration,
o generate d the facilityciency. Thait of electric
generatorse smaller mowth that haal to naturanatural gaseducing thes in the efficcontrols can
n adapting to be more s
U.S. Departm
Pa
electricity isy can be bu
at lower capcity generat
s in convertodular units
ave helped l gas fuel.
s also have e investmenciency of n cause.76
to changesslowly ramp
ment of Energ
age 39
s uilt pital ted
ting s
nt in
s in ped
y,
PRB Coal Exports and GHG Emissions April 2013 TM Power & DS Power Page 40
up and down. In addition, the efficiency of natural gas-fired plants does not deteriorate as quickly as they are ramped down. This flexibility makes natural gas-fired plants good complements for renewable resources such as wind and solar whose production can fluctuate significantly within relatively short period of time. Given that recently many states have been adopting “renewable portfolio standards” that require electric utilities to serve a specified percentage of their load with renewable resources, natural gas-fired generators have become more attractive because they are a more cost-effective complement to intermittent renewable resources than coal.
The life-cycle (discounted and levelized) cost per megawatt hour generated has often been lower using natural gas as a fuel rather than coal despite the significantly higher cost of a million Btu of natural gas. For instance the Annual Energy Outlook 2000 estimated the levelized cost of electricity from a 2005 natural gas-fired combined cycle generating facility to be about $35 per megawatt hour while the levelized cost per megawatt hour from a coal-fired generator was projected to be $41. The natural gas plant had a 17 percent cost advantage even through its fuel costs per unit of electricity produced were three times as high. The capital investment costs of the natural gas-fired plant, however, were 60 percent smaller on a megawatt hour basis. As a result, 70 percent of the megawatt hour costs for a coal-fired facility were fixed capital investment costs, but only about a third of the levelized megawatt hour cost of a gas-fired generator was associated with the capital investment. On the other hand only about 18 percent of the cost of a megawatt hour was fuel cost for the coal-fired plant while 60 percent of the cost of a megawatt hour was fuel-related for the gas-fired plant.77
These cost differences present utility planners with dramatically different sources of risk. For the coal-fired plant, the largest risk is that it may not operate almost continuously. The fewer hours it operates, the greater the risk that a significant part of its investment cost will be at risk of not being recovered. For the gas-fired plant, an increase in natural gas fuel costs in the future could dramatically increase the cost of the electricity being produced, something from which a coal-fired plant is more insulated because coal prices have been more stable over time.
The Annual Energy Outlook 2011 projected an even larger difference between the levelized cost of a megawatt hour from a coal-fired generator compared to a gas-fired combined cycle generator: $102 versus $70, a cost advantage for the natural gas plant of over 30 percent. Natural gas plants had the levelized cost advantage despite having variable operating costs (fuel and variable operations and maintenance costs) that were almost twice as large on a per unit of electrical output basis. The natural gas combined cycle plants offset that fuel cost disadvantage with capital costs that were only about a quarter of those of a coal-fired plant on a megawatt hour basis.78 See Figure 7 below.
77All costs in 1998 dollars. Figure 72 and Table 9, p. 67. 78 These are projected costs for 2020 stated in 2009 dollars. Figure 81, p. 75, DOE/EIA-0383 (2011), April 2011.
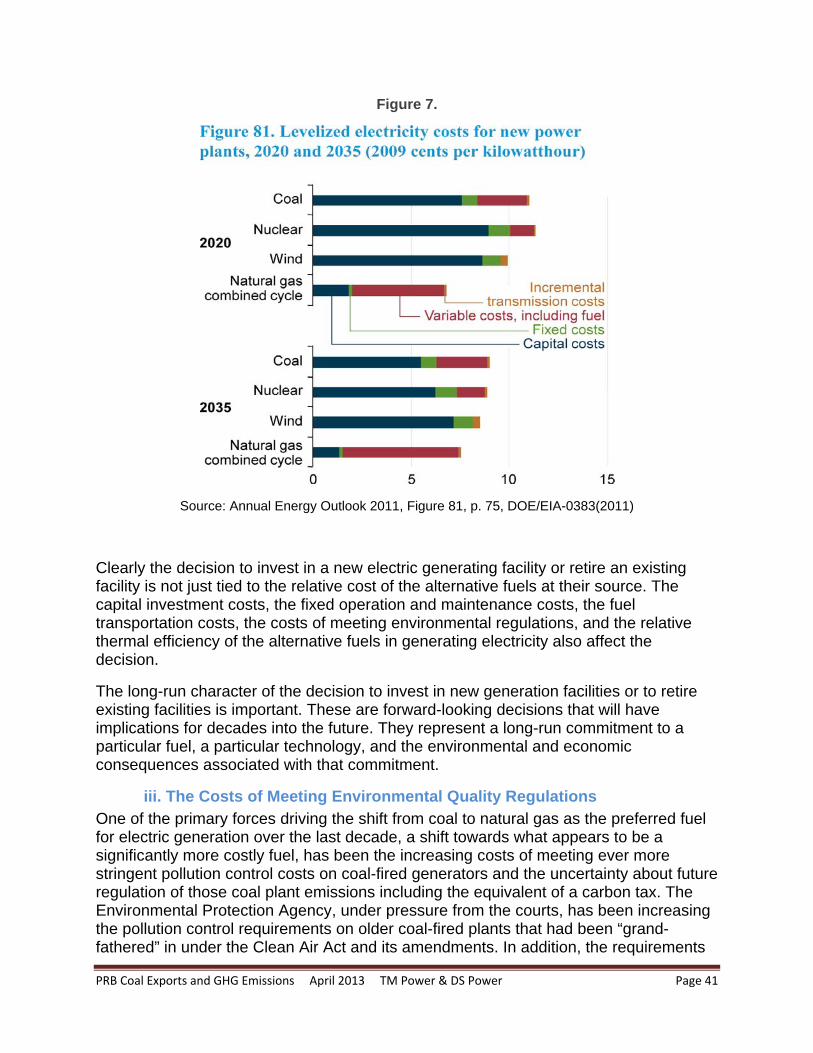
PRB Coal Exports and GHG Emissions April 2013 TM Power & DS Power Page 41
Figure 7.
Source: Annual Energy Outlook 2011, Figure 81, p. 75, DOE/EIA-0383(2011)
Clearly the decision to invest in a new electric generating facility or retire an existing facility is not just tied to the relative cost of the alternative fuels at their source. The capital investment costs, the fixed operation and maintenance costs, the fuel transportation costs, the costs of meeting environmental regulations, and the relative thermal efficiency of the alternative fuels in generating electricity also affect the decision.
The long-run character of the decision to invest in new generation facilities or to retire existing facilities is important. These are forward-looking decisions that will have implications for decades into the future. They represent a long-run commitment to a particular fuel, a particular technology, and the environmental and economic consequences associated with that commitment.
iii. The Costs of Meeting Environmental Quality Regulations One of the primary forces driving the shift from coal to natural gas as the preferred fuel for electric generation over the last decade, a shift towards what appears to be a significantly more costly fuel, has been the increasing costs of meeting ever more stringent pollution control costs on coal-fired generators and the uncertainty about future regulation of those coal plant emissions including the equivalent of a carbon tax. The Environmental Protection Agency, under pressure from the courts, has been increasing the pollution control requirements on older coal-fired plants that had been “grand-fathered” in under the Clean Air Act and its amendments. In addition, the requirements
PRB Coal Exports and GHG Emissions April 2013 TM Power & DS Power Page 42
that haze producing emissions not impact National Parks and Wilderness areas have begun to be enforced. Coal-fired electric generators are often the primary source of the haze-producing emissions.79 The power plant emissions most threatening to human health, including mercury and other toxic metals as well as sulfur oxides and tiny particulates are pollutants most closely linked with coal combustion. They are being subject to more strict limits. Also, most electric utility planners expect greenhouse gas emissions to ultimately be subject to limits and/or penalties or taxes, and since coal is the most carbon intensive of the electric plant fuels, such greenhouse gas controls are likely to be more costly for coal-fired plants. In addition, the solid and liquid waste byproducts associated with coal-combustion, which are quite toxic, are also coming under increasingly strict regulation. Finally, public opposition to siting new coal-fired electric plants and public support for the retirement of existing coal-fired plants has grown.
The result of this near perfect storm of concerns about the environmental costs associated with coal-fired electric generators has virtually eliminated coal as a fuel for new electric generators in the United States and has led to the “early” “voluntary” retirement of a significant number of existing coal-fired generators. In the Pacific Northwest, for instance, the only coal-fired generators, Centralia in Washington and Boardman in Oregon, are schedule for retirement under agreements negotiated between the utilities and the state governments. The decline in the price of natural gas and the increase in the price of coal have certainly assisted utility and utility regulators in supporting this shift away from coal as a fuel for electric generation. The dramatic increase in the projected American supply of natural gas over the last decade has also provided some confidence that those natural gas prices will remain relatively low for some time into the future. But the primary cost considerations have been the actual and potential regulatory costs and risks associated with operating coal-fired plants rather than a simple comparison of fuel costs. Meeting expected stricter environmental regulations both boosts the capital costs of new and existing coal-fired electric generators and reduces their efficiency, raising both the fixed and variable costs of electric generation. The uncertainty about future costs associated with environmental regulation also increases the investment risk and cost associated with coal-fired generation.
This is not to suggest that the building of new natural gas-fired electric generators has not also involved significant risk. Natural gas prices have shown considerable volatility over the last decade. This uncertainty about natural gas costs and the potential for quite large increases in natural gas fuel costs over a short period of time would tend to discourage the long-term commitment of capital associated with building new natural gas-fired electric generators. Recall the earlier Figure 3 above showing the changes in the relative cost of natural gas and coal per million Btu of fuel delivered to electric
79 US EPA proposed a Regional Haze Rule in 2011 in response to court decisions ordering EPA to implement the provisions of the Clean Air Act (amended) that mandate “prevention oa any future, and the remedying of any existing, impairment of visibility in the mandatory class I Federal areas which impairment results from manmade air pollution.” 42 U.S.C. 749(a)(1). Those mandatory Class I areas are primarily National Parks and Wilderness Areas. The haze-precursor pollutants include nitrogen oxides, sulfur dioxide, and particulate matter produced by coal-fired plants that also harm public health.
PRB Coal Exports and GHG Emissions April 2013 TM Power & DS Power Page 43
generators. Natural gas fuel costs have clearly fluctuated more than coal costs. Given that for natural gas-fired electric generators, unlike coal plants, fuel costs dominate the levelized cost of electric generation, this fuel price volatility represents a significant investment risk. Judging by the investment decisions that utilities have been making over the last decade and a half to invest almost exclusively in natural gas-fired generation even as natural gas prices have fluctuated significantly, utilities clearly see this fuel price risk associated with natural gas as a lower investment risk than that associated with environmental regulation and the high fixed investment costs associated with coal-fired generators. The lower capital costs and smaller modular character of natural gas generators also help offset the natural gas fuel cost risk.
2. The Potential for Changing the Intensity of Use of Coal- and Natural Gas-Fired Electric Generators as Fuel Costs Change
At any given time there is an existing set of electric generators that are powered by different energy sources. Renewable sources, such as hydroelectric, wind, and solar, have no fuel costs although they have operation and maintenance costs that are likely to vary with the level of actual generation. Electric generators using fossil fuels, of course, have significant fuel costs that vary with the level of generation. The dominant fossil fuels currently used for electric generation are coal and natural gas which together in 2009 were responsible for 69 percent of electric generation, 46 percent from coal and 23 percent from natural gas. The remaining 31 percent of electric generation came from nuclear power (20 percent) and renewable sources (11 percent).
Because the demand for electricity varies considerably across the day and across the year, not all electric generators are operating at full capacity all or most of the time. In general, utilities first operate the generators with the lowest operating costs and as the demand for electricity increases, they turn to generators with higher operating costs. This “economic dispatch” of the generators that are cheapest to operate first and turning to the most expensive generators only during the periods of higher electric demand means that as relative fuel prices vary, the intensity of use of generators fired by coal and natural gas will vary too. As natural gas falls in price relative to coal, natural-gas-fired plants will be used more and coal-fired plants less as we have seen since mid-2008 when the price of natural gas fell dramatically, staying at record low levels into 2013. The natural gas share of electricity generation in the U.S. has risen. The same will happen if the cost of coal rises relative to natural gas. Of course, the opposite will happen, natural gas plants will be used less and coal-fired plants more, if the cost of coal falls and/or the price of natural gas rises.
That opens up the possibility of natural gas displacing coal as a fuel for electric generation in existing electric generators if the rising demand for American coal for export were to drive coal costs up because more and more costly coal sources had to
PRB Coal Exports and GHG Emissions April 2013 TM Power & DS Power Page 44
be mined. In this section we explore quantitatively the likelihood that expanded PRB coal exports would trigger such a reduction in coal use within the United States.80
Our analysis is broken into two parts below. First we analyze whether increased exports of PRB coal to Asia are likely to significantly increase the cost of that coal. We conclude that geologic and economic information indicate that an increase in PRB production of 140 million ton per year level to serve Asian export markets would not drive up the delivered cost of PRB coal significantly. Second, we explore how, if there were a significant increase in the cost of PRB coal, that higher mine mouth cost would impact the use of that coal or other coal in the United States. We find that any reasonably expected increase in those PRB coal costs would have little impact on coal consumption in the United States. Finally, we confirm the results of our analysis by reviewing recent analyses by the U.S. Department of Energy of the likely impact of higher coal prices on coal consumption in the United States.
It is important to note again that we are not asserting that energy costs do not matter when fuel choices and fuel use decisions are made. We are analyzing the impact of higher coal costs on the use of coal in a setting where a particular set of fuel-dependent electric generators are already in place. As discussed above the cost of using different types of energy most certainly could have an impact on whether a natural gas or coal fueled generator was built. Once built, however, the range of choices about fuel use is much more limited by the technology already in place.
i. The Impact of Increased PRB Coal Production on Coal Costs As discussed above, the PRB coal fields have been a source of large quantities of very low cost coal, primarily because the coal is so close to the surface and there is so much of it. As a result, coal production in the PRB was able to increase between 1994 and the Great Recession year of 2008 by 236 million tons or 86 percent, while PRB real mine mouth coal prices remained 18 percent below 1994 levels.81 In the spring of 2012 PRB spot market prices tumbled downward, falling from $11.50 per ton on March 9 to $8.90 by March 23rd and appeared to stabilize at about $9 per ton in May 2012.82 During the first quarter of 2013 the price was $10.25 per ton. These prices were well below the average real value of $12.40 per ton for the 1994-2011 period as a whole.83
Federal analysts have estimated the production costs of PRB coal at various levels of annual production in each year. The higher the production level in any given year, the
80 Richard Morse at Stanford University’s Program on Energy and Sustainable Development has asserted that increased Chinese consumption of coal from the United States would have this offsetting impact on coal consumed in the United States. See Frank Wolak and Richard Morse, “China’s green gift to the world,” Guardian (UK), December 30, 2010. Also see “As Coal Use Declines in U.S., Coal Companies Focus on China,” Jonathan Thompson, Yale Environment 360, December 8, 2011. http://e360.yale.edu/feature/as_coal_use_declines_in_us_coal_companies_focus_on_china/2474/ 81 http://www.eia.gov/cneaf/coal/page/acr/backissues.html . Between 2008 and 2010 coal production in the PRB declined while mine mouth coal prices increased to just below the 1994 levels. That 2008-2010 price increase was a continuation of real price increases begun in 2005. 82 Average Weekly Coal Spot Prices, EIA, Coal News and Markets. 83 http://205.254.135.7/coal/nymex/
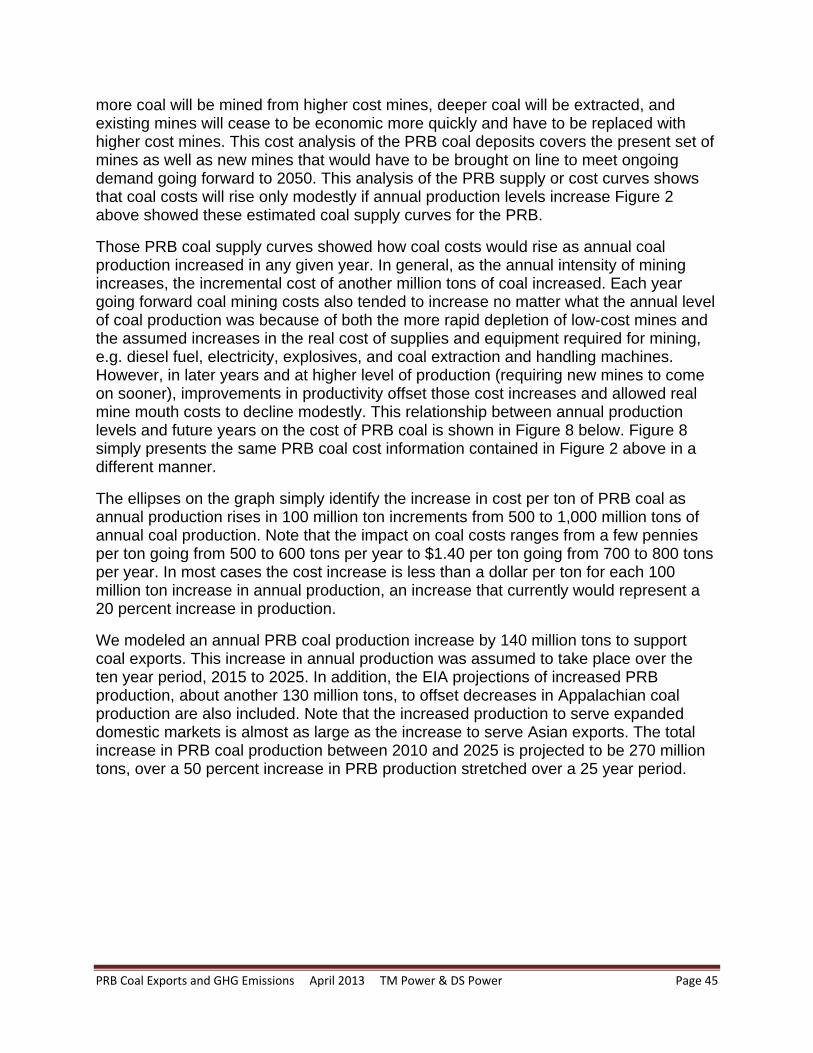
PRB Coal Exports and GHG Emissions April 2013 TM Power & DS Power Page 45
more coal will be mined from higher cost mines, deeper coal will be extracted, and existing mines will cease to be economic more quickly and have to be replaced with higher cost mines. This cost analysis of the PRB coal deposits covers the present set of mines as well as new mines that would have to be brought on line to meet ongoing demand going forward to 2050. This analysis of the PRB supply or cost curves shows that coal costs will rise only modestly if annual production levels increase Figure 2 above showed these estimated coal supply curves for the PRB.
Those PRB coal supply curves showed how coal costs would rise as annual coal production increased in any given year. In general, as the annual intensity of mining increases, the incremental cost of another million tons of coal increased. Each year going forward coal mining costs also tended to increase no matter what the annual level of coal production was because of both the more rapid depletion of low-cost mines and the assumed increases in the real cost of supplies and equipment required for mining, e.g. diesel fuel, electricity, explosives, and coal extraction and handling machines. However, in later years and at higher level of production (requiring new mines to come on sooner), improvements in productivity offset those cost increases and allowed real mine mouth costs to decline modestly. This relationship between annual production levels and future years on the cost of PRB coal is shown in Figure 8 below. Figure 8 simply presents the same PRB coal cost information contained in Figure 2 above in a different manner.
The ellipses on the graph simply identify the increase in cost per ton of PRB coal as annual production rises in 100 million ton increments from 500 to 1,000 million tons of annual coal production. Note that the impact on coal costs ranges from a few pennies per ton going from 500 to 600 tons per year to $1.40 per ton going from 700 to 800 tons per year. In most cases the cost increase is less than a dollar per ton for each 100 million ton increase in annual production, an increase that currently would represent a 20 percent increase in production.
We modeled an annual PRB coal production increase by 140 million tons to support coal exports. This increase in annual production was assumed to take place over the ten year period, 2015 to 2025. In addition, the EIA projections of increased PRB production, about another 130 million tons, to offset decreases in Appalachian coal production are also included. Note that the increased production to serve expanded domestic markets is almost as large as the increase to serve Asian exports. The total increase in PRB coal production between 2010 and 2025 is projected to be 270 million tons, over a 50 percent increase in PRB production stretched over a 25 year period.
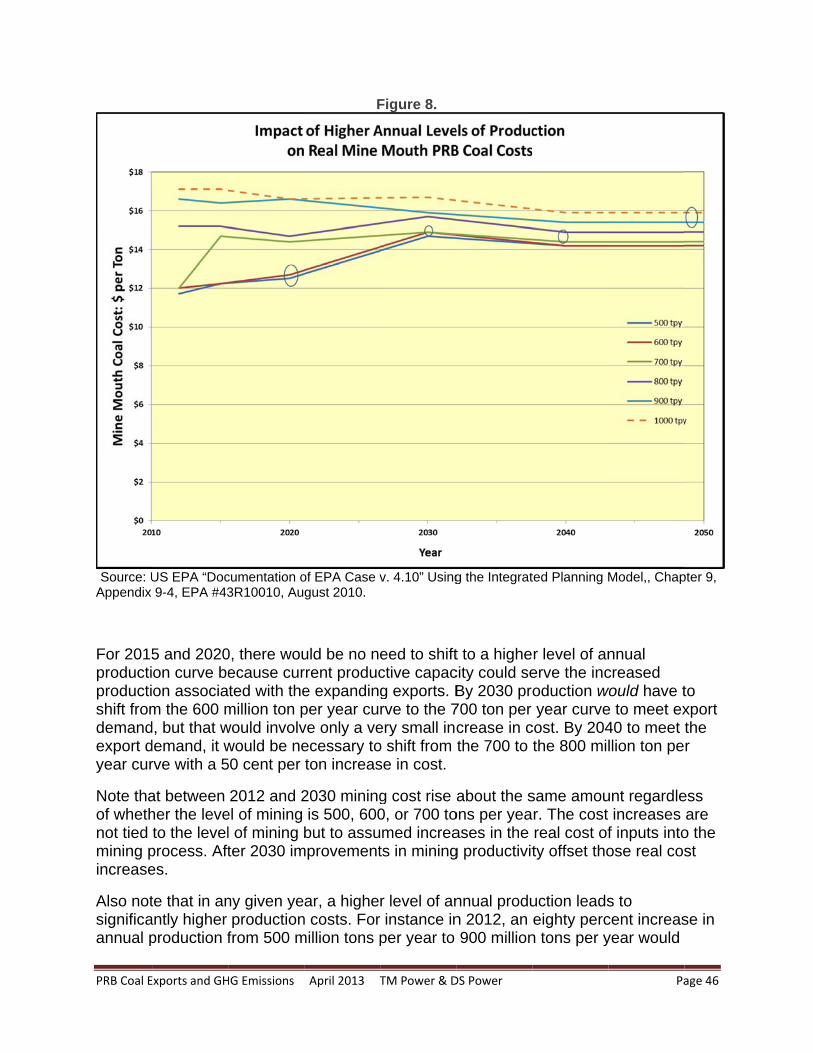
PRB Coal E
Source: UAppendix
For 2015productiproductishift fromdemandexport dyear cur
Note thaof whethnot tied mining pincrease
Also notsignificaannual p
Exports and GH
US EPA “Doc9-4, EPA #43
5 and 2020on curve beon associam the 600 md, but that wdemand, it wrve with a 5
at between her the leveto the level
process. Aftes.
te that in anantly higher production f
HG Emissions
cumentation o3R10010, Au
0, there wouecause curted with the
million ton pwould involvwould be ne50 cent per
2012 and 2el of mining l of mining ter 2030 im
ny given yeproduction
from 500 m
April 2013 T
F
of EPA Case vgust 2010.
uld be no nerrent produce expandingper year cuve only a veecessary toton increas
2030 miningis 500, 600but to assu
mprovement
ar, a highen costs. Formillion tons p
TM Power & D
Figure 8.
v. 4.10” Using
eed to shiftctive capacg exports. Brve to the 7ery small inco shift from se in cost.
g cost rise 0, or 700 tomed increats in mining
r level of anr instance inper year to
DS Power
g the Integrat
t to a highecity could seBy 2030 pro700 ton per crease in cthe 700 to
about the sons per yeaases in the g productivit
nnual produn 2012, an 900 million
ted Planning M
r level of anerve the incoduction wyear curve
cost. By 204the 800 mil
same amour. The cost real cost ofty offset tho
uction leadseighty perc
n tons per y
Pa
Model,, Chap
nnual creased
would have te to meet ex40 to meet llion ton pe
unt regardleincreases
f inputs intoose real cos
s to cent increasyear would
age 46
pter 9,
to xport the r
ess are
o the st
se in
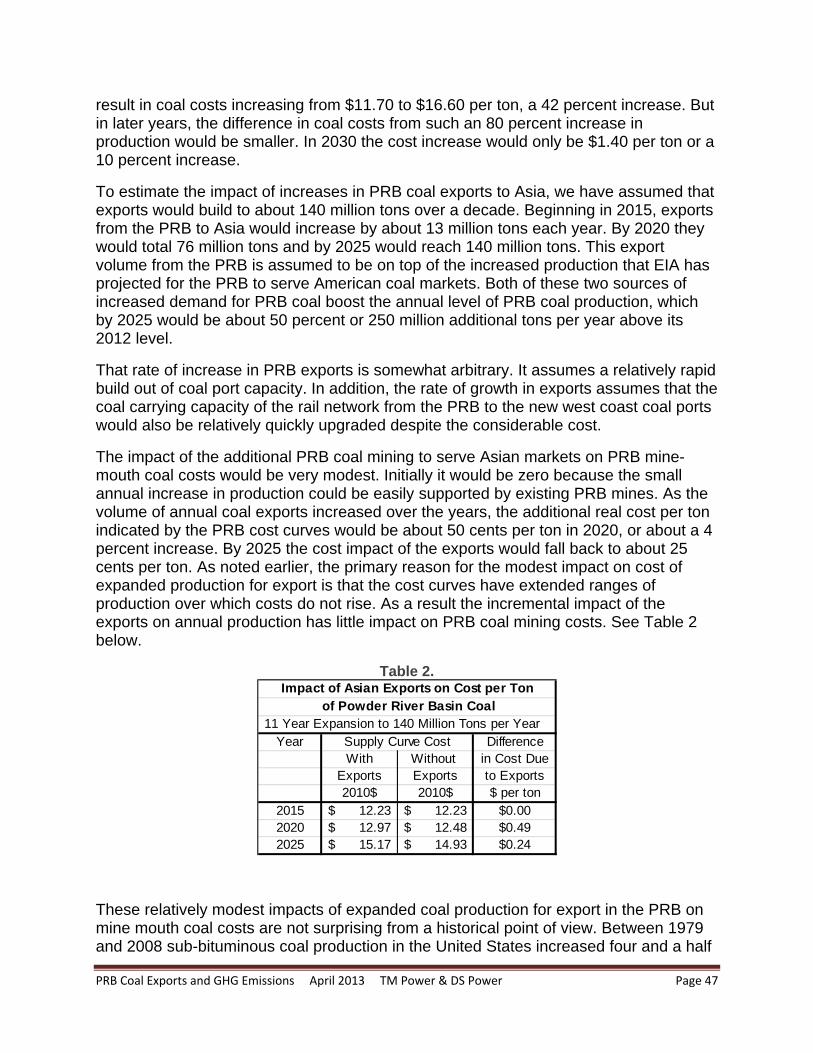
PRB Coal Exports and GHG Emissions April 2013 TM Power & DS Power Page 47
result in coal costs increasing from $11.70 to $16.60 per ton, a 42 percent increase. But in later years, the difference in coal costs from such an 80 percent increase in production would be smaller. In 2030 the cost increase would only be $1.40 per ton or a 10 percent increase.
To estimate the impact of increases in PRB coal exports to Asia, we have assumed that exports would build to about 140 million tons over a decade. Beginning in 2015, exports from the PRB to Asia would increase by about 13 million tons each year. By 2020 they would total 76 million tons and by 2025 would reach 140 million tons. This export volume from the PRB is assumed to be on top of the increased production that EIA has projected for the PRB to serve American coal markets. Both of these two sources of increased demand for PRB coal boost the annual level of PRB coal production, which by 2025 would be about 50 percent or 250 million additional tons per year above its 2012 level.
That rate of increase in PRB exports is somewhat arbitrary. It assumes a relatively rapid build out of coal port capacity. In addition, the rate of growth in exports assumes that the coal carrying capacity of the rail network from the PRB to the new west coast coal ports would also be relatively quickly upgraded despite the considerable cost.
The impact of the additional PRB coal mining to serve Asian markets on PRB mine-mouth coal costs would be very modest. Initially it would be zero because the small annual increase in production could be easily supported by existing PRB mines. As the volume of annual coal exports increased over the years, the additional real cost per ton indicated by the PRB cost curves would be about 50 cents per ton in 2020, or about a 4 percent increase. By 2025 the cost impact of the exports would fall back to about 25 cents per ton. As noted earlier, the primary reason for the modest impact on cost of expanded production for export is that the cost curves have extended ranges of production over which costs do not rise. As a result the incremental impact of the exports on annual production has little impact on PRB coal mining costs. See Table 2 below.
Table 2.
These relatively modest impacts of expanded coal production for export in the PRB on mine mouth coal costs are not surprising from a historical point of view. Between 1979 and 2008 sub-bituminous coal production in the United States increased four and a half
11 Year Expansion to 140 Million Tons per YearYear Difference
With Without in Cost DueExports Exports to Exports2010$ 2010$ $ per ton
2015 12.23$ 12.23$ $0.002020 12.97$ 12.48$ $0.492025 15.17$ 14.93$ $0.24
of Powder River Basin Coal
Supply Curve Cost
Impact of Asian Exports on Cost per Ton
PRB Coal E
fold fromof sub-b1982 andeclineda doublithe spotwere regquadrupproducti
ii
To studygeneratoelectric gprovidesenergy c
84 Table 723, 2012, http://205
Exports and GH
m 121 to 53bituminous cnd 2001 subd by 70 percng of coal pt market, lowgularly gathpled since 1on substan
. The Impay the impacors, we havgenerating s informatiocontent of d
7.2 Coal ProdCoal New an
.254.135.7/co
HG Emissions
9 million tocoal declineb-bituminoucent. In 201production. wer in real
hered (1979979.84 Clea
ntially with o
act of Shorct of higher ve analyzedplant owne
on on a mondifferent typ
duction, 1949-nd Markets. Moal/nymex/ .
April 2013 T
ons per yeaed despite tus coal prod10 the real In May 20terms than
9) despite Parly the Powonly modes
F
rt Run Coacoal costs
d the 2010 ed by electrnthly basis pes of fuel c
-2010 and TaMarch 23, 201
TM Power & D
r. During mthe massiveduction almprice was a12 PRB coaany price s
PRB coal prwder River
st increases
Figure 9.
al Cost Incron electric U.S. Deparric utilities inon the elec
consumed i
able 7.9 Coal 12, spot mark
DS Power
most of that e expansio
most tripled wat the sameal was sellisince sub-broduction hBasin has
s in costs. S
reases on utility use o
rtment of En the Unitedctric generain generatin
Prices, 1949-ket price from
time periodon of producwhile nomine level as inng for $7.5
bituminous having more
the capacitSee Figure
Utility Useof coal in itsnergy data d States. T
ation, the vong electricit
-2010. 2011 dm
Pa
d the real pction. Betwenal coal pri
n 1992 desp58 per ton ocoal prices
e than ty to expan9 below.
e of Coal s current seon each
This data olume and ty, the cost
data from Jan
age 48
rice een ces pite
on s
d
et of
of
nuary
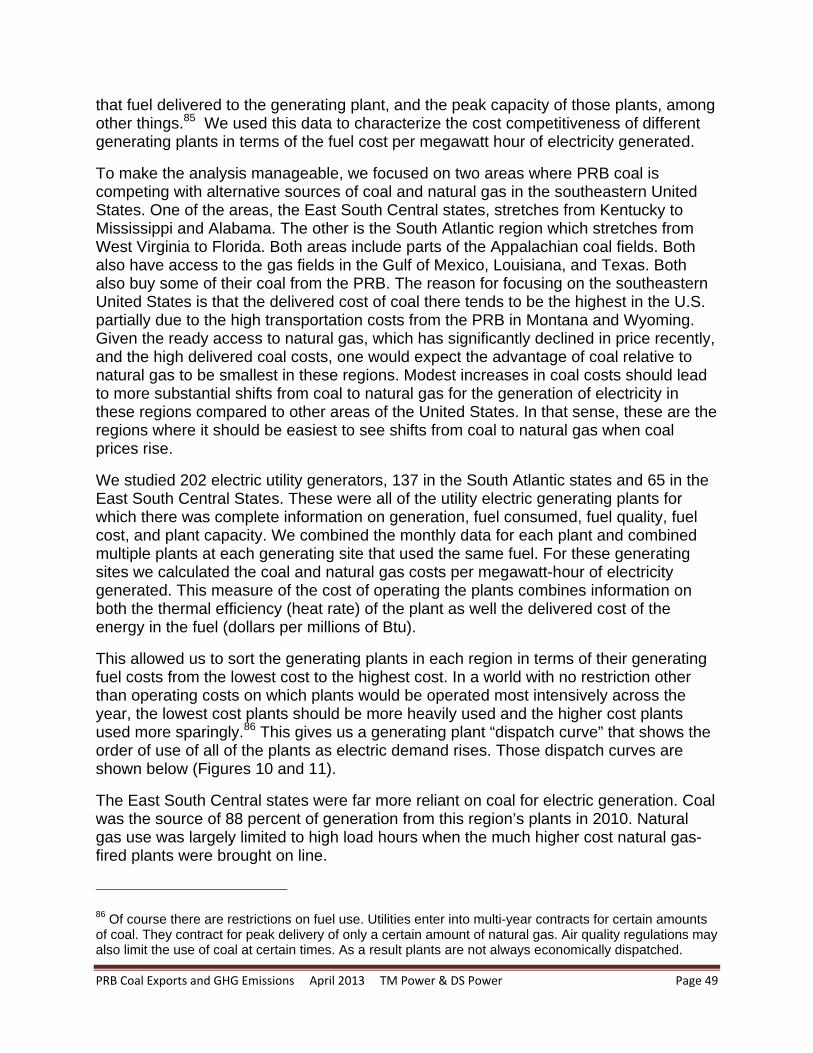
PRB Coal Exports and GHG Emissions April 2013 TM Power & DS Power Page 49
that fuel delivered to the generating plant, and the peak capacity of those plants, among other things.85 We used this data to characterize the cost competitiveness of different generating plants in terms of the fuel cost per megawatt hour of electricity generated.
To make the analysis manageable, we focused on two areas where PRB coal is competing with alternative sources of coal and natural gas in the southeastern United States. One of the areas, the East South Central states, stretches from Kentucky to Mississippi and Alabama. The other is the South Atlantic region which stretches from West Virginia to Florida. Both areas include parts of the Appalachian coal fields. Both also have access to the gas fields in the Gulf of Mexico, Louisiana, and Texas. Both also buy some of their coal from the PRB. The reason for focusing on the southeastern United States is that the delivered cost of coal there tends to be the highest in the U.S. partially due to the high transportation costs from the PRB in Montana and Wyoming. Given the ready access to natural gas, which has significantly declined in price recently, and the high delivered coal costs, one would expect the advantage of coal relative to natural gas to be smallest in these regions. Modest increases in coal costs should lead to more substantial shifts from coal to natural gas for the generation of electricity in these regions compared to other areas of the United States. In that sense, these are the regions where it should be easiest to see shifts from coal to natural gas when coal prices rise.
We studied 202 electric utility generators, 137 in the South Atlantic states and 65 in the East South Central States. These were all of the utility electric generating plants for which there was complete information on generation, fuel consumed, fuel quality, fuel cost, and plant capacity. We combined the monthly data for each plant and combined multiple plants at each generating site that used the same fuel. For these generating sites we calculated the coal and natural gas costs per megawatt-hour of electricity generated. This measure of the cost of operating the plants combines information on both the thermal efficiency (heat rate) of the plant as well the delivered cost of the energy in the fuel (dollars per millions of Btu).
This allowed us to sort the generating plants in each region in terms of their generating fuel costs from the lowest cost to the highest cost. In a world with no restriction other than operating costs on which plants would be operated most intensively across the year, the lowest cost plants should be more heavily used and the higher cost plants used more sparingly.86 This gives us a generating plant “dispatch curve” that shows the order of use of all of the plants as electric demand rises. Those dispatch curves are shown below (Figures 10 and 11).
The East South Central states were far more reliant on coal for electric generation. Coal was the source of 88 percent of generation from this region’s plants in 2010. Natural gas use was largely limited to high load hours when the much higher cost natural gas-fired plants were brought on line.
86 Of course there are restrictions on fuel use. Utilities enter into multi-year contracts for certain amounts of coal. They contract for peak delivery of only a certain amount of natural gas. Air quality regulations may also limit the use of coal at certain times. As a result plants are not always economically dispatched.
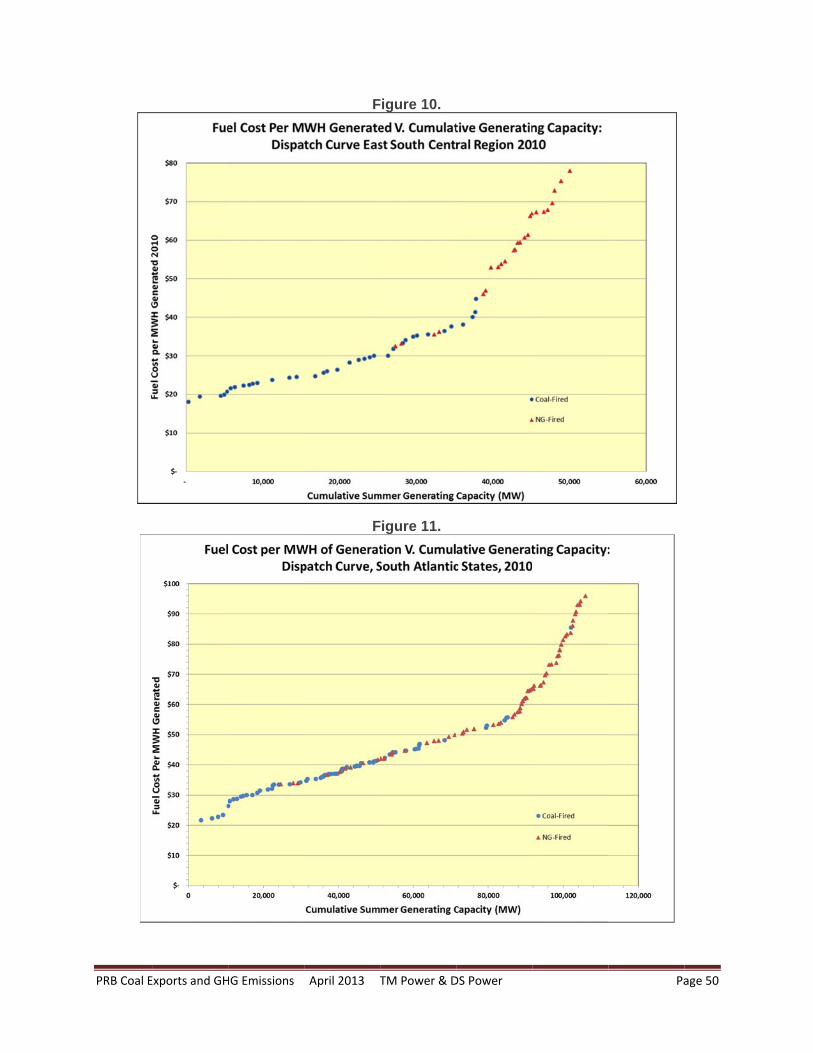
PRB Coal E
Exports and GHHG Emissions April 2013 T
F
F
TM Power & D
Figure 10.
Figure 11.
DS Power Pa
age 50
PRB Coal Exports and GHG Emissions April 2013 TM Power & DS Power Page 51
In the South Atlantic states natural gas played a much more significant role in electric generation, being the source of about a third of generation while coal was the fuel for the other two-thirds. Some natural gas generators were as cheap to operate as coal-fired plants despite the fact that on a per Btu basis natural gas was much more expensive. The higher efficiency of those natural gas plants off-set those higher natural gas fuel costs. In the South Atlantic states a larger percentage of the natural gas-fired electric generators were combined cycle plants that have a higher thermal efficiency and therefore lower fuel costs per mwh of production. 86 percent of the natural gas plants in the South Atlantic states were combined cycle plants; 74 percent of the natural gas plants in the East South Central states were combined cycle plants.
We modeled the impact of higher PRB coal costs by studying how coal cost increases of 10, 25, 50 and 100 percent would impact coal use in these existing plants.87 All of these are larger than our PRB cost curves suggest are likely but they allow us to estimate how high PRB mine mouth prices would have to rise before they change significantly the operation of electric generators in our southern study area. As will be discussed below, we found that mine mouth cost increases of up to 25 percent or about $3.75 per ton would have no significant impact on coal consumption.
One of the reasons for this was that increases in PRB mine-mouth coal prices do not translate into a proportional increase in the delivered cost of PRB coal to electric generators. As discussed above, the primary determinant of the delivered cost of PRB coal is the cost of transporting it to the electric generators. In the East South Central and South Atlantic states, the data indicates that two-thirds of the costs of the delivered PRB coal are transportation costs. Because of this, a 30 percent increase in mine-mouth coal price has only a 10 percent impact on the delivered cost of the coal. This dilution of the impact of changes in mine-mouth coal prices on the delivered cost of coal is tied to the unusually low cost of PRB coal at the mine. It is one of the lowest cost coal fields in the world. Those coal fields, however, are located at considerable distance from eastern electric generators. This increases the delivery costs.
Across the nation, coal transportation costs do not play as great a role. If one compares the average mine mouth coal price across the nation with the national average cost of delivered coal (both on a Btu basis), transportation costs represent only about 31 percent of the delivered cost of the coal as opposed to 68 percent of the delivered cost of PRB coal to the southeastern United States.
We raised the mine mouth price of the coal as describe above while leaving the natural gas prices as they were in 2010. We then dispatched the plants with the lowest operating cost (dollars of fuel cost per megawatt hour of generation) and operated them up to at least 65 percent across the year. We calculated how much generation would come from coal and natural gas fueled plants when they were dispatched in that order and compared that to a reference case where coal mine mouth prices had not been
87 Note that if PRB coal prices are currently about $15 per ton at the mine mouth, these represent $1.50, $3.75, $7.50, and $15.00 per ton increases, respectively, in PRB coal price due to the increased demand from Asian markets.
PRB Coal Exports and GHG Emissions April 2013 TM Power & DS Power Page 52
increased to see how much coal-fired generation was displaced by natural gas-fired generation.
We found that for the East South Central states, PRB mine-mouth cost increases $1.50 to $3.00 per ton would have zero impacts on the balance between the use of coal and natural gas for electric generation. That is, PRB mine mouth cost increases of 10 or even 20 percent instead of our projected 2 percent increase would not impact coal use.
In the South Atlantic states where natural gas is more heavily used for electric generation, PRB mine mouth cost increases of up to $3.00 or 20 percent would have very small impacts on fuel use by electric generators: Coal use would decline by six-tenths of one percent and natural gas use would rise by 1.3 percent. For the South Atlantic states this would represent a decrease in coal consumption of 750,000 tons of the 126 million tons of coal burned at these plants to generate electricity.
If, instead of focusing on the cost impact of increased PRB coal being exported from the west coast, we focus on increases in American coal prices in general, relatively modest real price increases due to increased exports, such as 10 percent, would still have zero or near zero impacts on the relative intensity of use of coal- and gas-fired electric generators. If real coal prices, for some reason, were to rise significantly, by 50 to 100 percent, there would be significant changes in the relative use of existing coal- and gas-fired generators. The use of coal could fall by 12 to 25 percent and the use of natural gas could increase by 25 to 50 percent.
iii. Other Modeling of the Impact of Increased PRB Coal Production on Coal Prices
The U.S. Department of Energy’s Energy Information Administration (EIA) annually produces a forecast of future energy trends in the United States entitled the Annual Energy Outlook. Included in that analysis is forecasted coal production to supply electric generation across the nation. Recent projections were those released in April 2011, June 2012, and May 2013.88
In the 2011 Annual Energy Outlook reference or base case, the EIA projected that annual Wyoming PRB coal production would increase by almost 147.5 million tons between 2010 and 2035 to a total annual production of almost 580 million tons. Overall, that represented a 34 percent increase over the 25-year period. Accompanying that expansion, EIA estimates that real mine-mouth price of Wyoming PRB coal would rise $4.41 per ton from $13.15 in 2011 to $17.50 in 2035, or about a 33 percent during the 25 year period.89 For this period EIA’s projection of the incremental increase in Wyoming PRB coal prices was similar to those shown in the PRB coal supply cost curves we discussed and used above.
88 Annual Energy Outlook 2011 with Projections to 2035, DOE/EIA-0383(2011) for the 2011 version. In June 2012 the 2012 version of the Annual Energy Outlook was released, (DOE/EIA-0383(2012)). The 2013 early release version was released between April 15 and May 2, 2013. 89 In this and the following discussion of the 2011 Annual Energy Outlook results, we used the EIA “table browser” to analyze the projections under various assumptions of the EIA model as used for the 2011 Outlook. www.eia.gov/oiaf/aeo/tablebrowser .
PRB Coal Exports and GHG Emissions April 2013 TM Power & DS Power Page 53
The 2012 Annual Energy Outlook projected a larger increase in the price of PRB coal, from $13.03 in 2011 to $23.86 in 2035 or an 83 percent increase. The Early Release 2013 Annual Energy Outlook projected an even higher increase in Wyoming PRB coal prices from 2011 to 2035, from $13.03 to $26.75, more than doubling, an increase of 105 percent.
Note the shift in the EIA’s projection of PRB mine mouth coal prices over the 25-year period from a 33 percent increase to more than a 100 percent increase.
EIA’s projection in 2011 of what the impact of this increase in Wyoming PRB coal prices would be on the delivered cost of coal to electric utilities across the United States was projected to be quite modest. Nationally, between 2010 and 2025 the real cost of delivered coal was projected to decline slightly from $2.40 to $2.36 per million Btu. By 2035 the delivered cost of coal to electric utilities was projected to rise slightly relative to 2010, from $2.40 to $2.47 per million Btu, about a three percent increase spread over a 25 year period, almost no change at all. Thus in its 2011 projections, EIA also found that the PRB could expand production substantially to serve additional demand for that coal without driving the cost of delivered coal significantly upward. In more recent projections, however, as PRB coal was projected to take over more and more to the U.S. coal market, the projections were for much higher mine mouth coal price increases in the PRB.
Stanford University’s Program on Energy and sustainable Development modeled the volume of PRB coal that could have been sold into Asian markets in 2009 if there were unlimited west coast coal port capacity available. It estimated that Asian markets would absorb 163 million tons of PRB coal, about 16 percent more than the PRB exports we modeled. The model estimated that these increased PRB coal exports would lead US coal prices at coastal ports to rise 5.3 percent. 90 The conclusion was that PRB coal exports, themselves could take place from west coast ports without major increases in the cost of coal delivered to U.S. electric generators. The incremental cost to U.S. coal users of exports was not very high.
iv. Competitive U.S. Coal Market Assumptions
Our analysis above assumes that for the foreseeable future there will be sufficient competitive pressure among coal producers in the United States to drive coal prices towards their cost of production. The impact of dramatically lower natural gas prices on the use of natural gas rather than coal for electric production has weakened the demand for coal in the American electric generation sector. The retirement of older electric generators to avoid having to invest in new pollution controls for them also will reduce the demand for coal in the future. Finally, the uncertainty about future environmental controls on coal combustion is discouraging the investment in new coal-fired electric generators in the U.S. That reduced demand for coal led to layoffs of coal miners in
90Asia’s Changing Landscape. Richard Morse and Lars Schernikau. World Coal. October 2011. http://hms-ag.com/fileadmin/user_upload/pdf/2011-10b_WorldCoal_LS_Article_Asian_Coal.pdf. Also see, "US Coal: A Stranded Asset Ready for Export?", presentation at IEA Outlook for Coal Industry and Markets, Richard Morse, April 14, 2011, Beijing. Dated 12/04/2011, http://www.iea.org/work/2011/WEO_Coal/03_02_MORSE.pdf .
PRB Coal Exports and GHG Emissions April 2013 TM Power & DS Power Page 54
2012-2013 as mines worked to reduce excess inventories and bring production into line with demand. Coal exports from the east coast have helped shore up demand to a limited extent and PRB coal producers hope to do the same with west coast exports. Taking all of these negative pressures on U.S. coal demand together, it seems likely that relatively stiff competition among U.S. coal mining companies and U.S. coal mining regions for the limited or declining domestic coal market will tend to drive coal prices towards the cost of production.
Our assumption that coal companies in the U.S. have limited market power is supported by empirical studies of American coal markets since the 1980s.91 As PRB coal entered American coal markets in a major way in the 1980s, real thermal coal prices in the U.S. declined dramatically between 1982 and 2000, largely because of the investment in new coal mining technologies that dramatically reduced the cost of production. Those reductions in the cost of production, in general, were passed on to electric generators. As the PRB’s share of the total national thermal coal market rose, PRB coal prices declined to very low levels, about $8.50 per ton in 2001 (expressed in constant 2012 dollars) and after some increase in the 2002 through 2010 period was back at $8.50 in mid-2012.92 See Figure 9 above. If there are uncompetitive features of the U.S. thermal coal market, it is in the rail transportation side of the market. There tends to be quite limited rail access to various coal basins and to various electric generating facilities. As a result, the railroads may be able to price discriminate and capture some of the value of the coal.93
91 See, for instance, “What Explains the Increased Utilization of Powder River Basin Coal in Electric Power Generation?”, Shelby Gerking and Stephen F. Hamilton, American Journal of Agricultural Economics, 90(4): 933-950, 2008. 92 U.S. DOE EIA, Table 7.9 Coal Prices, 1949-2010, http://www.eia.gov/totalenergy/data/annual/showtext.cfm?t=ptb0709 93 Op. cit. Shelby Genrking and Stephen Hamilton, 2008. Also see “Changing Energy Prices and Economic Rents: The Case of Western Coal,” John H. Mutti and William E. Morgan, Land Economics, 59(2):163-176, 1983.
PRB Coal Exports and GHG Emissions April 2013 TM Power & DS Power Page 55
V. Comparing the Role of Coal Costs in Coal Use Decisions in the United States and China
1. Comparing Coal Use Decisions in the United States and China
One over-simplified and misleading summary of our conclusions from the analysis above might be that coal costs significantly affect coal use decisions in China but not in the United States. The more accurate summary statement would be that coal costs affect coal use decision in both countries but that, as in all economic decisions, it is the cost of something relative to the cost of the alternatives available that matters. Because the alternatives to coal use in the United States are different than those in China, the impact of changes in coal cost can be expected to be different too.
In particular, the United States, has had a large, readily available, relatively low-cost (when all financial costs are taken into account) domestic alternative to the use of coal for the generation of electricity, namely natural gas. China, on the other hand, has had much more limited and higher cost set of alternatives given its historically limited supplies of both natural gas and petroleum. This is reflected in the relative dependence of the two countries on coal for the generation of electricity. The United States gets approximately 45 percent of its electricity by burning coal while China depends on coal for almost 80 percent of its electricity.94 (At the end of 2011 the share of U.S. electrical generation that came from coal fell below 40 percent for monthly generation for the first time since March 1978.95) Similarly, the United States obtains about 21 percent of its electricity by burning natural gas while China obtains only about 1 percent of its electricity from natural gas.96 China appears to have significant shale gas potential that has not yet been developed. If China applies the same horizontal drilling and hydraulic fracturing technology that has been deployed in the United State, China’s gas production could increase significantly.
In that setting it is not surprising that the important economic issues about coal usage in the United States have been how the total costs associated with coal-fired generation compared to the total costs associated with natural-gas-fired generation. Since at least 1985 this comparison has favored natural gas over coal and the percentage of new generation that has been fueled by natural gas has steadily risen. As a result, coal’s share of total electric generation has declined and natural gas’ has increased (recall Figures 4 and 5 above on page 34). Also as discussed above, the mine-mouth cost of coal was not the dominant determinant of the choice of natural gas as the fuel: Capital investment, environmental control, and fuel delivery costs, as well as the efficiency,
94 Data for 2008-2009, World Coal Association, Coal Statistics, http://www.worldcoal.org/resources/coal-statistics/ . Also EIA Country Analysis Briefs, China, May 2011, http://www.eia.gov/cabs/china/Full.html Conventional thermal generation 81 percent of total generation; 2 percent of thermal generationfrom natural gas. 95 Platts, March 9, 2012: http://www.platts.com/RSSFeedDetailedNews/RSSFeed/Coal/6038108 . 96 Data for 2008. European Environmental Agency, “Share of Electricity Production by Fuel Type in 2008. http://www.eea.europa.eu/data-and-maps/figures/share-of-electricity-production-by-5 .
PRB Coal Exports and GHG Emissions April 2013 TM Power & DS Power Page 56
modular nature, and construction times of natural gas generators were at least as important. As a result, even when relative coal costs declined dramatically because natural gas costs per million Btu rose relative to coal, natural gas remained the preferred fuel.
In China, on the other hand, there has been no low-cost alternative to coal. China has increased its investments in hydro, nuclear, wind, and solar electric generation, but coal remains the fuel on which the Chinese will have to rely for many decades to come. The EIA projects that 66 percent of China’s electricity will still be coming from coal in 2035, down from 80 percent in 2008. Natural gas will still not make a significant contribution to electric generation in China in 2035. The overall role of coal in energy consumption in the Chinese economy is projected to change even less. Coal’s share of total energy consumption will fall from about 70 percent in 2008 to 60 percent in 2035.97 Coal will remain China’s dominant energy source for many decades into the future.
This has important implications for the potential impact that rising coal costs could have on coal combustion and GHG emissions in China. China’s coal production dwarfs that of the U.S. China currently produces about three times as much coal as the U.S. does and the gap between Chinese coal consumption and that in the U.S. is likely to grow significantly larger. In the U.S. competition from natural gas and increasingly strict regulation of coal combustion will continue to discourage the use of coal for electric generation. That American coal use has fluctuated around 900 million short tons since the late 1990s.98 Chinese consumption, on the other hand, is project to continue to grow very rapidly.99
According the U.S. Energy Information Administration, between 2010 and 2020 China will increases its electric generation at a rate that would require almost fifty 500 megawatt electric generators to be built each year. That would be 500 additional large electric generators.100 Since China generates about 80 percent of its electricity by burning coal, given “business as usual” most of this additional generation would likely come from the construction and operation hundreds of large coal-fired plants.
The challenging size of the investment that China will have to make in the construction of these coal fired electric generators and in the expansion of coal mining and coal shipping infrastructure to serve them creates vast opportunities within China to improve the efficiency of electric generation, the efficiency of electric-using equipment and appliances, and improvements in other coal using industrial processes such as steel, chemical, and cement production. The cost of obtaining the coal fuel and generating electricity can have a far greater impact in China in encouraging improved efficiency and reductions in GHG emissions than in the United States simply because of the volume of Chinese coal use and the projected rapid expansion in its use. While coal use
97 International Energy Outlook 2011, U.S. EIA, page 71 and Figure 69. Tables F1, F3, and F4 present the share of generation capacity that is coal- and natural gas-fired. 98 Not adjusted for different BTU content. U.S. DOE EIA Table 7.3 Coal Consumption by Sector 1949-2011. http://www.eia.gov/totalenergy/data/annual/showtext.cfm?t=ptb0703 99 International Energy Outlook 2011, U.S. DOE EIA, Table 74, p. 86. 100 Ibid. The electric generating plants were assumed to operate with an 80 percent capacity factor.
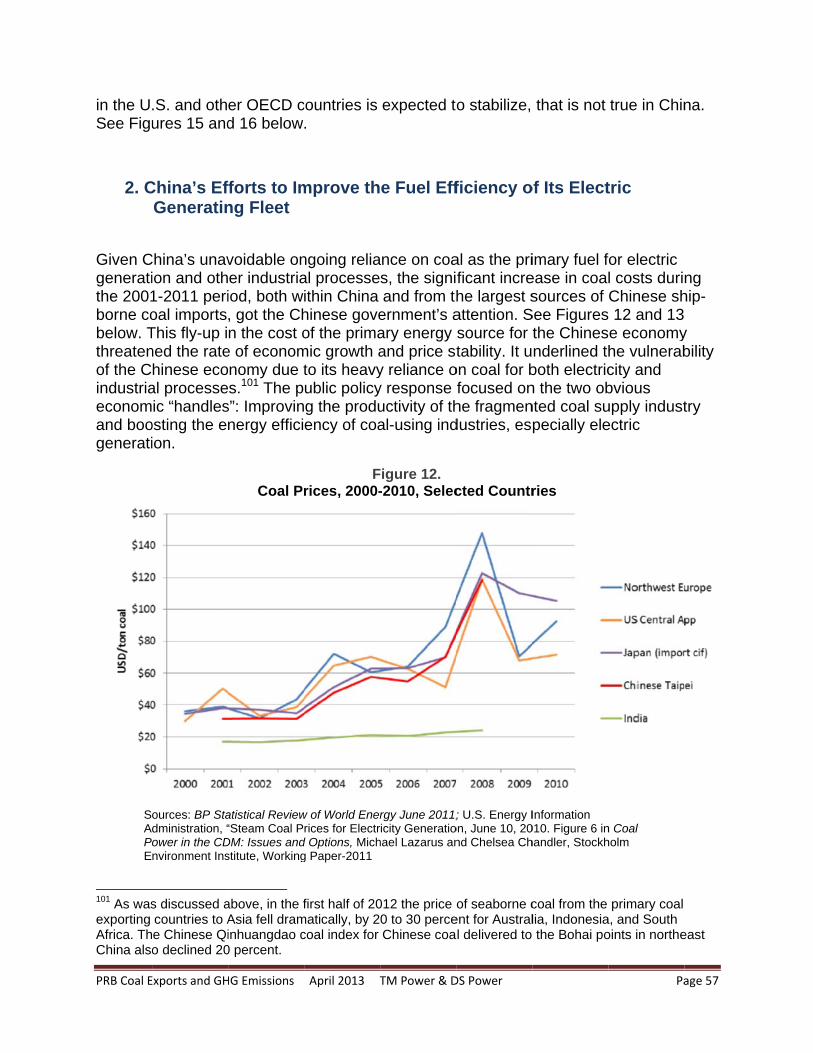
PRB Coal E
in the USee Figu
2. C
Given Cgeneratithe 2001borne cobelow. Tthreatenof the Cindustriaeconomand boogenerati
SAPE
101 As wasexporting Africa. ThChina also
Exports and GH
.S. and othures 15 and
China’s EfGeneratin
China’s unavion and oth1-2011 perioal importsThis fly-up ined the ratehinese eco
al processeic “handles
osting the eion.
ources: BP Stadministration, “ower in the CDnvironment Ins
s discussed acountries to Ae Chinese Qio declined 20
HG Emissions
er OECD cd 16 below
fforts to Imng Fleet
voidable oner industriaiod, both w, got the Chn the cost o
e of economnomy due ts.101 The p
s”: Improvinnergy effici
Coal Pr
atistical Review“Steam Coal P
DM: Issues andstitute, Working
above, in the fAsia fell draminhuangdao c0 percent.
April 2013 T
countries is .
mprove th
ngoing reliaal processeithin China hinese goveof the prima
mic growth ato its heavyublic policyg the produency of coa
Frices, 2000-
w of World Enerrices for Electr
d Options, Michg Paper-2011
first half of 20matically, by 2coal index for
TM Power & D
expected to
e Fuel Eff
ance on coas, the signiand from th
ernment’s aary energy and price sty reliance oy response uctivity of thal-using ind
Figure 12. -2010, Selec
rgy June 2011;icity Generatio
hael Lazarus an
012 the price o0 to 30 perceChinese coa
DS Power
o stabilize,
ficiency o
al as the prificant increhe largest sattention. Ssource for tability. It u
on coal for bfocused onhe fragmendustries, es
cted Countr
; U.S. Energy Ion, June 10, 20nd Chelsea Ch
of seaborne cent for Australl delivered to
that is not
of Its Elect
imary fuel fease in coalsources of
See Figuresthe Chinesnderlined thboth electricn the two obnted coal supecially ele
ries
Information 010. Figure 6 inhandler, Stockh
coal from the lia, Indonesia the Bohai po
Pa
true in Chin
tric
for electric l costs duriChinese sh 12 and 13e economyhe vulnerabcity and bvious upply industectric
n Coal holm
primary coal a, and South oints in northe
age 57
na.
ng hip-
y bility
try
east
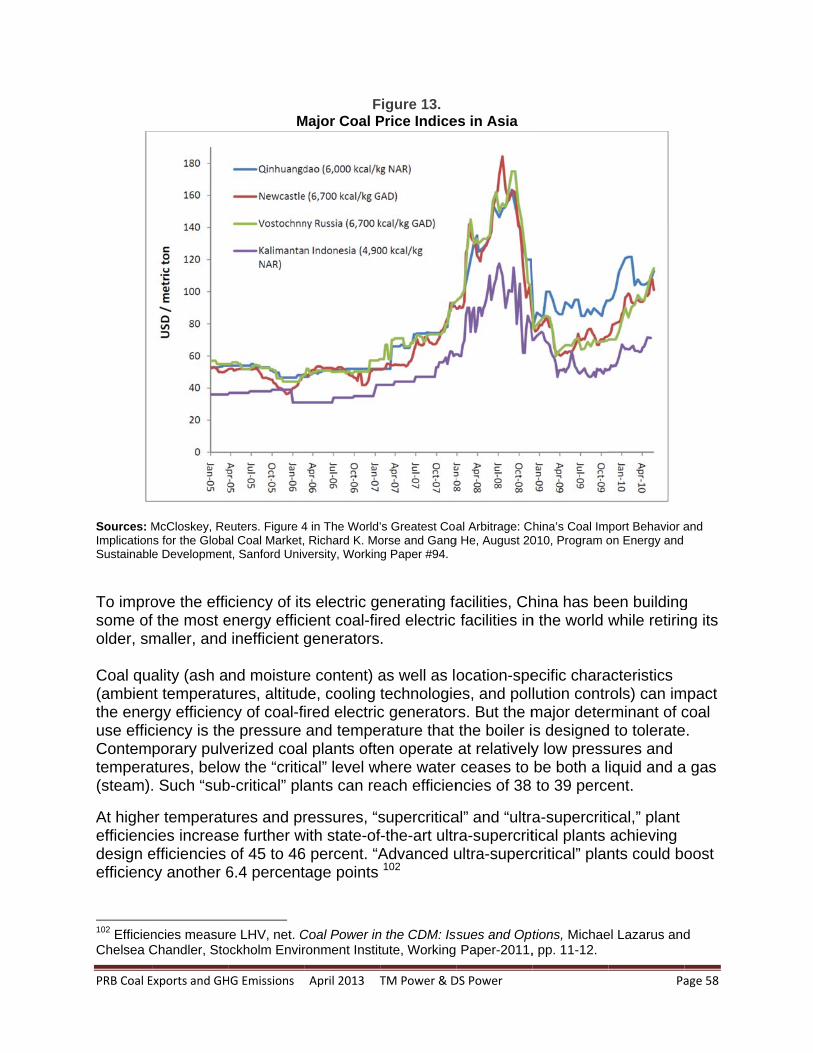
PRB Coal E
Sources: MImplicationSustainabl
To improsome ofolder, sm Coal qua(ambienthe eneruse efficContemtempera(steam).
At higheefficiencdesign eefficienc
102 EfficienChelsea C
Exports and GH
McCloskey, Res for the Globae Developmen
ove the effif the most emaller, and
ality (ash ant temperaturgy efficiencciency is theporary pulv
atures, belo. Such “sub
er temperatucies increasefficiencies cy another 6
ncies measurChandler, Sto
HG Emissions
M
euters. Figure 4al Coal Market,t, Sanford Univ
ciency of itsenergy effic
inefficient g
nd moistureures, altitudcy of coal-fe pressure verized coaw the “critic
b-critical” pla
ures and prse further wof 45 to 46
6.4 percent
re LHV, net. Cockholm Envir
April 2013 T
FMajor Coal P
4 in The World’ Richard K. Mo
versity, Workin
s electric gecient coal-firgenerators
e content) ade, cooling ired electricand tempel plants oftecal” level wants can re
ressures, “swith state-of6 percent. “Atage points
Coal Power inronment Instit
TM Power & D
Figure 13. Price Indice
’s Greatest Coaorse and Gangg Paper #94.
enerating fared electric .
as well as lotechnologiec generatorerature that en operate here water
each efficien
supercriticaf-the-art ultrAdvanced u102
n the CDM: Istute, Working
DS Power
es in Asia
al Arbitrage: Cg He, August 20
acilities, Chfacilities in
ocation-spees, and pollrs. But the mthe boiler iat relativelyceases to
ncies of 38
al” and “ultrara-supercritultra-superc
sues and Op Paper-2011,
hina’s Coal Im010, Program o
hina has ben the world w
ecific charalution contrmajor deters designedy low pressbe both a lto 39 perce
a-supercrititical plants critical” plan
tions, Michae, pp. 11-12.
Pa
port Behavior aon Energy and
een buildingwhile retirin
acteristics rols) can imrminant of cd to toleratesures and iquid and aent.
ical,” plant achieving nts could bo
el Lazarus and
age 58
and
g ng its
mpact coal e.
a gas
oost
d
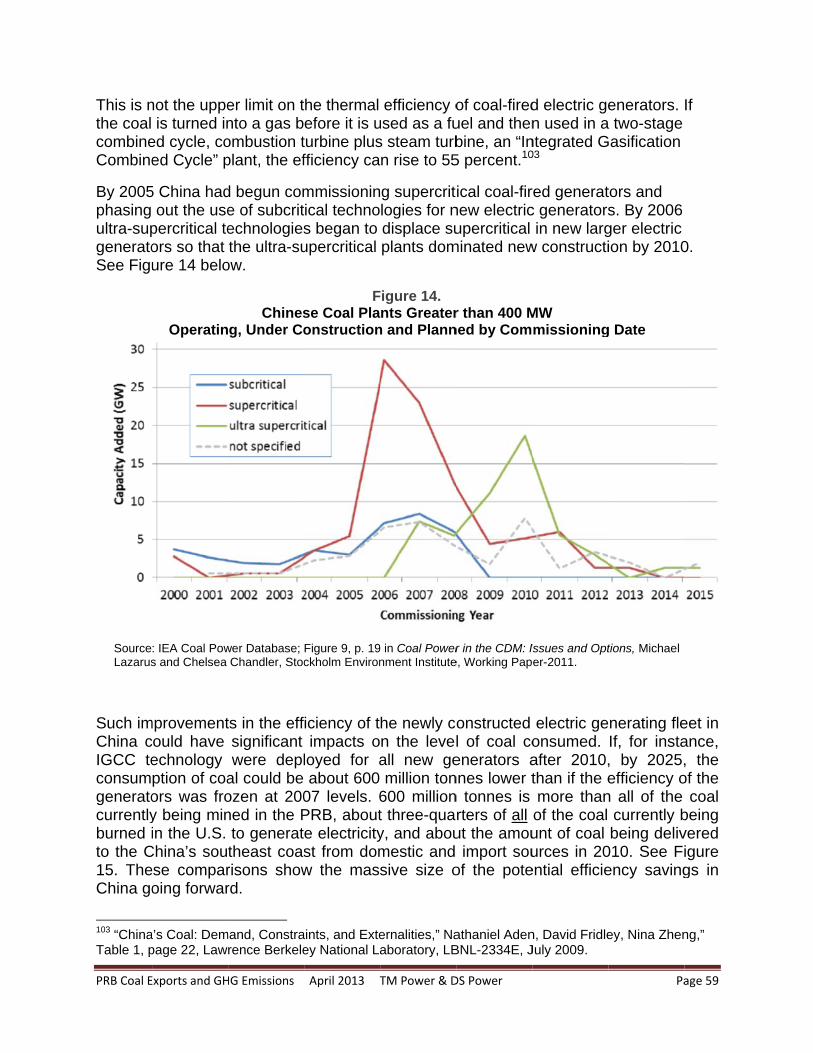
PRB Coal E
This is nthe coal combineCombine
By 2005phasing ultra-supgeneratoSee Figu
SourceLazarus
Such imChina cIGCC teconsumgeneratocurrentlyburned ito the C15. TheChina go
103 “ChinaTable 1, p
Exports and GH
not the uppeis turned in
ed cycle, coed Cycle” p
5 China hadout the use
percritical teors so that ure 14 belo
Operatin
: IEA Coal Pows and Chelsea
mprovementcould have echnology ption of coaors was froy being minin the U.S.
China’s souese comparoing forwar
a’s Coal: Dempage 22, Law
HG Emissions
er limit on tnto a gas bombustion tplant, the ef
d begun come of subcritechnologiesthe ultra-su
ow.
Chinesg, Under Co
wer Database; Chandler, Stoc
ts in the effsignificant were depl
al could be ozen at 200ned in the Pto generattheast coasrisons showrd.
mand, Constra
rence Berkele
April 2013 T
he thermal efore it is uturbine plusfficiency ca
mmissioninical technos began to upercritical
Fse Coal Plaonstruction
Figure 9, p. 19ckholm Environ
iciency of timpacts o
loyed for aabout 600
07 levels. 6PRB, aboute electricityst from domw the mass
aints, and Exteey National La
TM Power & D
efficiency oused as a fus steam turbn rise to 55
g supercritlogies for ndisplace suplants dom
Figure 14. nts Greater
n and Plann
9 in Coal Powernment Institute
he newly con the levelall new gemillion ton
600 milliont three-quay, and aboumestic and sive size o
ernalities,” Naaboratory, LB
DS Power
of coal-fireduel and thenbine, an “In5 percent.10
ical coal-firnew electricupercritical
minated new
r than 400 Mned by Com
r in the CDM: Ie, Working Pap
onstructed l of coal coenerators annes lower tn tonnes is rters of allut the amou
import souof the pote
athaniel AdenBNL-2334E, J
d electric gen used in a
ntegrated G03
red generatc generatorsin new larg
w constructi
MW missioning
Issues and Opter-2011.
electric geonsumed. after 2010,than if the emore thanof the coal unt of coal urces in 20
ential efficie
n, David FridleJuly 2009.
Pa
enerators. a two-stage Gasification
tors and s. By 2006 ger electric ion by 2010
g Date
tions, Michael
nerating fleIf, for insta, by 2025,efficiency o
n all of the currently bbeing deliv
010. See Fiency saving
ey, Nina Zhen
age 59
If
0.
eet in ance, , the of the
coal being vered igure gs in
ng,”
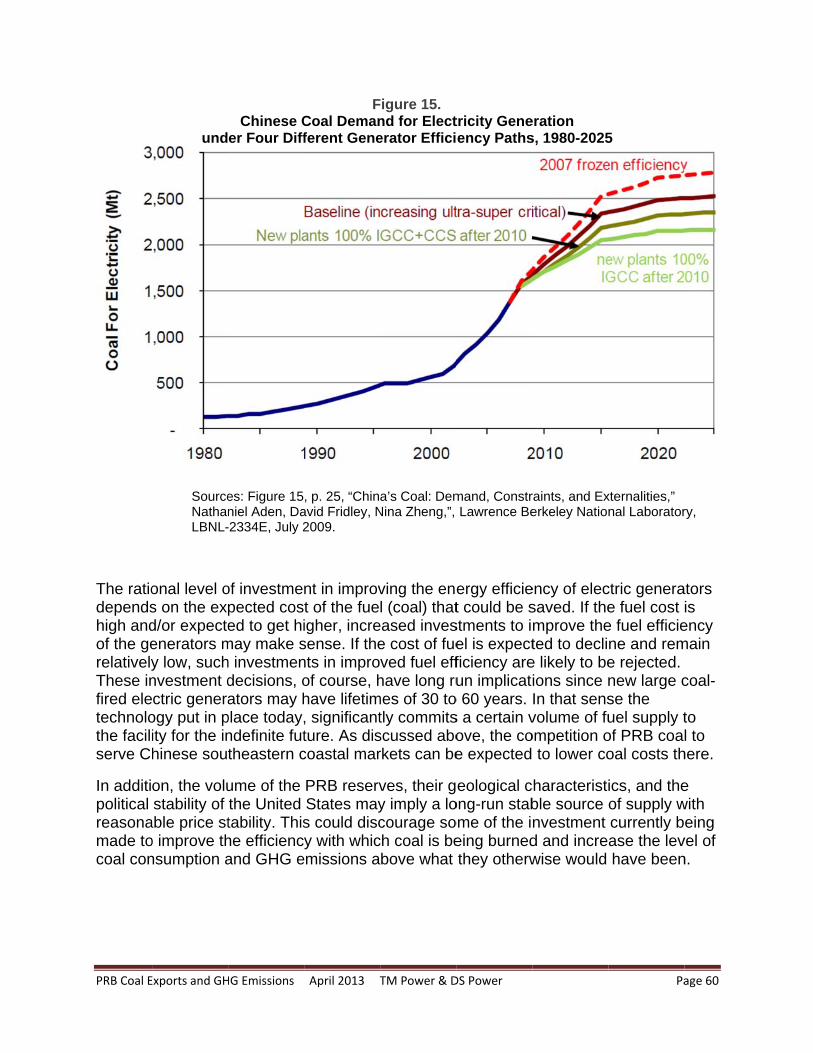
PRB Coal E
The ratiodependshigh andof the gerelativelyThese infired eletechnolothe faciliserve Ch
In additipolitical reasonamade tocoal con
Exports and GH
und
SourceNathanLBNL-
onal level os on the expd/or expecteenerators my low, suchnvestment dctric genera
ogy put in pity for the inhinese sou
on, the volustability of
able price sto improve thnsumption a
HG Emissions
Chinese Cer Four Diff
es: Figure 15niel Aden, Da-2334E, July 2
of investmepected cosed to get hi
may make sh investmendecisions, oators may h
place today,ndefinite futtheastern c
ume of the the United tability. Thishe efficiencand GHG e
April 2013 T
FCoal Demanferent Gene
, p. 25, “Chinavid Fridley, N2009.
nt in improvt of the fueigher, incresense. If thents in improof course, hhave lifetim, significantture. As discoastal mar
PRB reservStates mays could discy with whic
emissions a
TM Power & D
Figure 15. nd for Electerator Effici
a’s Coal: DemNina Zheng,”,
ving the enel (coal) that
eased invese cost of fueved fuel effhave long ru
mes of 30 totly commitsscussed aborkets can be
ves, their gy imply a locourage so
ch coal is bebove what
DS Power
tricity Geneency Paths
mand, ConstrLawrence Be
ergy efficiet could be s
stments to iel is expectficiency areun implicat
o 60 years. s a certain vove, the coe expected
eological cong-run stabome of the ieing burnedthey otherw
eration s, 1980-2025
raints, and Exerkeley Nation
ency of elecsaved. If themprove theted to declie likely to beions since nIn that sensvolume of fuompetition o to lower co
characteristible source nvestment d and increwise would
Pa
5
xternalities,” nal Laborator
ctric generae fuel cost e fuel efficiene and reme rejected. new large cse the uel supply tof PRB coaoal costs th
ics, and theof supply wcurrently base the levhave been
age 60
ry,
ators is
ency main
coal-
to l to
here.
e with eing
vel of n.
PRB Coal Exports and GHG Emissions April 2013 TM Power & DS Power Page 61
3. Other Chinese Efforts to Improve the Efficiency of Energy Production and Use
As part of the 12th Five Year Plan (FYP), China is attempting to put itself on a track to reduce the energy intensity of its economy by 16 percent by 2015.104 This plan is extremely ambitious. The only energy goal of the 11th FYP that China did not meet, was its targeted reduction in energy intensity by 20 percent.105 As part of that 11th FYP goal, China started “China’s Top-1000 Energy-Consuming Enterprise Program” where government officials visited the top 1,000 energy consuming enterprises and specifically implemented energy reduction strategies. Many analysts have pointed out that since China picked the “low hanging fruit” by implementing change in the most energy intense enterprises, its current program to expand the “top 1,000” to a tenfold larger group and go after the top 10,000 energy intensive firms, will be difficult.106 The point is, however, that China understands the importance of energy efficiency in meeting its economic, energy, and environmental goals.
A large part of the energy segment of the 12th FYP focuses on mining coal more efficiently. China is linking coal mining with more efficient electric generators by building mine-mouth generating super centers.107 For the last two FYPs, China has been trying to consolidate much of its coal industry from small privately owned mines that have been inefficient, environmentally damaging, and extremely dangerous, to large scale, efficient mines adjacent to mine-mouth electric generators. Although these improvements will not help places like the southern coast of China where there are not large coal reserves, it will help China as a whole become more energy efficient. Despite the fact that these coal and energy production measures will help produce energy more efficiently, the Chinese grid that moves the electricity to demand centers will also have to be expanded and needs to become more efficient itself.
To help become more efficient China is also implementing smart grid technology. By 2030 China hopes to have installed 360 million smart meters to monitor exactly where their energy is going, and encourage efficient use of that energy.108 Because China’s population continues to live increasingly in urban settings and is becoming more affluent, it is also using more energy, especially electricity. China is attempting to balance the increased use of electricity with improvements in the efficiency. All of these gains and goals must then be set against the reality that the lion’s share of China’s electricity comes from coal, and will continue to come from coal for the foreseeable future.
104 http://www.c2es.org/international/factsheet/energy-climate-goals-china-twelfth-five-year-plan 105 Backgrounder: China’s 12th Five-Year Plan. Casey, J. and Koleski, K. U.S.-China Economic & Security Review Commission. June 24, 2011. 106 Ibid. 107 Remaking the World’s Largest Coal Market: The Quest to Develop Large Coal-Power Bases in China. H. Rui, R. Morse, and G. He. Program on Energy and Sustainable Development. 2010. 108 Backgrounder: China’s 12th Five-Year Plan. Casey, J. and Koleski, K. U.S.-China Economic & Security Review Commission. June 24, 2011. (page 9)
PRB Coal Exports and GHG Emissions April 2013 TM Power & DS Power Page 62
4. China’s Efforts to Expand Non-Fossil Fuel Energy Supplies
Currently China produces 8.3 percent of its energy from non-fossil fuels.109 China plans to produce 11.4 percent and then 15 percent of its energy from non-fossil fuels by 2015 and 2020 respectively.110 To make these changes a reality, China has begun construction on new hydro power facilities, large offshore wind power generators, nuclear power plants, and new solar power capacity.111 During the 11th FYP China showed its commitment to non-fossil fuels and the environment by spending more than $300 billion dollars on clean energy technology and the environment. This commitment to clean energy technologies has positioned China as a global leader in solar and wind technologies.112 China is now the world leader in production of photovoltaic cells and controls 17 percent of the world’s market for silicon.113
China’s non-fossil fuel goals have to be ambitious if it is going to try to reduce its dependence on coal. With a large increase in Chinese electricity consumption predicted by the EIA, China, in the words of the New York Times, will be essentially “running in place” even if it is able to implement all of its non-fossil fuel goals.114 The EIA projects that by 2035 China will be consuming almost 10 trillion kilowatt hours of energy each year.115 To put that in context, China would account for almost one third of worldwide electrical consumption.
China will be the world leader in nuclear power in terms of the total installed capacity by 2035.116 Nuclear energy’s share of electrical power production is predicted to climb from 2 percent in 2008 to 10 percent in 2035. The EIA also projects that China will add more wind, hydro, and solar power capacity than any other country by 2035.117 All of these gains have to be set against the backdrop of increased electrical consumption that is largely satisfied by coal fired electric generation.
As with energy efficiency, the rational level of investment in non-coal sources of energy will at least partially depend on how high the monetary costs associated with coal-fired generation are. Of course there are substantial non-market costs associated with the production and use of coal that one would hope public policy would also include in its economic calculus, including human health and safety, climate stability, and local quality of life. But the expected trajectory of the monetary cost of coal as a fuel for electric generation compared to these various alternatives is also likely to influence decisions about the appropriate level of investment in nuclear, hydro, wind, solar, and biological
109 Ibid. 110 Backgrounder: China’s 12th Five-Year Plan. Casey, J. and Koleski, K. U.S.-China Economic & Security Review Commission. June 24, 2011. 111 Ibid. 112 Ibid. 113 Ibid. 114 http://www.nytimes.com/cwire/2011/04/12/12climatewire-chinas-ambitious-high-growth-5-year-plan-sti-12439.html?pagewanted=all 115 International Energy Outlook 2011. U.S. Department of Energy, EIA, page 86, figure 74. 116 Ibid. Page 88. 117 Ibid. Electricity section.

PRB Coal Exports and GHG Emissions April 2013 TM Power & DS Power Page 63
sources of energy. Lower and more stable costs associated with coal would tend to reduce the investments in alternative energy sources.
PRB Coal Exports and GHG Emissions April 2013 TM Power & DS Power Page 64
VI. Exporting Raw Materials Rather Than New Technology, Goods and Services
There is something troubling about the increased emphasis on the export of American coal to the rest of the world, especially to the developing countries of Asia. The flattening of the growth in the demand for coal in the more affluent developed countries of the world is at least partially due to the recognition that coal combustion results in a variety of health and climate threatening emissions. This has led to increasingly strict regulation of those emissions and the threat of more restrictions to come, including limits and/or charges on emissions of greenhouse gases, in the future. This increased regulation of the production, combustion, and disposal of combustion waste products of coal has raised the cost of coal-fired electric generation and threatens to raise it still further in the future. That, combined with expanded supplies of natural gas in some parts of the world, has led to a shift away from coal-fired electric generation in the developed nations of the world. The EIA projects that almost all of the future growth in coal consumption around the world will take place in the developing countries while coal consumption in the more affluent, developed countries stabilizes and then declines. See Figure 16 below which shows the coal consumption in the Organization for Economic Cooperation and Development (OECD) countries dipping and then largely stabilizing while that of non-OECD countries’ coal consumption rises steeply. The irony, of course, is that because the affluent countries of the world have brought their demand for and use of coal under control, this flattening of demand growth has spurred a search by American coal companies for alternative markets into which increasing amounts of their coal can be sold and burned. The fear is that this will simply compound global environmental problems around the world, negating what those countries that have stabilized their use of coal intended to accomplish. Often the export of raw coal to developing countries is presented as an appropriate way for the United States to boost its exports, boost employment in relatively high-paid jobs, and help balance America’s trade deficit with the newly industrializing countries of Asia. Although the desire of coal companies to expand their markets is understandable, coal company self-interest should not be confused with or wrapped in America’s economic interests. Exporting unprocessed raw materials to the developing world in order to finance the purchase of manufacturing goods produced by them is an exceedingly backward economic strategy that is likely to harm, not help, the ongoing vitality of the American economy. This is true for several reasons.
1. The Need for the United States to Focus on the Development of Clean Energy Technologies
Even the largest coal producing and consuming nations of the world recognize that the future does not belong to coal, unless major technological development make it feasible
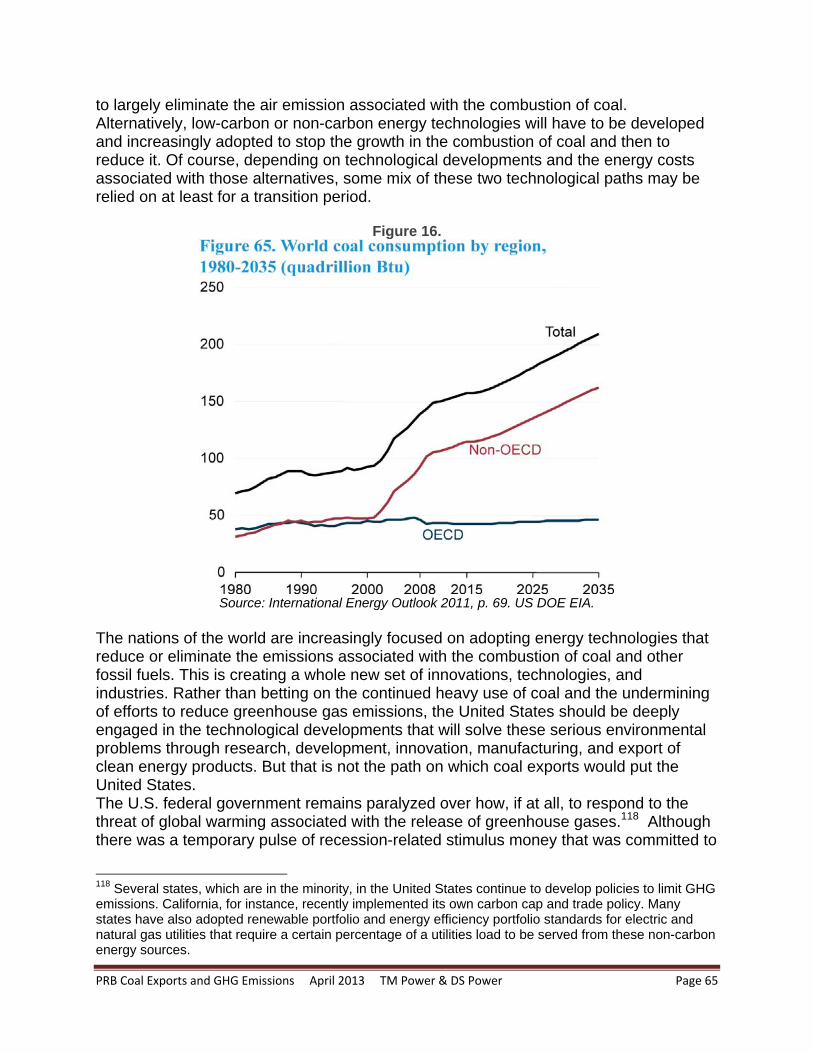
PRB Coal Exports and GHG Emissions April 2013 TM Power & DS Power Page 65
to largely eliminate the air emission associated with the combustion of coal. Alternatively, low-carbon or non-carbon energy technologies will have to be developed and increasingly adopted to stop the growth in the combustion of coal and then to reduce it. Of course, depending on technological developments and the energy costs associated with those alternatives, some mix of these two technological paths may be relied on at least for a transition period.
Figure 16.
Source: International Energy Outlook 2011, p. 69. US DOE EIA.
The nations of the world are increasingly focused on adopting energy technologies that reduce or eliminate the emissions associated with the combustion of coal and other fossil fuels. This is creating a whole new set of innovations, technologies, and industries. Rather than betting on the continued heavy use of coal and the undermining of efforts to reduce greenhouse gas emissions, the United States should be deeply engaged in the technological developments that will solve these serious environmental problems through research, development, innovation, manufacturing, and export of clean energy products. But that is not the path on which coal exports would put the United States. The U.S. federal government remains paralyzed over how, if at all, to respond to the threat of global warming associated with the release of greenhouse gases.118 Although there was a temporary pulse of recession-related stimulus money that was committed to
118 Several states, which are in the minority, in the United States continue to develop policies to limit GHG emissions. California, for instance, recently implemented its own carbon cap and trade policy. Many states have also adopted renewable portfolio and energy efficiency portfolio standards for electric and natural gas utilities that require a certain percentage of a utilities load to be served from these non-carbon energy sources.
PRB Coal Exports and GHG Emissions April 2013 TM Power & DS Power Page 66
the development of renewable energy projects, the federal government has largely limited its involvement in the actual implementation of a lower carbon energy future for the United States to the manipulation of the tax codes to subsidize investments in various type of renewable energy, from wind electric generation to ethanol production. Much of the rest of the developed world, as well as some of the most rapidly growing developing countries, have taken much more aggressive steps to reduce their reliance on the most carbon-intensive of fossil fuels, coal. Even the world’s leading coal consumer, China, has invested very heavily, compared to the United States, in developing clean energy technologies. It is now the world leader in photovoltaic cell production and in both installed capacity of wind-electric generators and total production of wind turbines.119 China has also become a world leader in new nuclear development. American’s debate whether global warming is real and, if it is, whether it is caused by human activity, and even if the latter is true, whether the government has a legitimate role to play in regulating those economic activities to reduce greenhouse gas emissions. Meanwhile nearly the entire world scientific community rejects this “doubters” position and many other countries, from China to Denmark and from South Korea to Turkey, are investing heavily in developing and installing non-carbon energy technologies. Initially supported by serving the domestic demand within their own countries, they have since become exporters of those clean energy technologies to other countries, including the United States. As a result, the United States imports the majority of the domestic wind electric turbines that are being installed. Hybrid and electric car technologies are also being imported from other nations. Various proposals to experiment with the capture and sequestration of carbon dioxide emissions in the United States have been abandoned. China, however, continues experimenting and testing various sequestration technologies. In the United States solar technology is largely limited to a few very large, utility-scale projects in the desert southwest, while Germany and other countries are installing solar voltaic arrays on tens of thousands of houses and businesses. If one were to judge by the current trajectories of clean energy technology development in various countries, one might conclude that ultimately the United States will import most of the clean energy equipment and technologies to serve its markets from other countries, including China, in the future. This, of course, is an environmental problem since it is largely the very small domestic market for clean energy technologies in the U.S. that has limited the development of domestic industries focusing on that demand. That lagging demand for clean energy technologies is a symptom of America’s ongoing long-term commitment to fossil fuels despite the environmental and global warming problems associated with their combustion. It is also, however, an economic problem for the U.S. because it involves allowing other countries to get a competitive lead in a whole set of innovative technologies that are going to be in increasing demand around the world, including, ultimately, across the United States, in the years to come. This includes the energy technologies that will allow a growing world economy and population to continue to 119 http://www.nytimes.com/2010/01/31/business/energy-environment/31renew.html
PRB Coal Exports and GHG Emissions April 2013 TM Power & DS Power Page 67
serve human needs and aspirations while also avoiding the more catastrophic effects of global warming. The slowly developing markets in the U.S. for clean energy technologies and America’s reliance on importing much of the clean energy technologies that it is deploying effectively grants the “first-mover advantage” in the development, manufacturing, and exporting of these technologies to other nations.120 This will deprive the U.S. of a significant opportunity to establish itself as a technological leader in the clean energy field and to develop a manufacturing industry around it. The U.S. was successful at capturing such first-mover advantages in aero-space, microchip, computer software, and pharmaceutical technologies in the recent past. It is not, however, acting to take such a leadership position in the clean energy field as investments in that set of technologies begins to burgeon worldwide. The clean energy field matters economically because of the way that energy interacts with most other sectors of the economy. Innovation in clean energy will lead to innovations throughout the rest of the economy. And technological innovation remains an important driver of regional and national economic development. Dozens of the world’s nations including China, Brazil, Korea, and Turkey as well as the countries of the European Union are investing heavily in these technologies with the expectation that these investments will boost economic productivity, generate both knowledge and manufacturing jobs, and boost their exports.121 The “first-mover” advantage in the development of a technology gives the early developers of technologies the opportunity to develop economies of scale, establish the manufacturing, installation, and delivery infrastructure, “cluster” symbiotic innovators in particular geographic areas where their interaction has positive feedback loops that allow them to maintain their technological leadership, while on the practical side of manufacturing and installation they gain the advantages of learning-by-doing. All of this can allow the early movers to capture a lasting competitive advantage over other firms and nations.122 It is here that the United States should be focused. Not on clinging to “king coal” by turning to the developing world to expand American coal production and worldwide coal consumption. This path has more than minor similarities to the socially destructive response of U.S. tobacco companies to declines in smoking in the United States. American tobacco responded by successfully expanding the markets for their health-damaging products in developing countries. The United States has much more to gain by developing clean energy markets in the United States so that a domestic industry
120 “Rising Tigers, Sleeping Giant: Asian Nations Set to Dominate the Clean Energy Race,” Rob Atkinson et al., Breakthrough Institute and the Information Technology and Innovation Foundation, November 2009. http://thebreakthrough.org/blog/Rising_Tigers.pdf 121 Sizing the Clean Economy: A National and Regional Green Jobs Assessment, Mark Muro, Jonathan Rothwell, and Devashree Saha, Metropolitan Policy Program, Brookings Institution, Washington DC, 2011. http://www.brookings.edu/~/media/Files/Programs/Metro/clean_economy/0713_clean_economy.pdf 122 Op. cit. “Rising Tigers, Sleeping Giant.”
PRB Coal Exports and GHG Emissions April 2013 TM Power & DS Power Page 68
focused on innovation can blossom on a scale that will ultimately allow it not only to serve domestic demand but also export superior products to the rest of the world.
2. Coal Mining and Rail and Ocean Shipping Are Mature Industries with Relatively Low Employment Potential
When the employment benefits of coal mining and shipping are discussed, it is not the creation of large number of jobs that is emphasized, but the relatively high pay levels associated with the modest number of jobs that are created. In fact, as coal production increased 86 percent in the United States between 1978 and 2008, coal mining employment was cut in half, falling from 220,000 to 110,000. The pattern is the same whether we include or exclude underground coal mines, which are more labor intensive, and focus only on surface mining. Thus, even with expanding coal production, employment falls as labor displacing technologies are systematically deployed. See Figure 17 below. In the Powder River Basin the mine employment per 10 million tons of coal produced each year was about 140 in 2010. The average mine in Campbell County, the center of the PRB coal production and the source of 97 percent of Wyoming’s coal, employed about 500 workers and produced about 36 million tons of coal per year.123 Rail transportation is also a mature industry that has been consolidating into a smaller and smaller number of large companies that employ fewer and fewer workers even as the volume hauled increases. Between 1987 and 2009 rail shipments in the U.S. have increased 37 percent while the number of worker-hours has dropped 42 percent. As a result the hours of labor effort needed to move a given volume of goods has declined 58 percent and the workers employed per million tons of freight has declined 54 percent.124 Railroads, despite the expansion of rail traffic, have not been a source of job growth and cannot be expected to be so in the future. There have also been major technological changes at ports with the adoption of containerization of loads and modern bulk handling methods which have significantly boosted labor productivity and reduced the size of the workforce necessary to handle any given volume or weight of cargo.125 As a result, the loading of coal onto ships at coastal ports has become highly mechanized and automated. That means that the number of jobs associated with coal ports will also be modest. For instance the Millennium Bulk Terminal proposed at Longview, WA, was originally presented as handling 5.7 million tons per year and employing 70 workers. The Westshore Terminal in Delta, BC, just outside of Vancouver, has a coal handling
123 Annual Report of the State Inspector of Mines of Wyoming, Year Ending December 31, 2010, pp. 34-35. 124 Bureau of Labor Statistics, Labor Productivity Indexes by Industry, August 30, 2011. 125 Restrictive Labor Practices in Seaports. Harding, Alan S. Infrastructure and Urban Development Department, The World Bank, October 1990, WPS 514.
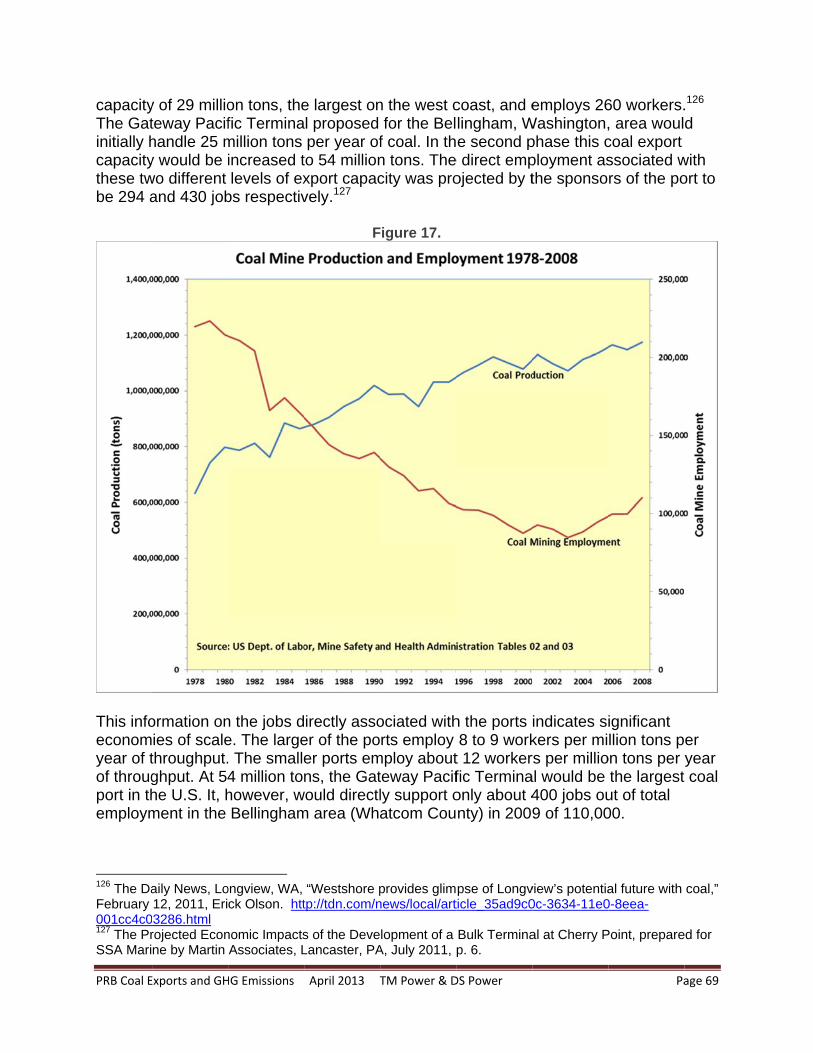
PRB Coal E
capacityThe Gatinitially hcapacitythese twbe 294 a
This infoeconomyear of tof througport in themploym
126 The DaFebruary 001cc4c0127 The PrSSA Mari
Exports and GH
y of 29 millioteway Pacifhandle 25 my would be iwo different and 430 job
ormation onies of scalethroughput.ghput. At 54he U.S. It, hment in the
aily News, Lo12, 2011, Eri3286.html rojected Econne by Martin
HG Emissions
on tons, thefic Terminamillion tons increased tlevels of ex
bs respectiv
n the jobs de. The large. The smalle4 million tohowever, wBellingham
ongview, WA, ck Olson. htt
nomic ImpactsAssociates, L
April 2013 T
e largest onl proposed per year of
to 54 millionxport capacvely.127
F
irectly assoer of the poer ports emns, the Gat
would directlm area (Wha
“Westshore ptp://tdn.com/n
s of the DeveLancaster, PA
TM Power & D
n the west cfor the Bel
f coal. In thn tons. Thecity was pro
Figure 17.
ociated withrts employ
mploy aboutteway Pacifly support oatcom Cou
provides glimnews/local/art
lopment of a A, July 2011, p
DS Power
coast, and elingham, We second p
e direct empojected by t
h the ports 8 to 9 work
t 12 workerfic Terminaonly about 4nty) in 2009
pse of Longvticle_35ad9c0
Bulk Terminap. 6.
employs 26Washington,phase this cployment asthe sponso
indicates sikers per mirs per millioal would be 400 jobs ou9 of 110,00
view’s potentia0c-3634-11e0
al at Cherry P
Pa
60 workers., area woulcoal export ssociated wrs of the po
ignificant llion tons p
on tons per the largest
ut of total 00.
al future with 0-8eea-
Point, prepare
age 69
.126 d
with ort to
er year coal
coal,”
ed for

PRB Coal Exports and GHG Emissions April 2013 TM Power & DS Power Page 70
In contrast to these modest and shrinking job prospects in coal mining and transportation, the clean energy economy employed about 2.7 million workers in 2010 and those jobs have been growing at over 3 percent per year. About a quarter of these clean economy jobs are found in manufacturing while only about 9 percent of jobs across all of the American economy are found in manufacturing. The clean energy industries are also about twice as export-intensive as the typical firm.128 In terms of the United States regaining its competitive edge as a source of new technologies that not only serve its domestic markets but also allows it to export both innovative products and the skilled services to deploy, operate, and maintain those technologies, raw coal exports have little to contribute. It reverses the typical roles between developing and developed countries with the United States supplying unprocessed raw material to developing countries while we import from them not only the high tech products we now import but also the new clean technologies that are being developed to serve markets around the world. That is not a productive trajectory for the American economy.
128 Op.cit. Sizing the Clean Economy, Brookings Institution, p. 4.
PRB Coal Exports and GHG Emissions April 2013 TM Power & DS Power Page 71
Bibliography
Adcock, T. Annual Report of the State Inspector of Mines of Wyoming. December, 2010.
Adams, G. Schachmurove, Y. Modeling and forecasting energy consumption in China: Implications for Chinese energy demand and imports in 2020. Energy Economics 30 (2008).
Aden, N. Fridley, D. Zheng, N. China’s Coal: Demand, Constraints, and Externalities. Lawrence Berkeley National Laboratory. 2009. http://china.lbl.gov/publications/china%E2%80%99s-coal-demand-constraints-and-externalities
Associated Press. Buffington buying Burlington Northern railroad. U.S. business on msnbc.com. November 3, 2009. http://www.msnbc.msn.com/id/33599744/ns/business-us_business/t/buffett-buying-burlington-northern-railroad/#.TysHovlnASF
Atkinson, R. and Shellenberger, M. et al. Rising Tigers, Sleeping Giant: Asian Nations Set to Dominate the Clean Energy Race. Breakthrough Institute and the Information Technology and Innovation Foundation. November, 2009. http://thebreakthrough.org/blog/Rising_Tigers.pdf
Austin, A. Energy and Power in China: Domestic Regulation and Foreign Policy. Foreign Policy Centre, London, UK. April 2005.
Bowles, S. Gintis, H. A Cooperative Species:Human Reciprocuty and Its Evolution. Princeton University Press. 2011.
Bradsher, K. China Leading Global Race to Make Clean Energy. New York Times. January 30, 2010. http://www.nytimes.com/2010/01/31/business/energy-environment/31renew.html
Bradsher, K. China Reportedly Plans Strict Goals to Save Energy. New York Times. March 4, 2011. http://www.nytimes.com/2011/03/05/business/energy-environment/05energy.html?pagewanted=all
Buchsbaum, L. Coal Producers and Shipper Work to Increase Export Capacity. Coal Age. June 9, 2011. http://www.coalage.com/index.php/features/1087-coal-producers-a-shippers-work-to-increase-export-capacity.html
Bureau of Labor Statistics. Labor Productivity Indexes by Industry. August, 2011.
PRB Coal Exports and GHG Emissions April 2013 TM Power & DS Power Page 72
Casey, J. and Koleski, K. Backgrounder: China’s 12th Five-Year Plan. U.S.-China Economic & Security Review Commission. June, 2011.
Chinamining.org. China to soon cut coal import VAT and port charges. August 4, 2011. http://www.chinamining.org/Policies/2011-08-04/1312443953d48628.html
China.org. How Does the VAT Work in China? From the China’s Ministry of Finance. March 13, 2007. http://china.org.cn/english/LivinginChina/202770.htm
Cloud Peak Energy. Investors Presentation. November, 2011.
Connely, J. Strategic withdrawal for Longview coal exporter. Seattle PI. March 15, 2011. http://blog.seattlepi.com/seattlepolitics/2011/03/15/strategic-withdrawal-for-longview-coal-exporter/
Dahl, C. A Survey of Energy Demand Elasticities in Support of the Development of the NEMS. Contract No. DE-Apo1-93EI23499 (Washington, DC, October 1993). http://mpra.ub.uni-muenchen.de/13962/
Du, Juan. Coal Prices Drop to Record Low, China Daily, June 29, 2012.
EIA. Annual Coal Report 2009. DOE/EIA-0584 (2009). http://www.eia.gov/FTPROOT/coal/05842009.pdf
EIA. Annual Coal Report 2010. DOE/EIA-0584 (2010). http://www.eia.gov/coal/annual/
EIA. Annual Energy Outlook 1995. January, 1995.
EIA. Annual Energy Outlook 2011. December, 2011.
EIA. Annual Energy Review. October, 2011.
EIA. International Energy Outlook 2011. September, 2011.
EIA. International Energy Statistics. February, 2012. http://www.eia.gov/cfapps/ipdbproject/iedindex3.cfm?tid=1&pid=1&aid=2&cid=ww,&syid=1995&eyid=2010&unit=TST
EIA. Monthly Time Series File. US DOE, EIA-923. 2010
EIA. NYMEX coal futures near-month contract final settlement price 2012. January, 2012. http://205.254.135.7/coal/nymex/
EIA. Rail Coal Transportation Rates to the Electric Power Sector. June, 2011. http://www.eia.gov/coal/transportationrates/pdf/waybill.pdf
PRB Coal Exports and GHG Emissions April 2013 TM Power & DS Power Page 73
Energy Policy Research Foundation Inc. The Economic Value of American Coal Exports. August 2012. http://eprinc.org/2012/08/the-economic-value-of-american-coal-exports/
EPA. Attachment 5: The Powder River Basin. EPA 816-R-04-003. June, 2004. http://www.epa.gov/ogwdw/uic/pdfs/cbmstudy_attach_uic_attach05_powder.pdf
EPA. Chapter 9: Coal. EPA’s IPM Base Case v.4.10. September, 2010. http://www.epa.gov/airmarkets/progsregs/epa-ipm/docs/v410/Chapter9.pdf
EPA. Regulatory Actions: Proposed Action to Address Regional Haze. December, 2011.
Fisher-Vanden, K. Jefferson, G. Jingkui, M. Jianyi, X. Technology development and energy productivity in China. Energy Economics. 28 (2006): 690-705.
Fleck, A. Our Dry Bulk Shipping Projections: Sink or Swim? Seeking Alpha. October 27, 2010. http://seekingalpha.com/article/232661-our-dry-bulk-shipping-projections-sink-or-swim
Flores, R. Nichols, D. Tertiary Coal Resources in the Northern Rocky Mountains and Great Plains Region—a Clean and Compliant Fossil Fuel Beyond 2000. U.S. Geological Survey Professional Paper 1625-A. 1999. http://pubs.usgs.gov/pp/p1625a/ES/ESpt2.html
Frank, R. The Darwin Economy: Liberty, Competition, and the Common Good. Princeton University Press. 2011.
Gerking, Shelby and Stephen F. Hamilton. 2008. What Explains the Increased Utilization of Powder River Basin Coal in Electric Power Generation? American Journal of Agricultural Economics, 90(4):933-950.
Gershuni, Shneur A. “Some Coal Export and Port Capacity Math,” UBS Investment Research, US Coal, May 21, 2012. www.ubs.com/investmentresearch.com
Griffin, R. Peabody projections show lucrative Chinese market for PRB coal. Platts Energy Week. December 6, 2010. http://www.wusa9.com/news/local/story.aspx?storyid=124286
Harding, A. Restrictive Labor Practices in Seaports. Infrastructure and Urban Development Department, The World Bank. WPS 514. October 1990.
Harvey, C. Coal in Appalachia: An Economic analysis. University Press of Kentucky. 1986.
PRB Coal Exports and GHG Emissions April 2013 TM Power & DS Power Page 74
He, S. Xhang, L. Yand, Y. Wang, J. Wang, J. Economic analysis of coal price-electricity price adjustment in China based on the CGE model. Energy Policy 38 (2010): 6629-6637.
Huntington, H. Short- and long-run adjustments in U.S. petroleum consumption. Energy Economics 32(2010).
in-en.com. China to cut umport VAT to boost coal import. June 27, 2011. http://en.in-en.com/article/policy/html/2011062725430.html
Jiao, J-L. Fan, Y. Wei, Y-M. The structural break and elasticity of coal demand in China: empirical findings from 1980-2006. International Journal of Global Energy Issues 31(3/4):331-344. 2009.
Kirkland, J. China’s Ambitious, High Growth 5-Year Plan Stirs a Climate Debate. New York Times. April 12, 2011. http://www.nytimes.com/cwire/2011/04/12/12climatewire-chinas-ambitious-high-growth-5-year-plan-sti-12439.html?pagewanted=all
Kuby, Michael, Samuel Ratick and Jeffrey Osleeb. 1991. Modeling U.S. Coal Export Planning Decisions. Annals of the Association of American Geographers, 81(4): 627-649.
Lazarus, M. Chandler, C. Coal Power in the CDM: Issues and Options. Stockholm Environmental Institute. Working Paper-2011. http://cdm.unfccc.int/stakeholder/submissions/2011/1104_cdmwatch_req2.pdf
Lewis, J. Energy and Climate Goals of China’s 12th Five-Year Plan. Center for Climate and Energy Solutions. March, 2011. http://www.c2es.org/international/factsheet/energy-climate-goals-china-twelfth-five-year-plan
Liebreich, M. How to Save the Planet: Be Nice, Retaliatory, Forgiving & Clear. New Energy Finance. September, 2007.
Ma, H. Oxley, L. The integration of major fuel source markets in China: Evidence from panel and cointegration tests. Energy Economics, 32(5): 1139-1146.
Martin Associates. The Projected Economic Impacts of the Development of a Bulk Terminal at Cherry Point. Prepared for SSA Marine by Martin Associates, Lancaster, PA. July 2011.
McCabe, R. Coal ships create a traffic jam on Hampton Roads waters. The Virginia-Pilot. February 21, 2011. http://hamptonroads.com/2011/02/coal-ships-create-sight-hampton-roads-waters
PRB Coal Exports and GHG Emissions April 2013 TM Power & DS Power Page 75
Morse, R. He, G. The World’s Greatest Coal Arbitrage: China’s Coal Import Behavior and Implications for the Global Coal Market. Program on Energy and Sustainable Development, Stanford University, Working Paper No. 94. August, 2010.
Morse, R. Schernikau, L. Asia’s Changing Landscape. World Coal. October, 2011. http://hms-ag.com/fileadmin/user_upload/pdf/2011-10b_WorldCoal_LS_Article_-_Asian_Coal.pdf
Morse, R. "US Coal: A Stranded Asset Ready for Export?", presentation at IEA Outlook for Coal Industry and Markets, April 14, 2011, Beijing. Dated 12/04/2011. http://www.iea.org/work/2011/WEO_Coal/03_02_MORSE.pdf .
Muro, M. Rothwell, J. Saha, D. Sizing the Clean Economy: A National and Regional Green Jobs Assessment. Metropolitan Policy Program, Brookings Institution, Washington DC. July, 2011. http://www.brookings.edu/reports/2011/0713_clean_economy.aspx
Mutti, Hohn H. and William jE. Morgan. 1983. Changing Energy Prices and Economic Rents: The Case of Western Coal. Land Economics, 59(2):163-176, 1983.
Navarre, R. Expanding Markets and Peabody Growth Opportunities. 2010 Analyst and Investor Forum. June 17, 2010.
National Energy Technology Lab. NETL’s 2007 Coal Power Plant DataBase. http://www.netl.doe.gov/energy-analyses/hold/technology.html
Olson, E. Westshore provides glimpse of Longview’s potential future with coal. The Daily News. February 12, 2011. http://tdn.com/news/local/article_35ad9c0c-3634-11e0-8eea-001cc4c03286.html
Peng, S. Understanding the Chinese Coal Industry. Coal Age. 115(8):24-29. August, 2010
Pindyck, R. The Structure of World Energy Demand. The MIT Press. Cambridge, MA, 1979.
Platts. Coal’s shar of monthly power generation lowest since 1978:US EIA. March, 2012. http://www.platts.com/RSSFeedDetailedNews/RSSFeed/Coal/6038108
Platts. Platts International Coal Report. Issue 1047. November, 2011.
Price, Tom. UBS Investment Research, Coal, “Floor-seeking in Thermal Coal,” June 25, 2012.
Reuters. Asia Coal-Australia thermal coal demand ramps up. January 20, 2012. http://in.reuters.com/article/2012/01/20/coal-asia-idINL3E8CK2ED20120120
PRB Coal Exports and GHG Emissions April 2013 TM Power & DS Power Page 76
Reuters. China makes rare purchase of U.S. coal. September 21, 2011. http://www.ecoalchina.com/english/news/gnmtxw/957746.shtml
Rosen, D. Houser, T. China Energy: A Guide for the Perplexed. China Strategic Advisory. May 2007.
Rui, H. Morse, R. He, G. Remaking the World’s Largest Coal Market: The Quest to Develop Large Coal-Power Bases in China. Program on Energy and Sustainable Development. 2010.
Scott, D. Luppens, J. Assessment of Coal Geology, Resources, and Reserve Base in the Powder River Basin, Wyoming and Montana. U.S. Department of the Interior and U.S. Geologic Survey. Fact Sheet 2012-3143. February, 2013.
Stark, J. Cherry Point cargo terminal could help fund rail upgrades, planners say. The Bellingham Herald. August 11, 2011. http://www.bellinghamherald.com/2011/08/11/2137016/cherry-point-cargo-terminal-could.html
Stricker, G. Ellis, M. Coal Quality and Geochemistry, Powder River Basin, Wyoming and Montana. U.S. Geological Survey Professionals Papers 1625-A. 1999. http://pubs.usgs.gov/pp/p1625a/Chapters/PQ.pdf
Thompson, J. As Coal Use Declines in U.S., Coal Companies focus on China. Yale Environment 360. Yale School of Forestry and Environmental Studies. December 8, 2011. http://e360.yale.edu/feature/as_coal_use_declines_in_us_coal_companies_focus_on_china/2474/
Tu, J. Industrial Organization of the Chinese Coal Industry. Program on Energy and Sustainable Development. 2011.
Watkins, J. Trends in Global Coal Markets. Wood and Mackenzie. January, 2012. http://alaskaalliance.com/servlet/content/presentations.html
Wellstead, J. Chinese Coal Imports Surge. Coal Investing News. August 18, 2011. http://resourceinvestingnews.com/21056-chinese-coal-imports-surge.html
Williams-Derry, C. Cooooooal Train! Sightline Daily. December 10, 2010. http://daily.sightline.org/2010/12/10/cooooooal-train/
Williams, Jacob. “Coal Markets: Near-Term Headwinds but Strong Global Fundamentals,” Peabody Energy, 2012 Analyst and Investor Forum, June 27, 2012.
PRB Coal Exports and GHG Emissions April 2013 TM Power & DS Power Page 77
Wolak, F. and R. Morse. China’s Green Gift to the World. Guardian (UK). December 30, 2010. http://www.guardian.co.uk/commentisfree/cifamerica/2010/dec/30/coal-energy-industry
World Coal Association. http://www.worldcoal.org/coal/coal-mining/ and http://www.worldcoal.org/coal/market-amp-transportation/
Xinhua. China to Cap Energy Use at 4 Bln Tonnes of Coal Equivalent by 2015. March