THE IMPACT OF POPULATION AGING ON TURKEY’S ECONOMIC …
12
Journal of Business, Economics and Finance -JBEF (2020), Vol.9(4). p.292-303 Moradi, Uslu ________________________________________________________________________________________________________ DOI: 10.17261/Pressacademia.2020.1311 292 THE IMPACT OF POPULATION AGING ON TURKEY’S ECONOMIC GROWTH: AN EMPIRICAL ANALYSIS WITH ARDL MODEL DOI: 10.17261/Pressacademia.2020.1311 JBEF- V.9-ISS.4-2020(2)-p.292-303 Mohammad Moradi 1 , Nilgun Caglarirmak Uslu 2 1 Anadolu University, Social Science Institute, Department of Economics, Eskisehir, Turkey. [email protected], 0000-0001-5162-9616. 2 Anadolu University, Social Science Institute, Department of Economics, Eskisehir, Turkey. [email protected], 0000-0001-6254-5784. Date Received: September 26, 2020 Date Accepted: December 8, 2020 To cite this document Moradi, M., Uslu, N.C. (2020). The impacts of population aging on Turkey’s economic growth: an empirical analysis with ARDL model. Journal of Business, Economics and Finance (JBEF), V.9(4), p.292-303. Permemant link to this document: http://doi.org/10.17261/Pressacademia.2020.1311 Copyright: Published by PressAcademia and limited licenced re-use rights only. ABSTRACT Purpose - Labor and labor productivity concepts, which have an important role in growth dynamics, have found a serious research area especially in developing countries due to the population aging. Many researchers have focused on the effect of population aging on economic growth of some developed countries like China, Japan, Malaysia and those countries where the old people share are growing fast or have a large share in total population. This condition, which causes the emphasis on production factors, labor migration and factor productivity concepts, is the main motivation of this study. Methodology - In order to find the relationship between population aging and economic growth in Turkey, an ARDL model has been used for 1970-2018-time period. This time period was selected due to availability of data for selected variables. The long run and short run models are estimates by Eviews 10 software. Findings- The results illustrate that the population aging negatively affect Turkey’s economy in either short-run or long-run. Based on this model’s results, Turkey’s economy is negatively influenced by population aging 0.029 percent in long-run and 0.084 percent in short-run periods which the coefficients are significant at 0.5 and 0.1 levels respectively. Conclusion- The rates of fertility and death both have been decreasing while the rate of life expectancy has been increasing gradually during last three decades in Turkey showing a negative effect from population aging on economic growth of Turkey. These signs are associate with this study’s result. Keywords: Population aging, population growth, economic growth, ARDL model, Turkey. JEL Codes: J11, J13, J14, O11 1. INTRODUCTION Population aging is an important issue in the world especially for the developed countries and also in a soon future for the developing countries. Countries like Republic of China, Republic of Korea, Singapore, and especially Japan are dealing with this issue and applying socio economic programs to change the game and Turkey as a developing country is not out of this issue and has to consider earlier. Labor is one of the most important factors of production and many researchers are working on labor’s effect on economy and it has started mainly with the theory of population by Thomas Robert Malthus (1798) and today the researchers are trying to find labor’s effects on different aspects of economy. Many researchers have focused on the effect of population aging on economic growth of some developed countries like China, Japan, Malaysia and those countries where the old people share are growing fast or have a large share in total population. An economy is going toward aging as fertility rate decreases, like a decrease in death rate or an increase in life expectancy. Also, it means that the share of old people over 65 years old in total population is rising gradually. The negative sign of population aging gives an alarm to government in order to take consider changes in social and demographic programs.
Transcript of THE IMPACT OF POPULATION AGING ON TURKEY’S ECONOMIC …

Journal of Business, Economics and Finance -JBEF (2020), Vol.9(4). p.292-303 Moradi, Uslu
________________________________________________________________________________________________________ DOI: 10.17261/Pressacademia.2020.1311 292
THE IMPACT OF POPULATION AGING ON TURKEY’S ECONOMIC GROWTH: AN EMPIRICAL ANALYSIS WITH ARDL MODEL DOI: 10.17261/Pressacademia.2020.1311 JBEF- V.9-ISS.4-2020(2)-p.292-303 Mohammad Moradi1, Nilgun Caglarirmak Uslu2 1Anadolu University, Social Science Institute, Department of Economics, Eskisehir, Turkey. [email protected], 0000-0001-5162-9616. 2Anadolu University, Social Science Institute, Department of Economics, Eskisehir, Turkey. [email protected], 0000-0001-6254-5784.
Date Received: September 26, 2020 Date Accepted: December 8, 2020
To cite this document Moradi, M., Uslu, N.C. (2020). The impacts of population aging on Turkey’s economic growth: an empirical analysis with ARDL model. Journal of Business, Economics and Finance (JBEF), V.9(4), p.292-303. Permemant link to this document: http://doi.org/10.17261/Pressacademia.2020.1311 Copyright: Published by PressAcademia and limited licenced re-use rights only.
ABSTRACT Purpose - Labor and labor productivity concepts, which have an important role in growth dynamics, have found a serious research area especially in developing countries due to the population aging. Many researchers have focused on the effect of population aging on economic growth of some developed countries like China, Japan, Malaysia and those countries where the old people share are growing fast or have a large share in total population. This condition, which causes the emphasis on production factors, labor migration and factor productivity concepts, is the main motivation of this study. Methodology - In order to find the relationship between population aging and economic growth in Turkey, an ARDL model has been used for 1970-2018-time period. This time period was selected due to availability of data for selected variables. The long run and short run models are estimates by Eviews 10 software. Findings- The results illustrate that the population aging negatively affect Turkey’s economy in either short-run or long-run. Based on this model’s results, Turkey’s economy is negatively influenced by population aging 0.029 percent in long-run and 0.084 percent in short-run periods which the coefficients are significant at 0.5 and 0.1 levels respectively. Conclusion- The rates of fertility and death both have been decreasing while the rate of life expectancy has been increasing gradually during last three decades in Turkey showing a negative effect from population aging on economic growth of Turkey. These signs are associate with this study’s result. Keywords: Population aging, population growth, economic growth, ARDL model, Turkey. JEL Codes: J11, J13, J14, O11
1. INTRODUCTION
Population aging is an important issue in the world especially for the developed countries and also in a soon future for the developing countries. Countries like Republic of China, Republic of Korea, Singapore, and especially Japan are dealing with this issue and applying socio economic programs to change the game and Turkey as a developing country is not out of this issue and has to consider earlier.
Labor is one of the most important factors of production and many researchers are working on labor’s effect on economy and it has started mainly with the theory of population by Thomas Robert Malthus (1798) and today the researchers are trying to find labor’s effects on different aspects of economy. Many researchers have focused on the effect of population aging on economic growth of some developed countries like China, Japan, Malaysia and those countries where the old people share are growing fast or have a large share in total population. An economy is going toward aging as fertility rate decreases, like a decrease in death rate or an increase in life expectancy. Also, it means that the share of old people over 65 years old in total population is rising gradually. The negative sign of population aging gives an alarm to government in order to take consider changes in social and demographic programs.

Journal of Business, Economics and Finance -JBEF (2020), Vol.9(4). p.292-303 Moradi, Uslu
________________________________________________________________________________________________________ DOI: 10.17261/Pressacademia.2020.1311 293
Population aging influences labor society by two main forces; one is increasing life expectancy and the other one is decreasing fertility. These two determined factors of population aging have different impact on economic growth and productivity and also different policies to implement OECD (1998a). An increase in life expectancy by changing shares of young and old individuals in labor force affects economic growth and it could be helpful and positive for the economy as the labor force increases. on the other hand, declining fertility means not only a change in the share of young and elderly people but a change in total population over time which can negatively affect economic growth. Thus, the net impact of the population aging is outcome of the two forces which move at the same time. The strength of this process could be rapid as it is in China and Singapore or slowly like it is the United States.
Solow (1956) and Swan (1956) by describing the classic form of production function, which the main components are capital (K), labor (L) and productivity (A). The population aging issue affects not only on the amount of the labor supplied but also on the accumulated capital and the productivity. Skirbekk (2004) argued that population aging issue could be studied in a balanced manner if the both side of labor force; the quantity of labor input and the quality of labor input which is the productivity, being considered in the study.
Borsch-Supan (2003), by researching on the “labor market effects of population aging” determined that it is very rare that the demographically decline in labor force will be offset by improvement in capital concentration. In order to compensate the effect of demographic change in active population, labor productivity should be more focused by more or increasing the quality of trainings and education. On the other hand, population aging will bring a change in age structure and thus in goods demand which now the market needs a great employment mobility between different sectors in order to fix these structural changes.
In this paper under the section two a brief literature review and in three several important variables which had been used in more articles in order to show the signs of an aging economy, for the case of Turkey can be found. In Section four, data and method of analysis which used to show the relationship between population aging and economic growth of Turkey has introduced. In section five, the results discussed and in last section conclusion has placed.
2. LITERATURE REVIEW
Theory of economic growth indicates that stable economic growth is not achievable in an economy where the population is aging. A stable growth of the economy is possible only if the population's age structure remains unchanged. Economic growth in a country where the population is ageing, i.e. the age structure is not stable, may only be achieved through the economy's transformation to its stable state. Population aging reflects adversely on economic growth. This finding was previously shown in various simulations and models of overlapping generations but not with infinite horizon in the neoclassical growth theory (Gruescu, 2007).
Bloom and Canning (2008) argue that an individual role in economic activities differs during his or her lifetime. They indicate that youth are pure consumers and as they enter to the labor market they transform to a net saver, and after retirement they will be something between a saver and a consumer. These transformation patterns show how age structure effects the economic growth in an aging economy. Beside the effect of age structure on labor force, in another research conducted by Bloom and Williamson (1998) indicated that age transformation by affecting individuals saving and investment can have impacts on economic growth. Enriching human capital is another channel in a society which can be affected by demographic transformation Bloom et al. (2001).
Savings and capital accumulation are another channel that demographic changes can affect economic growth beside the labor market mechanism. Lee, Masson and Miller (1998), claim that the two important factors; the increase life expectancy and decrease in household members, will change the individuals’ decision to save more for their extended years of retirement. This well led to a positive impact on economic growth with the support of effective policies regardless of investing in local activities or abroad. A research conducted by Masson and Lee (2006) indicated a strong relationship between Taiwanese savings with age structure.
There are many researches that have been conducted to show the effect of population aging on the economic growth with ambiguous results; which some of them indicate a negative relation while the others show a positive relationship among them. In developing and developed countries there are evidence that the demographic change plays an important role in economic growth. For instance, in a study under the title of “Demographic Transitions and Economic Miracles in Emerging Asia” conducted by Bloom and Williamson (1998) during 1965 to 1990, indicated that east Asia country’s working population are rapidly changing and found that approximately 20% of the economic growth is associated with demographic changes. Especially developing countries where the share of young population is more than the old population have better chance to gain advantage over demographic structure. Bloom et al. (2001), showed that age structure in Asia’s miracle countries has one third impact on economic growth while Cai and Wang (2006), indicates a 15-20% role of age structure on economic growth of China in recent years. However, the age structure only prepares an opportunity for countries to grow more rapidly; but it is not enough by itself.

Journal of Business, Economics and Finance -JBEF (2020), Vol.9(4). p.292-303 Moradi, Uslu
________________________________________________________________________________________________________ DOI: 10.17261/Pressacademia.2020.1311 294
There are many other matters which affects the economic growth of a country, the important point is where a nation can take advantage from demographic dividend by implying appropriate policies in both physical and human capital investments associate with job creation. Asia’s miracles can be a good example for it.
A decade later in 2010 Wei and Hao studied demographic structure and economic growth of China and extended the equation by including age structure dynamics during 1989-2004. They argue that the decrease in fertility rate led to a decrease in youth dependency, which improved China’s economic growth. The other important finding of their study is a significant relationship between demographical behavior and economic growth in the concept of life expectancy, birth rate and marriage age.
Likewise, Minh (2009) studied the “Dynamic Demographic and Economic Growth in Vietnam” and found that there is 15% contribution of demographic change on economic growth of the country based on 2002, 2004, and 2006 for 61 provinces with an OLS method. In Vietnam case a considerable increase in labor force and decrease in dependency rate has been seen. He argues that Vietnam may have suffer regarding the youth population in economic growth as he found that population have not negative impact on economic growth but youth population seem may have negative effects on economic growth in near future. It means that Vietnam’s demographic dividend are changing to demographic debt and it is very important for the government to take in consideration and preparation of such this result in soon future.
Similarly, Choudhry and Elhorst (2010), conducted a research about demographic transition in China over 1961-2003 based on 70 countries data and revealed that active population and total population positively related to the GDP per capita growth while child and old dependency rates are negatively related. They found that population dynamics define economic growth 25% for Pakistan, 39% for India and 46% for China during 1961-2003 period. Also, in long run they expect a negative relationship between economic growth and population dynamics for China but positive for India and Pakistan.
Wana Ismail et al. (2015), studied the population aging effect on Malaysia’s economic growth during 1970 to 2013. They have used the life expectancy, fertility rate, and old dependency ratio on behalf of population aging and found that fertility rate has a long run cointegration and a reduction in fertility rate is associated with higher economic growth. At the end they have suggested that the economic growth can be stable with more human capital investment.
The effect of population aging in non-oil economic growth of Iran has been researched by Basakha et al. (2015). According to united nation 2010 report Iran is the third country with a rapidly aging population. The researchers estimated the short run and long run cointegration and found that physical and human capitals and trade openness are significantly and positively affect per capita income on non-oil economy on Iran. They found that the aging is not a problem for Iran but in soon future the negative effect will be appeared and suggest that the government with working and retirees reform policies can stabilize population growth at an optimal rate.
Lee et al. (2013), used a panel regression for 80 countries from 1960 to 2005 and tried to find the effects of population aging on economic growth. They indicate that elderly population does not prevent economic growth in both short run and long run. They have found that higher retirement savings, immigration from developing countries and labor force participation are associated with population aging.
Zhang and Zhang (2005), studied “the effects of life expectancy on fertility, saving, schooling and economic growth”. They have used cross section analyses for 76 countries and found that increase in longevity leads to a reduction in fertility but increase the saving amount, higher schooling and growth. As the estimate shows a 10% increase in life expectancy at birth increases schooling ration by 5.6% and investment rate by 2.4%, decreases fertility rate by 0.55% and rises growth rate approximately 1%. They concluded for the developed countries with higher life expectancy, may have no serious impact on economic growth and for developing countries with low life expectancy it may be a great opportunity to gain benefit for their economic growth.
3. POPULATION AGING IN TURKEY
Towards the end of the twentieth century, birth rates decreased and life expectancy increased in the world, especially in developed countries. With this change, the proportion of the young population in the total population decreased and the proportion of the elderly population increased. After the declaration of the Republic of Turkey, in economic, social and health sectors positive developments have been observed with a significant reduction in birth rate per woman and child deaths under the age of five years old. Thus, Turkey has entered into a demographic transformation process (TUIK, 2012b: 1).
Since the first official survey conducted in 1927 with the declaration of the Turkey Republic, Turkey’s population has increased more than five times. With the help of Figure 1, as can be evaluated, although there is a continuous increase in the total population, the population growth rate has been slowing over the years. In 1960 the total population in Turkey has reached the highest population growth rate with 27.754 (million), while; Estimated population growth rate in 2020 is 0.7 per thousand; the estimated population is determined as 83.900 (million). This shows that there will be a decrease in the population growth rate,

Journal of Business, Economics and Finance -JBEF (2020), Vol.9(4). p.292-303 Moradi, Uslu
________________________________________________________________________________________________________ DOI: 10.17261/Pressacademia.2020.1311 295
but the population is in an increasing trend. Turkey's population growth rate in steady declining and total population tends to increase continuously since the 1960s. According to TUIK's report on population projections and forecasts, population will be approximately 95 million in 2050 but Turkey’s population growth rate will be expected to reach at zero level rate (TUIK, 2012a). It is possible to see the effect of the growth in the population and, conversely, the decrease in the population growth rate on the elderly population in figure 1.
Figure 1: Total Population and Population Growth of Turkey from 1935 to 2050
Source: TÜİK, Turkish Statistical Institute
In Turkey, especially the population aged 65 and above age group are constantly increasing after 1980. Population estimates show that this increase is steeper after 2015, with the slowdown in population growth rate (Figure 2). This increase can be explained by the global with focus on Turkey’s development and improvement in the economic and demographic structure.
Turkey, integrated to the world with a development strategy based on import substitution, and export oriented economic structure with the aim to release the difference between turkey and developed countries. In this context, along with the transformation process, the average growth rate of the economy has been constantly increasing. The average GNP growth rate in the period 1971-1980 was 4%; this rate was realized as 5.3% in the period 1981-1990. The average growth rate of GNP was 4.8% between 1991-1997, and in 2005 the average growth rate was 5%. While the national income per capita in 1980 was 1200 dollars; It was realized as 4982 dollars in 2005. The developments in Turkish economic structure, increase in national income per capita, developments in nutrition and health services have resulted longevity and infant mortality which has been taken under control effectively. Turkey’s old population in associate with the world old population group has been increased steady especially after the second half of the 20th century. It is a fact that the 20th century world population turning point in terms of the change in the age structure has a great impact on these increases. Increases in the elderly population at global level and decreases in birth rates, undoubtedly increased in economic welfare, improved nutrition and primary health care services, and the average life expectancy and decrease in infant and child mortality (DPT, 2007: 4-5).
104 749 423
0,0
5,0
10,0
15,0
20,0
25,0
30,0
20 000 000
40 000 000
60 000 000
80 000 000
100 000 000
120 000 000
1935194019451950195519601965197019751980198519902000200520102015202020252050
Population Pop. Growth Rate (1000)
Journal of Business, Economics and Finance -JBEF (2020), Vol.9(4). p.292-303 Moradi, Uslu
________________________________________________________________________________________________________ DOI: 10.17261/Pressacademia.2020.1311 296
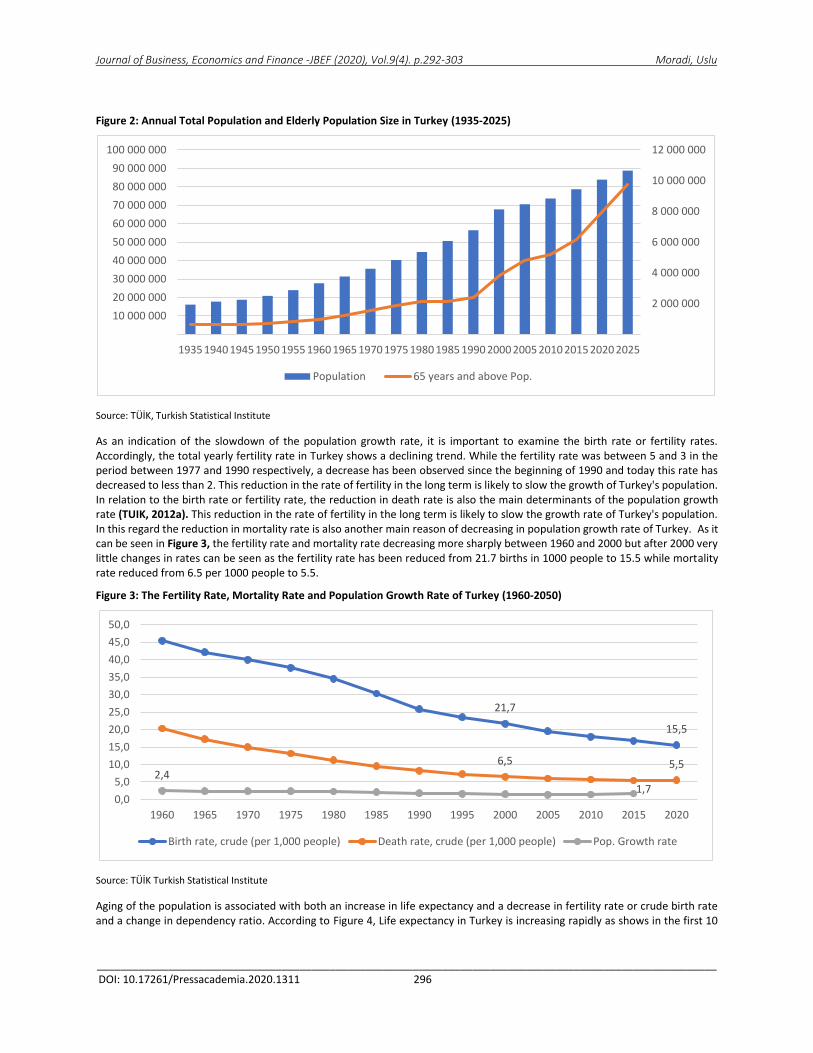
Figure 2: Annual Total Population and Elderly Population Size in Turkey (1935-2025)
Source: TÜİK, Turkish Statistical Institute
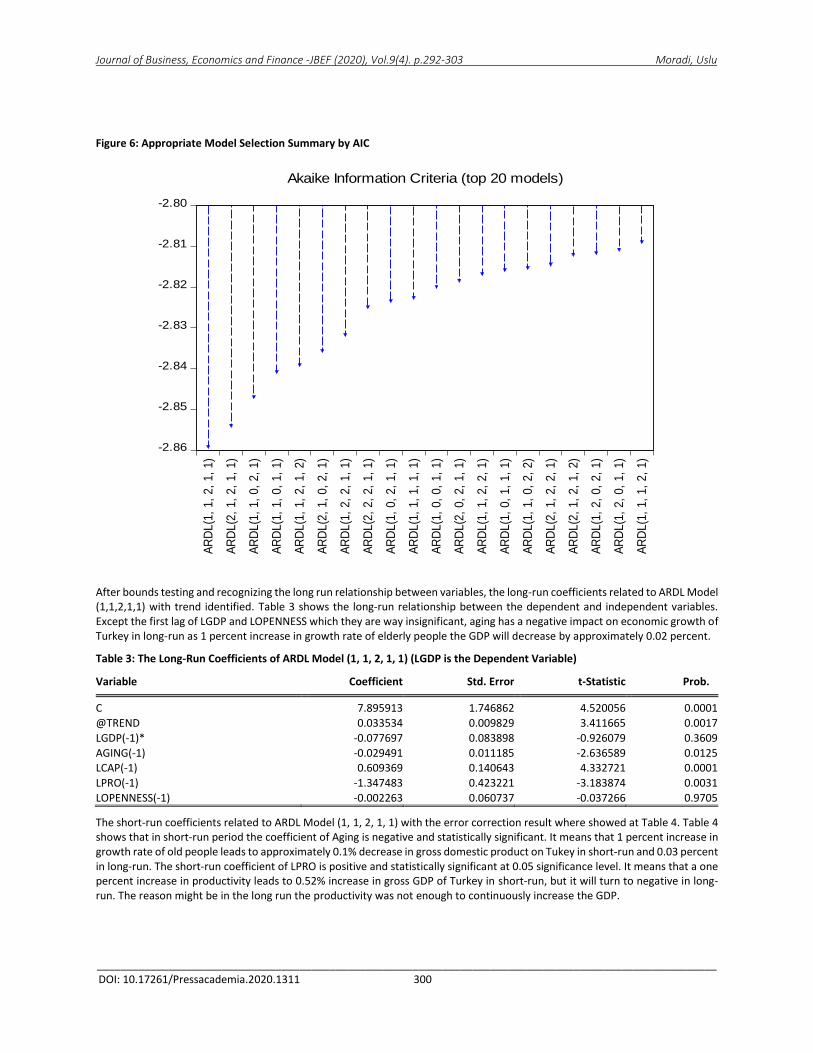
As an indication of the slowdown of the population growth rate, it is important to examine the birth rate or fertility rates. Accordingly, the total yearly fertility rate in Turkey shows a declining trend. While the fertility rate was between 5 and 3 in the period between 1977 and 1990 respectively, a decrease has been observed since the beginning of 1990 and today this rate has decreased to less than 2. This reduction in the rate of fertility in the long term is likely to slow the growth of Turkey's population. In relation to the birth rate or fertility rate, the reduction in death rate is also the main determinants of the population growth rate (TUIK, 2012a). This reduction in the rate of fertility in the long term is likely to slow the growth rate of Turkey's population. In this regard the reduction in mortality rate is also another main reason of decreasing in population growth rate of Turkey. As it can be seen in Figure 3, the fertility rate and mortality rate decreasing more sharply between 1960 and 2000 but after 2000 very little changes in rates can be seen as the fertility rate has been reduced from 21.7 births in 1000 people to 15.5 while mortality rate reduced from 6.5 per 1000 people to 5.5.
Figure 3: The Fertility Rate, Mortality Rate and Population Growth Rate of Turkey (1960-2050)
Source: TÜİK Turkish Statistical Institute
Aging of the population is associated with both an increase in life expectancy and a decrease in fertility rate or crude birth rate and a change in dependency ratio. According to Figure 4, Life expectancy in Turkey is increasing rapidly as shows in the first 10
2 000 000
4 000 000
6 000 000
8 000 000
10 000 000
12 000 000
10 000 000
20 000 000
30 000 000
40 000 000
50 000 000
60 000 000
70 000 000
80 000 000
90 000 000
100 000 000
1935 1940 1945 1950 1955 1960 1965 1970 1975 1980 1985 1990 2000 2005 2010 2015 2020 2025
Population 65 years and above Pop.
21,7
15,5
6,5 5,52,4
1,70,0
5,0
10,0
15,0
20,0
25,0
30,0
35,0
40,0
45,0
50,0
1960 1965 1970 1975 1980 1985 1990 1995 2000 2005 2010 2015 2020
Birth rate, crude (per 1,000 people) Death rate, crude (per 1,000 people) Pop. Growth rate

Journal of Business, Economics and Finance -JBEF (2020), Vol.9(4). p.292-303 Moradi, Uslu
________________________________________________________________________________________________________ DOI: 10.17261/Pressacademia.2020.1311 297
years period in Turkey (1960-1970), while the average life expectancy is 48-49 age; especially in the last decade (2010-2020), this age range has increased to 76-77 years. According to a projection for Turkey’s population prepared by TurkStat, in 2050 the life expectancy would rise to 79 and Turkey will be placed in 99th place among 186 countries (Tuik, 2012 A).
Figure 4: Life Expectancy at Birth, Total (Years) in Turkey
Source: World Bank DATA
The decrease in fertility rate and also increase in life expectancy leads to increase in elderly 65 ages and above group size in total population specially after 2015. Figure 4 shows that it is continuously increasing.
Employment rate of the population in the age group 65 years and above in Turkey makes it necessary to pay attention to the subject. Figure 5 shows that during 1988-2018, approximately 16% (16.37%) of the population aged 65 and above is employed. The reason for this is that the majority of individuals want to take part in the labor market at a young age. As a result of the country's social security system, individuals are entitled to retirement in their 60s, causing them to move away from the labor market (SSGSSK, m.28). The increase in life expectancy and a reduction in the population growth rate, the population that can be employed in Turkey over the next two decades shows that very few in. Therefore, policy makers are required to take into account the population aging issue and take the necessary actions.
Figure 5: Labor Force Participation in Turkey (+65) Age Group
Source: TÜİK, Turkish Statistical Institute
45,369
77,437
0
10
20
30
40
50
60
70
80
90
19
60
19
62
19
64
19
66
19
68
19
70
19
72
19
74
19
76
19
78
19
80
19
82
19
84
19
86
19
88
19
90
19
92
19
94
19
96
19
98
20
00
20
02
20
04
20
06
20
08
20
10
20
12
20
14
20
16
20
18
21,8
16,0
23,6
11,5 11,4 12,5
0,0
5,0
10,0
15,0
20,0
25,0
1988 1990 1992 1994 1996 1998 2000 2002 2004 2006 2008 2010 2012 2014 2016 2018

Journal of Business, Economics and Finance -JBEF (2020), Vol.9(4). p.292-303 Moradi, Uslu
________________________________________________________________________________________________________ DOI: 10.17261/Pressacademia.2020.1311 298
4. DATA AND METHODOLOGY
In order to analyze the effect of population aging on Turkey’ economy the following function has been considered. For this analysation the data were downloaded from World Band Data and OECD Statistics.
LGDPt = α0 + α1Agingt + α2 LPROt + α3 LCAPt + α4 LOpennesst + vt (1)
L: stands for the natural logarithmic form of the variables GDP: is the gross domestic product of Turkey Aging: is the growth rate of elderly population over total population PRO: Stands for total productivity and calculated as GDP per hour worked CAP: Stands for gross fixed capital formation (current US dollar) Openness: stands for the degree of openness measured as trade percent of GDP Vt= stands for white noise error term
The coefficient of Aging, α1, will be negative as an increase in aging associates with a decrease in economic growth. The increase in the 65 and above people is also associated with longevity or increase in life expectancy, old dependency rate and a fall in fertility rate Cervellati and Sunde (2009), Kelley and Schimidt (2005), and Barro (2008).
Productivity is one of the main components of production which measures the efficiency of labor and capital combinations in each country. Productivity may have played an important role in short-run but the more important is the long-run effect on economic growth and almost is everything Krugman (1994). In our model the α2 shows the effect of productivity on economic growth of Turkey.
Since changes in Gross fixed capital formation have high explanatory power on economic fluctuations, is another variable which included in the model with CAP name. The sign of α3 would be positive if the capital formation has increased the GDP per capita of Turkey.
Lastly, the degree of Turkey’s economic openness is included in the model by Openness variable as it measures the trade share in GDP. Increasing the share of trade in the whole economy is always used in growth models, by increasing competitiveness among domestic enterprises, is a factor in strengthening the foundations of the national economy.
In this study the ARDL bound testing approach used in order to find the relationship between population aging and economic growth of Turkey in 1970-2018 period. The ARDL bound testing approach introduced by Pesaran and Shin (1999). The ARDL approach has more advantage in long run effects evaluation between variables than Engle-Granger (1987) and Johansen (1988, 1991) cointegration tests. in order to evaluate the long run relationship between variables with the help of Engle-Granger or Johansen, the series need to be all stationary at I(1), but under the ARDL model the series are not necessary to be stationary all at I(1) and series with I(0) and I(1) mixes can be used. It is also necessary for any series in ARDL model to not to be stationary at I(2) or above. In contrast to VAR models, the variables can have different lags in ARDL model. Another advantage of ARDL models is the possibility of estimating the short run and long run effects at the same time and can create an ECM (Error Correction Model) via a simple linear transformation Esen and Ozata (2017).
In order to use the bounds testing approach introduced by Pesaran et al. (2001), the reformulation of equation 1 is necessary as follows:
For simplicity the productivity, capital and openness variables are taken as control variables (CV).
𝚫𝐋𝐆𝐃𝐏𝐭 = 𝛃𝟎 + 𝛈𝟏 ∑ 𝚫𝐥𝐧𝐋𝐆𝐃𝐏𝐭 − 𝐢 + 𝛗𝟐 ∑ 𝚫𝐋𝐀𝐠𝐢𝐧𝐠𝐭 − 𝐢 + 𝛏𝟑 ∑ 𝚫𝐋𝐂𝐕 − 𝐢 + 𝛌𝟏 𝐥𝐧𝐆𝐃𝐏𝐭 − 𝟏 +𝒑𝒊=𝟎
𝒑
𝒊=𝟎
𝒑
𝒊=𝟎
𝛌𝟐 𝐥𝐧𝐀𝐠𝐢𝐧𝐠𝐭 − 𝟏 + 𝛌𝟑 𝐥𝐧𝐂𝐕𝐭 − 𝟏 + 𝛍𝐭 (2)
Where Δ shows the first difference, P shows the lag length, and white noise error term is μt. Long run relationship or cointegration are shown as λ1, λ2, and λ3. Also, the short run relationship is shown as the coefficients of the summation symbol and for simplicity in equation 2 the productivity, capital and openness variables are taken as control variable (CV).
5. FINDINGS AND DISCUSSIONS
For estimating the coefficients in equation 2, time series data from Turkey between 1970-2018 period used as logarithmic form. It is necessary to use an appropriate test for investigating the time series stationarity. Thus, Augmented Dicky Fuller – ADF test used to investigate the stationarity.

Journal of Business, Economics and Finance -JBEF (2020), Vol.9(4). p.292-303 Moradi, Uslu
________________________________________________________________________________________________________ DOI: 10.17261/Pressacademia.2020.1311 299
Table 1: Augmented Dickey Fuller Unit Root Test Results at Level & 1st Difference (with intercept and trend: significant level 95%)
Variable Level First Difference
Level T-Statistics Critical Value T-Statistics Critical Value
LGDP -3.581491 -3.513075* I(0)
Aging -3.051079 -3.508508 -3.883776 -3.508508* I(1)
LPRO -3.641711 -3.506374* I(0)
LCAP -2.853401 -3.506374 -6.421615 -4.165756** I(1)
LOPENNESS -2.181078 -3.506374 -5.556026 -4.165756** I(1)
Note: * and ** shows the significant level at 5% and 1% respectively.
Table 1 shows the augmented dickey fuller unit root test results. As it can be seen, the natural logarithmic form of productivity and GDP are stationary at level and all the other series are stationary at first difference. With other words none of the tested variables are at I(2) as it is precondition of an ARDL model.
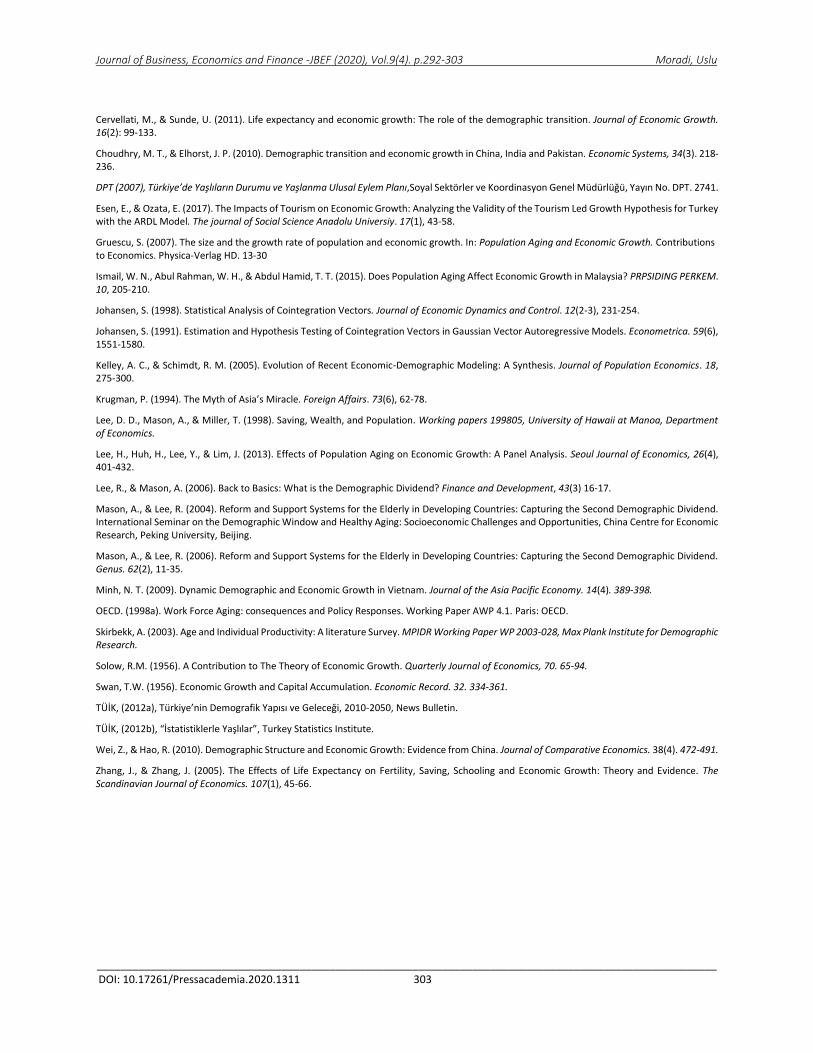
The appropriate ARDL model (1,1,2,1,1) by using Akaike Information Criteria (AIC) has been detected. It means that, one lag of LGDP, 1 lag of AGING, 2lags of LPRO, 1 lag of LCAP, and 1 lag of LOPENNESS inserted into the model. The appropriate model selection summary by Akaike Information Criteria has been shown in graph 6.
After detecting the suitable lag length for dependent and independent variables in order to find the long run relationship or cointegration the bounds testing applied. Table 2, shows the bounds test results with critic values calculated by Pesaran. As the F-statistics is 4.68 is greater than 3.97 which is significant at 0.05 significant level, the null hypothesis of bounds test which indicates that there is not any long run relationship can be rejected and alternative hypothesis accepted.
Table 2: Cointegration F-Statistics Test Statistic Value Signif. I(0) I(1) Asymptotic: n=1000
F-statistic 4.685733 10% 2.68 3.53 K 4 5% 3.05 3.97
2.5% 3.4 4.36
1% 3.81 4.92
Journal of Business, Economics and Finance -JBEF (2020), Vol.9(4). p.292-303 Moradi, Uslu
________________________________________________________________________________________________________ DOI: 10.17261/Pressacademia.2020.1311 300
Figure 6: Appropriate Model Selection Summary by AIC
After bounds testing and recognizing the long run relationship between variables, the long-run coefficients related to ARDL Model (1,1,2,1,1) with trend identified. Table 3 shows the long-run relationship between the dependent and independent variables. Except the first lag of LGDP and LOPENNESS which they are way insignificant, aging has a negative impact on economic growth of Turkey in long-run as 1 percent increase in growth rate of elderly people the GDP will decrease by approximately 0.02 percent.
Table 3: The Long-Run Coefficients of ARDL Model (1, 1, 2, 1, 1) (LGDP is the Dependent Variable)
Variable Coefficient Std. Error t-Statistic Prob. C 7.895913 1.746862 4.520056 0.0001
@TREND 0.033534 0.009829 3.411665 0.0017
LGDP(-1)* -0.077697 0.083898 -0.926079 0.3609
AGING(-1) -0.029491 0.011185 -2.636589 0.0125 LCAP(-1) 0.609369 0.140643 4.332721 0.0001
LPRO(-1) -1.347483 0.423221 -3.183874 0.0031
LOPENNESS(-1) -0.002263 0.060737 -0.037266 0.9705
The short-run coefficients related to ARDL Model (1, 1, 2, 1, 1) with the error correction result where showed at Table 4. Table 4 shows that in short-run period the coefficient of Aging is negative and statistically significant. It means that 1 percent increase in growth rate of old people leads to approximately 0.1% decrease in gross domestic product on Tukey in short-run and 0.03 percent in long-run. The short-run coefficient of LPRO is positive and statistically significant at 0.05 significance level. It means that a one percent increase in productivity leads to 0.52% increase in gross GDP of Turkey in short-run, but it will turn to negative in long-run. The reason might be in the long run the productivity was not enough to continuously increase the GDP.
-2.86
-2.85
-2.84
-2.83
-2.82
-2.81
-2.80A
RD
L(1
, 1
, 2
, 1
, 1
)
AR
DL
(2,
1,
2,
1,
1)
AR
DL
(1,
1,
0,
2,
1)
AR
DL
(1,
1,
0,
1,
1)
AR
DL
(1,
1,
2,
1,
2)
AR
DL
(2,
1,
0,
2,
1)
AR
DL
(1,
2,
2,
1,
1)
AR
DL
(2,
2,
2,
1,
1)
AR
DL
(1,
0,
2,
1,
1)
AR
DL
(1,
1,
1,
1,
1)
AR
DL
(1,
0,
0,
1,
1)
AR
DL
(2,
0,
2,
1,
1)
AR
DL
(1,
1,
2,
2,
1)
AR
DL
(1,
0,
1,
1,
1)
AR
DL
(1,
1,
0,
2,
2)
AR
DL
(2,
1,
2,
2,
1)
AR
DL
(2,
1,
2,
1,
2)
AR
DL
(1,
2,
0,
2,
1)
AR
DL
(1,
2,
0,
1,
1)
AR
DL
(1,
1,
1,
2,
1)
Akaike Information Criteria (top 20 models)

Journal of Business, Economics and Finance -JBEF (2020), Vol.9(4). p.292-303 Moradi, Uslu
________________________________________________________________________________________________________ DOI: 10.17261/Pressacademia.2020.1311 301
Table 4: The Short-Run Coefficients of ARDL Model (1,1,2,1,1) - (LGDP is the Dependent Variable)
Variable Coefficient Std. Error t-Statistic Prob. C 7.929447 1.388815 5.709506 0.0000 D(AGING) -0.084578 0.022849 -3.701547 0.0008
D(LCAP) 0.486156 0.114688 4.238949 0.0002
D(LCAP(-1)) -0.151892 0.071433 -2.126371 0.0408
D(LPRO) 0.520033 0.253088 2.054756 0.0477 D(LOPENNESS) -0.733266 0.043241 -16.95763 0.0000
DUM2001 -0.090415 0.036731 -2.461558 0.0191
CointEq(-1) -0.077697 0.013682 -5.678809 0.0000
F-Statistics= 67.21215(0.0000) R2= 0.923452,Adjusted R2=0.909713
Serial Correlation LM Test: 0.8956 (0.8510) JB Normality TEST: 0.874682 (0.645751)
Ramsey RESET TEST: 0.2855 (0.2855)
Heteroscedasticity Test: 0.8279 (0.8176)
The dummy variable of Dum2001 stands for the economic crisis in 2001 with negative coefficient and statistically significant at 0.05 significance level. Finally, the CointEq(-1) as it must be negative and less than 1 is negatively signed, less than 1 and strongly significant.
As Table 4, the Breusch Godfrey LM test shows that there is no autocorrelation in the model and the null hypothesis can be accepted. The Jarque Bera Normality Test result shows that the null hypothesis can be accepted and residuals are normally distributed. Also, ARCH Heteroscedasticity Test shows that the error terms are normally distributed. At the end, Ramsey RESET TEST, shows that the model is generally well designed and it is not mis specified.
Finally, to test whether the coefficients in the model are stable, the CUSUM Test and CUSUM of Squares were done. Figures 7 and 8 show the result of CUSUM and CUSUM of Squares Tests. Thus, the CUSUM and CUSUM of Squares lines are between the 0.05 significance level, the coefficients in the model are stable.
Figure 7: CUSUM TEST
-15
-10
-5
0
5
10
15
2002 2004 2006 2008 2010 2012 2014 2016 2018
CUSUM 5% Significance

Journal of Business, Economics and Finance -JBEF (2020), Vol.9(4). p.292-303 Moradi, Uslu
________________________________________________________________________________________________________ DOI: 10.17261/Pressacademia.2020.1311 302
Figure 8: CUSUM of Squares Test
-0.4
0.0
0.4
0.8
1.2
1.6
2002 2004 2006 2008 2010 2012 2014 2016 2018
CUSUM of Squares 5% Significance
6. CONCLUSION
The population aging is going to be an important subject in the soon future. An economy is going toward aging as the rate of fertility decreases, like a decrease in death rate or increase in life expectancy. Also, it means that the share of old people over 65 years old in total population is rising gradually. Turkey’s population growth rate was about 28.5 per 1000, in higher rate in 1960 and after that gradually decreased to 10.9 per 1000, in 2020 and as predicted will be 0 in 2050. On the other hand, life expectancy is gradually increasing from 45 years old in 1960 to 74 years old in 2018. The same as an increase in life expectancy, old population share is raising more rapidly specially after 1990 from approximately 2.5 million persons to near 8 million persons in 2018. These numbers are just signs of aging in Turkey, this study was conducted to find the relationship between population aging and economic growth of Turkey. For this reason, time series data set has been used for an ARDL model to find either short and long run relationship between 1970-2018 period. The evidences show, that the aging negatively affect Turkey’s economy but this condition should not be a major concern for Turkish government, as population ages through reducing fertility rate it not only means a greater opportunity for women to participate in the labor market but also increases labor productivity and economic growth. Policies like change in retirement age, reform of work and retirement benefits, planning to invest more on capital intensive production in coming decades, planning for the health and medical expenses of the elderly and policies related to balancing population growth should be considered as most important preventive policies in this field.
REFERENCES
Barro, R. J. (2008). Inequality and Growth Revisited. ADB Working Paper Series on Regional Economic Integration, Asian Development Bank (ADB), Manial. 11.
Basakha, M., Yavari, K., Sadeghi, H., & Naseri, A. (2015). Population Aging and Iran’s Non-Oil Economic Growth. Journal of Payavard Salamat. 9(2), 131-146.
Bloom, D. E., Canning, D., & Fink, G. (2008). Population Aging and Economic Growth. PGDA Working Paper Series. (31).
Bloom, D. E., & Williamson G. J. (1998). Demographic Transitions and Economic Miracles in Emerging Asia. The World Bank Economic Review. (12), 419-455.
Bloom, E. D., Canning, D., & Sevilla, J. (2001), “Economic Growth and the Demographic Transition”, NBER Working Paper Series, December, No.
(8685), 1-87.
Borsch-Supan, A. (2003). Labor Market Effects of Population Aging. Fondazione Giacomo Brodolini and Blackwell Publishing Ltd. 5-44.
Cai, F., & Wang M. (2006). Challenge Facing China’s Economic Growth in Its Aging but not Affluent Era. China & World Economy. 14(5). 20-31
Journal of Business, Economics and Finance -JBEF (2020), Vol.9(4). p.292-303 Moradi, Uslu
________________________________________________________________________________________________________ DOI: 10.17261/Pressacademia.2020.1311 303
Cervellati, M., & Sunde, U. (2011). Life expectancy and economic growth: The role of the demographic transition. Journal of Economic Growth. 16(2): 99-133.
Choudhry, M. T., & Elhorst, J. P. (2010). Demographic transition and economic growth in China, India and Pakistan. Economic Systems, 34(3). 218-236.
DPT (2007), Türkiye’de Yaşlıların Durumu ve Yaşlanma Ulusal Eylem Planı,Soyal Sektörler ve Koordinasyon Genel Müdürlüğü, Yayın No. DPT. 2741.
Esen, E., & Ozata, E. (2017). The Impacts of Tourism on Economic Growth: Analyzing the Validity of the Tourism Led Growth Hypothesis for Turkey with the ARDL Model. The journal of Social Science Anadolu Universiy. 17(1), 43-58.
Gruescu, S. (2007). The size and the growth rate of population and economic growth. In: Population Aging and Economic Growth. Contributions to Economics. Physica-Verlag HD. 13-30
Ismail, W. N., Abul Rahman, W. H., & Abdul Hamid, T. T. (2015). Does Population Aging Affect Economic Growth in Malaysia? PRPSIDING PERKEM. 10, 205-210.
Johansen, S. (1998). Statistical Analysis of Cointegration Vectors. Journal of Economic Dynamics and Control. 12(2-3), 231-254.
Johansen, S. (1991). Estimation and Hypothesis Testing of Cointegration Vectors in Gaussian Vector Autoregressive Models. Econometrica. 59(6), 1551-1580.
Kelley, A. C., & Schimdt, R. M. (2005). Evolution of Recent Economic-Demographic Modeling: A Synthesis. Journal of Population Economics. 18, 275-300.
Krugman, P. (1994). The Myth of Asia’s Miracle. Foreign Affairs. 73(6), 62-78.
Lee, D. D., Mason, A., & Miller, T. (1998). Saving, Wealth, and Population. Working papers 199805, University of Hawaii at Manoa, Department of Economics.
Lee, H., Huh, H., Lee, Y., & Lim, J. (2013). Effects of Population Aging on Economic Growth: A Panel Analysis. Seoul Journal of Economics, 26(4), 401-432.
Lee, R., & Mason, A. (2006). Back to Basics: What is the Demographic Dividend? Finance and Development, 43(3) 16-17.
Mason, A., & Lee, R. (2004). Reform and Support Systems for the Elderly in Developing Countries: Capturing the Second Demographic Dividend. International Seminar on the Demographic Window and Healthy Aging: Socioeconomic Challenges and Opportunities, China Centre for Economic Research, Peking University, Beijing.
Mason, A., & Lee, R. (2006). Reform and Support Systems for the Elderly in Developing Countries: Capturing the Second Demographic Dividend. Genus. 62(2), 11-35.
Minh, N. T. (2009). Dynamic Demographic and Economic Growth in Vietnam. Journal of the Asia Pacific Economy. 14(4). 389-398.
OECD. (1998a). Work Force Aging: consequences and Policy Responses. Working Paper AWP 4.1. Paris: OECD.
Skirbekk, A. (2003). Age and Individual Productivity: A literature Survey. MPIDR Working Paper WP 2003-028, Max Plank Institute for Demographic Research.
Solow, R.M. (1956). A Contribution to The Theory of Economic Growth. Quarterly Journal of Economics, 70. 65-94.
Swan, T.W. (1956). Economic Growth and Capital Accumulation. Economic Record. 32. 334-361.
TÜİK, (2012a), Türkiye’nin Demografik Yapısı ve Geleceği, 2010-2050, News Bulletin.
TÜİK, (2012b), “İstatistiklerle Yaşlılar”, Turkey Statistics Institute.
Wei, Z., & Hao, R. (2010). Demographic Structure and Economic Growth: Evidence from China. Journal of Comparative Economics. 38(4). 472-491.
Zhang, J., & Zhang, J. (2005). The Effects of Life Expectancy on Fertility, Saving, Schooling and Economic Growth: Theory and Evidence. The Scandinavian Journal of Economics. 107(1), 45-66.