The impact of o shoring on productivity and innovation ...
31
The impact of offshoring on productivity and innovation: Evidence from Swedish manufacturing firms * Christopher F Baum † HansL¨o¨ of ‡ Andreas Stephan § Ingrid Viklund-Ros ¶ April 19, 2021 Abstract This paper examines the impact of offshoring on total factor productivity (TFP) and innovation measured by patent applications. It applies instrumental variable and matching approaches on a panel of about 7,500 Swedish manufacturing firms over the period 2001–2014, and identifies offshoring-related intermediate imports by the United Nations Broad Economic Categories system. Accounting for selection and simultaneity bias, no causal impact on TFP can be established, while the estimated positive effect on innovation is found to be weakly significant. Keywords: offshoring, patents, total factor productivity, self-selection, reverse causality JEL classification: C33, F61, D24, L23, O31 * We thank two anonymous reviewers, participants at the ISGEP workshop 2020, Stefanie Haller for their constructive suggestions and helpful comments on an earlier version of this paper. We thank Joonas Tuhkuri for valuable help in calculating the Blinder and Osborn–Frey Indexes. We thank Vardan Hovsepyan for assistance with calculation of the BEC data. We thank Luis Perez for this preparation of earlier version of the manuscript † Boston College, DIW Berlin and CESIS ‡ Royal Institute of Technology. CESIS, Royal Institute of Technology, Lindstedsvagen 30, 100 44 Stockholm. Corresponding author § J¨ onk¨ oping University and DIW Berlin ¶ Royal Institute of Technology
Transcript of The impact of o shoring on productivity and innovation ...

The impact of offshoring on productivity and innovation:
Evidence from Swedish manufacturing firms∗
Christopher F Baum† Hans Loof‡ Andreas Stephan§ Ingrid Viklund-Ros¶
April 19, 2021
Abstract
This paper examines the impact of offshoring on total factor productivity (TFP) and
innovation measured by patent applications. It applies instrumental variable and
matching approaches on a panel of about 7,500 Swedish manufacturing firms over
the period 2001–2014, and identifies offshoring-related intermediate imports by the
United Nations Broad Economic Categories system. Accounting for selection and
simultaneity bias, no causal impact on TFP can be established, while the estimated
positive effect on innovation is found to be weakly significant.
Keywords: offshoring, patents, total factor productivity, self-selection, reverse causality
JEL classification: C33, F61, D24, L23, O31
∗We thank two anonymous reviewers, participants at the ISGEP workshop 2020, Stefanie Haller fortheir constructive suggestions and helpful comments on an earlier version of this paper. We thank JoonasTuhkuri for valuable help in calculating the Blinder and Osborn–Frey Indexes. We thank Vardan Hovsepyanfor assistance with calculation of the BEC data. We thank Luis Perez for this preparation of earlier versionof the manuscript
†Boston College, DIW Berlin and CESIS‡Royal Institute of Technology. CESIS, Royal Institute of Technology, Lindstedsvagen 30, 100 44
Stockholm. Corresponding author§Jonkoping University and DIW Berlin¶Royal Institute of Technology
1 Introduction
With the advent of offshoring in the 1990s, a new phase of the contracting-out phenomenon
was introduced. Explanations for this development can be sought among a handful of key
factors: technological advances, institutional developments favoring trade liberalization,
competitive pressures to reduce costs, and the potential for improved productivity (Olsen
2006). The single most important factor is the digitization of the economy, which has
opened the potential for conducting business activities in entirely new ways, and in an
extended spatial area in which a supply chain of local, regional and international firms
produces various inputs.
International trade theory is ambiguous about the importance of offshoring. While
some of the literature predicts that offshoring of business functions to locations outside of
the firm’s national borders stimulates innovation and productivity, other authors explore
why offshoring may have only a negligible impact on renewal and growth in the focal
firm, at least above some threshold level. While offshoring may improve firms’ innovation
capabilities by replacing labor-intensive and routine tasks with cognitive and non-routine
ones, offshoring production of intermediates may also reduce the feedback from production
to process research efforts.
Existing empirical research has not provided clear support for either one of these op-
posing theoretical predictions. Possible explanations for the lack of consensus in empirical
research relate to the difficulties in observing the extent both of offshoring and firm perfor-
mance, as well as methodological challenges to sort out causality, as innovative and highly
productive firms are likely to buy more imported inputs (Hummels, Jørgensen, Munch &
Xiang 2014).
The purpose of this paper is to address some shortcomings in previous studies on the
impact of offshoring on innovation and productivity. To do so we (i) study the universe of
manufacturing companies (with at least 10 employees) in an industrialized economy, (ii)
follow these companies with an unbalanced panel consisting of unique employer-employee
data for a 14-year period, (iii) observe detailed company and employee characteristics,
(iv) deal with both selection and simultaneity issues, (v) increase the precision of our
estimates by controlling for both routine tasks at the individual level (Frey–Osborne Index)
1

and offshorable activities (Blinder Index), and (vi) take advantage of the United Nations
Broad Economic Categories (BEC) to distinguish offshoring-related imports from other
imported goods. Using a panel of about 7,500 Swedish manufacturing firms over the
period 2001–2014, our random effects probit models and fixed effects instrumental variable
models suggest that offshoring may be positively associated with both patent applications
and total factor productivity. We then estimate an empirical model with offshoring firms
defined by a threshold where the input received through offshoring corresponds to at least
to 10% of the firms’ sales, and a control group consisting of otherwise similar companies.
The results suggest that the link between offshoring and technical change may be largely
explained by self-selection and reverse causality. Accounting for these factors, we find no
causal impact on TFP and a causal positive impact of offshoring on innovation measured
by patents, albeit at a low level of statistical significance.
The rest of the paper is structured as follows. Section 2 surveys the related literature.
Section 3 presents the data and the outcome variables. Section 4 details the empirical
strategy, Section 5 reports the results, and Section 6 concludes.
2 Related literature
In the three last decades, a key feature of the global economy is the growth of offshoring
in production and service tasks that were previously produced domestically (Feenstra
& Hanson 2003, Hummels, Jørgensen, Munch & Xiang 2014). Intermediate inputs now
account for two-thirds of world trade (Acemoglu, Gancia & Zilibotti 2015).
The question how increased input from foreign sources affects firms’ innovation and
technological change has been studied primarily in the theoretical literature, and to a
lesser extent in different strands of the empirical literature. A major focus of this research
are the indirect effects through changes in the composition of the labor force: the ratio be-
tween skilled and unskilled workers and their relative wages. Offshoring generally involves
unbundling and relocating labor-intensive work tasks from the focal firm to foreign firms
with lower labor costs, while cognitive and non-routine activities that require specialized
skills and technologies remain in house (Baldwin 2016, Yamashita & Yamauchi 2019).
However, Blinder (2009) and Blinder & Krueger (2013) argue that low-skilled and high-
skilled jobs are equally likely to be affected by offshoring. Instead of low skill-intensity, the
2
main candidates for offshorability are jobs lacking requirements of physical contact and
geographic proximity (Blinder 2006), as well as jobs associated with codifiable instructions
(Leamer & Storper 2001) and automation (Frey & Osborne 2017).
Economic research on offshoring has theoretical roots in several different disciplines.
They include, among others, the proposition that firms can increase their productivity by
focusing on what they do best and outsource the rest (Coase 1937), the related comparison
of the global value-chain process with the Ricardian principle of comparative advantage
(Porter 1985), the concept of an international product cycle proposed by Vernon (1966),
the endogenous theories on trade, spillovers and growth by Grossman & Helpman (1991),
as well as the literature on shifting production from North (West) to South (East) aimed
at raising rate of innovation and productivity in the North (West) (Branstetter & Saggi
2011, Chung & Yeaple 2008, Naghavi & Ottaviano 2009). Also of note are discussions
of trade-induced technical change (Bloom, Draca & Van Reenen 2016), the skill-biased
technical change literature on offshoring (Acemoglu, Gancia & Zilibotti 2015), concepts
of offshoring driven by fractionalization of production that unbundles supply chains into
finer stages across countries (Grossman & Rossi-Hansberg 2008), and theories on the weak-
ened feedback from offshoring sources to R&D investing firms due to imperfect knowledge
spillovers (Naghavi & Ottaviano 2009).
Broadly, the theoretical literature on offshoring predicts two possible outcomes for
firms’ innovation and productivity when they relocate production overseas. On the one
hand, offshoring can improve firm performance through within-firm resource allocation
and efficiency gains. The second is that it can slow the rate of innovation and productiv-
ity by limiting the possibility of knowledge creation and transfers between R&D operations
and production due to physical separation. Empirical assessment of these conflicting hy-
potheses has not reached a consensus on the net effect of offshoring. Below, we summarize
some of the divergent results in recent literature.
Yamashita & Yamauchi (2019) study Japanese multinational firms for the period 1995–
2011 and find that increased offshore production has little effects on onshore innovation
performance as measured with patent statistics. Moreover, the authors report weak evi-
dence that increased offshore production degrades the quality of innovation, as measured
by patent citations. This finding is consistent with the theoretical predictions of the neg-
3

ative effect of the separation of production to offshore locations and domestic innovation
activities. Similar results are reported by Branstetter, Chen, Glennon, Yang & Zolas
(2017). They study the Taiwanese electronics industry where exogenous policy changes
led to a significant decrease in the offshoring costs for Taiwanese firms. This fact was
exploited to identify the causal relationship between offshoring and innovation, as mea-
sured by patenting. The authors find that firms’ propensity of innovation was reduced as
a causal effect of greater offshoring of production to China.
In contrast to the main finding in these studies, Bøler, Moxnes & Ulltveit-Moe (2015)
show that imported intermediate goods stimulate R&D among Norwegian firms. Other
studies reporting a positive causal impact of offshoring on firms’ innovation include Dachs,
Ebersberger, Kinkel & Som (2015) who study data for more than 3000 manufacturing
firms from seven European countries. They present evidence that offshoring firms employ
a higher share of R&D and design personnel, introduce new products more frequently
to the market, and invest more frequently in advanced process technologies compared to
non-offshoring firms. A positive net effect of offshoring is also reported by Fritsch & Gorg
(2015). They use firm-level data for over 20 emerging market economies to investigate the
link between outsourcing and innovation. Their study shows that outsourcing is associated
with a greater propensity invest in research and development, to introduce new products,
and to upgrade existing products.
Most closely related to the empirical observations in our study, Tingvall & Karpaty
(2011) use data on Swedish multinational firms and find that offshoring to other European
countries and North America has a negative effect on R&D intensity at home. However,
offshoring to emerging economies is found to have a negligible or even a positive effect on
R&D intensity. The latter finding is in line with the theoretical argument on offshoring
as a strategy to specialize in knowledge-intensive activities while more routine-based pro-
duction processes are offshored to exploit lower labor costs. However, the results are not
consistent with the assumptions that offshoring to technologically advanced countries may
provide access to higher quality inputs, allowing firms to absorb knowledge spillovers on
new technologies (Abramovsky & Griffith 2006).
The empirical literature also provides support for the hypothesis of inverted U-shape
impact of offshoring. Based on a panel dataset of R&D-active firms in Germany, Stein-
4

berg, Procher & Urbig (2017) distinguish between R&D offshoring to foreign affiliates
and external foreign parties and find that both offshoring strategies, when pursued inten-
sively, eventually harm firms’ innovation performance. Other studies that confirm the ex-
istence of an inverted U-shape pattern of offshoring on innovation include Hurtado-Torres,
Aragon-Correa & Ortiz-de Mandojana (2017). Their paper considers how geographical di-
versification of firms’ R&D offshoring affects innovation performance among multinational
enterprises (MNEs) in the energy industry.
In contrast to the still limited firm-level studies on internal innovation and produc-
tivity effects of offshore production, the literature has devoted substantial attention to
the overall impact of offshoring. This research considers consequences on the spatial,
industrial or national level in the offshoring economy. While the significance of interna-
tional fragmentation of production is unclear at company level, there is a more coherent
and positive picture at the aggregate level. For instance, Bloom, Draca & Van Reenen
(2016) examine the impact of Chinese import competition on several measures of techni-
cal change—patenting, IT, and TFP—using panel data across twelve European countries
from 1996–2007. They suggest that the absolute volume of innovation increases within the
firms most affected by Chinese imports in their output markets. Castellani & Pieri (2013)
show that productivity growth of 262 regions in Europe is associated with offshoring of
R&D activities by domestic multinational enterprises based these regions. They find a
large positive correlation between the extent of R&D offshoring and the home region’s
productivity growth.
In summary, the empirical literature suggests that no definite conclusions can be drawn
about positive or negative causal effects of offshoring on innovation and productivity. Many
studies propose that the disadvantages outweigh the advantages, and among studies with
positive results there are indications that offshoring is only an effective strategy up to a
certain threshold level.
One explanation for the heterogeneous results in existing studies of the relationship
between offshoring, innovation and technological development is that they capture actual
differences in outcomes between products, companies, industries, and destinations, as well
as the importance of the scope of the outsourced activities.
It may also be the case that the results across studies are not comparable due to dif-
5
ferences in the quality of data, measurement of offshoring, and measurement of innovation
and productivity. Another key issue is how the studies have been able to correct for en-
dogeneity. There is extensive evidence in the literature that more innovative firms are
those that aggressively engage in offshoring in production (Yamashita & Yamauchi 2019).
The decisions of engaging in offshore production and innovation are therefore endogenous
to individual firms. Researchers have addressed this challenge with various empirical ap-
proaches such as instrumental variables estimation. Recently, a small number of studies
have exploited the occurrence of exogenous shocks (Bloom, Draca & Van Reenen 2016,
Autor, Dorn, Hanson, Pisano, Shu et al. 2016, Branstetter, Chen, Glennon, Yang & Zolas
2017, Bøler, Moxnes & Ulltveit-Moe 2015). Propensity score matching is another approach
that has been used to analyse the causal effect of offshoring on innovation. For instance,
Dachs, Ebersberger, Kinkel & Som (2015) use a propensity score matching estimator to
identify a control group of non-offshoring firms with characteristics similar to those of
offshoring firms.
3 Data
The data in our study come from several sources. The combined employer-employee
dataset is obtained from Statistics Sweden, and covers the population of Swedish man-
ufacturing firms (2-digit NACE Rev.2 codes 10–37) and their employees for 2001–2014.
Similar to most other studies using Swedish trade data, we only consider firms with 10 or
more employees, as the information provided for smaller firms is likely to be less reliable.
The employer dataset contains information on sales, value added, exports, imports,
capital stock, corporate ownership structure and number of employees at the firm level.
Continuous variables are deflated using deflators for exports, imports and producer prices
provided by Statistics Sweden. Firm-level data are matched with patent data retrieved
from the European Patent Office (EPO). By merging this data with the employee dataset,
we can access information on employees’ level of education, occupation and income levels.
Beginning with Feenstra & Hanson (1999), researchers have defined offshoring as im-
ports of intermediate inputs. More recent research has advanced the identification by
measuring offshoring as imports of the same four-digit industries (Hummels, Jørgensen,
Munch & Xiang 2014), or same six-digit industries that importers produce domestically
6

(Bernard, Fort, Smeets & Warzynski 2020).
In this paper, we apply a different approach to identify relocated production of inputs.
As offshoring production leads to firms’ imports, it is possible to take advantage of the
United Nations Broad Economic Categories (BEC), which is a three-digit classification
system grouping transportable goods according to their main end use: capital goods,
consumer goods and intermediate goods. The latter has been applied as a proxy for
offshoring. A main challenge for offshoring research based on the BEC system is that
revisions imply that unique products might be classified differently over time. To account
for the re-classification, we apply the algorithm suggested by Pierce & Schott (2012) and
further developed by Van Beveren, Bernard & Vandenbussche (2012) for concording trade
and production data over time, and consider an imported product as offshored if it is
classified as an intermediate good. The offshoring variable is defined in Table 8.
To mitigate possible bias due to spurious correlation, we control for the potential trends
that may make jobs more likely to be offshored1 using the Blinder index of offshorabil-
ity.2 Applying the classification method proposed by Blinder & Krueger (2013), we first
consider 430 job titles in the Swedish labor market and estimate their offshorability. Each
occupation is then classified according to whether it has a high risk of being moved abroad.
We then calculate a firm-specific offshorability measure, defined as the ratio of offshorable
jobs to total employment.
We also include the Osborne–Frey index (Frey & Osborne 2017) in our analyses. This
index is designed to capture the likelihood for each occupation to be replaced by computers
or robots in the near future. The computed Osborne–Frey index is also firm-specific.
Our study evaluates patent applications and TFP as measures of the importance of
offshoring. Despite well-known advantages and shortcomings, both are widely used in aca-
demic literature as indicators of technological change and economic development. Patents
are the only source of rich information on new technology screened in a systematic and
resource-intensive manner over a long period of time within and across technology classes.
1A wide variety of occupations in both manufacturing and services are vulnerable to offshoring toforeign countries. For instance, Blinder & Krueger (2013) estimate the potential offshorability to be aboutone-quarter of all jobs in the 2004 US workforce.
2Blinder & Krueger (2013) find that jobs that can be broken down into simple routine tasks are easier tooffshore in comparison to other more complex, non-routine tasks. The common characteristic of offshorableoccupations is the lack of face-to-face contact with end users.
7

Patent information are accessible through large databases maintained by organizations
such as the National Bureau of Economic Research (NBER), the European Patent Of-
fice (EPO), and the Institute of Intellectual Property (IIP) in Japan. However, there are
certainly caveats. Not all patents represent innovation, nor are all innovations patented;
the distribution of the value of patents is highly skewed, and companies may use patents
strategically to block other firms’ patents by creating a ‘patent thicket’. For a review on
patents as an indicator of innovation, see for instance Nagaoka, Motohashi & Goto (2010).
In the paper, we exploit the world’s largest patent data base, the EPO Worldwide Patent
Statistical Database (PATSTAT) that covers 172 countries.
TFP has its own measurement problems, such as its procyclicality and the difficulty
in obtaining an accurate price index, particularly for goods with rapid quality changes. A
main challenge in estimating TFP is that due to positive productivity shocks, firms tend
to respond by expanding their level of output and by demanding more inputs, and vice
versa for a negative shock. The positive correlation between the observable input levels
and the unobservable productivity shocks is a source of bias in TFP. Recent years have
seen a number of methodological developments of TFP computation addressing this bias.
Olley & Pakes (1996), Levinsohn & Petrin (2003), Ackerberg, Caves & Frazer (2006, 2015),
Manjon & Manez (2016) have contributed to the literature proposing two-step estimation
procedures, while Wooldridge (2009) provided a method to perform consistent estimation
within a one-step GMM framework. Most recently Mollisi & Rovigatti (2017) proposed
a new estimator, based on the Wooldridge approach, using dynamic panel instruments as
used in the Blundell & Bond (1998) methodology. In this paper, we apply the Wooldridge
TFP estimation approach.
To control for heterogeneous levels of ability, we estimate residuals from a Mincer equa-
tion, defined over traditional individual-level variables such as age, age squared, education
and gender. We take this measure as our proxy for ability and calculate the average ability
of the firm’s workforce.
A growing number of studies shows the importance of corporate ownership structures
on productivity and managerial practices. There are not only potential differences between
foreign and domestic multinational firms, but also among the various categories of domestic
firms. Our study separates firms in four ownership categories: domestic non-affiliated
8
firms, domestic affiliated firm (UNE), and domestic and foreign multinationals.
Other controls included in our regressions are measures of firm size, industry-specific
effects for 18 two-digit industries and time-specific effects. Table 8 in the Appendix lists
all variables used in the analyses and provides detailed definitions for each of them.
3.1 Descriptive Statistics
The average annual number of firms observed in our study is about 7,500, and as shown in
Table 1, this yields a total of 73,722 firm-year observations. There is substantial attrition,
approximately 20%, in the sample, from 8,219 firms in 2001 to 6,569 firms in 2014. Most
firms in our sample are domestic non-affiliated or independent companies (78%) located
outside metropolitan or large cities (45%), have fewer than 50 employees (75%) and are
categorized as low or medium-low technology companies (56%). Only 25% of the firms
have fifty or more employees, and more than seven out of ten firms are are located in large
cities or metropolitan areas. About half of the firms are classified as high or medium-high
technology firms.
Figure 1 provides a snapshot of offshoring engagement across regions for the four dif-
ferent ownership categories. About two-thirds of manufacturing firms in our sample carry
out offshoring. There is, however, a large variation in the sample. The upper part of the
figure reports figures for multinational companies and the lower part for domestic compa-
nies. The MNE companies are divided into foreign-owned and domestically owned, while
the domestic companies can be part of a group (Uninational) or be independent companies
(Non affiliated). The importance of offshoring across destination regions appears to be
similar between MNEs as well as between non-MNEs, but differs across these two cate-
gories of ownership. While around nine out of ten MNEs are contracting out production
internationally, the corresponding figure for non-MNEs is about 50%. Most noticeable is
the relative growth of offshoring destinations in Eastern Europe (all former non-market
economies in Eastern Europe except Russia) in all four ownership categories. At the same
time, it also appears that the proportion of companies that offshored production to the
BRICS countries has decreased, especially among domestic MNEs, while it has increased
to the counties we refer to as Rest of the World (ROW) in this study. While Figure 1 only
shows offshoring as a fraction of firms, the intensity of offshoring is reported in Section 5,
9
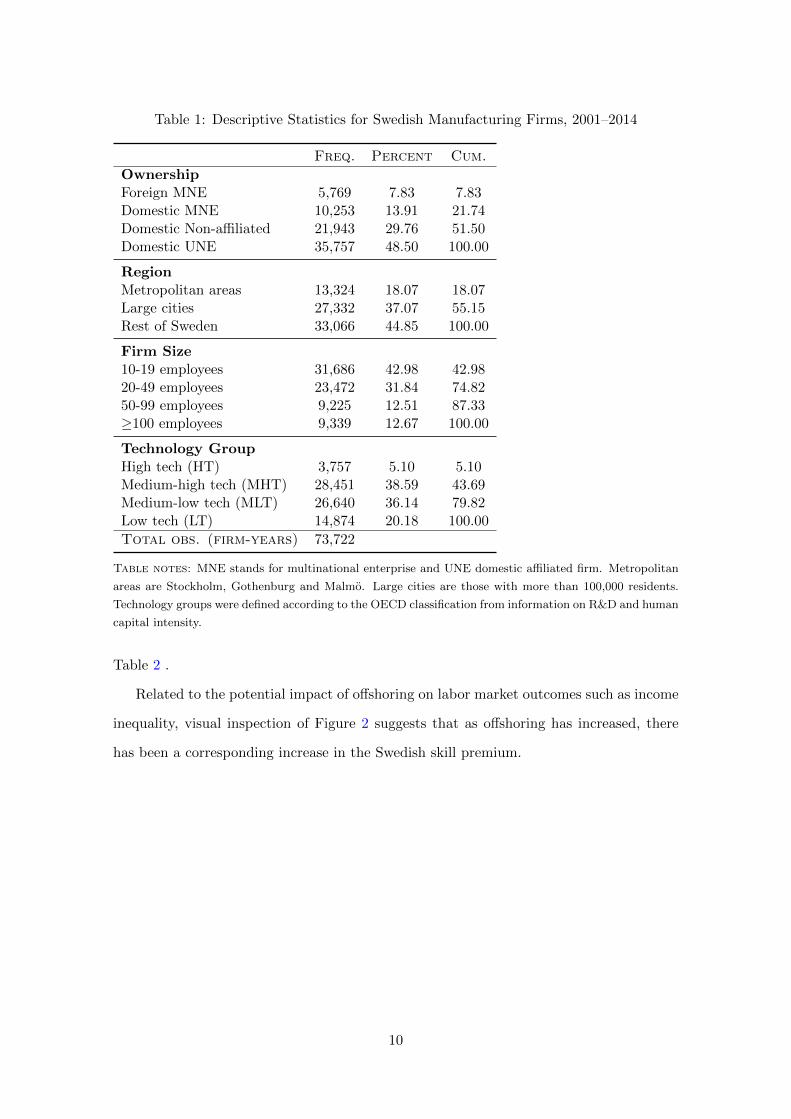
Table 1: Descriptive Statistics for Swedish Manufacturing Firms, 2001–2014
Freq. Percent Cum.
OwnershipForeign MNE 5,769 7.83 7.83Domestic MNE 10,253 13.91 21.74Domestic Non-affiliated 21,943 29.76 51.50Domestic UNE 35,757 48.50 100.00
RegionMetropolitan areas 13,324 18.07 18.07Large cities 27,332 37.07 55.15Rest of Sweden 33,066 44.85 100.00
Firm Size10-19 employees 31,686 42.98 42.9820-49 employees 23,472 31.84 74.8250-99 employees 9,225 12.51 87.33≥100 employees 9,339 12.67 100.00
Technology GroupHigh tech (HT) 3,757 5.10 5.10Medium-high tech (MHT) 28,451 38.59 43.69Medium-low tech (MLT) 26,640 36.14 79.82Low tech (LT) 14,874 20.18 100.00
Total obs. (firm-years) 73,722
Table notes: MNE stands for multinational enterprise and UNE domestic affiliated firm. Metropolitan
areas are Stockholm, Gothenburg and Malmo. Large cities are those with more than 100,000 residents.
Technology groups were defined according to the OECD classification from information on R&D and human
capital intensity.
Table 2 .
Related to the potential impact of offshoring on labor market outcomes such as income
inequality, visual inspection of Figure 2 suggests that as offshoring has increased, there
has been a corresponding increase in the Swedish skill premium.
10

Figure 1: Offshoring across regions. Proportions of firms.
(a) Foreign MNEs
01
02
03
04
05
06
0
BRICS East Europe G7 Non−offs Nordic OECD ROW
2001 2014
(b) Domestic MNEs
01
02
03
04
05
06
0
BRICS East Europe G7 Non−offs Nordic OECD ROW
2001 2014
(c) Domestic Uninational Enterprise
01
02
03
04
05
06
0
BRICS East Europe G7 Non−offs Nordic Other OECD ROW
2001 2014
(d) Domestic Non Affiliated
20
40
10
30
50
60
0
BRICS East Europe G−7 Non−offshoringNordic OECD ROW
2001 2014
Figure notes: BRICS is Brazil, Russia, India China and South Africa. East Europe is all former non-
market economies in Eastern Europe except Russia. G-7 is U.S., Canada, U.K., France, Germany, Italy
and Japan. Non-off refer to firms not offshoring production. Nordics is Finland, Denmark, Norway and
Iceland. OECD is all OECD-members except G-7 and Nordic countries. ROW is all other countries.
Figure 2: Offshoring and the skill premium in Sweden
.46
.48
.5.5
2.5
4
FR
AC
TIO
N O
F F
IRM
S O
FF
SH
OR
ING
2001
2002
2003
2004
2005
2006
2007
2008
2009
2010
2011
2012
2013
2014
YEAR
1.1
1.1
21
.14
1.1
61
.18
1.2
SK
ILL
PR
EM
IUM
2001
2002
2003
2004
2005
2006
2007
2008
2009
2010
2011
2012
2013
2014
YEAR
Figure notes: The left panel depicts the fraction of firms in Swedish manufacturing that utilize offshore
production. The right panel plots the skill premium, defined as the wage ratio between university-educated
and non-university educated workers, for the 75th percentile. Both of these figures are based on firms with
at least 10 employees.
11

4 Empirical Strategy
In order to estimate how the offshoring destination affects the likelihood of innovation,
proxied by applying for a patent , we specify the following model:
Pr(patentit = 1) = f(offshoring destinationit, potential offshorabilityit,workers’
abilityit, automation potentialit, controlsit, λt, µi, εit) (1)
where λt is a year effect, µi is a firm-specific error component and εit is an idiosyncratic
error. This model is estimated as a random effects probit model.
Next, we estimate the impact of offshoring on the firm’s productivity, expressed as log
TFP, in a dynamic specification. This model is specified as
log TFPi,t = f(log TFPi,t−1, log offshoringit, potential offshorabilityit, automation
potentialit,workers’ abilityit, controls, λt, µi, εit) (2)
To estimate this dynamic panel model specification, we employ the first-difference GMM
estimator developed by Arellano & Bond (1991). This framework is convenient because it
is relatively easy to allow for the endogeneity of offshoring, which is instrumented with both
its own lagged level values together with other covariates. It should be noted, however,
that we do not include any external instruments.
4.1 Propensity Score Matching
In this empirical analysis we focus on estimating the causal effect from offshoring on those
firms that persistently offshore production. As we cannot observe the counterfactual for
those firms that offshore, i.e. their outcomes if they had not chosen to offshore, we establish
a quasi-experimental research design by defining a control group of non-offshoring firms
which are most similar to the offshoring firms. To identify those firms we use propensity
score matching, or PSM (Rosenbaum & Rubin 1984, Rubin 1997).3 The first step in PSM
is to estimate the likelihood of a firm to be a persistent offshoring firm, for which we use a
3Note that coarsened exact matching (CEM) would have been an alternative to PSM, which might bemore robust as it does not rely on functional form specification (Iacus, King & Porro 2012). PSM is veryconvenient as it allows the inclusion of pre-treatment values of the outcome variables, which will balancethe pre-treatment outcome variables between the groups. Very often, however, the results from these twomatching approaches do not differ greatly.
12

probit model. This model is estimated based on variables for year 2001, while persistent
offshoring is determined for the entire sample period.4
5 Empirical Results
In this section, we present summary statistics and estimates for the models specified in
equations (1) and (2). We employ different estimation techniques in order to gauge the
importance of offshoring on different aspects of firms’ innovation strategies.
Table 2 reports summary statistics for key variables in the analysis. Five percent of
the firms are protecting their innovations with formal intellectual rights (patent).5 Total
factor productivity is expressed in logarithms. We define employees with three years of
university education as skilled employees, and those with a lower level of education as
unskilled. On average, 7% of the employees in a firm are classified as skilled, and the
mean skill premium is 0.75.
Our main offshoring measure is reported for all six destinations in the study. Nor-
malizing offshore by by sales, the table reveals that the G-7 countries and other OECD
countries are the most important destinations. We estimate a Mincer residual for each
employee, assuming that it can be used as a proxy for ability as a complement to human
capital.
Approximately 50% of jobs are potentially offshorable as expressed by the Blinder in-
dex. The Osborne–Frey index suggests that 60% of the jobs in Swedish manufacturing can
potentially be replaced by machines or robots in the near future. We denote this measure
as Automation potential, assuming that a high value of this index reflects unexploited
efficiency potential.
4A persistent offshoring firm has offshoring of at least 10% relative to its sales and in at least 80% ofthe observation years. A non-offshoring firm is defined as a firm that has less than 5% offshoring relativeto sales in all observation years. Thus, we are implicitly defining a hurdle model for offshoring with thisspecification.
5The patent measure may be compared with the self-declared innovation measured in the EurostatCommunity Innovation Survery (CIS) where firms report whether they have introduced a good or a servicenew for the firm or new for the market. According to CIS 2016, almost one third of the Swedish firmsdeclared themselves as innovative.
13
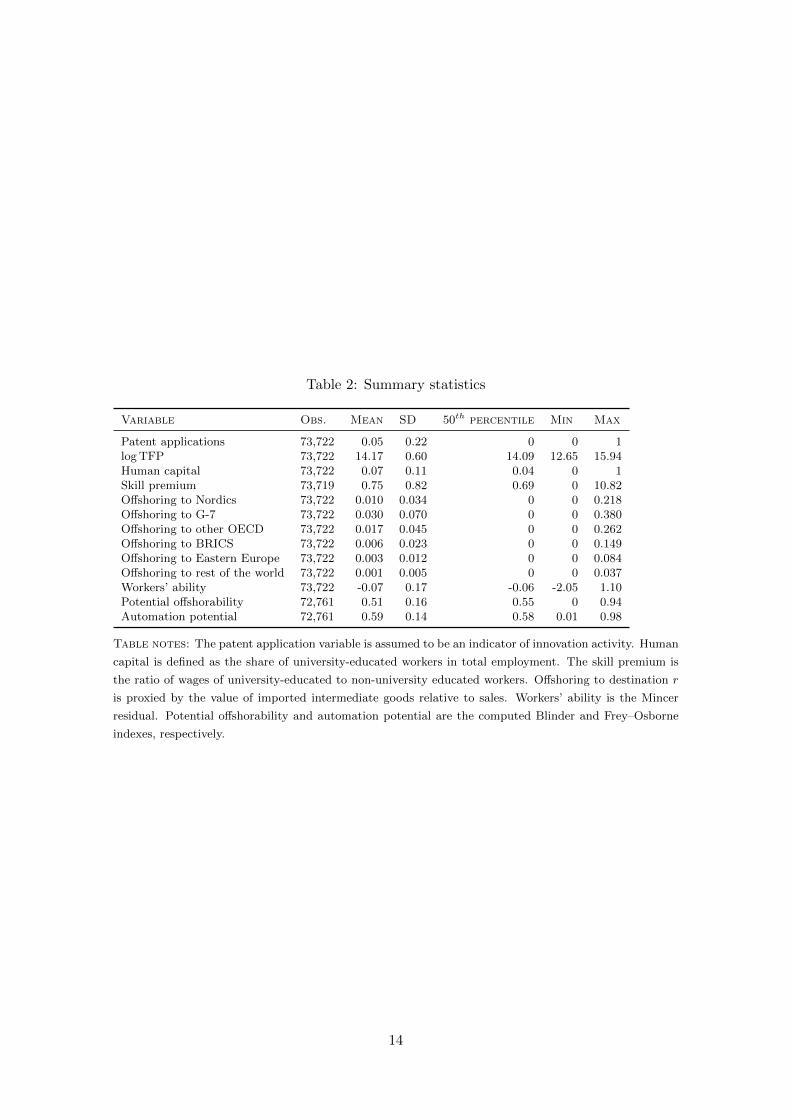
Table 2: Summary statistics
Variable Obs. Mean SD 50th percentile Min Max
Patent applications 73,722 0.05 0.22 0 0 1log TFP 73,722 14.17 0.60 14.09 12.65 15.94Human capital 73,722 0.07 0.11 0.04 0 1Skill premium 73,719 0.75 0.82 0.69 0 10.82Offshoring to Nordics 73,722 0.010 0.034 0 0 0.218Offshoring to G-7 73,722 0.030 0.070 0 0 0.380Offshoring to other OECD 73,722 0.017 0.045 0 0 0.262Offshoring to BRICS 73,722 0.006 0.023 0 0 0.149Offshoring to Eastern Europe 73,722 0.003 0.012 0 0 0.084Offshoring to rest of the world 73,722 0.001 0.005 0 0 0.037Workers’ ability 73,722 -0.07 0.17 -0.06 -2.05 1.10Potential offshorability 72,761 0.51 0.16 0.55 0 0.94Automation potential 72,761 0.59 0.14 0.58 0.01 0.98
Table notes: The patent application variable is assumed to be an indicator of innovation activity. Human
capital is defined as the share of university-educated workers in total employment. The skill premium is
the ratio of wages of university-educated to non-university educated workers. Offshoring to destination r
is proxied by the value of imported intermediate goods relative to sales. Workers’ ability is the Mincer
residual. Potential offshorability and automation potential are the computed Blinder and Frey–Osborne
indexes, respectively.
14
5.1 Innovation and technical change
Table 3 reports average marginal effects of the propensity to apply for patents. A priori,
we assume that offshoring allows firms to switch resources from production to research.
The working hypothesis is that this should be manifested through increased innovation
capabilities. The hypothesis is confirmed for offshoring to low wage destinations (Eastern
Europe and Rest of the World), and partly for offshoring to other OECD countries (MTL
and LT).
Our second analysis considers total factor productivity as a measure of technical
change. Some of the prior empirical literature reports a positive impact of offshoring
on TFP. However, what distinguishes our analysis from most of the existing literature is
that we observe the entire universe of manufacturing firms in the economy, both small,
middle-sized and large, over a long period. In addition, we are able to control for a number
of company and employee characteristics in order to identify the impact of offshoring.
Table 4 presents results from four different dynamic models: pooled OLS, fixed effects,
difference GMM and system GMM. The two latter are estimated by the Arellano–Bond
approach. In this analysis, we measure offshoring by the logarithm of its nominal value.
The approaches presented in columns (1) and (2) show a positive and highly significant
association between offshoring and TFP. However, both the pooled OLS and fixed effects
estimates are potentially Nickell-biased in a dynamic setting. Columns (3) and (4) present
results from the Arellano–Bond instrumental variable estimator for the dynamic panel
setting which allows for a causal interpretation of the estimates. Both columns show
positive and highly significant coefficients on the offshoring variable. The size of the
coefficient estimate is 0.011 in the difference GMM model and 0.022 in the system GMM
model.
The test statistics in the foot of the table show that the instruments are valid in
both Arellano–Bond estimators and that there is no second-order serial correlation in the
differenced error terms.
The overall results in the first step of the analysis provide a positive link between
global value chains, as reflected by an increased reliance on offshoring, and innovation
and technical change. It should be noted that we may only interpret this relationship
15
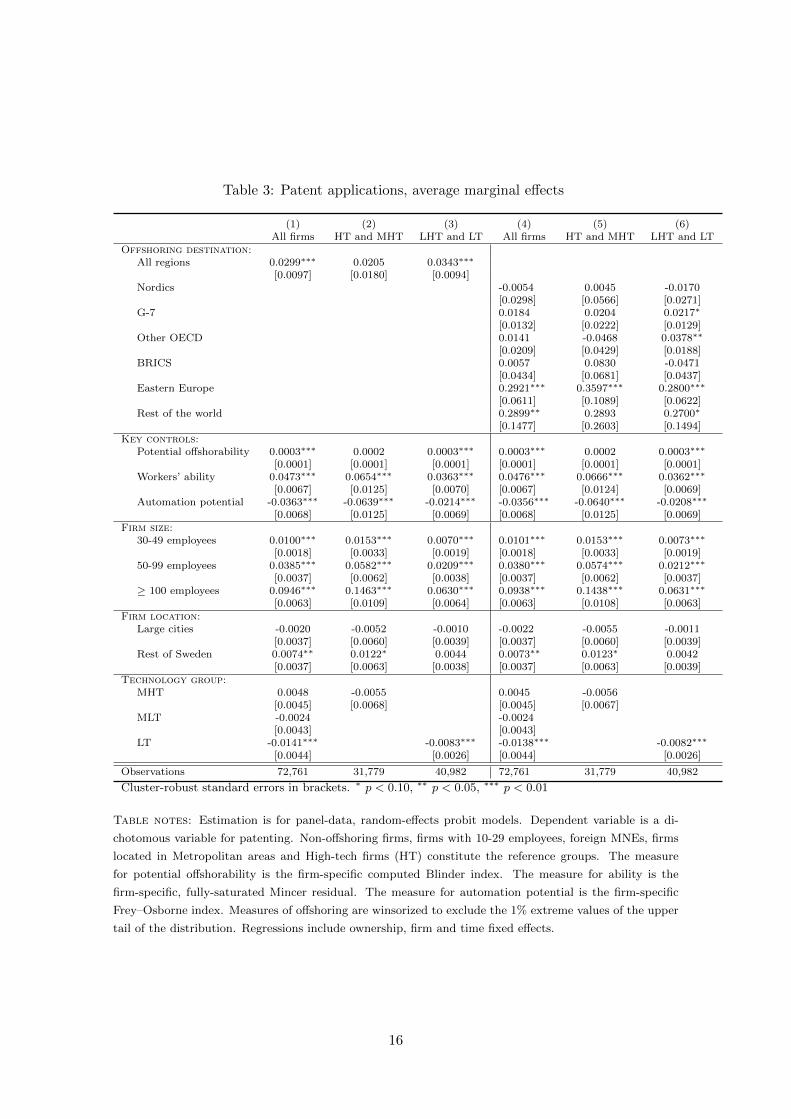
Table 3: Patent applications, average marginal effects
(1) (2) (3) (4) (5) (6)All firms HT and MHT LHT and LT All firms HT and MHT LHT and LT
Offshoring destination:All regions 0.0299∗∗∗ 0.0205 0.0343∗∗∗
[0.0097] [0.0180] [0.0094]Nordics -0.0054 0.0045 -0.0170
[0.0298] [0.0566] [0.0271]G-7 0.0184 0.0204 0.0217∗
[0.0132] [0.0222] [0.0129]Other OECD 0.0141 -0.0468 0.0378∗∗
[0.0209] [0.0429] [0.0188]BRICS 0.0057 0.0830 -0.0471
[0.0434] [0.0681] [0.0437]Eastern Europe 0.2921∗∗∗ 0.3597∗∗∗ 0.2800∗∗∗
[0.0611] [0.1089] [0.0622]Rest of the world 0.2899∗∗ 0.2893 0.2700∗
[0.1477] [0.2603] [0.1494]Key controls:
Potential offshorability 0.0003∗∗∗ 0.0002 0.0003∗∗∗ 0.0003∗∗∗ 0.0002 0.0003∗∗∗
[0.0001] [0.0001] [0.0001] [0.0001] [0.0001] [0.0001]Workers’ ability 0.0473∗∗∗ 0.0654∗∗∗ 0.0363∗∗∗ 0.0476∗∗∗ 0.0666∗∗∗ 0.0362∗∗∗
[0.0067] [0.0125] [0.0070] [0.0067] [0.0124] [0.0069]Automation potential -0.0363∗∗∗ -0.0639∗∗∗ -0.0214∗∗∗ -0.0356∗∗∗ -0.0640∗∗∗ -0.0208∗∗∗
[0.0068] [0.0125] [0.0069] [0.0068] [0.0125] [0.0069]Firm size:
30-49 employees 0.0100∗∗∗ 0.0153∗∗∗ 0.0070∗∗∗ 0.0101∗∗∗ 0.0153∗∗∗ 0.0073∗∗∗
[0.0018] [0.0033] [0.0019] [0.0018] [0.0033] [0.0019]50-99 employees 0.0385∗∗∗ 0.0582∗∗∗ 0.0209∗∗∗ 0.0380∗∗∗ 0.0574∗∗∗ 0.0212∗∗∗
[0.0037] [0.0062] [0.0038] [0.0037] [0.0062] [0.0037]≥ 100 employees 0.0946∗∗∗ 0.1463∗∗∗ 0.0630∗∗∗ 0.0938∗∗∗ 0.1438∗∗∗ 0.0631∗∗∗
[0.0063] [0.0109] [0.0064] [0.0063] [0.0108] [0.0063]Firm location:
Large cities -0.0020 -0.0052 -0.0010 -0.0022 -0.0055 -0.0011[0.0037] [0.0060] [0.0039] [0.0037] [0.0060] [0.0039]
Rest of Sweden 0.0074∗∗ 0.0122∗ 0.0044 0.0073∗∗ 0.0123∗ 0.0042[0.0037] [0.0063] [0.0038] [0.0037] [0.0063] [0.0039]
Technology group:MHT 0.0048 -0.0055 0.0045 -0.0056
[0.0045] [0.0068] [0.0045] [0.0067]MLT -0.0024 -0.0024
[0.0043] [0.0043]LT -0.0141∗∗∗ -0.0083∗∗∗ -0.0138∗∗∗ -0.0082∗∗∗
[0.0044] [0.0026] [0.0044] [0.0026]
Observations 72,761 31,779 40,982 72,761 31,779 40,982
Cluster-robust standard errors in brackets. ∗ p < 0.10, ∗∗ p < 0.05, ∗∗∗ p < 0.01
Table notes: Estimation is for panel-data, random-effects probit models. Dependent variable is a di-
chotomous variable for patenting. Non-offshoring firms, firms with 10-29 employees, foreign MNEs, firms
located in Metropolitan areas and High-tech firms (HT) constitute the reference groups. The measure
for potential offshorability is the firm-specific computed Blinder index. The measure for ability is the
firm-specific, fully-saturated Mincer residual. The measure for automation potential is the firm-specific
Frey–Osborne index. Measures of offshoring are winsorized to exclude the 1% extreme values of the upper
tail of the distribution. Regressions include ownership, firm and time fixed effects.
16
in terms of causality with regard to the effect on TFP. Further, as we do not use any
external instruments in the Arellano-Bond model, the results should be interpreted with
some caution.
In the next step of the analysis, we test the sensitivity of the parameter estimates above
in an approach that accounts for self-selectivity and reverse causality between innovation
and productivity.
5.2 Robustness test
It is plausible that firms that are more productive and have higher innovation capabilities
are more likely to engage in offshoring activities. In this case high productivity and high
innovation capability jointly determine the likelihood and intensity of offshoring. In fact,
the results from the PSM shown in Table 6 imply that persistent offshoring firms, in our
case about 1,000 of the 7,000 firms in the sample, have more patents and significantly
higher productivity compared to non-offshoring firms. However, it is an open question
whether this is a result of offshoring or itself a determinant of the likelihood to engage in
offshoring.
With the help of PSM we can define a control group of non-offshoring firms which are
most similar to the offshoring firms in their productivity and innovation outcomes in 2001.
The results of Table 6 indicate that there are no remaining significant differences between
the treatment group of offshoring firms and those in the control group after matching.
We then study the outcome variables, patent applications and TFP, for 2002–2014 for
these two groups of firms. Table 7 presents estimates for the matched sample. Probit
estimates for the innovation model are reported in columns 1 and 2. While we found
highly significant and positive point estimates for the category all firms in Table 3, the
pooled probit estimate results in column 1 are still positive but no longer significant.
Column 2 considers a panel probit model using the random effect estimator. The effect of
offshoring on innovation is positive, but only at the 90% level of significance. Thus, after
accounting for self-selectivity, the treatment effects from offshoring become much weaker
in the preferred random effects model.
Columns 3 and 4 reveal the causal impact of offshoring on TFP using the matched
sample of offshoring and non-offshoring firms. Not accounting for self-selection and not
17

properly controlling for endogeneity, the dynamic Arellano-Bond estimates in Table 4
supported the literature that suggests that firms which replace in-house production of
intermediate inputs with insourcing from foreign destinations increase their productivity.
Although this effect remains in the pooled OLS model reported in column 3, the effect
disappears completely when we include firm fixed effects in the preferred TFP model
presented in column 4.
Taken together, the matching results imply that offshoring is clearly endogenous, with
self-selection as an important factor that should be addressed in the empirical approach.
Most of the previous research has neglected this issue.
18

Table 4: Offshoring and total factor productivity (log TFP)
(1) (2) (3) (4)OLS Fixed effects Diff. GMM Syst. GMM
log TFPt−1 0.7203∗∗∗ 0.2469∗∗∗ 0.2673∗∗∗ 0.2684∗∗∗
[0.0070] [0.0099] [0.0206] [0.0209]log Offshoring 0.0105∗∗∗ 0.0154∗∗∗ 0.0119∗∗∗ 0.0229∗∗∗
[0.0006] [0.0013] [0.0018] [0.0045]
Key controls:Potential offshorability -0.0000 -0.0004∗∗ -0.0001 -0.0001
[0.0001] [0.0002] [0.0002] [0.0002]Workers’ ability 0.2757∗∗∗ 0.1513∗∗∗ 0.0757∗∗∗ 0.0733∗∗∗
[0.0137] [0.0202] [0.0234] [0.0234]Automation potential -0.1032∗∗∗ -0.0141 0.0395 0.0395
[0.0135] [0.0210] [0.0252] [0.0253]
Firm size:30-49 employees 0.0543∗∗∗ 0.0526∗∗∗ -0.0132 -0.0165
[0.0042] [0.0087] [0.0211] [0.0211]50-99 employees 0.1130∗∗∗ 0.1095∗∗∗ -0.0262 -0.0327
[0.0059] [0.0132] [0.0260] [0.0262]≥ 100 employees 0.2203∗∗∗ 0.1591∗∗∗ -0.0488 -0.0572
[0.0087] [0.0195] [0.0347] [0.0349]
Ownership:Domestic non-affiliated 0.0161 0.0170
[0.0187] [0.0187]Domestic UNE 0.0014 0.0004 0.0086 0.0091
[0.0039] [0.0083] [0.0152] [0.0152]Domestic MNE 0.0066 0.0025
[0.0057] [0.0135]
Firm location:Large cities -0.0081∗ 0.0813 0.0853 0.0835
[0.0047] [0.0742] [0.0908] [0.0905]Rest of Sweden 0.0000 0.0302 -0.0032 -0.0047
[0.0047] [0.0717] [0.0725] [0.0724]
Technology group:MHT -0.0255∗∗∗ -0.0118 -0.0251 -0.0248
[0.0066] [0.0116] [0.0191] [0.0191]MLT -0.0288∗∗∗ -0.0257∗∗ 0.0004 0.0003
[0.0065] [0.0108] [0.0200] [0.0200]LT -0.0379∗∗∗ -0.0392∗∗∗ -0.0090 -0.0088
[0.0067] [0.0109] [0.0183] [0.0183]
Observations 39,047 39,047 30,329 30,329Firms 6,938 6,938 5,408 5,408Instruments 39 42Hansen J p-value 0.352 0.256AR(2) p-value 0.933 0.994
Cluster-robust standard errors in brackets. ∗ p < 0.10, ∗∗ p < 0.05, ∗∗∗ p < 0.01
Table notes: Estimation method is reported underneath the column number. Dependent variable is total
factor productivity (TFP), calculated a la Wooldridge (2009). The difference between columns (3) and
(4) is that offshoring is treated as endogenous in the latter. Firms with 10-29 employees, foreign MNEs,
high-tech firms and firms located in Metropolitan areas are the reference groups. Important to note is
that we estimate with an absolute measure of offshoring (this avoids having productivity shocks artificially
caused by sales movements). The measure for potential offshorability is the firm-specific computed Blinder
index. The measure for ability is the firm-specific, fully-saturated Mincer residual. The measure for
potential offshorability is the firm-specific computed Blinder index. The measure for automation potential
is the firm-specific Frey-Osborne index. All regressions include firm- and time-specific effects, with the sole
exception of OLS which does not include firm-specific effects.
19
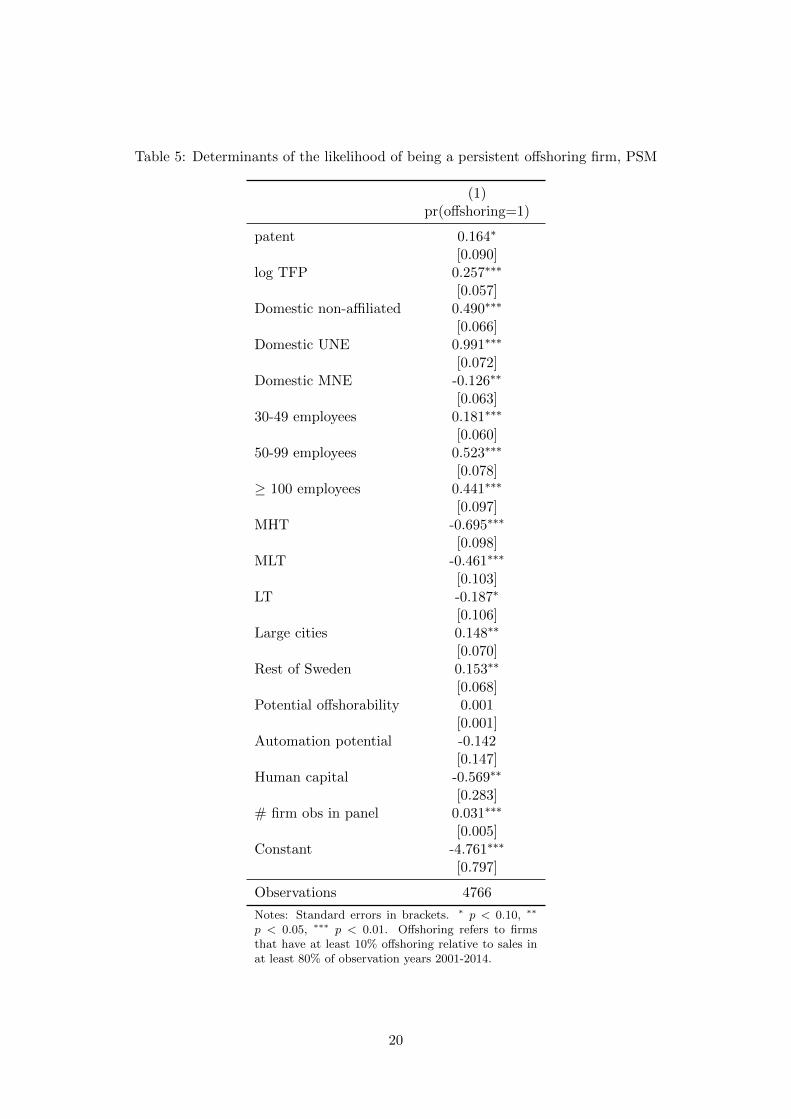
Table 5: Determinants of the likelihood of being a persistent offshoring firm, PSM
(1)pr(offshoring=1)
patent 0.164∗
[0.090]log TFP 0.257∗∗∗
[0.057]Domestic non-affiliated 0.490∗∗∗
[0.066]Domestic UNE 0.991∗∗∗
[0.072]Domestic MNE -0.126∗∗
[0.063]30-49 employees 0.181∗∗∗
[0.060]50-99 employees 0.523∗∗∗
[0.078]≥ 100 employees 0.441∗∗∗
[0.097]MHT -0.695∗∗∗
[0.098]MLT -0.461∗∗∗
[0.103]LT -0.187∗
[0.106]Large cities 0.148∗∗
[0.070]Rest of Sweden 0.153∗∗
[0.068]Potential offshorability 0.001
[0.001]Automation potential -0.142
[0.147]Human capital -0.569∗∗
[0.283]# firm obs in panel 0.031∗∗∗
[0.005]Constant -4.761∗∗∗
[0.797]
Observations 4766
Notes: Standard errors in brackets. ∗ p < 0.10, ∗∗
p < 0.05, ∗∗∗ p < 0.01. Offshoring refers to firmsthat have at least 10% offshoring relative to sales inat least 80% of observation years 2001-2014.
20
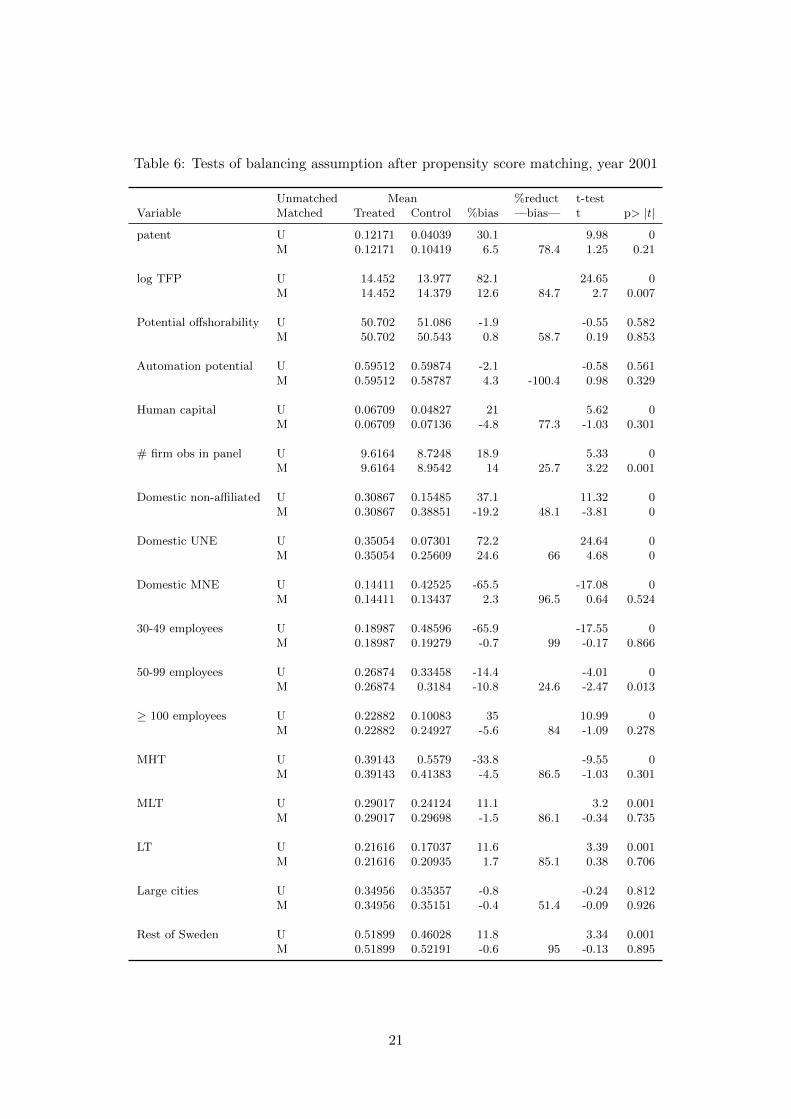
Table 6: Tests of balancing assumption after propensity score matching, year 2001
Unmatched Mean %reduct t-testVariable Matched Treated Control %bias —bias— t p> |t|
patent U 0.12171 0.04039 30.1 9.98 0M 0.12171 0.10419 6.5 78.4 1.25 0.21
log TFP U 14.452 13.977 82.1 24.65 0M 14.452 14.379 12.6 84.7 2.7 0.007
Potential offshorability U 50.702 51.086 -1.9 -0.55 0.582M 50.702 50.543 0.8 58.7 0.19 0.853
Automation potential U 0.59512 0.59874 -2.1 -0.58 0.561M 0.59512 0.58787 4.3 -100.4 0.98 0.329
Human capital U 0.06709 0.04827 21 5.62 0M 0.06709 0.07136 -4.8 77.3 -1.03 0.301
# firm obs in panel U 9.6164 8.7248 18.9 5.33 0M 9.6164 8.9542 14 25.7 3.22 0.001
Domestic non-affiliated U 0.30867 0.15485 37.1 11.32 0M 0.30867 0.38851 -19.2 48.1 -3.81 0
Domestic UNE U 0.35054 0.07301 72.2 24.64 0M 0.35054 0.25609 24.6 66 4.68 0
Domestic MNE U 0.14411 0.42525 -65.5 -17.08 0M 0.14411 0.13437 2.3 96.5 0.64 0.524
30-49 employees U 0.18987 0.48596 -65.9 -17.55 0M 0.18987 0.19279 -0.7 99 -0.17 0.866
50-99 employees U 0.26874 0.33458 -14.4 -4.01 0M 0.26874 0.3184 -10.8 24.6 -2.47 0.013
≥ 100 employees U 0.22882 0.10083 35 10.99 0M 0.22882 0.24927 -5.6 84 -1.09 0.278
MHT U 0.39143 0.5579 -33.8 -9.55 0M 0.39143 0.41383 -4.5 86.5 -1.03 0.301
MLT U 0.29017 0.24124 11.1 3.2 0.001M 0.29017 0.29698 -1.5 86.1 -0.34 0.735
LT U 0.21616 0.17037 11.6 3.39 0.001M 0.21616 0.20935 1.7 85.1 0.38 0.706
Large cities U 0.34956 0.35357 -0.8 -0.24 0.812M 0.34956 0.35151 -0.4 51.4 -0.09 0.926
Rest of Sweden U 0.51899 0.46028 11.8 3.34 0.001M 0.51899 0.52191 -0.6 95 -0.13 0.895
21
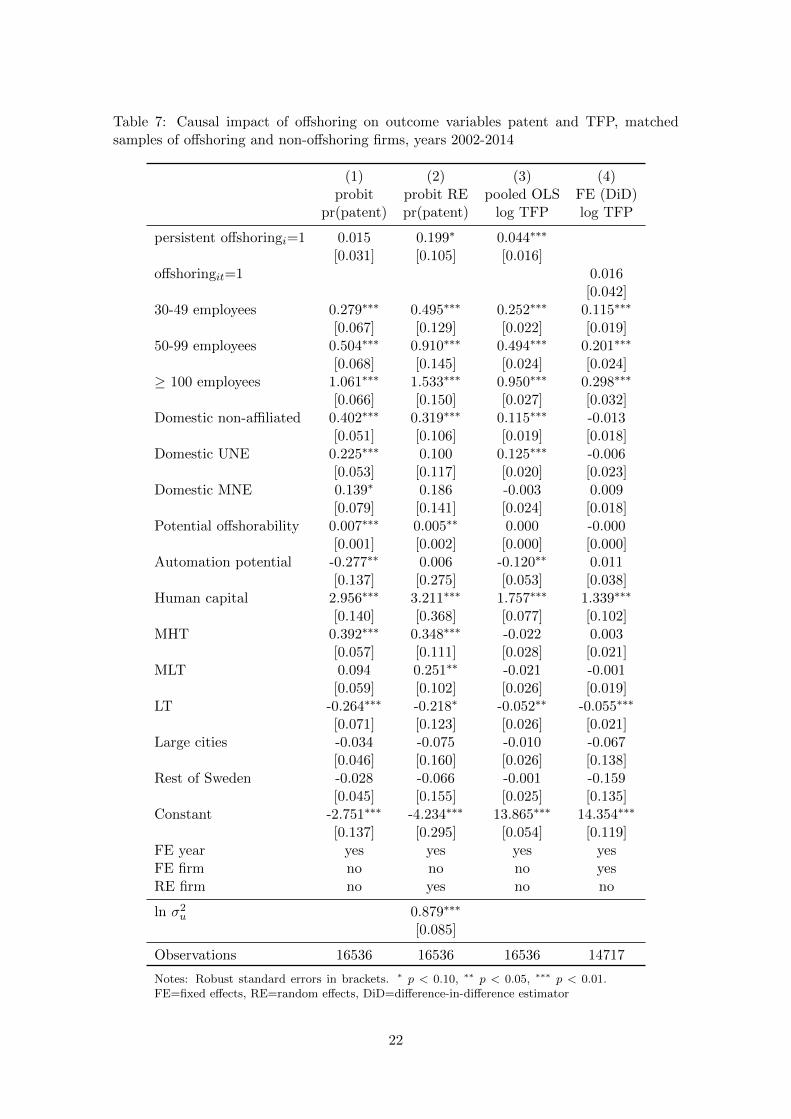
Table 7: Causal impact of offshoring on outcome variables patent and TFP, matchedsamples of offshoring and non-offshoring firms, years 2002-2014
(1) (2) (3) (4)probit probit RE pooled OLS FE (DiD)
pr(patent) pr(patent) log TFP log TFP
persistent offshoringi=1 0.015 0.199∗ 0.044∗∗∗
[0.031] [0.105] [0.016]offshoringit=1 0.016
[0.042]30-49 employees 0.279∗∗∗ 0.495∗∗∗ 0.252∗∗∗ 0.115∗∗∗
[0.067] [0.129] [0.022] [0.019]50-99 employees 0.504∗∗∗ 0.910∗∗∗ 0.494∗∗∗ 0.201∗∗∗
[0.068] [0.145] [0.024] [0.024]≥ 100 employees 1.061∗∗∗ 1.533∗∗∗ 0.950∗∗∗ 0.298∗∗∗
[0.066] [0.150] [0.027] [0.032]Domestic non-affiliated 0.402∗∗∗ 0.319∗∗∗ 0.115∗∗∗ -0.013
[0.051] [0.106] [0.019] [0.018]Domestic UNE 0.225∗∗∗ 0.100 0.125∗∗∗ -0.006
[0.053] [0.117] [0.020] [0.023]Domestic MNE 0.139∗ 0.186 -0.003 0.009
[0.079] [0.141] [0.024] [0.018]Potential offshorability 0.007∗∗∗ 0.005∗∗ 0.000 -0.000
[0.001] [0.002] [0.000] [0.000]Automation potential -0.277∗∗ 0.006 -0.120∗∗ 0.011
[0.137] [0.275] [0.053] [0.038]Human capital 2.956∗∗∗ 3.211∗∗∗ 1.757∗∗∗ 1.339∗∗∗
[0.140] [0.368] [0.077] [0.102]MHT 0.392∗∗∗ 0.348∗∗∗ -0.022 0.003
[0.057] [0.111] [0.028] [0.021]MLT 0.094 0.251∗∗ -0.021 -0.001
[0.059] [0.102] [0.026] [0.019]LT -0.264∗∗∗ -0.218∗ -0.052∗∗ -0.055∗∗∗
[0.071] [0.123] [0.026] [0.021]Large cities -0.034 -0.075 -0.010 -0.067
[0.046] [0.160] [0.026] [0.138]Rest of Sweden -0.028 -0.066 -0.001 -0.159
[0.045] [0.155] [0.025] [0.135]Constant -2.751∗∗∗ -4.234∗∗∗ 13.865∗∗∗ 14.354∗∗∗
[0.137] [0.295] [0.054] [0.119]FE year yes yes yes yesFE firm no no no yesRE firm no yes no no
ln σ2u 0.879∗∗∗
[0.085]
Observations 16536 16536 16536 14717
Notes: Robust standard errors in brackets. ∗ p < 0.10, ∗∗ p < 0.05, ∗∗∗ p < 0.01.FE=fixed effects, RE=random effects, DiD=difference-in-difference estimator
22

6 Conclusion
The rapid growth of offshoring in production and service tasks that were previously pro-
duced domestically is a key feature of the global economy over the last three decades.
However, understanding how offshoring affects firms’ innovation and technical change re-
mains an important question in economics. Recent theoretical development and empirical
studies yield ambiguous conclusions. While one group of studies provides evidence sup-
porting important efficiency and specialization gains from this internal resource allocation,
other authors question the positive effects of offshoring and argue that separating the pro-
duction and development functions of a firm can undermine its innovation capacity and
hinder its productivity growth.
This paper contributes to the literature by performing an empirical investigation that
addresses some of the shortcomings in previous studies. We study the universe of manu-
facturing companies in an industrialized economy. The data allow us to observe the firms
and their employees over a 14 year period. By observing detailed business characteristics
for all companies in the economy, we are able to deal with both selection and simultaneity
issues, using a control group and appropriate econometric techniques.
There are two main results from our analysis of Swedish manufacturing firms. First,
without accounting for self-selection into offshoring and properly controlling for endo-
geneity, the estimates suggest that innovation, measured by patent applications and total
factor productivity, is an increasing functions of offshoring. Second, applying a matching
approach with a control group of similar firms, our estimates show that this positive link
is largely explained by self-selection and reverse causality. Controlling for both sources of
bias, we find no causal impact of offshoring on TFP. The positive impact of offshoring on
innovation remains, but at a low level of statistical significance.
Our results are consistent with the trade literature that finds that exporters are on
average more productive than other firms, and that self-selected exporters are more in-
novative. A growing number of studies fail to find strong evidence for positive effects of
exporting on firm performance.6 In line with these findings, we do not find evidence of a
strong causal relationship between offshoring and firms’ innovation and productivity once
6See for instance (Bernard & Jensen 1999, Manez-Castillejo, Rochina-Barrachina, Sanchis-Llopis et al.2009, Temouri, Vogel & Wagner 2013, Greenaway & Kneller 2007).
23

the endogeneity of the offshoring decision is considered in the empirical approach. Ar-
eas for future study may include assessing the relevance of this conclusion for companies
in different size classes, different industries, different offshoring destinations and different
ownership connections to foreign suppliers of intermediate inputs.
24
References
Abramovsky, L. & Griffith, R. (2006), ‘Outsourcing and offshoring of business services:
How important is ICT?’, Journal of the European Economic Association 4(2-3), 594–
601.
Acemoglu, D., Gancia, G. & Zilibotti, F. (2015), ‘Offshoring and directed technical
change’, American Economic Journal: Macroeconomics 7(3), 84–122.
Ackerberg, D. A., Caves, K. & Frazer, G. (2015), ‘Identification Properties of Recent
Production Function Estimators’, Econometrica 83, 2411–2451.
Ackerberg, D., Caves, K. & Frazer, G. (2006), Structural identification of production
functions, MPRA Paper 38349, University Library of Munich, Germany.
URL: https://ideas.repec.org/p/pra/mprapa/38349.html
Arellano, M. & Bond, S. (1991), ‘Some Tests of Specification for Panel Data: Monte Carlo
Evidence and an Application to Employment Equations’, Review of Economic Studies
58(2), 277–297.
Autor, D., Dorn, D., Hanson, G. H., Pisano, G., Shu, P. et al. (2016), Foreign competition
and domestic innovation: Evidence from US patents, National Bureau of Economic
Research.
Baldwin, R. (2016), The great convergence, Cambridge, MA: Harvard University Press.
Bernard, A. B., Fort, T. C., Smeets, V. & Warzynski, F. (2020), Heterogeneous global-
ization: Offshoring and reorganization, Technical report, National Bureau of Economic
Research.
Bernard, A. B. & Jensen, J. B. (1999), ‘Exceptional exporter performance: cause, effect,
or both?’, Journal of international economics 47(1), 1–25.
Blinder, A. S. (2006), ‘Offshoring: the next industrial revolution?’, Foreign Affairs pp. 113–
128.
Blinder, A. S. (2009), ‘How many US jobs might be offshorable?’, World Economics
10(2), 41.
Blinder, A. S. & Krueger, A. B. (2013), ‘Alternative measures of offshorability: A survey
approach’, Journal of Labor Economics 31(S1), S97–S128.
Bloom, N., Draca, M. & Van Reenen, J. (2016), ‘Trade induced technical change? The
impact of Chinese imports on innovation, IT and productivity’, Review of Economic
Studies 83(1), 87–117.
Blundell, R. & Bond, S. (1998), ‘Initial conditions and moment restrictions in dynamic
panel data models’, Journal of Econometrics 87(1), 115–143.
Bøler, E. A., Moxnes, A. & Ulltveit-Moe, K. H. (2015), ‘R&d, international sourcing, and
the joint impact on firm performance’, American Economic Review 105(12), 3704–39.
Branstetter, L., Chen, J.-R., Glennon, B., Yang, C.-H. & Zolas, N. (2017), Does offshoring
manufacturing harm innovation in the home country? evidence from taiwan and china,
Technical report, Working paper.
25

Branstetter, L. & Saggi, K. (2011), ‘Intellectual property rights, foreign direct investment
and industrial development’, The Economic Journal 121(555), 1161–1191.
Castellani, D. & Pieri, F. (2013), ‘R&d offshoring and the productivity growth of european
regions’, Research Policy 42(9), 1581–1594.
Chung, W. & Yeaple, S. (2008), ‘International knowledge sourcing: Evidence from us firms
expanding abroad’, Strategic Management Journal 29(11), 1207–1224.
Coase, R. H. (1937), ‘The nature of the firm’, Economica 4(16), 386–405.
Dachs, B., Ebersberger, B., Kinkel, S. & Som, O. (2015), ‘The effects of production
offshoring on r&d and innovation in the home country’, Economia e Politica Industriale
42(1), 9–31.
Feenstra, R. C. & Hanson, G. H. (1999), ‘The impact of outsourcing and high-technology
capital on wages: Estimates for the United States, 1979–1990’, Quarterly Journal of
Economics 114(3), 907–940.
Feenstra, R. C. & Hanson, G. H. (2003), ‘Global production sharing and rising inequality:
A survey of trade and wages’, Handbook of International Trade 1, 146–85.
Frey, C. B. & Osborne, M. A. (2017), ‘The future of employment: How susceptible are
jobs to computerisation?’, Technological Forecasting and Social Change 114, 254 – 280.
URL: http://www.sciencedirect.com/science/article/pii/S0040162516302244
Fritsch, U. & Gorg, H. (2015), ‘Outsourcing, Importing and Innovation: Evidence
from Firm-level Data for Emerging Economies’, Review of International Economics
23(4), 687–714.
Greenaway, D. & Kneller, R. (2007), ‘Firm heterogeneity, exporting and foreign direct
investment’, The Economic Journal 117(517), F134–F161.
Grossman, G. M. & Helpman, E. (1991), ‘Trade, knowledge spillovers, and growth’, Eu-
ropean Economic Review 35(2-3), 517–526.
Grossman, G. M. & Rossi-Hansberg, E. (2008), ‘Trading tasks: A simple theory of off-
shoring’, American Economic Review 98(5), 1978–97.
Hummels, D., Jørgensen, R., Munch, J. & Xiang, C. (2014), ‘The wage effects of off-
shoring: Evidence from Danish matched worker-firm data’, American Economic Review
104(6), 1597–1629.
Hurtado-Torres, N. E., Aragon-Correa, J. A. & Ortiz-de Mandojana, N. (2017), ‘How does
R&D internationalization in multinational firms affect their innovative performance?
The moderating role of international collaboration in the energy industry’, International
Business Review .
Iacus, S. M., King, G. & Porro, G. (2012), ‘Causal inference without balance checking:
Coarsened exact matching’, Political Analysis 20(1), 1–24.
Leamer, E. & Storper, M. (2001), “‘the economic geography of the internet age”wp 8450’.
Levinsohn, J. & Petrin, A. (2003), ‘Estimating Production Functions Using Inputs to
Control for Unobservables’, Review of Economic Studies 70(2), 317–341.
26

Manez-Castillejo, J. A., Rochina-Barrachina, M. E., Sanchis-Llopis, J. A. et al. (2009),
‘Self-selection into exports: productivity and/or innovation?’, Applied Economics Quar-
terly 55(3), 219.
Manjon, M. & Manez, J. (2016), ‘Production function estimation in Stata using the
Ackerberg–Caves–Frazer method’, Stata Journal 16(4), 1046–1059.
URL: https://ideas.repec.org/a/tsj/stataj/v16y2016i4p1046-1059.html
Mollisi, V. & Rovigatti, G. (2017), Theory and Practice of TFP Estimation: the Control
Function Approach Using Stata, CEIS Research Paper 399, Tor Vergata University,
CEIS.
URL: https://ideas.repec.org/p/rtv/ceisrp/399.html
Nagaoka, S., Motohashi, K. & Goto, A. (2010), Patent statistics as an innovation indicator,
in ‘Handbook of the Economics of Innovation’, Vol. 2, Elsevier, pp. 1083–1127.
Naghavi, A. & Ottaviano, G. (2009), ‘Offshoring and product innovation’, Economic The-
ory 38(3), 517–532.
Olley, G. S. & Pakes, A. (1996), ‘The Dynamics of Productivity in the Telecommunications
Equipment Industry’, Econometrica 64(6), 1263–1297.
Olsen, K. B. (2006), Productivity Impacts of Offshoring and Outsourcing: A Review,
OECD Science, Technology and Industry Working Papers 2006/1, OECD Publishing.
URL: https://ideas.repec.org/p/oec/stiaaa/2006-1-en.html
Pierce, J. R. & Schott, P. K. (2012), ‘A concordance between ten-digit US Harmonized
System Codes and SIC/NAICS product classes and industries’, Journal of Economic
and Social Measurement 37(1, 2), 61–96.
Porter, M. E. (1985), Competitive advantage: Creating and sustaining superior perfor-
mance, Free Press, New York and London.
Rosenbaum, P. R. & Rubin, D. B. (1984), ‘Reducing bias in observational studies using
subclassification on the propensity score’, Journal of the American Statistical Associa-
tion 79(387), 516–524.
Rubin, D. B. (1997), ‘Estimating causal effects from large data sets using propensity
scores’, Annals of Internal Medicine 127(8 Part 2), 757–763.
Steinberg, P. J., Procher, V. D. & Urbig, D. (2017), ‘Too much or too little of r&d
offshoring: The impact of captive offshoring and contract offshoring on innovation per-
formance’, Research Policy 46(10), 1810–1823.
Temouri, Y., Vogel, A. & Wagner, J. (2013), ‘Self-selection into export markets by busi-
ness services firms–evidence from france, germany and the united kingdom’, Structural
Change and Economic Dynamics 25, 146–158.
Tingvall, P. G. & Karpaty, P. (2011), ‘Service-sector competition, innovation and r&d’,
Economics of Innovation and New Technology 20(1), 63–88.
Van Beveren, I., Bernard, A. B. & Vandenbussche, H. (2012), Concording EU trade and
production data over time, Technical report, National Bureau of Economic Research.
27

Vernon, R. (1966), ‘International trade and international investment in the product cycle’,
Quarterly Journal of Economics 80(2), 190–207.
Wooldridge, J. M. (2009), ‘On estimating firm-level production functions using proxy
variables to control for unobservables’, Economics Letters 104(3), 112–114.
Yamashita, N. & Yamauchi, I. (2019), ‘The effects of offshore production on onshore
innovation: Evidence from Japanese multinationals’, Research Policy 48(9), 103836.
28

Appendix
29

Tab
le8:
Var
iab
led
efin
itio
ns
Variable
Measu
re
Definition
Innov
ati
on
dum
my
Dic
hoto
mous
vari
able
of
pate
nti
ng
(pate
nti
ng=
1;
0,
oth
erw
ise)
TF
Pco
nti
nuous
Calc
ula
ted
acc
ord
ing
toW
oold
ridge
(2009)’
sappro
ach
Hum
an
capit
al
conti
nuous,
rela
tive
Rati
oof
univ
ersi
ty-e
duca
ted
work
ers
toto
tal
emplo
ym
ent
Skill
pre
miu
mco
nti
nuous,
rela
tive
Avg.
wage
rati
oof
univ
ersi
ty-e
duca
teto
non-u
niv
ersi
tyed
uca
ted
work
ers
Off
shori
ng
conti
nuous
Monet
ary
valu
eof
the
inte
rmed
iate
goods
imp
ort
edO
ffsh
ori
ng
tor
conti
nuous,
rela
tive
Rati
oof
the
monet
ary
valu
eof
the
imp
ort
edin
term
edia
tegoods
from
regio
nr
toto
tal
inte
rmed
iate
imp
ort
sP
ote
nti
al
off
shora
bilit
yco
nti
nuous
Fra
ctio
nof
off
shora
ble
jobs,
calc
ula
ted
as
the
Blinder
&K
rueg
er(2
013)
index
Work
ers’
abilit
yco
nti
nuous
Avg.
work
forc
eabilit
y,ca
lcula
ted
as
the
Min
cer
resi
dual
Auto
mati
on
pote
nti
al
conti
nuous
Fra
ctio
nof
pote
nti
ally
auto
mate
djo
bs,
calc
ula
ted
as
the
Fre
y&
Osb
orn
e(2
017)
index
Fir
msi
zedis
cret
eD
efined
over
five
gro
ups
dep
endin
gon
the
num
ber
of
emplo
yee
sO
wner
ship
cate
gory
dis
cret
eD
efined
over
four
cate
gori
esatt
endin
gto
owner
ship
’sori
gin
(dom
esti
cvs.
fore
ign)
and
typ
eof
busi
nes
sen
tity
(non-a
ffiliate
d,
UN
E,
MN
E)
Tec
hnolo
gy
gro
up
dis
cret
eD
efined
over
four
cate
gori
es(h
igh,
med
ium
-hig
h,
med
ium
-low
,lo
w)
att
endin
gto
R&
Dand
hum
an
capit
al
inte
nsi
tyF
irm
loca
tion
dis
cret
eD
efined
over
thre
eca
tegori
esatt
endin
gto
popula
tion
den
sity
(Met
rop
olita
nare
a,
larg
eci
ties
,re
stof
Sw
eden
)Tablenotes:
Continuousvariablesare
abso
lute
measu
resexceptin
dicate
doth
erw
ise.
30