The impact of mining conditions on mechanized mining ... · PDF filemaintenance by the...
10
J o u r n a l P a p e r Mining severity Advances in technology in mining have resulted in general improvements in mining conditions, especially in the fields of ventilation, mechanized mining equipment and drilling and blasting techniques. Unfortunately, many of the operating mines are designed around less efficient technologies such as handheld drilling resulting in irregular tunnel dimensions, uneven footwall conditions and poor fragmentation in drawpoints. Despite improvements over the past few years, many mining methods require operating in areas where established workshops are located far away from the production environment. Mining severity can be described as any conditions underground that may result in a reduction in safe working conditions, decrease in productivity or reduction in machine life. By addressing these issues and improving the availability and utilization of the mechanized mining equipment, there can be significant improvements in productivity and ultimately a reduction in overall cost per ton. Accident damage caused as a result of mining conditions and operator in efficiency is an often controversial and relationship damaging spin-off in any MARC contract. For example, an early life failure on a component such as an axle could be attributed to operating in extreme conditions, or could be as a result of product defect or poor maintenance practice. Therefore in order to minimize confrontation, all areas affecting on accident damage are covered in the severity audit. Some common conditions affecting on poor equipment performance are as follows: ➤ Workshops—size, location, tooling, lighting, drainage, contamination control ➤ Ventilation—cooling, visibility, operator efficiency ➤ Haulages—dimensions, clearance, obstructions, footwall, drainage, water, gradients ➤ Haul distance—drawpoint to tip, ramp tramming ➤ Maintenance practice—planning, mechanical skills, servicing on time, fluid analysis The impact of mining conditions on mechanized mining efficiency by D.J. Callow* Synopsis A maintenance and repair contract (MARC) provides the customer a zero risk opportunity to own and operate a fleet of mechanized equipment and guarantees the life and mechanical availability of the equipment on a cost per hour basis over the life of the machine. One of the biggest challenges to any MARC contract is a change in the severity of the mining conditions. This has a two-pronged effect: one, the life of the components of the machines can be signif- icantly reduced, causing components to fail prematurely. This increases the dealer cost of the contract to an amount higher than the guaranteed amount. Secondly, the customer will be affected by severe conditions underground by the loss of efficiency and ultimately productivity, which drives up the cost per ton of the operation. A negative spin-off of poor mining conditions is an increase in accident damage on mechanized machines. Therefore an increase in severity impacts on the machine cost per hour (affecting the dealer) and productivity decreases and increase in accident damage (affecting the customer) result in a lose-lose situation for both parties. A severity index has been developed, strongly based on the Caterpillar Underground site severity index which looks at the impact of mining conditions on component life and ‘derates’ the life of the component accordingly. Although this is not new to the mining industry, the ‘buy-in’ from the customer and subsequent team-based approach by mining, engineering and the supplier to improve the severity is ground-breaking. This promotes a partnership approach to improving productivity whereby poor maintenance by the supplier or poor mining conditions result in penalties to the MARC contract. Most importantly, and an area that has turned out to be the biggest win-win of this exercise, is that on a monthly basis each MARC site is audited by a team comprising accountable mine personnel, ventilation, operator trainers and dealer personnel in a detailed, measurable audit that identifies and highlights areas that will result in productivity losses. Corrective action is put in place that can not only reduce the MARC rate over time, but also significantly improve productivity on the mine site. * Barloworld Equipment. © The Southern African Institute of Mining and Metallurgy, 2006. SA ISSN 0038–223X/3.00 + 0.00. This paper was first published at the SAIMM Colloquium, The Second Underground Operators Conference, 11–12 September 2006.. 821 The Journal of The Southern African Institute of Mining and Metallurgy VOLUME 106 NON-REFEREED PAPER DECEMBER 2006 ▲
Transcript of The impact of mining conditions on mechanized mining ... · PDF filemaintenance by the...

Journal
Paper
Mining severity
Advances in technology in mining haveresulted in general improvements in miningconditions, especially in the fields ofventilation, mechanized mining equipment anddrilling and blasting techniques.Unfortunately, many of the operating minesare designed around less efficient technologiessuch as handheld drilling resulting in irregular
tunnel dimensions, uneven footwall conditionsand poor fragmentation in drawpoints. Despiteimprovements over the past few years, manymining methods require operating in areaswhere established workshops are located faraway from the production environment.
Mining severity can be described as anyconditions underground that may result in areduction in safe working conditions, decreasein productivity or reduction in machine life. Byaddressing these issues and improving theavailability and utilization of the mechanizedmining equipment, there can be significantimprovements in productivity and ultimately areduction in overall cost per ton.
Accident damage caused as a result ofmining conditions and operator in efficiency isan often controversial and relationshipdamaging spin-off in any MARC contract. Forexample, an early life failure on a componentsuch as an axle could be attributed tooperating in extreme conditions, or could be asa result of product defect or poor maintenancepractice. Therefore in order to minimizeconfrontation, all areas affecting on accidentdamage are covered in the severity audit.
Some common conditions affecting on poorequipment performance are as follows:
➤ Workshops—size, location, tooling,lighting, drainage, contamination control
➤ Ventilation—cooling, visibility, operatorefficiency
➤ Haulages—dimensions, clearance,obstructions, footwall, drainage, water,gradients
➤ Haul distance—drawpoint to tip, ramptramming
➤ Maintenance practice—planning,mechanical skills, servicing on time,fluid analysis
The impact of mining conditions onmechanized mining efficiencyby D.J. Callow*
Synopsis
A maintenance and repair contract (MARC) provides thecustomer a zero risk opportunity to own and operate a fleet ofmechanized equipment and guarantees the life and mechanicalavailability of the equipment on a cost per hour basis over the life ofthe machine.
One of the biggest challenges to any MARC contract is a changein the severity of the mining conditions. This has a two-prongedeffect: one, the life of the components of the machines can be signif-icantly reduced, causing components to fail prematurely. Thisincreases the dealer cost of the contract to an amount higher thanthe guaranteed amount. Secondly, the customer will be affected bysevere conditions underground by the loss of efficiency andultimately productivity, which drives up the cost per ton of theoperation. A negative spin-off of poor mining conditions is anincrease in accident damage on mechanized machines. Therefore anincrease in severity impacts on the machine cost per hour (affectingthe dealer) and productivity decreases and increase in accidentdamage (affecting the customer) result in a lose-lose situation forboth parties.
A severity index has been developed, strongly based on theCaterpillar Underground site severity index which looks at theimpact of mining conditions on component life and ‘derates’ the lifeof the component accordingly. Although this is not new to themining industry, the ‘buy-in’ from the customer and subsequentteam-based approach by mining, engineering and the supplier toimprove the severity is ground-breaking. This promotes apartnership approach to improving productivity whereby poormaintenance by the supplier or poor mining conditions result inpenalties to the MARC contract. Most importantly, and an area thathas turned out to be the biggest win-win of this exercise, is that ona monthly basis each MARC site is audited by a team comprisingaccountable mine personnel, ventilation, operator trainers anddealer personnel in a detailed, measurable audit that identifies andhighlights areas that will result in productivity losses. Correctiveaction is put in place that can not only reduce the MARC rate overtime, but also significantly improve productivity on the mine site.
* Barloworld Equipment.© The Southern African Institute of Mining and
Metallurgy, 2006. SA ISSN 0038–223X/3.00 +0.00. This paper was first published at the SAIMMColloquium, The Second Underground OperatorsConference, 11–12 September 2006..
821The Journal of The Southern African Institute of Mining and Metallurgy VOLUME 106 NON-REFEREED PAPER DECEMBER 2006 ▲
The impact of mining conditions on mechanized mining efficiency
➤ Operator efficiency—training, motivation, salary,incentives.
One of the challenges in determining mining severity isthe divergence between engineering, mining and suppliers.Clearly suppliers and engineering departments understandthe relevance of timely and regular planned maintenance onthe machines, whereas disparity between a supplier andengineering occurs in underground transport and cage andshaft delays. Mining and engineering departments have beenincompatible since the dawn of mining. Production at allcosts from mining personnel clashes with scheduledmaintenance of machines, while shaft schedules oftenobstruct critical men and material transport for optimizingproduction. Fortunately, through teamwork and communi-cation many of these obstacles can be overcome with theoverriding intent to produce a ton of ore at the lowestpossible cost. This should be the principal focus inimplementing a severity audit process in a mining operation.
The key issues above affect in different ways the majorcomponents of a machine and this relationship betweengeneral severity factors and explicit factors affecting specificparts of the machine are discussed in more detail in thefollowing sections.
Calculation of a MARC rate
Before analysing the calculation of a MARC rate, it isnecessary to determine why a mining customer wouldoutsource the management of mechanized equipment to anoriginal equipment manufacturer (OEM). In essence theMARC contract offers a zero-risk option for customerswhereby an OEM will guarantee the maintenance and repairrate on an hourly basis over the life of the machine.Generally measured in hours, the MARC contract in anunderground environment can run from 27000–30000 hours.A guaranteed hourly rate enables the customer to track cashflows on mechanized equipment (often a significantcontributor to overall mining operational costs) over theequipment life. From an OEM perspective, guaranteeing thecost per hour and ultimately carrying all the risk of early lifecomponent failures, the trade-off is a captured parts marketshare on the contracts and, depending upon performance,increased machine market share. In terms of a typical MARCcontract, the overall billed revenue of a MARC contract for asingle machine could be in the region 3.5:1, maintenancecost: initial capital purchase.
The determination of a MARC rate is a structured process,with two major factors affecting on the overall rate. Firstlysoftware is used to build up a price file for the specificmachine from base principles using individual part numbers.
In order to provide the most benefit to the customer, allmajor components are priced according to world classbenchmarks before failure. This ratio is 80% of allcomponents failing before failure, 20% after failure. In otherwords the OEM will guarantee that 80% of all componentswill be changed out at end of life before failure, with theremaining 20% after failure repairs. The advantage to thecustomer of this ratio is that the cost of a before failure repairis typically 60–70% of an after failure repair as Figure 2indicates.
In terms of a $50 000 engine, a before failure savingincorporated into the MARC rate would indicate significantsavings over the life of the MARC contract. In this case, twoengines would indicate a saving of $20000–$30000 over a30 000 hour period, or $1 per hour. Taking the transmission,torque converter, final drives and engine into account, thiscould relate into a cost per hour saving of upwards of $6–10per hour. The challenge for the OEM is to ensure that thisratio is maintained, as anything less than achieving the 80%target will result in additional costs against the contract forthe OEM account. Compared this to the overall revenue, thiscould constitute an additional 23% of costs attributable to theOEM, whereby machine costs exceeding revenue earnedresult in a loss situation.
The second focus of building a MARC rate is to identifythe planned component life and severity the machine will gothrough during its life. The component life calculation isestimated from historical data, experience from similaroperations and CAT data sheets. Once a component life isestimated, this forms an essential part of the MARC rate. Anincorrect estimation at this stage can result in huge cost over-runs and large liability for the OEM. For example, a rear axleplanned to last 8 000 hours between change-outs will requireone change out in 15 000 hours. Therefore a budget of $20 000 would be inserted into the cost build-up, which is abefore failure change-out. If the component life lasts only 6 000 hours, then this will result in two axle change outs asopposed to a single change-out, or an additional $20 000unbudgeted, resulting in $1.33 per hour. To amplify thispotential loss situation, if the axle lasts 6 000 hours andexperiences a catastrophic failure, then the repair cost couldbe doubled, equating to $2.60 per hour.
▲
822 DECEMBER 2006 VOLUME 106 NON-REFEREED PAPER The Journal of The Southern African Institute of Mining and Metallurgy
Figure 1—MARC rate build process

While these amounts may appear insignificant inisolation, fleets of 30–40 machines poorly managed, wherecomponents fail prematurely can result in deficits againstinitial budget of up to $1.5 million or more. This liability isheightened on larger surface machines and larger fleets. If, asdiscussed, the strategic aim of a MARC contract is to offer aguaranteed hourly rate over the machine life, the reputationand balance sheet of the OEM can be seriously affected
So, how do we accurately predict component life? Toolsfor predicting the severity of the mining conditions are usedup front to determine whether the historical component lifewill be attained. (See Figure 3.)
Time taken up front to determine accurate rates is all toooften neglected or subsidized to win new business, a mistakethat will live with the OEM for the extent of the MARCcontract.
In the case of a greenfield operation, estimating severityremains a theoretical exercise, whereas in an existing orbrownfield operation this can be determined more accurately.Unfortunately mining is dynamic and, depending uponcommodity prices and cut-off grades, often dictates movinginto previously mined areas as do certain mining methods,cut and fill, VCR, etc. As in opencast mining, the longer thecontract extends the greater the depth of the operation and
usually the distance away from the workshops, and this isnormally not taken into account when calculating a MARCrate.
While MARC rates are calculated on a cost per hour basis,these operational costs can be transformed into a productivitymeasure, such as cost per ton. This cost per ton measure, aswill be proved later on in this paper, is significantly affectedby factors such as payload (linked to fragmentation),operator efficiency and cycle times as opposed to the morefrequently measured factors such as oil consumption, up-front capital cost and MARC repair rates. In an attempt toprove this, the last section in this paper looks at a sensitivityanalysis on a typical underground haul profile. These produc-tivity measures discussed above are all linked to mineseverity and therefore the identification and rectifying ofsome of the mine severity factors will result in better produc-tivity. With OEMs being paid on machine utilization, in otherwords engine operating hours, it is in the interests of allpartners to improve the productivity. The increase in machineoperating hours, providing that the machine is used withindesign parameters, offers additional turnover on the OEMMARC contract and an exponential increase in terms of tonsof rock moved.
The impact of mining conditions on mechanized mining efficiencyJournal
Paper
823The Journal of The Southern African Institute of Mining and Metallurgy VOLUME 106 NON-REFEREED PAPER DECEMBER 2006 ▲
Figure 2—Predictive component failure
Figure 3—Component life forecasting tool
The impact of mining conditions on mechanized mining efficiency
Severity audit—a measurement tool
Severity audits are not a recent invention. Original equipmentmanufacturers have long recognized the link betweenextreme mining conditions and lower productivity. In mostcases, particularly in Africa, there is a resistance torecognition of the production capability of the machineversus the capital outlay of the equipment. This is partly dueto the fact that there are very few instances where machinesare operated to design parameters in terms of tons per hourcapability and also a misunderstanding of the link andsubsequent efficiency improvements between cost andproductivity. It is the responsibility of any OEM to try toassist the mine in improving the uptime, or availability andreliability (mean time between failure and mean time torepair) of the machine as part of the contractual conditions ofany MARC contract. The logical path to this, however, is veryoften less travelled and this is for the OEM to assist inidentifying and mitigating the risks in obstacles outside ofthe repair and maintenance arena to improving productivity.
The severity audit tool is a natural progression of thisand this is where the value add of this whole process comesinto play. The audit is separated into three main areas:
➤ Workshops➤ General operating factors➤ Component operating factors.
General operating factors are the ambient miningconditions affecting the overall potential to reduce produc-tivity, whereas component operating factors look at specificmining severity that has an impact on the major componentsof the machines, namely:
➤ Engine➤ Torque converter/transmission ➤ Axles, differentials, final drives, frame, brakes➤ Hydraulic system.
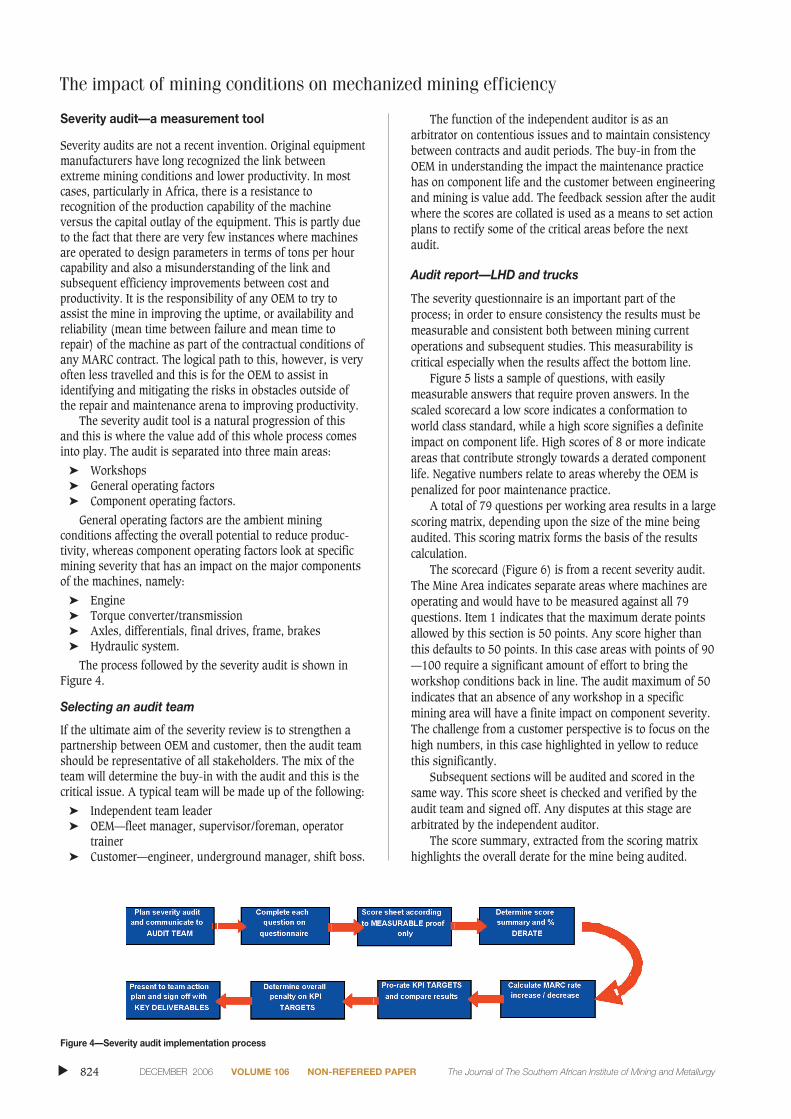
The process followed by the severity audit is shown inFigure 4.
Selecting an audit team
If the ultimate aim of the severity review is to strengthen apartnership between OEM and customer, then the audit teamshould be representative of all stakeholders. The mix of theteam will determine the buy-in with the audit and this is thecritical issue. A typical team will be made up of the following:
➤ Independent team leader ➤ OEM—fleet manager, supervisor/foreman, operator
trainer➤ Customer—engineer, underground manager, shift boss.
The function of the independent auditor is as anarbitrator on contentious issues and to maintain consistencybetween contracts and audit periods. The buy-in from theOEM in understanding the impact the maintenance practicehas on component life and the customer between engineeringand mining is value add. The feedback session after the auditwhere the scores are collated is used as a means to set actionplans to rectify some of the critical areas before the nextaudit.
Audit report—LHD and trucks
The severity questionnaire is an important part of theprocess; in order to ensure consistency the results must bemeasurable and consistent both between mining currentoperations and subsequent studies. This measurability iscritical especially when the results affect the bottom line.
Figure 5 lists a sample of questions, with easilymeasurable answers that require proven answers. In thescaled scorecard a low score indicates a conformation toworld class standard, while a high score signifies a definiteimpact on component life. High scores of 8 or more indicateareas that contribute strongly towards a derated componentlife. Negative numbers relate to areas whereby the OEM ispenalized for poor maintenance practice.
A total of 79 questions per working area results in a largescoring matrix, depending upon the size of the mine beingaudited. This scoring matrix forms the basis of the resultscalculation.
The scorecard (Figure 6) is from a recent severity audit.The Mine Area indicates separate areas where machines areoperating and would have to be measured against all 79questions. Item 1 indicates that the maximum derate pointsallowed by this section is 50 points. Any score higher thanthis defaults to 50 points. In this case areas with points of 90—100 require a significant amount of effort to bring theworkshop conditions back in line. The audit maximum of 50indicates that an absence of any workshop in a specificmining area will have a finite impact on component severity.The challenge from a customer perspective is to focus on thehigh numbers, in this case highlighted in yellow to reducethis significantly.
Subsequent sections will be audited and scored in thesame way. This score sheet is checked and verified by theaudit team and signed off. Any disputes at this stage arearbitrated by the independent auditor.
The score summary, extracted from the scoring matrixhighlights the overall derate for the mine being audited.
▲
824 DECEMBER 2006 VOLUME 106 NON-REFEREED PAPER The Journal of The Southern African Institute of Mining and Metallurgy
Figure 4—Severity audit implementation process

In Figure 7, the first two rows highlight the scoresachieved in the overall general operating conditions. Themaximum score is averaged across the mining areas to amaximum of 5% for each category.
Maximum scores in each of the component operatingconditions are as follows:
➤ Engine 20%➤ Transmission / torque converter 20%➤ Axle, diffs, final drives, frames 40%➤ Hydraulic system 10%.
This, added to general operating conditions (5%) andworkshop conditions (5%) makes up the total scoringsystem.
General operating conditions affect all componentoperating areas as can be seen from Figure 7. The resultrelates to a total derate of 25% on the overall audit. Theresults sheet in Figure 8 is fairly complex and looks at anumber of measurable key performance indicators (KPIs)defined by contractual targets on the MARC site. These arejointly agreed upon and measured as part of the audit.
The final section analyses the impact of severity on theoverall MARC rate as well as the impact on KPIs andsubsequent penalties against the OEM for not achievingadjusted contractual targets.
In the matrix in Figure 8, numbered icons highlight someof the salient points. These are discussed in more detailbelow.
The impact of mining conditions on mechanized mining efficiencyJournal
Paper
The Journal of The Southern African Institute of Mining and Metallurgy VOLUME 106 NON-REFEREED PAPER DECEMBER 2006 825 ▲
Figure 5—Severity audit questionnaire—workshops
Figure 6—Score sheet for workshops section
Concrete flooringMeans of egress & ingressPit or rampNumber of units per pit/rampOil dispensing facility (contamination free)Overhead lifting equipment (certified) where requiredAdequate lightning in working areasPressurized water and separate wash bayCompressed air availableLock up facilities for tooling, spares and documentsElectricity to handle welding equipment and electrical toolsUnderground communications to workshopFuel dispensing equipment (contamination free)Noise level signageSuitable tools availableWorkshop equipment availableWelding bay (fully equipped)Workshop ventilation/ambiant temperature conditionsGas cylinder storageWaste oil management

The impact of mining conditions on mechanized mining efficiency
▲
826 DECEMBER 2006 VOLUME 106 NON-REFEREED PAPER The Journal of The Southern African Institute of Mining and Metallurgy
Figure 7—Scoring summary per component
Figure 8—Final derate, KPI and penalty tables
1
2
3 4 5 6 7 8 9
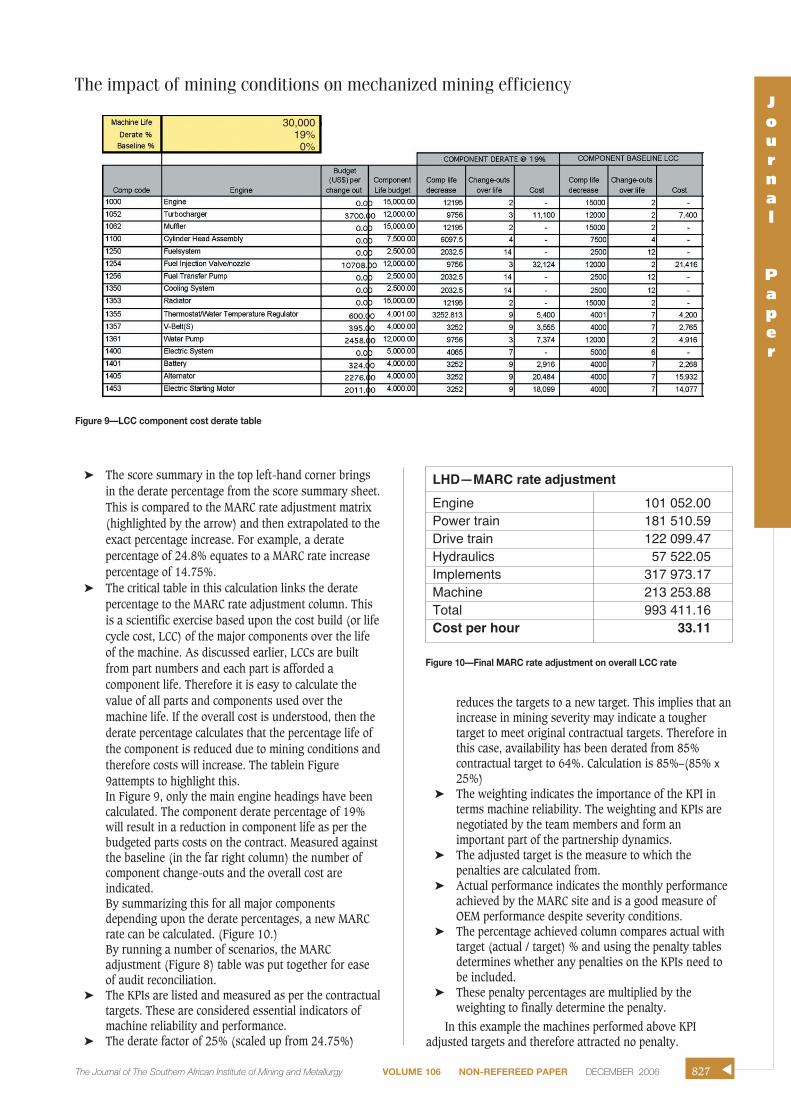
➤ The score summary in the top left-hand corner bringsin the derate percentage from the score summary sheet.This is compared to the MARC rate adjustment matrix(highlighted by the arrow) and then extrapolated to theexact percentage increase. For example, a deratepercentage of 24.8% equates to a MARC rate increasepercentage of 14.75%.
➤ The critical table in this calculation links the deratepercentage to the MARC rate adjustment column. Thisis a scientific exercise based upon the cost build (or lifecycle cost, LCC) of the major components over the lifeof the machine. As discussed earlier, LCCs are builtfrom part numbers and each part is afforded acomponent life. Therefore it is easy to calculate thevalue of all parts and components used over themachine life. If the overall cost is understood, then thederate percentage calculates that the percentage life ofthe component is reduced due to mining conditions andtherefore costs will increase. The tablein Figure9attempts to highlight this.In Figure 9, only the main engine headings have beencalculated. The component derate percentage of 19%will result in a reduction in component life as per thebudgeted parts costs on the contract. Measured againstthe baseline (in the far right column) the number ofcomponent change-outs and the overall cost areindicated.By summarizing this for all major componentsdepending upon the derate percentages, a new MARCrate can be calculated. (Figure 10.)By running a number of scenarios, the MARCadjustment (Figure 8) table was put together for easeof audit reconciliation.
➤ The KPIs are listed and measured as per the contractualtargets. These are considered essential indicators ofmachine reliability and performance.
➤ The derate factor of 25% (scaled up from 24.75%)
reduces the targets to a new target. This implies that anincrease in mining severity may indicate a toughertarget to meet original contractual targets. Therefore inthis case, availability has been derated from 85%contractual target to 64%. Calculation is 85%–(85% x25%)
➤ The weighting indicates the importance of the KPI interms machine reliability. The weighting and KPIs arenegotiated by the team members and form animportant part of the partnership dynamics.
➤ The adjusted target is the measure to which thepenalties are calculated from.
➤ Actual performance indicates the monthly performanceachieved by the MARC site and is a good measure ofOEM performance despite severity conditions.
➤ The percentage achieved column compares actual withtarget (actual / target) % and using the penalty tablesdetermines whether any penalties on the KPIs need tobe included.
➤ These penalty percentages are multiplied by theweighting to finally determine the penalty.
In this example the machines performed above KPIadjusted targets and therefore attracted no penalty.
The impact of mining conditions on mechanized mining efficiencyJournal
Paper
The Journal of The Southern African Institute of Mining and Metallurgy VOLUME 106 NON-REFEREED PAPER DECEMBER 2006 827 ▲
Figure 9—LCC component cost derate table
Figure 10—Final MARC rate adjustment on overall LCC rate
LHD—MARC rate adjustment
Engine 101 052.00Power train 181 510.59Drive train 122 099.47Hydraulics 57 522.05Implements 317 973.17Machine 213 253.88Total 993 411.16Cost per hour 33.11
30,00019%0%

The impact of mining conditions on mechanized mining efficiency
Impact of site severity on machine productivityThe first part of this paper identified a method of determiningthe severity of the mining conditions when compared tocomponent life. This increase in severity does not take intoaccount the improvements in productivity that can beachieved as working conditions improve.
This section analyses the relationship between miningconditions and productivity improvements. In order toascertain how severity affects the productivity of a machine,Caterpillar software was used to determine a number of real-life scenarios found in most underground miningenvironments. From this a sensitivity analysis was carriedout to determine an increase/decrease in productivity due toseverity.
Major areas looked at were as follows:➤ Tramming distances—excess of 300 metres (round
trip)➤ Bucket fill factors—< 90%➤ Tunnel dimension, roadway conditions—measured by
limiting loader speed➤ Operator efficiency—measured in utilized time per
hour.A typical underground mining operation set-up,
drawpoint to tip arrangement was used as an example. A 10 tcapacity underground loader was used, with the followingparameters:
Machine type: 10 t capacity front end loaderTarget availability: 85%Load time: 20 secondsHours per annum: 8760 (equates to 24 x 7 operationHaul road profile: Drawpoint to crosscut 25 metres
Cross-cut 100 metresCross-cut to tip 25 metresTotal haul (one way) 150 metresTotal cycle 300 metres
Material: Loose density = 1 900 kg/m3
Bank density = 2 700 kg/m3
Cycle time: Load with exchange 0.50 minutesHaul (loaded) 0.73 minutesDump and maneuver 0.30 minutesReturn (empty) 0.73 minutesTotal cycle time 2.26 minutes
Fill factor: 95% of overall SAE rated capacityOperator efficiency: 83% (calculated as operating 50
minutes in every hour, or 20 hoursper day)
Production per hour: 159 tons per hour (based uponabove assumption)
This set-up above lists a good underground set-up, goodunderfoot conditions with attainable underground speeds of10 km/h in drawpoints and cross-cuts. This equates to themachine able to operate at all times in second/third gear.
From the theoretical analysis, production studies as partof the results from the severity audits can be input into thesame model (assuming that the haul distances are modelledon the actual underground conditions).
The following example takes the above haul profile,machine and availability profiles and actual undergroundutilization figures to determine the current production output.
Cycle time Load with exchange 0.70 minutes1
Haul (loaded) 1.25 minutesDump and maneuver 0.30 minutes
▲
828 DECEMBER 2006 VOLUME 106 NON-REFEREED PAPER The Journal of The Southern African Institute of Mining and Metallurgy
Figure 11—Cost per ton relationship on productivity improvement

Return (empty) 1.25 minutesTotal cycle time 3.50 minutes
Fill factor: 95% of overall SAE rated capacityOperator efficiency: 67% (calculated as operating 40
minutes in every hour, or 16 hoursutilization per day)
Production per hour: 83 tons per hour (based upon aboveassumptions)
1Increased load time due to poor fragmentation
In this example, the productivity has almost halved bychanging the roadways to realistic underground conditionsand changing utilization from 20 hours to 16 hours per 24hour period. By careful collaboration, these areas are simpleto look at and rectify, thus significantly increasing theefficiency of the operation. This example indicates that oneloader can mine the same tonnage in this operation thatwould normally require two loaders working solely due tomining condition.
Sensitivity analysis
By taking the base case productivity scenario of 159 tons perhour, the following section identifies areas of severity andthe subsequent impact on productivity. Through hundreds ofproduction studies, a generic scorecard has been produced byCaterpillar that examines the relationship between costs andtonnages. What this exercise will show is that the oftenfanatical focus on input costs such as machine pricing, repairrate, and oil consumption, all too often neglects the produc-tivity measures such as operator efficiency and cycle times(affected by road conditions) that have a major impact onproductivity improvement. (Figure 11.)
This section examines the sensitivity of a number ofinput conditions on productivity using the same parametersas the base case example. Parameters looked at are
➤ Poor roadway conditions (affecting cycle time)➤ Operator efficiency➤ Mechanical availability.
The impact of mining conditions on mechanized mining efficiencyJournal
Paper
The Journal of The Southern African Institute of Mining and Metallurgy VOLUME 106 NON-REFEREED PAPER DECEMBER 2006 829 ▲
Figure 12—Cost per ton v s.haulage conditions
Figure 13—Cost per ton v s.operator efficiency
Figure 14—Cost per ton v s.mechanical availability
0 2 4 6 8 10 12 14 16 18 20 22 24 26 28 30
Speed (kph)
30.000
20.000
10.000
0
Gear 1Gear 2Gear 3Gear 4
Severity Maximum Cycle time Payload Operator Tonnes Annual loader Cost per % increaseGear (mins) capacity efficiency annually cost ($US) ton ($US) cost/t
Base case 3rd - 10 km/hr 2.26 95% 83% 1,378,674 $ 309,009 0.22
Moderate severity 2nd - 8 km/hr 3.29 95% 83% 716,327 $ 309,009 0.43 92%
High severity 1st - 4 km/hr 5.52 95% 83% 571,433 $ 309,009 0.54 141%
Severity Utilisation Operator Cycle time Payload Tonnes Annual loader Cost per % increaseper 24 hours efficiency (mins) capacity annually cost ($US) ton ($US) cost/t
Base case 20 83% 2.26 95% 1,378,674 $ 309,009 0.22
Moderate severity 19 78% 2.26 95% 1,295,621 $ 309,009 0.24 6%
High severity 18 73% 2.26 95% 1,212,568 $ 309,009 0.25 7%
Severity Available % Cycle time Payload Tonnes Annual loader Cost per % increaseper 24 hours (mins) capacity annually cost ($US) ton ($US) cost/t
Base case 85% 2.26 95% 1,378,674 $ 283,608 0.206
Moderate severity 80% 2.26 95% 1,297,575 $ 270,109 0.208 1%
High severity 75% 2.26 95% 1,216,417 $ 270,114 0.222 8%
The impact of mining conditions on mechanized mining efficiency
In each of the following examples (Figures 12 to 14.), thetonnage moved during the year is calculated by one loaderand compared to a cost per ton. Assume that the overalloperating cost of the loader is $50 per hour.
Roadway conditions
As can be seen in Figure 12, cost per ton is doubled due toroadway conditions. Commonly machines operate in firstgear due to road conditions. Areas for improvement inroadways are relatively straightforward and involve operatordiscipline (clearing rocks), good development drilling andblasting (footwall conditions) and good road maintenance(drainage, fines for road repairs, lighting).
Operator efficiency
Operator efficiency is affected by shift change times,operators taking time to carry out daily checks andcongestion in loading areas with personnel, other units andpoor ventilation and lighting. Once again, as part of apartnership approach focus on ‘hot-seat’ change-outs,reduction in preshift check times (auto-greasing systems,dual fuel tanks) and operator motivation all contribute toimproving operator production time. (Figure 13.)
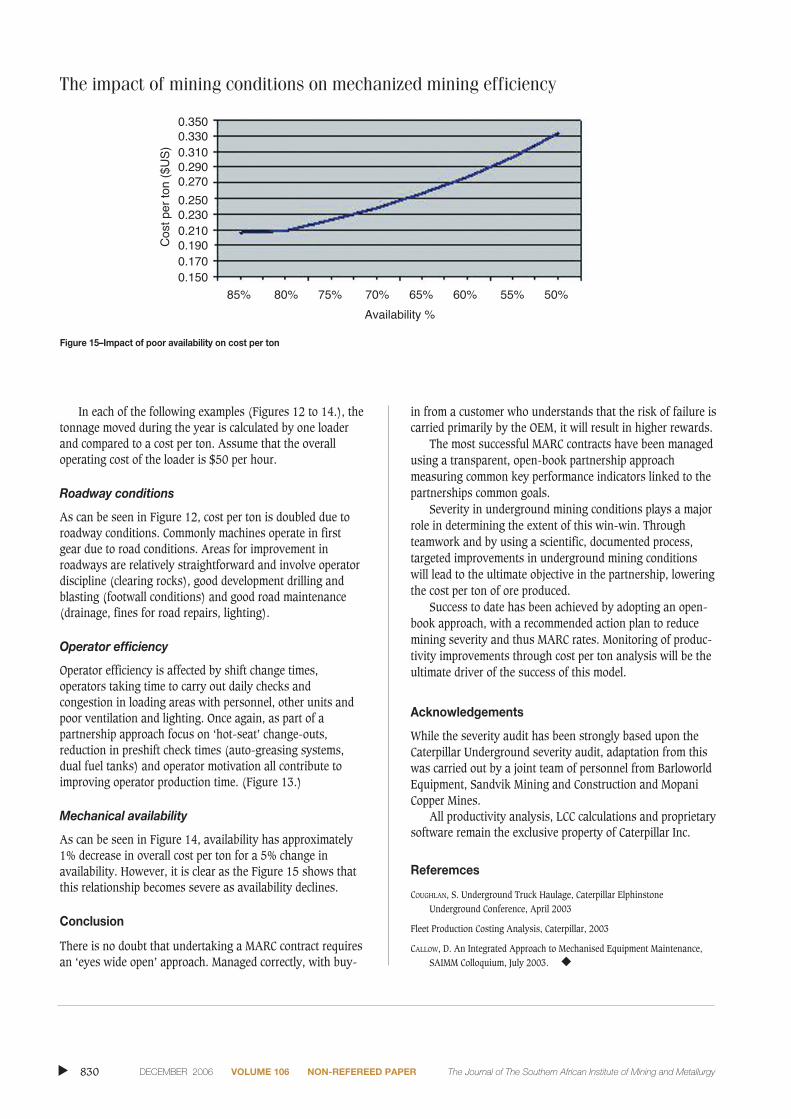
Mechanical availability
As can be seen in Figure 14, availability has approximately1% decrease in overall cost per ton for a 5% change inavailability. However, it is clear as the Figure 15 shows thatthis relationship becomes severe as availability declines.
Conclusion
There is no doubt that undertaking a MARC contract requiresan ‘eyes wide open’ approach. Managed correctly, with buy-
in from a customer who understands that the risk of failure iscarried primarily by the OEM, it will result in higher rewards.
The most successful MARC contracts have been managedusing a transparent, open-book partnership approachmeasuring common key performance indicators linked to thepartnerships common goals.
Severity in underground mining conditions plays a majorrole in determining the extent of this win-win. Throughteamwork and by using a scientific, documented process,targeted improvements in underground mining conditionswill lead to the ultimate objective in the partnership, loweringthe cost per ton of ore produced.
Success to date has been achieved by adopting an open-book approach, with a recommended action plan to reducemining severity and thus MARC rates. Monitoring of produc-tivity improvements through cost per ton analysis will be theultimate driver of the success of this model.
Acknowledgements
While the severity audit has been strongly based upon theCaterpillar Underground severity audit, adaptation from thiswas carried out by a joint team of personnel from BarloworldEquipment, Sandvik Mining and Construction and MopaniCopper Mines.
All productivity analysis, LCC calculations and proprietarysoftware remain the exclusive property of Caterpillar Inc.
Referemces
COUGHLAN, S. Underground Truck Haulage, Caterpillar ElphinstoneUnderground Conference, April 2003
Fleet Production Costing Analysis, Caterpillar, 2003
CALLOW, D. An Integrated Approach to Mechanised Equipment Maintenance,SAIMM Colloquium, July 2003. ◆
▲
830 DECEMBER 2006 VOLUME 106 NON-REFEREED PAPER The Journal of The Southern African Institute of Mining and Metallurgy
Figure 15–Impact of poor availability on cost per ton
85% 80% 75% 70% 65% 60% 55% 50%
Availability %
Cos
t per
ton
($U
S)
0.3500.3300.3100.2900.270
0.2500.2300.2100.1900.1700.150