The Impact of Migration and Remittances on Wealth ......The Impact of Migration and Remittances on...
23
The Impact of Migration and Remittances on Wealth Accumulation and Distribution in Rural Thailand 1 Filiz Garip Harvard University 1 This research was supported by grants from the National Science Foundation, Clark Fund, Milton Fund, and a seed grant from the Population Center at Harvard University. May 2012
Transcript of The Impact of Migration and Remittances on Wealth ......The Impact of Migration and Remittances on...

The Impact of Migration and Remittances on Wealth Accumulation and Distribution in
Rural Thailand1
Filiz Garip Harvard University
1 This research was supported by grants from the National Science Foundation, Clark Fund, Milton Fund, and a seed grant from the Population Center at Harvard University.
May 2012

2
Remittances to developing countries…
…amount to 325 billion US$ annually
…provide a potential pathway out of poverty

3
Questions
Why do individuals (or households) migrate or remit?
What are the implications of migration and remittance behavior for economic outcomes?
Is there a link between the reasons for migration-
remittance behavior and the effect of that behavior on economic outcomes?
4
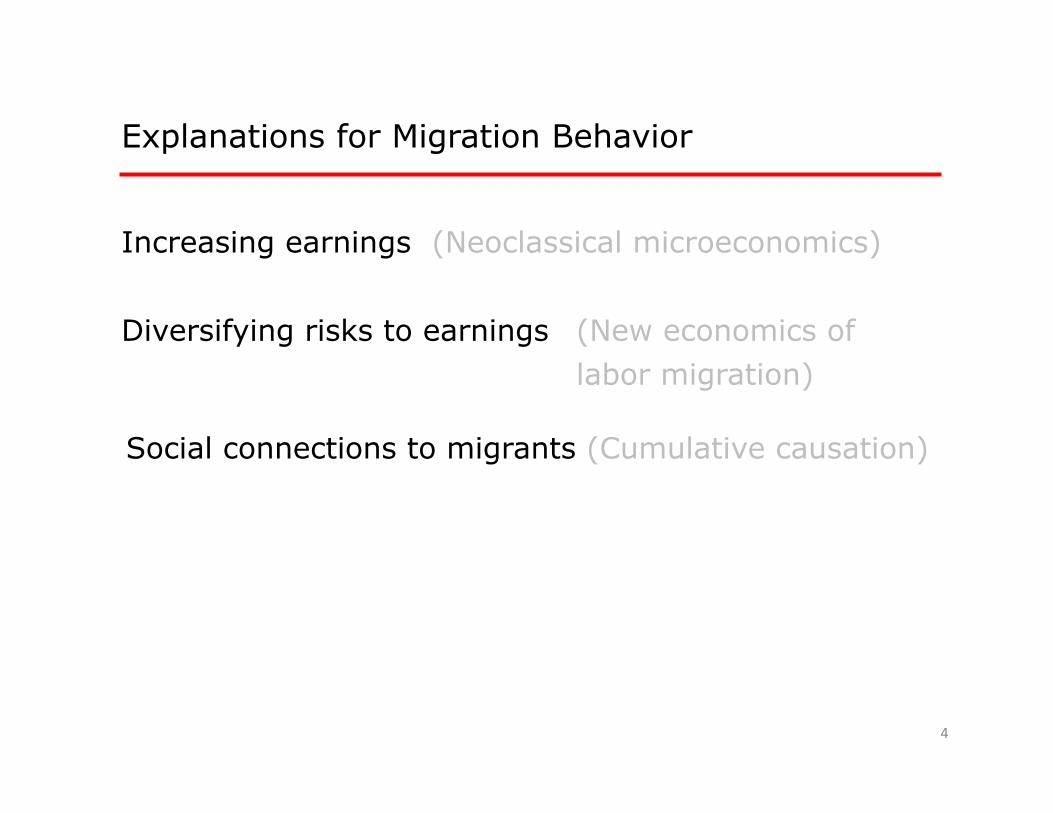
Explanations for Migration Behavior
Increasing earnings (Neoclassical microeconomics)
Diversifying risks to earnings (New economics of labor migration)
Social connections to migrants (Cumulative causation)

5
Explanations for Remittance Behavior
Increasing household’s welfare (Altruism)
Exchanging favors with the household (Contractual)

6
Argument
Different behavioral models of migration and remittances carry different expectations about wealth accumulation in households.
These expectations vary by households’ initial economic status.

7
Hypotheses
Household migrants contribute more to household wealth than individual migrants.
For poor households, departure of a migrant implies a reduction in household’s consumption needs, and potentially, a gain in household’s assets.
For wealthy households, departure of a migrant
implies a loss in the local workforce, and potentially, a loss in household’s existing assets.
8
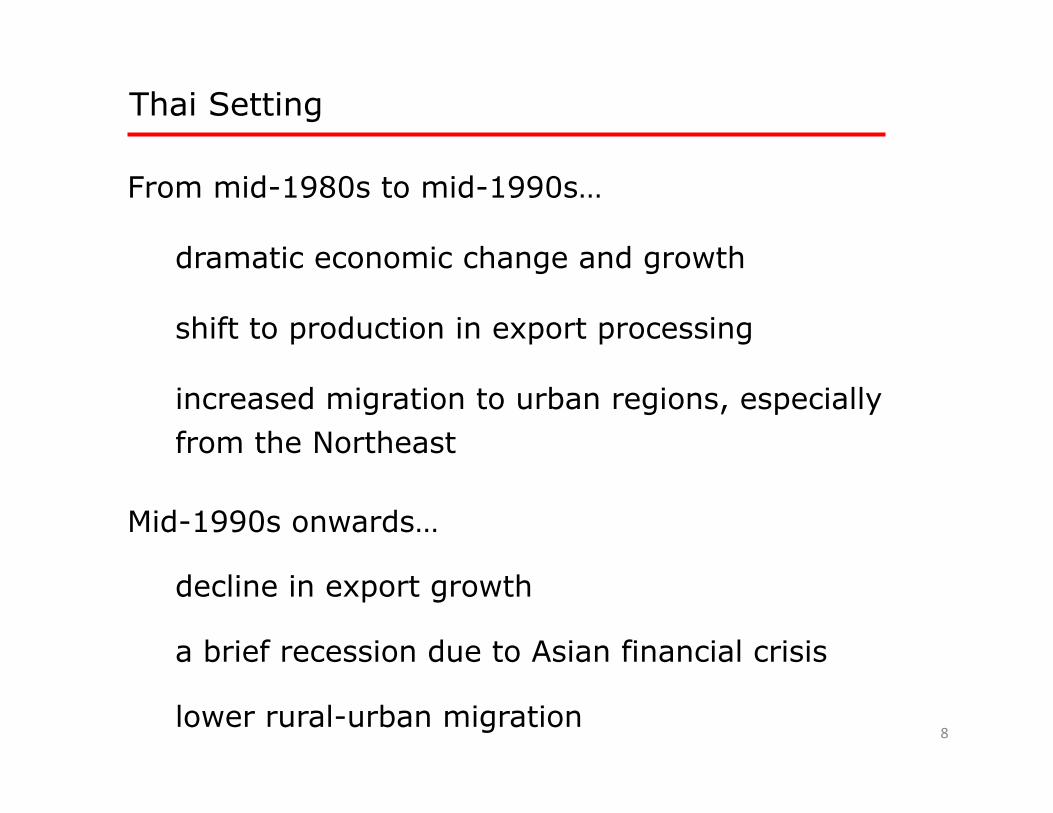
Thai Setting
From mid-1980s to mid-1990s…
dramatic economic change and growth
shift to production in export processing
increased migration to urban regions, especially from the Northeast
Mid-1990s onwards…
decline in export growth
a brief recession due to Asian financial crisis
lower rural-urban migration

9
!
!
!
!!
! !!
!!
!!
! !!
!! !
! ! ! !!!
!! !!
! !! !!!! !!! !! !
!!!
!! ! !!!! ! !!
! !
!
!
!
!
!
! !!
!!!
!!
! ! !
")Nakhon Nayok
Nakhon Pathom
Tak
Nan
Yala
Trat
Loei
Satun
Trang
Krabi
Surin
Phrae
Phuket
Ranong
Rayong
Roi Et
Phayao
Pattani
Bangkok
BuriramSisaketChainat
Kalasin
Phichit
LampangLamphun
Songkhla
Phangnga
Chumphon
Saraburi
Yasothon
Nang Rong
Phet Buri
Chon Buri
Ang Thong
Sing Buri
Khon Kaen
Sukhothai
Uttaradit Nong Khai
Chang Rai
Narathiwat
Ratchaburi Nonthaburi
Chaiyaphum
Phetchabun
Udon Thani
Chiang Mai
Phatthalung
Surat Thani
Chanthaburi
Supham Buri
Uthai Thani
Phitsanulok
SamutSakhon
Pathum Thani Prachin Buri
Nakhon Sawan
Sakon Nakhon
Mae Hong Son
Kanchanaburi
Maha Sarakham
Nakhom Phanom
Kamphaeng Phet
Ubon Ratchathani
Nakhon Ratchasima
Thahanbok Lop Buri
Nakhon Si Thammarat
Prachuap Khiri Khan
Phra Nakhon Si Ayutthaya
Myanmar
Laos
Vietnam
Malaysia
AndamanSea
Gulf of
Thailand
Samut PrakanSamutSongkhram
SouthChinaSea
Thailand
Area of detail
Kilometers
0 150 300
Provincial Map of Thailand
Cambodia
Population size
! 5,000,000 and greater
! 100,000 to 250,000
! 50,000 to 100,000
! Less than 50,000
Provincial Boundary
SouthChinaSea
!
!
Buriram
Nang Rong
Map of Study SiteRoad
Kilometers
0 30 60
Created by Tsering Wangyal Shawa

10
!!
^Bangkok
Pathum Thani
Sam ut PrakanSam ut Sakhon
Nakhon Pathom Nonthaburi
KrungM ahanakhon
Chachoengsao
Chon Buri
Rayong
Provinces in the Bangkok Metropolitan Area
and Eastern Seaboard
Kilometers
Gulf of
Thailand
0 30 60
Map of Migrant Destinations
Provincial Capital
Regional Capital
Bangkok Metropolitan Area
Eastern Seaboard
0 250 500
Kilometers
!
!
Gulf of
Thailand
Nakhon RatchasimaBuri Ram
Nang Rong
Area ofdetail
AndamanSea
Cambodia
Vietnam
Laos
Myanmar
Malaysia
U.S. Friendship Highway
"
Created by Tsering Wangyal Shawa

11
Data
Nang Rong survey data collected in three waves from 5,449 households (1984, 1994, 2000)
Information on individual demographics and household assets (1984, 1994, 2000)
Questions on migration and remittance behavior
in the past year (1994 and 2000)
Qualitative data from focus group discussions with 160 individuals in 8 of the 51 survey villages

12
Operational Measures
Household asset index constructed…
with polychoric PCA of 15 assets measured in 1994 and 2000 (pooled data)
separately for productive and consumer assets Land Farming tools Ca:le
Housing quality Durables (TV, VCR, fridge)
Indicators for household demographics, baseline wealth, prior migration patterns and months of water shortage in village

13
Analytic Strategy
Logit models of migration and remittance behavior in 1993 or 1999 to test behavioral theories
OLS, NN matching and IV models of the change in household productive and consumer assets from 1994 to 2000
…run separately for poor, medium-wealth and rich households

14
Results from Migration and Remittance Models
The odds of migrating and remitting are…
lower in households with children
higher in households with young adults
lower in wealthy households
higher in villages with a higher share of prior migrants or remitters

15
Results from Migration and Remittance Models
For the rich, the odds of migrating increase with assets, and more so…
if there are droughts in the village, or
if there are more sons or daughters in the households

Insights from Focus Groups – Reasons for Migrating
Individual reasons “I went to find work. My parents didn’t really want me to go, but I was stubborn.”
Household reasons “I wanted to help my family.”
“My parents wanted me to go, and I wanted to go. I migrated back and forth.”
“[My children] migrated so that they could help feed the family.”
Social resources “Others migrated and bought cars and good clothes to wear, so I also wanted to go.”
“I have a friend who lives in the city. I asked her to help me find a job,”
“It is risky to go without help, because we might end up not finding work at all.”

17
Insights from Focus Groups – Impact of Migration
“[Migrants from rich households] think that their father is already well-‐off… not in any difficulty, so they don’t send money. They are s_ll teenagers, so they go out and spend all their money.”
“No one sends me money. Whenever they come, I give them money.”
“If parents have enough money, they don’t want their children to go.”
“[My sons] ran away. Maybe they were bored of working in the rice fields…Before, three men helped work in the rice field, so things were easier. Now I don’t have any help.”
“It might have been be:er for me to stay in the village because we had land. When I migrated for work, no one took care of the land, so we had to rent it out.”
“The money [I send] is mainly for hiring help with the farm.”

18
Insights from Focus Groups – Impact of Migration
“When my kids went, I was happy. I was eagerly wai_ng for them to remit some money home every month so that we would have money to spend.”
“There are more expenses if the children stay home. If we go away to work, there are less people home, and it is less expensive to feed the family.”
“We were poor and had nothing to live on. There was nothing to do here, no farmland for us… If [my children] had stayed, we would have to feed them. They went with our blessing because we understood they wanted to help support the family.”
“[Remi:ances] is the reason why I sent my children away.”

19
Results from the Wealth Change Model
A. Change in Productive Assets
OLS 0.11 * -0.20 ** -0.65 ** 0.34 ** 0.10 -0.41 **(0.04) (0.05) (0.05) (0.05) (0.05) (0.05)
NN 0.19 * -0.25 ** -0.56 ** 0.30 ** 0.03 -0.47 **(0.08) (0.08) (0.10) (0.09) (0.10) (0.14)
IV 0.32 -0.12 -0.78 ** 0.54 * 0.78 ** -0.75 *(0.17) (0.15) (0.14) (0.26) (0.26) (0.32)
**p<0.01, *p<0.05
The effect of migration The effect of remittances
PoorMedium-wealth
Rich PoorMedium-wealth
Rich

20
Results from the Wealth Change Model
A. Change in Productive Assets
OLS 0.11 * -0.20 ** -0.65 ** 0.34 ** 0.10 -0.41 **(0.04) (0.05) (0.05) (0.05) (0.05) (0.05)
NN 0.19 * -0.25 ** -0.56 ** 0.30 ** 0.03 -0.47 **(0.08) (0.08) (0.10) (0.09) (0.10) (0.14)
IV 0.32 -0.12 -0.78 ** 0.54 * 0.78 ** -0.75 *(0.17) (0.15) (0.14) (0.26) (0.26) (0.32)
**p<0.01, *p<0.05
The effect of migration The effect of remittances
PoorMedium-wealth
Rich PoorMedium-wealth
Rich

21
Results from the Wealth Change Model
B. Change in Consumer Assets
OLS -0.05 -0.10 * -0.02 0.04 -0.04 0.07(0.04) (0.05) (0.05) (0.05) (0.05) (0.06)
NN -0.01 -0.16 -0.01 0.02 -0.04 0.17(0.09) (0.08) (0.09) (0.12) (0.13) (0.15)
IV 0.09 -0.12 0.14 -0.61 * -0.19 -0.25(0.18) (0.16) (0.14) (0.30) (0.28) (0.34)
**p<0.01, *p<0.05
The effect of migration The effect of remittances
PoorMedium-wealth
Rich PoorMedium-wealth
Rich

22
Conclusions for the Thai Setting
Migration and remittance flows are associated with changes in households’ productive assets, but not consumer assets.
The poorest one-third gains productive assets with migration and remittances, while the richest one-third loses assets.
The explanation is a potential clash between individual and household goals, which disproportionately hurts rich households.
Migration and remittance flows are likely to have an equalizing effect on the wealth distribution in the rural Thai villages.

23
Conclusions
The behavioral models for migration and remittances provide the key to understand their economic implications.
A mix of qualitative and quantitative analysis helps us better discriminate among alternative models.
Different behavioral models may be relevant for different groups of individuals.


![The Impact of Migration and Remittances on Wealth ... · “Some migrant households have improved so much from remittances that they are now richer than [initially] rich households.”](https://static.fdocuments.in/doc/165x107/5ecac161971f177c91456a37/the-impact-of-migration-and-remittances-on-wealth-aoesome-migrant-households.jpg)