The Impact of Market Rules and Market Structure on the Price
79
We would like to thank Jennifer Chen and Marshall Yan for outstanding research assistance. Severin * Borenstein, David Harbord, William Hogan, Peter Pashigian, Sam Peltzman and Matthew White provided very helpful comments on an earlier draft. The Impact of Market Rules and Market Structure on the Price Determination Process in the England and Wales Electricity Market * by Frank A. Wolak Robert H. Patrick Department of Economics Graduate School of Management Stanford University Rutgers University Stanford, CA 94305-6072 Newark, NJ 07102 Internet: [email protected] [email protected] Preliminary Draft February 1997
Transcript of The Impact of Market Rules and Market Structure on the Price

We would like to thank Jennifer Chen and Marshall Yan for outstanding research assistance. Severin*
Borenstein, David Harbord, William Hogan, Peter Pashigian, Sam Peltzman and Matthew White provided very helpfulcomments on an earlier draft.
The Impact of Market Rules and Market Structure on the Price Determination
Process in the England and Wales Electricity Market*
by
Frank A. Wolak Robert H. PatrickDepartment of Economics Graduate School of ManagementStanford University Rutgers UniversityStanford, CA 94305-6072 Newark, NJ 07102Internet: [email protected] [email protected]
Preliminary DraftFebruary 1997

Abstract
This paper argues that the market rules governing the operation of the England and Waleselectricity market in combination with the structure of this market presents the two majorgenerators—National Power and PowerGen—with opportunities to earn revenues substantially inexcess of their costs of production for short periods of time. Generators competing to serve thismarket have two strategic weapons at their disposal: (1) the price bid for each generation set and (2)the capacity of each generation set made available to supply the market each half-hour period duringthe day. We argue that because of the rules governing the price determination process in this market,by the strategic use of capacity availability declarations, when conditions exogenous to the behaviorof the two major generators favor it, these two generators are able to obtain prices for their outputsubstantially in excess of their marginal costs of generation. The paper establishes these points in thefollowing manner. First, we provide a description of the market structure and rules governing theoperation of the England and Wales electricity market, emphasizing those aspects that are importantto the success of the strategy we believe the two generators use to exercise market power. We thensummarize the time series properties of the price of electricity emerging from this market structureand price-setting process. By analyzing four fiscal years of actual market prices, quantities andgenerator bids into the market, we provide various pieces of evidence in favor of the strategic use ofthe market rules by the two major participants. The paper closes with a discussion of the lessons thatthe England and Wales experience can provide for the design of competitive power markets in theUS, particularly California, and other countries.

Order Instituting Rulemaking on the Commission's Proposed Policies Governing Restructuring1
California's Electric Services Industry and Reforming Regulation; Order Instituting Investigation on theCommission's Proposed Policies Governing Restructuring California's Electric Services Industry and ReformingRegulation, Decision No. 95-12-063 (December 20, 1995), as modified by Decision No. 96-01-009 (January 9,1996).
The Edison Electric Institute’s Retail Wheeling & Restructuring Report, Volume 3, Number 3, December 1996,2
gives a state-by-state summary of restructuring activity in the US.
1. Introduction
Since April 1, 1990, virtually all wholesale purchases of electricity in England and Wales
(E&W) must, by law, take place through a spot market which sets day-ahead prices for all half-hour
periods during the following day. These prices are determined from the day-ahead half-hourly supply
schedules submitted by all generators serving the market and an estimate of the market-level demand
for each half-hour period during the following day. The E&W market has been touted as the model
for liberalizing the electricity generation industry in many regions of the United States and worldwide.
For example, in late December 1995, the California Public Utilities Commission (CPUC) approved
a plan which calls for establishing an electricity spot market or Power Exchange similar to the E&W
electricity market, through which all generators sell power to electricity retailers and large customers
in California. This was followed by the September 23, 1996 signing by Governor Pete Wilson of1
Assembly Bill 1890 which clarified the specifics of the restructuring process. Currently, almost all
states are considering restructuring or are in the process of restructuring their electricity industries.2
A major aspect of all of these restructuring processes is the establishment of markets for trading
electricity.
The E&W electricity market and the proposed California Power Exchange are often referred
to as competitive electricity markets. However, the market structure and rules governing the
operation of the privatized and re-structured E&W electricity industry are not the direct result of
independent actions by generators, distributors and customers. Instead, they are the outcome of a

2
deliberate government policy to privatize and re-structure the industry. Similarly, the form of the re-
structured California electricity industry will be the result of a joint decision by the CPUC and the
California State Legislature. The Federal Energy Regulatory Commission (FERC) must also approve
California’s re-structuring plan. As we discuss later, there has been an increasing amount of
regulatory oversight in the E&W market since the re-structuring in 1990. The current plan for
restructuring the California electricity industry calls for continued monitoring of the industry by the
CPUC and other state and federal agencies. For all of these reasons, it is more appropriate to think
of the re-structured E&W market and the proposed California market as alternative mechanisms to
more traditional forms of regulation for achieving the goals of greater economic efficiency in the
production and distribution of electricity.
From the perspective of economic efficiency, the optimal price for electricity should be set
to mimic the market price in a competitive industry with many non-colluding firms and minimal
barriers to entry. This price has several desirable properties. First, it gives firms the proper signals
for the timing and magnitude of new investment expenditures. In addition, because firms have no
influence over this market price, they have the maximum incentive to produce their output at
minimum cost and can only earn higher profits by cost-reducing innovations not immediately imitated
by competitors. The major impetus behind the liberalization of the E&W market was the belief that
this new form of market organization would come closer to achieving these regulatory goals for the
behavior of electricity prices than the pre-privatization industry structure. An important concern
expressed in a 1981 study by the United Kingdom Monopolies and Mergers Commission (MCC) was
that the pre-privatization market structure did not provide the proper signals for constructing the
optimal amount and type of new generation capacity in a timely manner (Armstrong, Cowan and

3
Vickers, 1994, p. 291). In California, a traditionally high-price electricity state, the promise of lower
prices for all consumers seems to be the major impetus for the recent re-structuring efforts.
Despite these goals for re-structuring the E&W electricity industry, the desire of privately-
owned generation companies to maintain and attract shareholders implies that they will attempt to
exploit any profitable opportunities presented by the market structure and rules governing the
operation of the market. For this reason, the success of the re-structuring of the E&W market can
be judged by the degree to which these profit-making opportunities are eliminated by the design of
the market rules and market structure in the E&W electricity industry. Because all privately-owned
firms (including those in the E&W electricity industry) have strong incentives to maximize their
profits, the competitiveness of an industry can be judged by the extent to which the attempts by firms
to earn higher profits are foiled by the actions of other competitors and consumers. Markets with low
entry barriers and many firms tend to be those where the actions of both actual and potential
competitors limit the ability of any firm or group of firms to earn much higher than zero economic
profits. We therefore judge the success of the re-organization of the E&W market by the absence
of any persistent opportunities for large economic profits.
The purpose of this paper is to use half-hourly market-clearing prices and quantities, and the
half-hourly bids submitted from the E&W electricity market over the four fiscal years from April 1,
1991 to March 31, 1995 to assess the extent to which this re-structured market has eliminated any
significant profit-making opportunities for generators. We first illustrate how the major generators
have used the existing market structure and rules to achieve prices significantly above marginal cost
and average total cost. In the process we describe those circumstances in the E&W market which
make it particularly likely that the profit-seeking activities of the two largest firms serving the market
will be successful. We then present several calculations which are suggestive of the magnitude of

4
the above-normal profits earned by these two major generators as a result of their profit-seeking
efforts.
The major goal of our analysis is to understand the precise mechanism by which market power
is exercised—how generators use the rules governing the operation of the market to obtain market
clearing prices in excess of average cost. We believe that whether or not these firms are actually able
to exercise market power, they will continually attempt to maintain prices in excess of average costs
because of their desire to maximize profits. Our goal is to understand the strategies they use to raise
prices given the market structure and rules of the E&W electricity market.
Our story differs from the traditional static industrial organization view of market power
where the equilibrium price is maintained above marginal cost at all times in the following two ways.
First, we argue that in most load periods the market price set is not substantially in excess of the
average cost of supplying electricity for the two largest generators, National Power and PowerGen.
However, by taking advantage of the rules of the E&W pool, when circumstances largely exogenous
to their behavior make it possible, these two producers are able to temporarily obtain spot prices
much higher than the average cost of supply in that load period. In particular, we argue that the
majority of excess revenues due to the exercise of market power arise from extremely large within-
day price swings. The second way our story differs from the traditional view is that producers do not
exercise market power by explicitly bidding prices for each genset substantially in excess of its
marginal cost. Of the two strategic weapons available to each generator selling into this market—(1)
the maximum amount of its generating capacity made available to the pool and (2) the prices bid in
for each generating set made available—we show that the first is the more high-powered strategic
weapon used to obtain prices substantially above average costs. These capacity declarations are more
attractive than bids as a means to exercise market power because of the rules governing the operation

5
of the E&W market. These rules require the bid for each portion of a generation set during the next
day to be the same for all load periods throughout that day, although how these bids are converted
into market prices does compensate generators for the costs associated with starting-up their
generator sets (hereafter abbreviated as gensets). In contrast, the market rules allow gensets to be
declared available on a half-hourly basis during the day at the discretion of the electricity producer.
This asymmetry in the flexibility of setting price versus capacity availability makes the strategic
declaration of genset availability a very attractive way for National Power and PowerGen to obtain
large values of the day-ahead spot price.
We find that this market power activity leads to prices substantially in excess of average costs
for extremely short durations, often for no more than two or three half-hour load periods within the
day. In addition, the days in which these two or three very high-priced half-hour load periods occur
tend to follow one another in the same week. Despite many changes in the rules governing the E&W
electricity market (to be described in the next section) from the beginning to the end of our sample
period, this qualitative feature of the behavior of prices is constant across the four years in our
sample.
The remainder of the paper proceeds as follows. The next section describes the rules
governing the operation and market structure of the E&W system and characterizes the general
features of the time series properties of the wholesale price of electricity and the total amount of
electricity sold through the E&W market. Section 3 illustrates how the market rules and market
structure of the E&W market can allow the generators to obtain periods in which the wholesale price
is substantially above the average cost of supply. Section 4 integrates the evidence presented in
Section 3 to provide recommendations about the design of market rules and market structure to
achieve efficient pricing given the initial conditions in an electricity industry currently considering

Wolak and Patrick (1996a) describes the operation of the E&W system in more detail. Wolak and3
Patrick (1996b) analyzes the time series behavior of market clearing prices and quantities over our sample period.
Fiscal years run from April 1 to March 31 of the following calendar year.4
6
liberalization. Section 5 discusses several caveats associated with our results and suggests directions
for future work.
2. Industry Structure and Regulation in England and Wales Electricity Market
The purpose of this section is to summarize the market structure and rules governing the
operation of the E&W system and to characterize the behavior of market clearing prices and
quantities from April 1, 1991 to March 31, 1995. We first provide some historical background3
concerning the restructuring of the electricity industry in England and Wales. Second, we lay out the
various stages of the price determination process, highlighting the potential opportunities for
generators to influence the pool price through strategic price and capacity availability offerings. We
then discuss the evolution of the regulation of this market attempting to limit market power by the
two largest generators in the system. Finally, we summarize the general features of the times series
properties of the market clearing prices and quantities from the E&W market during our sample
period.
2.1. Market Structure
March 31, 1990 marked the vesting and operational beginning of an evolving economic
restructuring of the electric utility industry in the United Kingdom. Generation, transmission, and
distribution (suppliers to end-users) of electricity were divided into separate companies and largely
privatized. Generation plants in England and Wales were separated into three large companies.
National Power and PowerGen took over all existing fossil fuel power stations. Nuclear power plants
remained state-owned, under the auspices of Nuclear Electric, through the 1995/96 fiscal year. The4
Nuclear Electric's 1995/96 fiscal year market share was 22.49%, power imported from Scotland and France5
8.71%, pumped storage 0.69%, and IPPs and others 13.63% (Electricity Pool of England and Wales, Statistical Digest,May 1996).
7
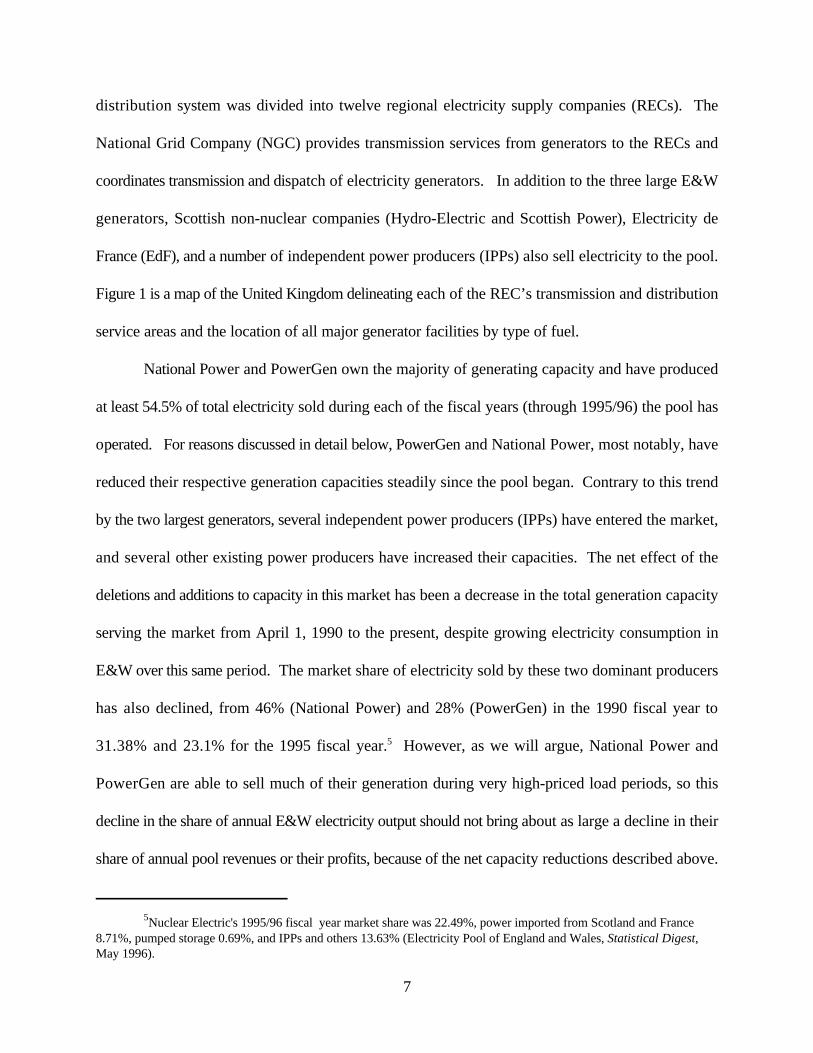
distribution system was divided into twelve regional electricity supply companies (RECs). The
National Grid Company (NGC) provides transmission services from generators to the RECs and
coordinates transmission and dispatch of electricity generators. In addition to the three large E&W
generators, Scottish non-nuclear companies (Hydro-Electric and Scottish Power), Electricity de
France (EdF), and a number of independent power producers (IPPs) also sell electricity to the pool.
Figure 1 is a map of the United Kingdom delineating each of the REC’s transmission and distribution
service areas and the location of all major generator facilities by type of fuel.
National Power and PowerGen own the majority of generating capacity and have produced
at least 54.5% of total electricity sold during each of the fiscal years (through 1995/96) the pool has
operated. For reasons discussed in detail below, PowerGen and National Power, most notably, have
reduced their respective generation capacities steadily since the pool began. Contrary to this trend
by the two largest generators, several independent power producers (IPPs) have entered the market,
and several other existing power producers have increased their capacities. The net effect of the
deletions and additions to capacity in this market has been a decrease in the total generation capacity
serving the market from April 1, 1990 to the present, despite growing electricity consumption in
E&W over this same period. The market share of electricity sold by these two dominant producers
has also declined, from 46% (National Power) and 28% (PowerGen) in the 1990 fiscal year to
31.38% and 23.1% for the 1995 fiscal year. However, as we will argue, National Power and5
PowerGen are able to sell much of their generation during very high-priced load periods, so this
decline in the share of annual E&W electricity output should not bring about as large a decline in their
share of annual pool revenues or their profits, because of the net capacity reductions described above.

Prices for transmission and distribution services from NGC and the RECs are restricted to grow no faster than the6
percentage change in the economy-wide price level, measured by the Retail Prices Index (RPI), less an X-factor adjustmentfor productivity increases. Until the 1994/95 fiscal year, the RECs' electricity supply prices for all customers were regulatedby RPI - X + Y, where Y is an adjustment factor which passes-through unexpected costs the REC incurs, as well as purchasedelectricity costs, and transmission and distribution services. Since the beginning of the 1994/95 fiscal year, supply to non-franchise customers (currently those with peak demands less than 100 KW) has not been regulated.
8
Transmission and distribution services for all customers, and electricity supply for customers
with no alternative sources of supply other than their local REC, so-called franchise customers
(currently those with less than 100 kilowatt [KW] peak demands), are regulated by price caps. Since6
the formation of the E&W market, RECs have had exclusive franchises to supply all consumers within
their geographic regions, except for consumers with peak demands greater than 1 megawatt (MW).
From the start, these customers were given the option of choosing their supplier from any of the 12
RECs as well as National Power or PowerGen directly. On April 1, 1994, the 1 MW limit on these
non-franchised consumers was reduced to 100 KW. This size restriction on customer peak demand
will cease to exist March 31, 1998, when even residential customers will be offered this option (i.e.,
all customers become non-franchise). RECs are required, with compensation, to allow competitors
to transfer electricity over their distribution systems.
The vast majority of a REC's customers purchase electricity at rates fixed independent of
within-year variations in the pool price. All residential customers pay fixed prices that may vary in
a mutually agreed-upon manner on a daily or weekly basis, independent of fluctuations in the pool
price, for the entire fiscal year. The most common form of this pricing plan has one fixed price per
KWH for all consumption during daylight hours and another fixed price per KWH for consumption
during nighttime hours. Almost all commercial and industrial users purchase power through similar
annually negotiated fixed price contracts which also vary on a daily or weekly basis, independent of
movements in the pool price. Consequently, within-day, day-to-day, or even month-to-month
movements in the pool price have no impact on the prices all but a small fraction of customers pay

Wolak and Patrick (1996a) describes these sorts of retail price contracts in more detail.7
9
because the price patterns they face do not change for the entire fiscal year. Only a very small
fraction of E&W total system load, approximately 5%, is purchased by final consumers according to
the variations in the half-hourly spot-market price.7
Because RECs provide electricity to the vast majority of their customers according to rate
schedules fixed well in advance of the realization of pool prices, they normally hedge against this price
volatility by purchasing "contracts for differences" (CFDs). CFDs are simply financial instruments
insuring prices at which an agreed upon quantity of electricity can be purchased and sold. CFDs have
been sold by generators as well as financial institutions and traders that deal in commodity markets
and derivative securities. They are not contracts to deliver electricity.
CFD contracts were also used in the initial privatization process to maintain employment in
the UK coal industry. As part of the privatization process, the Government required National Power
and PowerGen to enter into contracts for the purchase of a higher volume of UK coal than they
wished at higher-than-world-market prices, thus maintaining employment in the coal mining industry.
Vesting CFD contracts between each REC and National Power, PowerGen, and other generators
were designed to compensate these generators for the higher UK coal prices they paid for UK coal
under these coal supply contracts. The strike price of these CFDs allowed the costs of the coal
contracts to be passed on to the RECs, and the structure of the REC regulatory process—a price cap
with a Y-factor to pass through extraordinary cost increases—allowed these costs to be passed on
to final customers in the form of higher prices. In the first two years following privatization, it is
estimated that CFD contracts covered 84.3% and 89.1%, respectively, of National Power's and
PowerGen's generation, declining to 72.7% and 70.6% over the next two years (Helm and Powell,
1992).

10
2.2. The Pool Price Determination Process
Generators offer or "bid" prices at which they will provide various quantities of electricity to
the E&W pool from their generating stations throughout the following day. In addition, the
generators make availability declarations for each of these gensets for each half-hour during the
following day.
These availability declarations cannot exceed what the Pool Rules call the Registered Capacity
of the genset. This Registered Capacity can differ from the nameplate capacity of the genset and may
even be zero. Zero Registered Capacity gensets will show up in the bid data with a zero capacity
bid. However, according to the Pooling and Settlement Agreement for the Electricity Industry in
England and Wales, Agreed Procedures, Volume 1, the Registered Capacity of a genset can be
changed up to 10 am the day before the trading day under consideration, so that these gensets can
and do make non-zero availability declarations on very short notice. Setting the Registered Capacity
of a genset to zero precludes it from selling electricity into the pool during the next day, although it
does not preclude the option of doing so on any subsequent day. Consequently, in our discussions
of capacity for the remainder of the paper we make the distinction between Registered Capacity and
actual capacity that both National Power and PowerGen possess, with the former being the usual
number reported in UK Electricity Industry annual reports and the latter being the maximum amount
of generation capacity that each firm can use to sell electricity into the E&W pool.
The day-ahead bid prices and availability declarations submitted by generators are input into
the general ordering and loading (GOAL) program at NGC to determine the merit order of
dispatching generation and reserve capacity. The lowest price generating capacity is dispatched first,
unless such dispatch will compromise system integrity. Subject to this caveat, dispatching plants in
this "least-cost merit order" gives rise to an upward sloping aggregate electricity supply function for

According to the pool rules, each half-hour's forecast demand is the sum of reported pumped storage8
demand, reported demand by large customers (defined as those with a maximum demand of over 250 MWH duringany half-hour, although there are no electricity consumers of this magnitude in the E&W market), and the GridOperator's forecast based on "current and historic weather conditions and any other factors capable of affectingdemand which the Grid Operator reasonably considers to be capable of independent verification." (The ElectricityPool 1997, p. S5-1, Section 5.1.2). Furthermore, in Section 5.1.3,
In particular, but without limitation, such forecast shall not be adjusted for the expected output ofSmall Independent Generating Units, Non-Pooled Generators, Customer Demand Management orthe response of demand to price, or any other factors capable of affecting demand notified to theGrid Operator by Generators or Consumers except to the extent that the Grid Operator reasonablyconsiders such factors to be capable of independent verification.
In particular, the response of demand to price and demand-side bidding have not been considered sufficientlyreliable to be considered in the forecast demand (see, e.g., Baker 1992 and OXERA Press 1997).
11
each half-hour for the following day. The system marginal price (SMP) for each half-hour of the
following day is the price bid on the marginal genset required to satisfy NGC's forecast of each half-
hour's total system demand for the next day, i.e., the bid where this expected demand crosses the
aggregate supply curve.
The methodology and data input into NGC's forecast of demand are readily available to
generators prior to their submissions of bid prices and availability declarations for the next day [Baker
(1992), The Electricity Pool (1997), and National Grid Company (1995)]. This implies that the
generators can compute NGC's forecast of demand for all 48 load periods during the next day before
they submit their bid prices and availability declarations. We will argue that this market rule has
important implications for the strategies used by generators to exercise market power. Moreover,
this forecast demand in perfectly price inelastic.8
The Pool Purchase Price (PPP), the price paid to generators per KWH in the relevant half-
hour, is defined as
PPP = SMP + CC,

12
where the capacity charge is CC = LOLP×(VOLL - SMP), LOLP is the loss of load probability, and
VOLL is the value of lost load. The CC is intended to provide a signal to generators of the necessity
of new generation capacity and to signal consumers that their consumption has a significant
probability of requiring the maximum amount of generating capacity available in that load period.
The VOLL represents the per KWH willingness of customers to pay to avoid supply interruptions.
It was set by the Director General of the Office of Electricity Regulation (OFFER) at £2,000 per
megawatt-hour (MWH) for 1990/91 and has increased annually by the growth in the RPI since. The
LOLP is determined for each half-hour as the probability of a supply interruption due to generation
capacity being insufficient to meet demand. The LOLP is a decreasing function of the expected
amount of excess capacity available during each half-hour period. The greater the amount of capacity
available relative to expected demand in any half-hour, the lower the LOLP and therefore the lower
the capacity charge per KWH paid to generators. We argue that this relationship has important
implications for the two largest generators' strategies for obtaining high PPPs.
The pool selling price (PSP) is the price paid mostly by RECs purchasing electricity from the
pool to sell to their final commercial, industrial and residential customers. For the purposes of
determining this price, the 48 load periods within the day are divided into two distinct price-rule
regimes referred to as Table A and Table B periods. During Table A half-hours the PSP is
PSP = SMP + CC + UPLIFT = PPP + UPLIFT.
UPLIFT is a charge used to collect costs incurred when demand and supply are actually realized each
day, is only known ex post, is the only price uncertainty from the day ahead perspective, and is
collected over at least 28 Table A pricing periods each day (UPLIFT is zero for Table B pricing
periods). A major component of UPLIFT is to compensate generators for reserve, plant available but

13
not actually used to meet demand, and startup costs. Generators are paid for capacity they choose
to make available according to
Availability Payment/MWH = LOLP×(VOLL ! max[SMP, bid price]).
This approach to setting availability payments compensates a relatively high-priced plant that is not
used, but is available, less than a plant which bids close to the SMP. The remaining portion of
UPLIFT is comprised of NGC's costs of ancillary services (reactive power, frequency control, hot
standby, and black-start capability).
By 4 pm each day, the SMP, CC and the identities of the Table A and Table B periods for all
48 load periods for the following day are communicated to pool participants.
2.3. Regulatory Oversight
The Electricity Act of 1989 established the OFFER, with Professor Stephen Littlechild serving
as the Director General, to oversee the operation of the re-structured United Kingdom electricity
industry, from generation to transmission and distribution to final customers. At privatization there
were no explicit controls over the PPP. Since then, Professor Littlechild has instituted several
regulatory changes in an attempt to inhibit strategic price and supply schedule offerings by the
generators. These include (1) amending the original generation license to require generators to make
public their plans on capacity availability, (2) a change in the way LOLP is calculated, (3) price caps
on PPP, (4) the divestiture of generating plant, and (5) a price cap on UPLIFT.
The original generation license was revised, following the Pool Price Inquiry in December of
1991, to restrict the ability of generators to manipulate the PPP by reducing capacity made available
to the pool. The changes require generators to provide, for public viewing, reports containing the
generator's criteria for determining the availability of their capacity to the pool, closing generating
stations, and otherwise reducing generating capacity. Each year, generators must also file a detailed

An Introduction to Pool Rules (Issue 2), The Electricity Pool, p. 10.9
The Electricity Act of 1989 gives the Director General the authority to refer the firms to the Monopolies and Mergers10
Commission in order to make changes in the relevant license. Referrals can also be made under the Fair Trading Act of 1973or the Competition Act of 1980.
14
forecast of the availability of each generating unit for the coming year and, at year's end, file a
"reconciliation" explaining any deviations from the anticipated availability. This information is also
publicly available. However, “Generators are under no obligation under Pool Rules to declare any
of their Centrally Dispatched Generating Units (CDGUs) available to generate at any particular time,
even though the CDGU may be operationally available.” Wolak and Patrick (1996a) describe9
various actions by the Director Generator to encourage the generators to declare capacity available.
Due to perceived excessive variability in the PPP, OFFER charged National Power and
PowerGen with exercising market power to drive up pool prices. This matter was resolved with the
institution of caps on pool prices over the fiscal years 1994/95 and 1995/96 as part of a voluntary
agreement, reached February 11, 1994, between National Power, PowerGen, and OFFER after
Professor Littlechild threatened to refer these generators to the Monopolies and Mergers
Commission. This agreement also included the recently completed divestiture of 4 GW and 2 GW10
of coal or oil generating plant by National Power and PowerGen, respectively.
As a result of uplift increases in 1993/94, OFFER instituted, in April of 1994, the "uplift
management incentive scheme" (UMIS) in an attempt to encourage NGC to minimize “avoidable
costs” incurred in operating the E&W power market. UMIS was then replaced with the Transmission
Services Project (TSP) on October 1, 1995. TSP divided uplift into the costs associated with reactive
power, system constraints, transmission losses, and other ancillary services. Each category has a
price cap intended to provide an incentive for NGC to keep these costs down.
2.4. Time Series Properties of Pool Selling Price and Total System Load

15
In this section we characterize the time series properties of PSP and the total amount of
electricity sold through the E&W pool during each half-hour period over our sample period, what is
referred to as Total System Load (TSL). A notable feature of the behavior of PSP is its tremendous
variability, even over very short time horizons. For example, the maximum ratio of the highest to
lowest PSP within a day is 76.6, whereas the average of this ratio over all days in our sample period
is about 4.1. The maximum ratio of the highest to lowest PSP within a month is 107.5 and the
average of this ratio over all months in our sample is 11.0. Finally, the maximum ratio of the highest
to lowest PSP within a fiscal year is approximately 117.8.
TSL exhibits dramatically less volatility according to this metric. For example, the maximum
ratio of the highest to lowest TSL within a day is 1.89 and the average over all days in the sample is
1.49. Within a month, the maximum of the highest to lowest TSL is 2.38 and the average over all
months in the sample is 2.04. For the time horizon of a fiscal year, the maximum ratio of the highest
to lowest TSL is 3.08. Consistent with this difference in volatility, the TSL can be forecasted much
more accurately at all time horizons than the PSP. In making this comparison, we define forecasting
accuracy as the standard deviation of the forecast error as a percent of the sample mean of the time
series under consideration. Wolak and Patrick (1996b) give a detailed analysis of the forecastability
of PSP, PPP, CC, UPLIFT and TSL.
Figure 2 presents plots of the half-hourly PSP in (£/MWH) for the more than 17,000 prices
for each of the four fiscal years in our sample. The highest values of PSP within a fiscal year tend to
occur during the four-month period from November to February. These are also the months when
there is an enormous amount of price volatility within the day and across days. The pattern and the
magnitude of the volatility differs markedly across the four fiscal years. All of the price graphs are
plotted using the same scale on the vertical axis to illustrate this point. Figure 3 plots the system

16
capacity used in each of the half-hour load periods during each of the four fiscal years. Compared
to the four graphs in Figure 2, the four graphs in Figure 3 indicate the very predictable pattern of TSL
across days, weeks, and years. In particular, the total demand in a single day in one year is very
similar to the demand in that same day in the previous year. The cycle of demand within a given week
is similar to the cycle of demand within that same week in another year. Similar statements can be
made for the cycles in TSL within months across different years.
The difference between the four price graphs and the four TSL graphs illustrates a very
important implication of the design of the E&W market described in Section 2.2. Despite the large
differences in the patterns of price movements across the four years, there is no discernable change
in the pattern of TSL across the four years. Recall from Section 2.1 that only a very small fraction
of electricity consumed by final customers is purchased at the PSP. Because the vast majority of
business customers, and all residential customers, purchase power on fixed-price contracts set for the
entire fiscal year, these customers do not face any unpredictable price changes related to the current
value of the PSP which might trigger demand responses within that same load period. Each of the
12 RECs offers several fixed-price options to its customers. For residential customers, each REC
offers a small number of standard price contracts, e.g., a single-price for all load periods contract, or
a two-price contract (a fixed price for all daytime load periods and a fixed price for night-time load
periods). For business customers, each REC offers several standard price contracts, but particularly
for large customers who can choose their supplier from any of the 12 RECs or any of the generators,
these fixed price contracts are often negotiated on a customer-by-customer basis. Consequently, for
the same half-hour period, there are hundreds and potentially even thousands of different retail prices
that different customers throughout the E&W system are paying for electricity. Although these fixed-
price contracts are designed to yield annual revenues from a customer that at least cover the REC’s

17
cost of purchasing from the pool the actual electricity sold, movements in the PSP, or in any of its
components, have no effect on the movements in these contract prices. Consequently, the lack of
responsiveness of TSL to changes in PSP does not imply that individual customers do not respond
to price changes. This lack of responsiveness is indicative of the fact that only a small fraction of
customers purchase electricity at the half-hourly PSP, with the remaining vast majority purchasing
electricity on these fixed-price contracts.
An important consequence of virtually no customers purchasing electricity at the half-hourly
PSP is that it makes little, if any, economic sense to estimate an aggregate demand curve for
electricity involving PSP or PPP as the price variable and TSL as the quantity demanded variable.
Movements in the half-hourly or the daily average PSP or PPP, which identify the aggregate price
response, are irrelevant to the vast majority of consumers of electricity who face prices that are
unrelated to movements in the PSP or PPP for the entire fiscal year. Consequently, a price response
recovered from this estimation is likely to be extremely misleading about the true aggregate price
response because only approximately 5 percent of TSL is purchased by final customers at the PSP
and the remaining is purchased according to prices that are invariant to changes in the PSP for an
entire fiscal year.
Table 1 gives the means and standard deviations for PSP, SMP, CC and UPLIFT for each
of the four fiscal years in our sample. There has been a slight increase in the mean value of PSP
across the four fiscal years. The major explanation for this increase is the growth in the mean of CC
from the first to last fiscal year. The mean of UPLIFT has also shown a similar upward trend over
this time period. Another notable feature of this table is the tremendous amount of volatility in CC,
and to a lesser extent in UPLIFT, particularly for the year 1994/95. For all four fiscal years, the ratio

18
of the standard error to mean of CC exceeds two, indicating a substantial amount of relative volatility
in this half-hourly charge.
On average, the major component of the PSP is the SMP. However, the large amount of
volatility in both CC and UPLIFT indicates that, for many periods, the relative contribution of SMP
to the PSP can be much smaller. To illustrate this point, Table 2 gives the mean, minimum, maximum
and standard deviation for various ratios of the components of PSP for each of the fiscal years.
Although the sample average of SMP/PSP over the four fiscal years is 0.92, there is a substantial
amount of variability in this ratio within each year. The ratio CC/SMP illustrates the source of this
variability. In 1991/92, mean of this ratio was 0.05, and the maximum was 10.36. In 1994/95, the
mean was 0.09, but the maximum was 20.41. Even in 1992/93, when the mean of this ratio was only
0.01, the maximum was 1.87. Extremely large values of CC are the source of very small values of
SMP/PSP. A crucial part of our story of how National Power and PowerGen attempt and succeed
to obtain values of PPP or PSP substantially in excess of their average costs in certain load periods
within the day stems from their ability to achieve these extremely large values of CC relative to SMP.
In this next section, we will show that when events exogenous to their behavior make it possible,
through strategic declaration of their available generation capacity, these producers can obtain very
large values of CC and therefore very large values of PPP and PSP.
3. Strategic Use of Market Rules by National Power and PowerGen
We now describe a mechanism which it appears that National Power and PowerGen have used
to take advantage of the rules governing the E&W pool to temporarily obtain prices substantially in
excess of each generator's average cost of producing electricity. An explicit assumption in our
analysis and in all existing theoretical and empirical work on this market is that it can be thought of
a duopoly between National Power and PowerGen with the remaining firms acting as a competitive

19
fringe. The logic for this assumption is as follows. Nuclear Electric, because it produces only
baseload power, will bid low so as to always operate as much of its available capacity as possible.
Because most of the IPPs have long-term take or pay fuel contracts (specifically, natural gas) and
have signed long-term CFDs with RECs for the amount of electricity they expect to generate, their
incentive is to bid low to guarantee that their plants will be dispatched. Because of substantial excess
generating capacity in Scotland and transmission line capacity constraints from Scotland to the E&W
pool, the Scottish producers will do the same. Finally, EdF primarily sells its excess nuclear capacity
to the pool so that it has the same incentives to bid low as Nuclear Electric. EdF also faces
transmission capacity constraints to the E&W market, which makes its effective available capacity
small relative to the E&W market demand. For these reasons, it is reasonable to assume that the
remaining E&W residual demand is served by a duopoly composed of National Power and
PowerGen.
The general issue of generator market power in the E&W system has received attention from
both theoretical and empirical researchers. The existing theoretical literature points out several
modes for the exercise of market power. Unfortunately, there does not exist a comprehensive model
which accounts for the features of the structure and operation of the E&W market which leads to the
exercise of market power of the form we claim. We should caution that it would require an extremely
sophisticated model to simultaneously capture the entire story we have in mind. Consequently, we
first discuss the important features of the market structure and rules of the E&W market which allow
the two major generators to obtain prices substantially in excess of average costs. We then describe
the existing research on this market and the lessons that are learned from it. Then we provide an
argument which builds on this work to provide a story of how the two major generators make
strategic use of the market rules to obtain prices substantially in excess of average cost. We present

20
evidence for the use of this strategy by the two major generators using data from actual operation
of the market. Finally, we attempt to quantify the magnitude of the increased profit rate to the two
largest generators that results from their use of this strategy.
3.1. Important Features of E&W Market Structure and Market Rules
There are four important features of the economic environment which contribute to the ability
of National Power and PowerGen to maintain prices in excess of average cost. The first is the
presence of known upper bounds on the amount of electricity that any producer can bid into the pool
during each load period, because of transmission line constraints in the case of EdF and the Scottish
producers, and because of the actual amount of capacity owned by all of the other producers. If after
accounting for the total capacity of all other producers, National Power and PowerGen believe that
they face a large residual demand relative to their capacity, these two generators can be expected to
bid less aggressively into the pool.
The second feature of this market which allows the two dominant generators to obtain high
prices is the finite upper bound on maximum residual demand these two firms face. As noted in
Section 2.2, the rules of E&W market imply that all generators can construct the vector of expected
TSL for each half-hour during the day before they submit their bids, so the only source of demand
uncertainty to National Power and PowerGen for the purposes of the price-determination process is
the amount of capacity that will be supplied by Nuclear Electric, the IPPs, Scottish producers and
EdF. This implies that there is a finite upper bound, known to both National Power and PowerGen,
on the expected residual demand they face for the purposes of determining the SMP and CC each
load period. Recall that NGC’s forecast of TSL for the next day, not the actual value of TSL for the
next day, is the relevant magnitude used to determine the SMP and the CC (which is a function of
the expected reserve margin via the LOLP). The pool rules, which require all generators to make their

In December of 1993, the E&W Pool introduced demand-side bidding which could be used to builds some11
price-responsiveness into the forecasted total system demand that determines the SMP. However, during the 1995calendar year, the maximum amount of capacity subject to demand-side bidding in any load period was 260 MW, which isa tiny fraction of half-hourly TSL, which ranges from slightly less than 20 GW to more than 45 GW. In addition, as noted
earlier, demand-side bidding is not incorporated into NGC’s day-ahead demand forecast.
21
annual capacity availability plans public, make it easier for National Power and PowerGen to estimate
the residual demand they face, so that when expected aggregate demand conditions favor it, these two
generators can use their availability declarations to obtain very high values of PPP and PSP.
The third way the rules governing the operation of the market enhance the success of the
strategy we describe is that NGC’s estimate of the 48 half-hourly demands for the next day is
completely inelastic with respect to the value of SMP. Recall that where NGC’s day-ahead demand11
estimate crosses the aggregate industry supply curve (the aggregate of the individual generator bid
functions) directly determines the value of SMP and indirectly determines the value of CC through
the value of the LOLP which, in turn, depends on the value of the expected reserve margin. When
both National Power and PowerGen anticipate that a substantial residual expected demand will be
left after the availability declarations of other generators have been subtracted from the NGC’s
forecast of TSL, these two generators have very little incentive to bid aggressively. For the purposes
of determining the SMP and CC, both generators know that total residual expected demand they are
competing over is independent of the bid prices they submit. The only uncertainty they face is which
of the two firms captures more of this expected residual demand by having a larger fraction of their
declared available capacity called into service.
The fourth feature of the market which increases the viability of the strategy we outline is the
diverse mix of generating capacity owned by both National Power and PowerGen. Holding a mix
of generating capacity which contains baseload (low-cost) coal and combined cycle gas turbine plants,
intermediate load (intermediate cost) conventional turbine natural gas plants, and peaking (high cost)

22
oil-fired plants implies a steadily increasing (at an increasing rate) marginal cost function (up to total
capacity of the generator) within any load period. As of the end of the 1995, National Power's
capacity had the following fuel mix percentages, 65.5% coal, 22.0% oil, 12.3% natural gas (both
Open and Combined Cycle Gas Turbine Gensets), and 0.2% hydro. PowerGen's mix was 60.6% coal,
20.6% oil, 18.5% gas (both Open and Combined Cycle Gas Turbine Gensets) and 0.3% hydro. To
construct these percentages, we first constructed a complete inventory of all gensets that bid into the
E&W pool during 1995, including those that bid zero capacity into the pool (had zero Registered
Capacity) for the entire year. We then compiled the ownership, fuel type and nameplate capacity of
each genset from a variety of sources, with the major source the NGC Seven Year Statement
[National Grid Company (1995)]. This was supplemented with information from annual reports of
the UK Electricity Industry [Electricity Association (1994, 1995)], and a report by Aveline, Brough,
and Lobban (1996). This mix of generation capacity possessed by both National Power and
PowerGen yields company level marginal cost functions which are constant or only slightly increasing
for a large range of output, and then increase at an increasing rate to account for the use of
intermediate-load capacity and then peak-load capacity.
3.2. Previous Research on E&W Market
Green and Newbery (1992) is the first paper to analyze the issue of market power in the E&W
electricity market. They model the competition between PowerGen and National Power as a
noncooperative supply function equilibria with deterministic, but time-varying demand within the day,
along the lines developed in Klemperer and Meyer (1989). Green and Newbery construct a
simulation model for the annual amount of electricity sold through the E&W market assuming that
the market clearing prices and quantities sold during each load period are solutions to a static one-
shot symmetric supply function equilibria for three representative days of the year—summer, winter

23
and mid-year—each of which is appropriately scaled to yield annual amounts of electricity sold and
average prices similar to those actually occurring in the market. For each representative day, a player
is assumed to submit a continuously differentiable increasing supply function giving the amount they
will supply to the pool as function of the prevailing market clearing price. The authors then choose
parameters for their simulation model that they feel reflect the demand and cost conditions in the
E&W market.
Based on these simulations, the authors conclude that there is substantial monopoly power
in this market as it currently exists. They then show that this market power could be reduced by
increasing the number of competitors in the market. Green (1996) further extends this supply
function equilibrium analysis of policies to increase competition in the E&W market. He uses linear
supply function equilibria with asymmetric firms to consider impact of the partial divestiture policy
of National Power and PowerGen actually implemented. He finds that this policy would lead to a
substantial increase in the competitiveness of the market, although not as large of an increase as
would occur by splitting Nation Power and PowerGen into smaller companies.
Despite an explicit statement that he does not try to analyze the operation of E&W market,
Bolle (1992) considers three symmetric supply function equilibrium oligopoly models with stochastic
demand. For the version of his model closest in spirit to the Klemperer and Meyer framework, Bolle
finds that increasing the number of competitors leads to prices that converge to marginal costs,
although the rate of convergence is slower the smaller is support of the demand uncertainty.
The supply function models of Newbery and Green and Bolle each assume that the half-hourly
demand which sets the system marginal price is price-elastic. However, as noted Section 2.2, the
pool rules state that NGC’s demand forecast which sets the SMP and CC is completely price-

24
inelastic. This lack of a significant price-response in NGC’s demand forecast enhances the success
of strategy we describe for raising pool prices.
von der Fehr and Harbord (1993) construct a duopoly model of competition between
National Power and PowerGen which acknowledges price-inelastic nature of the demand forecast that
sets the SMP. They assume a price-inelastic market demand that is a realization of positive-valued
random variable with compact support, which is also consistent with the actual operation of the
market, because as discussed in Section 2.2, the only demand uncertainty faced by National Power
and Power Gen is the amount of capacity that will bid by remaining firms in the market. The von der
Fehr and Harbord model requires generators to bid in each of their gensets at a fixed price less than p̄
(what the authors call the maximum possible price), so that by aggregating over all generating units
a producer owns yields its step-function supply curve, which becomes vertical at the point where its
capacity is exhausted. In order to simplify the exposition of their results, but not without a cost in
terms of the market-to-model match, von der Fehr and Harbord assume that each firm has a constant
marginal cost of producing electricity across all of its generating capacity and no fixed costs.
These assumptions yield three results. First is that if, with probability one, either player has
sufficient capacity to supply the entire market, then a pure-strategy equilibrium is price equals the
marginal cost of the least efficient producer and only the most efficient producer sells to the market.
The second result is that if the range of demand—the highest possible demand minus the lowest
possible value—is greater than the maximum of the two generators' capacities, then no pure strategy
equilibrium to the game exists. The third result is that if, with probability one, demand is greater than
the maximum of the capacity of either producer, i.e., both producers must participate in the market
with probability one, then all pure strategy equilibria are such that the market clearing price is p̄, the
maximum possible price. Although the specifics of these theoretical predictions depends on the

25
simplifying cost and demand assumptions made, we will argue that the rules of the PSP determination
process allow something analogous to these three results taking place, depending on the value of
NGC’s total system demand forecast for the next day.
There have been two attempts to quantify the extent of the price/marginal cost markup in this
market using actual prices and TSLs from the E&W market. von der Fehr and Harbord (1993) and
Wolfram (1995) compute short run marginal cost functions for each generator based on the assumed
fuel costs and operating efficiencies for the portfolio of generating technologies available to each firm.
von der Fehr and Harbord also compute the bid schedule submitted by each generator to compare
price to marginal costs across the entire range of output. Wolfram takes the actual market PPP and
TSL and computes a price/marginal cost markup using the marginal cost function computed as
described above. Wolfram also applies three different methodologies which, to varying degrees,
leverage off of assumed duopoly models of the interaction between the two generators to recover an
estimate of the price/marginal cost markup. The results of these three approaches are found to be
broadly consistent with the finding of her first approach that the price/marginal cost markup is in the
neighborhood of twenty-five percent.
This work on the E&W market points out several important aspects of the market structure
and market rules which contribute to the ability of National Power and PowerGen to maintain prices
in excess of average costs for extended periods of time. However, all of these papers focus only on
the bid prices of the two generators, and not their capacity availability declarations, as the mechanism
used to exercise market power. The strategy we describe involves simultaneous use of the bid price
and availability declarations. In particular, we will argue that two generators rarely bid a price for
a specific genset substantially in excess of it marginal cost. Instead, by strategic capacity declarations
they are able to ensure that a high marginal cost genset sets the value of SMP during the peak load

26
periods for the day which then yields a high value of SMP. This strategy also yields a low expected
amount of excess generation capacity available, which leads to a high value of LOLP and a large
value of CC, so that the PPP = SMP + CC is significantly higher than it would otherwise be.
3.3. The Strategic Availability Declaration Strategy for Exercising Market Power
We now describe our story of the exercise of market power in the E&W market. It involves
the four aspects of the market structure and market rules described in Section 3.1 and builds on the
previous theoretical and empirical literature described in Section 3.2. An important aspect of this
strategy is the ability, noted in Section 2.4, of the capacity charge and uplift charge to yield extremely
high values of the PSP. We believe that these periods of very high values of CC and UPLIFT are the
result of strategic decisions by National Power and PowerGen. Because of this strategy, these periods
of high values of CC and UPLIFT tend to coincide with periods of high values of the SMP, resulting
in large values of the PPP and PSP.
National Power and PowerGen have at their disposal two strategic weapons to influence the
PPP and PSP each period: (1) the SMP function that they bid into pool and (2) the amount of
capacity they decide to make available to the pool each half-hour, i.e., the point at which the bid
function becomes vertical. This second choice is particularly crucial to the final PPP, because NGC
uses the sum of these available capacity declarations to compute the expected reserve margin for each
load period, the amount total available capacity is above the forecasted demand for that load period.
The LOLP entering into the computation of CC is decreasing in the expected reserve margin.
Furthermore, as Bunn and Larsen (1992) report, this function is extremely convex for low expected
reserve margins, indicating that the marginal increase in LOLP brought about by a fall in the expected
reserve margin is larger, the smaller is value of this margin. This nonlinear relationship between the

27
expected reserve margin and the LOLP indicates that by strategically withholding capacity to obtain
a small margin, large values of LOLP and hence large values of CC are possible.
Bidding prices in excess of marginal cost for each genset is one way for these producers to
obtain large values of the SMP and therefore large values of the PPP and PSP. However, because
it is relatively straightforward to perform the marginal generation fuel cost calculations for each
genset using its fuel costs and heat rates as described in von der Fehr and Harbord (1993) and
Wolfram (1995), bidding substantially above the marginal cost for any genset would be relatively easy
for the Director General of OFFER to detect. The maximum value of the SMP for the entire sample
is 180 £/MWH, whereas, as is shown in Figure 2, the value of PSP is often substantially in excess of
this value, particularly in during the 1991/92 and 1994/95 fiscal years. Generators would face severe
credibility problems rationalizing bids in excess of 100 £ /MWH for anything but peak load gensets.
Given the CC determination process, bidding high prices for each genset owned and offering as much
capacity as possible each period is not likely to be nearly as profitable as strategically withholding
capacity. A large amount of available capacity would result in a high expected reserve margin in most
periods and therefore a very small LOLP and hence a very small CC, so that the SMP would
comprise all but a small fraction of the PSP. For these reasons, given the market rules, bidding prices
substantially in excess of each genset’s marginal cost to obtain high prices is not likely to be as
successful at achieving this goal as a strategy involving capacity withholding.
A more high-powered and more difficult to detect strategy for the two major generators is
to bid each genset at close to its marginal cost and then declare capacity unavailable in different load
periods throughout the day so that the forecasted value of TSL for the next day crosses the day-ahead
aggregate industry supply curve in the rapidly increasing portion of aggregate bid function for as
many load periods during the following day as is feasible given the physical constraints of bringing

28
gensets on and off line. By declaring unavailable capacity from the flat (baseload) portion or upward
sloping (intermediate load) portion of the bid function, a generator can control where its bid function
becomes very steep. This strategy achieves a large value of SMP and, more important, a small
expected reserve margin and accompanying large value of CC during these load periods. During the
other load periods within the day the forecasted value of TSL may not intersect the aggregate supply
curve in its upward sloping portion because of the physical constraints on genset operation and the
increased cost of starting-up gensets or running them at substantially less than full capacity. During
these periods, the SMP is set by baseload and intermediate load gensets which results in low values
of the CC and UPLIFT, because of the accompanying high expected reserve margin. Consequently,
this bid price and availability declaration strategy yields a price pattern within the day that has the
large ratio of the highest to lowest PSPs within the day referred to in Section 2.4.
Figure 4 illustrates the potential increase in SMP and CC that results from this capacity
withholding strategy. The top two graphs plot representative marginal cost and bid functions for
Firms 1 and 2. Notice that no gensets are bid in at significantly above their marginal cost of supply
for either firm. In this case, capacity has been withheld from the flat portion of each firm’s supply
curve. The third graph plots the aggregate marginal cost and bid functions and gives the SMP that
results from the intersection of these curves with the forecasted total system load (FTSL).
Comparing the magnitude of total availability associated with the bid function, TAVAIL(Bid), and
that from marginal cost function, TAVAIL(MC), to the value of FTSL, we can see that the expected
excess available capacity will be significantly higher for TAVAIL(MC) versus TAVAIL(Bid), so that
the LOLP(MC) will be much smaller than LOLP(Bid), so that CC(MC) will be much less than
CC(Bid). Combining the results for the SMP and CC, yields a value for PPP(MC) than is

29
substantially less than PPP(Bid), despite the fact that the actual amount bid for any genset is not
significantly above it marginal cost of supply.
Before presenting our evidence in favor of this strategy, we discuss our choice of PSP as the
relevant price for the purposes of assessing the exercise of market power. As discussed in Section
2.2, generators receive the PPP for all electricity they supply during each load period, so that a case
could made for that being the relevant price to measure the ability of generators to earn above normal
profits. However, generators also receive the availability payment described in Section 2.2 for all
generating plant which is declared available but not used during each load period. These availability
payments are made through the uplift charge. There are other payments made to marginal generators
unexpectedly called upon to produce during the following day which are also paid for through
UPLIFT. We focus our story on movements in the PSP rather than the PPP, because higher PSP
means more revenues to generators in the form of availability payments, payments for activities
associated with plant start-up at different times of the day, and payments for other ancillary services.
Because of the relationship between the CC and the availability payments, there is a very high positive
correlation between the CC and UPLIFT, so that whether we use PPP or PSP, the general
conclusions of our analysis will continue to hold.

30
3.3. Evidence for Use of Strategic Capacity Availability Bidding
Because of both the mix of generating capacity owned by National Power and PowerGen and
the likely non-strategic bidding behavior by other participants in the E&W power pool, evidence
consistent with this available capacity withholding strategy would be that either of these two firms
is the marginal bidder setting the SMP for the vast majority of load periods. Since November 1,
1995, NGC has collected information on the identity of the marginal genset each load period. From
November 1, 1995 to March 31, 1996, National Power was the marginal genset 49% percent of the
load periods, with PowerGen setting the SMP 35% of the load periods. NGC's Pumped Storage
facilities were the marginal genset 11% of the load periods. The next highest fraction of load periods
a producer was the marginal generator was approximately 2% by EdF. Consequently, the sum of the
times that either National Power or PowerGen sets SMP is 84%, which is substantially more than the
54.5% fraction of annual TSL that these two producers generated during the 1995/96 fiscal year and
is more than the approximately 60% of 1995/96 capacity available to the E&W market that these two
generators control.
The amount of capacity National Power and PowerGen offer to supply to the market varies
considerably over the course of the year. Figures 5 and 6 plot for National Power and PowerGen,
respectively, estimates of their marginal cost functions and actual bid functions for January 18, 1995
and July 19, 1995 during the load period ending at 10:30 am. Both days are a Wednesday, which
tends to have the highest peak demand of any day of the week. We construct our estimate of the
marginal cost function for each producer by the following procedure. For each genset owned by
these two firms we first compute the maximum amount of actual availability declared within any load
period during the calendar year 1995. We think of this as a lower bound on maximum capacity
available from each genset. For each genset we then compute the minimum bid price offered for that

Because there is evidence of seasonal variation in the marginal cost of generating electricity from a given genset12
due to weather and other factors, for this reason and various others, our procedure for estimating the marginal cost shouldbe interpreted as yielding only a rough estimate of this function.
31
genset in any load period when this maximum availability is offered during the year. We can think
of this minimum genset bid as an upper bound on the marginal cost of that genset. Ordering these
maximum genset availabilities from the lowest to highest minimum price, and then aggregating the
total amount offered at less than or equal to each price yields the solid line given in each figure. We
believe this process yields an upper bound on the true marginal cost function. These marginal cost12
curves are plotted on both the July 19, 1995 and January 18, 1995 bid function graphs for both
generators.
These figures show that the available capacity for both generators, where their bid functions
end, is at a substantially higher capacity in February than in July. PowerGen's ends at 9.6 GW in July
and 15.6 GW in February and National's ends at 14.5 GW in July and 20 GW in February. Although
some of this capacity variation can be explained by scheduled maintenance or downtime for repairs,
it is very difficult for the Director General of OFFER to verify the extent to which the scheduled or
unscheduled maintenance was necessary. Consequently, generators can simply decide to declare
capacity unavailable. As Section 2.3 notes, the regulator has attempted to impose more formal
oversight over this capacity declaration process by requiring the submission of a yearly plan for plant
availability and an ex post explanation for any deviations from this plan. However, this requirement
seems unlikely make strategic use of available capacity declarations by PowerGen and National Power
less frequent, particularly in light of recent trends in net capacity reductions over the past five years
by these two producers.
To demonstrate that the differences in the endpoints of the bid functions across peak and off-
peak months given in Figures 5 and 6 are representative of all load periods throughout our sample

32
period, the following exercise was performed. For each load period, the ratio of total system capacity
used to the total system capacity actually declared available was computed. Figure 7(a) plots
estimates of the density of this ratio for all weekday (Monday through Friday) load periods in peak
months (November, December, January , and February) and for all weekday load periods in the
remaining off-peak months. Note that the two densities are very similar in shape and location. Figure
7(b) plots the densities of the ratio of total system capacity used in each load period to the maximum
of declared available system capacity over all load periods during that fiscal year for the peak-month
and off-peak month samples. This maximum declared available system capacity over all load periods
within a year is a lower bound on the actual maximum available system capacity to serve the market
each year. The major difference from Figure 7(a) is that the density for off-peak months is a leftward
shift of the density for peak months. Similar results hold if these two figures are constructed for
weekend day load periods only.
Figure 7(a) shows that the average value of available system capacity in the peak months is
51 GW as compared to 43.7 GW in the off-peak months. This indicates that, on average, 7.3 GW
(14.3% of peak available system capacity) is not made available during the off-peak months.
Comparing this figure to 32% = [(6 + 5.5)/(15.6 + 20)], the percent reduction in total capacity made
available by PowerGen and National Power combined (during the load period ending at 10:30 am)
on July 19, 1995 relative to January 18, 1995, demonstrates that the primary source of these
differences in total system capacity availabilities across peak and off-peak months is due to the
strategic capacity withholding behavior of PowerGen and National Power.
Although the von der Fehr and Harbord (1993) modeling framework ignores the CC and
UPLIFT determination process, their theoretical model yields several predictions about the
relationship between the SMP and NGC’s day-ahead forecast of TSL. To examine these predictions

It is important to emphasize that this 17.8 GW is the maximum possible capacity that the remaining firms13
could supply. They will most likely often supply significanlty less, which is why we chose 20 GW as our cutoff for thefirst von der Fehr and Harbord pricing regime.
33
we divided load periods into four groups: those where we felt it was likely that generators believed
with high probability that either of them could satisfy the entire forecasted market demand [where
NGC’s forecast of TSL (hereafter FTSL) is less than 20 GW], two intermediate demand periods
consistent with the intermediate mixed strategy range of demand realizations from the von der Fehr
and Harbord model (20 GW < FTSL # 35 GW and 35 GW < FTSL # 45 GW), and high demand
periods where with high probability both generators know they would both be significantly in the
market (FTSL > 45 GW), i.e., the maximum of the offered availabilities of PowerGen and National
Power is less than the residual FTSL faced by both producers.
We choose the first regime to be those load periods with FTSL less than 20 GW on the belief
that net of the 9.2 GW capacity of Nuclear Electric, the 1.6 GW capacity from Scotland (maximum
generation capacity to E&W is constrained at this level by the transmission capacity) and the more
than 5 GW of independent and REC generating capacity, and 2 GW from France (maximum
generation capacity to E&W is constrained by transmission capacity) for a total of 17.8 GW, leaves
a sufficiently small residual demand that either generator knows with virtual certainty that either can
supply the entire expected residual demand. Under these conditions, von Fehr and Harbor argue13
that the standard Bertrand price-setting equilibrium will result. However, crucial to this pure-strategy
equilibrium holding are the simplifying assumption of no fixed costs of generation and constant
marginal costs. The presence of fixed costs and increasing marginal costs does not rule out the
conclusion of vigorous of price competition for this level of demand, but this does imply that only
mixed-strategy equilibria exist (Tirole, 1986, p. 215). The calculations reported in Table 3, for the
most part, show this point to be true. The third and fourth columns of the table report the mean and

34
standard deviation of the SMP for each year and each of the four regimes. For each of the four years,
the mean value of SMP in the first FTSL regime is less the mean of SMP for the other three regimes.
Mean values of SMP within a year get successively higher moving from the first to fourth
regime, although the volatility of SMP, as measured by its sample standard deviation, tends to exhibit
an inverted U-shaped pattern. For all of the years, by far the largest increase in the mean of SMP is
across the third to the fourth regime. This is particularly true for the fourth fiscal year (1994/95)
where the mean increases from 30.54 £/MWH (in the third regime) to 68.36 £/MWH (in the fourth
regime). von der Fehr and Harbord argue that, for their model, the largest possible feasible price is
set in those periods where both generators know their capacity will be required with probability 1.
We assume that this will occur for all values of FTSL greater than 45 GW on the belief that
subtracting maximum amount of capacity available from other participants in the market besides
National Power and PowerGen leaves 28 GW, which is greater than the capacity of National Power
(the larger of the two producers) for all years in our sample.
Given the regulatory process in the UK one might argue that the maximum feasible price is
the political limit price described by Glazer and McMillan (1992), where if the SMP rises above this
point the Director General will step in and refer the generators to the Monopolies and Mergers
Commission, as he has threatened to do several times. We would expect this limit price to depend
on both the political strength of the Director General and the attitude of the Government towards the
industry. There has been considerable changes in both of these variables over the four fiscal years
in our sample. We would therefore expect differences in this maximum price across the years as is
illustrated by the changing mean of SMP for the (FTSL > 45GW) regime across the four years.
A comparison of the sample standard deviation (SD) of the SMP across each of these regimes
within years is also broadly consistent with the existence of the three pricing regimes described by von

35
der Fehr and Harbord. First, with exception of the third year, the sample SD of the SMP for the first
regime is substantially smaller than the sample SD of the SMP for the other three regimes within that
year. The other interesting aspect of the behavior of the sample SD across regimes is that for two
of the four years, the sample SD of SMP for the fourth regime is smaller than the SD of the SMP for
either two of the intermediate regimes in the same year despite the substantially larger mean value of
SMP for the fourth regime. For the first year, the difference between the SD of SMP across the
second and third regimes versus the fourth regime is not very large given the corresponding difference
in the magnitudes of the means. Computing volatility as the ratio of the SD to the mean yields the
inverted U-shaped relationship between volatility and the four FTSL regimes for all four years. These
volatility results are broadly consistent with the von der Fehr and Harbord view that in those loads
periods when both National Power and PowerGen know they will be significant participants in the
market the SMP is the political limit price, hence the high mean and relatively low volatility. The
volatility of SMP in the intermediate range can be interpreted as consistent with the notion that only
mixed strategy equilibria exist in the von der Fehr and Harbord model for this range of demand
realizations. While these results cannot confirm the validity of the von der Fehr and Harbord view
of the operation of the market, we do feel their model provides a useful theoretical lens through
which to view the behavior of the SMP.
Abstracting away from their model, a possible interpretation of Table 3 is the following.
During load periods in the day when forecasted demand is known to be very low, National Power and
PowerGen will bid very aggressively in terms of available capacity relative to demand and prices, so
that SMP will be very low. During periods in the day of extremely high system demand National
Power and PowerGen do not bid as aggressively in terms of available capacity and prices, because
they know that regardless of the price they bid, a large fraction of each their respective capacities will

36
be called upon to serve the forecasted demand. The generators therefore take advantage of their
superior market position to raise SMP. In the intermediate demand periods, both PowerGen and
National Power attempt to not bid aggressively in terms of available capacity and bid functions, but
the temptation of one to undercut the other makes it difficult to consistently maintain high values of
SMP during these periods, because aggressive bidding by one of the two participants when the other
bids high results in it being able to supply a substantial portion of the forecasted residual demand at
this high price and leaving the market-price-setting higher bidding competitor with only a small
fraction of the market. This desire to avoid being the substantially out-of-the-market price-setting
generator brings about the observed high volatility in SMP
Because we do not have information on generation costs for PowerGen and National Power,
we cannot rule out the possibility that the SMP is being set in excess of the short-run marginal cost
of running a generation unit in all load periods. The SMP/short-run marginal cost markups computed
by von der Fehr (1993) and Wolfram (1995) provide evidence of prices above marginal costs. Their
definition of short run marginal cost is a lower bound on the short run marginal cost of production
because it accounts for only the fuel costs associated with running the plant. By this logic the short-
run marginal cost to run a hydroelectric plant would be zero, although both authors do assign a
positive marginal cost to hydroelectric plants. There are short-run labor and materials costs besides
fuel costs which increase the short-run marginal cost. In addition, the short-run marginal cost, or so-
called system-8 by the US Electricity Generation Industry, can vary considerably for a given plant
depending on the manner in which a plant is operated. For example, several of the large coal-fired
power plants in the UK are used to provide power for only a fraction of the day. Consequently,
operating such plants in this load-following manner makes it much less energy-efficient, so that the
short-run marginal cost of producing power is higher and very sensitive to the changing level at which

This figure includes the maximum transmission constrained capacity from both Scotland and France14
and gensets that are not closed or decommissioned but have zero Registered Capacity as of March 31, 1995.
37
the plant is operated. This aspect of plant operation further complicates the accurate calculation of
short-run marginal cost.
Crucial to making strategic use of available capacity declarations produce high values of PPP
and PSP is an extremely low expected reserve margin, which brings about nonlinear increases in the
LOLP and large values for the capacity charge and availability payment. An easy way to make low
expected reserve margins more likely given the very predictable level of total system demand referred
to in Section 2.4 is to undertake net plant retirements. In the early years following privatization, there
were very large number of announced capacity additions. For example, in early 1992, The Economist
ran an article stating that if all stations are built and closed according to announced plans at the time,
the E&W market would have excess capacity over peak winter demand on the order of 50% by 1995,
well above the value of 20% in most countries, because of the so-called "dash for gas" in form of
announced new Combined Cycle Gas Turbine capacity by PowerGen, National Power, independent
electricity producers and the RECs.
The actual course of events has been quite different. Over the four fiscal years April 1, 1991
to March 31, 1995, approximately 5 GW of net capacity was retired in England and Wales (Electricity
Association, 1995, p. 27). This is 8.7% of the approximately 60 GW of capacity in currently serving
the E&W market. These net retirements have taken place despite the fact that total electricity sales14
grew at a little less than 1% per year over this same time period. This course of events over the past
five years has made it increasingly likely that National Power and PowerGen can, through their
availability declarations, obtain low reserve margins during an increasing number of load periods.
During the fiscal year 1994/95, 1.5 GW of the 5 GW of net retirements occurred, which explains, in

38
part, the extreme volatility in CC and UPLIFT during this year relative to other years, with the other
part of the story being the unexpected unavailability of two Nuclear Electric stations during
December and January, making it easier for National Power and PowerGen to obtain high values of
LOLP.
The increasing variance in SMP over the four years of data in each of the last three supply
regimes given in Table 3 implies that this capacity availability withholding bidding strategy is being
used with increasing regularity. The large drop in the Registered Capacity of National Power from
April 1, 1990 to March 31, 1995 of 28.3 GW to 20.2 GW and smaller fall in the Registered Capacity
for PowerGen of 17.4 GW to 15.6 GW over the same period (Electricity Association 1995), implies
that it takes smaller and smaller extremes in TSL to hit the residual demand regime where both
PowerGen and National Power know with virtual certainty they will both be required to supply
significant amounts of their capacity during the peak periods of the day, which are the conditions
required for this strategy for temporarily raising the SMP and CC to work. The actual capacities of
both National Power and PowerGen have also fallen over this same time period.
This pattern of Registered Capacity adjustments by PowerGen and National Power provides
further evidence consistent with the use of this capacity availability limitation strategy. The
maximum-price third regime of the von der Fehr and Harbord model requires that the probability of
the event ( FTSL $ max(K , K )) is one, where K is the amount of capacity bid in by PowerGenPG NP PG
and K is the amount of capacity bid in by National Power. Both firms would like to bid smallNP
capacities of approximately the same magnitude to make this regime most likely to occur. The
greater the difference between the capacity holdings of National Power and PowerGen the less likely
is the event that TSL will be above the maximum of both of these generators capacities. Given the
initial substantially larger Registered Capacity of National Power, to obtain close to equal generation

39
capacities would require a substantial reduction in National Power's initial 1990 Registered Capacity,
as has in fact occurred. The pattern of adjustment in actual capacities since privatization has followed
this same pattern, with the largest reduction in capacity from National Power.
To illustrate that the SMP is frequently set substantially in excess of the short run marginal
cost of supply, we perform the following exercise. First we select bins of TSL from 15 GW to 48
GW increasing in 1 GW increments. For each of these TSL bins we compute the maximum, minimum
and mean values of SMP, CC, UPLIFT and PSP over all 70,128 = [3*(365)+366]*48 load periods
in our sample. We then plot these three values as a function of the level of TSL associated with that
bin. Figure 8 plots these figures for PSP and the three components of PSP. The first thing to note
from the figure for SMP is our claim that there is a substantial range for SMP for all TSL levels. In
particular, the largest value of SMP occurs in the 31 GW TSL bin. The other point worth noting, but
not shown in this graph, is that although the range of SMP is virtually invariant to the level of TSL,
the frequency of very high values of SMP increases with the level of TSL. This is consistent with our
logic that this strategy for obtaining temporarily high levels of SMP is most feasible to implement in
the peak demand months. This plot for CC illustrates that significant capacity charges occur at TSL
levels as low as 30 GW, and that there is the possibility of enormous capacity charges during the
highest TSL load periods. Large capacity charges have also been implemented for TSLs in the range
31 GW to 42 GW, which contains the daily peak TSL of all off-peak months. The corresponding
graph for UPLIFT illustrates that large values of UPLIFT occur primarily in the high TSL load
periods, although there are some significant values in the range of the daily peak of the off-peak
months. Finally, the PSP plot more closely resembles the CC and UPLIFT plot more than the SMP
plot, with extremely high ranges of PSP associated with very large demand levels.

40
These figures also provide evidence that there exist many periods when price is set above
short run marginal cost if we are willing to assume that the minimum SMP for each TSL bin is an
upper bound on the short-run marginal cost to produce that level of output from the pool. This
assumption seems reasonable since this minimum SMP did actually clear the market and result in the
supply of that amount of electricity during one load period during our sample period. Subject to this
assumption, the SMP graph illustrates that, on average, SMP is substantially above the short-run
marginal cost for all ranges of output and that this margin is lower for higher levels of TSL.
This point deserves further comment. Recall that large values of SMP are obtained when the
aggregate supply curve intersects the level of expected TSL at the marginal price associated with a
high cost generating set. The success of our capacity availability withholding strategy at achieving
large values of SMP and CC does not imply that either PowerGen or National Power bids
significantly above the short-run margin cost for any of its generating sets, only that for certain
periods within the day the very high marginal cost peaking capacity will be called on line, and this will
lead to a high value of SMP and a high LOLP and therefore a high value of CC. The decline in this
price/marginal cost markup with higher values of TSL is consistent with this strategy of
simultaneously withholding baseload capacity in low FTSL periods and bidding gensets at close to
their marginal cost.
This markup over short-run marginal costs (defined as the ratio of the mean of SMP less the
minimum SMP for that TSL bin divided by this minimum SMP value) averaged over the TSL bins
from 16 GW to 45 GW yields a value of 193%. The very large, but variable, upper envelope on SMP
illustrates that SMP can be far above the short-run marginal cost of supply in load periods particularly
conducive to the supply-function/capacity-availability-limitation strategy. The PSP figure illustrates
this same point. If we take the lower envelope for PSP as an upper bound on the minimum marginal

41
cost of supplying electricity to the RECs, this figure illustrates a substantial price/marginal cost
markup. The average value of this price/marginal cost markup over all TSL bins is 232%. This
markup is particularly large at the high levels of TSL, different from case of SMP. This result is due
in large part to the very nonlinear relation between the LOLP and the reserve margin, which makes
CC increase at an increasing rate as the reserve margin gets smaller.
To investigate the impact of the presence of large amounts of sales covered by contracts for
differences during the first two years of our sample, we reproduce these graphs for the first two and
last two years of our sample separately in Figures 9 and 10, respectively. The qualitative features of
all of the four graphs described above remain the same across the two-year periods. These graphs
illustrate that magnitude of the coverage of electricity production by CFDs does not appear to have
changed the frequency or success with which this strategy has been used. We are also concerned
that this pattern in the graphs is purely a peak-month phenomenon. Consequently, we produce these
four figures using only load periods from the off-peak months, reducing the highest TSL bin to 44
GW. Once again, the same features of the four graphs described above are present in these graphs
given in Figure 11, but the ranges of the CC and UPLIFT are less in absolute value, indicating that
this capacity availability withholding strategy appears to be used in both peak and off-peak months.
A final piece of evidence in favor of strategic capacity availability bidding by National Power
and PowerGen is the simultaneous existence of average genset availabilities below industry availability
standards for gensets owned by these two companies and average genset availabilities for the
remaining gensets bidding into this market that are close to or exceed industry availability standards.
We compute average availability factors by fuel type for both National Power and PowerGen by
taking the ratio of the sum of capacity declared available (Actual Availability) over all half hours for
all gensets of each fuel type owned by each company for the entire calendar year 1995 divided by the

North American Electric Reliability Council (1996). NERC collects and supplies data for availability15
benchmarking, among other things, for more than 4,400 electricity generating units from 179 electric utilities inthe United States and Canada. This data is widely used in electricity industries throughout the world, includingNational Power, PowerGen, and others in the E&W market.
Capacities by fuel type are constructed using the inventory of gensets serving the E&W market described16
in Section 3.1. The capacity figures given in Table 4 include all gensets that bid into E&W pool during 1995,including those that bid zero availability.
42
total genset capacity of that fuel type owned by that company times the number of half-hour periods
in 1995. This availability factor gives the percentage of each firm’s annual potential generation
capacity by fuel-type that is actually made available. For industry standard plant availabilities we use
the North American Electric Reliability Council's (NERC) equivalent availability data. Table 415
presents total capacity as of the end of 1995 and average actual availabilities by plant type, for
National Power, PowerGen, Nuclear Electric, and several IPPs calculated as described above. The16
last column of the table is the average availability factor that would result if the plants were made
available according to the NERC average availability factors. These figures are computed as a genset
capacity weighted average of the equivalent availabilities from the NERC database over all gensets
of each fuel type for PowerGen, National Power and Nuclear Electric, because the NERC equivalent
availability figures can vary by the size of the genset for each fuel type. Because there are no direct
comparisons for some generating technologies—the MAGNOX and AGR nuclear generating
technologies, which are unique to the U.K., are particularly problematic. There are other differences
(e.g., weather, load factor, etc.) which may affect plant availability, we use the most conservative (in
terms of providing evidence in favor of our arguments) NERC availabilities for our comparisons.
Because Combined-Cycle Gas Turbine (CCGT) generators are relatively new to the US and Canada,
there is a single availability factor for this technology in the NERC database. The actual mean
availabilities for National Power and PowerGen range from 11.6 to 63 percentage points below the
benchmarks across the plant types. Because of the many differences between plant operation and

43
technology in the US and UK, the magnitude of these differences is less important than the sign,
particularly in light of the opposite sign of results of the same comparison for the IPPs. The two
actual average availability figures for Nuclear Electric are similar to those computed using the NERC
data. For all of the IPPs given in the table, the actual average availability exceeds the value computed
using the NERC data. This difference between actual average availabilities of gensets owned by
National Power and PowerGen versus Nuclear Electric and the IPPs is evidence consistent with the
use of strategic withholding of capacity by National Power and PowerGen.
3.4. Quantifying the Extent of Market Power
The fact that generators on average bid in excess of the short-run marginal costs of production
is not surprising given the structure of the technology of generation. In particular, assuming the fixed
cost and increasing marginal cost specification which is embodied in the short-run marginal cost
functions computed by von der Fehr and Harbord (1993) and Wolfram (1995), the short-run cost
function for a given load period takes the form
C(q) = F + c(q),
where F embodies the fixed capital, labor and materials costs for that period, and c(q) is an increasing
function of TSL (which we denote by q) giving the variable costs of fuel, labor and materials for
output level q. Given this specification, pricing at marginal cost can lead to losses because the price
can be set below the average cost of production for ranges of output even on the steeply increasing
portion of the short-run marginal cost curve if the fixed cost is a significant component of total costs.
Consequently, in this section we attempt to obtain a estimate of the average margin by which the
PPPs or PSPs these two generators obtain exceed their average costs.
According the Christensen and Greene (1976), the fixed cost (capital and labor) component
for electricity generation is approximately 40% of the total costs of production for most fossil fuel

The US Energy Information Administration (1992) reports accounting capital and labor costs of coal-fired17
generating plants to be approximately 42% of total costs for 1990. Analogous data, from the same source, for nuclearplants implies an 88% cost share.
44
generating capacity. However, given the increasing energy efficiency of new capacity and the17
increasing amount of capital and labor expenditures required at fossil fuel plants to control SO , NO ,2 X
and other emissions, this fixed cost fraction should be growing over time. Figure 12 plots the short-
run marginal cost curve and average total cost curve under these assumptions to illustrate the point
that pricing at marginal cost for wide ranges of output can yield losses, implying that in order to
remain financially viable generators must on average bid in excess of average costs. For this reason
it is difficult, if not impossible, based on the evidence presented, to determine definitively the extent
to which generators are earning excess profits from their generation.
However, with a few extreme simplifying assumptions we can get a rough idea of the
magnitude that the average PSP or PPP is above the average cost of production. Assume that C(q)
takes the form of a fixed-cost, constant marginal cost specification as: C(q) = F + cq. Let total costs
be such that the ratio of F/(cq+F), the fixed cost share, equals 50 percent (to account for fuel
efficiency gains and the fact that not all of National Power’s and PowerGen capacity uses fossil fuels)
at the observed output level q. This implies that F = cq, so that C(q) = cq + cq = 2(cq), so that
average cost is equal to 2c at this output level. This implies that PSP must be set at approximately
100% above marginal cost on average to cover the total costs of production. From the graphs in
Figure 8 for PSP we argued that PSP was set approximately 200% above short run marginal costs.
Consequently, by these very rough calculations the PSP is set, on average, approximately 50% above
average cost. Repeating this same calculation with a fixed cost share of 66% yields the result of a
zero markup of price above average cost.

45
Increased revenues are earned by strategic use of capacity availability declarations because
high values of the PSP coincide with high demand load periods. Simply looking at the annual average
price charged within a year gives a misleading picture of the increased returns earned from this
strategy. To illustrate this point, we first compute the product of price times the quantity sold in each
load period over the entire year for the PSP, each component of the PSP and for the PPP. This is the
actual total revenue produced from each of these charges. These numbers are reported in the third
column of Table 5. The fourth column presents the percent of actual total revenue (the third column)
that would be obtained if the price charged for all load periods within each day was the daily average
price, the sum of the 48 within-day prices divided by 48. The fifth column computes the percent of
total revenue that would be obtained if the price charged for all load periods within a week was the
average weekly price, the sum of the 336 prices within the week divided by 336. The sixth column
presents this same figure assuming the price charged for all load periods within a month is the
monthly average price. Finally, the last column presents the figure assuming the price charged for
all load periods within a year is the yearly average price. The remarkable feature of this table is the
very small reduction in the percentages across any row in the table moving from using the daily
average price to the yearly average price. However, using the daily average PSP relative to the actual
PSP in each load period within the day can lead to substantial reductions in the total revenues. For
PSP for the fourth fiscal year in our sample, the revenues using the daily average value of PSP are
94.27 percent of the actual revenues generated.
To provide a lower bound on the profitability of this capacity availability withholding strategy
we make the following calculation. Assume that the actual total costs of generation are equal to the
total revenue that would be generated if the yearly average price was applied to all load periods. This
implies that averaging over all load periods within a year the market clearing PSP or PPP is equal to

46
the average cost of generation. This assumption implies that total costs are approximately 95% of
total revenues from PSP or PPP over the four years in our sample. Assume the cost shares of capital,
labor and fuel are consistent with those from Christensen and Greene (1976): 20%, 20% and 60%,
respectively. The increase in the return to capital from this strategy is 0.05(TC)/0.20(TC) =
(Increased Return to Capital)/(Return to Capital Assuming Zero Profits) = 25%. In other words, the
return to capital in this industry is increased by 25% as result of this strategy. To give some idea of
the sensitivity of these results to our cost share assumptions, we repeat this calculation for a 30
percent capital share to yield at 16% increase in the returns to capital. Both of these increases in the
returns to capital are conservative estimates of the increased returns to capital from the use of this
capacity availability declaration strategy because we assume that the average cost for each load period
is a yearly average price which includes the very high-priced load periods. This calculation does,
however, go a long way towards explaining the rapid increase in the stock market values of National
Power and PowerGen over the past four years and increased levels of compensation paid to the chief
executives of these firms over this same time period.
4. Lessons from England and Wales Electricity Market
The E&W electricity market offers many valuable lessons for a region of the US or country
considering the design of a spot market for wholesale electricity. Many of these lessons follow
directly from the market structure, but other more subtle and perhaps important lessons arise from
the rules governing the operation of the market.
The most basic lesson is that competition in name is just that. Whether or not setting up an
electricity market similar to the E&W market will deliver benefits to consumers in the form of lower
electricity prices, depends on the market structure and the details of the market rules governing its
operation. Subtle differences in the rules of the market can dramatically enhance the ability of

47
generators selling into the market to set prices substantially in excess of their marginal and average
costs. To ask these generators not to serve their shareholders and exploit these market rules to earn
higher profits, is contrary to the purpose of privatizing these firms (thus giving firms the incentive to
maximize profits) and introducing competition into this market. Instead, when designing these
markets special care should be taken to specify the rules governing its operation so that there are
few, if any, opportunities for generators to use them to set prices substantially in excess of their
average costs.
On the issue of market structure, the Director General's recommendation of divesting both
National Power and PowerGen of a substantial fraction of their generation capacity is a step in the
right direction. However, given the relatively small magnitude of the mandated reductions, it is
doubtful these sales will significantly reduce the viability of the capacity availability withholding
strategy. The end result will still be two large producers each with a mixture of generation
technologies and the ability to supply a large fraction of TSL, which are the essential ingredients for
the success of this strategy.
Simply introducing more firms into the market will most likely have little effect of the success
of this strategy. There are already many IPPs serving this market, so that simply increasing the
number of competitors is not the solution. Given the current number of firms in the market and the
market rules, what is important to limiting market power is reducing the size of the largest firm
relative to all others. The key to the success of this capacity-withholding bidding strategy at obtaining
high prices is that frequently the largest generator knows that a significant portion of its capacity will
be called upon, regardless of the price it bids. If all generators are equal in size and total system load
is significantly less than the sum of their capacities, then only very rarely, if ever, will the largest
generator know with virtual certainty that a substantial fraction of its capacity will be required to

48
serve the market. If the amount of available capacity from all generators is such that at the forecasted
TSL, the capacity of the largest generator is not required to serve the market, then all generators will
have an incentive to bid very aggressively, because all of them face the prospect of being left out of
the market during that load period. The larger is the extent of demand uncertainty faced by the
largest firm relative to its capacity, the less likely this capacity withholding strategy will be successful.
The current California pool plan entails two very large generating companies selling into the
pool: Pacific Gas and Electric (PG&E)and Southern California Edison (SCE), each with a mix of
high and low-cost generating technologies. While three competitors may be sufficient to encourage
vigorous competition in a market not governed by the E&W rules of operation, the UK experience
suggests that if the E&W rules are adopted, a necessary condition for this capacity withholding
strategy to be unprofitable is that levels of TSL do not occur where all generators know that demand
is such that they all must be significant participants in the market. If the demand condition that all
generators are required to serve the market occurs sufficiently often, then there does not appear to
be any reason to believe that three competitors will be any more successful than two competitors at
keeping pool prices down. The CPUC and State Legislature have recognized this logic and are
requiring both PG&E and SCE to divest themselves of substantial portions of their generating
capacities. PG&E is seeking approval from the CPUC to sell a total of 3.074GW of gensets and SCE
proposes to sell about 10GW of capacity (Jenks and Whitcomb, 1997).
Another major lesson from the E&W experience is that the rules governing the market can
present opportunities for the large producers to exploit their market power and many of these modes
of exercising market power are subtle, but high-powered in the sense that they can yield high rates
of return. These strategies can be difficult to detect and even more difficult to correct. In the UK
market, there are several factors that have made the strategy of withholding capacity an attractive way

49
to raise the PSP. First, it is very difficult to detect. An alternative way to obtain a very high PSP
(similar to those achieved in load periods when CC is very large) is for the two generators to submit
bid functions with high prices for all levels of output supplied. However, this strategy would be
relatively easy for the Director General to detect. All he would need to do is look to see the capacity
offered and the price it is offered at and perform the marginal cost calculations outlined in von der
Fehr and Harbord (1993 and Wolfram (1995) for each genset. The availability declaration strategy,
has the advantage that the generators can disguise their intentions behind several veils. The Director
General will have a very difficult, if not impossible time telling plant unavailability due to actual
breakdowns from those due to an unavailability declaration for strategic reasons. Because the two
generators have a mix of technologies, they simply limit their baseload and intermediate load capacity
made available to the pool so that, for as many load periods as possible, a few high-cost gensets are
called into service, yielding high levels of SMP and CC.
A related lesson from the E&W market is that the regulator or a market designer should
consider all numbers or relationships not based on engineering or accounting identities as tools to
achieve the desired regulatory outcome. The true value of the VOLL to consumers and the true
relationship between the estimated reserve margin and LOLP are unknown to the regulator, but the
magnitude of VOLL or the function specified to relate the expected reserve margin to the LOLP can
have a tremendous impact on the observed market clearing prices. For example, setting the VOLL
too high can make the payoff from strategic capacity choice timed with demand fluctuations during
days and across the year a profitable strategy. If the relationship between the LOLP and the expected
reserve margin is too steep in absolute value, this can also increase the profitability of this strategy.
Consequently, the regulator overseeing the operation of the pool should view such variables as the

50
VOLL and the function relating the reserve margin to the LOLP as instruments for obtaining the
desired market outcomes, rather than as fixed constants or relationships.
Because the CC is a major source of very high PSPs, one may want to question why it is
necessary. The motivation for instituting this charge was to provide the proper signals to the market
for investment in new generation capacity to occur and to help recover the generators' fixed costs,
under the assumption that gensets are bid into the pool at their marginal cost. The thought was that
persistent periods of low reserve margin would trigger consistently high values of the CC, which
would in turn signal the market to build more generation capacity. The ratio of the difference
between total system capacity minus the highest annual half-hourly TSL divided by total system
capacity is currently more than 20%. Despite having substantial reserve capacity, large CC charges
occur throughout the year because of this available capacity withholding strategy. Prospective
entrants interpreting these large capacity charges as signals to enter must exercise caution because
of the strategic capacity availability withholding behavior of the two large generators. It seems
reasonable to expect that if the CC was eliminated generators would figure out that they had to
achieve higher values of SMP in order to maintain sufficient revenues to cover their total cost. These
generators could no longer bid each genset into the market at close to its marginal cost and rely on
high CC’s to compensate them for their fixed costs. Getting rid of the CC would not eliminate the
ability to withhold capacity to achieve higher SMPs, but it would eliminate the very profitable added
benefit of this strategy that it triggers a high LOLP and therefore a high CC. Consequently, it does
seem that serious consideration should be given to the elimination of the CC from the E&W market.
For all of the reasons described here and earlier in the paper, the CPUC and other state regulatory
bodies considering establishing electricity markets within their boundaries should not implement this
kind of capacity payment scheme.

51
Perhaps the most important lesson from the E&W experience is the necessity of building in
the potential for demand-side responses by customers into the price determination process. As noted
above, the expected demand that sets the SMP and CC is perfectly price inelastic. This aspect of the
rules governing the market operation makes it substantially easier for National Power and PowerGen
to produce high values of SMP and CC from the pool price determination process. The easiest way
to build a significant price response into the expected demand determination process is to allow large-
scale demand-side bidding by RECs or other large customers. Demand-side bids should be of the
form, “so long as the SMP or PPP is less than a certain value I will demand certain amount of
capacity from the pool.” If the SMP or PPP is above the cutoff value for the SMP or PPP, then that
demand-side bidder will take less electricity from the pool according his demand-side bid function.
Widespread demand-side bidding by RECs and large consumers would build in the demand-response
to high prices necessary to keep the values of SMP and PPP down. However, crucial to the success
of demand-side bidding for limiting the exercise of market power is credibility. Therefore, demand-
side bidders should be subject to same obligations for curtailing demand as the generators face for
the supplying electricity according to their supply-side bids. Because of the way that electricity is
currently sold to retail customers (according to fixed-price contracts) a significant amount of demand-
side bidding by RECs will be very difficult to implement. RECs must either be able to curtail
customers when the SMP or PPP exceeds their bid price or get more of their customers to pay the
actual PSP for the power they customer during each load period.
5. Conclusions
This paper has suggested a mechanism that the two largest participants in this market use to
set available capacity and prices to yield prices substantially in excess of marginal cost. This market

52
power activity is a periodic and transitory phenomenon requiring the confluence of factors, some
under the control of PowerGen and National Power, and others not under their control.
There are many caveats associated with these results. The most important is that although
there is a substantial amount of evidence from the behavior of various components of the pool selling
price, the behavior of total system load, the behavior of the E&W system reserve margin over time,
the form of the bids submitted by National Power and PowerGen and the fraction of load periods
each of the two generators sets the SMP consistent with the use of this strategy, it is impossible to
state with complete certainty this strategy is in fact being used by the two firms. On the other hand,
given the dramatic amount of price volatility and the large amounts of revenues that can easily be
produced by this strategy, it is difficult to believe that these two generators do not set their available
generating capacity and bid price with these considerations in mind in order to take advantage of the
rules governing the operation of market when demand conditions favor this behavior.

53
References
Armstrong, Mark, Cowan, Simon, and Vickers, John (1994) Regulatory Reform: Economic Analysisand British Experience, MIT Press: Cambridge, MA.
Aveline, Michelle, Martin Brough, and Seumas Lobban (1996) Generation in the 1990s: ElectricityCapacity and New Power Projects, 1995 Edition, OXERA Press, Oxford, UK.
Baker, A.B. (1992) "The Methodology and Process of Forecasting Nominal Demand," TheNational Grid Company, Grid System Management, National Control, GSMNC/ABB/DF5.1.2.9, Coventry, England.
Bolle, Freidel (1992) "Supply Function Equilibria and the Danger of Tacit Collusion: The Case ofSpot Markets for Electricity," Energy Economics, April, 94-102.
Brough, Martin and Lobban, Seumas, (1995) Guide to the Economic Regulation of the ElectricityIndustry, OXERA Press, Oxford, UK.
Bunn, Derek W. and Larsen, Erik R., (1992) “Sensitivity of Reserve Margin to Factor InfluencingInvestment Behavior in the Electricity Market of England and Wales,” Energy Policy, May,420-429.
Christensen, L.R. and Greene, W.H. (1976) "Economies of Scale in US Electric Power Generation,"Journal of Political Economy, 84, 655-767.
Edison Electric Institute (1996) Retailing Wheeling & Restructuring Report, December 1996.
Electricity Association (1994)UK Electricity, Electricity Association Services Limited, London.
Electricity Association (1995 UK Electricity, Electricity Association Services Limited, London.
von der Fehr, Nils-Henrik Morch and Harbord, David (1993) "Spot Market Competition in the UKElectricity Industry," The Economic Journal, 103, 531-546.
Glazer, Amihai and McMillan, Henry (1992) "Pricing by the Firm Under Regulatory Threat,"Quarterly Journal of Economics, August, 1089-1099.
Green, Richard J. and Newbery, David, M. (1992) "Competition in the British Electricity SpotMarket," Journal of Political Economy, 100(5), 929-953.
Green, Richard J. (1996) “Increasing Competition in the British Electricity Spot Market,” TheJournal of Industrial Economics, Volume XLIV, Number 2, 205-216.

54
Helm, Dieter and Powell, Andrew (1992) "Pool Prices, Contracts and Regulation in the BritishElectricity Supply Industry," Fiscal Studies, 13(1), 89-105.
Jenks, Norman and Whitcomb, Jill, (1997) “Divestiture: PG&E, SCE Plans Filed,” Edison Times,January 1997, 22-24.
Klemperer, Paul D. and Meyer, Margaret A. (1989) "Supply Function Equilibria in Oligopoly underUncertainty," Econometrica, 57(6), 1243-1277.
National Grid Company (1995) 1995 Seven Year Statement, The National Grid Company plc,Coventry.
North American Electric Reliability Report (1996) Generating Availability Report 1991-1995,Princeton, NJ, July 1996
Newbery, David M. (1995) "Power Markets and Market Power," The Energy Journal, 16(3), 39-66.
OXERA Press (1996) "The Stock Market Goes Nuclear," Energy Utilities, July 15, No. 31/96.
OXERA Press (1997) "The Pool Feels the Cold," Energy Utilities, January, 13.
Powell, Andrew (1993) "Trading Forward in an Imperfect Market: The Case of Electricity inBritain," The Economic Journal, 103, 444-453.
The Economist, (1992) "Electricity Generation: Feeling Gassy," May 9, 1992, 75-76.
The Electricity Pool (1997) Schedule 9: The Pool Rules, Pooling and Settlement Agreement for theElectricity Industry in England and Wales, Issue 45, Version 6.20, February 1.
Tirole, Jean (1986) The Theory of Industrial Organization, MIT Press: Cambridge, MA..
Wolak, Frank A. and Patrick, Robert H. (1996a) “Industry Structure and Regulation in the Englandand Wales Electricity Market,” in M.A. Crew, edited, Pricing and Regulatory InnovationsUnder Increasing Competition, .
Wolak, Frank A. and Patrick, Robert H. (1996b) “The Time Series Behavior of Market Prices andOutput in England and Wales Electricity Market,” mimeo, June 1996.
Wolfram, Catherine D. (1995) "Measuring Duopoly Power in the British Electricity Spot Market,"mimeo, MIT.

55
Table 1
Sample Means and Standard Deviations of Components of PSP (Daily Average and Actual Values)
Daily Average Values Actual Values
Year Mean Std Dev Mean Std Dev
SMP 1 19.52 1.57 19.52 4.10
CC 1 1.29 3.05 1.29 8.76
UPLIFT 1 1.61 1.01 1.61 2.31
PSP 1 22.42 4.72 22.42 12.72
SMP 2 22.64 1.62 22.64 4.24
CC 2 0.17 0.49 0.17 1.70
UPLIFT 2 1.39 0.48 1.39 1.12
PSP 2 24.19 2.08 24.19 5.75
SMP 3 24.16 3.56 24.16 6.71
CC 3 0.28 0.99 0.28 2.97
UPLIFT 3 2.18 0.72 2.18 1.62
PSP 3 26.62 4.13 26.62 8.76
SMP 4 20.78 7.22 20.78 12.28
CC 4 3.22 8.57 3.22 24.49
UPLIFT 4 2.38 1.72 2.38 4.53
PSP 4 26.38 14.82 26.38 35.08

56
Table 2
Distribution of Ratios of Various Components of PSP
Year Mean Min Max Std Dev
CC/SMP 1 0.05 0.00 10.36 0.30
UPLIFT/SMP 1 0.07 0.00 1.50 0.09
SMP/PSP 1 0.92 7.89e-02 1.00 0.11
CC/PSP 1 0.02 0.00 0.82 0.08
CC/SMP 2 0.01 0.00 1.87 0.05
UPLIFT/SMP 2 0.06 0.00 0.49 0.04
SMP/PSP 2 0.94 3.01e-01 1.00 0.05
CC/PSP 2 0.00 0.00 0.56 0.03
CC/SMP 3 0.01 0.00 3.65 0.08
UPLIFT/SMP 3 0.09 0.00 0.56 0.06
SMP/PSP 3 0.92 1.92e-01 1.00 0.06
CC/PSP 3 0.01 0.00 0.70 0.03
CC/SMP 4 0.09 0.00 20.41 0.58
UPLIFT/SMP 4 0.10 0.00 4.79 0.13
SMP/PSP 4 0.90 3.82e-02 1.00 0.12
CC/PSP 4 0.03 0.00 0.80 0.10

57
Table 3Mean and Standard Deviation of SMP by Load Period Regimes
Year Mean Std Dev StdDev/Mean(%)
FTSL # 20GW 1 15.75 1.35 8.57%
20GW < FTSL # 35GW 1 18.81 3.73 19.82%
35GW < FTSL # 45GW 1 21.88 4.03 18.41%
45GW < FTSL 1 30.71 4.36 14.20%
FTSL # 20GW 2 18.43 1.47 7.96%
20GW < FTSL # 35GW 2 22.01 4.13 18.76%
35GW < FTSL # 45GW 2 25.05 3.55 14.18%
45GW < FTSL 2 31.54 3.03 9.61%
FTSL # 20GW 3 23.30 7.80 33.49%
20GW < FTSL # 35GW 3 23.72 6.65 28.05%
35GW < FTSL # 45GW 3 25.27 6.38 25.25%
45GW < FTSL 3 37.66 3.85 10.21%
FTSL # 20GW 4 9.64 0.45 4.63%
20GW < FTSL # 35GW 4 18.69 9.43 50.44%
5GW < FTSL # 45GW 4 30.54 14.28 46.76%
45GW < FTSL 4 68.36 20.97 30.68%

58
Table 4 Actual and NERC Availabilities by Generator by Fuel Type
Generator Fuel Type Capacity* Availability
(MW) Actual (%)** NERC** (%)National Power CCGT 1,832 53.17 80.20
National Power OCGT 1,494 53.44 84.52
National Power coal 17,643 71.51 80.92
National Power hydro 40 0.00 90.80
National Power oil 5,938 28.94 78.39
PowerGen CCGT 3,140 64.10 80.20
PowerGen OCGT 463 73.79 84.65
PowerGen coal 11,792 69.96 79.61
PowerGen hydro 53 0.00 90.20
PowerGen oil 4,003 29.18 77.50
Nuclear Electric AGR 5,590 71.78 76.25
Nuclear Electric MAGNOX 3,391 75.38 76.25
Central Power OCGT 27 95.16 84.70
Lakeland Power CCGT 229 93.15 80.20
Teeside Power CCGT 1,875 88.59 80.20
Regional Power CCGT 272 89.70 80.20
Fellside Power CCGT 168 81.69 80.20
*Capacity at the end of the 1995 calendar year, including zero Registered Capacity gensets..
**Includes all gensets declaring availability in the 1995 calendar year, including zero Registered Capacity gensets.
CCGT = Combined Cycle Gas Turbine, OCGT = Ordinary Cycle Gas Turbine

59
Table 5
Annual Revenue from Each Component of PSP Computed Using Different Time-Averaged Prices
% of Actual Annual Revenue
Year Revenue Average Average Average Average Actual Annual Daily Weekly Monthly Yearly
Millions of £ Price Price Price Price
PSP 1 6,152 96.96% 96.17% 95.87% 95.65%
PPP 1 5,678 97.39% 96.67% 96.40% 96.12%
SMP 1 5,225 98.39% 98.00% 97.91% 97.84%
CC 1 453 85.85% 81.34% 78.99% 76.30%
UPLIFT 1 474 91.72% 90.08% 89.58% 89.95%
PSP 2 6,460 98.02% 97.75% 97.68% 97.67%
PPP 2 6,083 98.25% 97.98% 97.90% 97.80%
SMP 2 6,023 98.38% 98.15% 98.10% 98.06%
CC 2 60 85.02% 80.59% 78.17% 72.64%
UPLIFT 2 377 94.41% 94.12% 94.15% 95.45%
PSP 3 7,194 97.81% 97.51% 97.45% 98.23%
PPP 3 6,604 98.05% 97.72% 97.66% 98.27%
SMP 3 6,499 98.23% 97.98% 97.96% 98.70%
CC 3 105 86.77% 81.62% 79.29% 71.68%
UPLIFT 3 589 95.18% 95.14% 95.06% 97.79%
PSP 4 7,787 94.27% 92.76% 92.42% 90.61%
PPP 4 7,147 94.42% 92.93% 92.60% 90.77%
SMP 4 5,929 95.97% 95.08% 94.88% 94.62%
CC 4 1,220 86.90% 82.47% 81.51% 72.03%
UPLIFT 4 725 92.78% 91.05% 90.60% 89.11%

60
Figure 1: Map of United Kingdom Electricity Industry

61
Figure 2 (a)
Figure 2 (b)

62
Figure 2 (c)
Figure 2 (d)

63
Figure 3 (a)
Figure 3 (b)

64
Figure 3 (c)
Figure 3 (d)

MC(1)Bid(1)
Quantity
PriceFirm 1
Bid(2)
Quantity
PriceFirm 2
FTSL
Quantity
Price
SMP(Bid)
SMP(MC)
TAVAIL(MC)
TAVAIL(Bid)MC(1)+MC(2)Bid(1)+Bid(2)
65
Figure 4Increased SMP and CC Resulting from Capacity Withholding Strategy

66
Figure 5 (a)
Figure 5 (b)

67
Figure 6 (a)
Figure 6 (b)

68
Figure 7 (a)
Figure 7 (b)

69
Figure 8 (b)
Figure 8 (a)

70
Figure 8 (c)
Figure 8 (d)

71
Figure 9 (a)
Figure 9 (b)

72
Figure 9 (c)
Figure 9 (d)

73
Figure 10 (a)
Figure 10 (b)

74
Figure 10 (c)
Figure 10 (d)

75
Figure 11 (a)
Figure 11 (b)

76
Figure 11 (c)
Figure 11 (d)

MC
AC
Quantity
Price
77
Figure 12: Marginal Cost Function and Associated Average Cost Function