The Impact of Market Reforms on Competition, Structure and ...
Upload
truongkhanhCategory
view
217download
0
The Impact of Market Reforms on Competition, Structure and Performance of the Philippine Economy1
Rafaelita M. Aldaba2
1.0 Background
In its quest for industrialization, the postwar Philippine economy adopted a complex
array of protective policies, investment incentive measures, and regulatory controls. In general, the literature shows that these policies failed to provide an efficient mechanism for allocating domestic resources in the economy. The more than three decades of protectionism and import-substitution has left a legacy of high levels of industrial concentration and the concentration of economic wealth among a small number of families and groups. It has likewise left a legacy of a lack of a culture of competition that is characterized by a weak and underdeveloped competition framework. Although it has laws forbidding monopolies and cartels, the Philippines does not have a history of fighting against these illegal activities as evidenced by the lack of cases litigated in Philippine courts against monopolies and cartels.
Domestic firms have grown accustomed to government-sanctioned monopolies and
cartels together with price controls and government protection. In general, anticompetitive business practices have been accepted as part of the normal course of doing business in the country. Rather than compete with imports and focus on efficiency improvements, firms have tended to hide from the challenges of market competition by engaging in collusive acts and intensive lobbying for more government protection.
With the demise of the import substitution model for economic development, the
government was prompted to institute economic policy reforms consistent with the requirements of a competitive market environment. Since the 1980s, it had carried out economic reforms through liberalization, privatization, and economic deregulation, all of which were aimed at removing barriers to competition and promoting factor mobility and firm growth as well as securing both high and sustained economic growth and rapid poverty alleviation.
The main objective of the paper is to examine the impact of trade policy reforms
vigorously pursued in the 1990s on market competition, structure, and performance of major 1 Paper presented at the “Workshop on Policies to Strengthen Productivity in the Philippines” sponsored by the Asia-Europe Meeting (ASEM) Trust Fund, Asian Institute of Management Policy Center, Foreign Investment Advisory Service, Philippine Institute for Development Studies and the World Bank, held in AIM Policy Center, Makati City, 27 July 2005. 2 The author is grateful to Ms. Mildred Belizario, Ms. Melalyn Cruzado, and Ms. Corazon Pisano for their excellent research assistance, to the participants of the July 26, 2004 WB-PIDS Workshop for very useful discussions, to Shyam Khemani and Milan Brahmbhatt for their guidance and insightful comments and suggestions and to Linda Medalla for her support and encouragement. The usual disclaimer applies.
The Impact of Market Reforms on Competition, Structure and Performance of the Philippine Economy
page 2 of 90
economic sectors. The paper will also evaluate the presence of remaining barriers to entry and their effect on competition. It will attempt to address the following questions: Did the market-oriented reforms increase competition in the domestic market? If so, how can market forces be strengthened in order to ensure effective competition? If not, what could be the possible factors that inhibit effective competition from taking place? Are there remaining barriers to competition erected by the private sector or the government? How high are these barriers and what forms do they take?
Market reforms like trade liberalization reduce barriers to competition. They are
expected to sharpen competitive pressure and lead to welfare gains, particularly when monopolies and cartels characterize the structure of the market. In the context of the new trade theory, gains from trade are derived not only from specialization and comparative advantage, but also from the reduction of deadweight losses created by firms that have market power. Trade liberalization leads to lower price cost margins and causes more efficient firms to expand and less efficient firms to either contract or exit, thus, inducing additional efficiency gains. This increases productivity and innovation and enhances long-run economic growth.
The paper begins by analyzing the overall performance and growth as well as changes
in the structure of outputs of the major economic sectors. Section three presents the current state of competition-related laws, institutions, and competition policies. Section four discusses the theoretical underpinnings of trade liberalization, competition, and productivity. The next two sections assess the extent to which pro-competition changes have occurred in the major economic sectors: manufacturing, agriculture, and services and determine the presence of remaining barriers to competition. Price cost margins are calculated and the relationship between competition and trade reforms is analyzed using manufacturing sector data. The last section draws lessons from the previous analysis and recommends policy changes to deepen the economic reforms and strengthen competition in the Philippines.
2.0 Growth, Performance and Structure of the Philippine Economy
2.1 Output, Value Added Growth and Changes in Economic Structure
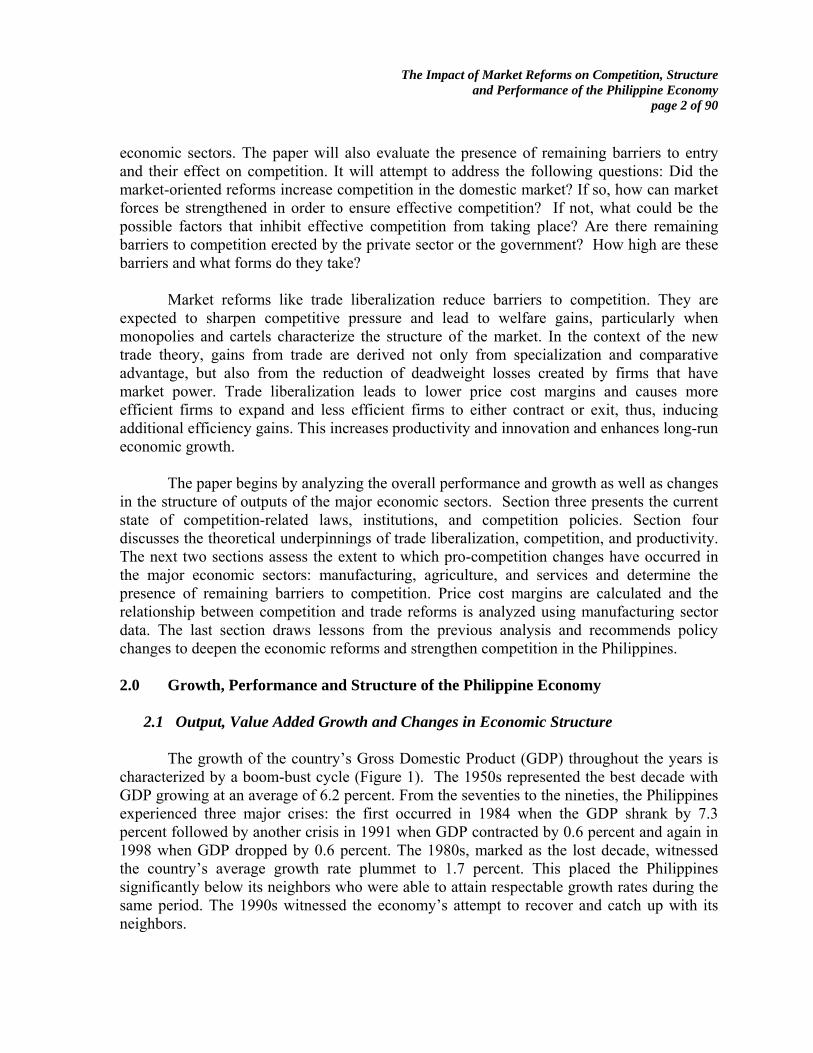
The growth of the country’s Gross Domestic Product (GDP) throughout the years is characterized by a boom-bust cycle (Figure 1). The 1950s represented the best decade with GDP growing at an average of 6.2 percent. From the seventies to the nineties, the Philippines experienced three major crises: the first occurred in 1984 when the GDP shrank by 7.3 percent followed by another crisis in 1991 when GDP contracted by 0.6 percent and again in 1998 when GDP dropped by 0.6 percent. The 1980s, marked as the lost decade, witnessed the country’s average growth rate plummet to 1.7 percent. This placed the Philippines significantly below its neighbors who were able to attain respectable growth rates during the same period. The 1990s witnessed the economy’s attempt to recover and catch up with its neighbors.

The Impact of Market Reforms on Competition, Structure and Performance of the Philippine Economy
page 3 of 90
Figure 1: Gross Domestic Product
-10.0-5.00.05.0
10.015.020.025.030.035.040.0
1947
1951
1955
1959
1963
1967
1971
1975
1979
1983
1987
1991
1995
1999
2003
Year
GD
P gr
owth
rate
(in
perc
ent)
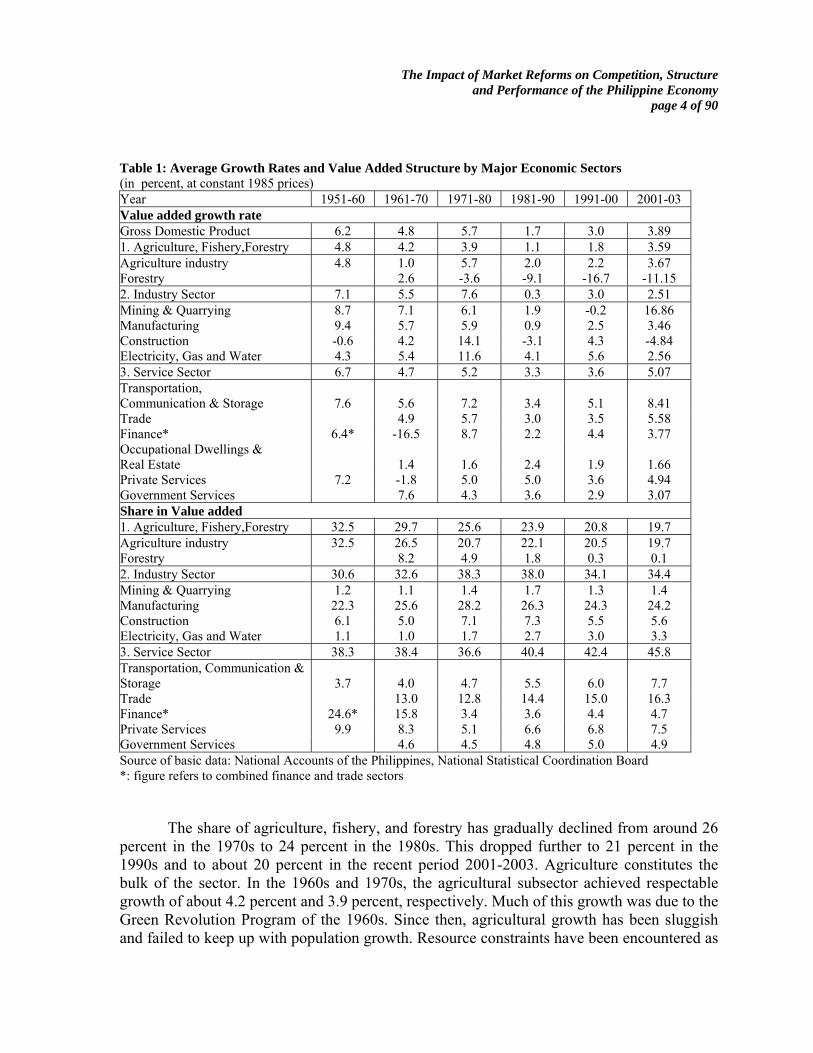
Table 1 indicates that the growth of the major economic sectors generally mimicked the macroeconomic picture. While the industry sector was the best performer in terms of average annual growth rate from the 1950s to the 1970s, the services sector has become the star sector in the succeeding decades as both agriculture and industry, manufacturing in particular, experienced sluggish growth during these periods. In contrast, services average growth increased continuously in the last two decades. Broad growth took place in the services sector as most of its sub-sectors registered consistently rising growth rates in the same periods under review.
It is also evident from Table 1 that the Philippine economy’s output structure is
characterized by a large services sector. This sector’s share has continued to increase from an average of 37 percent during the 1970s to 40.4 percent in the 1980s, 42.4 percent in the 1990s and to almost 46 percent in the most recent 2001-2003 period. Trade has constituted the bulk of the services sector followed by transportation, communication, and storage and private services sub-sectors. Since the 1980s, almost all services sub-sectors have experienced rising shares.
Within the services sector, the transportation, communication, and storage as well as
trade sub-sectors have registered continuously rising average growth rates since the 1980s. The transportation, communication, and storage sector posted the highest average growth rate of 8.4 percent during the period 2001-2003. This was followed by trade and private services sub-sectors with average growth rates of approximately 5.6 percent and 4.9 percent, respectively. Finance grew by 4.4 percent during the nineties and by 3.8 percent in the most recent period under review. The growth in the transportation, communication, and storage sub-sector as well as in finance may be attributed to the market reforms introduced in telecommunications, shipping, air transport, and finance sub-sectors during the early 1990s.
The Impact of Market Reforms on Competition, Structure and Performance of the Philippine Economy
page 4 of 90
Table 1: Average Growth Rates and Value Added Structure by Major Economic Sectors (in percent, at constant 1985 prices) Year 1951-60 1961-70 1971-80 1981-90 1991-00 2001-03 Value added growth rate Gross Domestic Product 6.2 4.8 5.7 1.7 3.0 3.89 1. Agriculture, Fishery,Forestry 4.8 4.2 3.9 1.1 1.8 3.59 Agriculture industry 4.8 1.0 5.7 2.0 2.2 3.67 Forestry 2.6 -3.6 -9.1 -16.7 -11.15 2. Industry Sector 7.1 5.5 7.6 0.3 3.0 2.51 Mining & Quarrying 8.7 7.1 6.1 1.9 -0.2 16.86 Manufacturing 9.4 5.7 5.9 0.9 2.5 3.46 Construction -0.6 4.2 14.1 -3.1 4.3 -4.84 Electricity, Gas and Water 4.3 5.4 11.6 4.1 5.6 2.56 3. Service Sector 6.7 4.7 5.2 3.3 3.6 5.07 Transportation, Communication & Storage 7.6 5.6 7.2 3.4 5.1 8.41 Trade 4.9 5.7 3.0 3.5 5.58 Finance* 6.4* -16.5 8.7 2.2 4.4 3.77 Occupational Dwellings & Real Estate 1.4 1.6 2.4 1.9 1.66 Private Services 7.2 -1.8 5.0 5.0 3.6 4.94 Government Services 7.6 4.3 3.6 2.9 3.07 Share in Value added 1. Agriculture, Fishery,Forestry 32.5 29.7 25.6 23.9 20.8 19.7 Agriculture industry 32.5 26.5 20.7 22.1 20.5 19.7 Forestry 8.2 4.9 1.8 0.3 0.1 2. Industry Sector 30.6 32.6 38.3 38.0 34.1 34.4 Mining & Quarrying 1.2 1.1 1.4 1.7 1.3 1.4 Manufacturing 22.3 25.6 28.2 26.3 24.3 24.2 Construction 6.1 5.0 7.1 7.3 5.5 5.6 Electricity, Gas and Water 1.1 1.0 1.7 2.7 3.0 3.3 3. Service Sector 38.3 38.4 36.6 40.4 42.4 45.8 Transportation, Communication & Storage 3.7 4.0 4.7 5.5 6.0 7.7 Trade 13.0 12.8 14.4 15.0 16.3 Finance* 24.6* 15.8 3.4 3.6 4.4 4.7 Private Services 9.9 8.3 5.1 6.6 6.8 7.5 Government Services 4.6 4.5 4.8 5.0 4.9 Source of basic data: National Accounts of the Philippines, National Statistical Coordination Board *: figure refers to combined finance and trade sectors
The share of agriculture, fishery, and forestry has gradually declined from around 26 percent in the 1970s to 24 percent in the 1980s. This dropped further to 21 percent in the 1990s and to about 20 percent in the recent period 2001-2003. Agriculture constitutes the bulk of the sector. In the 1960s and 1970s, the agricultural subsector achieved respectable growth of about 4.2 percent and 3.9 percent, respectively. Much of this growth was due to the Green Revolution Program of the 1960s. Since then, agricultural growth has been sluggish and failed to keep up with population growth. Resource constraints have been encountered as
The Impact of Market Reforms on Competition, Structure and Performance of the Philippine Economy
page 5 of 90
the country hit the land frontiers (David, 2003). In the 1980s and 1990s, the sector grew at the average annual growth rates of around 1 percent and 1.8 percent, respectively, as agricultural yields increased only slowly. In the recent period, the sector registered an average growth rate of about 3.6 percent.
The share of the industrial sector to total output decreased from the peak of about 38
percent in the 1970s till the 1980s, to 34.1 percent during the 1990s and 34.3 percent in the period 2001-2003. The manufacturing sub-sector represents the most important industrial sector, accounting for about 28 percent of total output in the 1970s, 26 percent in the 1980s, and 24 percent in the 1990s. This share to total output has remained unchanged in the most recent period under review.
Since the 1980s, industrial growth has been very slow with virtually no growth in the
1980s. In the 1990s, the sector posted an average annual growth rate of 3 percent. It grew by 2.5 percent in the period 2001-2003. Manufacturing registered an average annual growth rate of 0.9 percent in the 1980s, by 2.5 percent in the 1990s, and by 3.5 percent in the recent period.
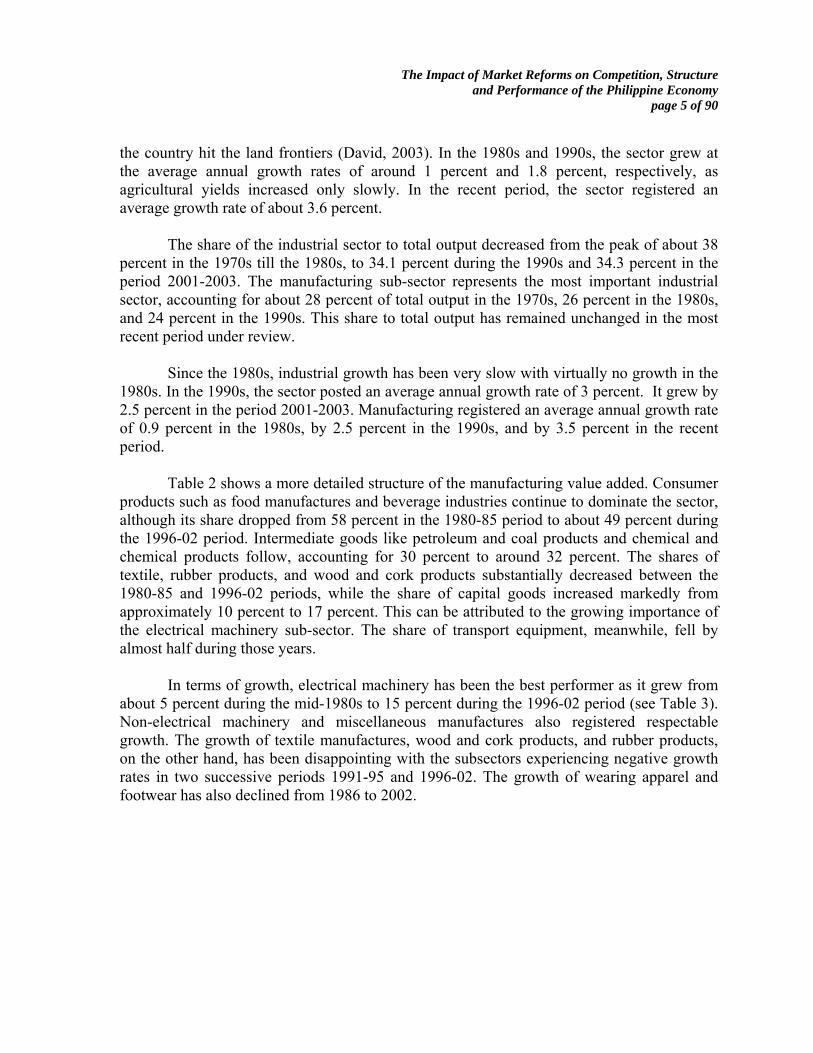
Table 2 shows a more detailed structure of the manufacturing value added. Consumer
products such as food manufactures and beverage industries continue to dominate the sector, although its share dropped from 58 percent in the 1980-85 period to about 49 percent during the 1996-02 period. Intermediate goods like petroleum and coal products and chemical and chemical products follow, accounting for 30 percent to around 32 percent. The shares of textile, rubber products, and wood and cork products substantially decreased between the 1980-85 and 1996-02 periods, while the share of capital goods increased markedly from approximately 10 percent to 17 percent. This can be attributed to the growing importance of the electrical machinery sub-sector. The share of transport equipment, meanwhile, fell by almost half during those years.
In terms of growth, electrical machinery has been the best performer as it grew from
about 5 percent during the mid-1980s to 15 percent during the 1996-02 period (see Table 3). Non-electrical machinery and miscellaneous manufactures also registered respectable growth. The growth of textile manufactures, wood and cork products, and rubber products, on the other hand, has been disappointing with the subsectors experiencing negative growth rates in two successive periods 1991-95 and 1996-02. The growth of wearing apparel and footwear has also declined from 1986 to 2002.

The Impact of Market Reforms on Competition, Structure and Performance of the Philippine Economy
page 6 of 90
Table 2: Distribution of Manufacturing Value Added (in percent) Industry Group 1981-85 1986-90 1991-95 1996-02 Consumer Goods Food manufactures 45.1 33 36.4 35.9 Beverage industries 3.4 3.9 3.9 3.8 Tobacco manufactures 3.5 3.1 2.7 2.5 Footwear & wearing apparel 4.8 4.5 6.2 5.4 Furniture & fixtures 1.3 1.2 1.2 1.3 Sub-total 58.1 45.7 50.4 48.9 Intermediate Goods Textile manufactures 4.1 3.9 3.1 2.0 Paper & paper products 1 1.1 1.1 0.9 Publishing & printing 1.2 1.2 1.6 1.3 Leather & leather products 0.1 0.3 0.1 0.1 Rubber products 1.6 2.5 1.3 0.9 Chemical & chemical products 7 7.3 6.3 6.1 Products of petroleum & coal 10.2 12.3 17.3 16.5 Non-metallic mineral products 2.3 2.5 2.9 2.7 Wood & cork products 2.6 2 1.8 1.1 Sub-total 30.1 33.1 35.5 31.6 Capital Goods Basic metal industries 2.2 2.8 2.4 1.9 Metal industries 1.9 2 2.3 2.1 Machinery except electrical 1.3 1.6 1.3 1.7 Electrical machinery 2.9 3.1 4.9 10.1 Transport equipment 2 1 1.3 1.0 Sub-total 10.3 10.5 12.2 16.8 Miscellaneous manufactures 1.4 1.5 2.0 2.5 Table 3 : Average Value Added Growth Rates in Manufacturing (in percent) Industry Group 1981-85 1986-90 1991-95 1996-02 Food manufactures -3.1 1.6 0.4 4.1 Beverage industries 9.8 2.8 0.7 1.9 Tobacco manufactures 0.1 0.5 -0.2 3.9 Textile manufactures -8.0 4.8 -3.6 -4.1 Footwear & wearing apparel -4.5 11.3 5.5 0.5 Wood & cork products -16.5 7.8 -7.2 -5.1 Furniture & fixtures -8.3 8.6 -0.8 2.7 Paper & paper products -2.9 7.6 0.3 -1.2 Publishing & printing -9.0 14.5 0.7 0.4 Leather & leather products -6.6 0.0 2.7 6.5 Rubber products -7.6 7.9 -2.6 -5.8 Chemical & chemical products -3.1 1.6 1.8 1.8 Products of petroleum & coal 1.9 10.2 3.7 -0.8 Non-metallic mineral products -10.8 10.4 7.3 -1.9 Basic metal industries 9.8 2.2 2.4 -5.3 Metal industries -5.9 8.3 0.5 4.5

Machinery except electrical -10.5 9.1 6.3 5.9 Electrical machinery 4.9 8.3 10.7 15.0 Transport equipment -34.7 14.2 9.7 -3.3 Miscellaneous manufactures -0.3 12.8 1.5 7.9 Gross Value Added in Mfg. -3.1 4.9 2.0 3.1 Source of basic data for both tables: National Accounts of the Phil., National Statistical Coordination Board
Table 4 compares the performance of the Philippines in terms of value added
distribution with other Asian developing countries. It is evident from the data that our neighboring countries registered reductions in the share of agriculture and substantial increases in the share of industry during the period 1990 to 1999. In comparison, the share of Philippine agriculture dropped from 22 percent to 18 percent, industry declined from 34 percent to 30 percent while services, which constituted a large portion of Philippine output, rose sharply from 44 percent in 1990 to 52 percent in 1999. Table 4: Structure of Output ( percent of GDP) Sector Philippines Thailand Indonesia Malaysia China 1990 1999 1990 1999 1990 1999 1990 1999 1990 1999 Agriculture 22 18 12 10 19 19 15 11 27 18 Industry 34 30 37 40 39 43 42 46 42 49 Manufacturing 25 21 27 32 21 25 24 32 33 38 Services 44 52 50 50 41 37 43 43 31 33 Source: World Bank, 2001 World Development Indicators.
In contrast, the share of agriculture in Thailand dropped from 12 percent in 1990 to 10 percent in 1999. The same trend was witnessed in Malaysia and China. In Malaysia, agriculture declined from 15 percent to 11 percent. In China, the share of agriculture fell from 27 percent to 18 percent. In Indonesia, it remained constant at 19 percent. In terms of industry share, in Thailand this went up from 37 percent to 40 percent, in Indonesia, it increased from 39 percent to 43 percent, in Malaysia, it rose from 42 percent to 46 percent and in Thailand, from 42 percent to 49 percent. The bulk of industry, manufacturing, witnessed significant increases in its share for all the countries under review except for the Philippines. In services, Thailand’s share remained unchanged at 50 percent in both years. In Indonesia, Malaysia, and China reductions in the share of services were observed.
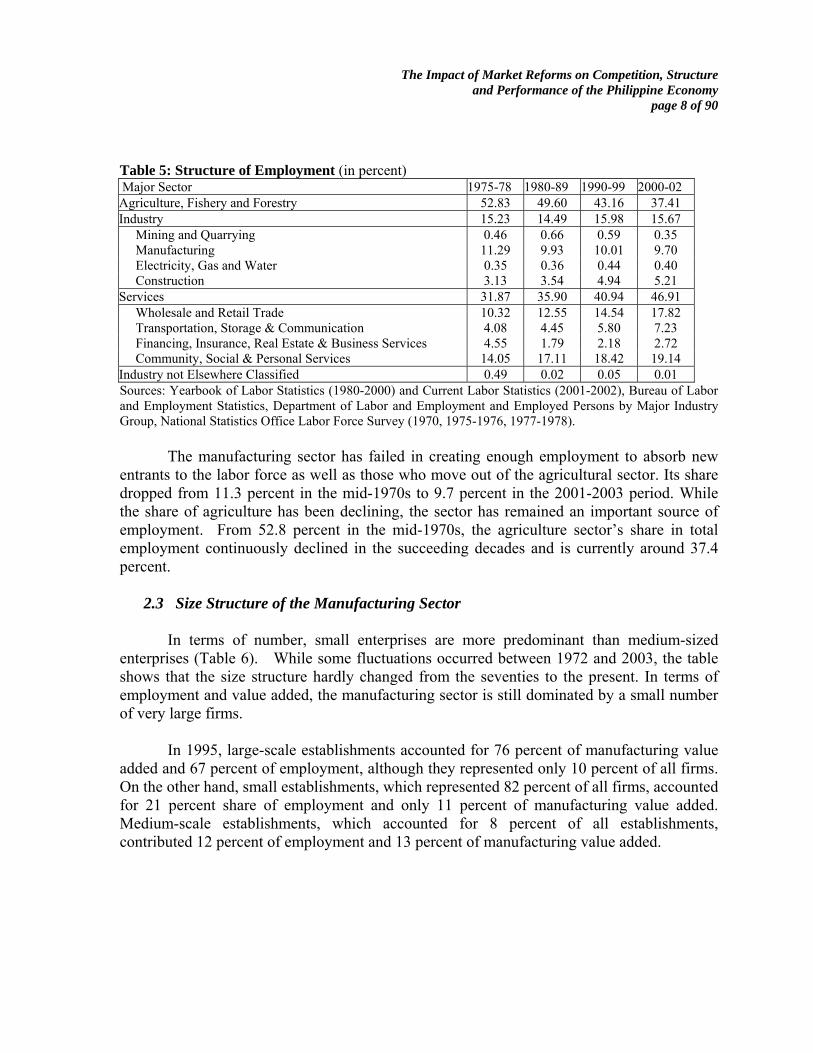
2.2 Employment The services sector has become the largest provider of employment in the most recent
period (Table 5). The share of the labor force employed in the sector consistently increased, from around 32 percent in the mid-1970s to almost 47 percent in 2001-2003. The share of industry to total employment has been almost stagnant from the mid 1970s to the most recent period under review.
The Impact of Market Reforms on Competition, Structure and Performance of the Philippine Economy
page 8 of 90
Table 5: Structure of Employment (in percent) Major Sector 1975-78 1980-89 1990-99 2000-02 Agriculture, Fishery and Forestry 52.83 49.60 43.16 37.41 Industry 15.23 14.49 15.98 15.67 Mining and Quarrying 0.46 0.66 0.59 0.35 Manufacturing 11.29 9.93 10.01 9.70 Electricity, Gas and Water 0.35 0.36 0.44 0.40 Construction 3.13 3.54 4.94 5.21 Services 31.87 35.90 40.94 46.91 Wholesale and Retail Trade 10.32 12.55 14.54 17.82 Transportation, Storage & Communication 4.08 4.45 5.80 7.23 Financing, Insurance, Real Estate & Business Services 4.55 1.79 2.18 2.72 Community, Social & Personal Services 14.05 17.11 18.42 19.14 Industry not Elsewhere Classified 0.49 0.02 0.05 0.01 Sources: Yearbook of Labor Statistics (1980-2000) and Current Labor Statistics (2001-2002), Bureau of Labor and Employment Statistics, Department of Labor and Employment and Employed Persons by Major Industry Group, National Statistics Office Labor Force Survey (1970, 1975-1976, 1977-1978).
The manufacturing sector has failed in creating enough employment to absorb new entrants to the labor force as well as those who move out of the agricultural sector. Its share dropped from 11.3 percent in the mid-1970s to 9.7 percent in the 2001-2003 period. While the share of agriculture has been declining, the sector has remained an important source of employment. From 52.8 percent in the mid-1970s, the agriculture sector’s share in total employment continuously declined in the succeeding decades and is currently around 37.4 percent.
2.3 Size Structure of the Manufacturing Sector
In terms of number, small enterprises are more predominant than medium-sized enterprises (Table 6). While some fluctuations occurred between 1972 and 2003, the table shows that the size structure hardly changed from the seventies to the present. In terms of employment and value added, the manufacturing sector is still dominated by a small number of very large firms.
In 1995, large-scale establishments accounted for 76 percent of manufacturing value
added and 67 percent of employment, although they represented only 10 percent of all firms. On the other hand, small establishments, which represented 82 percent of all firms, accounted for 21 percent share of employment and only 11 percent of manufacturing value added. Medium-scale establishments, which accounted for 8 percent of all establishments, contributed 12 percent of employment and 13 percent of manufacturing value added.

The Impact of Market Reforms on Competition, Structure and Performance of the Philippine Economy
page 9 of 90
Table 6: Firm Size Distribution in Philippine Manufacturing (in percent) Number of Firms 1972 1983 1988 1994 1995 1999 2000 2001 2002 2003 Small 83 78 84 72 82 86 86 85 86 83 Medium 7 9 7 12 8 7 7 7 7 7 Large 10 13 9 16 10 8 8 8 7 10 Employment 1972 1983 1988 1994 1995 1999 2000 2001 2002 2003 Small 22 18 24 21 21 28 29 26 26 23 Medium 10 10 12 13 12 12 12 12 13 11 Large 68 72 64 66 67 61 59 62 61 66 Census Value Added 1972 1983 1988 1994 1995 Small 15 11 12 11 11 - - - - - Medium 12 8 11 12 13 - - - - - Large 74 81 77 77 76 - - - - - Small-sized establishments employ 10 to 99 employees, medium-sized establishments have 100 to 199 employees while large establishments have 200 or more workers. Source: National Statistics Office -: no data The country’s underdeveloped financial markets represent a formidable barrier not just to the entry of new enterprises but also to the growth prospects of small and medium sized firms. The absence of a liquid and deep peso financial market contributes to the high cost of investment and makes it more difficult for enterprises to expand. Note, however, that financing constraints do not affect all firms equally, with access to financial credit being a particular problem affecting SMEs (Maxwell Stamp PLC, 2001). Based on a survey of SMEs, Hapitan (2005) concluded that small and medium-sized companies still face difficulties in credit access, particularly from foreign banks. This, the study found, is the result of accessibility problems in terms of branch location and the absence of information on the availability of credit facilities.
2.4 Foreign Direct Investment
Trade, together with foreign direct investment, is an important channel in improving efficiency. The highest degrees of productivity tend to be attained by firms competing directly with best practice firms all over the world. The diffusion of technology across countries tends to be slower in industries where competition is weak, as openness to competition allows firms to learn from their international competitors (Pilat, 1996). Open borders and favorable entry conditions for new firms also tend to improve productivity growth.
Table 7 presents the distribution of total cumulative flows across the major sectors from the eighties to the most recent period. Total cumulative flows to the Philippines increased from US$ 2.03 billion to US$ 8.34 billion between the 1980s and the 1990s. During the 2000-2003 period, a total of US$ 5.16 billion was registered.
The Impact of Market Reforms on Competition, Structure and Performance of the Philippine Economy
page 10 of 90
In the eighties, the bulk of FDI flows was concentrated in the manufacturing sector particularly in the manufacture of chemical and chemical products, food products, basic metal products, textiles and petroleum and coal. The average share of manufacturing went up from about 45 percent in the eighties to 50 percent in the nineties. In the most recent period, its share declined from 50 percent to around 31 percent as most FDI flows went into the financial sector.
In terms of changes in FDI flows within manufacturing, there was a shift towards the production of machinery, appliances, and supplies and petroleum and coal products. On the average, the FDI flows appear to be strong in food manufacturing as its share more than doubled from 7 percent in the nineties to around 14.5 percent in the period 2000-03.
A lot of these changes in FDI flows and structure may be explained by the substantial FDI liberalization process implemented over the past decades and which accelerated in the early nineties with the legislation of the Foreign Investment Act (FIA). As a result of this liberalization process, the shares of banks and other financial institutions to total FDI went up significantly, from 8 percent in the eighties to 15 percent in the nineties. In the most recent period, its share rose further to about 34 percent.
These increases in the share of FDI cumulative flows to the financial sector coincided with the major banking reforms legislated since the mid-1990s. The Foreign Bank Liberalization Act of 1994 allowed the establishment of ten new foreign banks in the Philippines. With the passing of the General Banking Law in 2000, foreign banks have been allowed to acquire up to 100 percent of the voting stock of only one bank (but only within seven years from the effectivity of this law). Prior to 1994, there were only four foreign banks in the country. These banks were heavily regulated; they could not engage in universal banking and trust operations and could not open new branches. Currently, there are a total of 19 foreign banks operating in the Philippines.
Public utility also experienced substantial increases in its share to total FDI, which went up from 1 percent in the 1980s to 12 percent in the nineties and to around 18 percent in the period 2000-03. Within the sector, the communication sub-sector received the largest cumulative FDI flows, increasing from less than one percent in the eighties to 6 percent in the nineties and to 15 percent in the most recent period under review.
In the past two decades, the share of mining fell drastically from 32 percent in the 1980s to around 6 percent in the nineties and increasing to 11 percent in the most recent period. Meanwhile, the share of agriculture, fishery, and forestry is very low and has been declining in all three periods under study. Commerce, which includes wholesale and retail trade as well as private services saw increases in its share from 5 percent in the eighties to 7.6 percent in the nineties. This share dropped to around 3 percent in 2000-2003.

The Impact of Market Reforms on Competition, Structure and Performance of the Philippine Economy
page 11 of 90
Table 7: Distribution of Foreign Direct Investment by Sector (in percent) Major Economic Sector 1980-89 1990-99 2000-03 Total Cumulative Flows (in million US$) 2027 8340 5164 Banks & other Financial Institutions 8.11 15.45 34.19 Banks 5.11 6.78 15.09 Other Fin. Institutions 2.99 8.67 19.11 Manufacturing 44.70 50.08 30.65 of which: Chemical & Chem. Prods. 13.36 5.72 3.55 Food 9.29 7.10 14.52 Basic Metal Products 5.71 2.27 1.85 Textiles 2.17 1.80 0.02 Transport Equipment 3.50 3.88 1.16 Petroleum & Coal 2.14 10.77 1.23 Rubber - 0.60 0.01 Metal Prods.,exc. Mach. 0.33 1.22 - Paper & Paper Prods. - 0.24 0.19 Mach., App., Suppl. - 12.23 3.99 Non-metallic Min. Products - 2.27 3.34 Others - 1.34 0.49 Mining 32.44 5.68 10.56 of which: Petroleum and Gas 28.15 1.66 10.54 Copper 0.51 0.00 - Nickel - 0.06 - Geothermal - 3.26 0.01 Others - 0.41 Commerce 5.05 7.63 3.23 of which: Wholesale 2.86 3.86 2.03 Real Estate 1.23 3.42 1.20 Services 6.39 5.29 0.91 of which: Business 2.36 1.13 0.63 Others - 0.21 0.23 Public Utility 1.13 11.94 17.82 of which: Communication 0.75 5.95 15.06 Water Transport - 0.16 0.15 Land Transport 0.04 0.01 0.04 Electricity - 5.39 1.54 Air Transport - 0.20 Others - 0.05 1.03 Agri., Fishery & Forestry 1.66 0.36 0.01 of which: Livestock & Poultry - - Fishery - 0.13 - Agriculture 2.01 0.23 Others - Construction 0.52 3.00 2.44 of which: Transport Facilities 0.15 - - Infrastructure 0.66 0.70 0.10 Building - 0.17 0.02 Gen. Engineering - 1.10 2.31 Others - 1.00 0.01 Source: Bangko Sentral ng Pilipinas
The Impact of Market Reforms on Competition, Structure and Performance of the Philippine Economy
page 12 of 90
Despite the progress in liberalization, there still remain certain significant barriers to FDI entry. The two negative lists under the Foreign Investment Act (FIA) either fully or partially restrict foreign ownership in a number of sectors. Due to constitutional constraints, List A restricts foreign investment in the practice of licensed professions as well as in the following industries: mass media, small-scale mining, private security agencies, and the manufacture of firecrackers and pyrotechnic devices. Foreign ownership ceilings are also imposed on enterprises engaged in, among others, financing, advertising, domestic air transport, public utilities, pawnshop operations, education, employee recruitment, public works construction and repair (except Build-Operate-Transfer and foreign-funded or assisted projects), and commercial deep sea fishing. Foreign equity remains banned in retail companies capitalized at less than $2.5 million.
Under List B, foreign ownership in enterprises is generally restricted to 40 percent due to national security, defense, public health, and safety reasons. List B also protects domestic small- and medium-sized firms by restricting foreign ownership to no more than 40 percent in non-export firms capitalized at no less than US$200,000. In 1997, foreign ownership was raised from 40 percent to 60 percent. The limit for financing companies was also raised to 60 percent in 1998.
Land ownership is constitutionally restricted to Filipino citizens or to corporations with at least 60 percent Filipino ownership. The Philippine Constitution bans foreigners from owning land in the Philippines. Foreign companies investing in the Philippines may lease land for 50 years, renewable once for another 25 years, or a maximum 75 years.
The legal framework for build-operate-transfer (BOT) projects and similar private sector-led infrastructure arrangements is covered under RA 6957 (as amended by RA 7718). The BOT law limits foreign ownership to 40 percent in BOT projects. Many infrastructure projects like public utilities, franchises in railways/urban rail mass transit systems, electricity distribution, water distribution and telephone systems are generally considered as natural monopolies.
There are certain provisions of the Omnibus Investment Code that impose more stringent conditions on foreign- owned enterprises seeking to qualify for BOI-administered incentives. In general, foreign-owned firms producing for the domestic market must engage in a "pioneer" activity to qualify for incentives. "Non-pioneer" activities are generally opened up to foreign equity beyond 40 percent only if, after three years, domestic capital proves inadequate to meet the desired industry capacity.
For firms seeking BOI incentives linked to export performance, export requirements
are higher for foreign-owned companies which ought to produce at least 70 percent of production for export while domestic companies ought to produce only 50 percent of production for export. Foreign-owned companies must also divest to a maximum 40 percent foreign ownership within thirty years or such longer period as the BOI may allow. Foreign firms that export 100 percent of production are exempt from this divestment requirement.
The Impact of Market Reforms on Competition, Structure and Performance of the Philippine Economy
page 13 of 90
3.0 The Evolution of Competition Related Laws and Policies
The Philippines does not have a comprehensive framework for competition policy and regulation. Current competition law and regulations are fragmented (see Table 8) and implemented by different government institutions. The Philippine Constitution prohibits and regulates monopolies, combinations in restraint of trade and other unfair competition practices. The Revised Penal Code defines and penalizes anticompetitive behaviour that is criminal in nature. The Civil Code of the Philippines allows the collection of damages arising from unfair competition as well as abuse of dominant position by a monopolist. The Act to Prohibit Monopolies and Combinations in Restraint of Trade, meanwhile, allows treble damages for civil liability arising from anticompetitive behaviour. The Corporation Code of the Philippines also covers the rules on mergers, consolidations, and acquisitions. It does not, however, address competition issues such as the possible abuse of dominant position arising from mergers and acquisitions.
There is no central government agency that monitors the implementation of
competition laws and policy, with various government agencies being tasked with both the regulation and promotion of competition in different economic sectors. For instance, the National Telecommunications Commission for telecommunications, the Energy Regulatory Board for power, Maritime Industry Authority for the shipping industry, Philippine Ports Authority for ports and arrastre services, and the Civil Aeronautics Board for air commerce, among others (Table 9).
There is general agreement that despite their considerable number and varied nature,
these laws have been ineffective in addressing anticompetitive behavior mainly due to lack of enforcement. The laws have been hardly used or implemented as may be seen in the lack of cases litigated in court against anti-competitive behavior. Since the laws are penal in nature, guilt must be proven without reasonable doubt and hence, the amount of evidence required so that the case may prosper is tremendous. The fines are also insufficient to prevent would-be criminals.
Since the early 1980s, there have been various attempts to legislate new competition
laws (refer to Table 10). There are two House bills that allow the creation of fair trade commission. The Espina bill is the most comprehensive and the strictest. It provides a more powerful commission than the Gonzales-Roxas bill. In terms of penalties, the Espina bill provides for imprisonment of not less than five to not more than 20 years, including possible closure of the erring firm. The Gonzales Roxas bill only contains provisions for penalties. To date, none of the House bills have been acted upon. The bills are both pending in the House Committee on trade and industry.

The Impact of Market Reforms on Competition, Structure and Performance of the Philippine Economy
page 14 of 90
Table 8: Existing Antitrust Laws and Regulations Competition Law Description Agency Responsible 1987 Philippine Constitution Article XII, Section 19
prohibits anti-competitive practices, combinations in restraint of trade and other unfair competition practices
RA 3815: Revised Penal Code Articles 186 and 187
defines and penalizes anticompetitive behavior that is criminal in nature such as monopolies and combinations in restraint of trade
RA 386 (1949): Civil Code of the Philippines, Article 28
allows the collection of damages arising from unfair competition as well as abuse of dominant position by a monopolist
RA 165: Act to Prohibit Monopolies and Combinations in Restraint of Trade
allows treble damages for civil liability arising from anticompetitive behavior
RA 165: Intellectual Property Code of the Philippines
protects patents, trademarks, and copyrights and provides for the corresponding penalties for infringement
Department of Trade and Industry Intellectual Property Office
BP 68 (1980): Corporation Code of the Philippines
rules on mergers, consolidations, and acquisitions. It does not, however, address competition issues such as the possible abuse of dominant position arising from mergers and acquisitions
Securities and Exchange Commission
BP 178 (1982) Revised Securities Act
prohibits and penalizes manipulation of security prices and insider trading
Securities and Exchange Commission
RA 7581 (1991): Price Act
to stabilize prices of basic commodities through price controls and ceiling mechanisms and prescribe measures against abusive price increases during emergencies and critical situations in order to protect consumers
Department of Trade and Industry Bureau of Trade Regulation and Consumer Protection
RA 7394 (1932): Consumer Act of the Philippines
consumer product quality and safety standards and includes deceptive and unfair sales practices like weight and measures as well as product and service warranties
Department of Trade and Industry Bureau of Trade Regulation and Consumer Protection, Bureau of Food and Drugs Bureau of Product Standards
RA 337 (1948): General Banking Act
to regulate banks and banking institutions Bangko Sentral ng Pilipinas
Source: Abad, A. (2002)
In the Senate, a bill sponsored by Sen. S. Osmena III provides for the creation of a competition commission as an administrative body of the Department of Trade and Industry. The bill also contains provisions for penalties. It, together will two other competition bills, are pending. This inaction indicates that the legislation of competition law and policy is not a priority. It shows the lack of appreciation and political will to pass a comprehensive framework for competition law and policy in the country.

The Impact of Market Reforms on Competition, Structure and Performance of the Philippine Economy
page 15 of 90
Table 9: Government agencies dealing with competition-related matters Regulatory Agency Function Department of Trade and Industry Board of Investments
pioneer and nonpioneer industries and firms availing of BOI incentives
Securities and Exchange Commission stock and nonstock corporations, resolves intra-corporate disputes and regulates all forms of securities, brokers and dealers, financing companies and investment houses
Insurance Commission insurance companies Housing and Land Use Regulatory Board
land use and real estate development
National Food Authority rice, corn, wheat and other grains and foodstuff Sugar Regulatory Administration sugar industry Philippine Coconut Authority coconut industry National Telecommunications Commission
telecommunications companies
Land Transportation Franchising and Regulatory Board
common carriers for land
Civil Aeronautics Board companies engaged in air commerce Maritime Industry Authority shipping industry Philippine Ports Authority port operators and arrastre services Department of Energy Energy Regulatory Board National Power Corporation
power generation companies and oil companies
Local Water Utilities Administration water firms outside Metro Manila Source: Abad, A. (2002) Table 10: Draft Competition Bills Proposed
bill Authors Description Year filed Status
HB 1373
Gerardo Espina
creation of fair trade commission which can adjudicate violations & conduct formal investigations, it can issue restraining orders, writs of execution, cease & desist orders
11th Congress Pending House Committee on Trade & Industry
HB 4455
Neptali Gonzales II & Manuel Roxas II
creation of fair trade commission, no adjudicatory powers to issue writs, cease & desist order or seizure of products
11th Congress Pending House Committee on Trade & Industry
HB 3780
Feliciano Belmonte Jr., Jack Enrile & Oscar Moreno
monopolization of trade, more detailed provisions on various anti trust activities
11th Congress Pending House Committee on Trade & Industry
HB 271 Roilo Golez provides for anti trust penalties 11th Congress Pending House Committee on Trade & Industry
The Impact of Market Reforms on Competition, Structure and Performance of the Philippine Economy
page 16 of 90
SB 150
Sergio Osmena III
creation of a fair trade commission & regulation of various anti-competitive practices
11th Congress Pending Senate Committee on Ways & Means
SB 1792 Juan Ponce Enrile same as Belmonte House Bill, strengthens penal provisions prohibiting monopolies & combinations in restraint of trade leaves antitrust enforcement to Courts & DOJ, DTI, & DA
11th Congress Pending Senate Committee on Ways & Means
SB 1600 Panfilo Lacson does not create an independent commission, provides for anti trust penalties including imprisonment
12th Congress Pending Senate Committee on Ways & Means
4.0 Trade Liberalization, Competition, and Productivity Links
While it does not have a comprehensive set of competition laws and regulation, the country has introduced substantial economic reforms aimed at promoting competition. As the next section discusses, the government has carried out trade liberalization in manufacturing and agriculture industries since the early 1980s. At the same time, reforms in the financial sector were also implemented. In the 1990s, privatization, liberalization, and economic deregulation were carried out in the transport sector as well as in the utilities sectors such as telecommunications, water, and power which were traditionally considered as natural monopolies or being of strategic interest.
4.1 Impact of Trade Liberalization
There are two major effects that can arise from liberalization: microeconomic and
macroeconomic (see Figure 2). The macroeconomic effects involve GDP growth, employment creation, reduced price inflation, and improvements in external balances. The microeconomic effects are the focus of this paper. The removal of trade barriers through liberalization will compel firms to rethink their strategies and to adapt to a new environment characterized by increased competition. By maintaining a competitive process, the emergence of technological innovation and improvements in product quality will also be promoted. With competition and the interplay of these effects, firms are induced to become productive.
In the theoretical literature, there are three main channels through which trade
liberalization affects a country’s economic performance. First, there are static gains arising from trade liberalization as resource allocation improves within and across industries. With increased competition from imported goods, domestic producers of import-competing goods will be forced to become more efficient. Firms will lower their price cost margins and move down their average cost curves. The pressure of competition will bring down costs and prices. As barriers to trade are removed, the costs to exporters and importers are reduced,

The Impact of Market Reforms on Competition, Structure and Performance of the Philippine Economy
page 17 of 90
Cost reduction
Attraction of Investment
Competition
Price Reduction
Increase in competitiveness
Improvement in trade balance
Increase in GDP
Productivity growth
purchasers of consumption and investment goods gain from lower prices. Consumers are the first beneficiaries of this process, as prices are lowered and as trade expansion leads to improvement in quality, quantity, and choice of products available.
Figure 2: Main Channels of the Liberalization, Competition, and Productivity Link
In the presence of within-industry heterogeneity, trade liberalization allows more
productive firms to expand while less efficient firms either exit or shrink. With the exit of inefficient firms, resources (labor and capital) will be freed and will move to other industries where they can be used more productively. Trade liberalization and other market-oriented
• Static effects: entry/exit; efficiency gains
• Dynamic gains: innovation, technological change
• Competitive effects: market power reduction
Increase in purchasing power
Economic Liberalization

The Impact of Market Reforms on Competition, Structure and Performance of the Philippine Economy
page 18 of 90
reforms will drive the process of restructuring and reshuffling of resources within and across sectors of the economy such that unprofitable activities contract while profitable ones expand. This is the expected improvement of allocative efficiency that leads to welfare gains for the whole economy.
Second, there are dynamic gains through technical change, learning, and growth that
leads to improved productivity growth. Dynamic efficiency implies that the economy achieves a permanently higher growth rate. The presence of competition, larger markets and increasing returns to scale drive firms to permanently strive for lower costs, higher quality, more specialization, and innovation through R&D activities.
Third, there are competitive effects arising from domestic competition. The new trade theory has shown that in the presence of imperfectly competitive markets, trade reforms can result in additional gains by reducing the deadweight losses created by domestic firms’ market power.
These microeconomic effects will not be achieved in a short period of time and will require several years to materialize. During the adjustment period, one of the feared costs is the reduction in employment. Thus, accompanying measures are necessary in reducing these adjustment costs, especially among workers. To realize the expected effects, it is also important that firms change their behavior and adjust to the new market environment. The success of reforms depends to a great extent on the capacity of firms to exploit the new competitive conditions in the market and to take advantage of the opportunities offered to them. Firms, however, will not venture into the unknown and uncertain. They will only take advantage of the new market opportunities if the government program for implementing policy reforms is a credible one. Policy reversals, delays in timetable, and inconsistent decision-making may thus undermine the success of liberalization.
The strength of competition is a function not only of the behavior of firms but also of the external environment within which firms compete. This includes the state of transport and communication, framework of laws and regulations, effectiveness of the financial system in matching investment resources with entrepreneurial opportunities, as well as information available to consumers. Carlin and Seabright (2000) call this external environment “competitive infrastructure” referring to both physical and institutional infrastructure. When this “competitive infrastructure” is inadequate, competition becomes weak.
4.2 Price Cost Margin as a Measure of Competition
One common approach used in assessing the impact of increased competition on mark-ups is to measure price cost margins or PCMs. The PCM or Lerner index is defined as:
PCM = [P – MC]/P
where P is price and MC is marginal cost.

The Impact of Market Reforms on Competition, Structure and Performance of the Philippine Economy
page 19 of 90
The PCM is a standard variable based on accounting data and is constructed to analyze inter-industry differences in profitability or mark-up. It is a static measure of actual conduct. Its empirical measurement is difficult since marginal costs are not directly observable and quite hard to estimate. Indirect measures have been developed based on accounting data with average variable costs acting as proxy for marginal costs.
The structure conduct performance paradigm (SCPP) in industrial organization measures PCMs using the above method. SCCP assumes that price cost margins are directly observable from accounting data. Focusing on cross-section analysis of many industries, early studies on PCMs and industry structure used price cost margin as a measure of profitability and related it to variables such as concentration, geographic dispersion of industries, industry size, growth rate, and industry capital-output ratios. These studies confirmed that profits tend to be higher in industries in which structural conditions departed substantially from the competitive model, although the statistical associations were usually weak (Collins and Preston, 1969).
The hypothesis that PCMs are directly observable formed a major dissatisfaction with the SCCP (Bresnahan, 1989). Beston (1985) indicated that accounting data yielded noisy measures of economic variables. Moreover, PCMs are easily criticized because they omit capital costs (Schamalensee, 1989). Orstein (1975) pointed out that it does not take into account other expenditures like advertising, research and development, taxes, depreciation, distribution expenses and components of overhead costs. A further problem is that PCM does not identify the relative component of fixed and variable costs for each expenditure.
The other criticism focused on the SCCP hypotheses that cross-section variation in industry structure could be captured by a small number of observable measures and empirical work should be aimed at estimating the reduced-form relationship between structure and performance (Bresnahan, 1989). Schamalensee (1989) noted that cross section studies rarely yield consistent estimates of structural parameters, although they can produce useful stylized facts to guide theory construction and analysis of particular industries.
The new empirical industrial organization (NEIO) has moved towards the use of an
econometric model of an industry in measuring market power and degree of competition. Under the NEIO, PCMs are not taken to be directly observable in accounting data. PCMs are estimated, one approach being to econometrically estimate marginal cost from cost data or factor demand data based on the economic theory of cost as dual to production (Bresnahan, 1989). Another approach is to make an inference based on the supply behavior of firms. The main problem arises from the fact that while prices can be measured, marginal costs are not directly observable (Martins, Scarpetta and Pilat, 1999). Therefore, indirect measures have to be developed. Robert Hall developed an alternative method in the late 1980s by estimating industry mark up from the production function of firms. Assuming imperfect competition, Hall showed that by estimating the parameters of the production function, the coefficient associated with the weighted growth rate of labor can be interpreted as the implied

The Impact of Market Reforms on Competition, Structure and Performance of the Philippine Economy
page 20 of 90
equilibrium mark up. The Hall framework has been extensively used in the empirical literature (see Shapiro, 1987; Domowitz et al, 1988; Caballero and Lyons 1990).
In principle, the PCM approach provides a very simple way to measure the degree of
competition. However, in practice, it is very difficult to measure marginal cost well and as such, the use of PCMs as a measure of competition has been somewhat limited. Nevertheless, recent empirical work indicates that accounting margins may still provide some useful information (see Martin, 2002). In a more recent study comparing PCMs or accounting margins based on the simple method described above (with slight modification to incorporate inventory changes) and those that were econometrically estimated using data from Spain, Siotis (2003) found that the accounting margins provide a reasonable proxy for margins obtained econometrically. Siotis concluded that the main difference between estimated mark-ups and accounting margins is one of magnitude with the latter taking lower values. He also indicated that accounting margins performed well in ranking the different sectors in terms of firms’ pricing above marginal cost. Using Philippine manufacturing data, a comparison of estimated margins obtained using the Roeger method (based on Hall) and PCMs calculated based on accounting data, was performed and as will be shown later in this paper, the same conclusions were arrived at.
In this paper, the main data sources in the calculation of price cost margins are the
Annual Survey of Establishments and Census of Establishments of the National Statistics Office. Average variable costs are used as proxy for marginal costs. Measured in this manner, the price cost margin or Lerner index becomes:
PCM = [value of output sold – raw materials costs- total compensation]/ value of output sold.
We know that Π = R – wN – rK
where Π is economic profit, R is total revenue, w is wage rate, N is labor employed, r is rate of return to capital, and K is capital.
Then, PCM can be rewritten as
PCM = [economic profits + user cost of capital]/value of output sold.
To account for certain variable costs, the price cost margin is redefined as follows:
Adjusted L = {[value of output sold + inventory change] – [raw materials costs+ fuels+ electricity + total compensation]- [rentals + depreciation + interest payments]}/ {value of output sold + inventory change}
In a situation of perfect competition where firms have no market power, economic profits are zero and the firms will be earning a normal or competitive return on investment. Thus, under perfect competition, price equals marginal cost and the price cost margin is zero. In the presence of market power, the firms will be able to set prices above those prevailing

The Impact of Market Reforms on Competition, Structure and Performance of the Philippine Economy
page 21 of 90
under competitive conditions, leading to excessive economic profits or “rents”. When prices exceed marginal cost, the price cost margin becomes positive and varies between zero and one. The higher the number, the greater the firm’s market power.
Firms may gain market power by limiting competition, i.e., by erecting barriers to
trade, and engaging in other anticompetitive business practices. This is bad because the firm’s ability to exercise market power can harm consumers and other producers through higher prices (rather than competitive prices), reduced output, and poorer product quality. In this case, market power results in inefficient allocation of resources and negatively affects industry performance and economic welfare.
The presence of entry barriers impedes competition and allows firms to acquire and
exercise market power. Regulatory barriers include government regulatory measures such as investment licensing and trade and industrial policies like tariff and nontariff measures as well as antidumping and countervailing duties along with safeguard measures.
Behavioral barriers represent abuse of dominant position where “relatively large”
firms engage in anti-competitive conduct by entering into collusive arrangements to restrict prices and output, preventing entry or forcing exit of competitors through various kinds of monopolistic conduct. These monopolistic behavior include predatory pricing, market foreclosure, product differentiation, and advertising (Dixit, 1982). Behavioral restraints are often classified into two: horizontal and vertical restraints. Horizontal restraints refer to agreements that are often referred to as “naked” restraints of trade, cartel behavior, or collusion. Examples are price-fixing, bid rigging, and allocation of territories or customers, and output restriction agreements. Vertical restraints are contractual agreements between supplier and purchasers/retailers in both upstream and downstream markets.
Economies of scale (increasing returns to scale) is an example of a structural barrier. When there are increasing returns to scale, there is a minimum size that firms have to attain if they are to have average cost as low as possible. If the minimum efficient scale is so large that only one firm of that size can serve the entire market, there will be a monopoly. This situation often occurs in public utilities such as distribution of water and electricity.
It is important to note that the economic profit or “rent” or a positive price cost margin can also serve as a reward for entrepreneurship and encourage innovation to take place. Innovation can take the form of new products or processes that lead to the creation of new markets. In these cases, high price margins are rewards for successful innovation and efficient mechanisms adopted by firms. This should not last forever since competition will erode it.
Tybout (2001) surveyed the literature in the past two decades on the impact of trade policy on mark-ups, firm sizes exports, productivity, and profitability among domestic firms. Based on the imperfect competition assumption under the new trade theory, Tybout’s main robust findings were:

The Impact of Market Reforms on Competition, Structure and Performance of the Philippine Economy
page 22 of 90
1. In general, mark-ups fall with import competition, but it is not clear whether
this phenomenon reflect the elimination of market power or the creation of negative economic profits.
2. Import competing firms cut back their production levels when foreign competition intensifies at least in the short run.
3. Trade rationalizes production in the sense that markets for the most efficient plants are expanded, but large import-competing firms tend to simultaneously contract.
4. Exposure to foreign competition often improves intra-plant efficiency. 5. Firms that engage in international activities tend to be larger, more productive,
and supply higher quality products. But the literature is mixed on whether international activities cause these characteristics or vice-versa.
6. The short-run and long-run effects of trade policy on exports and market structure can be quite different depending on factors such as initial conditions, sunk entry costs, and extent of firm heterogeneity.
Erdem and Tybout (2003) found that trade liberalization squeezes price cost margins
among import-competing firms, that the increased competitive pressure induces productivity gains among these same firms, and that further efficiency gains come from market share reallocations due to the shutting down of weak plants.
Recent studies for developing countries have demonstrated that trade liberalization can lead to substantial reductions in PCMs at least in those industries that are imperfectly competitive (Feenstra, 1995). Hoekman, Kee, and Olarreaga (2001) found that import competition reduces industry mark-up. Studies that examine the effect of trade liberalization on price cost margin estimated along the lines of the Hall approach include Levinsohn (1993) for Turkey, Harrison (1994) for Cote d’Ivoire, and Krishna and Mitra (1998) for India. Using plant-level data to assess the impact of trade liberalization on competition in developing countries, Levinsohn found that mark ups declined in Turkey as trade was liberalized and increased as protection rose. Similarly, Harrison found that mark-ups were negatively related to import competition in Cote d’Ivoire, and in India, Krishna and Mitra showed that mark ups fell during the trade reform period.
In the Philippines, existing empirical work on trade policy and competition is limited and is based mainly on the structure conduct performance paradigm where PCMs are calculated, not estimated econometrically. These studies treated profits as directly observable and valid measures of market power.
Imbat and Tanlapco (1993) calculated PCM as the ratio of the difference between value added and total compensation to value added. Using manufacturing data on 29 industries for 1988, their results showed that import competition, which was measured by the share of import value in aggregate domestic demand, had a negative effect on PCM. An interaction variable was used to capture the effect of trade reforms on competition. This was

The Impact of Market Reforms on Competition, Structure and Performance of the Philippine Economy
page 23 of 90
represented by the change in import share from 1983 to 1988 interacted with a dummy variable that was equal to 1 if the three firm concentration ratio exceeded 50 percent and zero elsewhere. The results showed that the interaction variable was negatively correlated with price cost margin which indicated that highly concentrated industries would be most affected by trade reforms. L. de Dios (1993) also use the same 1988 manufacturing data set in testing the relationship between trade liberalization and market power. De Dios calculated mark up as the ratio of [value of output less wages and costs] to [wages + costs]. Industry average tariff rate and a dummy variable representing import restrictions were used as trade liberalization variables. The results showed that tariff protection was positively correlated with mark-up while the dummy variable was negatively correlated with mark-up, which was unexpected. The three-firm concentration ratio was also found to be significantly positively correlated with mark-up. De Dios noted that the regression results are tentative given the level of product aggregation done and the unweighted average tariff rates used. She also pointed out that the cumulative impact of deregulation may not be too obvious when looking at a single year cross section of industries on which many other factors are at work but which were left out of the model. E. de Dios (1986) used 1979 establishment data on the manufacturing industry to study the relationship between price cost margin and effective protection rate. Price cost margin was defined as [value added less compensation]/value of gross output. The results showed effective protection rate (EPR) failed to attain an independent significance and it was only when EPR was interacted with concentration ratio in a log-linear specification did it become positively significant. Capital-labor ratio was found to be negatively correlated with PCM while concentration ratio had a positive relationship with PCM.
4.3 Productivity Growth as Measure of Performance The theoretical literature defines three main channels through which trade
liberalization increases productivity growth (Tybout, 2000). First, a reduction in tariff and nontariff barriers increases the competitive pressures on domestic producers in import-competing industries, thereby inducing them to improve their efficiency, introduce technological improvements through new investment or exit the industry. Second, a reduction in protection makes it cheaper to import capital goods and thus facilitate access to foreign technology. Third, trade liberalization changes the relative prices between exportables and import competing goods, making exporting relatively more attractive. Increased exports can lead to higher productivity growth through scale effects and increased awareness of best practice technology and production techniques abroad (Paus et al, 2003).
One of the measures of productivity growth is given by the ratio of output to labor
which reflects labor productivity. An analogous concept, the total factor productivity (TFP), is an economic indicator that measures the efficiency with which inputs of capital and labor are used. TFP provides more information about changes in technology than does labor

The Impact of Market Reforms on Competition, Structure and Performance of the Philippine Economy
page 24 of 90
productivity. Increases in labor productivity can result from increases in the capital-labor ratio without changes in underlying technology. Thus, TFP is the preferred measure, despite problems in measuring it.
The empirical evidence on the relationship between trade liberalization and industrial
productivity in developing countries is mixed and no definite conclusion can be drawn (Das, 2002). In India, which has undertaken substantial and far-reaching changes in its industrial and trade policy since 1991, Krishna and Mitra (1998) found evidence of a significant favorable effect of reforms on industrial productivity. Balakrishnan et al, on the other hand, found economic reforms to have an adverse effect on industrial productivity. One serious limitation of both studies was the absence of an explicit trade variable in their models as dummy variables were used. Using effective protection rates (EPRs) and import coverage ratios (percentage of imports covered by nontariff barriers) as trade liberalization variables, Goldar and Kumari (2003) found the coefficient of EPR to be consistently negative and statistically significant. However, the coefficient of the nontariff variable was found to be positive (contrary to expected relationship) but insignificant.
In Chile, Pavcnik (2002) used a panel of Chilean manufacturing establishments
covering the period 1979-1986. Chile implemented a large trade liberalization program as it eliminated most of its NTBs and reduced tariff rates from over 100 percent in 1974 to a uniform rate of 10 percent ad valorem across industries in 1979. While trade protection increased in 1983, the overall variation in protection appeared very small. Pavcnik found a positive relationship between trade liberalization and productivity and concluded that trade liberalization enhances plant productivity.
In Korea, Kim (2000) used a panel data of 36 Korean manufacturing industries
covering the period 1966-1988 and employed legal tariff rates, quota ratios (ratio of restricted imports to total imports), and nominal protection rates as trade liberalization variables. He found that under assumptions of non-constant returns and imperfect competition, trade liberalization has a positive impact on productivity performance, although the productivity increase was not significant because the extent of trade liberalization was not substantial enough. While quota ratios dropped from 100 percent to 30 percent between 1966 and 1985, nominal protection increased from 36 percent to 39 percent. Under assumptions of constant returns and perfect competition, none of the variables were significantly related to productivity.
5.0 Impact of Trade Reforms in the Manufacturing Sector
5.1 An Overview of Trade Reforms
The Philippines substantially liberalized its trade policy by reducing statutory tariff rates and removing import quantitative restrictions particularly in the late 1980s. The first tariff reform program (TRP 1) initiated in 1981 substantially reduced the average nominal
The Impact of Market Reforms on Competition, Structure and Performance of the Philippine Economy
page 25 of 90
tariff and the high rate of effective protection that characterized the Philippine industrial structure. It also reduced the number of regulated products with the removal of import restrictions on 1,332 lines between 1986 and 1989.
The second phase of the tariff reform program (TRP II) was launched in 1991. TRP II
introduced a new tariff code that further narrowed down the tariff range with the majority of tariff lines falling within the three to 30 percent tariff range. It also allowed the tariffication of quantitative restrictions for 153 agricultural products and tariff realignment for 48 commodities.
With the country’s ratification of the World Trade Organization (WTO) in 1994, the
government committed to remove import restrictions on sensitive agricultural products except rice and to replace these with high tariffs. In 1995, the government initiated another round of tariff reform (TRP III) as a first major step in its plan to adopt a uniform five percent tariff by 2005. This further narrowed down the tariff range for industrial products to within three and ten percent range. In 1996, the government legislated the tariffication of quantitative restrictions imposed on agricultural products and the creation of tariff quotas imposing a relatively lower duty up to a minimum access level (or in-quota rate) and a higher duty beyond this minimum level (or out-quota rate).
Except during the Ramos administration, the various liberalization episodes that the
economy has gone through under different presidents have been characterized by reversals. The inability of the government to sustain trade reforms can be attributed not only to the crises that have incessantly plagued the country but also to intense lobbying by special interest groups to increase their tariffs and delay or exempt them from tariff restructuring. For instance, the Marcos administration suspended TRP I because of the 1983 economic and political crises that triggered the imposition of severe import restrictions and the re-regulation of previously liberalized commodities.
In 1998, the Aquino administration signed Executive Order (EO) 413 in July 1990 to
simplify the tariff structure over a period of one year. The EO, however, was not implemented because of the vehement protests from domestic manufacturers of import substitutes. Various industry associations convened to oppose its issuance and, in the process, formed the Federation of Philippine Industries, a strong private sector group advocating protection of domestic industries. The business sector also successfully persuaded then President Aquino to delay the tariff reform package for one year. In July 1991, EO 470 was legislated; it contained the same tariff cuts under EO 413, except that the reductions were spread over a period of six years instead of one year.

The Impact of Market Reforms on Competition, Structure and Performance of the Philippine Economy
page 26 of 90
Box 1: Major Episodes of Trade Policy Reform in the Philippines Timeline Event Description 1980 Marcos Administration
Tariff Reform Program I EO 609 and EO 632-A (January 1981)
TRP 1 reduced the level and dispersion of tariff rates from a range of zero to 100 percent in 1980 to a range of 10 percent to 50 percent and removed quantitative restrictions beginning in 1981 and ending in 1985
1983 Assassination of B. Aquino Balance of payments crisis Suspension of the TRP I
1986 EDSA I Aquino Administration
Revival of import liberalization
1990 EO 413 (July 1990) EO 413 aimed to simplify the tariff structure by reducing the number of rates to four, ranging from 3 percent to 30 percent over a period of one year, but was not implemented.
1991 EO 470 (July 1991) Tariff Reform Program II
TRP II reduced the tariff range to within a three percent to 30 percent tariff range by 1995
1992 Ramos Administration
EO 8 Tariff Reform Program II
EO 8 tariffied quantitative restrictions for 153 agricultural products and tariff realignment for 48 commodities
1994 Ratification of the GATT-WTO
1995 EO 264 (August 1995) Tariff Reform Program III EO 288 (December 1995)
EO 264 further reduced the tariff range to three percent and ten percent levels, reduced the ceiling rate on manufacture goods to 30 percent while the floor remained at three percent, and created a four-tier tariff schedule: three percent for raw materials, 10 percent for locally available raw materials and capital equipment, 20 percent for intermediate goods, and 30 percent for finished goods EO 288modified the nomenclature and import duties on non-sensitive agricultural products
1996 EO 313 (March 1996) RA 8178
EO 313 modified the nomenclature and increased the tariff rates on sensitive agricultural products RA 8178 lifted the quantitative restrictions on three products and defined minimum access volume for these products
1998 EO 465 (January 1998)
Estrada Administration
EO 486 (June 1998) EO 63 (January 1999) EO 334 (January 2001) Tariff Reform Program IV
EO 465 corrected remaining distortions in the tariff structure and smoothened the schedule of tariff reduction in 23 industries identified as export winners EO 486 modified the rates on items not covered by EO 465 EO 63 adjusted the tariff rates on six industries Freezing of tariff rates at 2000 level until 2001 EO 334 adjusted the tariff structure towards a uniform tariff rate of 5 percent by the year 2004
2001 EDSA II Macapagal-Arroyo
EO 11 (April 2001)
EO 84 (March 2002) EO 91 (April 2002)
EO 11 corrected the EO 334 tariff rates imposed on certain products EO 84 extended existing tariff rates from January 2002 to 2004 on various agricultural products EO 91 modified the tariff rates on imported raw materials, intermediate inputs, and machinery and parts
2003 EO 164 (January 2003) EO 241 (October 2003)
EO 164 maintained the 2002 tariff rates for 2003 covering a substantial number of products EO 241 and EO 264 adjusted tariff rates on finished products and raw materials and intermediate goods, respectively.

The Impact of Market Reforms on Competition, Structure and Performance of the Philippine Economy
page 27 of 90
Amid a weak Estrada administration, the National Economic Development Authority (NEDA) struggled to continue the trade reforms initiated by the Ramos government. EO 486, a comprehensive tariff reform package, was signed. However, this was strongly opposed by the local manufacturers of import-substitutes. After six months, EO 63 was issued to increase the tariff rates on textiles, garments, petrochemicals, pulp and paper, and pocket lighters. In 2000, tariffs were frozen until the following year.
The same pattern emerged under the Arroyo administration. TRP IV, which was
legislated prior to the impeachment of Estrada, never really took off the ground as intense pressure by lobby groups either resulted in tariff increases or postponement of scheduled tariff reductions. In March 2002, EO 84 was passed to extend existing tariff rates from January 2002 to 2004 on various agricultural products. In January 2003, EO 164 was signed to maintain the 2002 tariff rates for 2003 covering a substantial number of products. By December 2003, two legislations, EOs 241 and 264, were passed to adjust the tariff schedule resulting in tariff increases on a group of selected agricultural and manufactured products.
5.2 Structure of Effective Protection
The substantial trade liberalization implemented in the last two decades has considerably reduced the high rates of nominal and effective protection in the economy. Table 11 shows that the average tariff rate fell from 33.33 percent in 1990 to 6.82 percent in 2004 while the average effective protection rate3 dropped from 39.4 percent to 6.33 percent, respectively.
Note that a lower level of tariff protection does not always imply that the tariff
schedule is less distorting. The economic and trade distortions associated with a country’s tariff structure depend not only on the size of tariffs but also on the dispersion of these tariffs across all products. Table 11 shows two measures of dispersion: the percentage of tariff peaks and the coefficient of variation. Tariff peaks are estimated by the proportion of 3 Effective protection rates (EPR) or rates of protection of value added are more meaningful than actual tariff rates since it is value added rather than the value of the product that is contributed by the domestic activity being protected. EPRs measure the net protection received by domestic producers from the protection of their outputs and the penalty from the protection of their inputs. The EPR formula is given by EPR = (V-V*)/ V* where V is the domestic value added per unit of the final good (including the tariffs on that good and on its inputs) and V* is the value added under free trade. Value added per unit , in turn, is defined as the gross value of output minus the cost of inputs used in production. Domestic value added is V = (1+ tj) - ∑ aij * (1+ti) free trade value added is the same, except that in this case tariffs do not exist (the value of t is zero) V* = 1- ∑ aij where a i j : technical coefficient derived from the 1994 input-output table indicating the amount of input from
sector i needed to produce a unit of output j t j : tariff on output from sector j t i : tariff on input from sector i.

The Impact of Market Reforms on Competition, Structure and Performance of the Philippine Economy
page 28 of 90
products with tariffs exceeding three times the mean tariff while the coefficient of variation is the ratio of the standard deviation to the mean. In general, the more dispersion in a country’s tariff schedule, the greater the distortions caused by tariffs on production and consumption patterns. Firms will tend to increase the production of those commodities protected by high tariffs. The reallocation of resources away from potentially competitive products towards highly protected less competitive products tends to lower the overall efficiency of the economy. Consumers will pay high prices for both imports and domestic import-competing products, thus reducing consumer welfare and benefiting domestic producers. Table 11: Nominal and Effective Protection in the Philippine Economy 1990 1998 2000 2004 Average tariff (in percent, all sectors) 33.33 11.32 8.47 6.82 Dispersion of tariffs (coefficient of variation) 0.44 0.96 0.99 1.07 Effective protection rate (in percent, all sectors) 29.39 8.59 7.06 6.33 Dispersion (coefficient of variation) 0.75 2.19 2.04 2.91 Percent of tariff peaks - 2.24 2.48 2.71 Number of product lines (8-digit level 2002 HS) 6,193 7,366 7,382 Source: Author’s own calculations except 1990 Manasan & Pineda (1999). Number of product lines refers to 6-digit HS.
Despite generally low average nominal protection rate, tariff variance remains high
and even increased from 44 percent in 1990 to 107 percent in 2004, thereby implying a wide dispersion of tariff lines. The number of tariff peak products went up from 165 product lines (or 2.24 percent of total number of HS lines) in 1998 to 200 lines (2.7 percent of total HS lines) in 2004. The tariffs for peak products range from 25 percent to 65 percent in 2004. These tariff peaks are concentrated in agricultural staple food products such as palay, corn, sugarcane, onions, garlic, cabbage, roots and tubers, hog, cattle and other livestock, chicken, other poultry and poultry products that serve as inputs to the manufacturing industry. Tariff peaks are also present in related manufactured food products such as milled and refined sugar, milled rice and corn, processed and roast coffee, processed meat, canned and preserved fruits and vegetables, starch and starch products, bakery products excluding noodles, and miscellaneous food products. They can also be found in non-food manufactures like animal feeds, drugs and medicines, chemical products, and motor vehicles.
The structure of protection has remained biased for manufacturing and agriculture
importables as these continue to receive higher levels of protection than exportables. On the average, manufacturing exportables have negative EPRs from 1998 to 2004 (see Table 12). This clearly indicates that manufacturing exportables are penalized by the system of protection. Given the strong anti-export bias of the structure of protection, only the best firms are able to export. There is clearly no incentive for firms to venture into the export market as it still remains profitable to manufacture import-substitutes for the domestic market. Food manufacturing has an average EPR for importables at 15 versus 0.4 percent for exportables. Tobacco has an average EPR of 6 percent for importables and -0.12 percent for its exportables while transport equipment has an average EPR of 5 percent for importables and -1.2 percent for exportables. The country’s major exports have negative protection of -

The Impact of Market Reforms on Competition, Structure and Performance of the Philippine Economy
page 29 of 90
0.26 percent for machinery and electrical equipment and -1.34 percent for garments. Except for food processing and furniture and fixtures, the manufacturing sub-sectors have zero or negative EPRs for their exportable sectors.
Table 12: Weighted Average Effective Protection Rates (in percent), 1998-2005 Sector 1998 1999 2000 2001 2002 2003 2004 All Industries 8.59 7.80 7.06 7.09 6.14 5.89 6.33 Exportable 2.35 1.75 1.59 1.71 1.16 1.1 1.38 Importable 14.76 13.42 12.28 12.16 10.89 10.48 10.98 Agriculture 19.38 17.50 15.87 16.62 14.38 13.74 15.09 Exportable 6.96 6.45 5.22 5.67 4.26 4.04 4.93 Importable 12.42 11.05 10.65 10.95 10.12 9.70 10.16 Fishing & forestry 8.52 8.05 5.97 5.78 4.67 4.63 5.15 Exportable 5.28 4.94 3.70 3.51 2.61 2.62 3.04 Importable 3.24 3.10 2.27 2.27 2.05 2.00 2.11 Mining & quarrying 1.99 2.05 2.09 2.11 1.91 1.86 1.80 Exportable 1.15 1.22 1.34 1.38 1.30 1.27 1.24 Importable 0.84 0.83 0.75 0.73 0.60 0.59 0.56 Manufacturing 7.01 6.36 5.86 5.79 5.04 4.82 5.13 Exportable -0.38 -0.92 -0.48 -0.45 -0.52 -0.52 -0.53 Importable 14.17 12.93 11.75 11.51 10.2 9.83 10.3 Food processing 19.61 18.32 17.47 17.42 15.57 14.49 15.36 Exportable 0.89 0.91 0.67 0.63 0.29 0.29 0.35 Importable 18.72 17.40 16.80 16.79 15.28 14.20 15.01 Beverages 9.27 7.54 3.88 3.89 1.88 1.75 3.20 Exportable -0.38 -0.34 -0.29 -0.29 -0.25 -0.26 -0.26 Importable 9.65 7.88 4.18 4.18 2.13 2.01 3.46 Tobacco 10.83 7.88 5.01 5.04 3.56 3.50 6.06 Exportable -0.31 -0.24 -0.18 -0.17 -0.12 -0.12 -0.12 Importable 11.14 8.12 5.18 5.21 3.68 3.62 6.18 Textile 5.97 5.58 4.51 4.51 3.28 3.6 3.82 Exportable -0.48 -0.86 -0.3 -0.25 -0.24 -0.09 -0.26 Importable 6.37 6.24 4.76 4.69 3.49 3.7 4.02 Garments -2.11 -2.76 -1.42 -1.31 -0.99 -1.01 -1.34 Exportable -2.95 -3.39 -2.11 -2.01 -1.51 -1.52 -1.84 Importable 0.84 0.63 0.69 0.69 0.52 0.52 0.5 Leather & leather products -0.42 -0.70 -0.36 -0.37 -0.49 -0.28 -0.27 Exportable -2.65 -2.46 -1.78 -1.72 -1.38 -1.58 -1.59 Importable 2.24 1.76 1.42 1.35 0.89 1.30 1.33 Wood & wood products 1.62 1.48 0.85 0.77 0.37 0.49 0.50 Exportable -0.68 -0.59 -0.60 -0.64 -0.59 -0.58 -0.59 Importable 2.30 2.07 1.45 1.41 0.96 1.07 1.09 Furniture & fixtures 18.53 14.71 14.55 14.37 10.55 10.76 10.80 Exportable 18.41 14.61 14.45 14.28 10.48 10.70 10.73 Importable 0.13 0.09 0.09 0.08 0.06 0.07 0.06 Paper & paper products 3.10 2.36 1.78 1.77 1.18 1.31 1.01 Exportable -1.94 -1.73 -1.37 -1.33 -0.90 -0.96 -0.85 Importable 5.04 4.09 3.15 3.10 2.09 2.26 1.86 Chemicals & chemical products 2.69 2.49 1.96 1.88 1.55 1.82 1.86 Exportable -0.52 -0.50 -0.44 -0.43 -0.33 -0.34 -0.34 Importable 3.21 3.00 2.40 2.31 1.89 2.16 2.20 Rubber & plastic products 1.48 0.79 0.73 0.74 0.40 0.60 0.45

The Impact of Market Reforms on Competition, Structure and Performance of the Philippine Economy
page 30 of 90
Exportable -1.95 -1.94 -1.51 -1.46 -1.29 -1.31 -1.43 Importable 3.43 2.73 2.23 2.20 1.68 1.91 1.88 Petroleum & nonmetallic mineral products 2.64 2.65 1.99 1.65 1.37 1.58 1.60 Exportable 0.13 0.14 0.03 -0.02 -0.06 0.00 0.01 Importable 2.51 2.51 1.95 1.67 1.44 1.58 1.59 Basic metal & metal products 0.35 0.21 0.15 0.11 0.00 0.10 0.09 Exportable -1.95 -1.78 -1.55 -1.42 -1.08 -1.13 -1.13 Importable 2.30 1.99 1.70 1.52 1.08 1.24 1.23 Machinery & electrical equipment -0.79 -0.76 -0.20 -0.23 -0.21 -0.25 -0.26 Exportable -1.85 -1.74 -0.96 -0.88 -0.69 -0.74 -0.70 Importable 1.06 0.98 0.77 0.66 0.48 0.49 0.44 Transport equipment 4.59 4.69 3.61 3.54 3.92 3.83 3.89 Exportable -1.94 -1.82 -1.45 -1.39 -1.21 -1.23 -1.20 Importable 6.53 6.51 5.06 4.94 5.13 5.07 5.08 Miscellaneous products -0.82 -1.02 -0.62 -0.59 -0.45 -0.39 -0.48 Exportable -2.15 -2.13 -1.53 -1.48 -1.11 -1.18 -1.26 Importable 1.32 1.11 0.91 0.89 0.67 0.79 0.78 Source: Author’s own calculations.
The system of protection has also remained biased for agriculture as the sector enjoys
the highest level of protection since 1996. The agriculture sector, which used to be penalized by the system of protection, witnessed increases in its EPR between 1974 and 1996 (see Table 13). Its effective protection rate went up from 9 percent in 1974 to 29 percent in 1996. This declined to 19 percent in 1998 and is currently about 15 percent. Note that the high tariff schedule in agriculture resulted from the tariffication under the WTO. In 1996, the government legislated the tariffication of quantitative restrictions imposed on agricultural products and the creation of tariff quotas imposing a relatively lower duty up to a minimum access level (or in-quota rate) and a higher duty beyond this minimum level (or out-quota rate). Unlike the rest of the sectors where ad valorem tariffs are used, tariff quotas are used in agriculture primarily because of the increased protection that they can provide against large reductions in import prices.
Table 13 provides a list of the most highly protected sectors in the economy. In
agriculture, the sub-sectors with the highest EPRs are coffee and hogs with EPRs of 38 percent and 35 percent in 2004, respectively. Corn comes next with an EPR of 26 percent. In manufacturing, there are two outlier sectors: coffee roasting and processing with a negative free trade value added and manufacture of pesticides and insecticides whose EPR is over 200 percent in 2004. Under transport, the manufacture and assembly of motor vehicles also has a relatively high protection with its EPR of 76 percent. Meat processing and rice and corn milling have EPRs slightly above 40 percent. Carpets and rugs, wire nails, rebuilding and major alteration of motor vehicles, and bicycles and motorcycles have EPRs ranging from 30 to 35 percent. Fish canning, bakery products excluding noodles, sugar milling and refining, ready-made clothing, made-up textile goods excluding wearing apparels, hardboard and particle board, and structural concrete have EPRs below 30 percent but greater than 23 percent.

The Impact of Market Reforms on Competition, Structure and Performance of the Philippine Economy
page 31 of 90
Table 13 : High Effective Protection Rates in Agriculture and Manufacturing Sectors Sector 1974 1990 1996 1998 2002 2004 Classification Agriculture, weighted average 9 26 29 19 14 15
Palay
-
53
53
53
-
-
Palay production
Coffee 50 32 65 48 43 38 Other agricultural crops
Corn - 20 44 36 31 26 Corn production Hog - - - 40 36 35 Livestock Manufacturing, weighted average 44 31 28 7 5 5
Coffee roasting & processing 36 90 210 * * * Food manufacturing Manufacture of pesticides, insecticides
17 23 5 109 110 238 Industrial Chemicals
Mfr and assembly of motor vehicles
127
30
20
97
78
76
Transport equipment
Meat and meat products 68 61 91 60 52 41 Food processing Rice & corn milling
-49& -46
38
60
51
43
42
Food processing
Manufacture of wire nails
-
52
56
74
28
32
Fabricated metal products
Manufacture of carpets & rugs 43 60 32 52 32 33 Textiles Rebuilding & major alteration of motor vehicles
- 33 21 43 34 33 Transport equipment
Mfr, assembly of motorcycles & Bicycles
52 40 30 45 32 35 Transport equipment
Manufacture of hardboard & particle board
181 31 46 38 29 29 Wood & cork products
Manufacture of ready made clothing -26
23
15 45 28 27 Garments
Manufacture of structural concrete products 110
110
81 59 16 26
Other non metallic mineral products
Manufacture of made up textile goods ex apparel 1
32
16 40 26 29 Textile
Sugar milling and refining
-12
53
106
36
31
30
Food manufacturing
Radio and TV receiving sets, sound recording & producing eq. incl records and tapes
204
51
33
37
22
19
Electrical machinery, apparatus, appliances & supplies
Mfr of bakery prods exc noodles 3,371
57
34
35
23
28
Food manufacturing
Mfr & repair of furniture & fixtures, made primarily of metal 0
62
38 37 23 24 Metal furniture
Hosiery, underwear, & outer knitting -4 -3 -0.4 36 22 21 Textiles Manufacture of other wearing apparel ex footwear -
10
6 35 22 22 Garments
Manufacture of veneer & plywood 5
35
22 35 19 19
Wood & wood products

The Impact of Market Reforms on Competition, Structure and Performance of the Philippine Economy
page 32 of 90
leather & leather substitutes ex footwear & apparel 145
40
24
37 14 23
Leather &leather products
Manufacture of articles made up of native materials -
-7
-3 31
20
22
Textiles
Metal stamping, coating, engraving mills 38
35
26 36 16 20
Fabricated metal products
Manufacture of rubber footwear 454 23 13 37 14 19 Rubber products Other fabricated wire & cable prods exc insulated wire & cable 14
35
38 33 16 16
Fabricated metal products
Manufacture & repair of other furniture 0
71
43 33 17 17 Furniture &fixtures
Manufacture of flat glass
45
63
39
30
14
20
Glass & glass products
Manufacture of leather footwear & footwear parts
-27 19 11 33 13 19 Leather footwear
* negative free trade value added EPR Sources: author’s own calculations (1998-2004), Manasan & Pineda (1990 & 1996), and Bautista, Power & Associates (1974).
5.3 Import Penetration and Export Ratios4
Table 14 presents two trade measures: the import penetration ratio and export ratio. On the average, both import penetration and exports ratios increased between the late 1970s and the late 1990s indicating that the exposure of the country’s industries to international trade has increased. While the import penetration ratio increased steadily across the three periods, the export ratio dropped substantially from 97 percent in the 1980s to 54 percent during the 1990s. In the 1980s, the export ratio exceeded the country’s import penetration ratio (see Figure 2) indicating the presence of highly competitive industries in the country.
4 Import Penetration Ratio = [Imports/(Output – Exports + Imports)] and Export Ratio = [Exports/Output]
Figure 2: Import Penetration (MPR) and Export Ratios (XR)
0.00 0.20 0.40 0.60 0.80 1.00 1.20
1977-80 1981-90 1991-98period
ratio MPRXR

The Impact of Market Reforms on Competition, Structure and Performance of the Philippine Economy
page 33 of 90
Table 14: Import Penetration and Export Ratios
Source of basic data: World Bank Based on these trade measures, industries may be broadly classified into four groups where (i) export ratios are greater than import penetration ratios, (ii) both export ratios and import penetration ratios are high, (iii) export ratios are lower than import penetration ratios, and (iv) export ratios and import penetration ratios are low. The first group which is characterized by industries having export ratios that are significantly greater than their import penetration ratios may reflect the presence of competitive domestic industries. These include leather and leather products, wood and wood/cork products, furniture and fixtures, machinery excluding electrical, and professional and scientific equipment.
The second group includes industries like electrical machinery, other manufacturing, non-ferrous metal, and manufacture of plastic products (not elsewhere classified) have high
Import Penetration Ratio Export Ratio
PSIC Description 1977-
79 1980-
89 1990-
98 1977-
79 1980-
89 1990-
98 311 Food Processing 0.17 0.14 0.18 0.50 0.32 0.20 313 Beverage Manufacturing 0.08 0.06 0.05 0.01 0.01 0.01 314 Tobacco Manufacturing 0.00 0.05 0.11 0.02 0.03 0.04 321 Mfr of Textiles 0.15 0.28 0.60 0.10 0.20 0.44 322 Mfr of Wearing Apparel, Except Footwear 0.03 0.02 3.11 0.76 0.55 0.82 323 Leather & Productsof Lthr, Subs & Fur 0.21 2.37 -0.92 1.08 17.52 1.51 331 Mfr of Wood & Wood/Cork Prods, Exc Furn 0.05 -0.02 0.40 0.89 0.82 0.74 332 Mfr/Rrp of Furniture & Fixture (Wooden) 0.00 0.05 0.44 0.37 0.74 0.80 341 Mfr of Paper & Paper Products 0.19 0.24 0.35 0.02 0.04 0.09 342 Printing, Publishing & Allied Ind 0.15 0.14 0.19 0.00 0.00 0.03 351 Mfr of Industrial Chemicals 0.64 0.66 0.72 0.17 0.29 0.27 352 Mfr of Other Chemical Products 0.21 0.18 0.22 0.02 0.03 0.04 353 Petroleum Refineries 0.11 0.09 0.12 0.01 0.03 0.04 354 Misc Products of Petroleum & Coal 0.50 0.77 0.47 0.00 0.47 0.02 355 Mfr of Rubber Products 0.19 0.15 0.27 0.01 0.02 0.06 356 Mfr of Plastic Products, N.E.C. 0.10 0.10 0.28 0.19 0.28 0.23 361 Mfr of Pottery, China & Earthenware 0.11 0.12 0.14 0.12 0.12 0.08 362 Mfr of Glass& Glass Products 0.17 0.16 0.33 0.07 0.06 0.15 371 Iron & Steel Basic Industries 0.50 0.39 0.41 0.06 0.07 0.04 372 Non-Ferrous Metal Basic Industries 1.42 1.19 0.45 1.49 0.90 0.48 381 Fabricated Metal Prods Exc Mach & Equip 0.45 0.39 0.53 0.08 0.13 0.25 382 Mfr of Machinery Exc Electrical 0.90 0.85 1.74 0.17 0.23 2.55 383 Elect Mach Apparatus, Appliances &Supp 0.49 0.56 2.79 0.11 0.45 1.27 384 Mfr of Transport Equipment 0.53 0.50 0.54 0.06 0.13 0.12 385 Prof, Scientific, Msurg & Cont Equipment 1.02 0.93 1.45 1.03 0.91 2.64 390 Other Manufacturing Industries 0.67 0.28 1.10 0.71 0.95 1.03 Average Manufacturing 0.35 0.41 0.62 0.31 0.97 0.54

The Impact of Market Reforms on Competition, Structure and Performance of the Philippine Economy
page 34 of 90
export ratios and high import penetration ratios. This indicates the internationalization of these industries especially because of sourcing of intermediate goods and intra-industry trade. The third group is characterized by industries whose import penetration ratios are significantly higher than their export ratios which may reflect weak domestic industries. These include paper products, printing, publishing, rubber products, glass and glass products, iron and steel, fabricated metal products, and transport equipment. The fourth group of industries which includes food processing, beverage, and tobacco have low import penetration ratios and low export ratios which may possibly indicate the presence of weak competition in the domestic market. Note the decline in the competitiveness of food processing as its export ratio, which began at a high level of 50 percent in the late 1970s, dropped drastically to 32 percent in the 1980s to only 20 percent in the 1990s. The sector’s import penetration ratio remained low and changed very little during the same periods.
5.4 Four-firm Concentration Ratios: Manufacturing Sector
Competition is not straightforward to measure. Oftentimes, concentration ratios are used to measure the strength of competition. Concentration ratios are at best imperfect indication of the underlying competition and can be misleading when there are important differences in size, strength, and productivity between firms.
Table 15 presents the four-firm concentration ratios (CR4) in the manufacturing sector for the years 1988, 1994, 1995 and 1998. The calculated average CR4 indicates that the Philippine manufacturing industry has remained highly concentrated increasing from 71 percent in 1988 to around 74 percent in 1994 and 1995 and further to 81 percent in 1998. The CR4 estimates also show that around 65 percent of the manufacturing industry have concentration ratios ranging from 70 to 100 percent. In 1998, this went up to almost 90 percent.
Manufacturing sub-sectors with high level of concentration are mostly those
producing intermediate and capital goods. In 1995, these included sectors such as petroleum refineries, glass and glass products, industrial chemicals, pottery, china and earthenware, petroleum and coal products, rubber products, and other nonmetallic mineral. These also included paper and paper products, professional and scientific equipment, nonferrous metal products, transport equipment, iron and steel, machinery except electrical, textiles, other chemicals and fabricated metal products. Consumer goods like tobacco and those of food manufacturing, and food processing firms also belong to the high concentration group.
In 1995, the moderate concentration group (which consists of sub-sectors with concentration ratios ranging from 40 to 69 percent) included beverages, electrical machinery, metal furniture, wood and cork products, cement, printing and publishing, leather footwear, furniture except metal, plastic products, and leather and leather products. In 1998, only furniture and cement remained in the moderately concentrated group as the other sectors
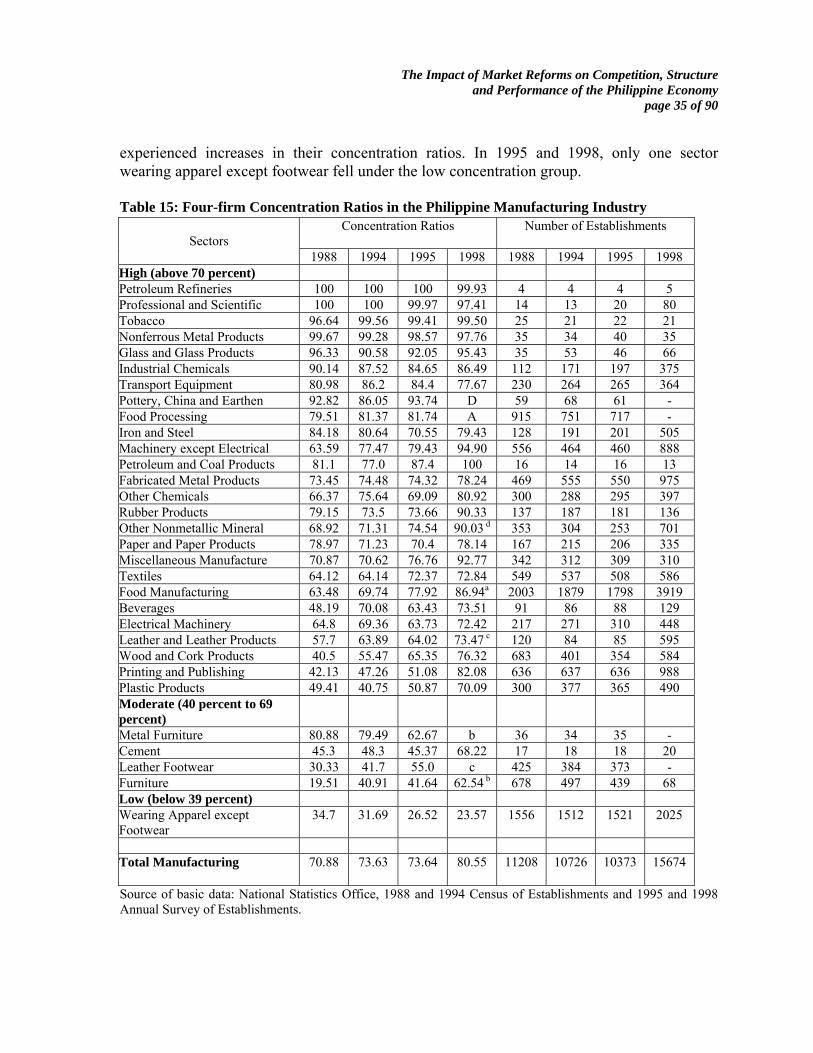
The Impact of Market Reforms on Competition, Structure and Performance of the Philippine Economy
page 35 of 90
experienced increases in their concentration ratios. In 1995 and 1998, only one sector wearing apparel except footwear fell under the low concentration group.
Table 15: Four-firm Concentration Ratios in the Philippine Manufacturing Industry
Source of basic data: National Statistics Office, 1988 and 1994 Census of Establishments and 1995 and 1998 Annual Survey of Establishments.
Concentration Ratios
Number of Establishments
Sectors
1988 1994 1995 1998 1988 1994 1995 1998 High (above 70 percent) Petroleum Refineries 100 100 100 99.93 4 4 4 5 Professional and Scientific 100 100 99.97 97.41 14 13 20 80 Tobacco 96.64 99.56 99.41 99.50 25 21 22 21 Nonferrous Metal Products 99.67 99.28 98.57 97.76 35 34 40 35 Glass and Glass Products 96.33 90.58 92.05 95.43 35 53 46 66 Industrial Chemicals 90.14 87.52 84.65 86.49 112 171 197 375 Transport Equipment 80.98 86.2 84.4 77.67 230 264 265 364 Pottery, China and Earthen 92.82 86.05 93.74 D 59 68 61 - Food Processing 79.51 81.37 81.74 A 915 751 717 - Iron and Steel 84.18 80.64 70.55 79.43 128 191 201 505 Machinery except Electrical 63.59 77.47 79.43 94.90 556 464 460 888 Petroleum and Coal Products 81.1 77.0 87.4 100 16 14 16 13 Fabricated Metal Products 73.45 74.48 74.32 78.24 469 555 550 975 Other Chemicals 66.37 75.64 69.09 80.92 300 288 295 397 Rubber Products 79.15 73.5 73.66 90.33 137 187 181 136 Other Nonmetallic Mineral 68.92 71.31 74.54 90.03 d 353 304 253 701 Paper and Paper Products 78.97 71.23 70.4 78.14 167 215 206 335 Miscellaneous Manufacture 70.87 70.62 76.76 92.77 342 312 309 310 Textiles 64.12 64.14 72.37 72.84 549 537 508 586 Food Manufacturing 63.48 69.74 77.92 86.94a 2003 1879 1798 3919 Beverages 48.19 70.08 63.43 73.51 91 86 88 129 Electrical Machinery 64.8 69.36 63.73 72.42 217 271 310 448 Leather and Leather Products 57.7 63.89 64.02 73.47 c 120 84 85 595 Wood and Cork Products 40.5 55.47 65.35 76.32 683 401 354 584 Printing and Publishing 42.13 47.26 51.08 82.08 636 637 636 988 Plastic Products 49.41 40.75 50.87 70.09 300 377 365 490 Moderate (40 percent to 69 percent)
Metal Furniture 80.88 79.49 62.67 b 36 34 35 - Cement 45.3 48.3 45.37 68.22 17 18 18 20 Leather Footwear 30.33 41.7 55.0 c 425 384 373 - Furniture 19.51 40.91 41.64 62.54 b 678 497 439 68 Low (below 39 percent) Wearing Apparel except Footwear
34.7 31.69 26.52 23.57 1556 1512 1521 2025
Total Manufacturing 70.88 73.63 73.64 80.55 11208 10726 10373 15674

The Impact of Market Reforms on Competition, Structure and Performance of the Philippine Economy
page 36 of 90
The concentration ratios refer to the ratio of census value added by four largest firms to total in each five-digit PSIC sector. The concentration ratios given above are weighted averages for three-digit PSIC. acombined food manufacturing and food processing; bcombined metal furniture and furniture ccombined leather footwear and leather products ; dcombined pottery,china and other nonmetallic products
5.5 Price Cost Margins in Manufacturing
PCMs when reliably measured maybe an inverse measure of the strength of competition in the market. But note that high PCMs are not always an indication of undesirable market power, they maybe a temporary reward for innovation. Using the National Statistic’s annual survey and census of manufacturing establishments, PCMs were computed for the period 1972 to 1998. As the figure shows, PCMs fluctuated widely prior to 1986. Since then, PCM movements were relatively smooth except for a sharp rise in 1993. In general, an upward trend is evident between the periods 1986-90 and 1996-98.
Table 16 presents estimates of average PCMs in the manufacturing sector from the seventies to the late 1990s. On the average, the PCMs for the manufacturing sector remained quite high, slightly increasing from 31 percent in the seventies to 34 percent in the late nineties with some fluctuations in between. In general, the dispersion of the PCMs about the mean declined between the mid-seventies and the nineties. There was a significant widening in the dispersion of PCMs in the mid-seventies but this narrowed down in the succeeding decades particularly toward the mid-nineties. The standard deviation increased tremendously from 14 percent in 1972-75 to 32 percent in the period 1976-80. However, this fell to 20 percent in 1986-90 and further dropped to 15 percent in 1991-95 and to 14 percent in 1996-98. Table 16: Simple Price Cost Margins in the Philippine Manufacturing Industry
Industry sector Average 1972-98 1972-75 1976-80 1981-85 1986-90 1991-95 1996-98
High (50 percent to 69 percent) Cement 0.65 0.59 0.66 0.67 0.65 0.65 Beverages 0.53 0.56 0.46 0.51 0.56 0.57 0.55 Glass and Glass Products 0.52 0.48 0.48 0.51 0.55 0.54 0.58 Moderate (20 percent to 49 percent) Tobacco 0.47 0.44 0.40 0.31 0.50 0.57 0.66 Other Nonmetallic Mineral Prods 0.43 0.64 0.42 0.33 0.42 0.43 0.36 Other Chemicals 0.37 0.37 0.35 0.30 0.35 0.46 0.44 Paper and Paper Products 0.36 0.35 0.38 0.36 0.36 0.34 0.36 Industrial Chemicals 0.35 0.40 0.33 0.37 0.32 0.38 0.32 Rubber Products 0.28 0.25 0.26 0.30 0.26 0.31 0.29 Food manufacturing 0.28 0.34 0.24 0.23 0.29 0.28 0.37 Textiles 0.27 0.25 0.23 0.30 0.25 0.27 0.30 Iron and Steel 0.26 0.26 0.22 0.35 0.21 0.26 0.25 Plastic Products 0.25 0.25 0.22 0.26 0.20 0.29 0.32 Electrical Machinery 0.25 0.29 0.21 0.25 0.21 0.24 0.34

The Impact of Market Reforms on Competition, Structure and Performance of the Philippine Economy
page 37 of 90
Wood and Cork Products 0.26 0.33 0.22 0.30 0.24 0.25 0.22 Furniture except Metal 0.22 0.21 0.18 0.24 0.21 0.23 0.27 Nonferrous Metal Products 0.21 0.37 0.29 0.17 0.11 0.14 0.19 Petroleum and Coal Products 0.21 0.32 0.17 0.22 0.20 0.24 0.13 Miscellaneous Manufacture 0.20 0.22 0.12 0.30 0.12 0.22 0.27 Low (19 percent and below) Fabricated Metal Products 0.17 0.23 0.12 0.16 0.12 0.21 0.21 Printing and Publishing 0.16 0.26 0.08 0.07 0.13 0.17 0.36 Leather and Leather Products 0.16 0.14 0.16 0.22 0.10 0.15 0.20 Transport Equipment 0.14 0.11 0.17 0.12 0.05 0.16 0.28 Machinery except Electrical 0.11 0.20 -0.14 0.18 0.13 0.17 0.17 Average 0.31 0.18 0.26 0.23 0.29 0.34 Standard deviation 0.14 0.32 0.17 0.20 0.15 0.14
The PCM estimates suggest sizeable and persistent margins in sectors such as
beverages, glass and glass products, and cement whose margins ranged from 55 percent to 66 percent. The estimates were ranked and classified into three major groups: high, moderate, and low. In a span of over twenty years, the margins seemed to remain quite stable. Significant reductions were observed in only three manufacturing sectors: other nonmetallic mineral products whose margin declined from 64 percent in the seventies to 36 percent in the nineties, nonferrous metals whose margin dropped from 37 percent to 19 percent, respectively, and petroleum and coal products whose margin decreased from 32 percent to 13 percent during the same period. A substantial increase in margin was observed in tobacco as it went up from 44 percent in the seventies to 50 percent in the late eighties to 64 percent in the nineties.
Appendix 1 presents PCM estimates calculated using roughly the same method for
India and Spain. Evidently, PCMs in the different manufacturing sectors in the Philippines are significantly higher than those in other countries. In India, the average PCM for the period 1995-1998 was 22 percent for beverages, tobacco and nonmetallic mineral products. In Spain, average PCMs during the period 1983-1996 was about 18 percent for beverages and glass products and 22 percent for nonmetallic mineral products.
Figure 3: Manufacturing PCM: 1972-1998
0.00
0.10 0.20
0.30 0.40
1970 1975 1980 1985 1990 1995 2000
Year
PCM

The Impact of Market Reforms on Competition, Structure and Performance of the Philippine Economy
page 38 of 90
Table 17 presents a second set of computed PCMs for the Philippine manufacturing sector. The second set takes into account additional expenditures that are available in the NSO’s Annual Survey and Census of Manufacturing Establishments. The second PCM measure explicitly deducts additional cost categories like fuels and electricity and capital expenditures like rentals, depreciation, and interest payments. It thus accounts for certain types of variable costs that are not accounted for in the first set of PCMs. These cost adjustments are particularly important for firms that are capital-intensive like glass manufacturers as well as for those that are intensive energy users like cement manufacturers. Following Domowitz et al (1986), inventory changes are included to ensure that adjustment for business cycle fluctuations is controlled for in the measure of PCMs.
As can be readily seen from Table 17, in terms of magnitude, the second set of PCMs
are much lower. The average for the 1996-98 period dropped substantially from 34 percent in the first set to 22 percent in the second set. In terms of PCM ranking, the second set of PCMs shows that, tobacco, beverage, petroleum refineries, cement, other chemicals, and food manufacturing had the highest PCMs. This is slightly different from the first set where the top sectors were led by cement, tobacco, beverages, and glass and glass products. Note that in the second set of PCM, cement and glass sectors witnessed substantial reductions in their PCM levels. Although, in the case of tobacco, its PCM changed very little, i.e. from 66 percent in the first set to 63 percent in the second set, despite the cost adjustments made. In contrast, glass and glass products, a sector that had very high PCM in the first set, saw a tremendous fall in its adjusted PCM. On the average, its PCM dropped from 58 percent in the first set to only 20 percent in the second set during the 1996-98 period.
On the overall, the average adjusted PCM for manufacturing followed the same upward trend found in the first set of PCMs. Between 1988-1990 and 1991-1995, the average adjusted PCM rose from 13 percent to 20 percent. This further went up to 22 percent in the 1996-98 period. The standard deviation fell from 18 percent in 1988 to 15 percent in 1998. Despite trade liberalization, most of the manufacturing sub-sectors witnessed increases in their adjusted PCMs. In the Philippines, only the following six sectors showed reductions in their adjusted PCM between the two periods 1988-1990 and 1996-98: wood and wood
Figure 4: Calculated PCM Adjusted and PCM
0.00 0.05 0.10 0.15 0.20 0.25 0.30 0.35 0.40
1988 1989 1990 1991 1993 1994 1995 1996 1997 1998
Year
PCM PCM adjustedPCM

The Impact of Market Reforms on Competition, Structure and Performance of the Philippine Economy
page 39 of 90
products, furniture and fixtures, rubber products, glass and glass products, other non-metallic products, and paper and paper products. Empirical studies typically show that trade liberalization and exposure to import competition led to a reduction in the PCMs of import-competing firms (Tybout, 2003). Note that in India, price cost margins in the post-reform period have also increased despite large reductions in tariff and non-tariff barriers (Goldar and Aggarwal, 2004 and Srivastava et al, 2001). In Turkey, while price cost margins declined in general, they went up in the highly concentrated private sector industries (Yalcin, 2000).
Table 18 shows another set of PCM estimated econometrically based on the Hall method and developed by Roeger (see Appendix 2 for details). The PCM is estimated using the following equation:
dy j = Bdx j + u j. where dy j = ( dq j + d p j ) - αj (dl j + dw j) - βj (dm j - dp j
m) - (1-αj- βj) (dk j + dr j) dx j = (dq j + d p j ) - (dk j + dr j) j is the industry-sector index B is the price cost margin Kj is capital Lj is labor input Mj is raw material input αj = (W j L j)/P j Q j is the share of wage payments to labor in total income βj = (P j
mM j)/P j Q j is the share of raw material costs in total income (1-αj- βj) = R j K j /P j Q j is the share of rental payments to capital in total income u j is error term.
The small letters denote logarithms and d (logarithmic) differences approximating growth rates. The dependent variable dyj can be interpreted as the nominal Solow residual (difference between the primal and dual Solow residual) and the explanatory variable dx j is the growth rate of the nominal output/capital ratio.
The average PCM by three-digit manufacturing sector was estimated using time series information by sector for all 26 three-digit sectors. There is a wide variation in price cost margins within the manufacturing industry. Sectors like beverages and tobacco have average PCM of around 62 percent and 59 percent, respectively while glass and glass products have an average PCM of 51 percent. Other chemicals and miscellaneous manufactures have an average PCM of 44 percent while cement and other non-metallic products have an average PCM of 41 percent. Manufacturing sectors with relatively low PCM include wearing apparel, leather and leather products, printing and publishing, transport equipment, and fabricated metal products whose average PCMs range from about 10 percent to 15 percent. Machinery except electrical has an average PCM of 19 percent. Compared with the PCMs based on accounting profits, there are differences in magnitude. It is evident

The Impact of Market Reforms on Competition, Structure and Performance of the Philippine Economy
page 40 of 90
that the price cost margins that are econometrically estimated are higher than the calculated accounting margins. However, in terms of ranking the different sectors, the two methods generally provide almost similar results. Table 17: Adjusted Price Cost Margins Manufacturing Sector 1988 1989 1990 1991 1993 1994 1995 1996 1997 1998 Food Processing 0.14 0.15 0.16 0.13 0.21 0.19 0.20 - - - Food Manufacturing 0.22 0.19 0.36 0.22 0.26 0.24 0.29 0.27 0.27 0.37 Beverage 0.51 0.53 0.47 0.50 0.51 0.50 0.49 0.43 0.44 0.51 Tobacco 0.43 0.46 0.49 0.43 0.59 0.63 0.61 0.63 0.62 0.63 Textiles 0.06 0.08 0.13 0.12 0.18 0.12 0.17 0.16 0.17 0.15 Wearing Apparel, Except Footwear 0.01 (0.07) (0.01) 0.05 0.22 0.23 0.25 0.20 0.21 0.25 Leather & Leather Products 0.04 0.08 0.16 0.10 0.15 0.04 0.14 0.12 0.09 0.17 Leather Footwear 0.12 0.19 0.14 0.14 0.45 0.04 0.10 - - - Wood & Wood/Cork Prods, Exc Furn 0.11 0.19 0.12 0.19 0.22 0.20 0.11 0.14 (0.01) 0.22 Furniture & Fixture (Wooden) 0.19 0.17 0.16 0.18 0.18 0.19 0.16 0.17 0.15 0.20 Paper & Paper Products 0.22 0.23 0.24 0.21 0.21 0.19 0.15 0.20 0.19 0.18 Printing, Publishing & Allied Industries 0.02 0.01 0.09 0.01 0.20 0.13 0.18 0.22 0.21 0.37 Industrial Chemicals 0.11 0.05 0.11 0.24 0.32 0.16 0.09 0.21 0.16 0.20 Other Chemical Prods 0.29 0.32 0.32 0.39 0.41 0.43 0.42 0.31 0.32 0.36 Petroleum Refineries 0.17 0.12 0.14 0.19 0.12 0.21 0.29 0.46 0.39 0.30 Misc Products of Petroleum & Coal 0.21 (0.01) 0.23 0.06 0.27 0.14 0.20 0.04 0.04 0.08 Rubber Products 0.21 0.23 0.16 0.17 0.22 0.20 0.28 0.20 0.03 0.13 Plastic Products, N.E.C. 0.16 0.13 0.10 0.15 0.22 0.19 0.19 0.22 0.21 0.12 Pottery, China & Earthenware 0.22 0.32 0.30 0.24 0.25 0.25 0.24 - - - Glass& Glass Products 0.36 0.35 0.30 0.17 0.17 0.28 0.38 0.28 0.21 0.10 Cement 0.21 0.28 0.20 0.25 0.29 0.28 0.29 0.35 0.34 0.39 Other Non-Metallic Products, NEC 0.19 0.25 0.22 0.24 0.29 0.20 0.22 0.18 0.14 0.22 Iron & Steel 0.06 (0.01) 0.14 0.13 0.12 0.26 0.15 0.19 0.05 0.10 Non-Ferrous Metal (0.01) (0.06) (0.07) (0.38) 0.15 (0.06) 0.06 0.17 0.18 (0.13) Fabricated Metal Prods 0.06 0.05 0.14 0.14 0.12 0.19 0.10 0.13 0.09 0.09 Machinery 0.02 0.04 (0.09) 0.07 0.07 0.02 0.14 0.11 0.13 0.11 Elect Mach Apparatus, Appliances & Supplies 0.10 0.16 0.17 0.19 0.18 0.16 0.19 0.23 0.19 0.27 Transport Equipment (0.01) 0.06 0.09 0.07 0.11 0.13 0.15 0.26 0.17 0.14 Prof, Scientific, Equipment (0.56) (0.38) (1.25) (0.45) 0.24 0.17 0.18 0.17 0.19 0.14 Furniture & Fixtures, of Metal 0.06 0.17 0.00 (0.03) 0.22 0.05 0.18 - - - Other Manufacturing 0.06 0.14 0.16 0.11 0.16 0.15 0.21 0.24 0.21 0.21 Average 0.13 0.14 0.13 0.14 0.24 0.20 0.22 0.23 0.20 0.22 Standard deviation 0.18 0.17 0.29 0.18 0.12 0.14 0.12 0.12 0.13 0.15

The Impact of Market Reforms on Competition, Structure and Performance of the Philippine Economy
page 41 of 90
Table 18. Econometrically Estimated PCMs
Note: *** indicates significance at the 1 percent level, ** at the 5 percent level, and * at the10 percent level.
5.6 Trade Liberalization and Competition in Manufacturing Empirical work on the impact of trade liberalization in developing countries indicates
that trade reforms were accompanied by falling mark-ups, productivity growth, technology advancement, and a reallocation of resources towards more efficient firms. This sub-section presents the results of a multiple regression analysis applied to assess the effect of trade liberalization on PCMs. It is based on pooled cross-section and time series data on the manufacturing industry covering 24 sub-sectors. The simple PCMs computed for the 795 five-digit manufacturing sub-sectors for the years 1988, 1994, and 1995 are pooled for the regression analysis. The regression equation is specified as
PSIC Description OLS
Robust Regression
PCM SE Obs PCM SE Obs 311-312 Food processing & Manufacturing 0.181** 0.087 22 0.226*** 0.029 22
313 Beverages 0.539*** 0.057 22 0.616*** 0.034 22 314 Tobacco 0.581*** 0.055 22 0.591*** 0.037 22 321 Textiles 0.253*** 0.06 22 0.256*** 0.022 22 322 Wearing Apparel except Footwear 0.182* 0.093 22 0.139* 0.075 22
323-324 Leather and Leather Products & Leather Footwear 0.158*** 0.045 22 0.140*** 0.038 22
331 Wood and Cork Products 0.290*** 0.055 24 0.304*** 0.026 24 332&386 Furniture including Metal Furniture 0.263*** 0.026 20 0.321*** 0.02 19
341 Paper and Paper Products 0.343*** 0.087 22 0.376*** 0.014 22 342 Printing and Publishing 0.092 0.105 22 0.151* 0.074 21 351 Industrial Chemicals 0.350*** 0.089 22 0.378*** 0.032 22 352 Other Chemicals 0.366*** 0.077 22 0.443*** 0.036 22 353 Petroleum Refineries 0.451*** 0.136 24 0.280*** 0.042 23 354 Petroleum and Coal Products 0.272*** 0.098 20 0.340*** 0.036 20 355 Rubber Products 0.397*** 0.066 22 0.355*** 0.032 22 356 Plastic Products 0.375*** 0.08 22 0.288*** 0.024 21 362 Glass and Glass Products 0.486*** 0.049 22 0.505*** 0.052 22
361, 363 & 369
Pottery, China and Earthenware, Cement & Other Nonmetallic Mineral Prods 0.433*** 0.061 22 0.410*** 0.038 22
371 Iron and Steel 0.258*** 0.076 22 0.222*** 0.03 22 372 Nonferrous Metal Products 0.319* 0.171 22 0.307*** 0.052 22 381 Fabricated Metal Products 0.162* 0.093 22 0.096* 0.052 22 382 Machinery except Electrical 0.141 0.139 22 0.190*** 0.035 22 383 Electrical Machinery 0.27*** 0.049 24 0.275*** 0.016 24 384 Transport Equipment 0.116 0.162 22 0.125*** 0.018 22 385 Professional and Scientific Eqpt 0.552*** 0.215 24 0.328*** 0.037 24 390 Miscellaneous Manufacture 0.350*** 0.043 20 0.439*** 0.014 20
All Manufacturing 0.313*** 0.024 643 0.292*** 0.011 643
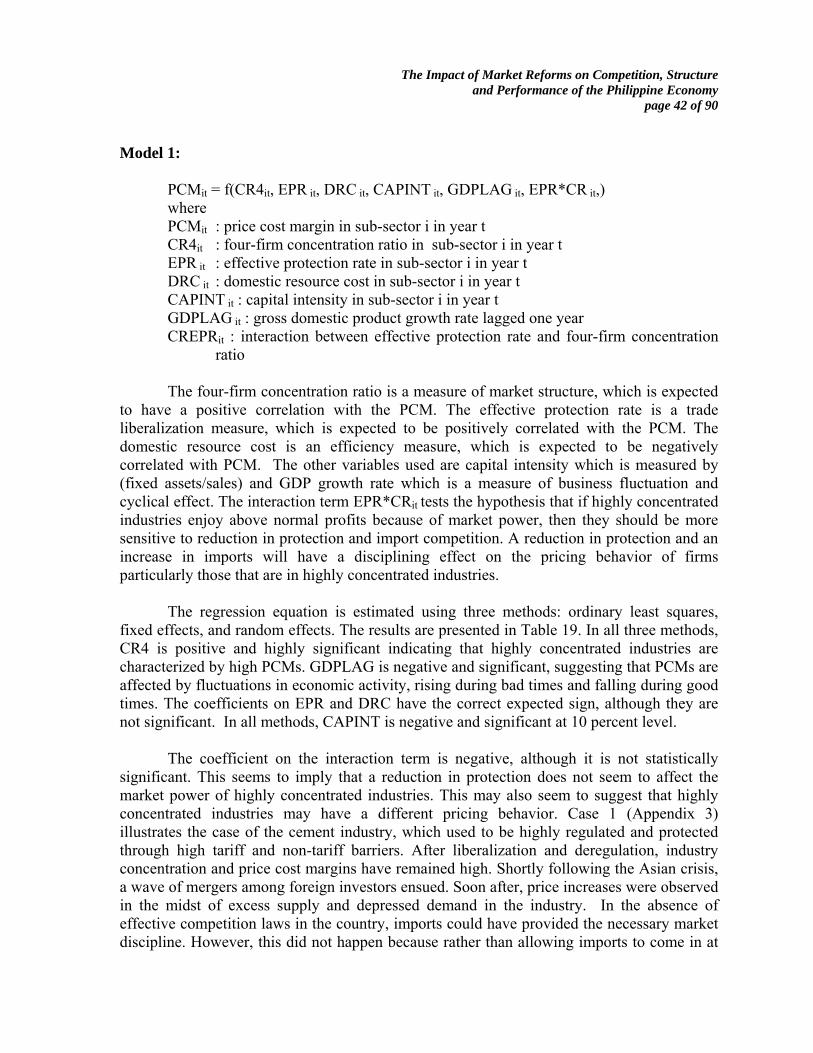
The Impact of Market Reforms on Competition, Structure and Performance of the Philippine Economy
page 42 of 90
Model 1:
PCMit = f(CR4it, EPR it, DRC it, CAPINT it, GDPLAG it, EPR*CR it,) where PCMit : price cost margin in sub-sector i in year t CR4it : four-firm concentration ratio in sub-sector i in year t EPR it : effective protection rate in sub-sector i in year t DRC it : domestic resource cost in sub-sector i in year t CAPINT it : capital intensity in sub-sector i in year t GDPLAG it : gross domestic product growth rate lagged one year CREPRit : interaction between effective protection rate and four-firm concentration
ratio The four-firm concentration ratio is a measure of market structure, which is expected
to have a positive correlation with the PCM. The effective protection rate is a trade liberalization measure, which is expected to be positively correlated with the PCM. The domestic resource cost is an efficiency measure, which is expected to be negatively correlated with PCM. The other variables used are capital intensity which is measured by (fixed assets/sales) and GDP growth rate which is a measure of business fluctuation and cyclical effect. The interaction term EPR*CRit tests the hypothesis that if highly concentrated industries enjoy above normal profits because of market power, then they should be more sensitive to reduction in protection and import competition. A reduction in protection and an increase in imports will have a disciplining effect on the pricing behavior of firms particularly those that are in highly concentrated industries.
The regression equation is estimated using three methods: ordinary least squares, fixed effects, and random effects. The results are presented in Table 19. In all three methods, CR4 is positive and highly significant indicating that highly concentrated industries are characterized by high PCMs. GDPLAG is negative and significant, suggesting that PCMs are affected by fluctuations in economic activity, rising during bad times and falling during good times. The coefficients on EPR and DRC have the correct expected sign, although they are not significant. In all methods, CAPINT is negative and significant at 10 percent level.
The coefficient on the interaction term is negative, although it is not statistically significant. This seems to imply that a reduction in protection does not seem to affect the market power of highly concentrated industries. This may also seem to suggest that highly concentrated industries may have a different pricing behavior. Case 1 (Appendix 3) illustrates the case of the cement industry, which used to be highly regulated and protected through high tariff and non-tariff barriers. After liberalization and deregulation, industry concentration and price cost margins have remained high. Shortly following the Asian crisis, a wave of mergers among foreign investors ensued. Soon after, price increases were observed in the midst of excess supply and depressed demand in the industry. In the absence of effective competition laws in the country, imports could have provided the necessary market discipline. However, this did not happen because rather than allowing imports to come in at

The Impact of Market Reforms on Competition, Structure and Performance of the Philippine Economy
page 43 of 90
the legislated tariff rate of 5 percent, the government opted to make imports more expensive by providing safeguard measures in addition to the normal tariff duty imposed on cement imports.
As the initial set of results show, the coefficient on EPR is positive as predicted, although not statistically significant. The same result is obtained when the Roeger methodology is applied to assess the effect of trade liberalization on competition. This is implemented by interacting the variable dxj with EPR to capture the change in PCM as a result of trade liberalization. EPR is a trade liberalization variable and a proxy for competitive pressure. A reduction in effective protection is expected to discipline firm behavior and lead to a decline in market power, hence a positive B2 is expected. The variable dxj is also interacted with yearly GDP growth to control for changes in PCMs due to business cycle fluctuations and demand effects. The model is given by: Model 2
dy j = B1dx j + B2 EPR*dx j - B3 GDP*dx j + u j
It is evident from Table 20 that using the OLS method, B2 has the correct sign but is
not statistically significant. The same finding is obtained in the fixed and random effects models. These results indicate that if market power declined because of trade liberalization, it did so only mildly. With the robust regression model, however, a highly significant positive coefficient is observed although its magnitude is very small. With respect to B3, a significant counter-cyclical price cost margin is observed in the random and fixed effects models. Table 19: Determinants of Price Cost Margin in Philippine Manufacturing
Note: Standard errors in parentheses; *** indicates significance at the 1 percent level, ** at the 5 percent level, and * at the 10 percent level.
Dependent variable: PCM
OLS RE FE
CR4 .001442*** (0.000461)
.0015181*** (0.0004891)
.0028625***
(0.0009944) EPR .0003275
(0.0010495) .0002855 (0.0010516)
.0003764 (0.0013253)
DRC -.0003974 (0.0022216)
-.0004393 (0.0022046)
-.0002306 (0.0026532)
GDPLAG -.0181053** (0.0080073)
-.0182407** (0.0075026)
-.0183826** (0.0075203)
CAPINT -.0224776* (0.0131081)
-.0235705* (0.0130859)
-.027954* (0.0160374)
CREPR -4.77e-06 (0.0000125)
-4.40e-06 (0.0000125)
-6.53e-06 (0.0000157)
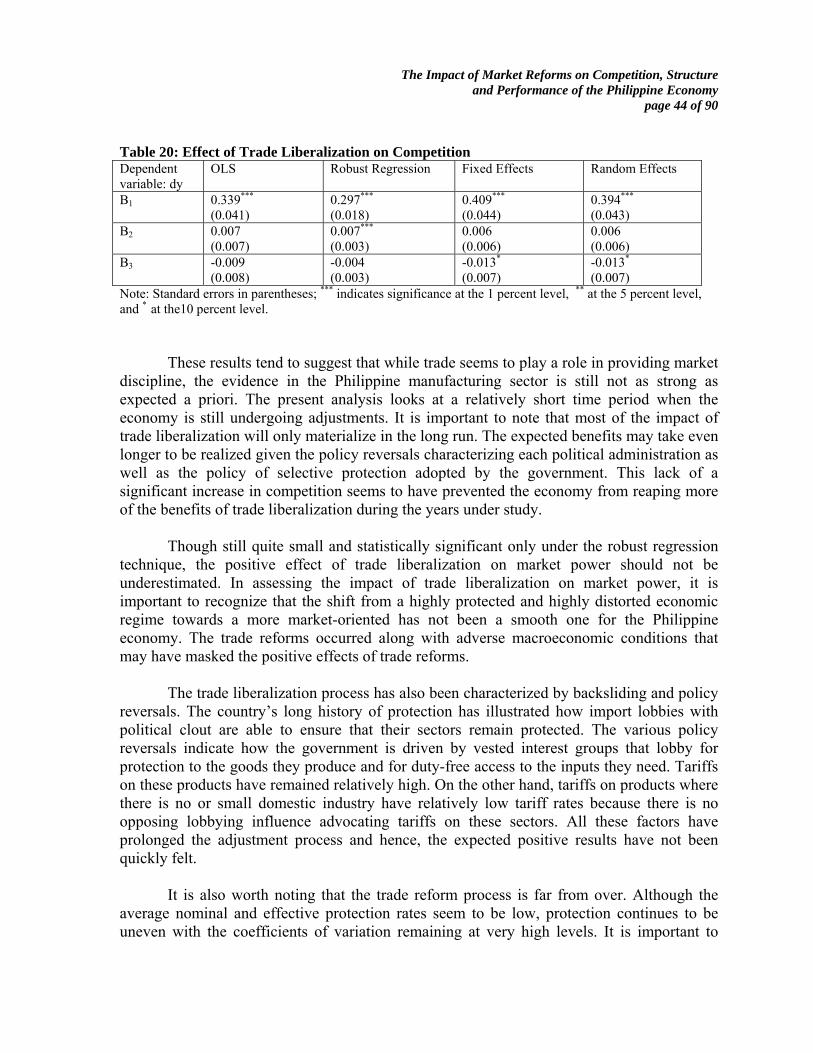
The Impact of Market Reforms on Competition, Structure and Performance of the Philippine Economy
page 44 of 90
Table 20: Effect of Trade Liberalization on Competition Dependent variable: dy
OLS Robust Regression Fixed Effects Random Effects
B1 0.339*** (0.041)
0.297***
(0.018) 0.409***
(0.044) 0.394*** (0.043)
B2 0.007 (0.007)
0.007*** (0.003)
0.006 (0.006)
0.006 (0.006)
B3 -0.009 (0.008)
-0.004 (0.003)
-0.013* (0.007)
-0.013* (0.007)
Note: Standard errors in parentheses; *** indicates significance at the 1 percent level, ** at the 5 percent level, and * at the10 percent level.
These results tend to suggest that while trade seems to play a role in providing market
discipline, the evidence in the Philippine manufacturing sector is still not as strong as expected a priori. The present analysis looks at a relatively short time period when the economy is still undergoing adjustments. It is important to note that most of the impact of trade liberalization will only materialize in the long run. The expected benefits may take even longer to be realized given the policy reversals characterizing each political administration as well as the policy of selective protection adopted by the government. This lack of a significant increase in competition seems to have prevented the economy from reaping more of the benefits of trade liberalization during the years under study.
Though still quite small and statistically significant only under the robust regression
technique, the positive effect of trade liberalization on market power should not be underestimated. In assessing the impact of trade liberalization on market power, it is important to recognize that the shift from a highly protected and highly distorted economic regime towards a more market-oriented has not been a smooth one for the Philippine economy. The trade reforms occurred along with adverse macroeconomic conditions that may have masked the positive effects of trade reforms.
The trade liberalization process has also been characterized by backsliding and policy
reversals. The country’s long history of protection has illustrated how import lobbies with political clout are able to ensure that their sectors remain protected. The various policy reversals indicate how the government is driven by vested interest groups that lobby for protection to the goods they produce and for duty-free access to the inputs they need. Tariffs on these products have remained relatively high. On the other hand, tariffs on products where there is no or small domestic industry have relatively low tariff rates because there is no opposing lobbying influence advocating tariffs on these sectors. All these factors have prolonged the adjustment process and hence, the expected positive results have not been quickly felt.
It is also worth noting that the trade reform process is far from over. Although the
average nominal and effective protection rates seem to be low, protection continues to be uneven with the coefficients of variation remaining at very high levels. It is important to
The Impact of Market Reforms on Competition, Structure and Performance of the Philippine Economy
page 45 of 90
point out that economic and trade distortions associated with a tariff schedule depend not only on the size of the tariffs but also on the dispersion of these tariffs across all products. The more dispersion in a country’s tariff schedule, the greater the distortions caused by tariffs on production and consumption patterns. Among the economic sectors, the manufacturing industry exhibits the most dispersion.
Despite generally low average import duties, the total number of tariff headings (8-
digit level of the 2002 Harmonized Commodity Description and Coding System or HS) increased from 7,366 in 1998 to 7,382 tariff lines in 2004. Most countries average about 6,000 tariff headings. The nominal tariff variance increased from 96 percent in 1998 to 107 percent in 2004 implying a wide dispersion of tariff lines. The number of tariff peak products went up from 165 product lines (or 2.24 percent of total number of HS lines) to 200 lines (2.7 percent of total HS lines) during the same period with tariffs for peak products ranging from 25 percent to 65 percent in 2004.
The structure of protection has also remained biased for importables as these continue
to receive higher levels of protection than exportables. Given the tariff distortions, problems of inefficient resource allocation arise that tends to favor highly protected importables at the expense of exportables.
The EPR estimates also show that the bias for agriculture has remained as the sector
enjoys the highest level of protection from 1998 to 2005. The high tariff schedule resulting from the tariffication under the WTO is the main problem in agriculture. With the obvious bias of the system of protection against manufacturing, the gap between manufacturing and agriculture has widened.
Meanwhile, the increase in applications for and use of safeguard measures as well as
petitions for anti-dumping and countervailing duties have resulted in an increase in protection particularly in sectors such as cement, float glass, chicken, and ceramic tiles. This policy environment of backsliding and conflicting policy pronouncements create a lot of uncertainty such that the government loses its credibility in implementing reforms. This has dampened firms’ incentives to become efficient and have fostered rent-seeking behavior.
5.7 Trade Liberalization and Productivity in Manufacturing
TFP growth in the Philippine manufacturing industry and its major sub-sectors was
estimated using the Annual Survey and Census of Manufacturing Establishments of the National Statistics Office for the 1972-98 period. One important concern raised in using OLS estimates of production function is the potential correlation between inputs that are easily adjusted and the unobserved firm-specific shocks. Firms that have a large positive productivity shock may respond to it by increasing the inputs used. In such cases, the OLS estimates will yield biased parameter estimates and biased productivity estimates.

The Impact of Market Reforms on Competition, Structure and Performance of the Philippine Economy
page 46 of 90
The TFP estimation used in this paper is based on the method developed by Levinsohn and Petrin (2001) which uses intermediate inputs as the proxy input to correct the potential simultaneity bias in production function estimation. The Levinsohn and Petrin method is a modification of Olley and Pakes (1996) which uses investment as the proxy. In this paper, electricity is chosen as the proxy for productivity. Appendix 4 describes the Levinsohn and Petrin method in more detail.
Figure 5 illustrates how the TFP growth estimates evolve in the Philippine
manufacturing industry. The average annual TFP growth estimates are generally low and even negative for six years during the period 1980-1989 and for four years during the period 1990-1998. Note that the TFP growth estimates were not particularly high during the mid-seventies. The estimated growth rate of TFP was negative for two out of four years during the period 1976-1979. In general, log TFP has remained very low during the period from 1975 to 1998. For the years 1996 to 1998, the estimated TFP growth rate was negative in 1996 and 1998 with slight improvement in 1997.
Using labor productivity as another measure, the same results are obtained. On the
average, labor productivity in manufacturing declined substantially from around P84,000 during the 1980s to P78,000 in the 1990s (see Figure 6). The average labor productivity barely improved from P84,000 in the mid-1970s to its current level of P85,950.
Regression analysis was applied to examine the impact of trade liberalization and
competition on manufacturing productivity. The growth rates of TFP estimated for the 26 three digit sectors for the period 1989-1998, a period of significant changes in trade policy, were pooled for this regression analysis. Using ordinary least squares (OLS) method and fixed effects method to take into account industry-specific factors, the determinants of manufacturing total factor productivity were examined with effective rate of protection (EPR), price cost margin (PCM) and GDP growth as explanatory variables.
Figure 5: TFP Growth in The Manufacturing Industry
-0.25 -0.2
-0.15 -0.1
-0.05 0
0.05 0.1
0.15 0.2
1970 1975 1980 1985 1990 1995 2000
Year
TFP Growth
TFF Growth

The Impact of Market Reforms on Competition, Structure and Performance of the Philippine Economy
page 47 of 90
7476788082848688
Labor Productivity
1970s 1980s 1990s 20s
Period
Figure 6 : Average Labor Productivity, in 000 pesos
Average LaborProductivity
Table 22: Determinants of Productivity Dependent variable: TFP growth rate OLS FE 1+EPR -0.0006
(0.0222) -0.0043 (0.0255)
PCM -0.0358 (0.0644)
-0.1098 (0.1126)
GDP 0.0083* (0.0073)
0.0086* (0.0050)
Note: Standard errors in parentheses; *** indicates significance at the 1 percent level, ** at the 5 percent level, and * at the10 percent level.
Table 22 presents the results of the regression analysis. In both methods, the expected negative relationship between productivity and protection was found but this was not significant. The coefficient on EPR clearly showed a negative sign but was statistically insignificant. PCM also showed the expected negative sign but was not statistically significant. The results showed a significant positive relationship between GDP growth rate and productivity.
The lack of a significant increase in competition and productivity seems to have
prevented the economy from reaping more of the benefits of trade liberalization. As the results on the determinants of competition have shown, the coefficient on EPR is positive but not significant. This indicates that if trade liberalization increased competition, it did so only mildly. The regression results on the determinants of productivity have shown that the coefficients on EPR and PCM are negative, although not statistically significant. This tends to imply that the impact of trade liberalization and competition on productivity is still somewhat small.
6.0 Price Cost margins and Productivity Growth in Other Economic Sectors
6.1 Agriculture

The Impact of Market Reforms on Competition, Structure and Performance of the Philippine Economy
page 48 of 90
This sub-section on agriculture refers to establishments with ten or more average total
employment and engaged in agricultural and livestock production such as palay/corn farming, banana farming, poultry and hog raising and agricultural services like the operation of irrigation systems and the renting of farm machinery. Table 23 presents the PCMs computed for the different agriculture sub-sectors. In general, the margins for agriculture are also relatively large. In the most recent year, 1997, the agriculture PCMs are very high (over 50 percent) for palay and corn, chicken broiler production, and agricultural services. The mark-up for sugarcane production has also remained high, although a slight reduction is observed as its mark-up dropped from 48 percent in 1994 to 43 percent in 1997. For hog and livestock (except hog) farming, the margins are 24 percent and 39 percent, respectively. Table 23: Price Cost Margins in the Agriculture Sector
**: This covers palay and corn production, vegetable, including root & tubers, fruit & nut, coconut including copra, fiber crops, and other agricultural crop production. *:This covers only palay production.
The high mark-up ratios in the agriculture sub-sector may indicate weak competition due to the presence of government-sponsored trade barriers. Agricultural inputs such as coffee, corn, sugar, chicken and hogs are subject to tariff quotas while rice is covered by import restriction. Aside from high tariffs, import restriction and tariff quotas on sensitive agriculture sectors, the presence of traditional government regulations in some product markets continue to act as government-induced barriers to competition. Case 2 (Appendix 4) describes the government’s monopoly control on rice and corn trading while Case 3 illustrates the government’s heavy regulation of the sugar industry. Case 4 depicts the administrative difficulty of implementing the MAV program.
Food processing sub-sectors such as coffee roasting and processing, meat and meat
products as well as the manufacture of beverages, confectionary products and preserved fruits and vegetables are closely linked with the agricultural sector as the latter provides the major intermediate inputs to these sub-sectors. Given the high level of protection on these products, the government has to provide higher levels of protection not only on these
Agriculture sub-sector 1989 1991 1994 1997 Palay/corn production 0.00* 0.35 0.50 0.54**Vegetable production, including root & tuber crops 0.31 0.23 0.41 - Fruit & nut (except coconut) production 0.39 0.41 0.41 - Coconut production, including copra making in the farm 0.37 0.55 0.49 - Fiber crops production 0.48 - 0.74 - Other agricultural crops production 0.35 - 0.66 - Sugarcane prod'n, incl muscovado sugar making in the farm 0.40 0.40 0.48 0.43 Livestock and Livestock products 0.14 0.32 0.23 - Hog Farming - - - 0.24 Livestock farming (except hog) - - - 0.39 Poultry and poultry products / Raising of other animals, incl their prodts 0.31 0.51 0.46 - Chicken broiler production (including operation of chicken hatcheries) - - - 0.54

The Impact of Market Reforms on Competition, Structure and Performance of the Philippine Economy
page 49 of 90
products but as well as on the food processing and manufacturing sub-sectors that use them. The high level of protection on sugar negatively affects the competitiveness of industrial users like food processors and beverage companies. With the presence of high tariff and non-tariff barriers in these sectors, import competition is weakened. On the overall, it is the consumer who ends up bearing the cost of the government policy of selective protection, which weakens competition.
6.2 Banking
After more than 30 years of interventionist financial policies, the Philippines initiated a financial liberalization program in the early 1980s. The program entailed a gradual liberalization of interest rates between 1981 and 1983 and the easing of restrictions on the operations of financial institutions. Further reforms were instituted in 1986 to address the interlinked problems of fraud or insider abuse of bank owners or officers and ineffective prudential supervision and regulation. In the 1990s, other banking sector reforms were pursued including the deregulation of entry of new domestic banks and domestic bank branching as well as the easing of restrictions on the entry of foreign banks. In 2000, the General Banking Law was enacted to replace the 52-year old General Banking Act. With this law, a seven-year window has been provided during which foreign banks may own up to 100 percent of one locally-incorporated commercial or thrift bank, without the no obligation of divesting later. This law also encouraged the establishment of microfinance-oriented banks.
Table 24: PCMs in the Banking Sector
Note: No sub-sector PCMs were computed after 1995 because of changes in subsector definition and classification by the National Statistics Office.
Initial research on the impact of the above financial reforms on competition and efficiency in the sector found only modest effects. Montinola and Moreno (2001) concluded that this small impact of the reforms on competition and efficiency was due to the limited scope of liberalization. Manzano and Neri (2001) indicated that the macroeconomic policy pursued by the government masked the competitive pressure that foreign banks would have exerted on the local banking industry. Milo (2001) found that while the concentration ratios in the banking sector fell, there was no significant effect on bank spreads.
Year 1984 1987 1988 1989 1990 1991 1992 1993 1994 1995 1997 1998 Banking Institutions 0.64 0.36 0.28 0.34 0.31 0.36 0.32 0.48 0.32 0.30 0.36 0.32 Deposit money banks 0.62 0.43 0.26 0.35 0.30 0.35 0.32 0.51 0.30 0.34 Thrift Banks 0.49 0.37 0.42 0.46 0.45 0.43 0.32 0.45 0.40 0.33 Regional unit banks (rural banks) 0.34 0.31 0.31 0.32 0.32 0.22 0.26 0.33 0.25 0.21 Government specialized banks 0.82 0.35 0.58 0.55 0.55 0.51 0.37 0.30 0.34 0.03 Banking institutions, N.E.C. 0.73 0.06 0.12 0.04 0.12 0.11 0.20 0.26 0.06 0.06

The Impact of Market Reforms on Competition, Structure and Performance of the Philippine Economy
page 50 of 90
Table 24 presents the calculated PCMs in the Philippine banking sector. It is evident from the table that since 1984, PCMs in general have been declining. From a very high price cost margin of 64 percent for the whole banking sector in 1984, this declined to 36 percent in 1987 and to 28 percent in 1988. Except in 1993 when margins went up to 48 percent, PCMs in the sector have ranged from 30 percent to 36 percent between 1989 and 1998. For deposit money banks, PCMs declined from 62 percent in 1984 to 34 percent in 1995; for thrift banks, from 49 percent to 33 percent; and for rural banks, PCMs dropped from 34 percent to 21 percent during the same period. The decline was very dramatic for government specialized banks and banking institutions, not elsewhere classified. For government banks, PCMs decreased from 82 percent to 3 percent and for the latter, from 73 percent to 6 percent.
These results tend to suggest that the financial reforms have led to an overall decline in market power in the financial sector. Using an econometric model assessing the impact of financial reforms on competition in the banking sector, Pasadilla and Milo (2004) found that firms were behaving competitively with the entry of foreign and domestic banks increasing banking competition. Another study by Manlangit and Lamberte (2004) found that small banks seemed to be more profit and cost efficient than large banks. They also found that foreign banks were more profit and cost efficient than domestic banks with the gap between domestic and foreign banks declining after the reforms.
6.3 Electricity
The electric power industry encompasses four major activities:
1. Generation: production of high-voltage electricity that ranges from 12 kilovolts to 500 kilovolts (kV).
2. Transmission (grid network phase): conduction of large blocks of high voltage electricity at the power plants to distribution companies.
3. Distribution: delivery of electricity from the transmission system to the final consumers at a usable level of voltage (usually 220 volts).
4. Supply: contracting for the delivery of electricity to the customer, metering and billing.
The industry is characterized by the following: essential to most productive processes
and is an element in final demand, has strong externalities, investment is specific and cannot be divided, economies of scale and scope are present, network takes a long time to build, and demand is highly inelastic to price changes. Because the features of the electricity industry closely resemble those of a natural monopoly, the industry has been under direct state control through ownership and regulation. Scale economies can provide the network owner with substantial market power. Other characteristics such as non- storability of electricity supply, the consumers’ dependence on the suppliers, and the essential nature of the service can further enhance the market power of the supplier.
The Impact of Market Reforms on Competition, Structure and Performance of the Philippine Economy
page 51 of 90
In most countries, the electricity industry is traditionally vertically integrated. The traditional approach in analyzing the electric power industry has changed with the technological innovations in the 1980s. The reduction in the optimal size of generation plants combined with the growth in market size have undermined the natural monopoly characteristics of the electricity industry and challenged the traditional paradigm of the vertically-integrated monopoly. While high-tension transmission and low-tension distribution systems are natural monopolies, generation and supply are now considered competitive. This allowed countries to adopt a market approach to power supply and introduce competition and unbundling of the industry.
In the case of the Philippines, the first wave of power sector reforms took place in 1987 as the generation sector was opened up to competition through the issuance of Executive Order 215. EO 215 abolished the monopoly of the government-owned National Power Corporation (NPC) by allowing the private sector to invest and participate in augmenting the sector’s generation base capacity. In 1990, the government passed Republic Act 6957, the first build-operate-transfer 5(BOT) law in Asia. This relaxed the rules on entry of private firms and reduced the scope for government intervention.
In 1992, Republic Act 7638 established the Department of Energy, which was
responsible for policy formulation on, planning for, and management of, the energy sector. Republic Act 7648 was legislated in 1993, which enabled the Ramos administration to expedite independent power producers (IPP) contracts for the construction, rehabilitation, improvement, and maintenance of power projects. In 1994, the BOT law was replaced with Republic Act 7718, which increased the number of variants of the BOT concept.
In June 2001, another wave of deregulation was implemented through the legislation
of RA 9136 or the Electric Power Industry Reform Act (EPIRA), which aimed to accelerate the total electrification of the country. It also aimed to ensure the quality, reliability, security, and affordability of electric power in a regime of free and fair competition. Under this law, the industry would be restructured by separating the natural monopolies from the potentially competitive parts: the National Power Corporation’s remaining power facilities and its transmission system would be privatized and a wholesale spot market for bulk power would be created.
The law distinguishes four separate segments in the power sector: generation, transmission, distribution, and supply. Generation and supply would be competitive and open while transmission and distribution segments would be regulated. The law also spells out the main rules for the regulation of these four segments as well as the rules for transition and the obligations and rights of all players involved: the service providers and government agencies.
5 Under BOT, the assets revert to the state at the end of the concession terms while under BOO, the ownership of the existing assets and the responsibility for their future expansion and maintenance are transferred to the private sector.
The Impact of Market Reforms on Competition, Structure and Performance of the Philippine Economy
page 52 of 90
The participation of private investors in the generation sector started in 1988 when NPC signed its first BOT contract with Hopewell Energy Management of Hong Kong for the construction of two 110-megawatt turbine power plants in Luzon which became operational in 1991. To generate additional capacity, the NPC contracted with several independent power producers (IPPs) through build-operate-transfer (BOT) and related schemes. Appendix 5 contains a list of 41 IPP projects with signed contracts that were initially awarded through negotiation but later through bidding procedures. The World Bank (2000) described the standard NPC contract as an energy conversion agreement, under which NPC purchases all fuel and pays the generator for converting it into electricity at a predetermined heat rate.
Between 1993 and 1998, the generation sector evolved from a monopoly to a
monopsony of NPC to a de facto deregulated sector in which private power producers can sell electricity to distributors and large industrial users. In 1998, the total generating capacity was 11,988 megawatts distributed as follows: 8,619 megawatts in Luzon, 1,554 megawatts in the Visayas, 1,552 megawatts in Mindanao, and 263 megawatts scattered throughout the country belonging to small island grid.
NPC accounted for about 54 percent of the total installed generating capacity while
independent power producers contracted by NPC generated the rest. In addition, a total of 518 megawatts of privately owned installed generation capacity served distributors.
Table 25 shows the PCMs calculated for the electricity generation and distribution
sub-sectors. With the opening up of the generation segment of the electricity sector that paved the way for the entry of independent power producers or IPPs in the early 1990s, the margins for generation increased to around 50 percent in 1994 and 1997. The PCMs for power generation remained almost the same at about 30 percent in 1987 and 1991. In the distribution segment, the margins are much lower at 14 percent in 1987, 17 percent in 1991, and 20 percent in 1994.
Table 25: PCMs in Electricity 1987 1991 1994 1997 Generating and distributing electricity 0.323 0.310 0.534 0.500 Distributing electricity to consumers 0.140 0.169 0.201
Note: Because of the changes in definition and classification by the NSO, no PCM can be computed for distribution since 1996.
The PCM results tend to suggest that despite the entry of IPPs in the generation sector, market power has gone up. It is important to note that even with the IPP scheme, competition was limited. What transpired in the sector was another form of public procurement with the IPPs becoming a contractor to the existing monopoly, NPC, for a set of specialized services. The contracts allowed a generous off-take (take-or-pay) where NPC agreed to purchase power from IPPs regardless of the required level of dispatch. NPC management locked the company into multi-year power purchase agreements which were at

The Impact of Market Reforms on Competition, Structure and Performance of the Philippine Economy
page 53 of 90
least 25 percent more expensive than its own generated power and which must be paid 75-80 percent even if it chose not to actually get the electricity (Tuano, 2001).
In the absence of clear rules and appropriate regulatory framework during that time,
negotiated deals were carried out by NPC and the private contractors. Under these circumstances, the deals negotiated unduly favored investors while NPC became a monoposonist in the market for capacity and energy. To protect their investments, the private investors focused on obtaining satisfactory power purchase contracts and looked to the government to underwrite the risks. Given the lack of credible rules or operating experience with pricing regimes in the Philippines, the procurement of private generation capacity became possible only with the government assuming all risks with respect to prices and quantities. The IPP received a physical quantity of fuel from NPC and then converted this to kilowatt hours for a processing fee, taking no risks with respect to either input or output prices. As Box 2 reveals, the government has borne virtually all risks except construction costs and some risks associated with the efficiency of operation and availability.
Box 2: Risk Allocation in the Typical Energy Conservation Agreement Category of risk Risk borne by government Risk borne by others Construction cost Interest rate Operation and maintenance cost Plant efficiency Change in cost equity Demand Exchange rate Fuel cost Availability, convertibility, transferability Retail tariff Sovereign
√ √ √ √ √ √
√ √ √ √ √
Source: The World Bank Country Framework Report for Private Participation in Infrastructure, 2000. Deregulation is not a trivial process. As the case of the Philippine electric power
industry has shown, designing an effective regulatory framework and enforcing it is not easy. The absence of clear rules and an appropriate regulatory framework in the early stage of deregulation led to discretionary decision making which resulted in high long-term costs and a societal backlash. More needs to be done particularly in terms of ensuring competition in the industry. Access rules for transmission and distribution (who will be dispatched, in what order, and when) as well as a pricing system (price caps or rate of return minus adjustments for efficiency changes) that would allow consumers to share in efficiency gains are still in need of attention. The Philippines is currently in the process of shifting towards price cap regulation for retail tariffs of all distribution utilities. The regulatory approach for distribution retail tariffs are still based on the rate of return regulation principle with assets revalued on a replacement cost basis. The rate of return base cannot be greater than 12 percent.

The Impact of Market Reforms on Competition, Structure and Performance of the Philippine Economy
page 54 of 90
With respect to the competition-related provisions of the EPIRA, Llanto and Patalinghug (2004), found some weakness in the cross-ownership stipulation which allows a company to operate or control 30 percent of the installed generating capacity of a grid and/or 25 percent of the national installed generating capacity. This stipulation allows a distribution company to enter into supply contracts with its generation subsidiaries. The classic example is the case of MERALCO’s supply contracts with Lopez-owned power plants. Against this context, it is important to study policies prohibiting cross ownership across monopolistic and competitive segments of the production process as this might lead to access problems and conflict of interest.
6.4 Water
The water sector covers three major areas: Metro Manila, provincial urban areas, and rural areas. In Metro Manila, the government privatized water supply and sanitation systems that used to be operated by the government-owned corporation, Metro Manila Water and Sewerage System (MWSS). Through competitive bidding, two private firms, the Ayala-led Manila Water Company, Inc. (MWCI) and Maynilad Water Services Inc. (MWSI) of the Lopezes were granted concessions in 1997 to bill and collect for water and sewerage services in two separate areas6 for 25 years. In return, the concessionaires would be responsible for the expansion and improvement of water and sewerage services and would assume payment of the loans incurred by MWSS to develop water resources as concession fees. The MWSS Regulatory Office was created to monitor and enforce compliance with contract terms. In the provincial urban areas, the Subic Water and Sewerage was granted, through a competitive bidding, a 25-year exclusive right to provide water supply services within the urban areas of the Subic Bay Metropolitan Authority, Olongapo, and Subic.
Outside the MWSS service area, the supply of water is highly fragmented and installed in a piecemeal method resulting in gaps in the availability of water especially in the rural areas (Llanto, 2002). Water supply facilities have been put up by either water districts, private entities and, to some extent, by local government units in the rural areas. The rural areas are serviced by the rural waterworks and sanitation associations, barangay waterworks and sanitation associations, and LGUs. Under this system Llanto identified two problems, namely, the absence of an able and independent regulator that will regulate water prices and quality and the financial constraints facing new investors. Currently, the Local Water Utilities Administration (LWUA) regulates the water districts while local governments regulate provincial or municipal-based water utilities. The National Water Resource Board (NWRB) regulates and controls the operation of utilities outside the jurisdiction of the MWSS, LWUA, and the local governments.
Table 26 presents the PCMs calculated in the water sector prior to the privatization. It is evident from the table that the PCMs in the sector are very sizeable, although a reduction is 6 The east concession (awarded to MWCI) covers Angono, Baras, Binagonan, Cainta, Cardona, Jala-Jala, Makati, Madaluyong, Marikina (parts), Morong, Pasig, Pateros, Pililia, Rodriguez, San Juan, San Mateo, Tanay, Taytay, and Taguig while the west concession (awarded to MWSI) covers Bacoor, Cavite City, Imus, Kawit, Las Pinas, Malabon, Manila, Muntinlupa, Navotas, Noveleta, Paranaque, Pasay, Quezon City (parts), Rosario, Taguig (parts), and Valenzuela.

The Impact of Market Reforms on Competition, Structure and Performance of the Philippine Economy
page 55 of 90
observed in both steam and hot water supply and in the collection, purification, and distribution of water between 1987 and 1997. Table 26: PCMs in Water 1987 1991 1994 1997 Steam and hot water supply 0.91 0.87 0.77 0.87 Collection, purification and distribution of water 0.78 0.68 0.63 0.66 Privatization in the water sector has been limited to Metro Manila and the Subic and Olongapo areas. The on-going experience in the privatization of MWSS in Metro Manila is instructive, particularly in the failed privatization in the west zone where lessons for future privatization could be drawn. Four companies submitted bids for the east and west water concessions. In both zones, MWCI won because of its very low base price bid of P2.32 per cubic meter versus MWSI’s P4.96 per cubic meter7. These were both way below the MWSS base price of P8.78 per cubic meter and even lower than the P5.36 per cubic meter which MWSS charged its customers in 1991. MWSS requested technical assistance from the International Finance Corporation (IFC) in assessing MWCI’s bid which some people thought was unsustainable and a stray one. The IFC believed that the MWCI bid was attainable but it expressed concern over the company’s access to debt financing, considering that cash flow would be negative in the first ten years of its operation. The MWSS Regulatory Office applied a price cap mechanism in regulating the two concessionaires. Effectively, the bid base price served as cap on the final tariff that the two concessionaires could charge. In addition, the two firms face a cap on the rate of return, which was set at 12 percent. The price cap could be changed through the extra-ordinary price adjustment (EPA)8 and rate rebasing process. Yardstick competition could also be used by the MWSS-RO in evaluating the cost and efficiency of the two firms (for as long as collusion is absent). Immediately after the privatization of the MWSS, prices dropped from P8.78 per cubic meter to P2.32 per cubic meter in the east service area and to P4.96 per cubic meter in the west service area. Before the privatization, MWSS rates rose continuously from P4.61 in 1990, P6.28 in 1992, P6.43 in 1995, P7.41 in 1996 and P8.78 in 1997. Part of the increase was implemented to avoid the probability of a substantial rate increase after privatization, which was deemed politically unsound. The rate increases were also effected to improve water supply and quality. After less than a year, the two concessionaires filed for EPA increases in 1998 due to the 52 percent increase in the peso-dollar rate and the occurrence of the El Nino phenomenon. Having aggressively bid to win the concession, the impact of the Asian 7 This draws from Solon and Pamintuan, 2000, “Opportunities and Risks in the Privatization –Regulation of the MWSS” in Philippine Review of Economics, Vol. XXXVII, No.1, UP School of Economics and PES. 8 This comes every ten years unless the MWSS-RO allows for an early rebasing after 5 years.

The Impact of Market Reforms on Competition, Structure and Performance of the Philippine Economy
page 56 of 90
financial crisis was heavier on MWCI. The latter requested to raise its base price to P5.55 while MWSI requested P5.70. In October 2001, the contracts between MWSS and the two concessionaires were amended to allow both firms to double their base rates in 2002. This was intended to help MWCI and MWSI cope with the impact of the financial crisis on their costs as well as on the costs of servicing the debt that they agreed to inherit from MWSS. This also paved the way for the firms to revise the concession targets leading to further rate increases beginning in 2003 under the rate rebasing process. The amendment allowed the rate rebasing exercise to take place every five years. Towards the end of 2002, MWSI announced its decision to terminate the concession agreement because of massive financial losses and failure to pay its loan payments, also called concession fees. Despite two hefty rate increases in 2001 and 2002, it failed to meet its concession targets and its water losses from leaks and theft continued to go up. While MWCI does not face the same financial difficulties due to mismanagement and inefficiency, it has also underperformed the targets that it made when it submitted and won the bid. In 2003, a Paris-based arbitration panel ordered MWSI to pay the government about P8 billion in overdue concession payments. MWSI in turn petitioned the regional court for debt relief and corporate rehabilitation. In March 2004, the government decided to take over the west concession area with the MWSS controlling the company to be named New Maynilad.
6.5 Air Transport In 1995, Executive Order 219 deregulated the air transport industry and thus
challenged the supremacy of the only designated flag carrier, Philippine Airlines (PAL). It eliminated restrictions on domestic routes and frequencies as well as government controls on rates and charges. In international air transport, it legislated changes in the number of carriers that can be designated as the country’s flag carriers and changes in the basis for the negotiation of traffic rights and routes with emphasis on national interest and reciprocity between the Philippines and other countries. In 1992, the government privatized PAL after controlling it for 14 years. PR Holdings won 67 percent shares of PAL. In 1999, Lucio Tan was able to control 90 percent of PAL.
The PCMs in transport services substantially dropped from 67 percent in 1987 to 52
percent in 1991 and further to 49 percent in 1997 (see Table 27). The reduction in margins can be attributed to the substantial competition that resulted after the deregulation of the industry. The initial efforts to liberalize the airline industry started in 1988 with the abolition of the one airline policy. In 1995, deeper market reforms were carried out with the removal of restrictions on domestic routes and frequencies as well as government controls on rates and charges. These reforms allowed the entry of new airlines, namely, Cebu Pacific, Air Philippines, Grand Airways, Asian Spirit, and Mindanao Express, in the industry which was dominated by only one airline, Philippine Airlines, for 22 years. Austria (2002) noted that with greater competition on the major routes, domestic travel has grown rapidly after

The Impact of Market Reforms on Competition, Structure and Performance of the Philippine Economy
page 57 of 90
deregulation. Competition arising form promotional and discount fares continues to open the air industry to travelers who could not afford to travel by air prior to deregulation. Competition has intensified resulting in lower airfare, improved quality of service and overall efficiency in the industry (see Tables 28 and 29). Table 27: PCMs in the Air Transport Sector Year 1987 1995 1997 Air transport 0.674 0.524 0.485 Table 28: Domestic Airline Capacity
Route 1995 1999 2000 2001 2002 2003 2004 Mla-Cebu 1,378,697 1,422,322 1,410,683 1,345,845 1,250,787 1,315,406 1,439,421 Mla-Davao 579,147 711,420 695,368 732,283 747,646 763,270 884,993 Mla-Zam 196,539 218,003 224,613 216,813 213,312 220,252 254,326 Others 4,264,058 3,720,694 3,743,209 3,756,887 3,587,097 3,794,076 4,511,964 Total 6,418,441 6,072,439 6,073,873 6,051,828 5,798,842 6,093,004 7,090,704 Source: Philippine Civil Aeronautics Board Table 29: Domestic Air Fares (in pesos)
Routes 1995 1999 1999 Prices Manila-Cebu-Manila 2846 2598 2028 Manila-Davao-Manila 5128 3796 2963 Manila-Zamboanga-Manila 5070 3396 2651 Source: Philippine Civil Aeronautics Board (1995 fares); Philippine domestic airlines (1999 fares) in V.S. Limlingan , October 2002, Open Skies – Is It Time for the Philippines? AIM Policy Center, Vol. 5 No. 8
While deregulation and liberalization have been pursued vigorously in domestic air
services, restrictive policies and regulations remain in international air services and the government has yet to adopt deeper reforms. Open skies will allow entry on all routes as well as unlimited capacity and frequency. Currently, trade in air services occurs through a common regulatory framework of bilateral air services agreement (ASAs) between pairs of countries where two countries agree to exchange air rights that would provide their respective carriers equal access to each other’s market. The ASAs determine the countries’ carriers, capacities and frequencies (in terms of number of flights and number of seats that a designated carrier can operate) for a particular route. Local carriers like PAL continue to oppose accelerated liberalization of air traffic rights as this would prejudice the operations of the local industry with foreign airlines competing more aggressively by offering lower rates (Batino, 2004).
PAL is still the country’s uncontested flag carrier in international routes. Austria
(2002) noted that the absence of competition in the international routes has resulted in PAL’s poor performance and growth. PAL is unable to use all the entitlements in the country’s ASAs. It used only 61 percent of the country’s traffic rights per week compared to 81 percent by foreign airlines. In nine countries, PAL failed to use any of the country’s entitlements.

The Impact of Market Reforms on Competition, Structure and Performance of the Philippine Economy
page 58 of 90
The limited competition in international air services resulted in reduced passenger traffic, tourists and tourist receipts. For instance, when the Philippines abrogated the RP-Taiwan ASA in 1999, the number of arrivals from Taiwan dropped from 182,914 to only 91,650. This was very costly for the country; as Lim (2004) estimated, the abrogation resulted in foregone losses of 900,000 incoming seats from Taiwan and US$50 million in terms of tourist spending. Lim also indicated that the Middle East market is currently underserved. For instance, while in Asia, there are 0.9 million OFWs and 320 flights, in the Middle East, where there are 1.2 million OFWs, there are only 34 flights weekly. The UAE has requested more flight frequency from the government but apparently had failed to elicit any action on the part of the latter. PAL and Gulf Air (designated carrier of UAE) also have a code-share service between Manila and Abu Dhabi. Gulf Air was also requesting that the second code-shared frequency on the route from Abu Dhabi to Manila and vice versa be regularized. While the Department of Transportation and Communications was in favor of the request, for unknown reasons the Civil Aeronautics Board did not approve the application. PAL also opposed the said request.
In air cargo9, the Diosdado Macapagal International Airport (Clark Field) and Subic
Bay International Airport have been opened to foreign freight carriers through Executive Order 253 issued last December 2003. Since 1995, Fedex, one of the world’s largest freight carriers, has been operating in Subic Bay, which it has chosen as its Asia Pacific hub. The facility connects with 19 destinations worldwide and allows the company to do overnight deliveries to the US West Coast. In 2002, UPS invested US$300 million to establish its Asian hub in Clark. UPS delivers packages from Clark to Malaysia, Thailand, China, Singapore, India, Australia, Hong Kong, Japan, and Taipei. Recently, Fedex decided to move its operations to Clark due to space limitations in Subic.
Early this year, the Philippines was set to sign open skies agreement on cargo with Singapore, Thailand, and Brunei. However, the Civil Aeronautics Board decided to defer action until a thorough study is carried out. PAL has strongly opposed the policy citing that only Singapore Airlines, one of the world’s biggest cargo airlines, would stand to gain from the agreement.
6.6 Water Transport
Changes in policies and regulations in the shipping industry were first introduced in
1989. These included the removal of the ad valorem charges and deregulation of first and second class passage rates. In 1990, the 3/10 percent valuation surcharge for insurance premiums was abolished and freight rates for refrigerated cargoes, transit cargoes, and livestock were also deregulated. In 1992, further deregulation was made in the freight rates between Class A and Class B cargoes. Through Executive Order 213 of 1994, all freight rates were deregulated except for noncontainerized basic commodities. However, the operators
9 Air cargo accounts for only two percent of the country’s total export volume but in terms of total export revenues, it constitutes around 80 percent of the total.

The Impact of Market Reforms on Competition, Structure and Performance of the Philippine Economy
page 59 of 90
were not allowed to set their own rates, the Domestic Shipping Consultative Councils (DOSCONs) were created in various regional centers of the country to serve as a forum for negotiating the rates. In 1999, the DOSCON process was finally abolished.
While the reforms led to increases in the number of ship operators and investments in
modern facilities, mark-up ratios remained persistently high at around 69 percent for all years under study: 1987, 1995, and 1997. This is in contrast to the experience of the domestic air transport industry where margins declined as new players enter the market. Table 30 : PCMs in the Water Transport Sector Year 1987 1995 1997 Water transport 0.675 0.694 0.686
The shipping industry is currently dominated by WG& A, the biggest shipping company in the country in terms of both passenger and cargo businesses. It operates 23 vessels nationwide. It was formed in 1995 after the three shipping giants, William Lines, Gothong Shipping Lines, and Aboitiz Transport merged their operations in response to the market deregulation implemented by the government. In 1998, WG&A posted an increase in sales and landed in the top 500 corporations on sales performance in the Philippines.
Aside from WG&A, there are four other players in the industry consisting of Negros
Navigation, Sulpicio Lines, Philippine Fast Ferry Corporation, and Cebu Ferries Corporation. These five corporations control around 90 percent of the total number of passengers (Austria, 2003). Negros Navigation and Sulpicio Lines are incumbent players while Philippine Fast Ferry Corporation and Cebu Ferries Corporation were established after the 1995 reforms. Philippine Fast Ferry is a product of the merger of Universal Aboitiz and Sea Angels Ferry Corporation (a subsidiary of Negros Navigation) in 1998. Cebu Ferries is a new firm established in 1996 as a subsidiary of WG&A.
Austria (2003) noted the weak competition in the industry with only the five players
controlling most of the primary routes. Austria also observed that the major players seemed to have divided the market among themselves. About 50 percent of the primary routes only have one operator. Although there are at least two operators in the remaining 50 percent, this has not resulted in effective competition. Out of 26 routes with at least two operators, substantial competition exists only in seven routes, five routes are monopolized and mild competition in the remaining routes. For the secondary and the tertiary routes, almost 59 percent and 78 percent of the routes has been monopolized, respectively.
WG&A, Sulpicio Lines, and Negros Navigation are also top players in the cargo
service sub-sector. Together with Lorenzo Shipping and Solid Shipping (purely engaged in cargo services), they account for about 91 percent of the total revenue of the cargo service sub-sector. As in passenger services, Austria (2003) indicated that these five firms control the cargo services market in both the primary and secondary routes.

The Impact of Market Reforms on Competition, Structure and Performance of the Philippine Economy
page 60 of 90
6.7 Telecommunications
The telecommunications sector, which was dominated by a private monopoly, the Philippine Long Distance Company (PLDT), for more than half a century was liberalized in the late 1980s. This reform process was accelerated with the implementation of substantial policy changes in the early 1990s. In 1992, the cellular mobile service was liberalized. In 1993, Executive Order 59 mandated the interconnection of all carriers while Executive Order 109 opened the basic telephone service to new entrants. These changes together with Republic Act 7925 of 1995 led to the demonopolization of the telecommunications industry. Llanto and Patalinghug (2004), however, noted that RA 7925 tempered EOs 59 and 109 by reducing the roll-out period from five years to three years, thereby making it difficult for new entrants to raise capital. It also reduced the power of the National Telecommunications Commission (NTC) by allowing firms to negotiate their interconnection and access tariffs instead of imposing a standard interconnection contract on the carriers. This resulted in delays in interconnection which is crucial in promoting competition in the sector. Table 31 : PCMs in the Telecommunications Sector
Year 1987 1995 1997 Telephone service 0.771 0.782 0.841 Telegraph service 0.818 0.827 - Communication services. N.E.C. 0.884 0.766 -
Table 31 presents substantial price cost margins in the telecommunications sector.
Between 1987 and 1995, there was not much change in the PCMs which remained at around 78 percent. This went up to about 84 percent in 1997. It is to be noted that although there are currently more than 280 telecommunications firms, the market is dominated by only three players with PLDT being the most dominant. Due to its ownership of the backbone network and its dominant position in the sector as it accounts for the largest share in the total number of fixed lines and mobile phone subscribers, PLDT has retained its market power. As Abrenica (2000) noted, the biggest challenge for NTC is how to prevent PLDT, which owns and controls the bottleneck facility (the local loop), from discriminating in favor of itself.
6.8 Wholesale and Retail Trade
In the wholesale and retail trade sector, the PCMs seem to be relatively low for both years 1988 and 1995. Exceptions to these are those for two sub-sectors: petroleum wholesaling whose mark-up increased from 11 percent to 28 percent during the two years under study and office and household furniture and appliances wholesaling whose mark-up also rose from 13 percent to 28 percent.
Table 32: Mark-up Ratios for Wholesale & Retail Trade 1988 1995 Wholesale trade Farm, forest and marine products 0.05 0.10 Processed food, beverage & tobacco products. 0.15 0.16

The Impact of Market Reforms on Competition, Structure and Performance of the Philippine Economy
page 61 of 90
Dry goods, textiles & wearing apparel, wholesaling 0.12 0.17 Construction materials & supplies, wholesaling 0.11 0.09 Office & HH furn., furnishing & appliances and ware, wsalg 0.13 0.28 Machinery and equiptment, including transport equipt., dealing 0.16 0.19 Minerals, metals & industrial chem'ls excpt crude petr prodts, dealing 0.13 0.19 Petroleum prodts, wholesaling 0.11 0.28 Wholesale trade, N.E.C. 0.16 0.18 Retail trade Books, office, & schl supplies, incl newspapers & mags, rtlg 0.22 0.22 Food, beverages & tobacco, retailing 0.07 0.10 Construction materials & supplies, retailing 0.12 0.15 Dry goods, textile and wearing apparel, retailing 0.06 0.08 Office & HH furn. & furnishings, appliances and wares, retailing 0.09 0.14 Transport machinery and equipt accessories & supplies, rtlg 0.09 0.11 Medical supplies & equiptment, retailing 0.05 0.02 Petroleum & other fuel products, retailing 0.04 0.08 Petroleum trade, N.E.C. 0.10 0.15
6.9 Productivity
A competitive market economy10 can allocate scarce resources more efficiently than any alternative system. However, the presence of market imperfections like trade barriers or government regulations that limit market entry can create inefficiencies and lead to reduced long-term growth. This weakens competition and prevents structural changes from taking place resulting in resources being tied to low-productivity industries. Weak competition reduces the pressure on firms to adopt new technology or innovate, resulting in low growth of productivity and a loss of competitiveness.
Table 33 compares the levels and trends in the productivity of labor across the
different economic sectors from the mid-1970s to the current period. The results indicate that labor productivity is low and disparities across the three major sectors are wide. Industry has the highest labor productivity, which declined from the mid-seventies to the nineties and showed some signs of improvement in the current period, although it still has not reached its highest average level registered in the mid-1970s.
Within the industry sector, electricity, gas, and water together with mining and quarrying are the leading sub-sectors. Both sub-sectors experienced increases in productivity levels between the mid-1970s and the current period. At present, the electricity, gas, and water sub-sectors posted an average labor productivity level of P 279,600 while mining and quarrying had a productivity level of P 117,280. The average labor productivity in manufacturing remained almost constant till the eighties and even dropped during the nineties. Currently, its average labor productivity is P85,950, which is roughly the same as its mid-1970 level. 10 A market economy in which every relevant good is traded in a market at publicly known prices and all agents act as price takers. (Mas-colell, Whinston and Green, 1995)

The Impact of Market Reforms on Competition, Structure and Performance of the Philippine Economy
page 62 of 90
The average labor productivity in the services sector has declined since the mid-1970s. All services sub-sectors have witnessed decreasing labor productivity. The financial and private services sub-sector has the highest average level of labor productivity, although this has been falling after reaching its peak of P272,140 in the 1980s. Transportation, communication, and storage has an average labor productivity of P35,020 which is a slight improvement over its average 1990s level, but still behind its mid-1970s level.
The agriculture, fishery, and forestry sector has the lowest level of labor productivity which remained stagnant from the mid-1970s up to the nineties. Currently, some improvements are evident as its level increased, though modestly, to P18,160.
Table 33: Labor Productivity (in thousand pesos, 1985 constant prices) Economic Sector 1976-1978 1980s 1990s 2000-2002 Agriculture, Fishery and Forestry 15.87 15.18 15.56 18.16 Industry 87.76 84.00 68.28 76.45 Mining and Quarrying 96.56 82.20 85.80 117.28 Manufacturing 84.09 83.98 78.02 85.95 Construction 90.44 70.61 35.21 40.40 Electricity, Gas and Water 178.96 230.34 216.24 279.61 Services 38.39 34.75 33.00 33.11 Transportation, Storage & Communication 40.79 38.10 32.56 35.02 Wholesale and Retail Trade 41.19 35.79 32.80 30.98 Financing, Insurance, Real Estate & Business Services 184.89 272.14 242.67 214.93 Community, Social & Personal Services 12.21 8.54 8.73 8.83
The considerable profit margins earlier presented along with the low labor productivity in all the major sectors seem to suggest a lack of competition in the economy as well as the presence of substantial market power among firms to raise their prices profitably away from competitive levels. Herrin and Pernia (2003) attributed the deterioration in the country’s labor productivity to three factors. These are: the failure of firms to invest in state-of-the-art technology and implement best practice, the lack of investments in human capital due to rapid population growth, and the relatively quick expansion of employment in low productivity services sector. Table 34: Total Factor Productivity
Year Unadjusted TFP Business
Fluctuation Adjusted TFP
Year Unadjusted
TFP Business
Fluctuation Adjusted TFP
1981 -2.12 -1.34 1991 -4.63 -1.881982 -1.94 -0.15 1992 -3.41 -1.241983 -4.63 -1.16 1993 -1.26 -0.841984 -8.82 -1.81 1994 0.47 -0.551985 -7.81 -2.61 1995 2.09 -0.501986 2.30 -2.71 1996 0.91 -1.341987 1.26 -1.45 1997 0.48 0.381988 6.29 -1.59 1998 -2.02 0.141989 1.51 -1.24 1999 2.61 0.541990 0.13 0.44 2000 4.27 0.70

The Impact of Market Reforms on Competition, Structure and Performance of the Philippine Economy
page 63 of 90
Source: Cororaton, PIDS Paper 2002-01 Table 34 presents total factor productivity (TFP) estimates from the 1980s to the late
1990s. As the table shows, TFP estimates were generally negative especially during the 1990s. New estimates are encouraging as these reveal positive TFPs in 1999 and 2000.
7.0 Good Policies, Bad Policies in the Philippine Market Reform Process
7.1 A Summing Up In the past two decades, the Philippines has implemented a substantial number of appropriate policies, ranging from trade liberalization, deregulation, privatization and other market reforms to promote competition, increase productivity and stimulate economic growth. Against the chaotic years marked by domestic, natural, and external crises, the country struggled to implement these economic reforms. The reforms have yielded some positive results, however, while the Philippine industrial sector was rated second in Asia to that of Japan in the early 1950s, today the country is ranked close to the least successful economic performers. Among the ASEAN countries, the Philippines has the lowest record of industrial growth.
There are many possible reasons, both domestic and international, that could explain the limited gains. The country has gone through a lot of adverse shocks such as the debt and political crises of the 1980s, bouts of political instability in the late 1980s, natural calamities, the recession of the early 1990s, the Asian financial crisis of 1997-98, and another political crisis in the late 1999 up to early 2000. All these could have easily wiped out the gains from previous economic reforms.
A more fundamental reason for the country’s low growth is the apparent lack of competition in the economy. Despite the substantial economic reforms that the Philippines has instituted, competition remains weak in a lot of major economic sectors. Sizeable margins have been found in sectors such as beverages, glass and glass products, and cement whose PCMs ranged from 55 percent to 66 percent. In other countries like India, for example, the average PCM during the same period was about 22 percent for beverages, tobacco and nonmetallic mineral products. In Spain, average PCMs were approximately 18 percent for beverages and glass products and 22 percent for nonmetallic mineral products. In the Philippines, the PCM for tobacco was around 66 percent and for chemicals it was 46 percent.
In agriculture, the margins were also found to be relatively large. In 1997, the PCM
was around 54 percent in palay as well as in corn and chicken broiler production while sugarcane production had a margin of about 43 percent. In Spain, agricultural and livestock production had a PCM of around 16 percent.
Exceptions are found in the wholesale and retail trade where the lowest PCMs are registered. Except for two sub-sectors, PCMs ranged from 10 percent to 19 percent in

The Impact of Market Reforms on Competition, Structure and Performance of the Philippine Economy
page 64 of 90
wholesale trade and from 2 percent to 15 percent in retail trade. Substantial reductions in PCMs were observed in the banking sector, particularly in deposit money banks whose PCM declined from 64 percent in 1984 to 34 percent in 1995. PCMs in thrift banks also fell from 49 percent to 33 percent during the same years. Within the manufacturing sector, low PCMs were found in wood and cork, nonferrous metal, petroleum and coal, fabricated metal, leather and leather products, and machinery except electrical where the margins ranged from 13 percent to 22 percent. Significant reductions in PCMs were witnessed in three manufacturing sub-sectors: nonmetallic mineral products, nonferrous products, and petroleum and coal products.
The high margins in certain manufacturing sector may be attributed to the government policy of selective protection. In agriculture, weak competition may be attributed to the presence of high trade barriers along with traditional government regulation and controls particularly in rice and sugar. Note that despite our generally low average import duties, the overall system of protection is highly uneven which has promoted trade and economic distortions. The number of tariff peak products, which are mostly concentrated in agriculture products and related food manufactures, went up especially between 1998 and 2004. The structure of protection has also remained biased for importables as these continue to receive higher levels of protection than exportables. With tariff distortions, problems of inefficient resource allocation arise and this tends to favor highly protected importables at the expense of exportables. Moreover, the highly dispersed protection has promoted lobbying and rent-seeking activities, corrupt practices, and smuggling of products that are subject to high tariffs.
With weak competition, the pressure on firms to adopt new technology or innovate is reduced resulting in low growth of productivity and a loss of competitiveness. The current weak evidence on the increase in competition and productivity may be attributed to the policy reversals that characterized the trade reform process and the adoption of selective protection in the economy. Furthermore, the poor state of the country’s infrastructures and the absence of effective competition laws and clear regulatory framework may have undermined the supply side response to the policy changes.
The Philippine trade liberalization experience has spanned more than two decades.
However, the transition has been very difficult because of the many backsliding episodes that the trade policy reform process must withstand. Though the average nominal and effective protection rates seem to be low, the reform process is far from complete. The government policy of selective protection has created widely dispersed tariffs and wide variation in protection that has resulted in economic distortions and prevented the reallocation of resources from less to more productive activities within the economy. Moreover, the widely increasing petitions for and use of safeguard measures, anti-dumping and countervailing duties seem to have increased protection.
Since the anti-export bias of the protection system has remained, there is no incentive
for firms to export and take advantage of the scale economies arising from trade liberalization. Given the uncertainty created by the government’s practice of policy flip-

The Impact of Market Reforms on Competition, Structure and Performance of the Philippine Economy
page 65 of 90
flopping, there is also no incentive to engage in innovation, which is a risky activity. With the large variation in protection, which creates gains to rent seeking activities, firms would rather engage in lobbying for more protection. All these factors have prolonged the adjustment process and hence, the expected positive results have not been quickly felt. As Rodrik (1989) points out, the primary need for a government engaged in trade liberalization is to establish and bolster its credibility. Allowing the possibility of providing protection amidst the transition process sends a signal to firms that the government will not commit itself to a given policy reform. This can negatively affect the performance of firms and can lead to so-called time-inconsistency problems. The firms do not adjust because they expect to obtain further protection in the future. When the future comes, it may not be politically optimal for the government not to grant such protection.
All the infrastructure sub-sectors have very large margins that are generally much
higher than those found in the manufacturing and agriculture sectors. In 1997, the PCM for electricity was 50 percent, water transport: 69 percent, air transport: 49 percent, and telecommunications: 84 percent. While high margins are expected in most of the infrastructure sectors like electricity, water, and telecommunications because they require high sunk costs and economies of scale in order to be profitable, the PCM trends in the various infrastructure sectors seem to vary in response to the liberalization and deregulation.
In the power sector, PCMs increased despite the opening up of the generation sector
to private sector participation. A closer examination of the deregulation and liberalization that took place would reveal that the competition that emanated from these reforms was very limited. In the absence of a clear regulatory framework, the National Power Corporation carried out negotiated deals resulting in generous take or pay contracts that unduly favored the independent power producers and merely transformed the National Power Corporation from a monopolist to a monopsonist in the energy market.
In the air transport sector, there were clear reductions in PCMs between 1987 and
1997 as the sector was deregulated. PCMs declined from 67 percent to 48 percent during this period as new players entered into the domestic air transport services sector which used to be a monopoly. In Spain, the PCM for activities related to air and sea transport is around 46 percent. It is important to note, however, that restrictive policies remain in the international air services sector.
In the water transport sector, PCMs remained unchanged at around 69 percent during
the period 1987 to 1997 despite the entry of new players owing to the liberalization of the sector. In the telecommunications sector, the liberalization resulted in a wide range of benefits. Nevertheless, the PCMs went up from 77 percent in 1987 to 84 percent in 1997. While there are a lot of new players in the telecommunications sector, incumbent PLDT which is vertically-integrated still dominates the market and owns and controls the bottleneck facility. Interconnection still remains a regulatory challenge.

The Impact of Market Reforms on Competition, Structure and Performance of the Philippine Economy
page 66 of 90
7.2 Policy Implications
The question of how trade liberalization affects competition and productivity growth
is a real and important one. Competition is the main channel through which liberalization affects the economy. Competition fosters innovation and technology adoption which leads to increases in competitiveness and growth that will have large consequences for poverty and inequality. Institutional and physical environment are important
The country’s more than twenty years of trade reform show that the institutional environment matters in the extent to which trade liberalization will be able to enhance competition and growth. The policy environment of backsliding and conflicting policy pronouncements create a lot of uncertainty such that the government loses its credibility in implementing reforms. This has dampened firms’ incentives to become efficient and has fostered rent-seeking behavior. Adoption of uniform tariff policy
To reduce market power and stimulate competition, the government needs to reduce current high tariffs towards the adoption of a more uniform tariff rate. A uniform tariff policy will reduce the gains to industry lobbying and thus, reduce the incentive to lobby for protection. This will also address the current distortion in the protection system where intermediate inputs (such as petrochemicals, float glass, steel) have higher tariffs than final user products. Replace tariff quotas with high single tariffs
In agriculture, government-induced barriers to imports such as import restrictions in rice, tariff quotas in other agriculture crops and related food manufactures and traditional government regulations and price controls continue to be significant. The presence of non-tariff barriers in agriculture continues to adversely affect the competitiveness of food manufactures that use agriculture inputs such as sugar and other crops including livestock products.
To encourage competition, the government should contemplate the removal of these
trade and regulatory barriers. This would entail the removal of quantitative restrictions on rice and replacing these with high tariffs as well as the removal of tariff quotas under the Minimum Access Volumes and replacing these with single tariffs. A reassessment of the roles of the National Food Authority and Sugar Regulatory Administration is also needed in the light of new market realities.
Strengthen regulation and competition laws in the infrastructure sector
The Impact of Market Reforms on Competition, Structure and Performance of the Philippine Economy
page 67 of 90
In the infrastructure sectors which are characterized by the presence of sunk costs and economies of scale, while deregulation and entry liberalization are powerful instruments to discipline incumbent monopolies, by themselves, these policies are not sufficient to ensure that markets perform efficiently. In the absence of clear rules and appropriate regulatory framework as well as efficient regulators, effective competition cannot be guaranteed. In telecommunications, interconnection remains a regulatory challenge. In air transport, reforms need to be deepened through the liberalization of international air transport. In water transport, the regulatory framework and competition laws especially mergers and consolidations need to be drawn. Increase investment: infrastructure, human capital, computers, machines, state of the art technology and other forms of capital
Currently, complementary policies and institutions that are necessary to support the reforms in order to generate supply-side responses that lead to employment and growth are missing. If market reforms such as trade liberalization, deregulation, and privatization are to have their intended effects, “behind the border” complementary policies that define the business environment or the so-called “competitive infrastructure” need to be addressed. These policies would include investment in human capital, infrastructure, and the quality of governance in the country.
Equally important is the need to increase investment in computers, machines, and other forms of capital. Both capital accumulation and innovation are critical ingredients to long-run growth. In line with Joseph Schumpeter’s idea of creative destruction11, Aghion and Howitt (1998) emphasized that openness to change and innovation is an important characteristic of countries that become the economic leaders of their time. Firms that survive the competitive struggle do not do so much by varying price and quantity but by innovating. Unify existing competition laws and promote education and information dissemination programs
Considering the lack of a competition tradition in the country, significant emphasis should be placed on the development of broad public support through education programs along with efforts to unify the existing competition law which are currently fragmented and implemented by many different government agencies. Note that the shift from import substitution to a more open economy requires the rule of law together with efficient institutions that will support growth and institutional change. While the Philippines has done a lot of market-oriented reforms; much remains to be done in terms of legislating effective rules and regulations as well as in creating efficient institutions.
11 The competitive process by which firms are constantly seeking for new ideas to make their rivals’ ideas obsolete.

The Impact of Market Reforms on Competition, Structure and Performance of the Philippine Economy
page 68 of 90
References:
Abad, A. (2002), “Recommendations for Philippine Antitrust Policy and Regulation” in Toward a National Competition Policy for the Philippines, edited by E. Medalla, Philippine Institute for Development Studies and Philippine APEC Study Center Network, Makati City.
Abrenica, J. (2000), “Technological Convergence and Competition” in in Philippine Review of Economics, Vol. XXXVII, No.1, UP School of Economics and PES.
Aldaba, R. (2005), “Policy Reversals, Lobby Groups and Economic Distortions”, Discussion Paper No. 2005-04, Philippine Institute for Development Studies, Makati City.
________. (2003), “Regulatory Policies and Reforms in the Power and Downstream Oil Industries”, Discussion Paper No. 2003-16, Philippine Institute for Development Studies, Makati City.
________. (2003), “Concentration and Market Power in the Philippine Manufacturing Industry”, The Philippine Review of Economics, Volume XL No. 1 June 2003, University of the Philippines School of Economics and the Philippine Economics Society, Quezon City.
Austria, M. (2002), “The State of Competition and Market Structure of the Philippine Air Transport Industry” in Toward a National Competition Policy for the Philippines, edited by E. Medalla, Philippine Institute for Development Studies and Philippine APEC Study Center Network, Makati City.
______. (2003), “Philippine Domestic Shipping Transport Industry: State of Competition and Market Structure”, Research Paper Series No. 2003-02, Philippine Institute for Development Studies, Makati City.
Aghion, P. & P. Howitt (1998), Endogenous Growth Theory, The MIT Press, Cambridge , Massachusetts.
Breshnahan, T.F. (1989), “Empirical Studies of Industries with Market Power” in Handbook of Industrial Organization, Volume II, edited by R. Schmalensee & R.D. Willig, Elsevier Science Publishers BV.
Carlin, W. & P. Seabright (2000), “The Importance of Competition in Developing Countries for Productivity and Innovation”, Background Paper for World Development Report 2001.
David, C. (2003), “Agriculture” in The Philippine Economy: Development, Policies and Challenges, edited by A. Balisacan & H. Hill.
De Dios, E. (1986), “Protection, Concentration, and the Direction of Foreign Direct Investments”, The Philippine Review of Economics & Business, Vol. XXIII, Nos. 1&2, March & June 1986, University of the Philippines, Quezon City.
De Dios, L. (1994), “A Review of the Remaining Import Restrictions”, Research Paper Series No. 94-08, Philippine Institute for Development Studies, Makati City.
Domowitz, I., Hubbard & Petersen (1988), “Market Structure & Cyclical Fluctuations in US Manufacturing Review of Economics & Statistics 70, pp 55-66.
______________________________(1986) “The Intertemporal Stability of the Concentration-Margins Relationship”, Journal of Industrial Economics, Vol. 35, No. 1, pp 13-34.

The Impact of Market Reforms on Competition, Structure and Performance of the Philippine Economy
page 69 of 90
Epifani, P. (2003), “Trade Liberalization, Firm Performance and Labor Market Outcomes in the Developing World”, University of Parma and CESPRI-Bocconi University.
Erdem E. & J. Tybout (2003), “Trade Policy and Industrial Sector Responses: Using Evolutionary Models to Interpret the Evidence”, Working Paper 9947, National Bureau of Economic Research.
Fabella, R. & R. Aldaba (2004), “The Regulatory Environment of the Energy Industry in the Philippines” in Leading Issues in Competition, Regulation and Development edited by Paul Cook, Colin Kirkpatrick, Martin Minogue & David Parker, Edward Elgar Publishing Limited, UK.
Feenstra, R. (1995), “Estimating the Effects of Trade Policy” in Handbook of International Economics, Volume 3.
Hoekman, B., H.L. Kee & M. Olarreaga (2001), “Mark-ups, Entry Regulation and Trade: Does Country Size Matter?” Policy Research Working Paper No. 2662, World Bank.
Goldar, B. & S.C. Agarwal (April 2004), “Trade Liberalization and PCM in Indian Industries”, WP No. 130, Indian Council for Research on International Economic Relations.
______ & A. Kumari (2003), “Import Liberalization and Productivity Growth in Indian Manufacturing Industries in the 1990s”, Developing Economies, 41(4).
Hapitan, R. (2005), “Competition Policy and Access of Small and Medium Enterprises (SMEs) to Financial Services: A Review of Selected SMEs”, Philippine Institute for Development Studies.
Hall, R. (1988) “The Relation between Price and Marginal Cost in US Industry”, Journal of Political Economy 96 pp 921-947
Harrison, A. (1994), “Productivity, Imperfect Competition and Trade Reform”, Journal of International Economics, 36, pp 53-73.
Herrin, A. & E. Pernia (2003), “Population, Human Resources and Employment” in The Philippine Economy: Development, Policies and Challenges, edited by A. Balisacan & H. Hill.
Kee, H.L. and B. Hoekman, “Imports, Entry and Competitoin Law as Market Disciplines”, World Bank paper.
Kim, E. (2000), “Trade Liberalization and Productivity Growth in Korean Manufacturing Industries: Price Protection, market Power, and Scale Efficiency”, Journal of Development Economics, Vol. 62, 55-83.
Krishna, P. & D. Mitra (1998), “Trade Liberalization, Market Discipline and Productivity Growth: New Evidence from India”, Journal of Development Economics, 56(2).
Konings, J. P. Van Cayseele & F. Warzynski (2002) “The Effect of Privatization and Competitive Pressure on Firms’ PCMs: Micro Evidence from Emerging Economies”
________ & H. Vandenbussche (2002) “Does Anti dumping Protection Raise Market Power of Domestic Firms? Evidence from Firm Level Data”
Krishna P. & Mitra D. (1998) “Trade Liberalization, Market Discipline and Productivity Growth: New Evidence from India”, JDE 56, pp 447-462.
Lamberte, M. & C. Manlangit (2005), “Evaluating the Impacts of Competition Policy Reforms on the Efficiency of Philippine Commercial Banks”, Philippine Institute for Development Studies and World Bank-Asia Europe Meeting.

The Impact of Market Reforms on Competition, Structure and Performance of the Philippine Economy
page 70 of 90
Llanto G. (2002), “Infrastructure Development: Experience and Policy Options for the Future”, Discussion Paper 2002-26, Philippine Institute for Development Studies, Makati City.
______ & E. Patalinghug (2005), “Competition Policy and Regulation in Power and Telecommunications”, Philippine Institute for Development Studies and World Bank-Asia Europe Meeting.
Levinsohn, J. (1993) “Testing the Imports-as-Market Discipline Hypothesis”, Journal of International Economics 35 (1-2), pp 1-22
________ & A. Petrin (2002), “Estimating Production Functions Using Inputs to Control for Unobservables”, Review of Economic Studies (2003) 70, 317-341.
________ & W. Petropoulos (2000), “Creative Destruction or Just Plain Destruction?: The US Textile and Apparel Industries since 1972”.
Lim, A. (2004), “Should We have Open Skies?”, Power Point Presentation, UP School of Economics.
Manzano, G. & E. Neri (2001), “Foreign Bank Entry, bank Spreads and the Macroeconomic Policy Stance”, Philippine Institute for Development Studies and the Philippine APEC Study Center Network.
Maxwell Stamp PLC. (2001), “Strengthening Export Competitiveness”, Study conducted for the Asian Development Bank under TA 3345-PHI.
Milo, M. (2002), “Analysis of the State of Competition and Market Structure of the Banking and Insurance Sectors” in Toward a National Competition Policy for the Philippines, edited by E. Medalla, Philippine Institute for Development Studies and Philippine APEC Study Center Network, Makati City.
Oliveira Martins J. & S. Scarpetta (1999) “The Levels and Cyclical Behaviour of Mark-ups Across Countries and Market Structures”, OECD Working Paper
__________________________ & D. Pilat “Mark-up Ratios in Manufacturing Industries” OECD Working Paper
Pasadilla G. & M. Milo (2005), “Effect of Liberalization on Banking Competition”, Philippine Institute for Development Studies and World Bank-Asia Europe Meeting.
Pavcnik, N. (2000), “Trade Liberalization, Exit, and Productivity Improvements: Evidence from Chilean Plants”, NBER Working Paper No. W7852.
Pilat, D. (Oct./Nov. 1996), “From Competition to Growth”, The OECD Observer. Rodrik, D. (1989), “The Credibility of Trade Reform – A Policy Makers Guide,” The World
Economy, 12:1- 17. Roeger, W. (1995) “Can Imperfect Competition Explain the Difference between Primal and
Dual Productivity Measures? Estimates for US Manufacturing”, Journal of Political Economy, Vol 103 no 21
Schmalensee, R. (1989), “Inter-Industry Studies of Structure and Performance” in Handbook of Industrial Organization, Volume II, edited by R. Schmalensee & R.D. Willig, Elsevier Science Publishers BV.
Siotis, G. (2003), “Competitive Pressure and Economic Integration: An Illustration for Spain, 1983-1996”, International Journal of Industrial Organization.

The Impact of Market Reforms on Competition, Structure and Performance of the Philippine Economy
page 71 of 90
Tuano, Philip Arnold (2001), “Privatization of a State Enterprise: The NAPOCOR Case” in Economic Reforms and Governance in the Philippines – Eight Case Studies, Ateneo School of Government and Ateneo Center for Social Policy and Public Affairs.
Tybout, J. (2001) “Plant and Firm-Level Evidence on New Trade Theories”, NBER Working Paper No. 8418.
Warzynski, F. (2002) “The Dynamic Effect of Competition on PCMs and Innovation”, PhD dissertation, Katholieke Universiteit Leuven
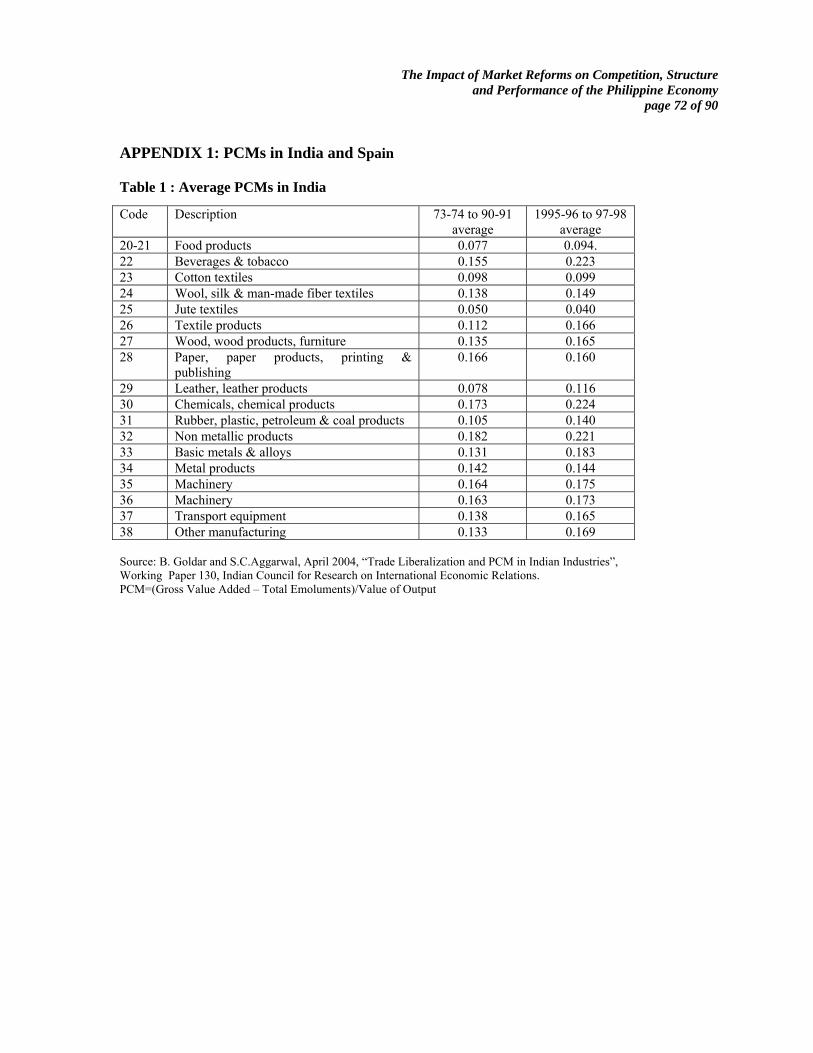
The Impact of Market Reforms on Competition, Structure and Performance of the Philippine Economy
page 72 of 90
APPENDIX 1: PCMs in India and Spain Table 1 : Average PCMs in India
Source: B. Goldar and S.C.Aggarwal, April 2004, “Trade Liberalization and PCM in Indian Industries”, Working Paper 130, Indian Council for Research on International Economic Relations. PCM=(Gross Value Added – Total Emoluments)/Value of Output
Code Description 73-74 to 90-91 average
1995-96 to 97-98 average
20-21 Food products 0.077 0.094. 22 Beverages & tobacco 0.155 0.223 23 Cotton textiles 0.098 0.099 24 Wool, silk & man-made fiber textiles 0.138 0.149 25 Jute textiles 0.050 0.040 26 Textile products 0.112 0.166 27 Wood, wood products, furniture 0.135 0.165 28 Paper, paper products, printing &
publishing 0.166 0.160
29 Leather, leather products 0.078 0.116 30 Chemicals, chemical products 0.173 0.224 31 Rubber, plastic, petroleum & coal products 0.105 0.140 32 Non metallic products 0.182 0.221 33 Basic metals & alloys 0.131 0.183 34 Metal products 0.142 0.144 35 Machinery 0.164 0.175 36 Machinery 0.163 0.173 37 Transport equipment 0.138 0.165 38 Other manufacturing 0.133 0.169

The Impact of Market Reforms on Competition, Structure and Performance of the Philippine Economy
page 73 of 90
Table 2: Average PCMs in Spain
Source: G. Siotis, 2003, “Competitive Pressure and Economic Integration: An Illustration for Spain, 1983-1996”, International Journal of Industrial Organization. PCM = (value of sales +△inventories – payroll – cost of materials)/(value of sales +△ inventories) where △ stands for “changes in”.
Code Description 1983-96 average 6 Meat industry 0.087 7 Fish based products 0.095 8 Dairy industry 0.099 9 Beverages 0.184 10 Other food products 0.120 14 Basic chemicals 0.178 15 Pharmaceuticals 0.166 16 Other chemical industries 0.147 17 Glass products 0.186 18 Ceramics 0.175 19 Other non-metallic mineral products 0.219 21 Metal products except machinery &
equipment 0.145
22 General use machinery 0.145 23 Industrial & agricultural machinery 0.142 25 Domestic apparatus 0.132 27 Electrical machinery & equipment 0.137 28 Electronic components, tv & radio equipment 0.149 29 Watch making, medical & optical equipment 0.148 31 Vehicle bodywork & equipment 0.142 34 Textile fibers 0.169 35 Textile cloth 0.148 36 Other textiles 0.143 37 Clothing: textile & leather 0.125 38 Shoes & other leather products 0.103 39 Wood & cork 0.127 40 Pulp & paper 0.139 41 Printing & publishing, graphics arts 0.207 42 Rubber products 0.136 43 Plastic products 0.155 44 Other manufacturing industries 0.137

The Impact of Market Reforms on Competition, Structure and Performance of the Philippine Economy
page 74 of 90
APPENDIX 2: Alternative Methods of Measuring Price Cost Margins
A. Hall Method Hall’s approach in estimating mark up draws on Solow’s (1957) seminal article on estimating productivity growth. The Solow residual or total factor productivity under perfect competition is given by: Δqt – αt Δηt = θt (1) where Δq: rate of growth of output/capital ratio or Δlog(Q/K) α: factor share earned by labor or wN/pQ (ratio of compensation wN to total revenue pQ) Δη: rate of growth of labor/capital or Δlog(N/K) θ: rate of Hicks-neutral technical progress or ΔlogΘ
Assuming that the rate of technological progress can be described as a random deviation from an underlying constant term, that is, θt = θ + εt where θ is a constant growth rate and εt is a random term, the above equation becomes Δqt – αt Δηt = θ + εt (2) For a firm with a fixed capital stock and unchanging technology over time, marginal cost x is measured as x = wΔN/ ΔQ (3) where ΔN: change in labor input w: wage rate ΔQ: change in output. Multiplying both sides by 1/Q, equation (3) can be rewritten as ΔQ/Q = (wN/xQ)( ΔN/N) (4) where ΔQ/Q: rate of growth of output wN/xQ: factor share or ratio of compensation to output valued at marginal cost ΔN/N: rate of growth of labor input. Let μ = p/x, then the relationship becomes Δqt = μtαt Δηt (5) with perfect competition, μ=1. Allowing capital stock to vary over time and technical progress, marginal cost is measured as

The Impact of Market Reforms on Competition, Structure and Performance of the Philippine Economy
page 75 of 90
x = (wΔN+rΔK)/(ΔQ- θQ) (6) where rΔK: cost of the change in capital stock r: service cost of capital θQ: amount by which output would have increased in the absence of additional labor or capital assuming Hicks neutral technical progress occurs at rate θ. Multiplying both sides of equation (6) by (ΔQ- θQ) and dividing both sides of the result by Q, the equation becomes ΔQ/Q = (wN/xQ)( ΔN/N) + (rK/xQ)(ΔK/K) + θ (7) where β is equal to (rK/xQ) or factor share earned by capital. Without constant returns to scale, (α + β) > 1. With constant returns to scale, (α + β) = 1. By substituting β = [1- (wN/xQ)] into equation (7) and rearranging the terms, ΔQ/Q - ΔK/K = (wN/xQ)(ΔN/N- ΔK/K) + θ (8) With imperfect competition and using the earlier notations, this becomes Δqt = μtαt Δηt + θt (9) The relation between price and marginal cost is found by comparing the actual growth in the output/capital ratio with the growth that would be expected given the rate of technical progress and the growth in the labor/capital ratio. By adding and subtracting the term (αt Δηt) in the LHS of the above equation, the Solow residual under imperfect competition becomes Δqt - αt Δηt = (μt – 1)αt Δηt + θt (10) where θt = θ + εt . This cannot be directly estimated by simple OLS because the error term includes productivity shocks that are correlated with the explanatory variables leading upwardly biased mark up coefficients. Hall proposed the use of instrumental variables to overcome this problem, but the relative merits of the instrumental variable estimates over the simple OLS are not clear cut.
B. Roeger Method
Werner Roeger (1995) proposed a different way to overcome the identification problems arising from the correlation between the explanatory variable and the error term. The basic intuition of Roeger’s approach is that both the primal and dual Solow residuals contain the same unobservable productivity term which can be cancelled out if one residual is subtracted from the other.

The Impact of Market Reforms on Competition, Structure and Performance of the Philippine Economy
page 76 of 90
Consider a firm with a linear homogeneous production F (Nt, Kt )Et for value added Yt where Nt represents labor input, Kt is capital input, and Et a shift variable representing changes in productive efficiency, Roeger started with Hall’s equation (28). He rewrote the Solow residual (SR) under imperfect competition as:
Δyt - Δkt = μt αt (Δηt - Δkt) + θt (11)
where lowercase variables indicate log differences.
By substituting μ = 1/(1-B) which gives the relationship between the price cost margin B and the mark up μ, the Solow residual (SR) can be rewritten as:
SRt = (Δyt – Δkt) – αt (Δηt - Δk) = B (Δyt – Δkt )+ (1-B) Δet (12) In deriving the dual residual under imperfect competition, Roeger assumed a general cost function C(.) for a representative firm operating under constant returns to scale: C(Wt, Rt, Yt, Et) = [G(Wt, Rt )Yt ]/Et (13) where Wt :price of labor Rt : price of capital Yt : value added Et : technical progress The function C(.) is homogeneous of degree 1. The marginal costs (MC t) are given by: ∂Ct/∂Yt = MC t = G(Wt, Rt )/Et (14) Taking the logarithm of both sides of equation (14) Log [∂Ct/∂Yt] = Log [G(Wt, Rt )/Et] (15) Differentiating with respect to time yields (∂MC t /∂t)/MC t = [GW (∂Wt/ ∂t)]/G(Wt, Rt ) + [GR (∂Rt/ ∂t)]/G(Wt, Rt )] - (∂Et/ ∂t)/Et (16) where GW = ∂G(Wt, Rt )/∂W and GR = ∂G(Wt, Rt )/∂R Multiplying the first and second terms of the RHS by Wt/Wt and Rt/Rt, respectively, equation (14) can be rewritten as (∂MC t /∂t)/MC t = [(GW Wt)/ G] [(∂W/∂t)/Wt] + [(GRRt)/ G] [(∂R/∂t)/Rt] - (∂Et/ ∂t)/Et Then, Δmc t = [(GW Wt)/ G]Δwt + [(GRRt)/ G]Δrt - Δet (17)

The Impact of Market Reforms on Competition, Structure and Performance of the Philippine Economy
page 77 of 90
Using Shephard’s lemma, GW = EtNt/Yt GR = EtKt/Yt By substituting the above into equation (15) Δmc t = [(EtNtWt)/ Yt G(.)]Δwt + [(EtNtRt)/ Yt G(.)]Δrt - Δet (18) With constant returns to scale, [(EtNtWt)/ Yt G(.)] + [(EtNtRt)/ Yt G(.)] = 1 By substitution, Δmc t = [(EtNtWt)/ Yt G(.)]Δwt + [1- {(EtNtWt)/ Yt G(.)}]Δrt - Δet Replacing the cost function (see equation 11) into the above yields Δmc t = [(NtWt)/ C(.)]Δwt + [1- {NtRt/ C(.)}]Δrt - Δet (19) We know that P/ μ = MC. By substituting equation μ = 1/(1-B) and equation (14), the relation between price and marginal cost can be defined as (1-B)Pt = MCt = G(Wt, Rt )/Et (20) (1-B)Δ pt = Δmc t
By substituting equation (19), the difference between the change in price and a weighted average of changes in factor prices, the dual or price-based Solow residual is defined by (1-B)Δ pt = [(NtWt)/ C(.)]Δwt + [1- {NtRt/ C(.)}]Δrt - Δet This can be rewritten as αtΔwt + (1-αt) Δrt - Δ pt = -B[Δ pt - Δrt] + (1- B)Δet (21) Denote the left-hand side of the above equation by SRPt. By subtracting it from SRt (equation 12), the unobservable productivity term is cancelled out. Adding an error term u t, the following expression is obtained SR t – SRP t = BΔx t + u t or Δyt = BΔx t + u t (22) where Δy t, the difference between the primal and the dual Solow residual, and Δx t are defined as: Δy t = (Δyt + Δpt) – αt (Δηt + Δ wt) – (1- αt) (Δkt+Δrt) Δx t = B[(Δ yt + Δpt) + (Δkt+Δrt)] The above (equation 22) is a very simple equation which can be used to estimate the Lerner index B through standard OLS.
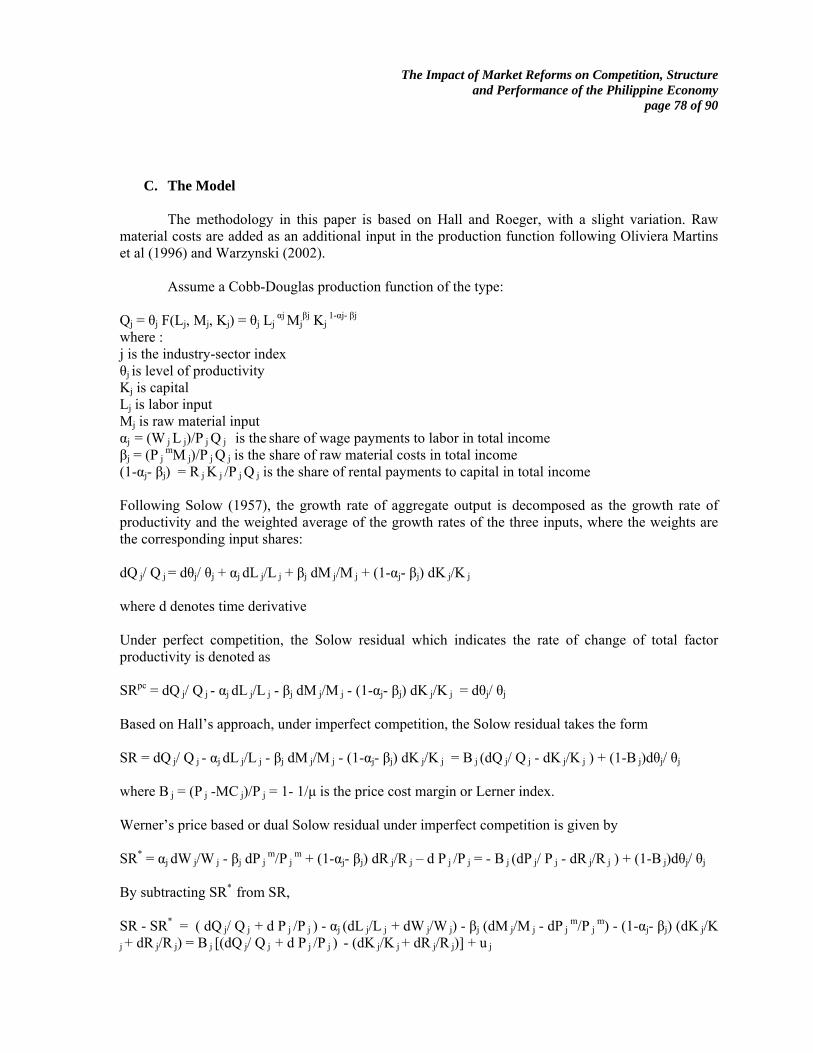
The Impact of Market Reforms on Competition, Structure and Performance of the Philippine Economy
page 78 of 90
C. The Model
The methodology in this paper is based on Hall and Roeger, with a slight variation. Raw material costs are added as an additional input in the production function following Oliviera Martins et al (1996) and Warzynski (2002).
Assume a Cobb-Douglas production function of the type:
Qj = θj F(Lj, Mj, Kj) = θj Lj
αj Mj
βj Kj 1-αj- βj
where : j is the industry-sector index θj is level of productivity Kj is capital Lj is labor input Mj is raw material input αj = (W j L j)/P j Q j is the share of wage payments to labor in total income βj = (P j
mM j)/P j Q j is the share of raw material costs in total income (1-αj- βj) = R j K j /P j Q j is the share of rental payments to capital in total income Following Solow (1957), the growth rate of aggregate output is decomposed as the growth rate of productivity and the weighted average of the growth rates of the three inputs, where the weights are the corresponding input shares: dQ j/ Q j = dθj/ θj + αj dL j/L j + βj dM j/M j + (1-αj- βj) dK j/K j where d denotes time derivative Under perfect competition, the Solow residual which indicates the rate of change of total factor productivity is denoted as SRpc = dQ j/ Q j - αj dL j/L j - βj dM j/M j - (1-αj- βj) dK j/K j = dθj/ θj Based on Hall’s approach, under imperfect competition, the Solow residual takes the form SR = dQ j/ Q j - αj dL j/L j - βj dM j/M j - (1-αj- βj) dK j/K j = B j (dQ j/ Q j - dK j/K j ) + (1-B j)dθj/ θj where B j = (P j -MC j)/P j = 1- 1/μ is the price cost margin or Lerner index. Werner’s price based or dual Solow residual under imperfect competition is given by SR* = αj dW j/W j - βj dP j
m/P j m + (1-αj- βj) dR j/R j – d P j /P j = - B j (dP j/ P j - dR j/R j ) + (1-B j)dθj/ θj
By subtracting SR* from SR, SR - SR* = ( dQ j/ Q j + d P j /P j ) - αj (dL j/L j + dW j/W j) - βj (dM j/M j - dP j
m/P j m) - (1-αj- βj) (dK j/K
j + dR j/R j) = B j [(dQ j/ Q j + d P j /P j ) - (dK j/K j + dR j/R j)] + u j
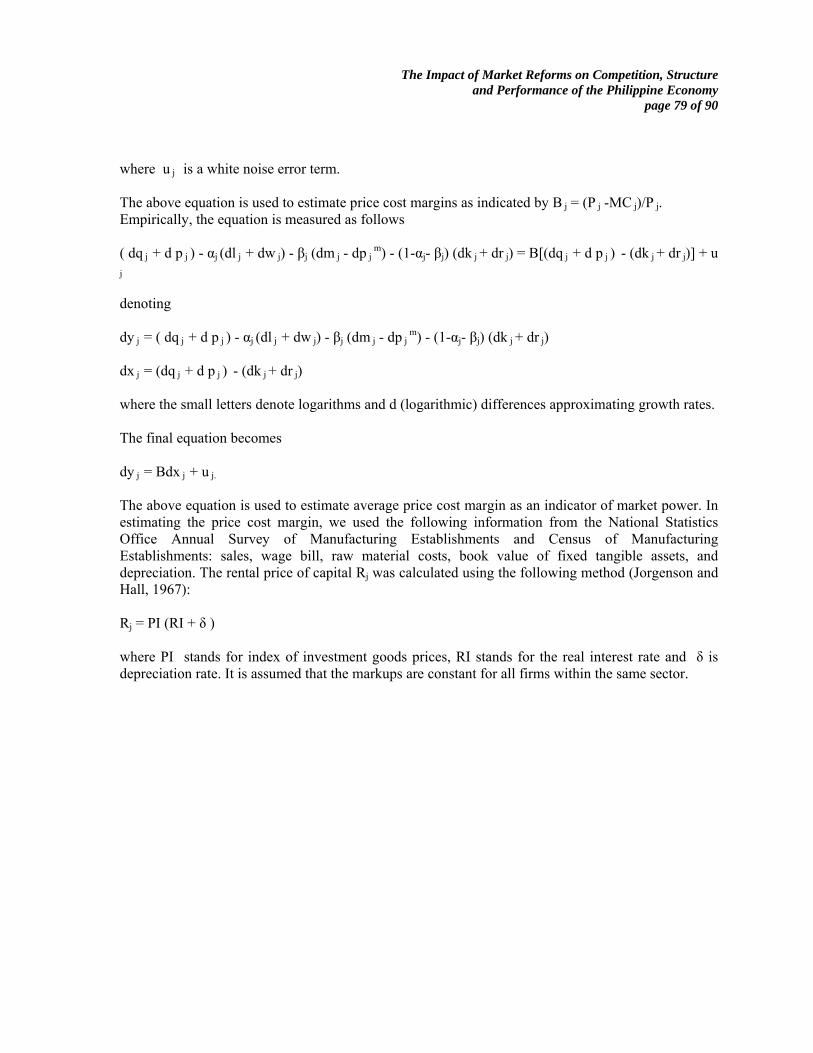
The Impact of Market Reforms on Competition, Structure and Performance of the Philippine Economy
page 79 of 90
where u j is a white noise error term. The above equation is used to estimate price cost margins as indicated by B j = (P j -MC j)/P j. Empirically, the equation is measured as follows ( dq j + d p j ) - αj (dl j + dw j) - βj (dm j - dp j
m) - (1-αj- βj) (dk j + dr j) = B[(dq j + d p j ) - (dk j + dr j)] + u
j denoting dy j = ( dq j + d p j ) - αj (dl j + dw j) - βj (dm j - dp j
m) - (1-αj- βj) (dk j + dr j) dx j = (dq j + d p j ) - (dk j + dr j) where the small letters denote logarithms and d (logarithmic) differences approximating growth rates. The final equation becomes dy j = Bdx j + u j. The above equation is used to estimate average price cost margin as an indicator of market power. In estimating the price cost margin, we used the following information from the National Statistics Office Annual Survey of Manufacturing Establishments and Census of Manufacturing Establishments: sales, wage bill, raw material costs, book value of fixed tangible assets, and depreciation. The rental price of capital Rj was calculated using the following method (Jorgenson and Hall, 1967): Rj = PI (RI + δ ) where PI stands for index of investment goods prices, RI stands for the real interest rate and δ is depreciation rate. It is assumed that the markups are constant for all firms within the same sector.

The Impact of Market Reforms on Competition, Structure and Performance of the Philippine Economy
page 80 of 90
APPENDIX 3: Industry Case Studies
Case 1: Cement The cement industry developed under a complex policy package of protection, promotion and
regulation. A government sponsored-cartel evolved as a government regulator was established in 1973 to regulate entry, allocate supply, and control prices. During the 90s, deregulation and trade liberalization were implemented in the industry.
Prior to 1997, the industry was dominated by three big domestic Filipino groups. A wave of
mergers and acquisitions took place right after 1997 Asian crisis. Currently, the industry is divided into three major groups: Phinma/Holcim, Lafarge/Blue Circle, and Cemex.
Between 1987 to 1999, the cement industry remained highly concentrated with CR4 ranging from
93% to 100%. After the mergers and acquisitions, cement price increases were observed beginning in 1999. Prior to this, big drops in prices starting in mid 1997 eventually leading to a price war were observed. After hitting a price of P45/bag in December 1998, the lowest level hit during the price war period, prices began to increase in a simultaneous fashion between January 1999 up 2000. In May 2000, ex plant price/bag was already P110 and reached around 140-145 per bag in 2001.
These price increases occurred at a time characterized by excess supply, which ballooned from 5
million bags in 1996 to 10 million bags in 1998 and 1999. While demand remained depressed and the industry wallowed in excess capacity which was below 50% in 1999, prices kept on rising. Their sales revenues grew by 25% despite a 12% reduction in production growth and a 130% increase in import growth in 2000. Note that the price increases coincided with reduced tariffs as well as entry of imports.
Indicators 1995 1996 1997 1998 1999 2000 Total Domestic Supply (in ‘000 bags) 277810 328288 380280 332620 318772 Total Domestic Demand (in ‘000 bags) 277237 323821 372210 322362 308594 Excess Supply (in ‘000 bags) 573 4467 8070 10258 10178 Ave.Ex-plant Price (in pesos per bag) 92.33 100.97 94.92 72.75 85.17
Capacity Utilization Rate (in %) 93.44 88.15 80.05 50.26 48.97
Production (in million MT) 12.43 14.68 12.89 12.56 11.96
Sales (in MT) 12.27 14.54 12.7 11.87 10.48
Revenues (‘000 pesos) 22.77 29.3
Imports (in million bags) 12.01 16.99 8.79 4.5 11.86 39.48 Source of basic data: Philcemcor Note: Total supply = [domestic production + imports + inventory – exports] Total demand = [domestic sales + imports]
Consumer groups threatened to file a criminal case against the industry which they accused of
engaging in cartel activities, but this never prospered. The House Committee on Trade and Industry and the Department of Trade and Industry immediately conducted investigations but no resolution was made. The industry, through its very strong association, Philcemcor, was able to divert government’s attention from the cartel issue by filing an antidumping case against imports. The Tariff Commission (TC), however, failed to find sufficient evidence to prove that the industry suffered serious injury from imports. However, DTI reversed the decision of the Tariff Commission by granting safeguard measures to protect the industry against imports. Recently, the Supreme Court voided the safeguard duty on imported cement, thus nullifying the earlier DTI decision.
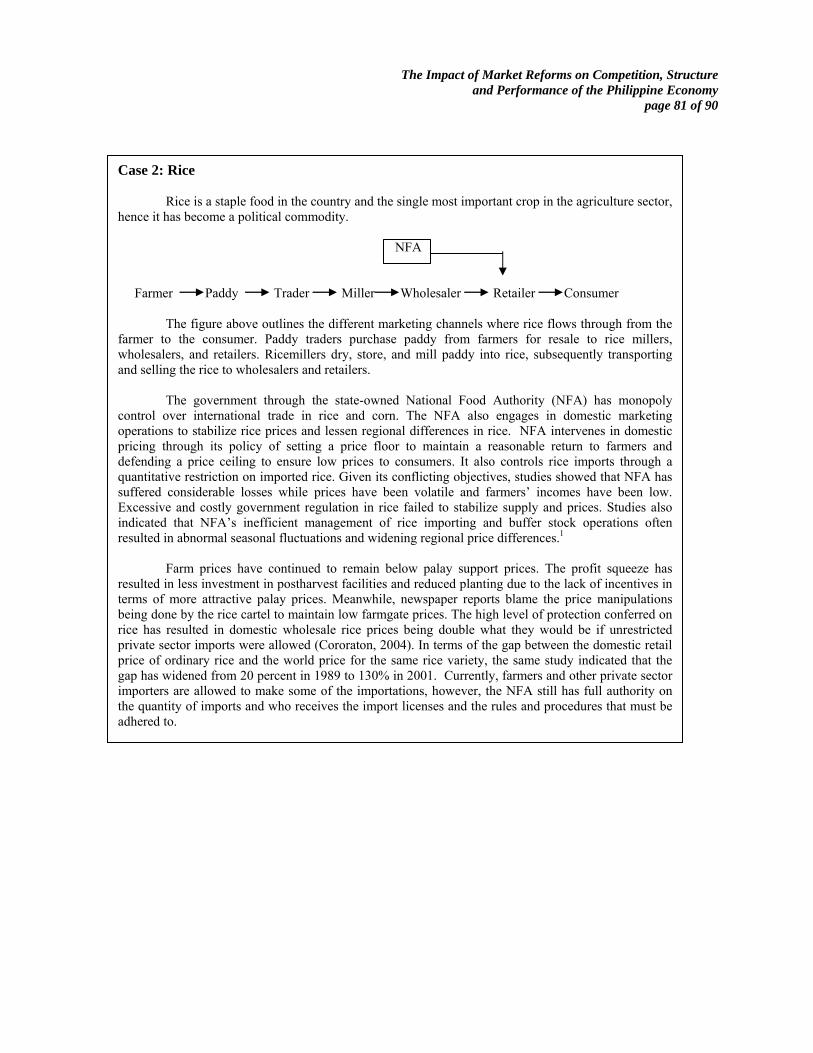
The Impact of Market Reforms on Competition, Structure and Performance of the Philippine Economy
page 81 of 90
Case 2: Rice
Rice is a staple food in the country and the single most important crop in the agriculture sector, hence it has become a political commodity.
NFA
Farmer Paddy Trader Miller Wholesaler Retailer Consumer The figure above outlines the different marketing channels where rice flows through from the
farmer to the consumer. Paddy traders purchase paddy from farmers for resale to rice millers, wholesalers, and retailers. Ricemillers dry, store, and mill paddy into rice, subsequently transporting and selling the rice to wholesalers and retailers.
The government through the state-owned National Food Authority (NFA) has monopoly
control over international trade in rice and corn. The NFA also engages in domestic marketing operations to stabilize rice prices and lessen regional differences in rice. NFA intervenes in domestic pricing through its policy of setting a price floor to maintain a reasonable return to farmers and defending a price ceiling to ensure low prices to consumers. It also controls rice imports through a quantitative restriction on imported rice. Given its conflicting objectives, studies showed that NFA has suffered considerable losses while prices have been volatile and farmers’ incomes have been low. Excessive and costly government regulation in rice failed to stabilize supply and prices. Studies also indicated that NFA’s inefficient management of rice importing and buffer stock operations often resulted in abnormal seasonal fluctuations and widening regional price differences.1
Farm prices have continued to remain below palay support prices. The profit squeeze has
resulted in less investment in postharvest facilities and reduced planting due to the lack of incentives in terms of more attractive palay prices. Meanwhile, newspaper reports blame the price manipulations being done by the rice cartel to maintain low farmgate prices. The high level of protection conferred on rice has resulted in domestic wholesale rice prices being double what they would be if unrestricted private sector imports were allowed (Cororaton, 2004). In terms of the gap between the domestic retail price of ordinary rice and the world price for the same rice variety, the same study indicated that the gap has widened from 20 percent in 1989 to 130% in 2001. Currently, farmers and other private sector importers are allowed to make some of the importations, however, the NFA still has full authority on the quantity of imports and who receives the import licenses and the rules and procedures that must be adhered to.
The Impact of Market Reforms on Competition, Structure and Performance of the Philippine Economy
page 82 of 90
Case 3: Sugar
The sugar industry is another agricultural crop that has been heavily regulated and protected by the government. Government intervention in the industry has been extensive because of the need to divide the higher than normal returns among millers and planters due to the Philippine’s preferential access to the US sugar market which the country enjoyed till the 1980s.
The government set up the Sugar Regulatory Administration (SRA) to control and regulate the sugar market. It classifies all sugar produced and imported in the country into different classes by type of market: “A” for US, “B” for domestic consumption, “C” is reserve sugar, and “D” is sugar for export to other countries other than the US and E for input into processed for export. SRA also enforces the production sharing system (known as quedan system) between domestic planters and millers. At the start of the crop year, SRA estimates total domestic production and issues a Sugar Order stating the percentage allocations for various categories. These percentages are applied to the raw sugar produced at the sugar mill from the cane produced from each farm.
Aside from traditional regulation, sugar has been heavily protected. Although the quantitative
restrictions on sugar were lifted in 1992, these were replaced with tariff quotas under the MAV. This allowed the importation of raw and refined sugar within the minimum access volume (MAV) at 50% in-quota tariffs in 1996. Volumes of imported refined sugar beyond the MAV are levied a higher tariff rate of 100% in 1996. This declined to 80% in 1997 and to 65% in 1999.
In terms of performance, output and industry productivity have declined. The industry’s costs
of production are higher than Thailand, Australia, Brazil, or South Africa. Investments in new technology are limited to only a few firms. In 1991-92, the average recovery rate of Philippine mills was 78% while in Australia the average was 92%. To improve recovery rates, the country’s sugar mills need to be upgraded.
Because of the declining sugar production in the country, the Philippines has been a net importer of sugar such that every year the MAV has to be raised. In 1999, the Philippines imported 500,000 metric tons of sugar. In 1998, domestic prices of sugar in the country skyrocketed despite a worldwide sugar glut because of delays in importation and the milling process. There are reports that the presence of a cartel in sugar trading pushed the prices of sugar upward, in spite of the falling sugar prices abroad. Large groups were able to corner the bulk of importations The group of controversial trader Margarita Sia (who also controlled a big sugar conglomerate) was able to get one-half of the total 300,000 metric tons of the Philippine sugar trade (Dumlao, 2000). The same report noted that her group was also engaged in sugar smuggling. Despite the worldwide glut in sugar, Filipino consumers never get to enjoy low sugar prices as they continue to pay high prices due to the heavy protection provided by the government to the industry. Domestic food processors and beverage companies have been clamoring for the reduction of sugar tariffs.
The present quedan system and the Sugar Regulatory Administration’s powers of market
classification remain as barriers to effective competition in the industry. The high mark-ups in the industry can be attributed to the weak competition in the sugar sub-sector. The sugar sharing system poses a disincentive for producers to make the necessary investments which would lead to the uptake of the best technology and practices to increase productivity and lower costs. Under the quedan system, which provides cane growers and millers equal access to premium markets, producers are penalized for increasing productivity and output. A small increase in production would lower the domestic price for all output and reduce gross revenues. In the absence of effective competition, there is very little incentive for firms to modernize and improve their efficiency.
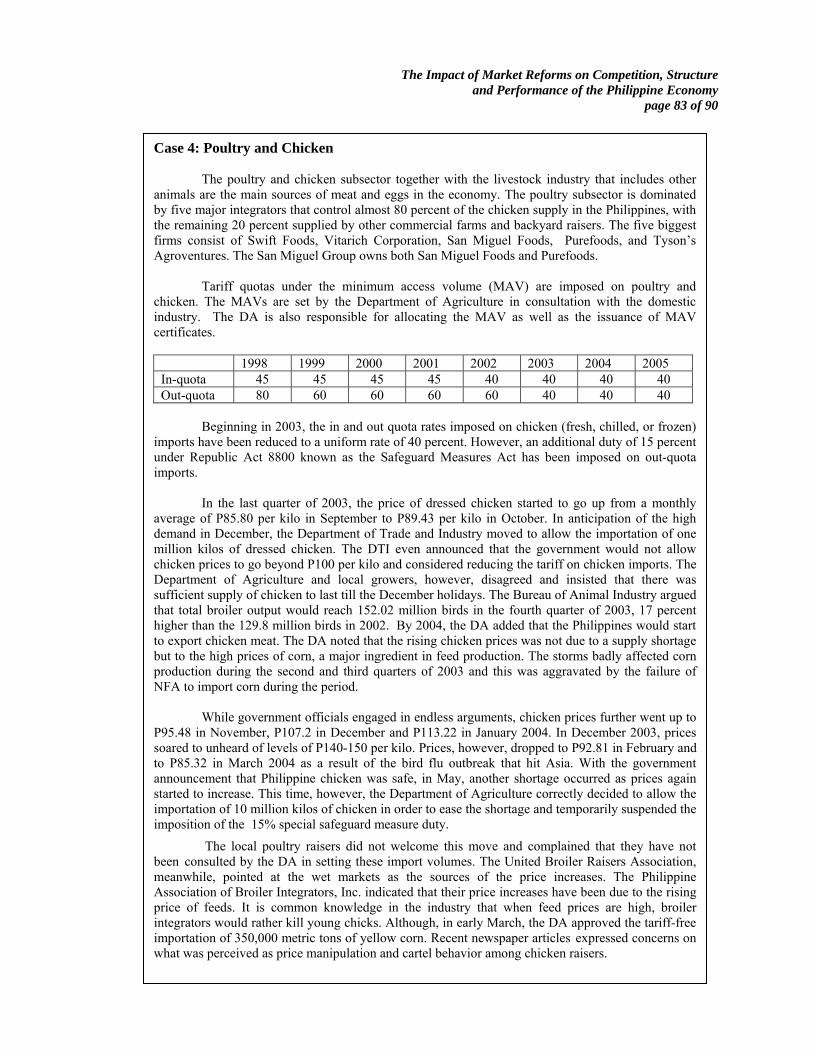
The Impact of Market Reforms on Competition, Structure and Performance of the Philippine Economy
page 83 of 90
Case 4: Poultry and Chicken
The poultry and chicken subsector together with the livestock industry that includes other animals are the main sources of meat and eggs in the economy. The poultry subsector is dominated by five major integrators that control almost 80 percent of the chicken supply in the Philippines, with the remaining 20 percent supplied by other commercial farms and backyard raisers. The five biggest firms consist of Swift Foods, Vitarich Corporation, San Miguel Foods, Purefoods, and Tyson’s Agroventures. The San Miguel Group owns both San Miguel Foods and Purefoods.
Tariff quotas under the minimum access volume (MAV) are imposed on poultry and chicken. The MAVs are set by the Department of Agriculture in consultation with the domestic industry. The DA is also responsible for allocating the MAV as well as the issuance of MAV certificates.
1998 1999 2000 2001 2002 2003 2004 2005 In-quota 45 45 45 45 40 40 40 40 Out-quota 80 60 60 60 60 40 40 40
Beginning in 2003, the in and out quota rates imposed on chicken (fresh, chilled, or frozen)
imports have been reduced to a uniform rate of 40 percent. However, an additional duty of 15 percent under Republic Act 8800 known as the Safeguard Measures Act has been imposed on out-quota imports.
In the last quarter of 2003, the price of dressed chicken started to go up from a monthly
average of P85.80 per kilo in September to P89.43 per kilo in October. In anticipation of the high demand in December, the Department of Trade and Industry moved to allow the importation of one million kilos of dressed chicken. The DTI even announced that the government would not allow chicken prices to go beyond P100 per kilo and considered reducing the tariff on chicken imports. The Department of Agriculture and local growers, however, disagreed and insisted that there was sufficient supply of chicken to last till the December holidays. The Bureau of Animal Industry argued that total broiler output would reach 152.02 million birds in the fourth quarter of 2003, 17 percent higher than the 129.8 million birds in 2002. By 2004, the DA added that the Philippines would start to export chicken meat. The DA noted that the rising chicken prices was not due to a supply shortage but to the high prices of corn, a major ingredient in feed production. The storms badly affected corn production during the second and third quarters of 2003 and this was aggravated by the failure of NFA to import corn during the period.
While government officials engaged in endless arguments, chicken prices further went up to
P95.48 in November, P107.2 in December and P113.22 in January 2004. In December 2003, prices soared to unheard of levels of P140-150 per kilo. Prices, however, dropped to P92.81 in February and to P85.32 in March 2004 as a result of the bird flu outbreak that hit Asia. With the government announcement that Philippine chicken was safe, in May, another shortage occurred as prices again started to increase. This time, however, the Department of Agriculture correctly decided to allow the importation of 10 million kilos of chicken in order to ease the shortage and temporarily suspended the imposition of the 15% special safeguard measure duty.
The local poultry raisers did not welcome this move and complained that they have not been consulted by the DA in setting these import volumes. The United Broiler Raisers Association, meanwhile, pointed at the wet markets as the sources of the price increases. The Philippine Association of Broiler Integrators, Inc. indicated that their price increases have been due to the rising price of feeds. It is common knowledge in the industry that when feed prices are high, broiler integrators would rather kill young chicks. Although, in early March, the DA approved the tariff-free importation of 350,000 metric tons of yellow corn. Recent newspaper articles expressed concerns on what was perceived as price manipulation and cartel behavior among chicken raisers.
The Impact of Market Reforms on Competition, Structure and Performance of the Philippine Economy
page 84 of 90
APPENDIX 4: Estimating Total Factor Productivity (TFP)
A. Levinsohn-Petrin (LP) Method While plant entry and exit, employment and wages are directly observable, productivity can not be directly observed and is often difficult to measure. The traditional way of measuring productivity at the plant level is to compute value-added per worker. While this is easy to calculate and reflects labor productivity, it focuses productivity measurement only on labor which can be misleading. Levinsohn and Petropolous (2000) cited two problems: Suppose it was possible to purchase a machine that allowed a single person to run an entire textile plant, but that this machine cost several billion dollars. Output per worker would be huge, but as a business decision, purchasing the machine would be stupid. One needs to account for the other inputs into the production process and this quickly leads one to measures of total factor productivity. Another, more subtle, problem with using output per worker to measure productivity is this strongly biases one toward finding a trade-off between productivity changes and employment changes. Holding output constant, the only way plant-level productivity (by this measure) will increase is if workers are laid off. With more accurate measures of productivity, it is easier to have both jobs and increased productivity. Measures of total factor productivity capture the efficiency with which inputs of capital and labor are used. The simplest way of computing TFP is to estimate a production function using ordinary least squares (OLS) and use the residual from such a regression as the measure of productivity. The problem with this method as pointed out by Marschak and Andrews (1944) is the correlation between unobservable productivity shocks and input levels, which is the key issue in the estimation of production function. Profit-maximizing firms respond to positive productivity shocks by expanding output which requires additional inputs. Negative shocks lead firms to pare back output, decreasing their output usage. When this happens, OLS estimates of production functions will yield biased estimates and by implication, biased estimates of productivity. The usual way to address this econometric endogeneity is to use Instrumental Variables estimator. However, finding a valid instrument is difficult. The current state-of-the-art in measuring productivity was developed by Olley and Pakes (1996). They developed an estimator that uses investment as a proxy for unobservable shocks. Building on the work of Olley and Pakes, Levinsohn and Petrin (2000) developed a methodology for estimating plant-level productivity that uses intermediate inputs as proxies. Levinsohn and Petrin argue that intermediates may respond more smoothly to productivity shocks. Investment is very lumpy and requires substantial adjustment cost. Hence, the investment proxy may not respond smoothly to productivity shocks.
B. Technical Notes: LP Method12
12 Levinsohn and W.Petropoulos (2000), Appendix A in “Creative Destruction or Just Plain Destruction”, and Levinsohn and A. Petrin (2000), “Estimating Production Functions Using Inputs to Control for Unobservables”, Review of Economic Studies (2003) 70, 317-341.

The Impact of Market Reforms on Competition, Structure and Performance of the Philippine Economy
page 85 of 90
Estimation proceeds in two steps. The first step is the estimation of the production function coefficients on those factors of production that are assumed to be freely variable and which will respond quickly to productivity shocks. In the second stage, the estimates of the coefficient on capital{ a state variable in the plant's optimization problem) is obtained. Assume a Cobb-Douglas production function for value-added yt = βo + βk kt + βslt
s + βult
u + ωt + ηt (1)
where yt is the log of value added in year t, kt is the log of the plant's capital stock, lt
s is the log of the skilled labor input (number of non-production workers) and lt
u is the log of the unskilled labor input (number of production worker hours). The two disturbance terms, ωt and ηt comprise the productivity term and any measurement error on output. The first component of the productivity term contains the “transmitted” part of productivity, that is, the part that is observed by plants before they choose variable input levels and that may be serially correlated within a plant over time. The second component contains any i.i.d. differences in productivity that are not observed by plant before they choose input levels, as well as measurement error on plant-level output. The first component, therefore, is likely to be correlated with variable inputs. To get consistent estimates of the coefficients on variable inputs, the effect that unobserved productivity has on plant choices of input levels must be controlled. With increasing marginal costs and a perfectly elastic demand for their good, plants will respond to an increase in productivity by using strictly more of variable inputs. This strictly monotonic relationship between productivity and variable input use allows the unobserved productivity term to be written as some exact function of the capital stock (on which variable input levels will also depend) and employment of a variable input: ωt = ht(et; kt) (2) where ht is the inverted function describing optimal energy use. Energy, et, is used since it is excluded from the value-added production function. Rewrite (1) as yt = βslt
s + βult
u + φ(et; kt) + ηt (3)
where φ(et; kt) = βo + βk kt + ht(et; kt) (4) Equation (3) is partially linear; it is linear in variable inputs, and non-linear in electricity and capital. The goal in this first stage is to obtain estimates on the coefficients of the inputs that enter (3) linearly (i.e. βs and βu). Here the approach for semi-parametric estimation of a partially linear equation described in Olley and Pakes (1996) is followed. Value added on ls
and lu are projected and on a fourth- or fifth-order polynomial expansion in e and k. Consistent estimates of coefficients on the included variable inputs (skilled and unskilled labor) are obtained and completes the first stage of the estimation routine. In order to obtain estimates of productivity, an estimate of the coefficient on capital is required. βk is estimated in the second step. Notice that capital enters φ(.) twice, i.e. φ(et; kt) = βo + βk kt + ht(et; kt) and and hence βk (and ωt) are not identified without further restrictions.
The Impact of Market Reforms on Competition, Structure and Performance of the Philippine Economy
page 86 of 90
Identification of the capital coefficient obtains from assuming that capital is quasi-fixed, and is slow to adjust to the productivity shock. While capital might well adjust to the expected part of a productivity shock, the identifying assumption maintains that capital does not instantaneously adjust to the unexpected part. To operationalize this notion, some structure on the stochastic process of the transmitted productivity shock, ω, is imposed. Following Olley and Pakes (1996), it is assumed that ωt follows a first order Markov process. In particular, we can write ωt = E(ωt / ωt-1 ) + ξt (5) where ξt is the “news” in the transmitted shock. To control for the endogeneity of capital, we only need to proxy for the E(ωt / ωt-1). The first stage regression provides an estimate of φt = ωt + βk kt , a nonparametric function of which serves as the proxy for each plant's expected productivity. The moment condition that identifies the coefficient on capital is then given by: E(ξt + ηt / kt ) = E(ξt /kt ) + E(ηt / kt) = 0 (6) This moment condition simply states that capital does not respond to the innovation in productivity. Estimation proceeds by employing a Generalized Method of Moments estimator to find the parameter estimate that most closely matches the sample to the population moment analog. Once the coefficients of the production function are estimated, the plant-level measure of productivity, φit - βk kit, is computed. A Stata program was created to implement the LP approach and is used in estimating TFP in the Philippine manufacturing industry .
C. Data Sources and Definitions Data on output and inputs for Philippine manufacturing industries are from the Annual Survey and Census of Manufacturing Establishments published by the National Statistics Office. The following are census years: 1972, 1975, 1978, 1983, 1988, and 1994. Real Output is approximated using sales revenue in Philippine peso deflated by an output price deflator at the three-digit PSIC level. The output price deflator is taken from the implicit price deflator of sector value added taken from the National Income Accounts. Real raw materials used is measured as raw materials in Philippine peso deflated by a materials price deflator at the three-digit PSIC level. The materials price deflator is taken from the wholesale price index. Employment is measured by the total number of employees (production and non-production) in the industry. The capital stock is obtained by the perpetual inventory method. Nominal investment flows in Philippine peso are available for all three-digit level industries from the Annual Survey and Census of Manufacturing Establishments. These flows are deflated by the implicit price deflator taken from gross fixed capital formation from the National Income Accounts to generate real investment flows.
The Impact of Market Reforms on Competition, Structure and Performance of the Philippine Economy
page 87 of 90
The capital stock for industry i and year t is obtained by cumulating real flows of investment (It) according to the following formula: Kt+1 = (1-δ)Kt + It
Where I is investment in constant 1985 prices, δ is depreciation rate, and K is capital stock. The initial capital stock13 is obtained according to the following formula: Kt = (n-T)*D where t is the year of the Annual Survey of Manufacturing n is average standard life (in years) and is given by the following ratio [book value of asset/accumulated depreciation] Kt is depreciated or book value at the beginning of year t D is depreciation cost in year t T is average age at the beginning of year t and is given by the ratio [acquisition cost/depreciation cost] where acquisition cost = book value + accumulated depreciation
13 The methodology closely follows Power, 1978, “Estimating the Replacement Cost of Fixed Capital” in Bautista, Power et al, Industrial Promotion Policies in the Philippines, PIDS.
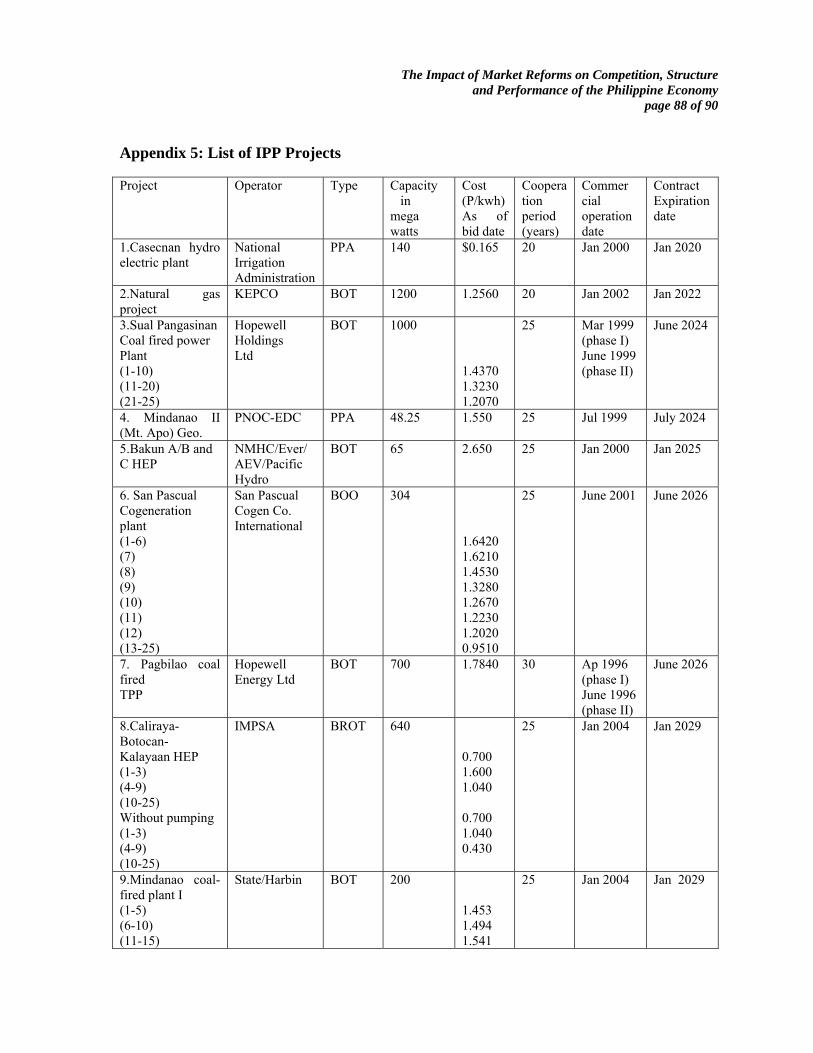
The Impact of Market Reforms on Competition, Structure and Performance of the Philippine Economy
page 88 of 90
Appendix 5: List of IPP Projects Project Operator Type Capacity
in mega watts
Cost (P/kwh) As of bid date
Cooperation period (years)
Commer cial operation date
Contract Expiration date
1.Casecnan hydro electric plant
National Irrigation Administration
PPA 140 $0.165 20 Jan 2000 Jan 2020
2.Natural gas project
KEPCO BOT 1200 1.2560 20 Jan 2002 Jan 2022
3.Sual Pangasinan Coal fired power Plant (1-10) (11-20) (21-25)
Hopewell Holdings Ltd
BOT 1000 1.4370 1.3230 1.2070
25 Mar 1999 (phase I) June 1999 (phase II)
June 2024
4. Mindanao II (Mt. Apo) Geo.
PNOC-EDC PPA 48.25 1.550 25 Jul 1999 July 2024
5.Bakun A/B and C HEP
NMHC/Ever/AEV/Pacific Hydro
BOT 65 2.650 25 Jan 2000 Jan 2025
6. San Pascual Cogeneration plant (1-6) (7) (8) (9) (10) (11) (12) (13-25)
San Pascual Cogen Co. International
BOO 304 1.6420 1.6210 1.4530 1.3280 1.2670 1.2230 1.2020 0.9510
25 June 2001 June 2026
7. Pagbilao coal fired TPP
Hopewell Energy Ltd
BOT 700 1.7840 30 Ap 1996 (phase I) June 1996 (phase II)
June 2026
8.Caliraya-Botocan- Kalayaan HEP (1-3) (4-9) (10-25) Without pumping (1-3) (4-9) (10-25)
IMPSA BROT 640 0.700 1.600 1.040 0.700 1.040 0.430
25 Jan 2004 Jan 2029
9.Mindanao coal-fired plant I (1-5) (6-10) (11-15)
State/Harbin BOT 200 1.453 1.494 1.541
25 Jan 2004 Jan 2029

The Impact of Market Reforms on Competition, Structure and Performance of the Philippine Economy
page 89 of 90
(16-20) (21-25)
1.591 1.767
10.San Roque multi Purpose HEP
Marubeni/SIT HE/Italian-Thai
BOT 345 3.3550 25 Jan 2005 Jan 2030
11.Ambuklao Hydro Power Plant
Miescor ROL 75 1.350 5 Oct 1995 Oct 2000
12.Baung, La Union Diesel PP
First Private Power Corp
BOT 215 1.373 15 Feb 1995 Feb 2010
13.Bataan EPZA Diesel Plant
Edison Global Electric
BOO 58 1.634 10 Jun 1994 Jun 2004
14.Benguet (Amphohaw) Minihydro
Hydro Elect. Dev. Corp
ROL 22 88%*NPC rate
5 Jun 1992 Jun 2002
15.Binga Hydro Power Plant
Chiang Jiang Energy Corp
ROL 100 1.150 15 Aug 1993 Aug 2008
16.Calaca Batangas Diesel Plant
Far East Levingston (FELS)
BOO 90 1.779 5 Sept 1993 Sept 1998
17.Cavite EPZA Diesel Plant
Magellan Cogen Utilities
BOO 43 1.346 10 Dec 1995 Dec 2005
18.Clark Air Base Diesel Plant
Electrobus Consolidated Inc
ROM 50 1.140 7 Jul 1992 Jul 1999
19.Engineering Island Power Barge
Sabah Shipyard SDN, BHD
BOO 100 1.568 5 Oct 1994 Oct 1999
20.Gas Turbine (GT) power Barges
Hopewell Tileman Ltd
ROM 270 1.963 10 1993 2003
21.General Santos Diesel Plant
Alsons/Tomen BOO 50 1.526 18 Ap 1998 Ap 2016
22.Iligan City Diesel Plant I
Alsons/Tomen BOT 58 1.437 10 Jul 1993 Jul 2003
23.Iligan City Diesel Plant I(1-7) (8-12)
Alsons/Tomen BOT 40 1.525 1.318
12 Dec 1993 Dec 2005
24.Leyte A (Leyte-Cebu) Geo
PNOC-EDC PPA 200 1.650 25 Nov 1997 Nov 2022
25.Leyte A (Leyte-Cebu) Geo
PNOC-EDC PPA 440 1.550 25 Jul 1998 Jul 2023
26.Limay Bataan CC, Block A
ABB/Marubeni/ Kawasaki
BTO 300 0.920 15 SC May 1994 CC Oct 1994
Oct 2009
27.Limay Bataan CC, Block A
ABB/Marubeni/ Kawasaki
BTO 300 0.934 15 SC Apr 1993 CC Jan 1995
Jan 2010
28.Makban Binary Geo Plant
ORMAT Inc BTO 15.73 0.337 10 Mar 1994 Mar 2004
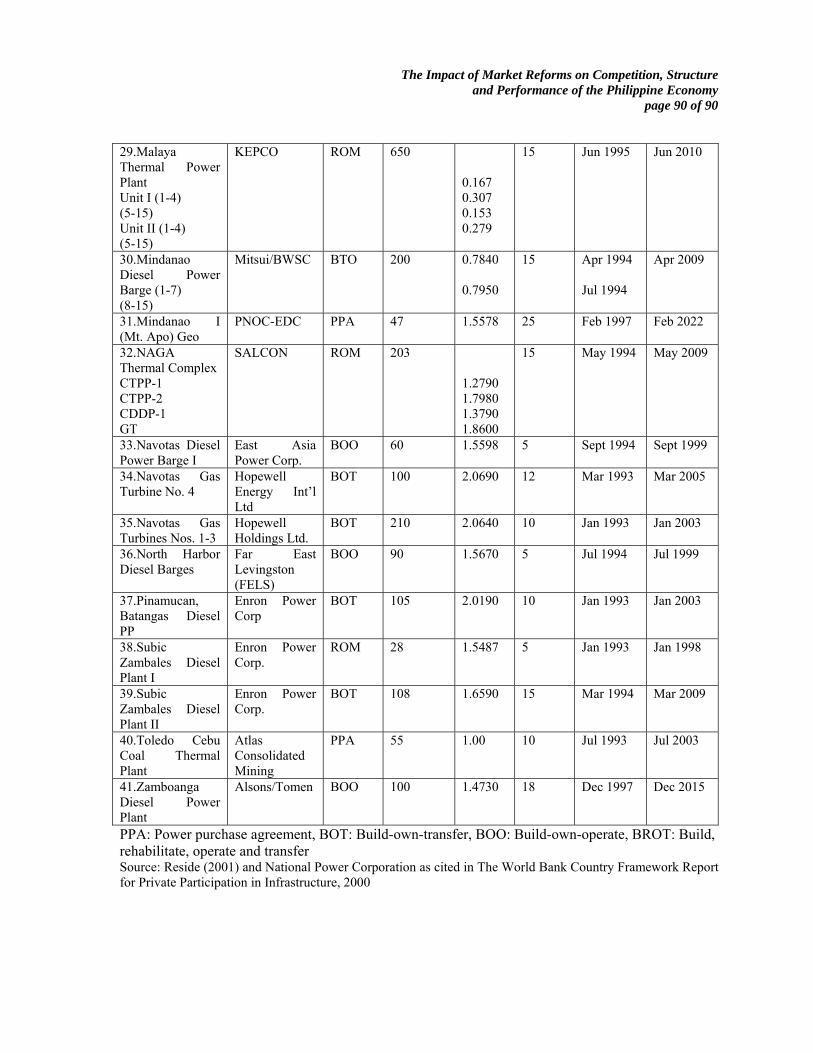
The Impact of Market Reforms on Competition, Structure and Performance of the Philippine Economy
page 90 of 90
29.Malaya Thermal Power Plant Unit I (1-4) (5-15) Unit II (1-4) (5-15)
KEPCO ROM 650 0.167 0.307 0.153 0.279
15 Jun 1995 Jun 2010
30.Mindanao Diesel Power Barge (1-7) (8-15)
Mitsui/BWSC BTO 200 0.7840 0.7950
15 Apr 1994 Jul 1994
Apr 2009
31.Mindanao I (Mt. Apo) Geo
PNOC-EDC PPA 47 1.5578 25 Feb 1997 Feb 2022
32.NAGA Thermal Complex CTPP-1 CTPP-2 CDDP-1 GT
SALCON ROM 203 1.2790 1.7980 1.3790 1.8600
15 May 1994 May 2009
33.Navotas Diesel Power Barge I
East Asia Power Corp.
BOO 60 1.5598 5 Sept 1994 Sept 1999
34.Navotas Gas Turbine No. 4
Hopewell Energy Int’l Ltd
BOT 100 2.0690 12 Mar 1993 Mar 2005
35.Navotas Gas Turbines Nos. 1-3
Hopewell Holdings Ltd.
BOT 210 2.0640 10 Jan 1993 Jan 2003
36.North Harbor Diesel Barges
Far East Levingston (FELS)
BOO 90 1.5670 5 Jul 1994 Jul 1999
37.Pinamucan, Batangas Diesel PP
Enron Power Corp
BOT 105 2.0190 10 Jan 1993 Jan 2003
38.Subic Zambales Diesel Plant I
Enron Power Corp.
ROM 28 1.5487 5 Jan 1993 Jan 1998
39.Subic Zambales Diesel Plant II
Enron Power Corp.
BOT 108 1.6590 15 Mar 1994 Mar 2009
40.Toledo Cebu Coal Thermal Plant
Atlas Consolidated Mining
PPA 55 1.00 10 Jul 1993 Jul 2003
41.Zamboanga Diesel Power Plant
Alsons/Tomen BOO 100 1.4730 18 Dec 1997 Dec 2015
PPA: Power purchase agreement, BOT: Build-own-transfer, BOO: Build-own-operate, BROT: Build, rehabilitate, operate and transfer Source: Reside (2001) and National Power Corporation as cited in The World Bank Country Framework Report for Private Participation in Infrastructure, 2000