The Impact of Liquidity on Profitability on Selected Banks of Bangladesh
78
“The Impact of Liquidity on Profitability of Selected Banks in Bangladesh”
-
Upload
samia-ibrahim -
Category
Documents
-
view
59 -
download
5
Transcript of The Impact of Liquidity on Profitability on Selected Banks of Bangladesh

“The Impact of Liquidity on Profitability of Selected Banks in Bangladesh”

Prepared by:
Samia Ibrahim
An Internship Report Presented in Partial Fulfillment of the Requirement for the
Degree Bachelor of Business Administration
Independent University, Bangladesh.
May, 2014


“The Impact of Liquidity on Profitability of
Selected Banks in Bangladesh”
Prepared by:
Md. Samia Ibrahim

Has been approved by
Md. Nayeem Abdullah
Assistant Professor
School of Business
Independent University, Bangladesh.
May 2014
Letter of Transmittal
May 22nd 2014
Mr. Nayeem AbdullahAssistant ProfessorIndependent University, Bangladesh
Subject: Submission of internship report on “The Impact of Liquidity on Profitability of Selected Banks in Bangladesh”
Dear Sir,
This is a great pleasure for me to submit my internship report on The Impact of Liquidity on Profitability of Selected Banks in Bangladesh” as a requirement for my graduation. I have prepared this report during my three months long Internship program at Mercantile Bank Limited, Khatungonj Branch, Chittagong. I was privileged to be associated with such an experienced, efficient and helpful team in such a reputed Bank. This has been a great source of learning for me and helped me a lot to achieve practical knowledge.

I have put my best effort in making this report and tried to make this report informative, practical, and relevant. I hope and believe that this report will satisfy your requirements and expectations.
However, I would like to express my sincere gratitude to you for your kind guidance, cooperation and suggestions in preparing this report which will definitely help me in future endeavors. It would be my immense pleasure if you find this report informative.
I shall be happy to provide any further query and clarification regarding this report.
Yours Sincerely,
Samia IbrahimID: 1020627 Dept: BBAIndependent University, Bangladesh

Acknowledgement
First of all I am grateful to Almighty ALLAH.
I would like to thank all my honorable faculty members, who over the years, played a big role in
grooming me into whatever I am today, especially my honorable supervisor, Mr. Nayeem
Abdullah for being so kind, cooperative, and supportive the entire time. I am grateful to him for
his valuable suggestions and time that he has spent on me in guiding me. The past few months
have been a wonderful experience for me, full of challenges and satisfaction. This has obviously
been a great source of learning for me and a transition period from a student life to professional
life.
I would like to acknowledge my great appreciation towards everyone at Mercantile Bank
Limited for being so warm in their approach and for bestowing such responsibility on me all the
while, making me feel completely at ease. A special thanks to my External Internship
Supervisor, Mr. Jashim Uddin, V.P., Head of Khatungonj Branch Mercantile Bank Limited for
giving me time and for providing me with all kinds of support by suggesting me about
completing the report.
Finally, I would like to thank all the employees of MBL who helped me in conducting my
research by taking out time for me from their extremely busy schedule to discuss on various
issues with me and making me more knowledgeable about the Banking industry. Without them I
would not have been able to complete my report.

Table of ContentsChapter Particular Page no:
Executive Summary iChapter 1: Introduction 1
1.1 introduction 21.2 Statement of the problem 21.3 Purpose of the Study 31.4 Scope of the study 31.5 Methodology 3
1.5.1 Research Design 31.5.2 Research Instrument 41.5.3 Research Sample 51.5.4 Data Sources 51.5.5 Limitations 5
Chapter 2: Banking Sector of Bangladesh 7Chapter 3: Company profile : Mercantile Bank Limited 8
3.1 Overview of Mercantile Bank Limited 14 3.1.1 Mission 15 3.1.2 Vision 15 3.1.3. Objectives 15 3.1.4 Functional Departments 16 3.1.5 Corporate Information 16
Chapter 4: Literature Review 174.0 Literature Review 184.1 Conceptual Framework 214.2 Definition of Liquidity & profitability 224.3 Independent Variables : Liquidity Ratios 22 4.3.1 Loan Deposit Ratio (LDR) 22 4.3.2 Cash Deposit Ratio (CDR) 23 4.3.3 Deposit Asset Ratio (DAR) 234.4 Dependent Variables : Profitability Ratios 23 4.4.1 Return on Asset (ROA) 24 4.4.2 Return on Equity (ROE) 24

Chapter 5: Research Objectives, Questions, Hypothesis & Hypotheses 255.1 Objectives of the Study 265.2 Research Questions & Hypothesis 265.3 Hypotheses 26
Chapter 6: Findings & Analysis 276.1 Evaluation of Profitability 286.2 Evaluation of Liquidity 296.3 Analysis of Impact on Liquidity on Profitability 33 6.3.1 Descriptive Analysis 33 6.3.2 Correlation Analysis 34 6.3.3 Regression results 35
Chapter 7: Conclusion 39
Bibliography 41Appendix 43

Executive Summary
Profitability and liquidity are the most prominent issues in the banking sector all over the world.
The ultimate goal for any organization is to maximize profitability. However, in case of banks,
too much attention on profitability may lead the bank into a pitfall by diluting the liquidity
position. It is very much important to maintain an optimum level of liquidity while generating
good amount of profit. This study is initiated to find out the relationship between liquidity and
profitability. The study five scheduled private commercial banks in Bangladesh over a period of
past 5 years from 2008 to 2012. To examine the impact of liquidity on profitability, descriptive
statistics, and correlation analysis has been executed. Profitability ratios, ROA and ROE are
assumed to be the dependent variable and the independent variables are liquidity measures, i.e.
Loan Deposit Ratio, Deposit Asset Ratio and Cash Deposit ratio. However, the descriptive
analysis has revealed that the values of standard deviation and variance of profitability ratios are
higher than those of the liquidity measures. Therefore, profitability is more volatile than liquidity
measures. The Pearson’s correlation analysis and findings suggest that there is no significant
relationship between liquidity and profitability among the selected banks in this study over the
period of observation. The regression analysis also shows that there is no significant impact of
liquidity measures on profitability. The r square of liquidity measures is found to be 0.50 and
0.46 with ROA and ROE respectively. Therefore, only 46% and 50% of the variation in ROA
and ROE can be explained by the liquidity measures.
Chapter One
Introduction

1.1. Introduction
Generally, the banking business involves mobilization of funds from the surplus units to the
deficit units in the economy of a country. While performing these functions, banks undertake
many risks and prominent among those risks is liquidity risk. Liquidity risk is the risk of loss
incurred by the bank due to its inability to meet the cash needs. It may include the cash needs for
lending and investment commitments and deposit withdrawals and liability maturates, in the
normal course of business (Amengor, 2010). The bank’s profitability depends on its ability to
generate revenue in excess of costs, withstanding negative shocks. Bank profitability is usually
expressed as a function of internal and external factors. The variables which mostly determine
bank profitability are expense management, loan composition and bank credit, composition of
bank deposits, market interest rates, bank earning and operating efficiency, changes in capital
and liquidity management.
The study will attempt to find out the impact of liquidity on profitability of some selected banks
in Bangladesh. I will consider five randomly selected banks to represent the overall banking
industry scenario of Bangladesh. The study will help to find relationship between liquidity and
profitability and suggest solutions for better profitability.
1.2 Statement of the Problem
Liquidity risk is one of the prominent risks faced by banks. Determining the optimum level of
liquidity is quite critical and important too because it can affect the banks’ performance and
profitability. This research seeks to establish a relationship between liquidity and profitability
which may assess in liquidity management in the banks in Bangladesh.

1.3 Purpose of the Study
There has been a wide range of study on the concepts of liquidity and profitability. Some studies
were made to find the interaction between the two while some were made on the proper
management of these two variables. My research differs from the previous works as such
research was not done in the context of Bangladeshi banking sector using recent data.
1.4 Scope of the Study
Liquidity is of great importance to banks because it determines the banks’ ability to meet its
current cash needs, such as payment obligation and other financial commitments. A bank is
considered to be liquid when it has sufficient cash and other short term financial instruments like
treasury bills and certificates. It has always been a matter of discussion for the banks’
management to determine how much liquid asset should be maintained. Adequate liquidity helps
banks to grab lucrative loans situations during periods of expanding economic activities. But by
maintaining surplus liquidity, the bank can lose attractive long-term investment opportunities
which might be profitable. In this research this relationship between liquidity and profitability
will be investigated.
1.5 Methodology of the Research
1.5.1 Research design
This study aimed to establish a relationship between liquidity and profitability of banks in
Bangladesh through an empirical research. The data used in this study are compiled from income
statements and cash flow statements from the annual report of each year of the selected banks.
The sample has been tested through descriptive statistics, correlation analysis and regression
analysis.

1.5.2 Research instrument
In this study, descriptive statistics has been used to compare the means of the profitability ratios
and the liquidity ratios. The trade-off between liquidity and profitability was analyzed through
Pearson Correlation Coefficient analysis and represented through correlation matrix. The
hypotheses have been tested by applying linear regression using SPSS. The profitability ratios
are the dependent variables whereas liquidity measures are the independent variable. The
variables to analyze the liquidity impact on profitability using regression analysis are as follows:
Dependent Variables:
Return on Assets = Net Income after Taxes / Total Assets
Return on Equity = Net Income after Taxes / Total Equity Capital Account
Independent Variables:
Loan Deposit Ratio = Loans and Advances / Total Deposit
Deposit Asset Ratio = Total Deposit / Total Assets
Cash Deposit Ratio = Cash & Equivalent / Total Assets
MODELS
The research model is as follows:
ROA= α1 + β11 LTD + β12 DTA + β13 CTD + Ui -----------------------model (1)
ROE = α2 + β 21 LTD + β22 DTA + β23 CTD + Ui -----------------------model (2)
α : the constant , β: the regression coefficient, Ui : error
1.5.3 Research Sample
A sample of five private commercial banks have been randomly selected and examined to find
the impact of liquidity on profitability over the period of five years during 2008 to 2012. The
selected banks are-
Bank Asia Limited
Mercantile Bank Limited
Prime Bank Limited
Eastern Bank Limited
South East Bank Limited
1.5.4 Data Sources
All the relevant data regarding the study were collected from the following sources:
Secondary source:
Annual report of the selected banks
Financial statements of the selected banks
Policy guideline of the banks
Related journal & articles.
1.5.5 Limitations
The allocated time was not sufficient to gather knowledge and to make the study a
complete and fruitful one. It was one of the main constraints that affected covering all
aspects of the study.
The data is collected from secondary sources; hence the reliability of data is questionable.

Only a small sample of five banks has been considered in this study due to lack of time.
For the lack of practical knowledge, some shortcoming may be available in the paper.
Personal barriers such as inability to understand some terms were also a limitation.

Chapter Two
Banking Sector of Bangladesh

2.1 Banking Sector of Bangladesh
The Financial sector of Bangladesh, like most in developing countries, is dominated by banking
industry. After the independence of Bangladesh in 1971, all the domestic banks were merged and
grouped into few state owned commercial banks. However, their performance was not
satisfactory in terms of profitability, customer service and overall performance. To set up a
proper regulatory system that would diagnose such problems and correct them was also tough
while the government intervention were in existence everywhere. Therefore, banking concept
like profitability, liquidity and capital adequacy were alien to bank managers. Some private
banks were allowed to operate in the market in 1980s, they begun to perform satisfactorily. Later
more private commercial banks were allowed to play in the market. At present private
commercial banks are dominant in respect of market share and profitability in the banking sector
of Bangladesh.
2.1.1 Banking System in Bangladesh
Before the independence, the branch banking system of Bangladesh is inherited from the
British colonial regime. There were 44 banks and financial institutions in operation in erstwhile
Pakistan before the partition of Indo-Pak sub-continent in 1947. After the emergence of Pakistan
in 1947, State Bank of Pakistan became the Central Bank of Pakistan in July 1948. In the whole
Pakistan there were 36 scheduled commercial banks in operation until 1971. Local business
groups of East Pakistan owned only two banks, Eastern Mercantile Bank Ltd. (presently Pubali
Bank Ltd.) and Eastern Banking Corporation Ltd. (presently Uttara Bank Ltd.) established in
1959 with headquarters in Dhaka.

After the independence, banking industry in Bangladesh started its journey with 6 nationalized
commercialized banks, 2 State owned specialized banks and 3 Foreign Banks. In the 1980's
banking industry achieved significant expansion with the entrance of private banks. Now, banks
in Bangladesh are primarily of two types:
Scheduled Banks: The banks which get license to operate under Bank Company Act,
1991 (Amended in 2003) are termed as Scheduled Banks.
Non-Scheduled Banks: The banks which are established for special and definite
objective and operate under the acts that are enacted for meeting up those objectives, are
termed as Non-Scheduled Banks. These banks cannot perform all functions of scheduled
banks.
2.1.2 Private Commercial Bank
Local private commercial bank started operation in the decades of 1980's. We can
categorize local private bank in the following manner:
First generation bank: Those established in the decades of 1980s.
Second generation bank: These banks started operation in 1990 to 1995.
Third generation bank: After 1998, these banks are established.
At present, there are thirty local private commercial banks operating in Bangladesh. PCBs
dominate the banking sector of Bangladesh. More than fifty percent of total deposits and assets
are covered by the PCBs. The performance of PCBs is much better than SCBs and DFIs in all
respects. Bangladesh‘s PCBs have quickly occupy market share at the expense of the state-
owned commercial banks (SCB) and presently grasp more than 59 percent of total deposits
whereas it is only 28 percent for the SCBs and PCBs assets coverage is 58% whereas it is only
29% in SCBs.

Table 1 and figure 1 shows the number of banks from the year 1975 to 2010. Then number of
Nationalized and Specialized Banks remained almost the same with only a little change. The
number of Foreign Banks grew up a little but decreased to 9 after the year 2000. However, the
number of private banks had a rising trend up to the year 2005. The number of private banks
increased substantially in the period from 1995 to 2000. 14 new private banks were allowed to
come into operation in this period. After the year 2000, only 3 more private banks came into the
market. The number of private banks remain unchanged after the year 2005 i.e. 30.
Number of Banks in Bangladesh from 1975 to 2010
1975 1980 1985 1990 1995 2000 2005 2010
Total Number of banks 12 14 21 24 31 49 48 47
Nationalized Banks 6 6 4 4 4 4 4 4
Specialized Banks 2 2 2 3 5 5 5 4
Private Banks 8 10 13 27 30 30
Foreign Banks 4 6 7 7 9 13 9 9
No. of bank branches 1611 3820 4943 5539 5813 6065 6412 7246
Table 1- Number of Banks in Bangladesh from 1975 to 2010
1975 1980 1985 1990 1995 2000 2005 20100
10203040
6 6 4 4 4 4 4 42 2 2 3 5 5 5 48 10 13
27 30 30
4 6 7 7 9 13 9 9
Number of Banks in Bangladesh from 1975 to 2010
Nationalized Banks Specialized Banks Private Banks Foreign Banks
Figure 1- Number of banks in Bangladesh from 1975-2010

2.1.3 The Current Structure of Financial System in Bangladesh
At present the financial system in Bangladesh is mainly comprised of two types of institutions
like banks and non-bank financial institution (NBFIs). The formal financial sector in Bangladesh
includes: (a) Bangladesh Bank as the central bank, (b) 47 commercial banks, including (c) 30
non-bank financial institutions (NBFIs) – licensed by the Bangladesh Bank; (d) A total of 62
insurance companies have been operating in Bangladesh, (e) 2 stock exchanges and, (f) Some co-
operative banks. Besides, a good number of semi-formal micro finance institutions (MFIs) also
are operating in Bangladesh.
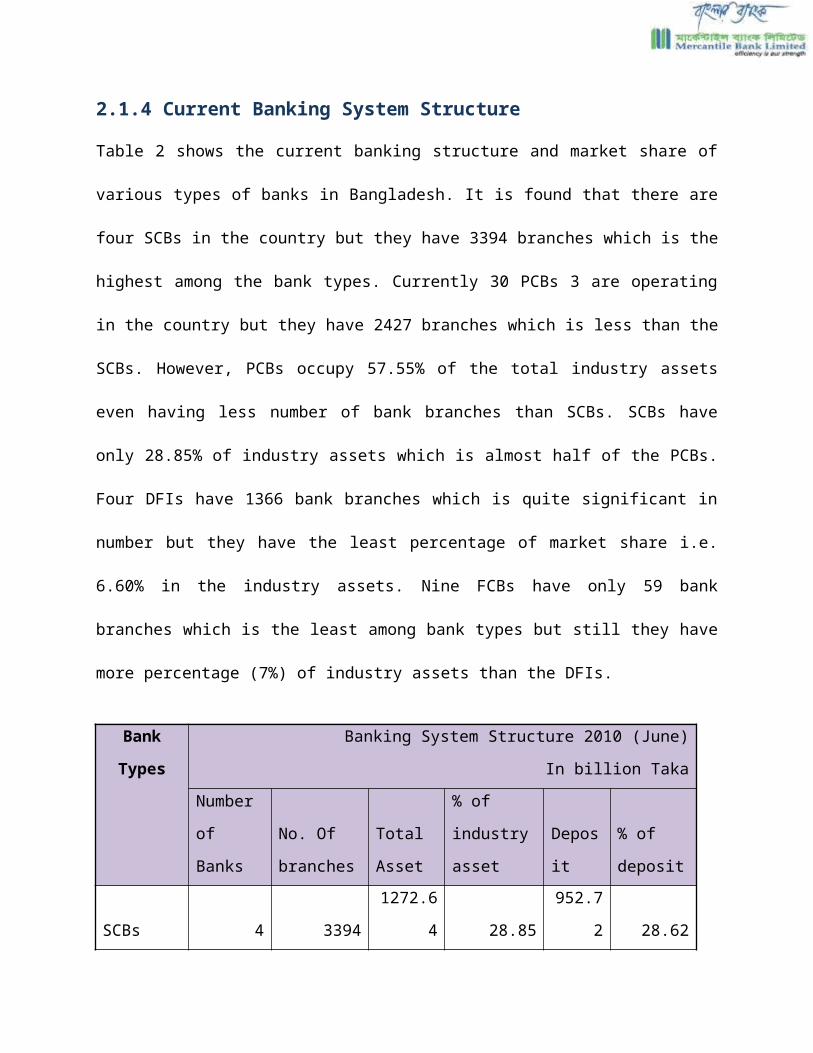
2.1.4 Current Banking System Structure
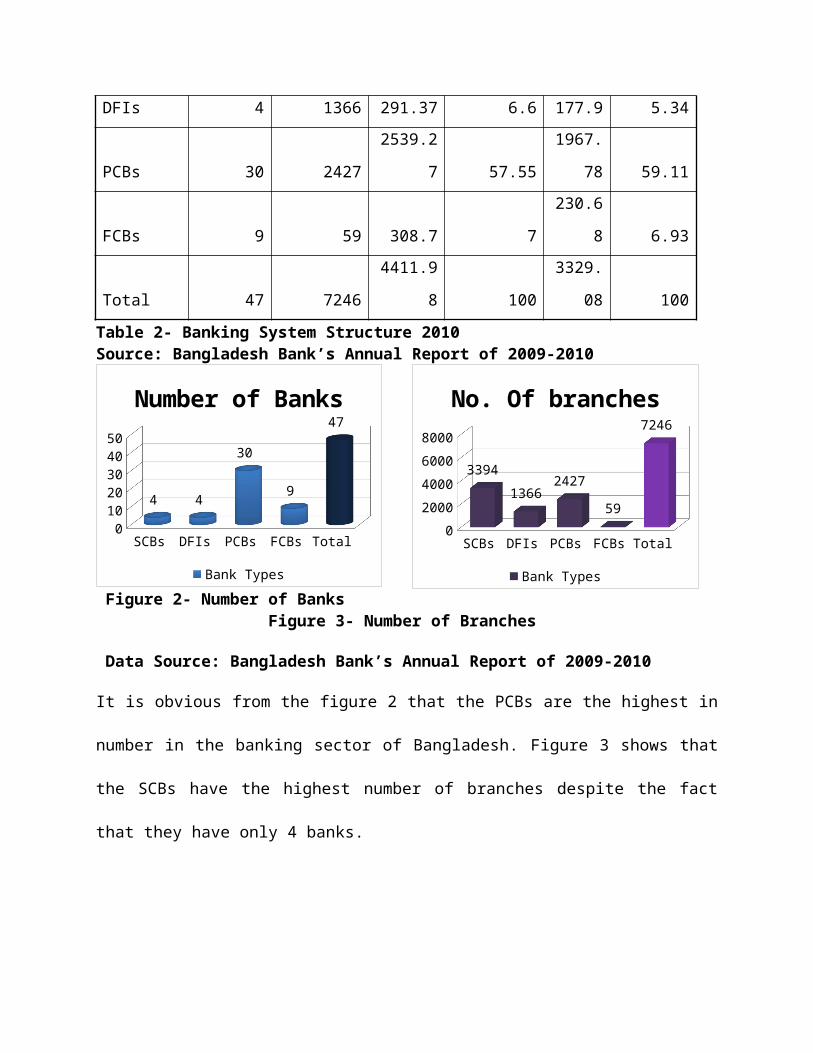
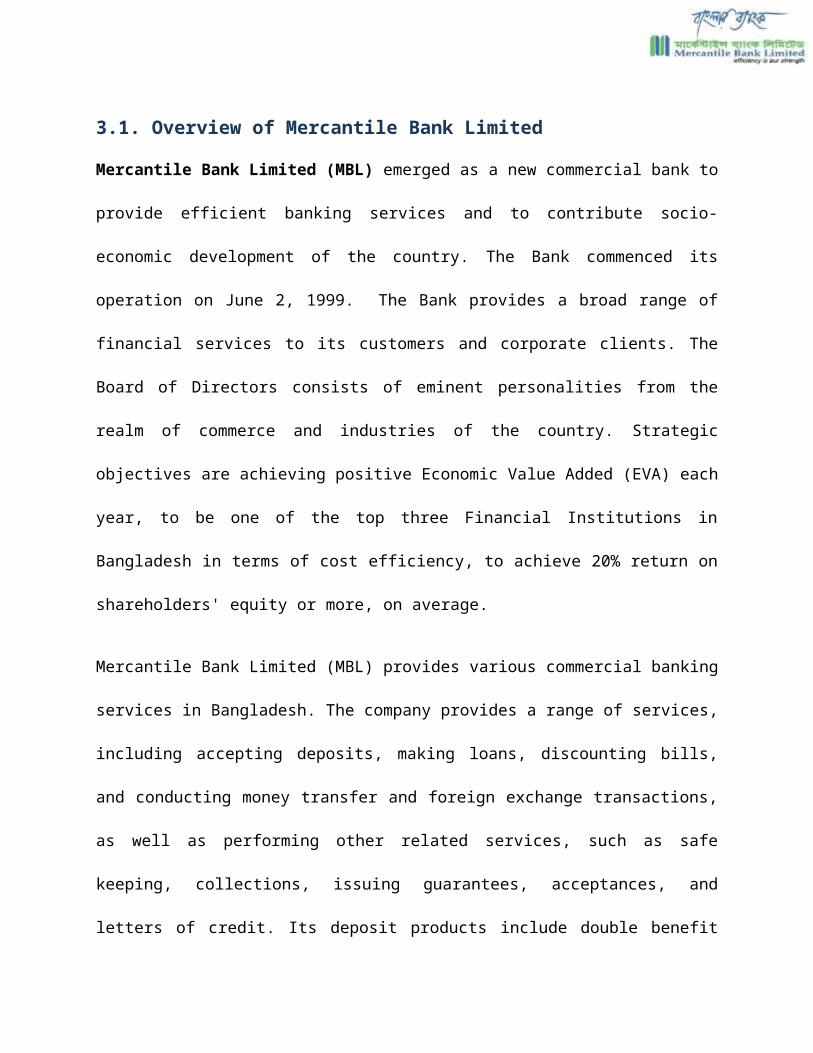
Table 2 shows the current banking structure and market share of various types of banks in
Bangladesh. It is found that there are four SCBs in the country but they have 3394 branches
which is the highest among the bank types. Currently 30 PCBs 3 are operating in the country but
they have 2427 branches which is less than the SCBs. However, PCBs occupy 57.55% of the
total industry assets even having less number of bank branches than SCBs. SCBs have only
28.85% of industry assets which is almost half of the PCBs. Four DFIs have 1366 bank branches
which is quite significant in number but they have the least percentage of market share i.e. 6.60%
in the industry assets. Nine FCBs have only 59 bank branches which is the least among bank
types but still they have more percentage (7%) of industry assets than the DFIs.
Bank
Types
Banking System Structure 2010 (June) In billion
Taka
Number
of Banks
No. Of
branches
Total
Asset
% of
industry
asset Deposit
% of
deposit

SCBs 4 3394 1272.64 28.85 952.72 28.62
DFIs 4 1366 291.37 6.6 177.9 5.34
PCBs 30 2427 2539.27 57.55 1967.78 59.11
FCBs 9 59 308.7 7 230.68 6.93
Total 47 7246 4411.98 100 3329.08 100
Table 2- Banking System Structure 2010Source: Bangladesh Bank’s Annual Report of 2009-2010
SCBs DFIs PCBs FCBs Total0
10
20
30
40
50
4 4
30
9
47
Number of Banks
Bank Types
Figure 2- Number of Banks Figure 3- Number of Branches
Data Source: Bangladesh Bank’s Annual Report of 2009-2010
It is obvious from the figure 2 that the PCBs are the highest in number in the banking sector of
Bangladesh. Figure 3 shows that the SCBs have the highest number of branches despite the fact
that they have only 4 banks.
SCBs DFIs PCBs FCBs Total0
10002000300040005000600070008000
3394
13662427
59
7246
No. Of branches
Bank Types

Chapter Three
Company Profile: Mercantile Bank Limited

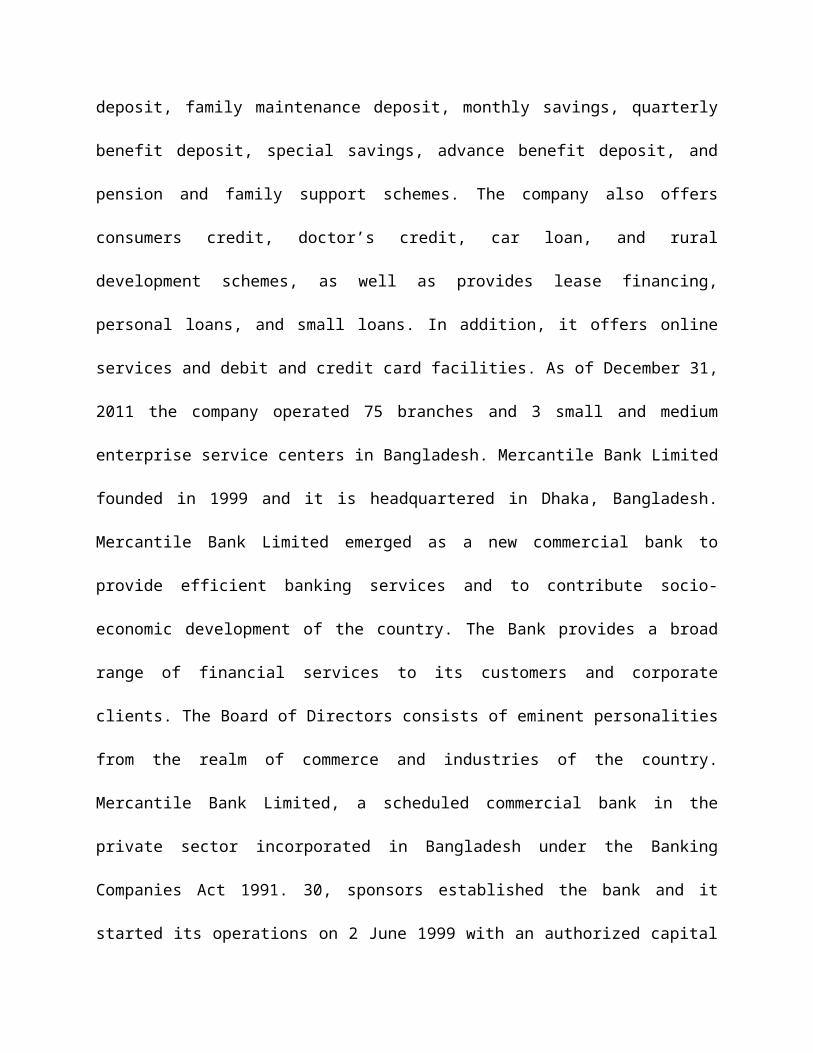
3.1. Overview of Mercantile Bank Limited
Mercantile Bank Limited (MBL) emerged as a new commercial bank to provide efficient
banking services and to contribute socio-economic development of the country. The Bank
commenced its operation on June 2, 1999. The Bank provides a broad range of financial services
to its customers and corporate clients. The Board of Directors consists of eminent personalities
from the realm of commerce and industries of the country. Strategic objectives are achieving
positive Economic Value Added (EVA) each year, to be one of the top three Financial
Institutions in Bangladesh in terms of cost efficiency, to achieve 20% return on shareholders'
equity or more, on average.
Mercantile Bank Limited (MBL) provides various commercial banking services in Bangladesh.
The company provides a range of services, including accepting deposits, making loans,
discounting bills, and conducting money transfer and foreign exchange transactions, as well as
performing other related services, such as safe keeping, collections, issuing guarantees,
acceptances, and letters of credit. Its deposit products include double benefit deposit, family
maintenance deposit, monthly savings, quarterly benefit deposit, special savings, advance benefit
deposit, and pension and family support schemes. The company also offers consumers credit,
doctor’s credit, car loan, and rural development schemes, as well as provides lease financing,
personal loans, and small loans. In addition, it offers online services and debit and credit card
facilities. As of December 31, 2011 the company operated 75 branches and 3 small and medium
enterprise service centers in Bangladesh. Mercantile Bank Limited founded in 1999 and it is
headquartered in Dhaka, Bangladesh. Mercantile Bank Limited emerged as a new commercial
bank to provide efficient banking services and to contribute socio-economic development of the

country. The Bank provides a broad range of financial services to its customers and corporate
clients. The Board of Directors consists of eminent personalities from the realm of commerce
and industries of the country. Mercantile Bank Limited, a scheduled commercial bank in the
private sector incorporated in Bangladesh under the Banking Companies Act 1991. 30, sponsors
established the bank and it started its operations on 2 June 1999 with an authorized capital of TK
800 million divided into 8 million ordinary shares of TK 100 each. On 31 December 2001, its
paid up capital was TK 596.5 million. The Vision of the bank is “Would make finest corporate
citizen.”Its mission is to become most caring, focused for equitable growth based on diversified
deployment of resources and nevertheless would remain healthy and gainfully profitable Bank.
3.1.1 Mission
“Will become most caring, focused for equitable growth based on diversified deployment of
resources, and nevertheless would remain healthy and gainfully profitable Bank”
3.1.2 Vision“Would make finest corporate citizen”
3.1.3 Objectives
Strategic objectives• To achieve positive Economic Value Added (EVA) each year.
• To be market leader in product innovation.
• To be one of the top three financial institutions in Bangladesh in terms of cost efficiency.
• To be one of the top five financial institutions in Bangladesh in terms of market share in
all significant market segment they serve.
Financial objective• To achieve 20% return on shareholders’ equity or more, on average

3.1.4 Mercantile Bank’s Functional Departments
The Mercantile Bank Limited has the following departments, which includes the whole
operations of the bank. The departments are listed below with their major section in the
following table.
Departments in Mercantile Bank Limited
Major Sections Department Name
BranchesGeneral Banking DepartmentCredit DepartmentForeign Exchange Department
Human Resources Department
Corporate OfficeInternational DivisionTreasuryIT (Information Technology)Card Division
Table 3- Departments in MBL
3.1.5 Corporate Information
HEAD OFFICE
61, Dilkusha Commercial Area Dhaka-
1000
Phone: +88-02-9559333, 9553892, 9561140 Fax:
+88-2-9561213
Swift: MBLBBDDH
E-mail: [email protected] m
Website: www.mblbd.co m

Chapter four
Literature Review

4.0 Literature Review
Banks today are under great pressure to perform- to meet the objectives of their stockholders,
employees, depositors and borrowing customers, while somehow keeping government regulators
satisfied that the bank’s policies, loans and investments are sound (Rose, 2004-2005).
Commercial banks are profit seeking organizations. Banks have to earn profits because if they
don’t, they would not work as all the shareholders would sell off the shares if proper dividends
are not earned. Hence they have to earn profits for their shareholders and at the same time satisfy
the withdrawal needs of its customers.
Bourke (1989) finds some evidence of a positive relationship between liquid assets and bank
profitability for 90 banks in Europe, North America and Australia from 1972-1981. On the other
hand, other researchers argue that, holding liquid assets imposes an opportunity cost on the bank
given their low return relative to other assets, thereby having a negative effect on profitability.
For example, Molyneux and Thornton (1992) and Goddard, et al (2004) find evidence of a
negative relationship between the two variables for European banks in the late 1980s and mid‐1990s, respectively. According to Eichengreen and Gibson (2001), the fewer the funds tied up
in liquid investments, the higher we might expect profitability to be. In effect, various authors
have found varying relationships between the liquidity and profitability of banks in various
countries.
Eljelly (2004) examined the relation between profitability and liquidity measured by current
ratio and cash gap (cash conversion cycle) on a sample of joint stock companies in Saudi Arabia
using correlation and regression analysis. They found a negative relationship between
profitability and liquidity indicators. In order to test Hirigoyen hypothesis, Pimentel et al (2005)
performed an empirical study with a sample of retailing companies in the Brazilian market for
the period of 2000 to 2003. The authors found out for the analyzed sample that the larger the
current ratios, the smaller the ROE, thus there would be a negative correlation among liquidity
and profitability on the short run.
Banks are obliged to pay cash before asset driven cash collections occur, increasing their
illiquidity (Adrian & Shin, 2009). Bank liquidity management involves a tradeoff between the
cost of attaining higher liquidity and the cost of inefficient allocation of such liquidity. Providing
financial services across borders helps to transfer liquidity to those locations where it is scarce,
but at the cost of probable inefficient fund allocation. These inefficiencies may arise from not
having enough cash to finance the maximum possible number of positive net present value,
thereby, resulting in lessened opportunities for shareholder value creation (Dietrich & Vollmer,
2010). The relationship between the liquidity and the profitability of banks listed on Ghana Stock
Exchange is presented by Lartey V, Antwi1 S, Boadi E. (2013) study. Seven out of the nine
listed banks were involved in the study. The study was descriptive in nature. It used the
longitudinal time dimension, specifically, the panel method. Document analysis was the main
research procedure used to collect secondary data for the study. The financial reports of the
seven listed banks were studied and relevant liquidity and profitability ratios were computed.
The trend in liquidity and profitability were determined by the use of time series analysis. The
main liquidity ratio was regressed on the profita
bility ratio. It was revealed that for the period 2005-2010, both the liquidity and the profitability
were droping. It was also revealed that there was a very weak positive relationship between the
liquidity and the profitability of the listed banks in Ghana.
The effect of bank capital structure and liquidity on profitability using Nigerian data during the
period from1980 to 2006 studied is presented by Uremadu S. (2012), The data were analyzed
using descriptive statistics and the auto-regressive distributed lag (ADL) model. The study
practiced data on an OLS methodology that incorporated unit root tests for stationary and co-
integration. The study found a positive impact of cash reserve ratio, liquidity ratio and corporate
income tax; and a negative effect of bank credits to the domestic economy, savings deposit rate,
gross national savings (proxy for deposits with the central bank), balances with the central bank,
inflation rate and foreign private investments, on banking system profits. They equally noticed
that liquidity ratio drive banks’ profits in Nigeria, closely followed by balances with the central
bank and then, gross national savings and foreign private investments, followed case in that
order.
Using bank level data for 80 countries in the 1988-1995 periods, a study suggested that interest
margins differences and banks‟ profitability reflect a variety of determinants such as; bank
characteristics, macroeconomic conditions, explicit and implicit bank taxation, deposit insurance
regulation, overall financial structure, and several underlying legal and institutional indicators
(Demirgüç-Kunt and Huizinga,1998). Shahchera, Mahshid (2012) analyzed the impact of
liquid asset holdings on bank profitability for a sample of Iranian banks. Applying the
Generalized Method of Moment (GMM), this study analyzed the profitability of listed banks
using unbalanced panel data over the period of 2002-2009. An important finding of this study is
that the business cycle significantly affects bank profits. The coefficient of regulation is negative
and significant. Therefore if regulators reduce the constraints imposed on banks, banks obtain
profit. Liquidity is of vital importance to the daily operations of a bank. Maintenance of a sound
liquidity position of the bank is necessary to protect the bank against uncertainties of its business.

Maintenance of liquidity bears both risk and return. A tradeoff between these two elements can
minimize the conflict between liquidity versus profitability of a bank (Islam, M. Muzahidul
(2008). As stated by Islam (2008) Koch (1992) believed that there is a short-run tradeoff
between liquidity and profitability. The more liquid a bank is, the lower are its return on equity
(ROE) and return on assets (ROA), all other things being equal. Therefore, statistical
significance of liquidity on profitability can be a great factor for potential investors. In a nutshell
the influence of banks‟ liquidity cannot be negligible when considering profit motive.
4.1 Conceptual framework
Based on the literature review discussed above, an analysis has been conducted to draw a
relationship between the liquidity and profitability of the banks in Bangladesh. The dependent
variables in this study are Return on Assets (ROA) and Return on Equity (ROE) and the
independent variables are the liquidity ratios derived for this study, i.e. Loan Deposit Ratios
(LTD), Deposit Asset Ratios (DAR), Cash Deposit Ratios (CDR).
Figure 4- Conceptualization Model
Before evaluating the impact it is a precondition to be conceptually sound about the items to be
used for measuring the performance. This part mainly deals the theoretical guideline and
definition required for understanding about different terms.
4.2 Definition of liquidity and profitability
Liquidity is the ability of the bank to convert assets into cash. It is also called marketability or
short-term solvency. The liquidity of a business bank is usually of particular interest to its short-
term creditors since the liquidity of the bank measures its ability to pay those creditors.
Profitability can be defined as the final measure of economic success achieved by a company in
relation to the capital invested in it. This economic success is determined by the magnitude of the
net profit accounting (Pimentel, 2005). The assessment of profitability is usually done through
the ROA (Return on Assets =Net Income / Total Assets) and ROE (Return on Equity = Net
Income / Equity), which is the ultimate measure of economic success.
4.3 Independent Variables: Liquidity Ratios
Liquidity Ratios are ratios that come off the Balance Sheet and hence measure the liquidity of the
bank as on a particular day i.e. the day that the Balance Sheet was prepared. Liquidity Ratios are
used to examine the liquidity risk faced by the bank. A decrease in liquidity ratio increases the
liquidity risk of the bank. The ratios that are used in this study are discusses below
4.3.1 Loan Deposit Ratio (LDR)
This ratio insures the optimality of loan and deposit. LDR calculated as:
Loan Deposit Ratio = Loans and Advances / Total Deposit
A higher loan deposit ratio indicates that a bank takes more financial stress by making excessive
loan. Therefore lower loan deposit ratio is always favorable to higher loan.
4.3.2 Cash Deposit Ratio (CDR)
Cash deposit ratio is calculated from the balance sheet data. It determines the bank’s
effectiveness in liquidity management.CDR is calculated as follows:
Cash Deposit Ratio = Cash & Equivalent / Total Deposit
Cash in a bank vault is the most liquid asset of a bank. Therefore a higher CDR indicates that’s a
bank is relatively more liquid than a bank which has lower CDR. Depositors trust to bank is
enhanced when a bank maintain a higher cash to deposit ratio.
4.3.3 Deposit Asset Ratio (DAR)
Deposit asset ratio is another traditional liquidity measure on the liability side. The ratio of
deposits to assets is calculated as:
Deposit Assets Ratio = Total Deposits / Total Assets
It indicates the broad "reliable" base of funding for the bank. This ratio establishes how much of
the bank’s assets are funded by deposits, rather than borrowed funds or equity.
4.4 Dependent Variables: Profitability Ratios
Every bank is most concerned with its profitability. Profitability ratios show a bank's overall
efficiency and performance. One of the most frequently used tools of financial ratio analysis is
profitability ratios which are used to determine the bank's bottom line. Profitability measures are
important to managers and owners alike.

Profitability ratios show a bank's overall efficiency and performance. We can divide profitability
ratios into two types: margins and returns. Ratios that show margins represent the firm's ability
to translate sales dollars into profits at various stages of measurement. Ratios that show returns
represent the firm's ability to measure the overall efficiency of the firm in generating returns for
its shareholders. In case of bank return ratios are considered to judge its profitability.
4.4.1 Return on asset (ROA)
The Return on Assets ratio is an important profitability ratio because it measures the efficiency
with which the bank is managing its investment in assets and using them to generate profit. It
measures the amount of profit earned relative to the bank's level of investment in total assets.
The return on assets ratio is related to the asset management category of financial ratios.
The calculation for the return on assets ratio is,
Return on Assets = Net Income after Taxes / Total Assets
4.4.2 Return on Equity (ROE)
This ratio indicates how profitable a company is by comparing its net income to its average
shareholders' equity. The return on equity ratio (ROE) measures how much the shareholders
earned for their investment in the company. The higher the ratio percentage, the more efficient
management is in utilizing its equity base and the better return is to investors. The calculation for
the return on assets ratio is,
Return on Equity = Net Income after Taxes / Total Equity Capital Account

Chapter fiveResearch Objectives, Questions,
Hypothesis & Hypotheses

5.1 Objectives of the Study
Evaluating the profitability of selected banks.
Evaluating the liquidity of selected banks.
Evaluating the impact of liquidity measures on profitability of the selected banks
5.2 Research Questions and Hypothesis
The research questions for this study are given below:
1. Is there any significant impact of liquidity on ROA of the selected banks?
2. Is there any significant relationship of liquidity on the ROE of the selected banks?
The following hypotheses have been formulated for the study-
H01: There is no significant impact of independent variables on dependent variable return on
asset (ROA).
HA1: There is a significant impact of independent variables on dependent variable return on asset
(ROA).
H02: There is no significant impact of independent variables on dependent variable return on
equity (ROE).
HA2: There is a significant impact of independent variables on dependent variable return on
equity (ROE).
5.3 Hypotheses
There is no significant impact of independent variables on dependent variable return on
asset (ROA).
There is no significant impact of independent variables on dependent variable return on
equity (ROE).

Chapter Six Findings & Analysis

6.0 Findings & Analysis
6.1 Evaluation of Profitability
The profitability of any business concern can be understood by analyzing the Profit And Loss
Account of that concern. Profit And Loss Account shows the revenue generated, corresponding
expenditure and the resulting profit or loss.
6.1.1 Return on asset
2008 2009 2010 2011 2012
0.700000000000001
1.72 2.22 2.18 1.871.22 1.32
1.86 1.7 1.021.3
2.372.22 2.05
1.241.68000000000
001
2.34
3.192.52
1.321.09
1.66
2.26
1.32
0.950000000000001
ROABAL MBL PBL EBL SEBL
Figure 5- Return on assets of the banks
Analysis: As we know that the Return on Assets ratio is an important profitability ratio because
it measures the efficiency with which the bank is managing its investment in assets and using
them to generate profit. Furthermore, the higher the percentage, the better, because that means
the bank is doing a good job using its assets. In this sense, over the years Bank Asia Limited
grabbed a better position than the previous considering the rise in ROA over the years with
reaching to about 1.87% in 2012 compared to 0.7% in 2008.On the other hand the ROA of

Mercantile Bank Limited, Prime Bank Limited, Eastern Bank Limited and South East Bank
Limited has increased over the year 2008 to 2010 but fell down in 2012 following 2011.
6.1.2 Return on Equity
2008 2009 2010 2011 20127.11 19.61
32.12 32.03 2317.55
18.819.84 17.95
13.4220.58
30.1921.65 20.19
13.5318.64
22.123.61
19.03
14.44
12.08
16.5119.41
10.47
8.42
ROEBAL MBL PBL EBL SEBL
Figure 6– Return on equity of the banks
Analysis: The return on equity ratio (ROE) measures how much the shareholders earned for their
investment in the company. The higher the ratio percentage, the more efficient management is in
utilizing its equity base and the better return is to investors. There was an increase in Return on
Equity for all the five banks over the year 2008 to 2010.The ROE of all the five banks shown a
downfall over the year 2011 to 2012.
6.2 Evaluation of Liquidity
These ratios signify liquidity of a bank since these ratios are important in measuring the ability of
a bank to meet both its short term and long term obligations. Hence a decrease in these ratios
increases liquidity risk of the bank. There are several measures for evaluating liquidity of a bank
appeared as follows:
6.2.1 Loan deposit ratio
2008 2009 2010 2011 2012
94% 92% 92% 87% 84%
88% 83% 88%78% 80%
85% 83% 93%87% 88%
95% 97% 104% 108% 105%
88%80%
88%84% 83%
LDR
SEBLEBLPBLMBLBAL
Axis Title
Figure 7- LDR of the banks
Analysis: From 2008 to 2010, the loan deposit Ratio of Bank Asia Limited and Mercantile Bank
Limited were very high, but it showed a slight downfall in loan deposit ratio in the years 2011
and 2012. So, it is found that Bank Asia Limited & Mercantile Bank Limited is in better
position in terms of LDR now than the previous years because a higher LDR indicates that a
bank takes more financial stress by making excessive loan. From 2008 to 2012 the LDR of Prime
Bank Limited, Eastern Bank Limited and South East Bank Limited was very high. So it is found
that these banks are not in a good position because they have higher loan deposit ratio.

6.2.2 Deposit Asset ratio
2008 2009 2010 2011 2012
79% 79% 82% 81% 78%
88% 88% 87% 88% 86%
79% 86% 81% 80% 77%
76% 70% 69% 64% 62%
85% 86% 81% 80% 90%
DAR
BAL MBL PBL EBL SEBL
Figure 8- DAR ratio of the banks
Analysis: Deposit to asset ratio is calculated from the balance sheet data. From our study, we
observe, Eastern Bank Limited and Prime Bank Limited has shown a declining trend in
deposit asset ratio from 2009 to 2012. The DAR of South East Bank Limited declined from
2009-2011 with a slight increase in 2012. This Bank has low liquidity Risk. Mercantile Bank
Limited and Bank Asia Limited maintained almost constant deposit asset ratio over the five years
while the DAR of Prime Bank Limited has been fluctuating with the least deposit asset ratio in
2012.

6.2.3 Cash Deposit Ratio
2008 2009 2010 2011 2012
10%9% 8% 9%
10%
21%26%
8% 7%10%
10%
10%
9% 9% 10%
18%
21%
15% 16%22%
11%11%
8% 10%
13%
CDRBAL MBL PBL EBL SEBL
Figure 9- CDR ratio of the banks
Analysis: Cash deposit ratio is calculated from the balance sheet data. It determines the bank’s
effectiveness in liquidity management. From our study, we observe, Bank Asia Limited has
shown a downfall in cash deposit ratio from 2009 to 2010 with a slight increase in 2011 and
2012.This Bank has low liquidity Risk. With slight increase in 2009 Mercantile Bank Limited
has shown downfall in CDR from 2010 to 2012 which is very alarming and signifies that the
bank is facing high liquidity risk. Prime Bank Limited has shown a downfall from 2010 to 2011
with a slight increase in 2012.This bank has low liquidity risk. Eastern Bank Limited has shown
downfall from 2010 to 2011 but the CDR increased in 2012.It signifies that the bank has low
liquidity risk. South East Bank has shown downfall from 2010 to 2011 with a slight increase in
2012.It has low liquidity risk.

6.3 Impact of liquidity on profitability
The dependent variable, ROA and ROE of the banks over the past five years are shown in table
10 and 11. The tables 12-14 show all the independent variables, Loan-Deposit ratio, Deposit-
Asset ratio, Cash-Deposit ratio respectively, of the banks over 2008-2012. The averages of all
the dependent and independent variables are shown in table 15 in the Appendix. These ratios are
used to examine correlation and to conduct regression analysis to show the impact of Liquidity
on Profitability of the five selected banks.
6.3.1 Descriptive Analysis
Variables N Minimum Maximum Range Mean Std. Dev. Variance
ROA 5 1.2 2.35 1.15 1.75 0.47 0.22
ROE 5 14.56 23.33 8.77 18.92 3.83 14.69
LTD 5 0.86 0.93 0.07 0.89 0.03 0.0009
DTA 5 0.79 0.86 0.07 0.82 0.03 0.0009
CTD 5 0.10 0.15 0.05 0.12 0.03 0.0009
Table 4: Descriptive Statistics of the variables.
Table 4 shows descriptive statistics for the dependent and independent variables. It illustrates the
maximum and minimum, mean, standard deviation and variance values of the dependent and
independent variables over the years under observation. The descriptive statistics reveal that the
average of the profitability ratios, ROA and ROE, are 1.75 and 18.92 respectively. The means of
the liquidity measures Loan Deposit ratio, Deposit Asset ratio and Cash Deposit ratio are 0.89,
0.82 and 0.12 respectively, which is much lower than the averages of the profitability. Similarly,
the standard deviation and variance values of profitability ratios are also found to be higher than

those of the liquidity measures. Therefore, it can be concluded that profitability is more volatile
than liquidity measures.
6.3.2 Correlation Analysis
Table 5 indicates the correlation between the dependent variables with the various independent
used in the study. As it is shown in the table, the correlation values are found to be both positive
and negative between the independent and dependent variables.
Variables ROA ROE LDR DAR CDR
ROA 1
ROE 0.96**0.01
1
LDR 0.540.35
0.530.36
1
DAR -0.670.27
-0.670.21
-0.690.20
1
CDR -0.320.60
-0.030.96
-0.210.74
-0.020.97
1
** Correlation is significant at the 0.01 level (2-tailed).Pearson Correlation Sig. (Two- tailed)
Table 5: Correlation Matrix
The R values are found to be positive between loan to deposit ratio and both the profitability
ratios, ROA and ROE (0.54 and 0.53 with ROA and ROE respectively). However, the R value of
deposit asset ratio is negative with ROA and ROE and it is -0.67 in both the cases. The R values
between cash asset ratio and ROA and ROE are -0.32 and -0.03 respectively, hence it is also
found to be negative. Therefore, there is a moderate positive correlation between loan deposit
ratio with ROA and ROE while there is a moderate negative correlation between deposit asset
ratio and profitability ratios, ROA and ROE respectively. There is a weak negative correlation
between cash deposit ratio and the profitability ratios. It can also be concluded that all the

correlations between the liquidity ratios and profitability ratios are statistically insignificant at
0.01 level.
Therefore, both the null hypotheses are accepted and the alternate hypotheses are rejected. That
is, there is no significant correlation between the liquidity ratios with ROA and ROE.
6.3.3 Regression Results
Regression analysis of ROA
To examine the research hypotheses SPSS program is used to conduct simple regression
analysis. Following tables reports the result of simple regression analysis of the independent
variables with ROA.
Regression on Return on Assets
Variable B SE B β Sig. R SquareLTD 0.65 17.90 0.04 0.98 0.50DTA -6.46 17.25 -0.37 0.77CTD -8.35 18.14 -0.41 0.73
Table 6: Regression analysis (Return on Assets)
ANOVA (Return on Assets)
Source Sum of Squares Degree of freedom
Mean of Square
F-statistics
Significance
Regression
Residual
Total
0.43
0.45
0.88
3
1
4
0.14
0.45
0.85 0.83
Table 7- Analysis of Variance

Here in table 6 ROA is dependent variable and Loan to deposit ratio, Deposit to Asset ratio and
Cash to Deposit ratio are independent variables. The table shows that deposit to asset ratio and
cash to deposit ratio are negatively associated with ROA whereas Loan to Deposit Ratio is
positively associated with ROA. At 10% level of significance the association between ROA and
independent variables – Loan Deposit ratio, Deposit Asset ratio and Cash Deposit ratio is
statistically insignificant that indicates the independent variables have no significant impact on
ROA.
The coefficient of determination reported in Table 6 by R-square indicates that 50% of the
changes in ROA can be explained by the independent variables.
Table 7 reports the results of ANOVA. The data indicates that at 10% level of significance, the
regression model as whole is found to be insignificant. The reason for the regression model to be
statistically insignificant could be use of limited data on only five banks and for five years. We
can also find that the value of F (0.85) is not significant, at α=5% and this does not support the
alternate hypothesis. Therefore, the liquidity of the selected banks in Bangladesh has no
significant influence on the profitability of the banks. There is no significant impact of
independent variables, Loan Deposit ratio, Deposit Asset ratio, and Cash Deposit ratio on the
dependent variable return on asset (ROA). Therefore, the first null hypothesis is accepted.

Regression analysis of ROE
Following tables reports the result of simple regression analysis of the independent variables
with ROE.
Regression on Return on Equity
Variable B SE B Β Sig. R Square
LTD 12.84 152.81 0.09 0.95 0.46
DTA -82.31 147.25 -0.58 0.68
CTD -10.69 154.85 -0.06 0.96
Table 8- Regression analysis (Return on Equity)
ANOVA (Return on Equity)Source Sum of Squares Degree of
FreedomMean Square F-Statistics Significance
Regression
Residual
Total
27.06
31.71
58.77
3
1
4
9.02
31.71
0.38 0.84
Table 9- Analysis of Variance
Here in table 8 ROE is dependent variable and Loan deposit ratio, Deposit Asset ratio and Cash
Deposit ratio are independent variables. The tables show that deposit asset ratio and cash deposit
ratio are negatively associated with ROE whereas Loan to Deposit Ratio is positively associated
with ROE. At 10% level of significance the association between ROE and independent variables
– Loan Deposit ratio, Deposit Asset ratio and Cash Deposit ratio is statistically insignificant that
indicates the independent variables have no significant impact on ROE.
The coefficient of determination reported in Table 8 by R-square indicates that 46% of the
changes in ROE can be explained by the independent variables.

Table 9 reports the results of ANOVA. The data indicates that at 10% level of significance, the
regression model as whole is found to be insignificant. The reason for the regression model to be
statistically insignificant could be use of limited data on only five years over a period of five
years. The result also shows that the value of F (0.38) is insignificant, at α=5%. Hence, the
independent variables do not have impact of the return on equity as well. Therefore, the second
null hypothesis is also accepted.

.
Chapter Seven
Conclusion

7.0 Conclusion
This study had attempted to investigate the impact of liquidity and profitability of the private
commercial banks in Bangladesh by focusing on certain ratios over a period of five years. Five
private commercial banks have been selected to undertake the research. Liquidity and
profitability in private commercial banks are two sensitive issues in the operations of the banks
and the information on these two are seriously hoarded. Consequently, a study on these two
issues is quite difficult. However, the major concern of this study was to figure out if the amount
of liquidity maintained by the banks effect their profitability as these two issues are much
important to the main stakeholders of the banks. The shareholders desire maximum profitability
as a return on their investment, while the depositors opt for a maximum liquidity as a guarantee
for safety and ability to pay their money on demand. The research carried out several analyses to
test the impacts of the variables and found that there is no significant relationship. The
correlation values have been found to be negative between return on assets and return on equity
with cash to deposit ratio and deposit to asset ratio respectively. But the correlation between
ROA and ROE with loan to deposit ratio has been found positive according to the correlation
matrix. The simple regression test was conducted to test the hypotheses. The test also showed
that the liquid ratios are negatively correlated with all the profitability measures. Hence, null
hypothesis is accepted and alternate hypothesis is rejected. That is, there is no significant
relationship between liquidity and profitability among the selected banks. That means that
profitability in the banks is not significantly influenced by liquidity maintained and vice versa.

Bibliography
I. Adrian, T. & Shin, H. S. (2009) “Money, Liquidity, and Monetary Policy,” American
Economic Review, vol. 99(2), p. 600-605
II. Amengor, E. C. (2010). Importance of Liquidity and Capital Adequacy to Commercial
Banks”. A Paper Presented at Induction Ceremony of ACCE, UCC Campus, 14 (2), 49-58.
III. Annual Report (2008-2012) of Mercantile Bank Limited
IV. Annual Report (2008-2012) of Bank Asia Limited
V. Annual Report (2008-2012) of Prime Bank Limited
VI. Annual Report (2008-2012) of Eastern Limited
VII. Annual Repot (2008-2012) of South East Bank Limited
VIII. Annual Report 2008-2012, Bangladesh Bank, Dhaka.
IX. Bourke, P., (1989), "Concentration and other Determinants of Bank Profitability in
Europe". Journal of Banking and Finance, pp65-80.
X. Dietrich, D., & Vollmer, U. (2010) “International Banking and Liquidity Allocation:
Cross-border Financial Services vs. Multinational Banking,” Journal of Financial Services
Research, vol. 37, p.45-69.
XI. Eichengreen, B. and H.D. Gibson (2001). “Greek banking at the dawn of the new
millennium.” CERP Discussion Paper 2791.
XII. Eljelly, A. (2004). Liquidity – profitability tradeoff: an empirical investigation in an
emerging market. IJCM, 14 (2), 48-61.
XIII. Goddard, J., Molyneux, P. & J.O.S. Wilson (2004). "Dynamics of Growth and Profitability
in Banking," Journal of Money, Credit and Banking 36, 1069-1090.

XIV. Islam, M. Muzahidul (2008). Liquidity Management. Text Book on Islamic Banking, 2nd
Edition,November, pp.101-111. Dhaka (Bangladesh): Islamic Economics Research
Bureau.
XV. Lartey V., Antwi1 S., Boadi E. (2013), “The Relationship between Liquidity and
Profitability of Listed Banks in Ghana.”International Journal of Business and Social
Science, Vol. 4 No. 3; PP. 71-86.
XVI. Molyneux, P. & J. Thornton (1992), “Determinants of European Bank Profitability: A
Note,” Journal of Banking and Finance, Vol. 16, No. 6, pp. 209-19.
XVII. Pimentel, R. C., Braga, R., & Casa Nova, S. P. C. (2005). Interação entre rentabilidade e
liquidez: um estudo exploratório. Revista de Contabilidade do Mestrado em Ciências
Contábeis da UERJ, Rio de Janeiro – 10 (2), PP. 83-98.
XVIII. Rose, Peter S. (2004-2005). Commercial Bank Management, pp.149-198. U.S.A:
Irwin/McGraw-Hill Companies.
XIX. Shahchera, Mahshid (2012). The Impact of Liquidity Asset on Iranian Bank Profitability.
International Conference on Management, Behavioral Sciences and Economics Issues
(ICMBSE'2012), pp. 131-135. Penang, Malaysia.
XX. Uremadu S. (2012), “Bank Capital Structure, Liquidity and Profitability Evidence from the
Nigerian Banking System.” International Journal of Academic Research in Accounting,
Finance and Management Sciences, Volume 2, Issue 1 (2012) ISSN: 2225-8329.

Appendix
Table 10– ROA of the banksBanks 2008 2009 2010 2011 2012Bank Asia 0.70 1.72 2.22 2.18 1.87Mercantile Bank
1.22 1.32 1.86 1.70 1.02
Prime Bank 1.30 2.37 2.22 2.05 1.24EBL 1.68 2.34 3.19 2.52 1.72Southeast Bank 1.09 1.66 2.26 1.32 0.95
Table 11- ROE of the banksBanks 2008 2009 2010 2011 2012Bank Asia 7.11 19.61 32.12 32.03 23.00
Mercantile Bank
17.75 18.80 19.84 17.95 13.42
Prime Bank 20.58 30.19 21.65 20.19 13.53EBL 18.64 22.10 23.61 19.03 14.44Southeast Bank 12.08 16.51 19.41 10.47 8.42
Table 12- Loan to Deposit Ratio of the banksBanks 2008 2009 2010 2011 2012Bank Asia 0.94 0.916 0.92 0.87 0.84Mercantile Bank 0.88 0.83 0.88 0.78 0.71Prime Bank 0.85 0.83 0.93 0.87 0.88EBL 0.95 0.97 1.04 1.08 1.05Southeast Bank 0.88 0.80 0.88 0.84 0.83

Table 13: Deposit to Asset Ratio of the banksBanks 2008 2009 2010 2011 2012Bank Asia 0.79 0.79 0.82 0.81 0.78Mercantile Bank
0.88 0.88 0.87 0.88 0.86
Prime Bank 0.79 0.86 0.81 0.80 0.77EBL 0.76 0.70 0.69 0.64 0.62Southeast Bank 0.85 0.86 0.81 0.80 0.90
Table 14- Cash and Equivalent to Deposit Ratio of the banksBanks 2008 2009 2010 2011 2012Bank Asia 0.10 0.09 0.08 0.09 0.10Mercantile Bank
0.21 0.26 0.08 0.07 0.10
Prime Bank 0.10 0.10 0.09 0.09 0.10EBL 0.18 0.21 0.15 0.16 0.22Southeast Bank 0.11 0.11 0.08 0.10 0.13
Table 15- Average value of all the variablesRatios 2008 2009 2010 2011 2012Average ROA 1.198 1.882 2.35 1.954 1.36Average ROE 15.323 21.442 23.326 19.934 14.562Average LDR 0.9 0.869 0.93 0.888 0.862Average DAR 0.814 0.818 0.80 0.786 0.862Average CDR 0.14 0.15 0.10 0.10 0.13