Globalisation, Living Standards and Inequality Recent Progress and Continuing Challenges

THE IMPACT OF LIBERALISATION AND
GLOBALISATION ON INCOME INEQUALITY IN
DEVELOPING AND TRANSITIONAL ECONOMIES
GIOVANNI ANDREA CORNIA
CESIFO WORKING PAPER NO. 843CATEGORY 5: FISCAL POLICY, MACROECONOMICS AND GROWTH
JANUARY 2003
PRESENTED AT CESIFO CONFERENCE ON GLOBALISATION,INEQUALITY AND WELL-BEING, NOVEMBER 2002
An electronic version of the paper may be downloaded• from the SSRN website: www.SSRN.com• from the CESifo website: www.CESifo.de

CESifo Working Paper No. 843
THE IMPACT OF LIBERALISATION AND
GLOBALISATION ON INCOME INEQUALITY IN
DEVELOPING AND TRANSITIONAL ECONOMIES
Abstract
This paper reviews changes in global, between-country and within-country inequality over1980-2000 against the background of the shifts that occurred in this area during theglobalisation of 1870-1914. The paper finds that recent changes in global and between-country inequality are not marked and depend in part on the conventions adopted for theirmeasurement. In contrast, within-country inequality appears to have risen clearly in two thirdsof the 73 countries analyzed mainly because of the policy drive towards domesticderegulation and external liberalisation. The paper concludes by analysing the differencesbetween the inequality changes observed during 1980-2000 and 1870-1914.
JEL Classification: D31, F02.
Giovanni Andrea CorniaUniversity of FlorenceFaculty of Economics
Via Curtatone 150123 Firenze
The author gratefully acknowledges the financial support received from the InternationalPolicy Group of the ILO for the preparation of this paper. He also would like to thankFrançois Bourguignon for sharing with him an unpublished draft of his 2001 paper withChristian Morisson.

1
The impact of liberalisation and globalisationon income inequality in developing and transitional economies1
byGiovanni Andrea Cornia2,
University of Florence
I. INTRODUCTIONOver the last two centuries, the world economy has become substantially moreunequal. The last twenty years – the years of the second globalisation – havewitnessed some slow down in this secular trend owing to the partial convergence ofthe incomes per capita of South East Asia, coastal China and part of urban Indiatowards that of the advanced nations. They have also witnessed, however, an increasein the income gap between the advanced nations and all other developing andtransitional countries, as well as a worrying reversal in many nations of past trendstowards lower domestic inequality. While the debate on the causes of such changes isnot over yet, initial evidence shows that they are in part due to the spread of the new‘global market paradigm’.
Such paradigm advocates the removal of barriers to international trade in goods andservices, the opening up to foreign direct investments, the liberalisation of short-termportfolio flows, the creation of a standardised patent regime regulating technologytransfers and intellectual property (now embodied in the TRIPS agreement of theWTO) and the simplification of all norms on travel, visa, payment systems and so onregulating international exchange. In contrast, liberalisation of the international labourflows remains off the policy agenda and since the early 1980s migration to Europe hasslowed considerably due to the growing legal restrictions.
The globalisation of the world economy was preceded and made possible by theliberalisation of domestic markets that began in the early 1980s in many countries. Forinstance, the rise in foreign investments of the 1990s often consisted in the acquisitionby multinational firms of state-owned enterprises and would not have taken placewithout their prior privatisation and the parallel liberalisation of the labour market thatallowed large job cuts in privatised firms. Likewise, the surge in short-term portfolioflows of the 1990s would not have occurred without the liberalisation of the domesticfinancial markets during the 1980s. Thus, both theoretically and empirically, it is oftenimpossible to separate the effects of globalisation from those of domesticliberalisation and we shall not try to do so in this paper.
The advocates of ‘the global market paradigm’ claim that this approach causes areduction in domestic prices, offers major opportunities for export to the poor nations,channels world savings to countries with low capital accumulation but high rates ofreturn on investment, accelerates the transfer of modern technology to backwardcountries and – as a result of all this - improves global economic efficiency. They also
1 The author gratefully aknowledges the financial support receied from the InternationalPolicy Group of the ILO for the preparation of this paper.2 The author would like to thank Francois Bourguignon for sharing with him an unpublished draft of his2001 paper with Christian Morisson.

2
claim that liberalisation improves global income distribution thanks to theequalisation of factor prices across nations and the convergence of the income percapita of poorer countries with those of the advanced nations. While inequality mayworsen in the advanced countries importing labour-intensive goods, it is expected tofall in the poor nations and on the global scale.
Against such background, the paper reviews the trends in global, between-country andwithin-country inequality over the last twenty years. To place such trends intohistorical perspective, the paper first analyses the changes in income concentrationduring the first wave of globalisation of 1870-1912 so as to emphasise similarities anddifferences observed over these two periods. The paper then shows that thepredictions of the standard theory about the changes due to the liberalisation of theworld economy often collide with a substantial and growing body of statisticalevidence that shows that, over the last two decades, global inequality has risen andthat past declines in within-country inequality have been reversed since the early1980s. Finally, the paper explores the possible causes of these changes byemphasising in particular the linkages between liberalisation, globalisation andincome distribution. Conclusions follow.
2. GLOBAL INCOME DISTRIBUTION IN HISTORICAL PERSPECTIVENo doubt, the years 1870-1914 witnessed an unprecedented economic integrationbetween the countries of the Old and New World. Thanks to a decline in transportcosts and to cuts in the pre-1870 tariff rates, the ratio of exports plus imports to GDProse steadily in all countries of the Old and New World3 while commodity prices inthe different markets converged sharply – with price gap cuts of 81 percent (Lindertand Williamson 2001). Meanwhile capital markets became much more integrated andinternational lending from Great Britain, France and Germany to the New World and afew Asian countries increased 20 times between the mid 1850s and 1914 (Anderson1999). Finally, during this period, 60 million of mostly unskilled people migratedfrom the European periphery to the New World. The main impact of inequality ofthese changes is reviewed hereafter to help to put into perspective the impact of thecurrent wave of globalisation.
To start with, a massive increase in migration and international trade among the now-developed countries led to a substantial convergence in their average incomes percapita. The wage and income gap between the countries of the Old and New Worldwere reduced markedly, as globalisation increased the relative demand for and theremuneration of the abundant factors and reduced that of the scarce factors(Williamson 1996, Andersen 1999). Mass migration from the periphery of Europe tothe New World appears to explain most (some eighty- percent) of the drop in the NewWorld-Old World wage gap between 1870 and 1914 (ibid.). Trade expansionaccounted for another 30 percent while the capital flows from the comparatively poorOld World to the comparatively rich New World generated a modest disequalizingeffect.
Second, globalisation caused a rise in within-country inequality in the rich countries ofthe New World and a fall in the poor Old World countries (Anderson 1999). In Great 3 The only exception was the US where the trade/GDP ratio remained constant over this period.

3
Britain, Ireland and Sweden, the ratio of unskilled wages to farm rents per acre rosefollowing a drop in the supply of unskilled labour due to migration and growinglabour demand in the export-led manufacturing sector and to a fall in the prices ofagricultural products due to cheap imports. The opposite effects obtained in the NewWorld. Indeed, as predicted by the standard trade theory, free trade drove up thereturns to land in the commodity-exporting New World and to labour in themanufactures-exporting Old World. Ceteris paribus, these changes had a disequalizingeffect in the first region and an equalising effect in the second. Likewise, migrationdrove up unskilled wages and down the rental-wage ratio in the Old World but causedthe opposite effect in the New World. In addition, as migrants were mostly unskilled,migration caused a reduction in the skilled–unskilled wage differential in the OldWorld but a rise in the same ratio in the New World. In turn, the flow of Europeaninvestments to the New World partially offset the local fall in unskilled wages, as theymoderated the decline in returns to a growing supply of unskilled labour, and soretarded the rise in wage inequality, while having the opposite effects in the OldWorld countries that exported capital.
Williamson (1996) suggests that such trends – the relative decline in the wages ofunskilled workers in North America and the relative fall in the incomes of landownersin Europe – were at least partially responsible for the retreat from globalisation duringthe inter-war period. He warns that – as similar trends are re-emerging at the end ofthe 20th century – the world may retreat again from its drive towards globalisation.
Third, convergence of real wages among the countries on the opposite sides of theNorth Atlantic was accompanied by a sharp divergence between the their wage rateand that of the colonial nations. As observed also over 1980-2000, the globalisation of1870-1914 remained confined to a limited number of nations and did not manage tointegrate into the world economy the now-developing countries. These were fullybypassed by the expansion of trade, capital and modern technology i.e. factors thatpromote growth and convergence, while migrants from these countries were kept outof the centre by restrictive migration policies and the high cost of the move. Worldlabour markets were in fact as segmented then as they are today. The limited data ongrowth for countries such as India, China, Indonesia, Brazil, Mexico and Argentinaconfirm that – except for the latter country - these economies experienced much lowerrates of growth and higher growth volatility than the now-developed countries (ibid.).The reasons for this divergence are not yet fully understood but have likely to do withdomestic factors – such as lack of infrastructure and limited human capital – andinternational factors such as the global division of labour under colonial rule andasymmetric access to international markets.
Fourth, as a result of this growing divergence between the now-developed and thenow-developing countries and of the mixed inequality changes within countries,global inequality rose steadily throughout the period 1870-1914 (Bourguignon andMorisson 2001).
3. CHANGES IN GLOBAL AND BETWEEN COUNTRY INEQUALITYThe global income distribution is the distribution of per capita income among thecitizens of the world. It can be decomposed into the distribution of average income percapita between countries (the between-country distribution of income) and the

4
distribution of income per capita within countries (the within-country distribution ofincome). Most studies on the global inequality suggest that between-country incomedifferences explain 60-90 percent of the total income variation among the citizens ofthe world (depending on the inequality measure chosen) and that variations in thedistribution of income within countries explain the remaining 10-40 percent4.Analyses of time trends in global inequality over the last twenty years can be groupedas follows:
- a first group of studies confines itself to the analysis of population-weighted changesin national-currency GDP or GNP per capita5 converted into US dollars at the marketexchange rates. Most of these studies underscore that while over the last 30 yearsseveral East Asian nations converged towards the average income per capita of theOECD group, the majority of the developing countries further diverged from it and so 4 This was not true before the industrial revolution when most of global inequality was explained bywithin-country inequality (see the data for 1820 and 1870 in Table 2)
5 Conclusions about the level of and changes in global inequality depend also on the approach adoptedfor its measurement and, in particular, on whether the comparisons:
• are carried out on the basis of GDP-GNP/capita (that is derived from the National Accounts) ordisposable income per capita (that is derived from Household Income and Expenditure Surveys).The two concepts differ considerably. While both include imputations for incomes in kind, GNP/calso comprises undistributed profits and operating surpluses, the depreciation of capital stock,changes in inventories and public expenditure. As a result, estimates of income/c based on GDP/care always substantially bigger (up to a factor of 3) than survey-based estimates. Thus estimates ofglobal inequality are always much bigger (by up to 15-20 Gini points) when they are derived fromGDP/c data. Finally, the ratio of income/c to GDP/c declines with the increase in GDP/c.Differences over time in inequality estimates based on the two concepts are thus not constant;
• make use of market exchange rates or of Purchasing Power Parity (PPP) exchange rates. It is wellknown that PPP exchange rates are higher. Thus, conversion of national incomes into US dollars bymeans of PPP exchange rates leads to a lower estimate of the income gap between developed anddeveloping countries and to lower estimates of global inequality;
• on whether inter-national comparisons of GDP/c or income/c take into account the differentpopulation size of the countries compared with each other;
• implicitly assume that all citizens of one nation have the same income per capita or use syntheticstatistics of the distribution of income (such as the Gini or Theil coefficients), or micro-datadepicting in detail the distribution of income/c. The use of synthetic statistics of inequality iscommon in studies of global income inequality. But this approach does not provide a goodapproximation of the real distribution of household incomes/c. Indeed, the Gini coefficients areseldom computed on the basis of random samples or account for differences in householdcomposition. In addition, they often rely on expenditure or consumption data, rather than incomedata, with the result that the shape of the income distribution and overall inequality are beingartificially compressed. Evidence suggests that, survey-based Gini coefficients systematicallyunderstate the extent of inequality of the distribution of individual incomes in most countries;
• treat large ‘highly dualistic’ countries such as China and India as a single nation, two separate sub-nations (each comprised of the urban and the rural sector) or as multiple regions (as, for instance, inthe case of China which is often separated in this kind of studies into its Inner, Middle and Coastalareas, i.e. regions that have grown at very different rates. Treating these different segments of alarge economy as separate entities increases between-country inequality.

5
contributed to a rise in global inequality. Results along these lines were obtained by anUNCTAD (1997) study on changes in the population-weighed distribution of averageGDP per capita in current US dollars for 124 countries representing 93.6 of the worldpopulation. The study shows that the Gini coefficient of the global income distributionrose from 0.68 in 1980 to 0.74 in 1990 largely because of an increase in the incomeshare of the countries with the richest 10 percent of the world population.
Similar conclusions were reached by the 1999 Human Development Report (UNDP1999) which attributes this disequalizing trend to the rapid changes induced byglobalisation. The Report analyses changes in the population-weighed distribution ofGDP per capita converted into dollars at current exchange rates and finds thatbetween-country inequality rose in recent years as the income gap between the fifth ofthe world’s people living in the richest countries and the fifth living in the poorestones rose from 30 to 1 in 1960 to 74 to 1 in 1997. The Gini coefficient consistent withthese data rose from 0.71 in 1980 to 0.75 in 1995 (Dowrick and Akmal 2001).
These studies make use of market exchange rates to convert GDP/c in nationalcurrencies into US dollars and have been criticised because the ‘traded sector bias’implicit in this approach raises the estimates of global inequality. Some authors(Schultz 1998) have shown, in fact, that between-country inequality is lower and mayfall over time when national-currency GDP/c are converted into dollars by means ofPPP exchange rates. Dowrick and Akmal (2001) note, however, that analyses basedon PPP-exchange rates are themselves subject to another bias - the ‘substitution bias’6
– that lowers artificially the level of global inequality and its trend over time7. Theytherefore compute a new distribution of between-country income per capita makinguse of the Afriat true index and find that the Gini coefficient of such distribution risesslightly over time, from 0.615 in 1980 to 0.623 in 1993. By adding a component forchanges in within-country inequality, they obtain a Gini coefficient of the globalincome distribution that appears to have risen from 0.698 to 0.711 (equal to amoderate 1.7 percent increase) over the same period. Other inequality measures(Theil, the squared coefficient of variation and the variance of logs) however showbigger inequality increases of between 5 and 8.7 percent.
- A second - less numerous - group of studies is concerned with the distribution ofincome among individuals, so as to account for changes in income per capita bothbetween and within countries. This is important, as even if between-country inequalityrises (falls), world inequality may decline (increase) if within-country inequality falls(rises) in the large countries. Most of these analyses, however, do not make use ofsurvey data, which alone can provide precise information on the shape of the income 6 In the PPP conversion method, the many services consumed by people in low-income countries areassigned US prices (which are much higher than those in developing countries). But, in developingcountries, these services are consumed not because consumers are rich but because their local price islow. The GDP/c level obtained through the PPP method is thus inconsistent with the observedconsumption structure and causes an artificial substitution in the consumption structure of low-incomepeople.7 The decline in inequality over time does not follow from differences between market and PPPexchange rates. The authors attribute it to the fact that country price structures between developingcountries and the USA have become less and less similar over the last twenty years or so.
6
distribution, but rely instead on synthetic inequality indexes (such as the Gini or Theilcoefficients or quantile shares) and assumptions to estimate the shape of a country’sincome distribution (the most common being that all distributions are log-normal).
One of such studies by Korzeniewicz and Moran (1997) analysed changes in the worlddistribution of GNP per capita at current exchange rates in 46 nations accounting for68 percent of the world population over the period 1965-92. They concluded that theworld income distribution became more skewed, with the Gini index rising from0.749 to 0.796 and the Theil index soaring from 1.15 to 1.32. A decomposition of thelatter index showed that between country inequality accounted respectively for 79 and86 percent of the world inequality in 1965 and 1992, while within-country inequalitydeclined proportionately. Similar results are arrived for the period 1960-89 by Schultz(1998) who used data on GDP per capita (converted at current exchange rates) for 120countries. The Gini index rose steadily from 0.64 and 0.72 and the Theil index from1.51 to 2.14. However, when converting GDP per capita at PPP-exchange rates, worldinequality increased between 1960 and 1968 but declined between then and 1989. Inthe later period, convergence in inter-country income per capita more than offset theincrease in within-country inequality. However, when China was excluded from thesample, the decline in global inequality after 1975 was no longer evident.
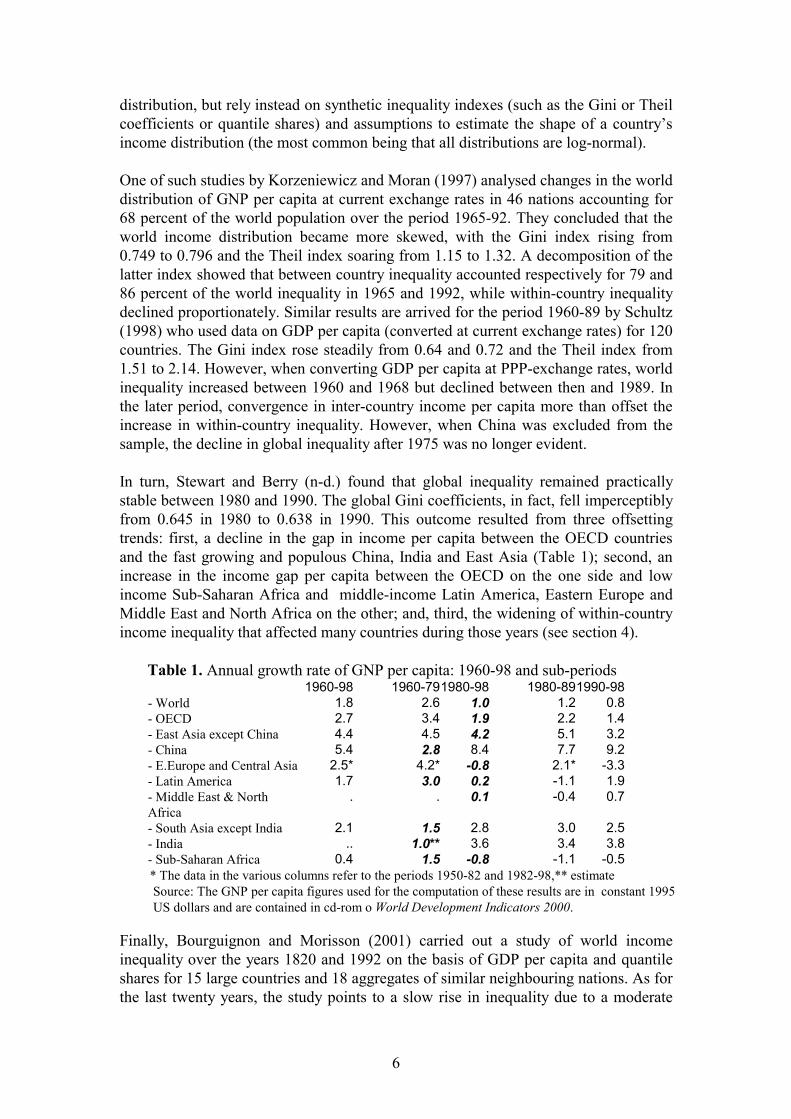
In turn, Stewart and Berry (n-d.) found that global inequality remained practicallystable between 1980 and 1990. The global Gini coefficients, in fact, fell imperceptiblyfrom 0.645 in 1980 to 0.638 in 1990. This outcome resulted from three offsettingtrends: first, a decline in the gap in income per capita between the OECD countriesand the fast growing and populous China, India and East Asia (Table 1); second, anincrease in the income gap per capita between the OECD on the one side and lowincome Sub-Saharan Africa and middle-income Latin America, Eastern Europe andMiddle East and North Africa on the other; and, third, the widening of within-countryincome inequality that affected many countries during those years (see section 4).
Table 1. Annual growth rate of GNP per capita: 1960-98 and sub-periods1960-98 1960-791980-98 1980-891990-98
- World 1.8 2.6 1.0 1.2 0.8- OECD 2.7 3.4 1.9 2.2 1.4- East Asia except China 4.4 4.5 4.2 5.1 3.2- China 5.4 2.8 8.4 7.7 9.2- E.Europe and Central Asia 2.5* 4.2* -0.8 2.1* -3.3- Latin America 1.7 3.0 0.2 -1.1 1.9- Middle East & NorthAfrica
. . 0.1 -0.4 0.7
- South Asia except India 2.1 1.5 2.8 3.0 2.5- India .. 1.0** 3.6 3.4 3.8- Sub-Saharan Africa 0.4 1.5 -0.8 -1.1 -0.5
* The data in the various columns refer to the periods 1950-82 and 1982-98,** estimate Source: The GNP per capita figures used for the computation of these results are in constant 1995 US dollars and are contained in cd-rom o World Development Indicators 2000.
Finally, Bourguignon and Morisson (2001) carried out a study of world incomeinequality over the years 1820 and 1992 on the basis of GDP per capita and quantileshares for 15 large countries and 18 aggregates of similar neighbouring nations. As forthe last twenty years, the study points to a slow rise in inequality due to a moderate

7
and unstable increase in between-country inequality, and to a rise of within-countryinequality (Table 2). It is worth nothing that this study shows also that within-countryinequality declined between 1950 and 1970 and then surged in the subsequent period– a finding confirmed also by the detailed review of the within-country inequalitytrends carried out in section 4.
Table 2. Evolution of the global distribution of income and of the distribution ofwithin- and between-country inequality, 1820-1972
1820 1870 1910 1950 1960 1970 1980 1992Gini Coefficient (global inequality) 0.500 0.560 0.610 0.640 0.635 0.650 0.657 0.657
Theil CoefficientInequality within country groups 0.462 0.484 0.498 0.323 0.318 0.315 0.330 0.342Inequality between country groups 0.061 0.188 0.299 0.482 0.458 0.492 0.499 0.513Total (global) inequality 0.522 0.672 0.797 0.805 0.776 0.808 0.829 0.855
Mean logarithmic deviationInequality within country groups 0.370 0.382 0.399 0.303 0.300 0.304 0.321 0.332Inequality between country groups 0.053 0.162 0.269 0.472 0.466 0.518 0.528 0.495Total (global) inequality 0.422 0.544 0.668 0.775 0.766 0.823 0.850 0.827Source: Bourguignon and Morisson (2001)
Finally, Sala-i-Martin (2002) reconstructs the global income distribution by adding upthe national income distributions of 125 countries for the period 1970-98. To do so, heestimates the yearly national income distribution for the period 1970-98 of 78countries for which several datapoints on the income shares were available. For 29nations with only one datapoint, he assumed that the income shares remained constantthroughout 1970-98. Finally, for 28 countries with no information whatsoever, heassumed a perfectly egalitarian distribution over the entire period. These heroicassumptions allow him to estimate a Gaussian kernel density function for every yearand country and – by adding up these individual density functions – to derive theglobal income distribution as well as the distribution of income between-countries andwithin-countries. The results in Table 3 show that between-country inequality rosemodestly between 1970 and 1980 and declined since then, as the growth of Chinasince 1978 and India in the 1990s was faster than that of the OECD countries.Meanwhile, within-country inequality rose steadily over the entire period, includingbecause of the sharp rise in domestic inequality recorded in China, India and otherlarge countries. As the increase in within-country inequality was smaller than that inbetween-country inequality, global inequality fell since 1980. Also in this case,removing China from the sample raises global inequality and reduces within-countryinequality.
Table 3. Evolution of the global distribution of income and of thedistribution
of within- and between-country inequality, 1970-981970 1980 1990 1992 1998
Gini Coefficient (global inequality) 0.633 0.638 0.630 0.621 0.609
Theil CoefficientInequality within country groups 0.186 0.193 0.194 0.195 0.203Inequality between country groups 0.586 0.593 0.583 0.554 0.513

8
Total (global) inequality 0.771 0.786 0.776 0.749 0.716
Mean logarithmic deviationInequality within country groups 0.170 0.181 0.201 0.206 0.226Inequality between country groups 0.634 0.647 0.586 0.557 0.513Total (global) inequality 0.805 0.828 0.787 0.763 0.739
Squared coefficient of variationInequality within country groups 0.454 0.483 0.500 0.487 0.483Inequality between country groups 0.722 0.731 0.774 0.734 0.678Total (global) inequality 1.175 1.214 1.273 1.221 1.160
Source: derived from Sala-i-Martin (2002)
Also this second group of studies suffers from some methodological problems.Indeed, it is impossible to predict the shape of income distribution on the basis of asingle statistics (for instance, a Gini coefficient is compatible with an infinite numberof Lorenz curves), or it is reasonable to assume that all distributions follow alognormal pattern. To solve this problem, a third group of analyses relies onindividual income data derived from representative household surveys. This approachallows estimating accurately for each year the shape of the income distribution of eachcountry and, by aggregation, the distribution of world income among its citizens. Tothe best of our knowledge, there are only four studies in this category. The first two(Ravallion et al. 1991 and Chen et al. 1997) comprise only developing countries,while the third (Ravallion and Chen 1997) includes also the transitional economies.The fourth and most complete study is that by Milanovic (2000) which covers also thedeveloped economies. These account for a large share of world output and theirexclusion from the analysis affects perceptibly the shape of the global incomedistribution.
The main problem with this approach is that lack of individual data from householdsurveys for the earlier years impedes to extend backwards the analysis of changes inglobal inequality. The study by Milanovic (2000), for instance, refers only to 1988 and1993 and cannot provide a deeper time perspective of inequality changes. The studymakes use of PPP-adjusted survey-derived data on the distribution of income percapita in 1988 and 1993 for 88 countries accounting for 84 percent of the worldpopulation and 93 percent of world GDP. Because of their huge size (e.g. rural Chinarepresents 18.5 percent of the world population) and of the recent sharp widening ofthe income gap between their urban and rural areas, the study treats these two sectorsof the Chinese, Indian, Bangladeshi, Pakistani and Egyptian economies as separatenations. The study finds that global inequality worsened sharply over 1988-93: theratio between the average income of the top 5 percent and the bottom 5 percent of theworld population rose from 78 in 1988 to 114 in 1993. Meanwhile the Gini coefficientof the world income distribution rose from 0.628 in 1988 to o.670 in 1993 as a resultof a surge in both within-country and between-country inequality. Milanovicconcludes his analysis noting that “ …slow growth of rural per capita incomes inpopulous Asian countries (China, India and Bangladesh) compared to income growthof several large and rich OECD countries, plus fast growth in urban China comparedto rural China and rural India, were the main reasons why world Gini increased”.

9
The results of these studies are summarized in Table 4 below and suggest the followingtentative conclusions:
- measurement of the level of global inequality and of the direction of its change over thelast two decades is influenced by a number of statistical choices concerning the use ofGDP versus income per capita, market versus PPP exchange rates, synthetic statistics ofthe distribution vs. detailed survey data (see footnote 4) and the treatment of China,India and few other poor populous countries either as single nations or as two separateurban and rural sectors. This latter choice is particularly important for the 1990s, aperiod which witnessed a resurgence of the urban-rural income gap in China (see table4). In all cases, removing China from the sample raises world inequality.
Table 4. Summary of findings of changes in within country, between country and globalinequality over the recent two decades (or similar period)
PeriodCovered
Exchangerate used
Inequalitymeasure
WithincountriesInequality
Betweencountriesinequality
Total(global)inequality
Approach followed and mainassumptions
UNCTAD (1997) 1980-90 Current Gini ….. Up …. Uses GDP/c and incomeshares
UNDP (1999) 1960-97 Current Quintileratio
….. Up …. Uses GDP/c
Korzeniewicz andMoran (1997)
1965-92 Current GiniTheil
…..…..
Up Up
Uses GDP/c
Schultz (1998) 1968-89 PPP GiniGini(exc.China)
Up Up
Down Stable
Down Up
Uses GDP/c and incomeshares
Stewart andBerry (n.d.)
1980-90 PPP Gini Up Down Slightlydown
GDP/c and income shares
Sala-i-Martin(2002)
1970-98 PPP 7 ineq.indexes
7 ineq.indexes(excl.China)
Up
Stable
Down
Slightlyup
Down
Slightlyup
GDP/c and quintile shares for125 countries (for 57 of themassumptions made onshape/stability of distribution)National trends in quintileshares are obtain throughlinear regression.
Bourguignon andMorissson (2002)
1980-92 PPP GiniTheilMLD
….. Up Up
….. Up Down
Stable Up Down
GDP/c and income sharesto proxy the distribution of33 large countries/groups
Dowrick andAkmal (2001)
1980-93 Afriat GiniTheilSCV
Up Up Up
Slightly up Up Up
Up Up Up
Uses GDP/c and incomeshares
Milanovic (2000) 1988-93 PPP GiniTheil
Up Up
Up Up
Up Up
Income/c and originaldistributions from 91 nations.Large Asian countries areseparated into rural and urban
Li, Squire, Zou(1998)
1980-92n.appl.
Gini Stable … …. 49 countrieslinear trend regression
Cornia (2002) 1980-99 Gini Up … …. 73 countries

10
n.appl. quadratic trend regressionSource: compilation by the author
- bearing these considerations in mind, the evidence suggests – on balance - thatbetween the early 1980s and 1993 (no analysis extends beyond that year) globalinequality increased – if at a slower pace than during the first wave of globalisation -because of a moderate rise in between-country. In turn, within-country inequality hasclearly risen in many countries (see next section) but its overall impact on globalinequality seems to have been less pronounced. The latter conclusion is, however,influenced by the inequality index used.
- the increase in global inequality was probably more pronounced in the 1990s, a periodduring which the US and other high-income economies expanded rapidly while ruralincomes in India and – to some extent – China grew slowly8. In contrast, during the1980s, fast agricultural growth in China and India and recession in the OECD countries– caused quasi-stagnation in global inequality in relation to the 1970s.
4. CHANGES IN WITHIN-COUNTRY INEQUALITY
The previous section has argued that between-country inequality accounts for most ofglobal inequality and its evolution over the last two decades. However, from a policyperspective, within-country inequality is likely to be more important. There are threereasons for this. First, between-country inequality is path dependent and is not easilymodifiable by the policies of a single country save, possibly, the US and China.Second, despite the development of global media and international travel, within-country inequality is much more observable and perceivable than between-countryinequality that, for most people, still remains an abstract notion. For this reason,within-country inequality exerts a greater influence on the behaviours of the economicagents than between-country inequality. And, third, most policy decisions affectingthe relative income position of the citizens of a country are still taken at the nationallevel. This calls therefore for a greater emphasis on analyses of changes in within-country inequality. This approach is followed in the next sub-section that reviews thechanges in income distribution since the end of World War II – and particularly overthe last 20 years – in the main non-developed regions.
4.1 INEQUALITY CHANGES BY MAIN REGIONS
(i) Latin America: a rise in inequality in the 1980s followed by a further rise orstagnation in the 1990s. In the 1980s and 1990s, inequality in the region was affectedby several external shocks, the recessionary adjustments introduced to respond to them,and widespread external liberalisation. Altogether, the 1980s were characterised byhighly regressive outcomes as inequality declined in only three countries (Colombia,Uruguay and Costarica) out of 11 (Altimir, 1996). Iglesias (1998, p.6) notes that '... atthe end of the decade, there was a substantial rise in inequality in most cases. Thatmeans that the recession of the 1980s hit the poor harder than the rich'. In the 1990s,income polarisation did not decline and in half of the cases it worsened further, if at a
8 In both China and India, agricultural growth was much more rapid in the 1980s than in the 1990s.

11
slower pace than in the 1980s, despite the return to full capacity growth and theliberalisation of the external sector. A review of inequality changes over the 1990sbased on 49 representative surveys for 15 countries (Székely and Hilgert 1999) showsthat inequality worsened in eight cases while it stagnated in seven (see also Morley2000).
The income polarisation of the 1980s and 1990s was the result of fast inequality risesduring recessionary spells and slow declines during periods of recovery (Cornia, 1994).As a result, between 1980 and the late 1980s, the labour share declined by 5-6percentage points in Argentina, Chile and Venezuela and ten in Mexico (Sainz andCalcagno, 1992) while such tendency was not reversed in the 1990s. In several countries– as in Chile during the military dictatorship – the fall in the labour share was due alsoto the regressive changes in labour legislation that relaxed regulations on workersdismissals, restricted the power of trade unions, suspended wage indexation, cut publicemployment and restricted the coverage of the minimum wage while, at the same time,wealth and capital gains taxes were eliminated, profit taxes substantially reduced andinterest rates sharply risen. Five structural trends emerged in the labour market as aresult of these policy changes and of the stagnation of the 1980s (Tokman 1986) andslow growth of the 1990s. First, sluggish growth brought about a slowdown in jobscreation. Second, informal employment (in sectors where low wages are the rule)became much more common. Third, formal sector wages evolved less favourably thanGDP per capita. Fourth, minimum wages mostly fell in relation to average wages. Fifth,wage differentials by skill level widened, particularly during the 1990s, in parallel withwidespread trade and financial liberalisation (Székely and Hilgert 1999). This reviewmay be concluded by noting with Altimir (1996, p.59) that:
Under these new economic modalities (characterised by trade openness,fiscal austerity, a prudent management of monetary policy, less publicregulation of markets and more reliance on private initiative), the patternof income distribution tends, as suggested above, to be unequal at thevery least, and more unequal - in most cases, at least in urban areas -than those [already high] that prevailed during the last stages of theprevious growth phase in the 1970s.
(ii) China: a U-shaped trend in regional and urban-rural inequality. Over the last50 years, income inequality in China followed a clear U-shaped pattern. At the start ofthe Maoist reforms in 1953, the nationwide Gini coefficient of the distribution ofhousehold incomes stood at a high 0.56. The reforms of the 1950s and 1960s rapidlyreduced income polarisation and, by 1975, the Gini index had fallen to 0.26 despitelarge regional differences in natural endowments (Table 5). The reforms adopted inagriculture since 1978 replaced the rural communes with an egalitarian family-basedagriculture and introduced considerable price incentives for the farmers. The result wasa sharp acceleration of agricultural and overall growth between 1978 and 1984. Duringthese years, there was only a modest upsurge in inequality and rural poverty was literallyhalved, falling from 30.7 to 15.1 percent between 1978 and 1984 (Gustafsson andZhong 2000).
Table 5. Evolution of the Gini coefficients and the income gap in China, 1953-98

12
Year Overall Gini
Urban Gini
Rural Gini
Income gapU/Ra
Inter-ProvincialIncomegap(rural)b
Inter-Provincial Incomegap(urban)b
Inter-ProvincialIncomeGap(total)b
1953 0.56c ..... .... ... ..... ... ...1964 0.31 c ..... .... ... ..... ... ...1975 0.26c ….. … … …. … …1978 0.32 0.16 0.21 2.37 ..... ... ...1981 …. 0.15 0.24 2.05 2.80 1.81 12.621984 0.28d 0.16 0.26 1.71 3.16e 1.59e 9.22e1988 0.38 0.23 0.30 2.05 ..... ..... .....1990 …. 0.23 0.31 2.02 4.17 2.03 7.501995 0.43 0.28 0.34 2.47 4.82 2.34 9.791998 0.41c ..... ... ... ..... ... ...
Source: State Bureau of Statistic and World Bank (2000). Notes: a ratio between the average urban andrural average income;b ratio between the average income of the highest to the lowest province, by rural,urban and total area; c data for these years are not comparable with those of the other years and are onlyillustrative of the broad level of inequality of that year; d refers to 1983; e refers to 1985.
In contrast, inequality rose fast between 1985 and 1990 and very fast after 1990 (Table5). This increase can be traced to a widening of the urban-rural gap driven by rapidurban-based industrialisation, export-led growth in the coastal area and neglect of thepoor interior regions and of agriculture (Ping 1997). For example, over 1993-8, theChinese farmers suffered a 30 percent fall in the price of grains and a tripling ofagricultural taxes. Such trends exasperated the urban-rural gap and reduced the pace ofrural poverty alleviation which slowed down sharply over 1984-95, the years of theexport boom, in relation to 1978-84, the years of agricultural growth (Gustafsson andZhong 2000).
Public policy was a major determinant of this rise in income polarisation. The fiscaldecentralization introduced in 1978 substantially reduced the possibility of the centralGovernment to control regional inequality by means of transfers to poorer provinces.Industrial and export-growth policy - deliberately pursued in a regionally unbalancedmanner - plaid an even greater disequalizing role, as it favored the coastal provincesthrough the granting of special administrative and economic powers, tax privileges andother benefits which facilitated the development of export industries and the inflow offoreign direct investment.
(iii) East and Southeast Asia: a common if milder and more recent reversal ofinequality trends. Countries from this region are well known for having achieved in thepast an equitable export-led growth. Yet, since the 1980s, and particularly the early1990s, inequality rose also in most of the region. In South Korea the Gini coefficient ofthe earnings distribution declined steadily over time owing to a narrowing of wagedifferentials by occupation, gender and level of education (Fields and Oyo 2000). Bothwage and income inequality rose again, however, in the aftermath of the 1997 crisis.The full-capacity unemployment rose from 1-2 to 4-5 percent between 1995-6 and 1999-2000 (KLSI, 2001), while the share of part time and daily workers in the total jumpedfrom 42.5 to 52.5 percent between l996 and 2000 and the wage spread by employmenttype widened. As a result, between 1996 and 1999, the labour share fell from 64 to 60percent while the Gini coefficient of the distribution of earnings rose from 0.29 to 0.32.

13
In Taiwan, income inequality improved steadily between 1964 and 1980 thanks to arapid expansion of employment among skilled and unskilled workers employed in thedomestic and export sector. Over 1980-1993, however, the development of the skill-intensive sectors pushed up again – id moderately - wage inequality, while the share ofcapital incomes in the total surged in line with the development of large corporationsand the escalation of land prices. By 1993, Taiwan reached again the inequality level of1964. Hong-Kong and Singapore too show a mild U-shaped pattern, with fairly rapidinequality declines till the late 1970s, followed by moderate rises offsetting half of theearlier falls (Oshima, 1998).
Except for Thailand, the economies of Southeast Asia also follow a pattern of inequalitydecline between the 1960s and the mid-1980s followed by a rise during the 1990s. InThailand, the Gini coefficient of the distribution of total income rose steadily (from 0.41to 0.52) since the 1960s and particularly during the 1990s. Since the mid-late 1980s, thistrend is explained by a surge in the share and concentration of non-farm profits linked tothe rapid expansion of the globalisation-related finance, insurance, internet and realestate (F.I.I.R.E.) sector in the Bangkok area (Sarntisart 2000).
In Indonesia, the Gini coefficient of the distribution of income fell from 0.35 in 1964-5to 0.32 in 1987 thanks to the recycling of the oil rent to the financing of the ‘greenrevolution’. This substantially raised employment and production opportunities inagriculture, reduced rural inequality and fostered rural growth and poverty reduction(Feridhanusetyawan 2000). In contrast, the years from 1987 to 1996 – a periodcharacterised by devaluation, tariff reform and financial deregulation - werecharacterised by the development of the urban-based manufacturing and capital-intensive F.I.I.R.E. sector, a slow down of agriculture, a widening of the urban-ruralgap, the retrenchment of rural development programs and, as a result, a rise in overallinequality from 0.32 in 1987 to 0.38 in 1997 (ibid.). In the immediate, the Asianfinancial crisis of 1997 led to a marginal drop in inequality as middle-high incomepeople employed in the F.I.I.R.E. sector were immediately affected. Shortly after,however, inequality and poverty rose especially fast among the urban poor – due to therecession induced by the crisis, the stabilisation measures introduced to combat it andthe differential impact of price rises which affected the poor the most (Levinshon et al1999). In a summary analysis of the impact of the Asian crisis, Pangestu (2000) andKnowles et al (1999) found that over 1997-98 inequality dropped marginally inIndonesia and rose in Thailand, the Philippines and South Korea.
(iv) The late liberalizers of South Asia. By and large, during the post-World War IIperiod, income distribution in the region changed less than elsewhere, though –following the changes of the last decades - it now appears it also followed a mild U-shaped pattern. In India, the Gini coefficient of household consumption expenditure percapita fell from 0.36 to 0.31 over 1951-61 and then fluctuated in the 0.29-0.32 rangeuntil the introduction in July 1991 of the first IMF stabilisation and liberalisationprogramme. In the 1980s, stable inequality, substantial expenditure on ruraldevelopment and a 4 percent growth in agriculture led by the ‘green revolution’ reducedsubstantially rural poverty.

14
With the gradual liberalisation of the economy in the 1990s, GDP growth accelerated to5.6 percent. Such growth was, however, highly concentrated in the urban sector, byregions and by income group. While fast urban growth and a moderate rise in urbaninequality (whose Gini coefficient rose from 0.34 to 0.369) allowed for a decline in urbanpoverty, rural poverty stagnated owing to slow agricultural growth, cuts in ruraldevelopment programs and food subsidies and a rise in rural inequality (Mundle andTulasidhar 1998, Jha 2000). In sum, the experience of the 1990s points to a moderate risein both urban and rural inequality, a larger rise in overall inequality due to the widening ofthe urban-rural gap and a decline in the poverty alleviation elasticity of growth (Ravallionand Datt 1999). In Sri Lanka, Bangladesh and Pakistan inequality followed also a mild U-shaped pattern. In Pakistan, for instance, the Gini coefficient declined from .39 to 0.33during the growth years of 1963-1973 but gradually climbed back to reach 0.41 in 1992-93(Oshima, 1998). As in Bangladesh, the inequality reversal is more pronounced in the ruralsector where an initial drop of 7 Gini points was followed by a rise of 12 points.
(v) Sub-Saharan Africa: falling urban-rural gap, but rising intra-urban and – attimes - intra-rural inequality. Conclusions about inequality changes in Sub-SaharanAfrica are tentative, as – despite some improvements – there are still few nations with atleast two comparable surveys spanning the last twenty years.
In the past, inequality was the fruit of a large urban-rural income gap inherited from thecolonial era and reinforced by the “urban bias” of post-colonial policy. The 1980s and1990s were characterised by the massive application of adjustment programs aimed atimproving the rural terms of trade and stimulating agricultural exports. These reformssucceeded in liberalising the economy, devaluing the real exchange rate (which fell onaverage by 30 percent over 1980-1998) and opening up the African economies, assignalled by the rise from 51 to 62 percent in the regional import plus export ratio toGDP (Kayizzi-Mugerwa 2000). In spite of this, GDP per capita stagnated. Even in thefew regional success stories (Uganda and Ghana), the recovery remained fragile whilelabour-intensive manufacturing exports did not take off. Mauritius is the mainexception. It successfully increased textile exports and liberalised the financial sectorwhile experiencing rapid growth, a surge in employment in the export sector and fallinginequality (Table 6).
The impact of policy reform and output stagnation was the hardest in the urban sectorthat, in several cases, experienced a drop in its terms of trade and large income falls.Rural areas were less affected or gained, as in the case of Uganda. Thus, in most cases,the urban-rural gap was reduced by a process of 'equalising downward' (UNCTAD,1997). Intra-rural inequality rose in countries – such as Kenya - characterised by a highland concentration (Table 6) or where the recovery was peasant-based but where theimproved earning potential failed to reach the remote areas due to inadequateinfrastructure or the collapse of marketing arrangements - as in Zambia (Mc Culloch et
9 Many argue that such modest increase in inequality contrasts with the growing capitalisation of theBombay stock market, and that it likely reflects the undersampling of the new high-income groups fromthe National Sample Survey – as confirmed by the growing divergence between the estimates of theaverage consumption per capita measured on NSS and national accounts data.

15
al 2000). Inequality generally improved in countries such as Mozambique and Ugandacaricaturised by a peasant agriculture rebounding from years of civil strife (Bigsten2000).
Table 6. Gini coefficients of the distribution of income in the rural, urban and overall economy
Country Year Rural Urban OverallCoted’Ivoire
1970 1985 1995
…… …. 0.53 0.39 0.37
Kenya 1982 1992
0.40 0.49
….. 0.52 (‘76) 0.58 (‘84)
Mauritius 1986 1991
…… ….. 0.40 0.37
Ethiopia 1989 1994
0.41 0.46
….. …..
Tanzania 1983 1991
0.53 0.76
…. ….
Nigeria 1986 1993
…… ….. 0.37 0.42
Uganda 1989 1992 1998
…. 0.33 0.32
…. 0.43 0.37
0.33 0.38 0.36
Zambia 1991 1996 1998
0.56 0.49 0.52
0.45 0.47 0.48
0.56 0.52 0.51
Source: WIID, UNU/WIDER, Helsinki (www.wider.unu.edu), Kayizzi-Mugerwa (2000), Bigsten (2000), Mc Culloch et al (2000)
This nuanced picture is broadly confirmed by a review of the 1990s changes in theexpenditure distribution (Christiaensen et al 2002) for Ethiopia, Uganda, Zimbabwe,Ghana, Madgascar, Zambia and Mauritania. The study finds that rural inequalitydeclined in 5 cases out of 7 thanks to domestic trade liberalisation, changes inagricultural procurement policies and greater macroenomic and political stability. Incontrast, urban inequality rose in 4 out of 7 cases while overall inequality rose in threecases and fell in another three. The changes recorded were generally quite modestthough this apparent stability hides considerable micro churning.
(vi) A sharp rise of inequality in the former Soviet Bloc. Since 1989, concurrentlywith the privatisation and domestic and international liberalisation of these economies,income concentration rose moderately in the countries of Central Europe (Milanovic,1998) where earnings inequality widened less than expected and a comprehensivewelfare state was preserved or even expanded. In contrast, in the former USSR andSouth Eastern Europe, Gini coefficients rose on average by an astounding by 10-20points, i.e. 3-4 times faster than in Central Europe (Table 7). In these countries, thetransitional recession and fall in the wage share were extremely pronounced, socialtransfers declined, their composition and targeting deteriorated (Cornia 1996) andprivatisation was less equitable than in Central Europe.
Table 7. Gini coefficients of the distribution of net per capita disposable householdincome between 1989 and 1994-95
Moderate 1989 Gini 1989-95 Increase Large Increases 1989 Gini 1989-95 Increase

16
IncreasesSlovenia 23.7 1.3 Lithuania 27.5 8.5Hungary 21.4 1.6 Latvia 22.5a 8.5Slovakia 19.5 3.0 Estonia 27.7 11.9Romania 23.5 4.9 Bulgaria 25.0b 12.0Czech Republic 18.5 4.9 Moldova 26.7 13.3Poland 24.9 5.1 Russia 25.7 15.2
Ukraine 23.3a 24.1Source: UNICEF (1997); Milanovic (1998) for Latvia and Ukraine. Notes: a. 1988. The data are notalways directly comparable over time due to changes in the sampling framework. For a few countriesand years the data refer to gross household income per capita. b. 1990.
Rising earnings inequality seems to have played a central role in the surge of incomeinequality (Milanovic 1998). The rise in the wage gap has been attributed to theemergence of “scarcity rents” for professionals such as bankers and other specialistsundersupplied during the old system, and to a physiological rise in returns to educationfollowing the liberalisation of the labour market (Rutkowski 1999). Such explanations,based on standard human capital theory, account however for less than half of theobserved increase. Indeed, many educated employees in the public sector continued toreceive low wages unrelated to their skills and experience. Earnings inequality appearsto have risen also because of the fall in the minimum wage relative to the average, theexpansion of a poorly regulated and inequitable informal sector, mounting wage arrearsand a surge in interindustrial wage dispersion favouring politically influential sectorssuch as mining and power generation (Cornia, 1996). The limited rise in capital incomesreported by the literature (Milanovic 1998) is likely the result of the undersampling ofthe new high-income groups and to the underreporting of their income in the HouseholdBudget Surveys as suggested by the growing discrepancy between the income per capitaderived from the national accounts and the household surveys and by the growingconcentration of financial assets.
4.2 ECONOMETRIC ANALYSIS OF WITHIN-COUNTRY INEQUALITYThe above review suggests that, during the last two decades, inequality increased withinmost of the countries analyzed and that such rise often represented a reversal of theinequality decline observed during the first two-three decades of the post World War IIperiod. Such result conflicts however with the findings of prior research in this area thathas pointed to the broad stability of within-country inequality over the 1950-1990period. For instance, after fitting linear trends to 49 country data, Li, et al. 1998, (p.35)conclude that " .. there is no evidence of a time trend in 32 countries or 65% of oursample". Examination of the estimation procedure followed in this and similar studiessuggest, however, that these conclusions are dependent on the methodology adopted.Indeed, the sample utilised did not include most economies in transition (whichexperienced a universal rise in inequality in the 1990s), extended only up to 1991-93(and so missed the disequalizing impact of recent financial crises) and was fitted onlywith linear trends (i.e. a functional form that does not permit to capture trend reversals).Finally, the country results were not weighted by population size and GDP-PPP.
Cornia with Kiiski (2001) tried to overcome the limitations of this literature. Theyextracted from the November 1998 version of WIDER’s World Income Inequality

17
Database (WIID) 770 “reliable observations” of Gini coefficients for 73 countries10 thataccount for 80 and 91 percent of the world population and GDP-PPP. These coefficientsare derived from fully documented, comparable and representative surveys of the entireeconomy and refer to “per capita household disposable income” in 52 countries, “percapita consumption expenditure” in nine countries; and “gross earnings” in 14economies in transition. Each country’s time series (that makes use of the same incomeconcept for the entire period analysed) were interpolated with linear as well as quadraticfunctions (so as to capture trend reversals). For each country, the best functional formwas selected on the basis of the most significant t statistics and, as a subordinatecriterion, the highest R2. The results of these trend estimates are summarised in Table 8.
Table 8. Trends in income inequality from the 1950s to the mid 1990s for 73 developed,developing and transitional countries.
Samplecountries ineach group
Developed
Samplecountries ineach group
Developing
Samplecountries ineach group
Transitional
Samplecountries ineach group
Total
Share ofpopulationof totalsamplecountries
Share ofGDP-PPPof totalsamplecountries
Rising inequality ofwhich:
12 15 21 48 59 78
U shaped ……. …… ……. 29 55 73Constant inequality 2 14 0 16 36 13Falling inequality 2 5 2 9 5 9Total 16 34 23 73 100 100
Source: author’s calculations on the November 1998 version of WIDER’s WIID.
These results broadly confirm the conclusions arrived at on the basis of the review ofcase studies presented in section 4.1. Inequality was found to have risen in 48 of the 73countries analyzed, including in large economies such as China, several large LatinAmerican nations, the USA and Russia. Inequality was found to have remained constantin 16 countries (including Germany and Brazil, as well as medium or large countriessuch India, Indonesia and Tanzania for which the most recent data reviewed in section4.1 show, however, a perceptible reversal of the inequality trend). Only in nine countriesthere is evidence of a decline in income concentration over the long-term. These includesome small countries (Bahamas, Honduras, and Jamaica, Tunisia) and a few mediumsized ones (France, Malaysia, South Korea). Weighing the results by population size andGDP-PPP, strengthens the conclusions (see the last two columns of Table 8).
As noted, the November 1998 version of WIID extends only up to 1994-5. Because ofthis, the results in Table 8 do not reflect the inequality changes intervened during thelast 5-6 years. We, thus, separately moved India, Indonesia, South Korea, Tanzania andthe Philippines – all countries that recently experienced inequality reversals (see section4.1) – to the ‘rising inequality’ category. In this way, of the 73 countries in the sample,53 experienced a surge in income concentration over the last 20 years. This increase wasuniversal in the economies in transition, almost universal in Latin America and 10 Of these 73 countries 32 are developing, 21 transitional economies and 18 from the OECD. Exceptfor Africa, these countries account for 84 to 98 percent of the population and 82 to 98 percent of theGDP-PPP of these regions. For Africa, the six countries included in the analysis account for 18 and 32percent of the total population and GDP-PPP.

18
increasingly frequent, if less dramatic in South, SouthEast and East Asia. In sub-SaharanAfrica, domestic liberalisation may have improved the agricultural terms of trade butfailed to induce – with few exceptions – an expansion of inequality-reducing labourintensive exports.
The observed increase in the Gini coefficients was often substantial. Of the 53 countrieswith growing inequality, the rise was of between 5 and 10 Gini points in 30 nations (in 9of them it occurred from initial levels of 0.40-0.45), by between 10 and 20 points in 10countries and by more than 20 points in a couple of countries of the former SovietUnion. In many countries, greater income polarisation seems to have been driven byboth a fall in the labour share (paralleled by a rise in the capital share) and a worseningof the earnings distribution explained only in part by a rise in returns to education.Growing regional disparity and growth concentration in the urban areas were also keyfactors.
5. CAUSES OF THE RECENT CHANGES IN INEQUALITYSection 4 has argued that both between- and within-country inequality have risen overthe last two decades. While the upward impact on global inequality was moderate byhistorical standards, such increase is perplexing if seen in relation to the predictions ofthe standard theory and if juxtaposed to the fall in within-country inequality which tookplace between 1950 and 1970-5 following the adoption of full-employment andredistributive policies in the OECD and socialist economies, and of the land,educational and employment reforms adopted in the East Asian countries, China and –to an extent – India. What factors account for such trend reversals? One can,alternatively, propose three sets of explanations:
(i) An aggravation of the traditional causes of inequality? The first – and leastplausible – explanation of the recent rise in income polarisation focuses on anaggravation of the traditional causes of inequality such as land concentration. Yet,changes in this area cannot explain the recent surge in inequality for the reasonsadduced below.
In developing countries, high land concentration has been and remains a majordeterminant of rural inequality. Yet, during the last 50 years the share of agriculture intotal output and employment has fallen everywhere, while over the 1950s and 1960sland reforms redistributed latifundia and state land to poor farmers in at least 27countries. As a result, land rents and rural inequality have declined. Second, whilecountries well endowed with mineral resources are known to have a high income andasset inequality, such ‘curse of natural resources’ hardly explains the incomepolarisation of the last two decades, as the mineral rent/GDP ratio has systematicallydeclined since the late 1970s (Cornia with Kiiski, 2001). Third, the same conclusionapplies – with some qualification – to an hypothetical aggravation of the ‘urban bias’.Indeed, a recent review of such bias in the globalised world economy (Eastwood andLipton 2001) finds no evidence of systematic change, though the bias appears to havedeclined in Latin America and parts of Africa and increased in post-1984 China,Thailand and Indonesia.

19
Finally, greater inequality in the 1980s and 1990s might be ascribed to a worsening inthe distribution of educational achievements. Mean educational achievements increasedin most countries during the last two decades. Yet, in Latin America, a rise in theaverage number of years of education was accompanied by mounting educationalinequality – as public policy emphasised the reduction of illiteracy (a measure thatreduces educational variance) together with a rapid expansion in the number ofuniversity graduates (a measure that raises educational variance) (Morley 2000)11.Differences in educational achievements thus continue to be a key determinant of wagepolarisation in the region (Fiszbein and Psacharopulos 1992) while the slow growth inthe number of secondary school graduates likely contributed to sluggish growth inmanufacturing exports inspite of trade liberalisation. In Africa and, to a lesser extent,the former Soviet Union the difficulties experienced in sustaining primary education inthe 1980s and 1990s and the surge in private secondary and higher education will havea disequalizing impact on the future distribution of human capital. In Africa, however,two thirds of the population are still engaged in simple tasks so that the impact ofgrowing polarisation in educational achievements on inequality may remain limited forsome years. In contrast, the East and Southeast Asian and Middle Eastern educationalpolicy, focused on an expansion of universal secondary education and so helpedreducing educational inequality and wage concentration.
(ii) Technological change. A second – not entirely satisfactory – explanation ascribesthe recent rise in within-country inequality to technological change. The latter - it isargued - generates a demand for new skills that chronically outstrips its supply and socreates scarcity rents for skilled workers. International comparisons, however, suggestthat whether the relative earnings of educated workers rise depends not so much ontechnology but on government’s investments in secondary and higher education. Forinstance, Murphy et al. (1999) compare the situation of the US (where governmentsinvested little in public education and the wage premium for college workers rose byover 20 percent between 1980 and 1995) with that of Canada (where this ratio remainedconstant owing to considerable public investments in education and training). Theyconclude that, while technological change does raise the relative demand for educatedworkers, governments control powerful policies for counteracting the unwantedinequality side effect of technological progress.
It is also argued – even when assuming a balanced evolution of the demand and supplyof new skills – that new technologies generate an earnings distribution more skewedthan that emanating from old technologies. Especially in the service sector and a fewindustrial branches, new technologies replace unskilled labour with skilled labour andcapital embodying new technologies and so affect the labour share in total income andthe wage spread. In support of this argument, the World Bank (2000) suggests that theshift towards skill-intensive employment observed in the Western world in the 1970sand 1980s is being matched in a number of developing countries in the 1990s. Yet, thisviewpoint does not apply to the many developing countries where either inequalitystarted increasing ahead of this decade of technological modernisation or, as in Africaand Eastern Europe, where low investment rates have impeded a significant
11 In Latin America the standard deviation of education has risen from 3 years in 1960 to over 4.5 yearsin the mid 1990s (Morley 2000).

20
technological modernisation. Thus, with the exception of a few middle incomecountries, the evidence in support of such thesis seems, on balance, weak.
(iii) Domestic and external liberalisation. The third – and most relevant - set ofexplanations pivots around the disequalizing impact of liberalisation and globalisation.Standard theory posits that trade liberalisation in poor countries switches productionfrom non-tradeables and inefficient import-substitutes towards efficient exportables,thus raising the demand for unskilled labour in which the reforming countries aresupposed to have a comparative advantage. In turn, capital account liberalisation isexpected to raise investment, employment, labor productivity and growth in poorcountries with low capital accumulation but high rates of return on investment, withfavorable effects on equity and poverty.
The real-life impact of these reforms is, however, more complex and conclusions abouttheir impact depends on the methodology used for their evaluation (cross countryregressions, simulations with CGE models, before-after comparisons), the regionsanalysed and the specific policy mixes considered. Conscious of all this, we first reviewthe literature on the equity impact of the overall reform package, then move to a separateexamination of the equity impact of trade and financial liberalisation. Finally, we brieflydiscuss the impact of those domestic policies that often accompany externalliberalisation.
- Impact of the overall liberalisation-globalisation package. There are only fewreview-studies on the distributive effect of these reforms. Behrman et al (2000) reviewthe impact on wage differentials of the overall reform packages introduced in 18 LatinAmerican countries over 1980-98. They focus on six types of economy-wide reforms,i.e. trade liberalisation, capital account liberalisation, domestic financial liberalisation,privatisation, tax reform and labour market reform. The authors found that the overallpackage has a significant short-term disequalizing effect on wage differentials12, theintensity of which, however, declines over time. They also find that the strongestdisequalizing impact was due to domestic financial reform, capital account liberalisationand tax reform. Trade openness had, on balance, no net effect on the wage spread,possibly because its many effects cancelled each other out. The authors tentativelysuggests that technological progress – rather than trade – is the channel through whichliberalisation affects wage inequality.
Broadly similar evidence is provided by a review of the impact of liberalisation during21 reform episodes in 18 countries (13 from Latin America plus India, South Korea,Turkey, Russia and Zimbabawe) during the last two decades (Taylor 2000). Incomeinequality was found to rise in 13 cases, remain constant in 6 and improve in two.Virtually without exception, wage differentials by skill level rose followingliberalisation, as a result of a reduction of employment in the modern sector, a rise inproductivity and wage concentration by skill within the same, the reallocation of excesslabour to the low-paying non-traded sector (informal trade, services and traditionalagriculture) and a rise of inequality within the latter. Of the 18 countries analysed, onlyEl Salvador and Costa Rica managed to reduce inequality on occasion of liberalisation 12 However, a similar review of the impact of policy reform in Latin America during thesame period, Morley (2000) arrives to somewhat contradictory conclusions.

21
thanks to a surge in the employment of unskilled workers in the export sector. In turn,Cornia with Kiiski (2001) evaluate the impact of liberalisation by means of an overallreform index developed by the World Bank. Their regression analysis is carried out on asample of 32 developing and transitional economies for the years 1980- 95 and suggeststhat while the reform package had an overall disequalizing effect, this was morepronounced in the economies of the former Soviet bloc, probably on account of theirinstitutional weakness, while it was less pronounced in those with high initial inequality.
In a careful study of the poverty impact of IMF-World Bank reform programs (whichcomprise macroeconomic stabilisation and structural adjustment measures) Easterly(2001) finds that these moderated the rise of poverty during output contractions,possibly because of the cushioning of the crisis through Bank-sponsored, adjustment-related ‘social safety nets’. But he also finds that, during spells of economic expansion,Fund-Bank programs reduced the poverty alleviation elasticity of growth in relation tothose of ‘home-grown’ adjustment programs. This would suggest that Fund-Bankprograms entail a worsening of income inequality during this process (Table 9). Forinstance, in China – a country with medium inequality and no Fund-Bank program -poverty incidence fell over 1990-2 by 3.8 percent for every point of GDP growth, whilein 1995-6 Colombia - a country with high inequality and a Fund-Bank adjustment loan –experienced zero poverty reduction for every point of GDP growth (Table 9).
Table 9. Poverty elasticity of growth for different Ginicoefficients and IMF- World Bank adjustment loans per year
Average number of IMF-WorldBank adjustment loans per year
During survey spellGini coefficient 0 0.5 1.0
30 -3.8 -2.7 -1.745 -2.9 -1.9 -0.960 -2.1 -1.0 0.0
Source: Easterly (2001), Table 3
Though the above studies do not trace all causal linkages between liberalisation,globalisation and inequality, the evidence reviewed as well as other studies omitted herefor reasons of space suggest that – especially for economies with weak domesticconditions and institutions – the overall liberalisation package often leads to adeterioration in within-country inequality owing to the incomplete switching ofresources from the non-tradable to the tradable sector which entails a fall in modernsector employment, a rise in wage differential within the same and a swelling of theinformal sector, as well owing to a decline in the wage share and a rise in the capitalshare linked to increasing banking and financial instability and to the reform of thelabour market and taxation. Of the six components of the liberal package, capitalaccount liberalisation appears to have the strongest disequalizing effect, followed bydomestic financial liberalisation, labor market deregulation and tax reform. Privatisationof land was found to improve equity and growth in many cases while that of industrialassets and utilities was associated with rising inequality in some regions (Eastern Europeand former Soviet Union) but not always in others (Latin America). The equity effectsof trade liberalisation appear to vary from country to country. The impact wasfavourable in the 1960s and 1970s in East Asia, in a few small countries (El Salvador,

22
Costarica, Mauritius) in recent times and – at the margin – in China and Vietnam, butnot in the large Latin America countries, Eastern Europe and most of Africa.
- Trade liberalisation. As noted above, standard theory predicts that trade liberalisationwill improve between-country inequality, within-country inequality in poor countriesand, by implication, global inequality (in most cases). Analyses on the 1960s and 1970sseem to support these conclusions. Bourguignon and Morisson (1989) analyse thedeterminants of inequality in 35 small and medium developing countries and concludethat the phased removal of trade protection in manufacturing reduces the income of therichest 20 percent of the population and improves that of the bottom 60 percent. Asimilar view is offered by Adrian Wood (1984) in his well-known book that shows thattrade liberalisation diminished wage inequality in the East Asian exporters of labourintensive manufactures13. Yet, the last twenty years offer a less encouraging picture thanthat just presented. Indeed, evidence for the last two decades shows that tradeliberalisation widened the wage gap in a broad range of countries including the EastAsian exporters of manufactured goods. For instance, wage inequality was found tohave increased in six out of seven Latin American countries for which reliable wagedata are available, as well as in the Philippines and Eastern Europe (Lindert andWilliamson 2001). One explanation of this phenomenon pivots around a choice oftechnologies inconsistent with local factors endowments. The import of world classinvestment goods incorporating the latest technological advances by firms operating inthe export sector of developing countries leads to a rise in the demand of skilled ratherthan unskilled labour. A second explanation pivots around the so called ‘fallacy ofcomposition’ which argues that the historical context under which trade liberalisationtook place in the 1990s was very different from that under which it occurred in the1960s. The Mexican trade liberalisation of 1985-90, for instance, was accompanied by awidening of its wage distribution as the country had to face intense competition from theentry into the world market for low skill manufactured exports of China, Indonesia andother exporters with substantially lower wages than Mexico. The formal sector ofmiddle income countries no longer has a comparative advantage in labour-intensiveexports and either it informalizes its production via a long chain of subcontractors orshifts production towards skill-intensive exports in markets where, however, they facestiff competition from the advanced economies. Third, in the case of low-tech Africanexporters, trade liberalisation has led to unsatisfactory export growth because of acombination of weak domestic conditions and persistent protectionism in the OECDcountries. In a recent review of protectionist tendencies in Northern countries, and in theUnited States in particular, Slaughter (2000) concludes that current trade barriers in theNorth appear to cost Southern countries billions of dollars annually. He also finds thatwhile some WTO-governed trade barriers in the North are declining, it appears thatthere is increasing US resistance to further globalisation via trade and immigrationliberalisation. All in all, the predictions of standard trade theory do not seem to holdmuch in the globalised world of the 1990s. Alternative theoretical approaches, such asthose stressing the imports of world class technology, structural inflexibilities, fallacy ofcomposition, persistent protectionism and a changing political economy of distributionin a world of mobile capital and immobile labour may better explain the recent trends inthis area (Rodrik1997).
13 As noted in section 2, such decline was reversed in the 1980s and 1990s in most of these countries.

23
Standard theory predicts also that foreign trade will reduce between-country inequality.In a longer-term analysis of the effects of trade, Barro (1991) and Sachs and Warner(1997) found that trade distortions are associated with slow growth and that tradeliberalisation would therefore improve income growth in poor countries and theirconvergence towards the income per capita of rich nations. Rodriguez and Rodrik(2000), however, argue that these studies are based on weak evidence, proxy traderestrictions through inappropriate variables (such as the openness index and thedeviation of domestic from international prices) and omit key factors from the analysis.They conclude that, likely, there is not a clear relation between trade openness andgrowth. Lately, Dollar and Kraay (2000) have analysed growth performance over 1980-95 in relation to trade policy. They found that growth in the countries that significantlycut tariff rates or expanded trade volumes was significantly higher than in the non-globalizers. Since they assigned China and India to the first group, they argue that tradeliberalisation triggers also to a decline in between-country inequality. Their paper has,however, been severely criticised for applying suitably arbitrary criteria in the selectionof the ‘globalizers’ and for other methodological problems that bias the final results(Rodrik 2000). When the same test was repeated with an unbiased country selection,there was no evidence that the globalizers grew faster than the other countries. Rodrik(2000) concludes that while trade and growth clearly correlate with each other, bothlikely depend on the quality of a country’s institutions and not on trade liberalisation perse.
Finally, assigning China and India to the globalizers’s club is also problematic. Indeed,the acceleration of growth in China and India started well before trade liberalisation wasintroduced in the early 1990s (ibid.). More generally, it is difficult to attribute the recentgrowth of China, India, Vietnam and other countries to textbook liberalisation. Whilethese countries adopted some market reforms and increasingly integrated themselvesinto the world economy, they did so through a highly unorthodox strategy combiningexport orientation with high tariff and non-tariff protection, public ownership ofbanking, patent infringements, restrictions on foreign capital flows and a nonconvertible exchange rate. Furthermore, both income and wage inequality rose markedlyin China and to a lesser extent in India in parallel with the growing globalisation of theireconomy. While export promotion per se generated a favourable impact on equity, itlikely entailed the adoption of other policies – such as a regionally unbalanced industrialpolicy, fiscal decentralisation and a reversal of the rural-urban terms of trade – thatgenerated a strong disequalizing impact.
- domestic and international financial deregulation. Domestic financial sector reforminspired by ‘financial de-repression’ was one of the first policy changes introduced indeveloping countries since the mid-1970s. This reform was conducive to private creditexpansion, some financial deepening and the creation of bond and stock markets. But itwas also often characterised by inadequate bank supervision, a sizeable rise in interestrates and spreads and growing bank failures. The distributive impact of such measures isdifficult to capture but the data are suggestive of a negative impact. Indeed, these policychanges, together with the 1982 rise in US interest rates and the IMF policy ofdemanding large increases in interest rates in crisis countries, fuelled a worldwide rise inreal interest rates in the 1980s. In developing economies real rates often rose by 10-15points and pushed a number of governments into a 'vicious circle' in which the rate risesaugmented the cost of debt servicing, which further pushed upward deficits and

24
indebtedness. Financial deregulation thus led to an increase in the rate of return onfinancial assets, a rise in the share of GDP accruing to capital incomes and theredistribution via the budget of labor income to holders of state bonds.
Domestic deregulation was followed in the early 1990s by the liberalisation of crossborder movements of foreign direct investments, bank loans and portfolio investments.With rare exceptions, these measures – and particularly the liberalisation of portfolioflows - generated a sharp social impact. This is in part due to the ‘disciplining’ structuraleffect such liberalisation has on the domestic policy decisions of governments(especially in the field of taxation and redistribution) and on the demands of organisedlabour, and partly due to the real appreciation of the exchange rate which shiftsresources to the non-tradeable sector and encourages subcontracting and wage cuts inthe tradeable sector to preserve profit margins (Taylor 2000). The impact on inequalityis also mediated by the tendency of capital account liberalisation to increase thefrequency of destabilising financial crises with real effects (Caprio and Klingebiel1997). Left to themselves, deregulated financial systems cannot perform well owing toproblems of incomplete information, markets and contracts, herd behaviour, panics,weak supervsion and speculation on asset prices.
Indeed, such crises have turned out to be costly, in both the short and medium term, aswell as disequalizing. Stiglitz (1998) suggests that countries that suffered from bankingcrises over 1975-94 saw their GDP growth rate decline on average by 1.3 percent overthe subsequent five years in relation to countries that did not experience banking crises.Their distributional impact is also negative, particularly in countries with weak laborinstitutions and social safety nets, as underscored by an analysis by Galbraith and Lu(1999) who found that in Latin America and Asia financial crises raised inequality in 73and 62 percent of the time while no impact was evident in Finland, Norway and Spain.Diwan (1999) arrives at similar conclusions. On the basis of panel data he finds that thelabor share contracts markedly and permanently in the wake of financial crises while ina subsequent paper, he shows that capital account restrictions help maintain the labourshare once financial crises occur (Diwan 2000). In an empirical study on Latin America,Behrman et. al. (2000) find that the strongest wage disequalizing component of theoverall reform package was precisely the liberalisation of the capital account. Thedistributive and social effects of such crises are underscored also by the World Bank(2000) that shows that financial liberalisation raises the poverty rate, via a worsening ofincome distribution, that persists even after returning to full-capacity growth (Table 10).Analyses based on micro data show that the impact on inequality is transmitted viadifferential employment, wages and price effects that affect the lower deciles of thedistribution especially hard. In analyzing the price changes of the 1997 financial crisis inIndonesia, Levinshon et al (1999) found that price increases had been significantly fasterfor the poor and for rural households. They conclude noting (p.20) that ‘.. the notion thatthe very poor are so poor as to be insulated from international shocks is simply wrong.Rather, in the Indonesian case, the very poor appear to be the most vulnerable.’
Table 10. Poverty incidence before, during and after a few major financial crises(percentages)---------------------------------------------------------------------------------------------------------------------------
before during after--------------------------------------------------------------------------------
Argentina (87-90) 25.2 47.3 33.7

25
Argentina (93-7) 16.8 24.8 26.0Jordan (86-92) 3.0 …. 14.9Mexico (94-6) 36.0 …. 43.0---------------------------------------------------------------------------------------------------------------------------Source: World Bank (2000)
- Domestic policy changes accompanying globalisation. As noted at the beginning ofthis paper, globalisation tends to be preceded by domestic policy changes that –regardless of their inherent merit - render a country more attractive to foreign investors.For instance, in a world of immobile labor and mobile capital, labour markets areliberalised by relaxing the norms on workers dismissal, safety at work, minimum wages,social security contributions, unionisation and collective bargaining either in the wholecountry or in selected export processing zones. Likewise, policies on corporate taxation,infrastructural development and privatisation may be influenced by the desire to attractforeign investors seeking low-wage, low-tax locations endowed with adequate physicalfacilities. The distributive impact of these ‘complementary policies’, however, is seldomfactored in the assessment of the impact of open-door policies. While space limitationsprevent to deal adequately with this issue, some of the possible linkages are brieflyreferred to hereafter to illustrate the indirect distributive impact of globalisation.
The liberalisation of the labour market, for instance, is likely to generate a rise in bothemployment and wage dispersion. The net distributive effect depends on the relativesignificance of the 'wage inequality effect' and 'employment-creation effect' as well ason the evolving importance of the informal sector. Outside East Asia and China, theexperience of last twenty years points to a dominance of the negative effects over thefavorable ones. For instance, as noted in section 4.1, it points to slow employmentcreation, a surge in the share of informal employment, an almost invariable erosion ofminimum wages in real terms and relative to the average wage14 and slow employmentcreation.
Tax reforms to attract foreign investors may also have had a disequalizing impact.During the last two decades, tax systems moved away from taxes on corporations andtrade and towards indirect taxes. In addition, the progressivity of wealth and direct taxrates was reduced though greater accent was placed on horizontal equity by eliminatingexemptions and improving collection. The net impact of these reforms has varied fromcountry to country but the general trend is towards lower tax progressivity. In reviewingthe impact of tax changes in Latin America, for instance, Morley (2000) notes that theeffect of these changes were to shift the burden of taxation away from the wealthy andtowards the middle and lower classes.
Finally, privatisation-for-liberalisation, most common in Latin America and EasternEurope, has a had mixed distributive impact. Privatisation of agriculture has often
14 In the mid 1990s the real minimum wage in Kenya, Uganda and Zimbabwe was 60 percent of theearly 1980s level, while in Latin America the minimum wage either declined in relation to its 1980slevel with the exception of Colombia, Costarica e Chile (van der Hoeven 2000) and the EasternEuropean economies in transition Cornia (1996). Similar evidence is available about the rate ofunionisation, which has dropped frequently during the era of liberalisation and deregulation.

26
generated a distributionally favourable impact, as in the case of the dismembering of thecommunes land in China and of state farms in Armenia and Romania. Privatisation oflarge industrial assets proved more complex and inequality often rose as institutionalreforms in the field of anti-monopoly legislation, competition policy and regulation ofprivatised utilities and foreign investments has lagged behind. The worst outcomes wereobserved in the economies in transition where insider privatisation led to rapidconcentration of assets in the hands of a small élite of former managers of stateenterprises. In Latin America, the acquisition of privatised utilities by multinationalfirms worsened equity through the low price paid for the assets purchased, the highservice prices charged by the privatised utilities, the employment cuts followingrestructuring and the limited capacity of local regulators to control large transitionalcorporations. Morley (2000) suggests that privatisation of utilities in Latin America hurtmainly the middle class.
6. CONCLUSIONSToday’s globalisation shares several commonalities with that of 1870-1914 but alsodiffers substantially from it (Table 11). While a strongly asymmetric expansion of tradeand capital flows characterised both periods, international migration plaid a key role inequalising wages and incomes during the first globalisation but not during the recent onedue to the growing restrictions of migration policies in developed countries. Conversely,technology appears to have had a greater impact during the current globalisation thanlast century. Finally, the impact of current capital flows to emerging and developingcountries – dominated by highly unstable and disequalizing portfolio flows - appears tobe far more pronounced now than during the first globalisation.
Global inequality appears to have continued growing during the last two decades,though less rapidly than over 1870-1914. The recent rise in globalisation is the result ofmutually offsetting trends. On the one side, unprecedented fast growth in Coastal China(and few other East Asian nations) in relation to that of the OECD countries led to areduction in global inequality, especially in the 1980s. On the other, faster growth inCoastal China and the OECD (the new core of the world economic system) in relation torural China, rural India and Sub Saharan Africa raised global inequality. Finally, theslow growth or outright stagnation of Eastern Europe, Latin America and MENArelative to the OECD countries also contributed to global inequality, though thecomparatively limited populations of these regions moderated this impact.
As during 1870-1914, the current liberalisation and globalisation have led to a selectiveand asymmetric integration of only a few countries into the core of the world economicsystem. However - now as then – the majority of the developing and transitionalcountries has been almost totally bypassed by global integration – despite a considerableopening up of their economies. While over 1870-1914 integration into the worldeconomic core concerned only the nations of the European periphery, the currentglobalisation has coopted into the core of the world economy most of South East Asia,Coastal China and, possibly, a segment of urban India. Interestingly, the graduation ofthese economies into the core of the world system was generally guided by ‘home grownstrategies’ combining elements of market reforms with pragmatic and highlyunorthodox policies in the fields of trade, finance, patents and exchange rate.

27
The reasons why large swathes of the developing and transitional world were bypassedby both globalisations remain unclear but cannot only be attributed – as sometimesargued in the literature – to insufficient commitment to liberalisation. As shown insection 4.1, for instance, Africa has substantially reformed its macroeconomy and tradepolicy during the last twenty years but has was simultaneously bypassed more thanbefore by international trade and financial flows. Weak domestic conditions ininfrastructure, human capital and institutions, as well systemic problems of fallacy ofcomposition, inadequate access to markets and persistent protectionism of the low techsectors by the advanced countries are other important factors explaining why someregions lag behind despite profound policy reform.
Unlike during the first globalisation wave – when inequality rose in the labour importingNew World but fell in the Old World countries exporting labour and manufacturedproducts - the last two decades have witnessed a widespread and symmetric rise inwithin-country inequality that has involved also the exporters of labour-intensive goods(Table 9). There are three possible explanations for this. First, contrary to the experienceof the first globalisation, limited migration to the advanced nations – the main source ofconvergence last century – did not help equalising the distribution of income in thecountries of origin. Second, international financial flows have become less stable andmore disequalizing than a century ago. And third, inequality was also influenced in anon-negligible way by domestic policy reforms – such as those of the labour market,financial sector, tax reform – which may have been introduced to facilitate theinternational integration of poor countries but which had unfavorable effects on thelabour share and wage differentials.
Finally, the predictions of standard theory about the inequality impact of internationaltrade and capital flows explained more easily the changes observed during theglobalisation of last century than during the last twenty years. Indeed, most of the recentevidence on the inequality impact of globalisation contradicts the predictions of standardtheory which is unable to capture the effect of other factors such as domesticinstitutional weaknesses, the complexity of trade and finance in a multi-country multi-goods environment, persistent and rising protectionism in the North and the equityimpact of other domestic reforms that are often introduced to facilitate the drive towardsglobalisation.
Table 11. Summary of the main inequality changes in the global economy, as well asin the Old Core, New Core and the Rest of the world during the globalisation of 1870-1914 and of 1980-2000
Globalisation wave1870-1914
Globalisation wave1980-2000
Integration into world economy- included in New Core
- excluded
N.America,N+S.EuropeArgentina, Australia
Rest of the world
East Asia, coastal ChinaParts of urban India
Rest of the worldFactors of income convergencebetween Old Core and New Core- trade- migration
Important Dominant
Dominant Negligible

28
- capital flows long term (FDI, Bank lending) short term (portfolio flows)- technology
Negative Negative …... Negligible
Positive-Undetermined Positive Negative Important
Income inequality
- global
- between countries Old Core vs. New Core Old Core + New Core vs. others- within countries Old Core New Core Rest of the World
Rising
Rising Falling Rising fast
Declining Rising Unknown
Rising slowly
Rising Falling Rising fast
Rising Rising Rising
Factors explaining inequality- External policies -Domestic policies
Dominant Unknown
Dominant Important
Source: author compilation.

29
ReferencesAltimir, Oscar (1996), “Economic Development and Social Equity”, Journal of
Interamerican Studies and World Affairs, Summer/Fall 1996.Anderson, Edward (1999), ‘Globalisation and Inequality in Historical Perspective’,
background paper to the Human Development Report 1999, UNDP, New York.Barro, Robert (1991), ‘Economic growth in a cross section of countries’, Quarterly
Journal of Economics, 106: 407-443.Behrman, Jere, Nancy Birdsall and Miguel Székely (2000) “Economic Reform, and
Wage Differentials in Latin America”, Working Paper of the ResearchDepartment n. 435, Inter-American Development Bank, Washington, D.C.
Bigsten, Arne (2000), “Globalisation and Income Inequality in Uganda’, paperpresented at the Conference on Poverty and Inequality in DevelopingCountries: A Policy Dialogue on the Effects of Globalisation, 30 November- 1December 2000, OECD Development Centre, Paris.
Bourguignon, Francois and Christian Morisson (1989), “Income Distribution,Development and Foreign Trade”, European Economic Review, 34 (1990).
Bourguignon, Francois and Christian Morisson (2001), “Inequality among WorldCitizens” (final version, November 2001), mimeo. The World Bank,Washington.
Caprio, Gerard and Daniela Klingebiel (1996), “Bank Insolvencies: Cross-CountryExperience”, World Bank Policy Research Working Papers 1620, Washington,DC: World Bank.
Chen, Shaohua, Gaurav Datt and Martin Ravallion (1994), ‘Is Poverty Increasing in theDeveloping World?’, Review of Income and Wealth, vol.40, No.4, December,pp. 359-376.
Christiaensen, Luc, Lionel Demery and Stefano Paternostro (2002), ‘Growth,Distribution and Poverty in Africa: Messages from the 1990s’, mimeo, WorldBank, Washington, D.C.
Cornia, Giovanni Andrea (1994), “ Poverty in Latin America in the Eighties: Extent,Causes and Possible Remedies', Giornale degli Economisti e Annali diEconomia, July- September 1994.
Cornia, Giovanni Andrea (1996), “Transition and Income Distribution: Theory,Evidence and Initial Interpretation”, WIDER Research in Progress, No.1,UNU/WIDER, Helsinki.
Cornia, Giovanni Andrea with Sampsa Kiiski (2001) “Trends in Income Distribution inthe Post World War II Period: Evidence and Interpretation”, UNU/WIDERDiscussion Papers, UNU/WIDER, Helsinki, Finland.
Diwan, Ishac (1999) “Labour Shares and Financial Crises”. Preliminary draft. TheWorld Bank, Washington, D.C.
Diwan, Ishac (2000) “Labour Shares and Globalisation”. paper presented at theConference on Poverty and Inequality in Developing Countries: A PolicyDialogue on the Effects of Globalisation, 30 November- 1 December 2000,OECD Development Centre, Paris.
Dollar, David and Art Kraij (2000), ‘Trade, Growth and Poverty’, The World BankDowrick, Steve and Muhammad Akmal (2001), ‘Contradictory Trends in Global
Income Inequality: a Tale of Two Biases’,http://ecocomm.anu.edu.au/economics/staff/dowrick/worl-ineq.pdf
30
Easterly, William (2001), “The Effect of IMF and World Bank Programs on Poverty”,paper prepared for the WIDER Development Conference ‘Growth and Poverty’25-26 May 2001, Helsinki.
Eastwood, Robert and Michael Lipton (2001), “Rural-Urban Dimension of InequalityChange”, UNU/WIDER Working Papers, No. 200, UNU/WIDER, Helsinki,Finland.
Feridhanusetyawan, Tubagus (2000), “Globalisation, Poverty and Equity in Indonesia”,paper presented at the Conference on Poverty and Inequality in DevelopingCountries: A Policy Dialogue on the Effects of Globalisation, 30 November- 1December 2000, OECD Development Centre, Paris.
Fields, Gary and Gyengjoon Yoo (2000), “Falling Labour Income Inequality inKoreas’s Economic Growth: Patterns and Underlying Causes’, Review ofIncome and Wealth, Series 46, number 2, June
Fiszbein, Ariel and George Psacharopoulos (1995). “Income Inequality Trends inLatin America in the 1980s” in Nora Lustig (ed.) Coping with Austerity:Poverty and Inequality in Latin America. Brookings Institution, WashingtonD.C., pages71-100.
Galbraith James and Lu Jiaqing (1999), “Inequality and Financial Crises: Some earlyFindings” UTIP Working Paper Number 9, LBJ School of Public Affairs, TheUniversity of Texas at Austin
Gustafsson Bjorn and Wei Zhong (2000), “How and Why Has Poverty in ChinaChanged?”, processed, forthcoming on China Quarterly
Iglesias, Enrique (1998) “Income Distribution and Sustainable Growth: A LatinAmerican Perspective” in Vito Tanzi and Ke-Young Chu, Income Distributionand High-Quality Growth, The MIT Press, Cambridge Massachussets.
Kayizzi-Mugerwa, Steve (2000), “Globalisation, Growth and Income Inequality: AReview of the African Experience”, paper presented at the Conference onPoverty and Inequality in Developing Countries: A Policy Dialogue on theEffects of Globalisation, 30 November- 1 December 2000, OECD DevelopmentCentre, Paris.
Korea Labour and Society Institute (KLSI) (2001) ‘Overview of current economicconditions’, http://klsi.org
Korzeniewick, Roberto and Timothy Moran, (1997), ‘World-Economic Trends in theDistribution of Income, 1965-1992’, American Journal of Sociology, vol.102:1000-39
Knowles, James, Ernesto Pernia and Mary Racelis (1999), “Social Consequences of theFinancial Crisis in Asia” Economic Staff Paper Number 60, Asian DevelopmentBank, Manila
Jha, Raghbendra (2000) “Reducing Poverty and Inequality in India: Has LiberalisationHelped ?”, UNU/WIDER Working Papers, No. 204, UNU/WIDER, Helsinki,Finland.
Levinshon, James, Steven Berry and Jed Friedman (1999), ‘Impacts of the IndonesianEconomic Crisis: Price Changes and the Poor’ mimeo, University of Michigan.
Li, Honhyi, Lyn Squire, and Heng-fu Zou (1998) “Explaining International andIntertemporal Variations in Income Inequality”, Economic Journal, Vol. 108 No.446.
Lindert, Peter and Jeffrey Williamson (2001), “Does Globalisation Make the WorldMore Unequal ?”, paper presented at the NBER ‘Globalisation in HistoricalPerspective Conference’ in Santa Barbara, California, May 3-6, 2001

31
Mc Culloch, Neil, Bob Baulch and Milasoa Cherel-Robson (2000), “Globalisation,Poverty and Inequality in Zambia”, paper presented at the Conference on Povertyand Inequality in Developing Countries: A Policy Dialogue on the Effects ofGlobalisation, 30 November- 1 December 2000, OECD Development Centre,Paris.
Milanovic, Branko (1998), Income, Inequality, and Poverty during the Transition fromPlanned to Market Economy, The World Bank, Washington D.C.
Milanovic, Branko (2000), "The true world income distribution, 1988 and 1993: Firstcalculations based on household surveys alone”, mimeo (November 2000), TheWorld Bank, Washington DC.
Morley, Samuel (2000), “Distribution and Growth in Latin America in an Era ofStructural Reform”, paper presented at the Conference on Poverty and Inequalityin Developing Countries: A Policy Dialogue on the Effects of Globalisation, 30November- 1 December 2000, OECD Development Centre, Paris.
Mundle, Sudipto, and V.B. Tulasidhar (1998), “Adjustment and Distribution: the IndianExperience”, Occasional Paper, No. 17. Asian Development Bank, ThePhilippines.
Murphy, Kevin, Craig Riddell and Paul Romer (1998), ‘Wage, Skills and Technology inthe United States and Canada’ NBER Working Papers No. 6638.
Oshima, Harri (1998), “Income Distribution Policies in East Asia”, The DevelopingEconomies, XXXVI-4 (December 1998).
Pangestu, Mary (2000), “Social impact of globalisation is Southeast Asia”, paperpresented at the Conference on Poverty and Inequality in Developing Countries:A Policy Dialogue on the Effects of Globalisation, 30 November- 1 December2000, OECD Development Centre, Paris.
Ping, Zhan (1997), “Income Distribution during the Transition in China”, UNU/WIDERWorking Papers, No. 138, UNU/WIDER, Helsinki, Finland.
Ravallion, Martin, Gaurav Datt and Dominique van der Walle (1991), “QuantifyingAbsolute Poverty in the Developing World”, Review of Income and Wealth, vol.37, No. 4, December, pp.345-361.
Ravallion, Martin and Shaohua Chen (1997), “What Can New Survey Data Tell Usabout Recent Changes in Distribution and Poverty?”, World Bank EconomicReview, vol.11, No.2, pp.357-82
Ravallion, Martin and Gaurav Datt (1999), “When is growth pro-poor ? Evidence fromthe diverse experience of Indian states”. Mimeo,The World Bank, Washington,DC.
Rodriguez, Francisco and Dani Rodrik (2000). “Trade Policy and Economic Growth: ASceptic’s Guide to the Cross-National Evidence”, in B.Bernanke and K.Rogoff,NBER Macroeconomics Annual 2000, Cambridge, MA, MIT Press, forthcoming.
Rodrik, Dani (1997). Has Globalization Gone Too Far?, Institute for InternationalEconomics, Washington, DC..
Rodrik, Dani (2000), “Comments on ‘Trade, Growth and Poverty” by D.Dollar, and ArtKraay’, mimeo, Harvard University.
Rutkowski, Jan (1999), “Wage Inequality in Transition Economies of Central Europe:Trends and Pattern in the Late 1990s”. Mimeo, August 1999.
Sachs, Jeffrey and Andrew Warner (1995), “Natural Resource Abundance andEconomic Growth”, NBER Working Papers, No. 5398.
Sainz, Pedro and Alfredo Calcagno (1992), "Em Busca de Otra Modalidad deDesarrollo", CEPAL Review, No. 48, December.

32
Sala-i-Martin, Xavier (2002), ‘The Disturbing ‘Rise’ of Global Income Inequality’,NBER Working Paper Series 8904, National Bureau of Economic Research,Cambridge, MA
Sarntisart, Isra (2000), “ Growth, Structural Change and Inequality: the Experience ofThailand”, UNU/WIDER Working Paper N. 207, World Institute forDevelopment Economics Research, Helsinki
Schultz, T. Paul (1998), ‘ Inequality in the distribution of personal income in the world:how it is changing and why’, Journal of Population Economics, 1998: 307-344.
Slaughter, Matthew (2000), ‘Protectionist Tendencies in the North and VulnerableEconomies in the South’ WIDER Working Paper Series, No.196, September,UNU/WIDER, Helsinki.
Stewart, Frances (n.d.), ‘Globalisation, Liberalisation and Inequality: Expectations andExperience’, mimeo, Queen Elizabeth House, Oxford.
Stiglitz, Joseph (1998) “More Instruments and Broader Goals: Moving toward the Post-Washington Consensus”, UNU/WIDER Annual Lectures, 2, UNU/WIDER,Helsinki, Finland, (January).
Székely, Miguel and Marianne Hilgert (1999), ‘The 1990s in Latin America: AnotherDecade of Persistent Inequality’, Working Paper 410, Research Department ofthe Inter-American Development Bank, Washington, DC.
Taylor, Lance (2000), “External Liberalisation, Economic Performance and Distributionin Latin America and Elesewhere”, UNU/WIDER Working Paper N. 215, WorldInstitute for Development Economics Research, Helsinki
Tokman, Victor (1986), "Ajuste y Empleo: Los Desafios del Presente”, PREALC,Regional Employment Programme for Latin America and the Caribbean.Mimeo. Santiago, Chile
UNCTAD (1997), Trade and Development Report”, UNCTAD, Geneva, Switzerland.UNDP (1999), ‘Human Development Report’, Oxford University Press, Oxford.UNICEF (1997), ‘Regional Monitoring Report’ N.5, Unicef-ICDC, FlorenceWilliamson, Jeffrey (1996), “Globalisation and Inequality then and now: the Late 19th
and late 20th Centuries Compared”, NBER Working Paper Series N.5491,Cambridge
Wood, Adrian (1994), North-South Trade, Employment and Inequality, ClarendonPress, Oxford, United Kingdom.
World Bank (2000), World Development Report 2000/1. Consultation draft, 17 January2000, The World Bank, Washington D.C

CESifo Working Paper Series(for full list see www.cesifo.de)
________________________________________________________________________
778 Antonio Merlo and François Ortalo-Magné, Bargaining over Residential Real Estate:Evidence from England, September 2002
779 Yu-Fu Chen and Michael Funke, Exchange Rate Uncertainty and Labour MarketAdjustment under Fixed and Flexible Exchange Rates, September 2002
780 Michael S. Michael, International Migration, Income Taxes and Transfers: A WelfareAnalysis, September 2002
781 Clemens Fuest and Alfons Weichenrieder, Tax Competition and Profit Shifting: On theRelationship between Personal and Corporate Tax Rates, October 2002
782 Jan Bouckaert and Hans Degryse, Softening Competition by Enhancing Entry: AnExample from the Banking Industry, October 2002
783 Johann K. Brunner and Susanne Pech, Adverse Selection in the Annuity Market withSequential and Simultaneous Insurance Demand, October 2002
784 Gregory D. Hess and Eduard Pelz, The Economic Welfare Cost of Conflict: AnEmpirical Assessment, October 2002
785 Jan Erik Askildsen, Uwe Jirjahn, and Stephen C. Smith, Works Councils andEnvironmental Investment: Theory and Evidence from German Panel Data, October2002
786 Geir H. Bjønnes, Dagfinn Rime, and Haakon O. Aa. Solheim, Volume and Volatility inthe FX-Market: Does it matter who you are?, October 2002
787 John Evans and John Fingleton, Entry Regulation and the Influence of an IncumbentSpecial Interest Group, October 2002
788 Wolfgang Ochel, International Comparisons and Transfer of Labour MarketInstitutions, October 2002
789 B. Gabriela Mundaca, Moral Hazard Effects of Bailing out under AsymmetricInformation, October 2002
790 Gene M. Grossman and Edwin L.-C. Lai, International Protection of IntellectualProperty, October 2002
791 John Hassler, José V. Rodriguez Mora, Kjetil Storesletten, and Fabrizio Zilibotti, APositive Theory of Geographic Mobility and Social Insurance, October 2002
792 Paul De Grauwe and Marianna Grimaldi, The Exchange Rate in a Model withHeterogeneous Agents and Transactions Costs, October 2002

793 Guido Friebel and Mariassunta Giannetti, Fighting for Talent: Risk-shifting, CorporateVolatility, and Organizational Change, October 2002
794 Jan Erik Askildsen, Badi H. Baltagi, and Tor Helge Holmås, Will Increased WagesReduce Shortage of Nurses? A Panel Data Analysis of Nurses’ Labour Supply, October2002
795 Marko Köthenbürger and Panu Poutvaara, Social Security Reform and IntergenerationalTrade: Is there Scope for a Pareto-Improvement?, October 2002
796 Paul De Grauwe and Laura Rinaldi, A Model of the Card Payment System and theInterchange Fee, October 2002
797 Volker Böhm and Tomoo Kikuchi, Dynamics of Endogenous Business Cycles andExchange Rate Volatility, October 2002
798 Mariam Camarero, Javier Ordóñez, and Cecilio Tamarit, The Euro-Dollar ExchangeRate: Is it Fundamental?, October 2002
799 Misa Tanaka, How Do Bank Capital and Capital Adequacy Regulation Affect theMonetary Transmission Mechanism?, October 2002
800 Jörg Baten and Andrea Wagner, Autarchy, Market Disintegration, and Health: TheMortality and Nutritional Crisis in Nazi Germany, 1933-1937, October 2002
801 Saku Aura, Uncommitted Couples: Some Efficiency and Policy Implications of MaritalBargaining, October 2002
802 Wolfram F. Richter, Delaying Integration of Immigrant Labor for the Purpose ofTaxation, October 2002
803 Gil S. Epstein and Shmuel Nitzan, The Politics of Randomness, October 2002
804 John Hassler and José V. Rodriguez Mora, Should UI Benefits Really Fall over Time?,October 2002
805 Friedrich Breyer and Stefan Felder, The Dead-anyway Effect Revis(it)ed, October 2002
806 Assar Lindbeck and Solveig Wikström, E-exchange and the Boundary betweenHouseholds and Organizations, November 2002
807 Dieter Bös, Contests Among Bureaucrats, November 2002
808 Steven Brakman, Harry Garretsen, and Marc Schramm, The Strategic Bombing ofGerman Cities during World War II and its Impact on City Growth, November 2002
809 Florian Englmaier and Achim Wambach, Contracts and Inequity Aversion, November2002

810 Sarbajit Sengupta, Delegating Recruitment under Asymmetric Information, December2002
811 Rajshri Jayaraman, On the Partial Public Provision of a Private Good, December 2002
812 Stéphanie Stolz, Banking Supervision in Integrated Financial Markets: Implications forthe EU, December 2002
813 Christian Keuschnigg, Taxation of a Venture Capitalist with a Portfolio of Firms,December 2002
814 Inés Macho-Stadler and David Pérez-Castrillo, Settlement in Tax Evasion Prosecution,December 2002
815 Rainer Niemann and Dirk Simons, Costs, Benefits, and Tax-induced Distortions ofStock Option Plans, December 2002
816 Jan-Egbert Sturm and Barry Williams, Deregulation, Entry of Foreign Banks and BankEfficiency in Australia, December 2002
817 V. Anton Muscatelli, Patrizio Tirelli, and Carmine Trecroci, Monetary and Fiscal PolicyInteractions over the Cycle: Some Empirical Evidence, December 2002
818 Claude Hillinger, A General Theory of Price and Quantity Aggregation and WelfareMeasurement, December 2002
819 Erkki Koskela and Ronnie Schöb, Optimal Capital Taxation in Economies withUnionised and Competitive Labour Markets, December 2002
820 Sheilagh Ogilvie, Guilds, Efficiency, and Social Capital: Evidence from German Proto-Industry, December 2002
821 Hans Gersbach and Verena Liessem, Financing Democracy, December 2002
822 Costas Hadjiyiannis, Panos Hatzipanayotou, and Michael S. Michael, Optimal TaxPolicies with Private-Public Clean-Up, Cross-Border Pollution and Capital Mobility,December 2002
823 François Ortalo-Magné and Sven Rady, Homeownership: Low Household Mobility,Volatile Housing Prices, High Income Dispersion, December 2002
824 Syed M. Ahsan and Panagiotis Tsigaris, Measuring the Social Discount Rate underUncertainty: A Methodology and Application, December 2002
825 Kai A. Konrad, Altruism and Envy in Contests: An Evolutionarily Stable Symbiosis,December 2002
826 Robert S. Chirinko and Huntley Schaller, A Revealed Preference Approach toUnderstanding Corporate Governance Problems: Evidence from Canada, December2002

827 Geir B. Asheim, Green National Accounting for Welfare and Sustainability: ATaxonomy of Assumptions and Results, December 2002
828 Andrea Gebauer, Chang Woon Nam, and Rüdiger Parsche, Lessons of the 1999Abolition of Intra-EU Duty Free Sales for Eastern European EU Candidates, December2002
829 Giacomo Corneo, Work and Television, December 2002
830 Vivek H. Dehejia and Yiagadeesen Samy, Trade and Labour Standards – Theory, NewEmpirical Evidence, and Policy Implications, December 2002
831 Geir B. Asheim and Wolfgang Buchholz, A General Approach to Welfare Measurementthrough National Income Accounting, December 2002
832 Aaron Tornell and Frank Westermann, The Credit Channel in Middle IncomeCountries, January 2003
833 Gebhard Flaig, Time Series Properties of the German Monthly Production Index,January 2003
834 Campbell Leith and Jim Malley, Estimated Open Economy New Keynesian PhillipsCurves for the G7, January 2003
835 Burkhard Heer and Bernd Süssmuth, Inflation and Wealth Distribution, January 2003
836 Erkki Koskela and Leopold von Thadden, Optimal Factor Taxation under WageBargaining – A Dynamic Perspective, January 2003
837 Carola Grün and Stephan Klasen, Growth, Income Distribution, and Well-Being:Comparisons across Space and Time, January 2003
838 Robert S. Chirinko and Ulf von Kalckreuth, On the German Monetary TransmissionMechanism: Interest Rate and Credit Channels for Investment Spending, January 2003
839 Sascha O. Becker, Andrea Ichino, and Giovanni Peri, How Large is the “Brain Drain”from Italy?”, January 2003
840 Albert Berry and John Serieux, All About the Giants: Probing the Influences on Growthand Income Inequality at the End of the 20th Century, January 2003
841 Robert Fenge and Martin Werding, Ageing and the Tax Implied in Public PensionSchemes: Simulations for Selected OECD Countries, January 2003
842 Robert Fenge and Martin Werding, Ageing and Fiscal Imbalances Across Generations:Concepts of Measurement, January 2003
843 Giovanni Andrea Cornia, The Impact of Liberalisation and Globalisation on IncomeInequality in Developing and Transitional Economies, January 2003