The Impact of Job-Protected Leave on Female Leave-Taking ... · challenging for low-income parents...
51
Transcript of The Impact of Job-Protected Leave on Female Leave-Taking ... · challenging for low-income parents...
The Impact of Job-Protected Leave on Female
Leave-Taking and Employment Outcomes
August 21, 2017
Abstract
This paper provides evidence on the impact of job-protected family leave on female
leave-taking and employment outcomes. I study a state-level paid leave program in
California and exploit the institutional feature that under this program, leave includes
job protection only for women who work at �rms with 50 or more employees. I �nd
that the increase in leave-taking as a result of California's program is largest for women
whose leaves are job-protected. Furthermore, it appears that gains for disadvantaged
subgroups (less-educated, unmarried, and minority new mothers) exist only for the
subsample of women with access to job protection. I then examine the impact of job-
protected leave on female employment. Using a di�erence-in-di�erence-in-di�erences
approach, I compare labor market outcomes for women at large versus small �rms in
California to women at large versus small �rms outside of California after the passage
of paid leave. I �nd that large employers who are forced to o�er job-protected leave
decrease female hiring by 1.1% in favor of less costly male employees. However, I also
�nd that female separations decrease by 1.5% as a result of access to job-protected leave,
so that female employment overall increases slightly. These results provide evidence of
both a supply-side and demand-side e�ect of job-protected leave. Women are more
attached to a labor force that a�ords them �exibility after childbirth, but also are more
costly to employers if they are likely to take leave to care for newborns.
1 Introduction
Two weeks after taking o�ce, President Bill Clinton signed the Family Medical Leave Act
(FMLA) which provided eligible mothers 12 weeks of job-protected unpaid leave after the
1

birth of a newborn. The passage of this legislation represented a major victory for progressive
advocates of family-friendly leave legislation, who had seen two prior iterations of the FMLA
vetoed by President George H.W. Bush. Still, the FMLA is viewed by many as incomplete.
It is available only to workers at �rms with more than 50 employees (meaning over 40 percent
of the labor force is uncovered) and does not come with any wage replacement, making it
challenging for low-income parents to take advantage of this program (Klerman et al. 2012).1
The United States is the only developed country in the world that does not o�er paid
leave to new mothers after the birth of a newborn. In the recent epoch, there has been
advocacy on both the state and federal level to provide access to paid parental leave. Many
states (California, Hawaii, New Jersey, New York, and Rhode Island) extended the FMLA
by providing temporary disability insurance (TDI) for pregnancy related short-term �dis-
abilities.� However, pregnancy-related disability leave is not maternity leave to bond with a
newborn; in fact, much of this leave is typically taken before childbirth.
Beyond these TDI programs, a few states have passed legislation providing for access to
paid family leave: �rst California (passed in 2002 and implemented in 2004), then New Jersey
(passed in 2008 and implemented in 2009), Rhode Island (passed in 2013 and implemented in
2014), New York (to be implemented in 2018), and most recently DC and Washington (both
to be implemented in 2020) (Rossin-Slater 2017, Corte 2017).2 State paid leave in California
and New Jersey di�ers from the federal FMLA in three key ways: (1) unlike FMLA coverage,
it is paid, so it provides wage replacement; (2) employees at �rms of all sizes are eligible for
paid leave; and (3) while FMLA leave is job-protected, paid leave is not�that is, employers
are not required to hold jobs open for employees who decide to take paid leave. Yet, when
1Speci�cally, to be eligible for unpaid FMLA leave, an employee has to have worked for her employer forat least a year and accumulated 1250 work hours. She must work at a location that has 50 employees withina 75-mile radius. �FMLA Eligibility.�
2These programs are very similar to TDI in these states, as they are funded by employee contributions.Family leave in these states can start immediately after TDI ends, so we can understand family leave asproviding citizens of these states access to longer leaves with higher wage replacement. Another di�erencebetween the programs is that TDI applies only to new mothers who may experience childbirth-relateddisability; whereas paid leave in these states is available to new mothers and new fathers in order to bondwith a newborn.
2
employees take FMLA leave and paid leave simultaneously, their leaves are job-protected.
This means that employees at large �rms (50+ employees) in CA and NJ are eligible for job-
protected paid leave, and employees at small �rms (less than 50 employees) are eligible for
paid leave, but without any job protection. In this paper, I compare maternal leave-taking
and female employment outcomes for women at �rms above the FMLA cuto� to those at
�rms below the cuto� to isolate the impact of job-protected leave on female labor market
outcomes.
For the purpose of this paper, I focus on the impact of California's Paid Family Leave (CA-
PFL) program. I focus on California, rather than later paid leave later enacted in New Jersey
and Rhode Island for two main reasons. First, the passage and enactment of New Jersey's
Family Leave Insurance (NJ-FLI) overlaps with the Great Recession, making the immediate
impact of the program challenging to isolate. Second, Rhode Island is excluded because
its program is even more nascent than New Jersey's (enacted in 2014) and is structured
di�erently, with job protection provided for female employees, regardless of �rm size. Further
work should compare the impact of Rhode Island's program to those in California and New
Jersey. If the hypotheses in this paper are valid, the di�erence between small and large �rms
I document should not exist in Rhode Island.
This paper is novel in its consideration of the interaction between CA-PFL and the FMLA
to isolate the impact of access to job protection on female leave-taking and employment
outcomes. The contribution of this paper is twofold. I �rst consider the impact of access
to job protection on maternity leave. I begin by replicating work done by Rossin-Slater
et al. (2013), who establish that CA-PFL doubled the use of maternity leave, increasing
it from an average of three to six weeks for new mothers. I then extend their work to
show that these gains are largest for women who work at large �rms, and thus have access
to job protection: average leave-taking after the passage of CA-PFL for the small �rm
subgroup increases to around 3.3 weeks; average leave-taking for large �rm employees (with
access to job protection) is more than twice as long, increasing to nearly 7 weeks. I further3
establish that gains for disadvantaged (minority, unmarried, and less-educated) new mothers
are concentrated in the large �rm subsample. My evidence suggests that access to paid leave
is not su�cient for new mothers who cannot a�ord to take unpaid FMLA leave after the
birth of a newborn; instead, job protection is pivotal for these women.3
I then consider both supply and demand-side impacts of CA-PFL on female employ-
ment. I use data from the publicly available Census LEHD database, which allows me to
explore �rm employment across the U.S. and understand industry dynamics and individual
employment trajectories. I utilize a standard di�erence-in-di�erence-in-di�erences (DDD)
approach, comparing female employment at large vs. small �rms in California to large vs.
small �rms outside of California to identify the causal e�ects of the provision of paid leave
with job protection on female labor market outcomes. On the demand-side, female hiring at
large �rms decreases by .06 percentage points (1.1%) after the passage of CA-PFL. This is in
line with Summers (1989) and Gruber (1992) who caution that group-speci�c mandates (like
access to job-protected paid leave) that have a disproportionate impact on the behavior of
one group (women of child-bearing age) can make this group more expensive to hire relative
to their older and male counterparts.4 But �exible workplace policies have an impact on
labor force attachment as well (Byker 2016). On the supply side, the share of child-bearing
age female separations decreases post-CA-PFL by .07 percentage points (1.5%). My sep-
arations result is larger in magnitude than the hires result, meaning the overall impact of
job-protected leave on female employment appears to be slightly positive. To evaluate the
causal interpretation, I perform a series of robustness checks that suggest that my results
are in fact attributable to the extension of paid leave in California. When comparing �rm
sizes una�ected by the FMLA cuto� and looking at the impact of paid leave on women not
3This �nding relates to work by Fass (2009) who highlights the importance of job-protected leave for low-income new mothers and Carneiro et al. (2015), who �nds that in Norway, transitioning to paid job-protectedleave from a system of unpaid leave has large gains for disadvantaged women
4Empirical work by DeLeire (2000) and Acemoglu and Angrist (2001) considers the unintended conse-quences of group-speci�c mandates in a di�erent context�the Americans with Disabilities Act��nding adecline in employment for disabled workers after the law's passage that they attribute to increased employercosts of accommodation of disabilities.
4
of childbearing age, I �nd no statistically signi�cant decrease in female hires or separations
post-CA-PFL.
The idea that there is both a supply and demand-side impact of leave legislation is
consistent with recent work by Das and Polachek (2015) who note that while labor force
participation increases for young women post-CA-PFL, unemployment duration also goes up.
My �ndings are also related to recent work by Bana et al. (2017) who use administrative data
from CA-PFL to demonstrate that larger leave bene�ts increase the likelihood of returning
to an employee's pre-leave �rm, thus reducing costly turnover costs for employers.
My conclusion o�ers some avenues for future research and implications for policy. I
demonstrate the importance of access to job protection for family leave to be a realistic option
for less-advantaged new parents. Encouraging more men to make use of family leave could
make it more di�cult for employers to substitute away from leave-likely women. Additionally,
educating employers about the bene�ts of paid leave extension and encouraging them to
develop cost-e�ective ways to adjust to employee leave-taking will make leaves less costly
and thus result in fewer negative externalities.
The remainder of the paper is organized as follows. Section 2 provides additional back-
ground on the FMLA and CA-PFL. Section 3 provides detail on the data I use. Section
4 follows the methodology of Rossin-Slater et al. (2013) and establishes that increases in
leave-taking are largest for women with access to job protection. Section 5 provides sugges-
tive evidence that access to paid leave decreases employers' desire to hire women, while also
increasing female labor force attachment. Section 6 concludes.
5
2 Institutional details
2.1 The U.S. is a leave outlier
The federal FMLA, which requires covered employers to provide employees with job-protected
unpaid leave for qualifying medical and family reasons, including the birth or adoption of
a newborn, has made it easier for parents to spend time with their children in early life,
which is related to superior later-life outcomes.5 Since its enactment, the FMLA has been
used more than 200 million times by women and men who have taken leave to care for their
own health or the health of their family members.6 Still, critics of the FMLA cite various
de�ciencies with the program. Most glaringly, as discussed above, the FMLA does not cover
employers with fewer than 50 employees and provides access only to unpaid leave, making
it di�cult for low-income families to utilize the program. It is estimated that nearly two-
thirds of eligible workers do not take FMLA leave because they are unable to handle the
�nancial burden of unpaid leave (Reagan 2013). Likely stemming from the de�ciencies of
the FMLA, the extension of paid leave in the United States has become a popular policy
issue and one of recent focus for state and local legislators who aim to make the workplace
more family-friendly (Miller 2017).
The United States is the only industrialized country in the world without a national
system of paid parental leave (Rossin-Slater 2017). A 2014 report by the International
Labour Organization of the United Nations surveyed 185 countries and found that only
three�the United States, Oman, and Papua New Guinea�failed to o�er cash bene�ts to
women during maternity leave.7 Compared to the US, the rest of the developed world's
5See Rossin-Slater (2017) for an extensive overview of the impact of family leave policies on children.Some relevant work includes Carneiro et al. (2015) for impact of leave policies on school dropout rates,Ruhm (2000) for impact on child mortality, Stearns (2015) and Rossin (2011) for leave provision reducinglow birth weight births, Stearns (2015) �nds these concentrated for disadvantaged groups. However somework �nds little impact of leave-taking on children in early childhood or on long-term educational attainmentor earnings, e.g. Baker and Milligan (2015), Dustmann and Schonberg (2012).
6�Family Medical Leave Act at 22.� (2015).7�Maternity and Paternity at Work: Law and Practice Around the World.� International Labour Orga-
nization. 2014.
6
paid leave o�erings are extremely generous�Canada provides for a year of paid leave, with
around 55% of wages replaced; and European countries provide upwards of �fteen weeks of
maternity leave with 70 to 100% of wages replaced (Addati et al. 2014). In the Middle East,
leaves are typically shorter (for a period of on average 14 weeks) but come with 100% wage
replacement for women during this period.8 Paternity leave is more limited; but still about
50 percent of countries o�er access to paid leave for new fathers, and this leave is almost
always paid (Rossin-Slater 2017).
Given the interest in �exible workplace policies and the fact that the US is an outlier in
the parental leave space, proponents of a federal program of paid leave have emerged in the
private sector, political, and academic spheres. Industry leaders like YouTube CEO Susan
Wojcicki9 and Facebook founder Mark Zuckerberg, among many others, have campaigned for
access to paid leave and for paternity leave bene�ts.10 And in the most recent presidential
election cycle, Democratic candidate Hillary Clinton put forth a plan to guarantee up to
twelve weeks of paid leave and ensuring a two-thirds wage replacement rate for workers,11
and President Trump has promised access to six weeks of paid maternity leave for new
mothers.12
2.2 State-level paid leave in California
CA-PFL o�ers six weeks of partially paid leave to bond with a newborn or a recently placed
foster or adoptive child, or to care for a sick family member (Rossin-Slater et al. 2013). For
�bonding� claims �led to spend time with a newborn, the six weeks of leave must be taken
within the �rst year of the child's birth, adoption, or foster placement.13 CA-PFL operates
8An outlier here is Syria, which meets ILO standards by providing 120 days of leave to new mothersand 100% of earnings during this period, though this generous leave is o�ered only for the birth of the�rst child. �Maternity and Paternity at Work: Law and Practice Around the World.� International LabourOrganization. 2014.
9Wojcicki (2014).10Zuckerberg took two months of paternity leave to spend time with his own newborn, see Bravo (2015).11Clinton (2015).12But no similar provision for new fathers, Sullivan and Costa (2016).13�Paid Family Leave Factsheet.� Employment Development Department. State of California.
7
through the state's short-term disability insurance (SDI) program, meaning that funding
comes entirely from employee contributions.14 Unlike the relatively limited coverage under
the FMLA, almost all private-sector workers are eligible for CA-PFL. Wage replacement
with CA-PFL far from complete, but it is substantial, providing 55% of a worker's wages
(up to a ceiling based on the state's average salary) (Rossin-Slater et al. 2013).
Women are much more likely to take parental leave, and take much longer leaves; as such,
the impact of leave programs on labor-market outcomes is more pronounced for women of
childbearing age than for their male (or older female) counterparts (Bartel et al. 2015). In
2013, 14 percent of employed mothers with a child under age 1 reported being on leave,
compared to only two percent of employed fathers with a child under the age of 1 (Bartel et
al. 2015).
Despite the fact that employees pay through deductions for paid-leave provisions, aware-
ness (and consequently use of paid leave o�erings) remains surprisingly low. A 2009--2010
survey found that fewer than half of Californians who recently experienced a qualifying event
under CA-PFL knew of the program's existence, and awareness is lowest for workers who
earn less than $30,000 annually (Engeman 2012). Even among those with awareness of paid
family leave, usage may be limited because of the lack of job protection for workers un-
der CA-PFL. However, employees who are covered by the FMLA (at �rms with more than
50 employees in a 75-mile radius of their worksite) must take CA-PFL and FMLA leave
concurrently, and thus receive job protection even for their paid leaves.
The provision of job-protected leave increases the �ring cost of employers at large �rms
by precluding the dismissal of employees for taking costly leaves. This distinction is key to
my identi�cation strategy, as I test the impact of CA-PFL on leave-taking and employment
outcomes for new mothers at �rms above and below this 50-employee FMLA cuto�. Under-
standing precisely what is meant by job protection�and how its unavailability may impact
employee and employer behavior�is thus key to my analysis.
14Ibid, the same is true for New Jersey and Rhode Island's programs.
8
In the context of the FMLA, if employees believe they were terminated for taking leave,
they are permitted to bring suit against their employers through an FMLA inference claim.
While the speci�cs of the case law di�er in di�erent circuits, broadly for an FMLA inference
claim to stand, employees must prove that 1) they were eligible for FMLA leave; 2) an adverse
action by their employer limited their ability to take FMLA leave; and 3) the adverse action
was precipitated by their taking of leave or request to take leave (Brown v. ScriptPro, LLC.
700 F. 3d 1222). An employer's intent is not directly relevant to the interference analysis
(Grace v. USCAR, 521 F.3d 655, 670. 6th Cir. 2008), but if an employer can pro�er a
legitimate business reason for an employee's termination�one unrelated to interfering with
FMLA rights�then the burden shifts to the employee to refute this reason (Donald v. Sybra,
Inc. 667 F.3d 7 757 762. 6th Cir. 2012). As such, it is an overstatement to suggest that
workers cannot be �red while taking FMLA leave. As long as the termination is for a
legitimate business reason unrelated to leave-taking, it is lawful. Practically, though, by
�ring workers while on leave (or by �ring workers who have given notice that they will take
FMLA leave) employers are opening themselves up to costly litigation.
The same is not true for paid leave. Workers can be dismissed for taking (or announcing
an intent to take) paid leave when their jobs are not federally protected by the FMLA.
This means that around 40% of California's workers could be �red for taking CA-PFL.
Unsurprisingly, the threat of job loss in�uences employee leave-taking patterns. A 2011
survey found that 37% of workers who knew about the existence of PFL decided not to
take it because they were worried that if they took PFL �their employer would be unhappy,
that their opportunities for advancement would be a�ected, or that they might actually be
�red.�15
This distinction is important to my study for many reasons. First, it is clear that the
provision of job protection will make paid leave more expensive for larger �rms relative to
their smaller counterparts because (1) more employees will take leave (and often for longer)
15Appelbaum and Milkman (2011).
9

without the worry that they can be lawfully terminated for their decision to do so;16 and
(2) thus employers will have to hold jobs open for workers who take leave, for example by
hiring and training a temporary worker or paying current employees a premium for working
extra hours. The employer cost of CA-PFL is illustrated by opposition to a recent bill in
the California state legislature that would have extended job protection under CA-PFL to
businesses with more than 20 employees. California Governor Jerry Brown ultimately vetoed
the bill in the face of tremendous opposition from small businesses: the California Chamber
of Commerce labeled the proposed bill a �job killer� for the reasons discussed above (Barrera
2016).
3 Data and Methodology
3.1 Impact of CA-PFL on female leave-taking
3.1.1 Data: March Current Population Survey
I �rst study the impact of CA-PFL on maternal leave-taking, following Rossin-Slater et al.
(2013), who use data from the March Current Population Survey (CPS) Annual Demographic
Supplement, accessed via the Integrated Public Use Microdata Series (IPUMS) database.
The March CPS provides detailed information on leave-taking and labor market outcomes for
a large and nationally representative sample. Since 1994, survey respondents have been able
to indicate that they were absent from work in the prior week because of maternity/paternity
absence. An important limitation of the March CPS is it does not provide precise information
on child birth dates and women's employment status during the period of pregnancy. I am
able to observe only whether a new parent in the labor force was absent from the labor
force in the prior week because of family leave; not whether new mothers drop out of the
labor force in advance of giving birth. Importantly for my analysis, since 1988 the March
16This is consistent with the leave results documented by Bartel et al. (2015) who estimate that CA-PFLincreases fathers' leave-taking by approximately 2.4 days and mothers' leave-taking by 6 days.
10
CPS supplement has included a question on �rm size. This allows me to tease out whether
increases in leave-taking are driven by the subsample of workers who have access to paid
leave with job protection (employees at �rms with 50+ employees) relative to those who are
below the FMLA cuto� and thus do not have access to job-protected paid leave.17
Like Rossin-Slater et al. (2013) I analyze leave-taking using a di�erence-in-di�erence ap-
proach and a variety of dependent variables. The baseline leave variable classi�es women as
leave-takers if they report being on maternity leave in the prior week. However, because new
mothers (and fathers, though not the focus of my analysis) may be on CA-PFL leave and
misreport on the March CPS, I follow Rossin-Slater et al. (2013) and construct a �broad�
family leave variable that also characterizes a new parent reporting time o� work for vaca-
tion/personal days, child care problems, and other family-related reasons as a leave-taker. As
a placebo, following Rossin-Slater et al. (2013) I also provide results for only �other leave,�
which includes all of the broader leave responses with the exception of maternity/paternity
leave to determine whether any of the impact of CA-PFL that I document is driven by in
leave-taking generally rather than maternity leave speci�cally. The main speci�cation in-
volves comparing leave-taking by women in California whose youngest child was born within
the last year to leave-taking by women in California whose youngest child is aged 5-17. Un-
fortunately, the March CPS has not consistently asked about �rm size categories directly
above/below the 50-employee FMLA cuto�. Thus, I label women at �rms with fewer than
25 employees as �small �rm employees� and those with more than 100 employees as �large
�rm� employees.
17Like Rossin-Slater et al. (2013) I use the sample period of 1999-2010 in e�orts to make my results ascomparable to theirs. Importantly, the �rm size question on the March CPS is known to be a problematic one,as the Department of Labor has acknowledged. Many respondents provide answers about the establishmentor location of work rather than the overall size of the �rm. Additionally, prior to March 2011 there were�rm size partitions at 10 or fewer, 25 or fewer, and 100 or fewer employees, rather than 10, 50, and 100, asis the new standard. As such, I compare leave-taking by survey respondents who work at small �rms (25 orfewer employees) to large �rms (100+ employees). The lack of precision in the data biases against my �ndingdi�erences in the small and large �rm subsample because employees who report working at a small �rm mayin fact work at small establishments that are part of large �rms required to provide access to job-protectedleave.
11

3.1.2 Methodology: DD approach comparing leave-taking by new mothers in
CA to various control groups18
I follow Rossin-Slater et al. (2013) and employ a di�erence-in-di�erence design, comparing
changes in the outcomes for California women with infants surveyed before and after the
implementation of California's paid family leave. My baseline empirical strategy involves
estimating the below regression speci�cation for (1) the full sample, replicating the results of
Rossin-Slater et al. (2013); (2) the large �rm subsample; and (3) the small �rm subsample.
The baseline regression estimated is:
Yit = β0 + β1 ∗ Treati + β2 ∗ Postt ∗ Treati + γ′Xit + δt + εit
for an individual surveyed in year t. Yit is the dependent variable of interest, equal to
1 for the use of leave (for various de�nitions); Treati is a dummy variable equal to 1 for
California mothers whose youngest child is less than 1 on the survey date; Postt is a dummy
variable equal to 1 if the individual was surveyed in the year following the implementation of
CA-PFL (2005 or later) and 0 otherwise; Xit is a set of individual-level controls for standard
demographic characteristics: marital status, race, education, age, and birthplace; and δt is
a vector of general year-e�ects. The coe�cient of interest β2 measures the DD estimate of
CA-PFL on the treatment group of new mothers in California.
The key identi�cation assumption in this DD strategy is that changes in the leave out-
comes would have been the same for treatment and control groups if CA-PFL had not been
implemented. This is a fundamentally untestable assumption, to address it Rossin-Slater et
al. (2013) (and I, following their design) include a variety of control groups: (1) women in
California with a youngest child ages 5�17 (the main speci�cation of interest); (2) women in
California with no children; (3) women with young children in the next three largest states:
18The �rst part of my paper is a replication of Rossin-Slater et al. (2013) which then extends the author'swork by estimating their speci�cations separately for the large and small �rm subgroup. As such, themethodology I adopt below is exactly the methodology they implement in their work, and I adopt theirnotation for ease of comparison.
12
Florida, New York, and Texas; and (4) mothers with infants residing in all states other than
CA. As a placebo and further check on the veracity of this assumption, I obtain a set of
DD estimates for other states with temporary disability insurance programs�Hawaii, New
York, and Rhode Island�but that did not implement paid family leave policies during the
treatment period examined (1999�2010). These states o�er some access to paid leave, and if
I am simply capturing di�erences in leave-taking that are correlated with the period when
CA-PFL was passed, I would expect to see increases for California, as well as the other TDI
states.
The estimates of the impact of CA-PFL are potentially biased if patterns of fertility (i.e.
typical age of new mothers) are impacted by CA-PFL or if CA-PFL induces migration into
California (or into large �rms relative to small �rms, which are forced to o�er job-protected
leave through the FMLA) to take advantage of the existence of (job-protected) paid leave.
Like Rossin-Slater et al. (2013), I �nd it unlikely that the behavioral impact of CA-PFL
is a signi�cant contributor to the increased leave-taking documented, especially given that
awareness of the bene�t program, even for the subsample of employees eligible in California,
is fairly low (Applebaum and Milkman 2011). In Table 1, I present summary statistics for
employment composition overall, and at large and small �rms separately, in California for
my treatment group of mothers who gave birth in the last year.19 There is little evidence of
any drastic changes in demographic characteristics of employees as a result of the passage of
CA-PFL.
For these DD estimates, it is not possible to cluster standard errors at the treatment
group-level because most speci�cations contain only a control and treatment group within the
same state (California). As an alternative, I follow the two-step method developed by Donald
and Lang (2007) and utilized by Rossin-Slater et al. (2013) to account for potential serial
correlation in the error structure. As a �rst step, I calculate regression-adjusted di�erences
19Table A1 has much more extensive descriptive statistics and also includes summary information for theother control groups studied.
13
in outcomes between the treatment and comparison groups in each survey-year:
Yit = γ′Xit + π′t ∗ Treati + γt + εit
for each individual i surveyed in year t. The vector π′t contains regression-adjusted
di�erences between the treatment and comparison groups for each survey-year. In the second
stage, I collapse the di�erences into survey-year cells and estimate
π̂ = ρ0 + ρ1 ∗ Postt + ut
where the key coe�cient of interest ρ1 if non-zero implies that the di�erence in leave-
taking between the treatment and control group changes after the implementation of CA-
PFL. Because the second stage of Donald and Lang in this case is a regression with only 12
observations, I use a t-distribution with 10 degrees of freedom instead of a standard normal
distribution to test for statistical signi�cance.20
For models with the control group as mothers in all other states, I am able to compare the
coe�cients and standard errors obtained using this DL method to those from the DD method
with robust standard errors clustered at the state level, and obtain comparable results with
both approaches. I report the latter.
3.2 Impact of CA-PFL on Female Labor Market Outcomes
3.2.1 Data: Census Longitudinal Employer-Household Dynamics Quarterly Work-
force Indicators
I then use data from the publicly available Census Longitudinal Employer-Household Dy-
namics (LEHD) partnership to estimate the causal impact of CA-PFL on female employment.
LEHD integrates data from state-supplied administrative records on workers and employers
20I use March CPS Supplement person weights for each survey year.
14
with censuses, surveys, and other administrative databases to provide longitudinal data on
US employment patterns.21 The primary data for my analysis are from the LEHD �ag-
ship product, the Quarterly Workforce Indicators (QWI), which provides information about
trends in employment, hiring, job creation and destruction, with detail on both �rm and
employee characteristics, i.e. data on �rm size, and employee race, gender and educational
background. 2223 The LEHD data on �rm size are preferable to the March CPS because the
�rm size buckets allow for focus on �rms right below (20-49 employees) and �rms directly
above (50-249 employees) the FMLA cuto�. However, these data are still limited by the fact
that I am not able to observe �rm size directly. An ideal test would allow the use of �rm
level micro-data to construct more helpful groupings; unfortunately, the publicly available
data do not allow for this level of granularity.
Because data is reported at the �rm size-quarter level, the QWI allows us to determine if
the impact of CA-PFL is di�erent in �rms above and below the 50-person cuto�. Addition-
ally, QWI publicly available data allows for industry-level analysis. This is relevant because
recent work (e.g. Bartel et al. 2015) has suggested that there are di�erential patterns of
leave-taking for di�erent industries/occupations, �nding for example that fathers in occu-
pations with a high share of female workers are more leave-likely. QWI industry-level data
also facilitates the inclusion of industry �xed e�ects.
The publicly available LEHD data has important limitations. While allows for investiga-
tion of �rm employment patterns based on employee (1) sex and education; (2) sex and age;
(3) sex and race. Unfortunately, I am not able to examine these employee characteristics
simultaneously. Based on both theory (Gruber 1992, 1994) and past empirical work on this
topic (i.e. Ross 2013), I hypothesize that on the demand side paid leave most negatively
21�Local Employment Dynamics.� 201522This data is at a national level. While unfortunate, I do not think it argues against my �ndings because
(1) it biases them downward, since I am comparing �rms that are de�nitely below the FMLA cuto� to amix of �rms above and below and (2) more than 95% of �rms have only one establishment, and those thatdo not are super-large �rms that I do not consider in this paper (BLS).
23�Local Employment Dynamics.� 2015
15
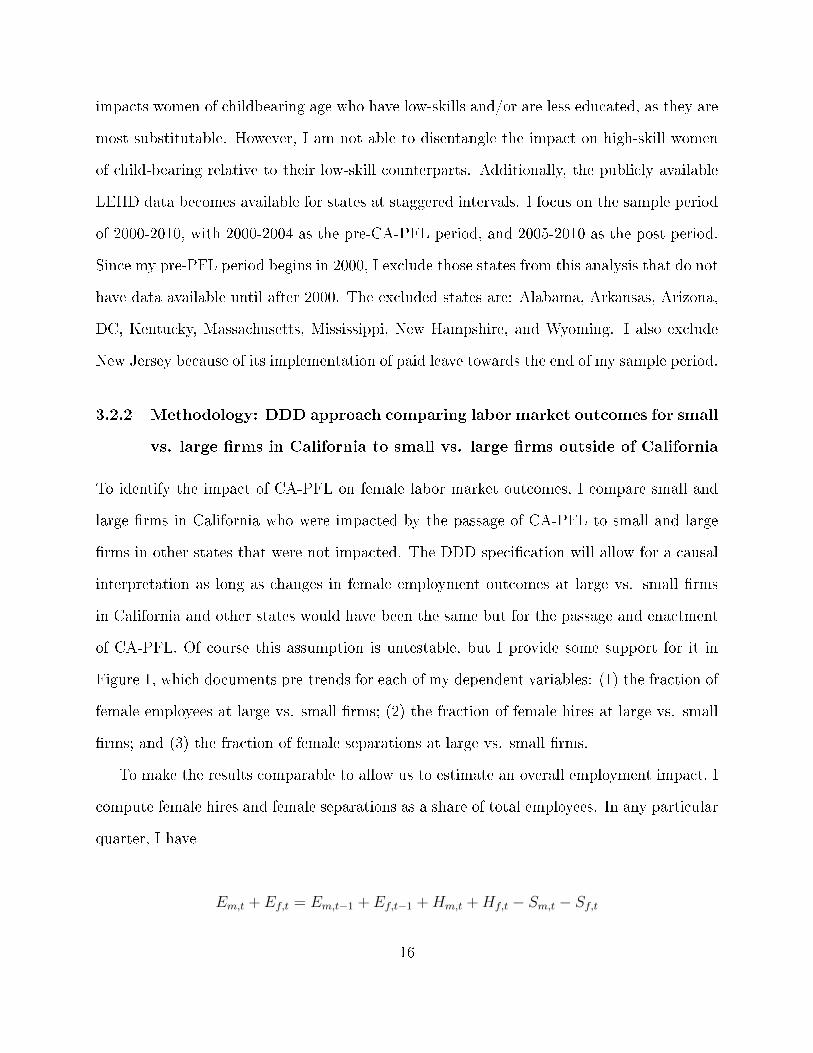
impacts women of childbearing age who have low-skills and/or are less educated, as they are
most substitutable. However, I am not able to disentangle the impact on high-skill women
of child-bearing relative to their low-skill counterparts. Additionally, the publicly available
LEHD data becomes available for states at staggered intervals. I focus on the sample period
of 2000-2010, with 2000-2004 as the pre-CA-PFL period, and 2005-2010 as the post period.
Since my pre-PFL period begins in 2000, I exclude those states from this analysis that do not
have data available until after 2000. The excluded states are: Alabama, Arkansas, Arizona,
DC, Kentucky, Massachusetts, Mississippi, New Hampshire, and Wyoming. I also exclude
New Jersey because of its implementation of paid leave towards the end of my sample period.
3.2.2 Methodology: DDD approach comparing labor market outcomes for small
vs. large �rms in California to small vs. large �rms outside of California
To identify the impact of CA-PFL on female labor market outcomes, I compare small and
large �rms in California who were impacted by the passage of CA-PFL to small and large
�rms in other states that were not impacted. The DDD speci�cation will allow for a causal
interpretation as long as changes in female employment outcomes at large vs. small �rms
in California and other states would have been the same but for the passage and enactment
of CA-PFL. Of course this assumption is untestable, but I provide some support for it in
Figure 1, which documents pre-trends for each of my dependent variables: (1) the fraction of
female employees at large vs. small �rms; (2) the fraction of female hires at large vs. small
�rms; and (3) the fraction of female separations at large vs. small �rms.
To make the results comparable to allow us to estimate an overall employment impact, I
compute female hires and female separations as a share of total employees. In any particular
quarter, I have
Em,t + Ef,t = Em,t−1 + Ef,t−1 +Hm,t +Hf,t − Sm,t − Sf,t
16
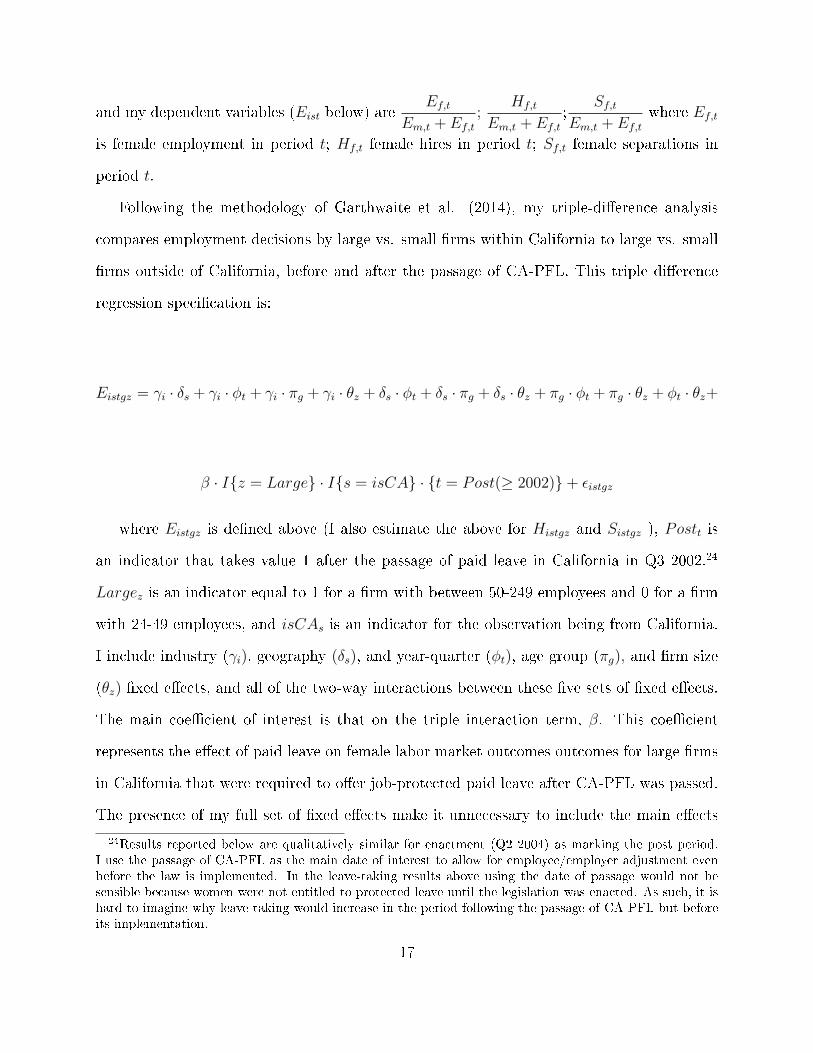
and my dependent variables (Eist below) areEf,t
Em,t + Ef,t
;Hf,t
Em,t + Ef,t
;Sf,t
Em,t + Ef,t
where Ef,t
is female employment in period t; Hf,t female hires in period t; Sf,t female separations in
period t.
Following the methodology of Garthwaite et al. (2014), my triple-di�erence analysis
compares employment decisions by large vs. small �rms within California to large vs. small
�rms outside of California, before and after the passage of CA-PFL. This triple di�erence
regression speci�cation is:
Eistgz = γi · δs + γi · φt + γi · πg + γi · θz + δs · φt + δs · πg + δs · θz + πg · φt + πg · θz + φt · θz+
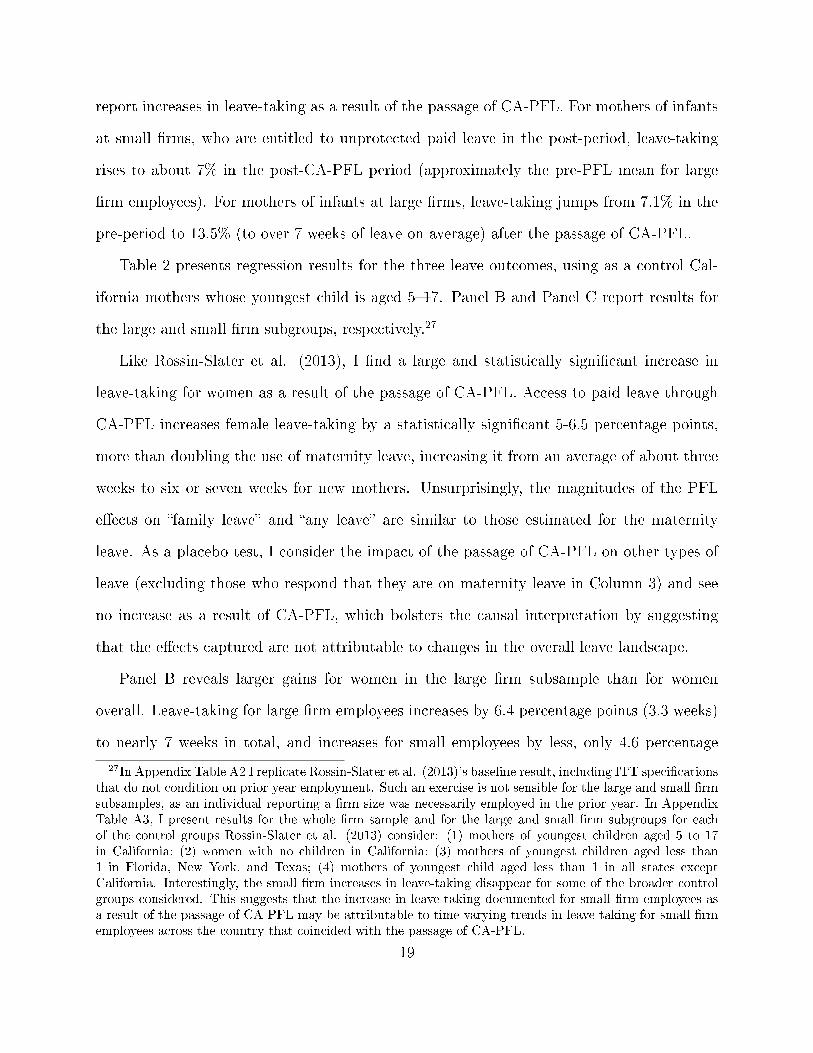
β · I{z = Large} · I{s = isCA} · {t = Post(≥ 2002)}+ εistgz
where Eistgz is de�ned above (I also estimate the above for Histgz and Sistgz ), Postt is
an indicator that takes value 1 after the passage of paid leave in California in Q3 2002.24
Largez is an indicator equal to 1 for a �rm with between 50-249 employees and 0 for a �rm
with 24-49 employees, and isCAs is an indicator for the observation being from California.
I include industry (γi), geography (δs), and year-quarter (φt), age group (πg), and �rm size
(θz) �xed e�ects, and all of the two-way interactions between these �ve sets of �xed e�ects.
The main coe�cient of interest is that on the triple interaction term, β. This coe�cient
represents the e�ect of paid leave on female labor market outcomes outcomes for large �rms
in California that were required to o�er job-protected paid leave after CA-PFL was passed.
The presence of my full set of �xed e�ects make it unnecessary to include the main e�ects
24Results reported below are qualitatively similar for enactment (Q2 2004) as marking the post period.I use the passage of CA-PFL as the main date of interest to allow for employee/employer adjustment evenbefore the law is implemented. In the leave-taking results above using the date of passage would not besensible because women were not entitled to protected leave until the legislation was enacted. As such, it ishard to imagine why leave-taking would increase in the period following the passage of CA-PFL but beforeits implementation.
17
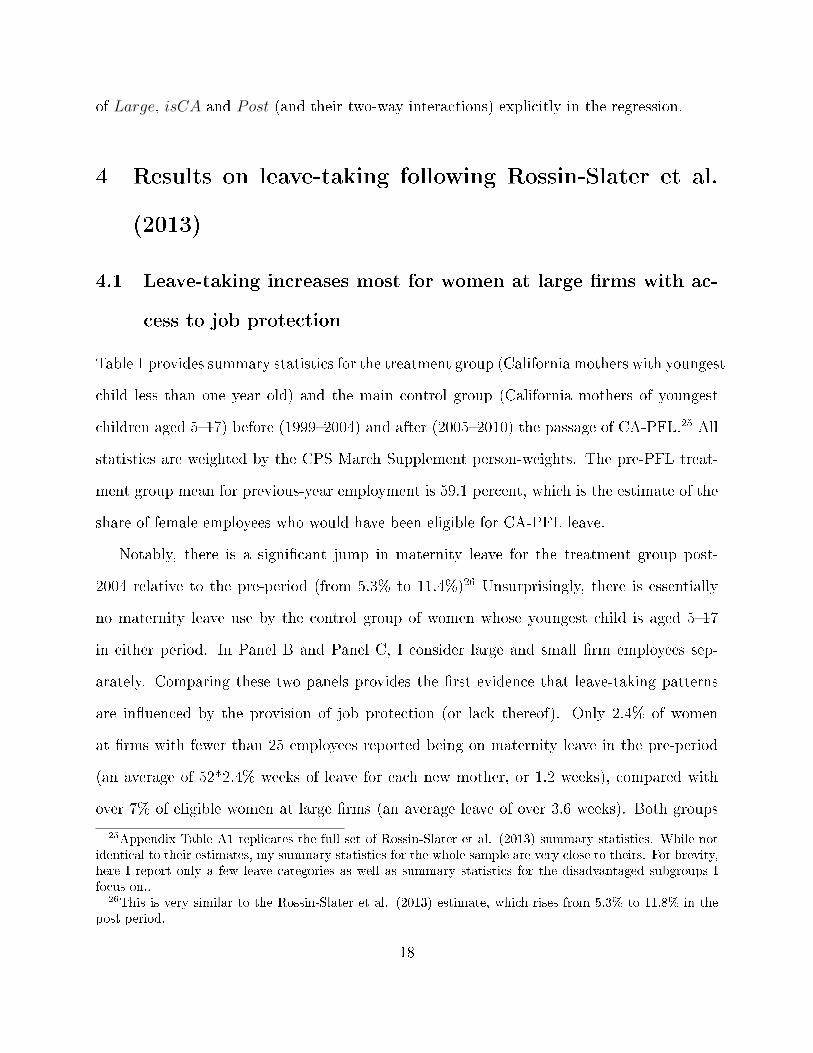
of Large, isCA and Post (and their two-way interactions) explicitly in the regression.
4 Results on leave-taking following Rossin-Slater et al.
(2013)
4.1 Leave-taking increases most for women at large �rms with ac-
cess to job protection
Table 1 provides summary statistics for the treatment group (California mothers with youngest
child less than one year old) and the main control group (California mothers of youngest
children aged 5�17) before (1999�2004) and after (2005�2010) the passage of CA-PFL.25 All
statistics are weighted by the CPS March Supplement person-weights. The pre-PFL treat-
ment group mean for previous-year employment is 59.1 percent, which is the estimate of the
share of female employees who would have been eligible for CA-PFL leave.
Notably, there is a signi�cant jump in maternity leave for the treatment group post-
2004 relative to the pre-period (from 5.3% to 11.4%)26 Unsurprisingly, there is essentially
no maternity leave use by the control group of women whose youngest child is aged 5�17
in either period. In Panel B and Panel C, I consider large and small �rm employees sep-
arately. Comparing these two panels provides the �rst evidence that leave-taking patterns
are in�uenced by the provision of job protection (or lack thereof). Only 2.4% of women
at �rms with fewer than 25 employees reported being on maternity leave in the pre-period
(an average of 52*2.4% weeks of leave for each new mother, or 1.2 weeks), compared with
over 7% of eligible women at large �rms (an average leave of over 3.6 weeks). Both groups
25Appendix Table A1 replicates the full set of Rossin-Slater et al. (2013) summary statistics. While notidentical to their estimates, my summary statistics for the whole sample are very close to theirs. For brevity,here I report only a few leave categories as well as summary statistics for the disadvantaged subgroups Ifocus on..
26This is very similar to the Rossin-Slater et al. (2013) estimate, which rises from 5.3% to 11.8% in thepost period.
18
report increases in leave-taking as a result of the passage of CA-PFL. For mothers of infants
at small �rms, who are entitled to unprotected paid leave in the post-period, leave-taking
rises to about 7% in the post-CA-PFL period (approximately the pre-PFL mean for large
�rm employees). For mothers of infants at large �rms, leave-taking jumps from 7.1% in the
pre-period to 13.5% (to over 7 weeks of leave on average) after the passage of CA-PFL.
Table 2 presents regression results for the three leave outcomes, using as a control Cal-
ifornia mothers whose youngest child is aged 5�17. Panel B and Panel C report results for
the large and small �rm subgroups, respectively.27
Like Rossin-Slater et al. (2013), I �nd a large and statistically signi�cant increase in
leave-taking for women as a result of the passage of CA-PFL. Access to paid leave through
CA-PFL increases female leave-taking by a statistically signi�cant 5-6.5 percentage points,
more than doubling the use of maternity leave, increasing it from an average of about three
weeks to six or seven weeks for new mothers. Unsurprisingly, the magnitudes of the PFL
e�ects on �family leave� and �any leave� are similar to those estimated for the maternity
leave. As a placebo test, I consider the impact of the passage of CA-PFL on other types of
leave (excluding those who respond that they are on maternity leave in Column 3) and see
no increase as a result of CA-PFL, which bolsters the causal interpretation by suggesting
that the e�ects captured are not attributable to changes in the overall leave landscape.
Panel B reveals larger gains for women in the large �rm subsample than for women
overall. Leave-taking for large �rm employees increases by 6.4 percentage points (3.3 weeks)
to nearly 7 weeks in total, and increases for small employees by less, only 4.6 percentage
27In Appendix Table A2 I replicate Rossin-Slater et al. (2013)'s baseline result, including ITT speci�cationsthat do not condition on prior year employment. Such an exercise is not sensible for the large and small �rmsubsamples, as an individual reporting a �rm size was necessarily employed in the prior year. In AppendixTable A3, I present results for the whole �rm sample and for the large and small �rm subgroups for eachof the control groups Rossin-Slater et al. (2013) consider: (1) mothers of youngest children aged 5 to 17in California; (2) women with no children in California; (3) mothers of youngest children aged less than1 in Florida, New York, and Texas; (4) mothers of youngest child aged less than 1 in all states exceptCalifornia. Interestingly, the small �rm increases in leave-taking disappear for some of the broader controlgroups considered. This suggests that the increase in leave-taking documented for small �rm employees asa result of the passage of CA-PFL may be attributable to time-varying trends in leave-taking for small �rmemployees across the country that coincided with the passage of CA-PFL.
19

points (2.4 weeks), making average leave post CA-PFL about half as long for small �rm
new mothers compared to their large �rm counterparts. Said another way, the extension of
paid leave does not bridge the pre-CA-PFL gap in leave-taking for large and small �rm new
mothers. Many women at small �rms still cannot a�ord to take advantage of CA-PFL, even
though this leave is paid, because of fear of losing their jobs for taking unprotected leave.
In my baseline speci�cation, I �nd that the passage of CA-PFL increases the likelihood
of maternity leave for a new mother from around 7.1% in the pre-period to around 13.5% in
the post-period). This raises leave-taking from an average of around 3.7 (7.1% x 52) weeks
in the pre-period to around 7.02 weeks in the post-PFL period. Unsurprisingly in Panel
C, women at small �rms (fewer than 25 employees) who are not eligible for job protection
under the FMLA are much less likely to be on maternity leave in the pre-period (around
2.4 percent probability of leave, which translates to an average leave of about 1.2 weeks in
the pre-CA-PFL period). Post passage of CA-PFL, maternity leave rises for this group by
around 4.6 percentage points. However, in terms of total magnitudes, even after the passage
of CA-PFL, women at small �rms only take about 3.5 weeks of leave. The are two points
worth noting. First, the FMLA's guarantee of unpaid leave made it much more likely that
eligible women would be able to take maternity leave to bond with a newborn�the baseline
di�erences in leave-taking for large vs. small �rms in California per CA-PFL illustrates this.
Second, the extension of paid leave to all California employees did not serve to bridge this
gap. Women at large �rms still take about twice as much leave as small �rm employees. I
attribute this continued di�erence to the access to job protection a�orded large �rm, but
not small �rm, employees.28
28In Table A4, I replicate the Rossin-Slater et al. (2013) placebo tests, looking to see whether the measuredimpact on leave-taking of CA-PFL could be attributed to overall changes in the leave-taking landscape. Totest for this, I label as the treatment group three states (Hawaii, New York and Rhode Island) that did nothave a paid leave program during this time period, but did provide some access to paid leave through theirTemporary Disability Insurance programs. The near-zero and statistical insigni�cance of these coe�cientssuggests that changes in leave-taking more broadly are not responsible for the impact of CA-PFL that isdocumented. What is most interesting about these falsi�cation tests is what happens to the magnitude ofthese coe�cients when I break out the small and large �rm subsamples separately. For small �rms (PanelC) for the baseline control group (women outside TDI states with a child aged <1) I see a statistically
20
4.2 CA-PFL increases leave-taking for less advantaged subgroups
only when leaves are protected
As other authors have noted, when paid leave replaces a system of unpaid leave, increases
in leave-taking are largest among disadvantaged mothers (unmarried, less-educated, and
minority mothers) who were least able to take advantage of unpaid leave programs (Carneiro
et al. 2015; Appelbaum and Milkman 2011). This is because women who cannot a�ord
unpaid leave are unable to take it. It is sensible to consider whether even when a program
of paid leave is implemented, if the lack of job protection makes it di�cult for some less-
advantaged subgroups to take advantage of this leave o�ering.
As Rossin-Slater et al. (2013) note, there are di�erences in baseline leave-taking (prior
to CA-PFL) among di�erent educational and ethnic groups. In Table 3, Panel A, these
di�erences are reported. In the pre-period, only 2.2% of women in the treatment group with
a high-school degree or less reported being on maternity leave, compared to more than 9%
of women with a college degree or more. And only 2.1% of black mothers reported being
on leave in the pre-period, compared to 6.9% of white mothers. As documented by Rossin-
Slater et al. (2013), it is clear that CA-PFL increases leave-taking for all of the disadvantaged
subgroups. Gains are largest for black women, for whom leave-taking rise by an estimated
9.9 percentage points (5.15 week increase in leave as a result of CA-PFL). Leave-taking for
Hispanic mothers increases as well, by around 5.06 percentage points, or a little more than
2.5 weeks. Interestingly, there are no statistically signi�cant increases in leave for women
with a college degree or more, suggesting that the impediment for leave for this group was
not that it was unpaid in the pre-PFL period.
In Panel B and Panel C of Table 3, I consider the impact on leave-taking for disadvantaged
signi�cant increase in leave in the placebo TDI states that is of comparable magnitude to the estimatedincrease in leave-taking as a result of CA-PFL documented in Table 2. And for all the comparison groups,the coe�cients remain large for the small �rm subsample, but are much smaller for the all �rm and large�rm samples, perhaps suggesting that my estimates of the increase in leave-taking for small �rm employeesas a result of CA-PFL may be in�ated.
21
groups in the large and small �rm subsample separately. I �rst note that the di�erences in
leave-taking for large and small �rm employees are pronounced for most subgroups. 7.8% of
women with some college education in the large �rm subsample are on leave in the pre-CA-
PFL period, compared with only 1.5% of women with some college education in the small
�rm subsample. Similarly, 5.4% of Hispanic new mothers at large �rms are on leave in the
pre-CA-PFL period, compared to only 1.9% of Hispanic new mothers at small �rms.
I �nd that all of the gains in leave-taking as a result of CA-PFL for disadvantaged new
mothers are concentrated in the large �rm subsample (Panel B). The only subgroup for
whom leave-taking increases in the small �rm subsample is married mothers. In the case of
uneducated, unmarried and minority mothers, the DDD point estimates for the small �rm
subsample (Panel C) are small and even negative (for black new mothers), and they are
never statistically signi�cant. The results for the large �rm subsample are economically and
statistically signi�cant, indicating increases in leave-taking of four to six weeks for women
with a high school degree or less, women with some college, unmarried mothers, and Hispanic
mothers. Interestingly, there are no gains for large �rm employees with a college degree or
more (as for the whole sample, suggesting lack of pay is not the impediment to leave for this
group) or white mothers. Likely due to the small sample size, the results for black mothers
(for whom overall gains are largest in Panel A) are no longer statistically signi�cant for
the large �rm subsample, although the coe�cient on the DDD remains large. These results
suggest that job protection is key to make leave-taking a possibility for less-advantaged
mothers.
5 Impact of CA-PFL on female labor market outcomes
Knowing that the increase in leave-taking as a result of CA-PFL is concentrated in large
�rm employees, I next test whether CA-PFL has a di�erential impact on female employment
at large vs. small �rms. Using the logic of Summers (1989) and Gruber (1992), since it is
22
perhaps di�cult for wages to adjust for the fact that men are less leave-likely than women
(for example, because of anti-discrimination laws), I would expect female hiring to decrease
at large �rms relative to that at small �rms. Furthermore, if women are more attached to a
labor force that is more �exible (Bana et al. 2017), then on the supply side it is likely that
female separations should decrease as a result of the passage of paid leave. The sign of the
overall employment e�ect will depend on the relative magnitude of impact of CA-PFL on
female hires and separations.
Table 4 reports summary statistics for the sample of �rms used in my preferred empirical
speci�cation, which compares employment patterns in California to �rms in non-treatment
states. Annual averages are also provided for the fraction of �rm employees that are female,
and the fraction of hires that are female, and the fraction of separations that are female
(the three dependent variables of interest) for all �rms, and then large (50-249 employees)
and small (20-49 employees) �rms separately. In the Appendix, Figures A1 and A2 provide
additional descriptive information, presenting data on the age distribution of employees in
the pre-CA-PFL and post-CA-PFL period; and the concentration of female employees across
the country in these periods.
5.1 Job-protected leave decreases share of female hires and sepa-
rations
Table 5 shows the estimated e�ect of paid leave on female employment outcomes in California
in the preferred DDD speci�cation. Here, I compare employment outcomes for women in
small and large �rms in California (who were impacted by paid leave) to small and large �rms
outside of California.29 As I note above, to compute my dependent variables, I divide female
employees, female hires, and female separations each by total employees in each quarter,
thereby making the three coe�cients I compute in my forthcoming analysis comparable.
29I exclude from the sample New Jersey, because of its consideration of and eventual passage of paid leavetoward the end of this sample.
23
The passage of paid leave with job protection led to a .06 percentage point decrease in
the share of female hires at large vs. small �rms in California. Relative to the sample mean
of 5.2% of current quarter employees being new female hires, this decrease corresponds to
a 1.1% decrease in female hiring at large �rms, where paid leave is job protected, relative
to small �rms, where leave is unprotected. I also see a statistically signi�cant decrease in
the share of this quarter's employees who separate from large relative to small �rms after
the passage of paid leave. The passage of CA-PFL led to a .07 percentage point decrease
in the share of female separations at large vs. small �rms, or a 1.5% decrease in female
separations. Overall, it appears that the decrease in female separations is of a slightly larger
magnitude than the decrease in female hiring, and in aggregate the passage of CA-PFL leads
to a statistically signi�cant .65 percentage point (1.4%) increase in female employment.
5.2 Robustness checks
To interpret the DDD estimate as the causal e�ect of the provision of paid leave on fe-
male employment, the implementation of paid leave cannot be correlated with time-varying
determinants of female labor market outcomes in large versus small �rms in the sample.
That is, to estimate the impact of CA-PFL with my DDD approach, I assume that, absent
CA-PFL, there would have been no di�erence in how the share of female employees, hires,
and separations would have evolved at large vs. small �rms inside of California relative to
large vs. small �rms outside of California. This is an untestable assumption. I document
the pretrends for my DDD speci�cation in Figure 1. While the pretrends are imperfect,
there does appear to be evidence of a decrease in all three of my dependent variables of
interest around the same time as the passage of CA-PFL. These pretrends also suggest that
employers/employees began to adjust to CA-PFL even before its enactment: the downward
trajectory for the dependent variables begins around the proposal of CA-PFL in late 1999.
I may also be concerned that the passage of CA-PFL induced selection into the treatment
24
group because leave-likely employees opted into large �rms once they realized that CA-PFL
provided better bene�ts in large �rms compared to their smaller counterparts. It is also
a concern that �rms, aware of the di�erential requirements around the 50-employee cuto�,
sought to remain just below the cuto� so as not to adhere to the job protection requirements.
This concern would be best alleviated by gaining access to LEHD micro data on �rm size to
test for bunching right below the FMLA cuto�. In the absence of microdata, placebo tests
provide evidence for the baseline causal interpretation.
5.2.1 Placebo tests for di�erent �rm sizes
One concern is that the baseline results are capturing di�erential trends in female hiring
based on �rm size that are fully independent of the impact of CA-PFL. It is possible that
larger �rms in California have become less likely to hire women, and that current female
employees in California at large �rms have become less likely to separate from them for
reasons unrelated to CA-PFL, and this could drive my results. I address this hypothesis
with a series of placebo tests in Table 6. Here I replicate the baseline DDD analysis from
Table 5, now comparing small (20-49 employees) and smaller �rms (0-19 employees), neither
of which must o�er job protection post CA-PFL and large (50-249 employees) and larger
(250-499 employees), both of which must o�er job protection. If the baseline results are
driven by some California-speci�c trends, I would expect to capture these same results in
the placebo regressions. Table 6 demonstrates that this is not the case.
In my baseline results, I see that the share of this quarter's employees that are female
hires and female separations decreases at large relative to small �rms as a result of the
passage of paid leave. In the placebo tests in Table 6, the opposite is true. The share of
employees that are female hires or female separations increases at large relative to smaller
�rms in both placebo groups. This suggests that the hiring and separation results we observe
in CA as a result of CA-PFL are hard to attribute to general trends in female hiring and
separations at large relative to small �rms in this period.25
The placebo employment results are slightly perplexing (female employment increases for
workers at �rms with 20-49 employees relative to �rms with 0-19 employees; and decreases
for �rms with 250-499 employees relative to �rms with 50-249 employees). However, these
results are barely statistically signi�cant (signi�cant at the 10% level, relative to the much
stronger results for hiring and separations). Furthermore, they do not suggest that there
are systematic increases in female employment at large vs. small �rms that are driving my
results, as the coe�cients change sign depending on the placebo treatment group considered.
5.2.2 Placebo tests for older workers
A related concern is that the results that attributed to CA-PFL in fact are related to changes
in labor market outcomes for women generally, unrelated to the enactment of CA-PFL.
To address this concern, I next use a placebo age group test, replicating the replicate the
baseline DDD results for the older sample of female employees (those aged 45+). If my
results are driven by the fact that the passage of CA-PFL coincided with a general tendency
for large �rms to hire fewer women relative to small �rms in California (or relatedly, for
women to separate less often from large vs. small �rms around this time), then I should
still see a statistically signi�cant decrease in female hiring and separations for this older
employee sample. If instead CA-PFL is responsible for the hiring and separation results
documented above, I would no statistically signi�cant di�erence in female hiring, separations,
or employment for older women who are unlikely to take maternity leave. In Table 7, I
�nd no statistically signi�cant impact on female employment or separations for the older
subsample. I do see a statistically signi�cant increase in female hiring�of .031 percentage
points or 1.8% relative to the pre-PFL mean. This increase in female hiring for the older
subsample in fact reinforces our results, as it suggests that employers may substitute older
women for leave-likely women of child-bearing age.
26
5.3 Heterogeneity in labor market outcomes by industry
Finally, I seek to understand in which industries the labor market impact of CA-PFL is most
concentrated. For the subset of young workers, DDDs for each industry in the sample are
presented in Table 8 for employment (Column 1), hires (Column 2) and separations (Column
3). Only the coe�cient on the DDD interaction term of interest is reported. The publicly
available LEHD data provides very coarse industry categories, but the results are interesting.
There is a negative and statistically signi�cant decrease in female hiring in retail trade,
management, and administrative support industries. Separations decrease for women in re-
tail trade and management as well, and also for women in mining/oil and gas, the arts,
and the accommodation and food services industries. These crude results indicate that
leave-taking patterns di�er by industry30 and thus are di�erentially disruptive to employers
depending on the sector. Interestingly, in some industries female hires at large vs. small
�rms increase during this period (educational services, health care, mining, and agricul-
ture) and female separations at large vs. small �rms also increase in many of these same
industries during this period (except for educational services, where there is no statistical
signi�cance; and with the addition of construction). Overall employment e�ects in Column
1 vary depending on industry in way that re�ects the relative magnitudes of the hiring and
separations results in Columns 2 and 3.
It is not obvious why in some industries our results move in the opposite direction of
our baseline results. It is worth noting that many of these industries (i.e. construction,
mining) have experienced changes related to the displacement of low-skill (primarily male)
workers during/after the Great Recession (Elsby and Hobijin 2010) that may have impacted
the relative demand for male/female employees in a way totally unrelated to the passage of
CA-PFL. Others of these industries (education and health services) are where job growth
(especially for women) has and will be concentrated in the post-Recession epoch,31 and it is
30Relatedly, Bartel et al. (2015) �nd that paternity leave increases as a result of CA-PFL are concentratedin occupations with a high share of female workers.
312015 BLS projections suggest that healthcare and social assistance and educational services, will be the27
possible that too is related to these results.
For the industries where the results are directionally consistent with paid leave reduc-
ing both hiring and separations (i.e. management and retail trade), I cannot comment on
whether the hiring and separation results are distinct or related phenomenon. That is, one
possibility is that employers have a fraction of their workforce that is traditionally women
of child-bearing age. As a result of the provision of job-protected paid leave with CA-PFL,
when these young women become pregnant, rather than leaving the workforce (which they
would have done had leave not been available to them), many take advantage of CA-PFL
and do not separate from their employers: hence a decrease in female separations for this
subgroup. Employers then shift away from hiring women of child-bearing age because their
young female employees are less likely to separate from their jobs post CA-PFL.
An alternative possibility may be that these are two distinct phenomenon. Now that
job-protected paid leave is mandated, employers would if anything like to reduce the share
of their employees that are leave likely. They cannot �re young women that are already
employed who opt for paid leave because �ring costs are too severe, but they actively choose
to under-hire from this group to avoid having to bear the cost of future burdensome leaves.
Future research should consider the extent to which the demand-side decision of employers
to decrease female hiring in response to CA-PFL is a response to supply-side dynamics
(decrease in female separations).
6 Conclusion
This paper contributes to the literature on parental leave in various ways. First, I build on
the results of Rossin-Slater et al. (2013) and establish that the increase in leave-taking they
document as a result of CA-PFL is most pronounced for new mothers at large �rms, who
have access to job protection through the FMLA. Although there are gains for small �rm
fastest growing sectors in the next decade.
28
employees as well (who have access to paid leave, but not job protection), these are more
limited in scope. And gains for disadvantaged (low-educated, unmarried, and minority) new
mothers who cannot a�ord to take unpaid FMLA leave exist only at large �rms, where leaves
are protected.
Armed with the knowledge that CA-PFL increases leave-taking for large �rm female
employees more than their small �rm counterparts, I compare employment outcomes at large
vs. small �rms within California to large vs. small �rms outside of California to ascertain
the labor market implications of job-protected paid leave. This analysis builds on prior
work that studies the impact of the extension of paid leave on female labor force attachment
and employment outcomes. Past authors have found relatively small medium- and long-
term e�ects of leave policies on female employment, e.g. Ruhm (1998), Waldfogel (1999),
Baker and Milligan (2008), Han et al. (2009), and Baum and Ruhm (2016). I disentangle
the overall employment impact into two distinct and important reactions to the provision
of paid family leave in California. On the demand side, as Gruber (1992) and Summers
(1989) caution with regards to group-speci�c mandates, employers actively substitute away
from young women who are likely to take costly leave post-CA-PFL, and the percentage of
employees that are new female hires falls by 1.1%. On the supply side, female employees who
would have chosen to leave their jobs after giving birth instead take job-protected paid leave,
increasing female labor force attachment, with the share of female separations decreasing by
.07 percentage points (1.5%). The separations result appears slightly larger in magnitude,
with overall employment increasing slightly for women at large vs. small �rms as a result of
CA-PFL.
There are, of course, important limitations to the results presented. Although these
�ndings are robust to the inclusion of a number of controls and placebo tests, data limi-
tations prevent us from being able to ascertain (1) exactly how many employees work at
each �rm and (2) the educational backgrounds of �rm employees of di�erent ages. As a
result, this preliminary work is unable to explicitly take the hypothesis that low-skill women29
bear the brunt of the negative employment impact of job-protected leave to the data. It
is also not possible to determine whether �rms actively try to stay under the 50-employee
cuto� as a result of CA-PFL. Such bunching would bias the results downward, suggesting
that my �ndings provide a lower bound on the impact of CA-PFL on female labor market
outcomes. Further work should include comparisons to Rhode Island, where paid leave is
job-protected for employees of all �rm sizes. I also only consider whether women are in
the labor force (employed, hired, or separated from their current employer). Recent work
by Stearns (2016) considers other labor market outcomes, cautioning that overly generous
leaves may increase female employment but actually hinder career advancement, and Ruhm
(1998) notes that longer paid leave entitlements may have a negative long-term wage impact
for female employees.
In order to formulate optimal leave policy it will be important to understand the extent
to which the two main employment results in this paper�(1) that employers substitute
away from hiring leave-likely women post-CA-PFL and (2) that leave-likely women are more
attached to a workplace that is more �exible�are distinct or related. If employers choose
to hire fewer young women because the costs associated with parental leave (like �nding a
temporary worker to substitute for an employee on leave) are too high, then policies like those
in the Norway, Sweden, Germany, and Finland, which force men to take leave after the birth
of a newborn,32 will be valuable not only for the impact they will have on children and new
fathers, but also because such programs will make it harder for employers to substitute away
from leave-likely women and instead hire men. If, however, the decision to hire fewer women
is reactionary and the result of fewer young women choosing to separate from a workplace
that is �exible, then it is less clear that mandating leave for new fathers will meaningfully
impact employers' hiring decisions.
32For a brief discussion of these programs, see Jackson (2015).
30
31
References
Acemoglu, D, and J. D. Angrist (2001). Consequences of Employment Protection? The
Case of the Americans with Disabilities Act. Journal of Political Economy, 109(5), 915-957.
Addati, L., N. Cassirer, and K. Gilchrist (2014). Maternity and Paternity at Work: Law
and Practice Across the World. International Labour Organization.
Appelbaum, E., and R. Milkman (2011). Leaves That Pay: Employer and Worker
Experiences with Paid Family Leave in California. Center for Economic and Policy
Research.
Bana, S., K. Bedard, and M. Rossin-Slater (2017). The Impacts of Paid Family Leave
Benefits: Regression Kink Evidence from California Administrative Data.
Baker, M. and K. Milligan (2008). How Does Job-Protected Maternity Leave Affect
Mothers' Employment? Journal of Labor Economics, 26(4), 655-692.
(2015). Maternity leave and children's cognitive and behavioral development.
Journal of Population Economics, 28(2), 373-391.
Bartel, A., M. Rossin-Slater, C. Ruhm, J. Stearns, and J. Waldfogel (2015). Paid Family
Leave, Fathers’ Leave-Taking, and Leave-Sharing in Dual-Earner Households (NBER
Working Paper No. w21747).
Barrera, J. (2017). Job Killer Mandates New Leave of Absence. California Chamber of
Commerce Advocacy.
Baum, C. L. (2003). The Effect of State Maternity Leave Legislation and the 1993 Family
and Medical Leave Act on Employment and Wages. Labour Economics, 10(5), 573-596.
32
Baum, C. L., and C. J. Ruhm (2016). The effects of paid family leave in California on
labor market outcomes. Journal of Policy Analysis and Management, 32(2), 224-245.
Bertrand, M., Mullainathan, S. (2003). Enjoying the quiet life? Corporate governance and
managerial preferences. Journal of Political Economy, 111(5), 1043–1075.
Bravo, S. (2015). Why Facebook CEO’s Paternity Leave is a Big Deal. CNBC.
Byker, T. S. (2016). Paid Parental Leave Laws in the United States: Does Short-Duration
Leave Affect Women’s Labor-Force Attachment? American Economic Review, 106(5), 242-
46.
Carneiro, P., K. Loken, and K. G. Salvanes (2015). A Flying Start: Maternity Leave
Benefits and Long Run Outcomes of Children. Journal of Political Economy, 123(2), 365-
412.
Clinton, H. (2015). Paid Family and Medical Leave. Policy Statement.
Corte, R.L. (2017). Inslee Signs Bill Guaranteeing Paid Family Leave in Washington.
Associated Press.
Das, T. and S. Polachek (2015). Unanticipated Effects of California’s Paid Leave Program.
Contemporary Economic Policy, 33(4), 619-635.
DeLeire, T. (2000). The Wage and Employment Effects of the Americans with Disabilities
Act. Journal of Human Resources, 35(4), 693-715.
Donald, S. G., and K. Lang (2007). Inference with difference-in-differences and other panel
data. The Review of Economics and Statistics, 89(2), 221-233.
33
Dustmann, C., and U. Schönberg (2012). Expansions in maternity leave coverage and
children’s long-term outcomes. American Economic Journal: Applied Economics, 4(3), 190-
224.
Elsby, M. and B. Hobijin (2010). The Labor Market in the Great Recession. Brookings
Papers on Economic Activity.
Employment Development Department State of California. Paid Family Leave [Factsheet].
Engeman, C. (2012). Ten Years of the California Paid Family Leave Program:
Strengthening Commitment to Work, Affirming Commitment to Family. Policy Brief.
Family and Medical Leave Act. 29 USC 2601.
“Family Medical Leave Act at 22: 200 Million Reasons to Celebrate and Move Forward.”
National Partnership for Women and Families. 2015.
“FMLA Eligibility.” http://employment.findlaw.com/family-medical-leave/fmla-
eligibility.html
Fass, S. (2009). Paid Leave in the States: A Critical Support for Low-wage Workers and
Their Families. Technical Report. National Center for Children in Poverty.
Garthwaite, C., Gross, T., & Otidid, M. J. (2014). Public health insurance, labor supply,
and employment lock. The Quarterly Journal of Economics, 129(2), 653-696.
Goodman, M. (2015). Can you be Fired for Taking Family Leave? American Civil
Liberties Union of Northern California.
Gruber, J. (1992). The efficiency of a group-specific mandated benefit: Evidence from
health insurance benefits for maternity (NBER Working Paper No. w4157).
34
(1994). State-mandated benefits and employer-provided health insurance. Journal of
Public Economics, 55(3), 433-464.
(1994). The Incidence of Mandated Maternity Benefits. The American Economic
Review, 84(3), 622-641.
Han, W-J., and J. Waldfogel (2003). Parental Leave: The Impact of Recent Legislation on
Parents’ Leave Taking. Demography, 40(1), 191-200.
Han, W-J., C. Ruhm and Jane Waldfogel (2009). Parental Leave Policies and Parents'
Employment and Leave-Taking. Journal of Policy Analysis Management, 28(1), 29-54.
Houser, L., and T. Vartanian (2012). Pay Matters: The Positive Economic Impacts of Paid
Family Leave for Families, Businesses and the Public. New Brunswick, NJ: Rutgers Center
for Women and Work.
Jackson, G. (2015). “Force Men to Take Paternity Leave. It will Make the World a Better
Place.”
Jaumotte, F. (2003). Labour Force Participation of Women: Empirical Evidence on the
Role of Policy and Other Determinants in OECD countries. OECD Economic Studies, 2,
51-108.
Klerman, J. A., K. Daley, and A. Pozniak (2012). Family and medical leave in 2012:
Technical report. Abt Associates Inc. Prepared for the U.S. Department of Labor.
“Local Employment Dynamics.” U.S. Census Bureau. 2015.
“Maternity and Paternity at Work: Law and Practice Around the World.” International
Labour Organization. 2014.
35
Miller, C.C. (2017). Family-Friendly Laws are Being Passed, but Not by Trump’s Team.
New York Times.
Ondrich, J.C., Spiess, K., Yang, Q. (1996). Barefoot and in a German kitchen: Federal
Parental Leave and Benefit Policy and the Return to Work after Childbirth in Germany.
Journal of Population Economics, 9(3), 247-266.
Pelletier, A. (2007). The Family Medical Leave Act of 1993-Why Does Parental Leave in
the United States Fall So Far Behind Europe? Gonzaga Law Review, 42(3).
“PFL Program Statistics.” Employment Development Department. State of California.
Price, J. (2008). Parent-Child Quality Time Does Birth Order Matter? Journal of Human
Resources, 43(1), 240-265.
Reagan, K. (2013). “The ‘Illusion’ of Family Leave in New York.”
Ross, A. (2013). It Pays to Leave: The Impact of Paid Family Leave on Mothers in
California. Harvard University. Unpublished Manuscript.
Rossin-Slater, M. (2017). Maternity and Family Leave Policy (NBER Working Paper No.
w23609).
Rossin-Slater, M., C. J. Ruhm, and J. Waldfogel (2013). The Effects of California's Paid
Family Leave Program on Mothers’ Leave-Taking and Subsequent Labor Market
Outcomes. Journal of Policy Analysis and Management, 32(2), 224-245.
Rossin, M. (2011). The effects of maternity leave on children's birth and infant health
outcomes in the United States. Journal of Health Economics, 30(2), 221-239.
36
Ruggles, S., K. Genadek, R. Goeken, J. Grover, and M. Sobek (2015). Integrated Public
Use Microdata Series: Version 6.0 [dataset]. Minneapolis: University of Minnesota.
Ruhm, C. J. (2000). Parental Leave and Child Health. Journal of Health Economics, 19(6),
931-960.
(1998). The Economic Consequences of Parental Leave Mandates: Lessons from
Europe. The Quarterly Journal of Economics, 113(1), 285-317.
Stearns, J. (2015). The effects of paid maternity leave: Evidence from Temporary
Disability Insurance. Journal of Health Economics, 43, 85-102.
“SDI Contribution Rates.” Employment Development Department. State of California.
“The Need for Paid Family Leave.” A Better Balance.
Summers, L.H. (1989). Some Simple Economics of Mandated Benefits. The American
Economic Review, 79(2), 177-183.
Sullivan, S. and R. Costa (2016). Donald Trump Unveils Child-Care Policy Influenced by
Ivanka Trump. Washington Post.
Waldfogel, J. (2001). Family and Medical Leave: Evidence from the 2000 Surveys. Monthly
Labor Review, 124(9), 17-23.
(1999). The Impact of the Family and Medical Leave Act. Journal of Policy
Analysis and Management, 18(2), 282-302.
Wojcicki, S. (2014). Paid Maternity Leave is Good for Business. Wall Street Journal.
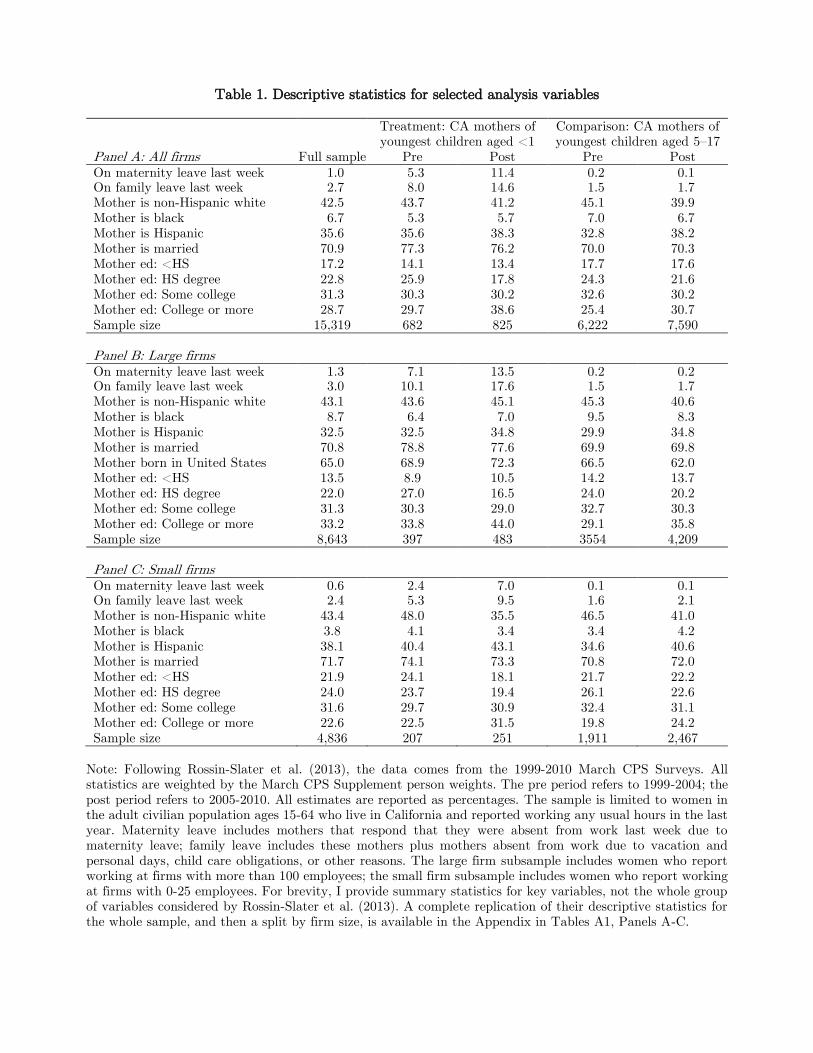
Table 1. Descriptive statistics for selected analysis variables
Treatment: CA mothers of
youngest children aged <1
Comparison: CA mothers of
youngest children aged 5–17
Panel A: All firms Full sample Pre Post Pre Post
On maternity leave last week 1.0 5.3 11.4 0.2 0.1 On family leave last week 2.7 8.0 14.6 1.5 1.7
Mother is non-Hispanic white 42.5 43.7 41.2 45.1 39.9
Mother is black 6.7 5.3 5.7 7.0 6.7
Mother is Hispanic 35.6 35.6 38.3 32.8 38.2
Mother is married 70.9 77.3 76.2 70.0 70.3
Mother ed: <HS 17.2 14.1 13.4 17.7 17.6
Mother ed: HS degree 22.8 25.9 17.8 24.3 21.6
Mother ed: Some college 31.3 30.3 30.2 32.6 30.2
Mother ed: College or more 28.7 29.7 38.6 25.4 30.7
Sample size 15,319 682 825 6,222 7,590
Panel B: Large firms
On maternity leave last week 1.3 7.1 13.5 0.2 0.2 On family leave last week 3.0 10.1 17.6 1.5 1.7
Mother is non-Hispanic white 43.1 43.6 45.1 45.3 40.6
Mother is black 8.7 6.4 7.0 9.5 8.3
Mother is Hispanic 32.5 32.5 34.8 29.9 34.8
Mother is married 70.8 78.8 77.6 69.9 69.8
Mother born in United States 65.0 68.9 72.3 66.5 62.0
Mother ed: <HS 13.5 8.9 10.5 14.2 13.7
Mother ed: HS degree 22.0 27.0 16.5 24.0 20.2
Mother ed: Some college 31.3 30.3 29.0 32.7 30.3
Mother ed: College or more 33.2 33.8 44.0 29.1 35.8
Sample size 8,643 397 483 3554 4,209
Panel C: Small firms
On maternity leave last week 0.6 2.4 7.0 0.1 0.1 On family leave last week 2.4 5.3 9.5 1.6 2.1
Mother is non-Hispanic white 43.4 48.0 35.5 46.5 41.0
Mother is black 3.8 4.1 3.4 3.4 4.2
Mother is Hispanic 38.1 40.4 43.1 34.6 40.6
Mother is married 71.7 74.1 73.3 70.8 72.0
Mother ed: <HS 21.9 24.1 18.1 21.7 22.2
Mother ed: HS degree 24.0 23.7 19.4 26.1 22.6
Mother ed: Some college 31.6 29.7 30.9 32.4 31.1
Mother ed: College or more 22.6 22.5 31.5 19.8 24.2
Sample size 4,836 207 251 1,911 2,467
Note: Following Rossin-Slater et al. (2013), the data comes from the 1999-2010 March CPS Surveys. All
statistics are weighted by the March CPS Supplement person weights. The pre period refers to 1999-2004; the
post period refers to 2005-2010. All estimates are reported as percentages. The sample is limited to women in
the adult civilian population ages 15-64 who live in California and reported working any usual hours in the last
year. Maternity leave includes mothers that respond that they were absent from work last week due to
maternity leave; family leave includes these mothers plus mothers absent from work due to vacation and
personal days, child care obligations, or other reasons. The large firm subsample includes women who report
working at firms with more than 100 employees; the small firm subsample includes women who report working
at firms with 0-25 employees. For brevity, I provide summary statistics for key variables, not the whole group
of variables considered by Rossin-Slater et al. (2013). A complete replication of their descriptive statistics for
the whole sample, and then a split by firm size, is available in the Appendix in Tables A1, Panels A-C.
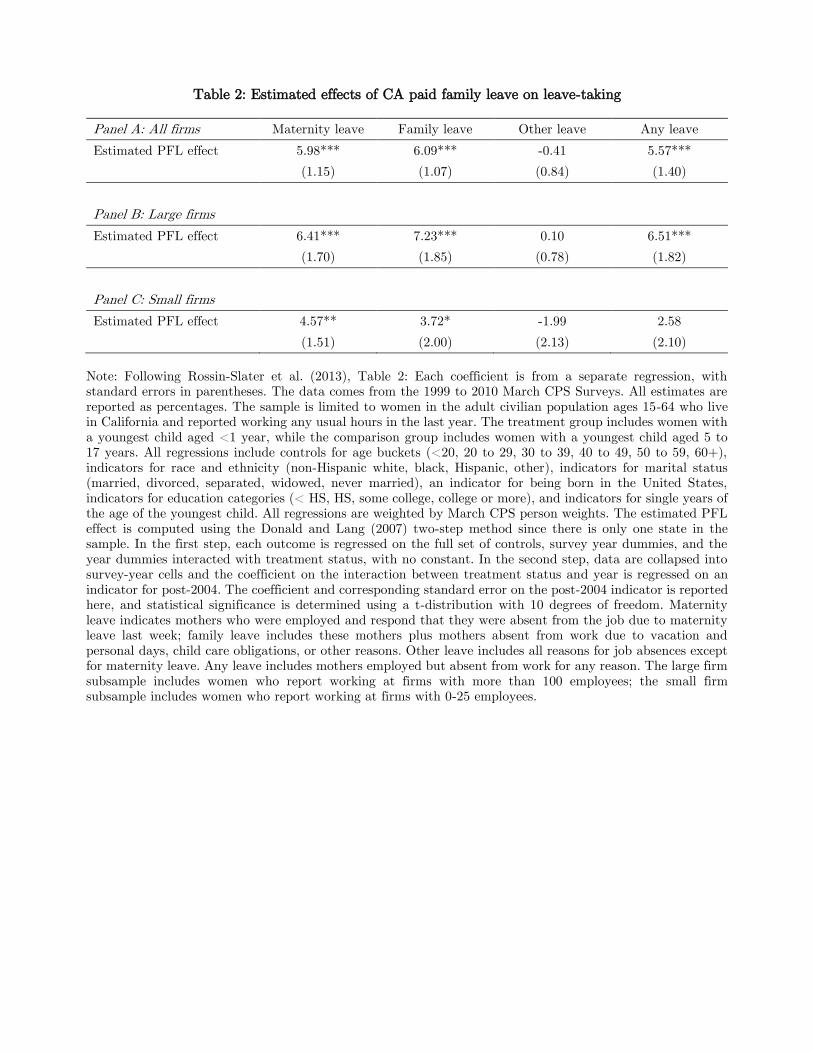
Table 2: Estimated effects of CA paid family leave on leave-taking
Panel A: All firms Maternity leave Family leave Other leave Any leave
Estimated PFL effect 5.98*** 6.09*** -0.41 5.57***
(1.15) (1.07) (0.84) (1.40)
Panel B: Large firms
Estimated PFL effect 6.41*** 7.23*** 0.10 6.51***
(1.70) (1.85) (0.78) (1.82)
Panel C: Small firms
Estimated PFL effect 4.57** 3.72* -1.99 2.58
(1.51) (2.00) (2.13) (2.10)
Note: Following Rossin-Slater et al. (2013), Table 2: Each coefficient is from a separate regression, with
standard errors in parentheses. The data comes from the 1999 to 2010 March CPS Surveys. All estimates are
reported as percentages. The sample is limited to women in the adult civilian population ages 15-64 who live
in California and reported working any usual hours in the last year. The treatment group includes women with
a youngest child aged <1 year, while the comparison group includes women with a youngest child aged 5 to
17 years. All regressions include controls for age buckets (<20, 20 to 29, 30 to 39, 40 to 49, 50 to 59, 60+),
indicators for race and ethnicity (non-Hispanic white, black, Hispanic, other), indicators for marital status
(married, divorced, separated, widowed, never married), an indicator for being born in the United States,
indicators for education categories (< HS, HS, some college, college or more), and indicators for single years of
the age of the youngest child. All regressions are weighted by March CPS person weights. The estimated PFL
effect is computed using the Donald and Lang (2007) two-step method since there is only one state in the
sample. In the first step, each outcome is regressed on the full set of controls, survey year dummies, and the
year dummies interacted with treatment status, with no constant. In the second step, data are collapsed into
survey-year cells and the coefficient on the interaction between treatment status and year is regressed on an
indicator for post-2004. The coefficient and corresponding standard error on the post-2004 indicator is reported
here, and statistical significance is determined using a t-distribution with 10 degrees of freedom. Maternity
leave indicates mothers who were employed and respond that they were absent from the job due to maternity
leave last week; family leave includes these mothers plus mothers absent from work due to vacation and
personal days, child care obligations, or other reasons. Other leave includes all reasons for job absences except
for maternity leave. Any leave includes mothers employed but absent from work for any reason. The large firm
subsample includes women who report working at firms with more than 100 employees; the small firm
subsample includes women who report working at firms with 0-25 employees.
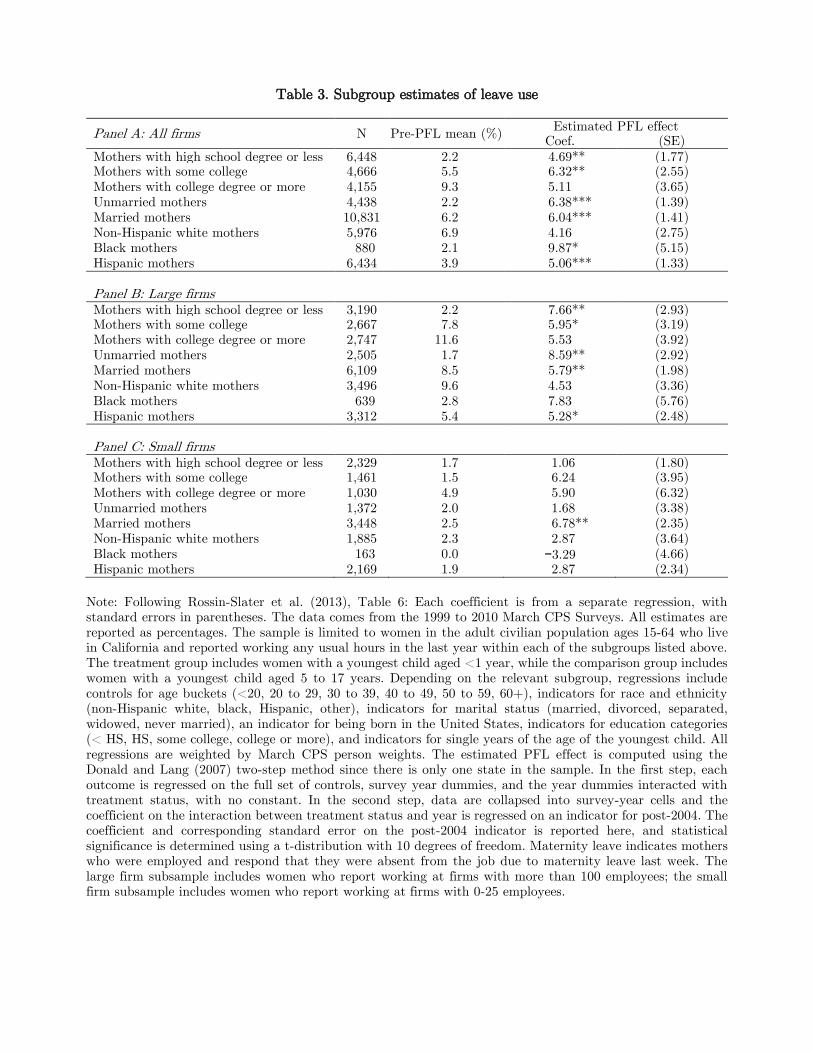
Table 3. Subgroup estimates of leave use
Panel A: All firms N Pre-PFL mean (%) Estimated PFL effect
Coef. (SE)
Mothers with high school degree or less 6,448 2.2 4.69** (1.77) Mothers with some college 4,666 5.5 6.32** (2.55)
Mothers with college degree or more 4,155 9.3 5.11 (3.65)
Unmarried mothers 4,438 2.2 6.38*** (1.39)
Married mothers 10,831 6.2 6.04*** (1.41)
Non-Hispanic white mothers 5,976 6.9 4.16 (2.75)
Black mothers 880 2.1 9.87* (5.15)
Hispanic mothers 6,434 3.9 5.06*** (1.33) Panel B: Large firms
Mothers with high school degree or less 3,190 2.2 7.66** (2.93) Mothers with some college 2,667 7.8 5.95* (3.19)
Mothers with college degree or more 2,747 11.6 5.53 (3.92)
Unmarried mothers 2,505 1.7 8.59** (2.92)
Married mothers 6,109 8.5 5.79** (1.98)
Non-Hispanic white mothers 3,496 9.6 4.53 (3.36)
Black mothers 639 2.8 7.83 (5.76)
Hispanic mothers 3,312 5.4 5.28* (2.48) Panel C: Small firms
Mothers with high school degree or less 2,329 1.7 1.06 (1.80) Mothers with some college 1,461 1.5 6.24 (3.95)
Mothers with college degree or more 1,030 4.9 5.90 (6.32)
Unmarried mothers 1,372 2.0 1.68 (3.38)
Married mothers 3,448 2.5 6.78** (2.35)
Non-Hispanic white mothers 1,885 2.3 2.87 (3.64)
Black mothers 163 0.0 −3.29 (4.66)
Hispanic mothers 2,169 1.9 2.87 (2.34)
Note: Following Rossin-Slater et al. (2013), Table 6: Each coefficient is from a separate regression, with
standard errors in parentheses. The data comes from the 1999 to 2010 March CPS Surveys. All estimates are
reported as percentages. The sample is limited to women in the adult civilian population ages 15-64 who live
in California and reported working any usual hours in the last year within each of the subgroups listed above.
The treatment group includes women with a youngest child aged <1 year, while the comparison group includes
women with a youngest child aged 5 to 17 years. Depending on the relevant subgroup, regressions include
controls for age buckets (<20, 20 to 29, 30 to 39, 40 to 49, 50 to 59, 60+), indicators for race and ethnicity
(non-Hispanic white, black, Hispanic, other), indicators for marital status (married, divorced, separated,
widowed, never married), an indicator for being born in the United States, indicators for education categories
(< HS, HS, some college, college or more), and indicators for single years of the age of the youngest child. All
regressions are weighted by March CPS person weights. The estimated PFL effect is computed using the
Donald and Lang (2007) two-step method since there is only one state in the sample. In the first step, each
outcome is regressed on the full set of controls, survey year dummies, and the year dummies interacted with
treatment status, with no constant. In the second step, data are collapsed into survey-year cells and the
coefficient on the interaction between treatment status and year is regressed on an indicator for post-2004. The
coefficient and corresponding standard error on the post-2004 indicator is reported here, and statistical
significance is determined using a t-distribution with 10 degrees of freedom. Maternity leave indicates mothers
who were employed and respond that they were absent from the job due to maternity leave last week. The
large firm subsample includes women who report working at firms with more than 100 employees; the small
firm subsample includes women who report working at firms with 0-25 employees.
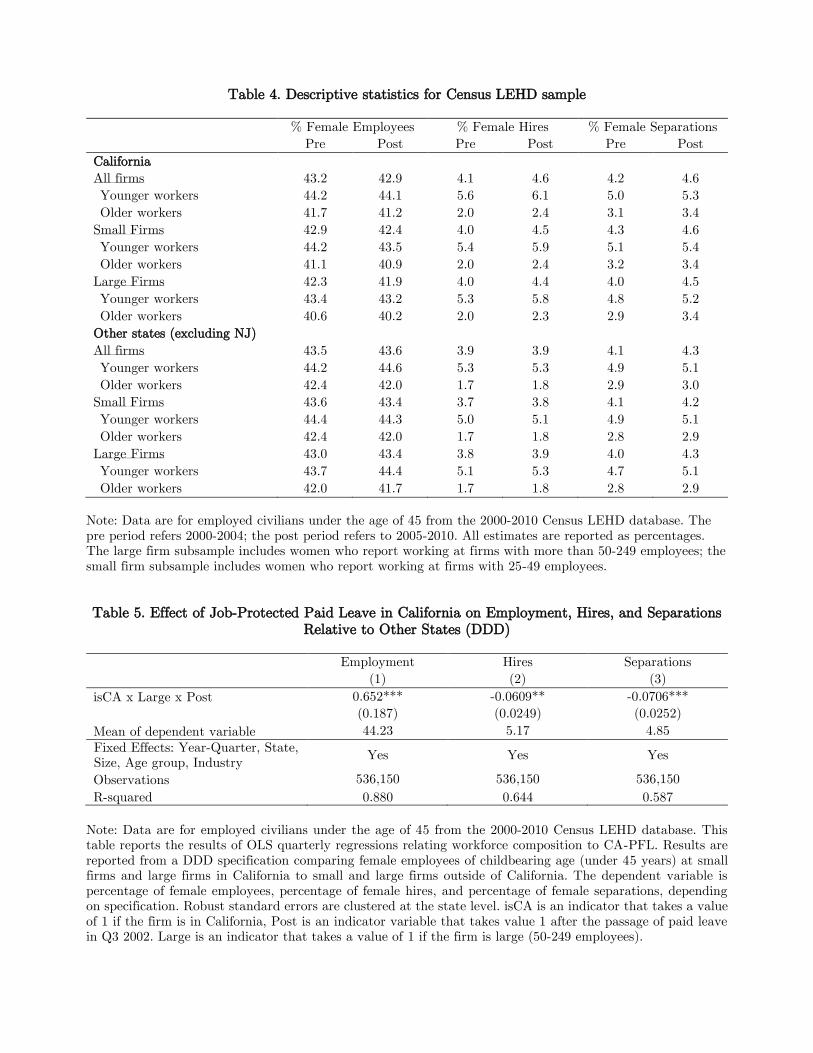
Table 4. Descriptive statistics for Census LEHD sample % Female Employees % Female Hires % Female Separations
Pre Post Pre Post Pre Post
California
All firms 43.2 42.9 4.1 4.6 4.2 4.6
Younger workers 44.2 44.1 5.6 6.1 5.0 5.3
Older workers 41.7 41.2 2.0 2.4 3.1 3.4
Small Firms 42.9 42.4 4.0 4.5 4.3 4.6
Younger workers 44.2 43.5 5.4 5.9 5.1 5.4
Older workers 41.1 40.9 2.0 2.4 3.2 3.4
Large Firms 42.3 41.9 4.0 4.4 4.0 4.5
Younger workers 43.4 43.2 5.3 5.8 4.8 5.2
Older workers 40.6 40.2 2.0 2.3 2.9 3.4
Other states (excluding NJ)
All firms 43.5 43.6 3.9 3.9 4.1 4.3
Younger workers 44.2 44.6 5.3 5.3 4.9 5.1
Older workers 42.4 42.0 1.7 1.8 2.9 3.0
Small Firms 43.6 43.4 3.7 3.8 4.1 4.2
Younger workers 44.4 44.3 5.0 5.1 4.9 5.1
Older workers 42.4 42.0 1.7 1.8 2.8 2.9
Large Firms 43.0 43.4 3.8 3.9 4.0 4.3
Younger workers 43.7 44.4 5.1 5.3 4.7 5.1
Older workers 42.0 41.7 1.7 1.8 2.8 2.9
Note: Data are for employed civilians under the age of 45 from the 2000-2010 Census LEHD database. The
pre period refers 2000-2004; the post period refers to 2005-2010. All estimates are reported as percentages.
The large firm subsample includes women who report working at firms with more than 50-249 employees; the
small firm subsample includes women who report working at firms with 25-49 employees.
Table 5. Effect of Job-Protected Paid Leave in California on Employment, Hires, and Separations Relative to Other States (DDD)
Employment Hires Separations
(1) (2) (3)
isCA x Large x Post 0.652*** -0.0609** -0.0706***
(0.187) (0.0249) (0.0252)
Mean of dependent variable 44.23 5.17 4.85
Fixed Effects: Year-Quarter, State,
Size, Age group, Industry Yes Yes Yes
Observations 536,150 536,150 536,150
R-squared 0.880 0.644 0.587
Note: Data are for employed civilians under the age of 45 from the 2000-2010 Census LEHD database. This
table reports the results of OLS quarterly regressions relating workforce composition to CA-PFL. Results are
reported from a DDD specification comparing female employees of childbearing age (under 45 years) at small
firms and large firms in California to small and large firms outside of California. The dependent variable is
percentage of female employees, percentage of female hires, and percentage of female separations, depending
on specification. Robust standard errors are clustered at the state level. isCA is an indicator that takes a value
of 1 if the firm is in California, Post is an indicator variable that takes value 1 after the passage of paid leave
in Q3 2002. Large is an indicator that takes a value of 1 if the firm is large (50-249 employees).

Table 6. Effect of Job-Protected Paid Leave in California Relative to Other States (DDD), Placebo Size Test
Small vs. smaller firms Large vs. larger firms
Employment Hires Separations Employment Hires Separations
(1) (2) (3) (4) (5) (6)
isCA x Large x Post 0.375* 0.180*** 0.194*** -0.508* 0.202*** 0.0785** (0.191) (0.0406) (0.0338) (0.282) (0.0467) (0.0388)
Mean of dependent variable 44.25 5.18 5.04 44.00 4.93 4.60
Fixed Effects: Year-Quarter, State,
Size, Age group, Industry Yes Yes Yes
Yes Yes Yes
Observations 537,424 537,424 537,424 519,893 519,893 519,893
R-squared 0.887 0.673 0.636 0.818 0.566 0.505
Table 7 Effect of Job-Protected Paid Leave in California on Employment, Hires, and Separations Relative to Other States (DDD), Placebo Age Test
Employment Hires Separations
(1) (2) (3)
isCA x Large x Post 0.283 0.0305** -0.0561 (0.255) (0.0135) (0.0357)
Mean of dependent variable 42.18 1.69 2.90
Fixed Effects: Year-Quarter, State,
Size, Age group, Industry Yes Yes Yes
Observations 325,887 325,887 325,887
R-squared 0.905 0.620 0.551
Note: Data are for employed civilians from the 2000-2010 Census LEHD database. This table reports the results of OLS quarterly regressions relating
workforce composition to CA-PFL. In Table 6 (Table 7), results are reported from a DDD specification comparing female employees of childbearing
age, under 45 years (over childbearing age, 45+) at small firms and large firms in California to small and large firms outside of California. The
dependent variable is percentage of female employees, percentage of female hires, and percentage of female separations, depending on specification.
Robust standard errors are clustered at the state level. isCA is an indicator that takes a value of 1 if the firm is in California, Post is an indicator
variable that takes value 1 after the passage of paid leave in Q3 2002. In Table 6, Large is an indicator that takes a value of 1 if the firm is large (20-
49 employees in the small placebo test, 250-499 employees in the large placebo test). In Table 7, Large is an indicator that takes a value of 1 if the
firm is large (50-249 employees). I include year-quarter, age group, industry, geography, and firm-size fixed effects, as well as all possible pairwise
interactions of these fixed effects. The use of these fixed effects makes it unnecessary to control explicitly for isCA, Post, Large, or any pairwise
interaction of these variables.
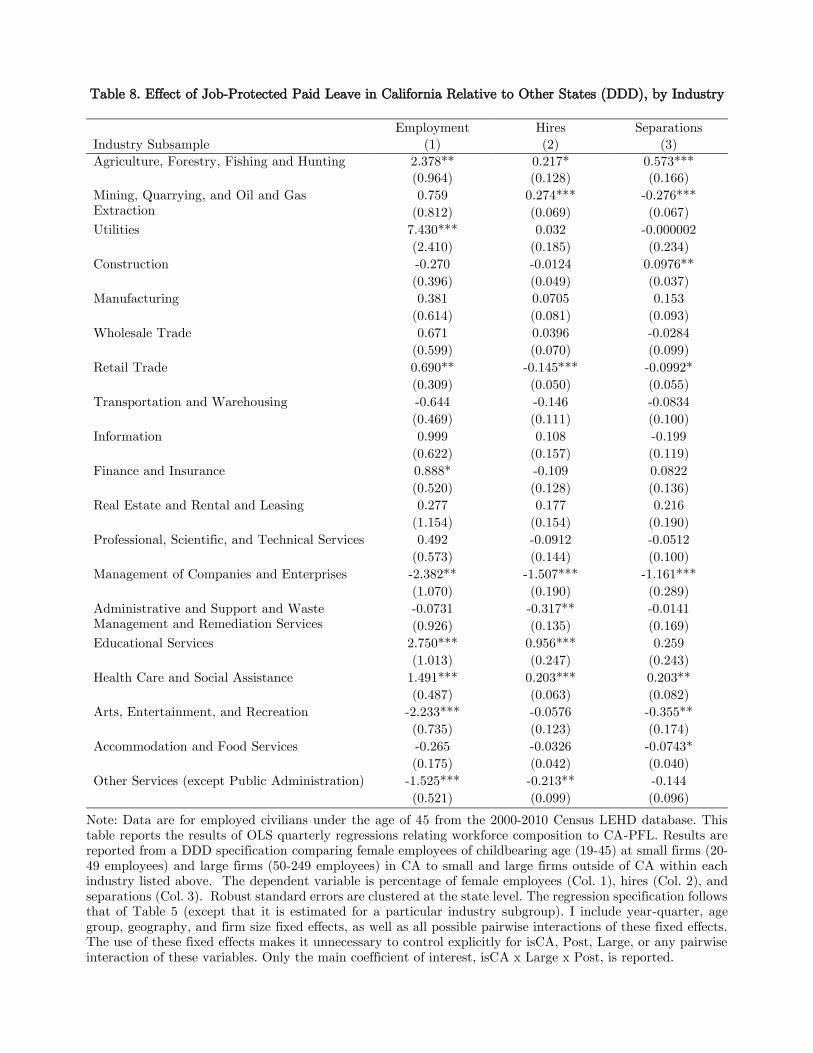
Table 8. Effect of Job-Protected Paid Leave in California Relative to Other States (DDD), by Industry
Employment Hires Separations
Industry Subsample (1) (2) (3)
Agriculture, Forestry, Fishing and Hunting 2.378** 0.217* 0.573***
(0.964) (0.128) (0.166)
Mining, Quarrying, and Oil and Gas
Extraction
0.759 0.274*** -0.276***
(0.812) (0.069) (0.067)
Utilities 7.430*** 0.032 -0.000002
(2.410) (0.185) (0.234)
Construction -0.270 -0.0124 0.0976**
(0.396) (0.049) (0.037)
Manufacturing 0.381 0.0705 0.153
(0.614) (0.081) (0.093)
Wholesale Trade 0.671 0.0396 -0.0284
(0.599) (0.070) (0.099)
Retail Trade 0.690** -0.145*** -0.0992*
(0.309) (0.050) (0.055)
Transportation and Warehousing -0.644 -0.146 -0.0834
(0.469) (0.111) (0.100)
Information 0.999 0.108 -0.199
(0.622) (0.157) (0.119)
Finance and Insurance 0.888* -0.109 0.0822
(0.520) (0.128) (0.136)
Real Estate and Rental and Leasing 0.277 0.177 0.216
(1.154) (0.154) (0.190)
Professional, Scientific, and Technical Services 0.492 -0.0912 -0.0512
(0.573) (0.144) (0.100)
Management of Companies and Enterprises -2.382** -1.507*** -1.161***
(1.070) (0.190) (0.289)
Administrative and Support and Waste
Management and Remediation Services
-0.0731 -0.317** -0.0141
(0.926) (0.135) (0.169)
Educational Services 2.750*** 0.956*** 0.259
(1.013) (0.247) (0.243)
Health Care and Social Assistance 1.491*** 0.203*** 0.203**
(0.487) (0.063) (0.082)
Arts, Entertainment, and Recreation -2.233*** -0.0576 -0.355**
(0.735) (0.123) (0.174)
Accommodation and Food Services -0.265 -0.0326 -0.0743*
(0.175) (0.042) (0.040)
Other Services (except Public Administration) -1.525*** -0.213** -0.144
(0.521) (0.099) (0.096)
Note: Data are for employed civilians under the age of 45 from the 2000-2010 Census LEHD database. This
table reports the results of OLS quarterly regressions relating workforce composition to CA-PFL. Results are
reported from a DDD specification comparing female employees of childbearing age (19-45) at small firms (20-
49 employees) and large firms (50-249 employees) in CA to small and large firms outside of CA within each
industry listed above. The dependent variable is percentage of female employees (Col. 1), hires (Col. 2), and
separations (Col. 3). Robust standard errors are clustered at the state level. The regression specification follows
that of Table 5 (except that it is estimated for a particular industry subgroup). I include year-quarter, age
group, geography, and firm size fixed effects, as well as all possible pairwise interactions of these fixed effects.
The use of these fixed effects makes it unnecessary to control explicitly for isCA, Post, Large, or any pairwise
interaction of these variables. Only the main coefficient of interest, isCA x Large x Post, is reported.
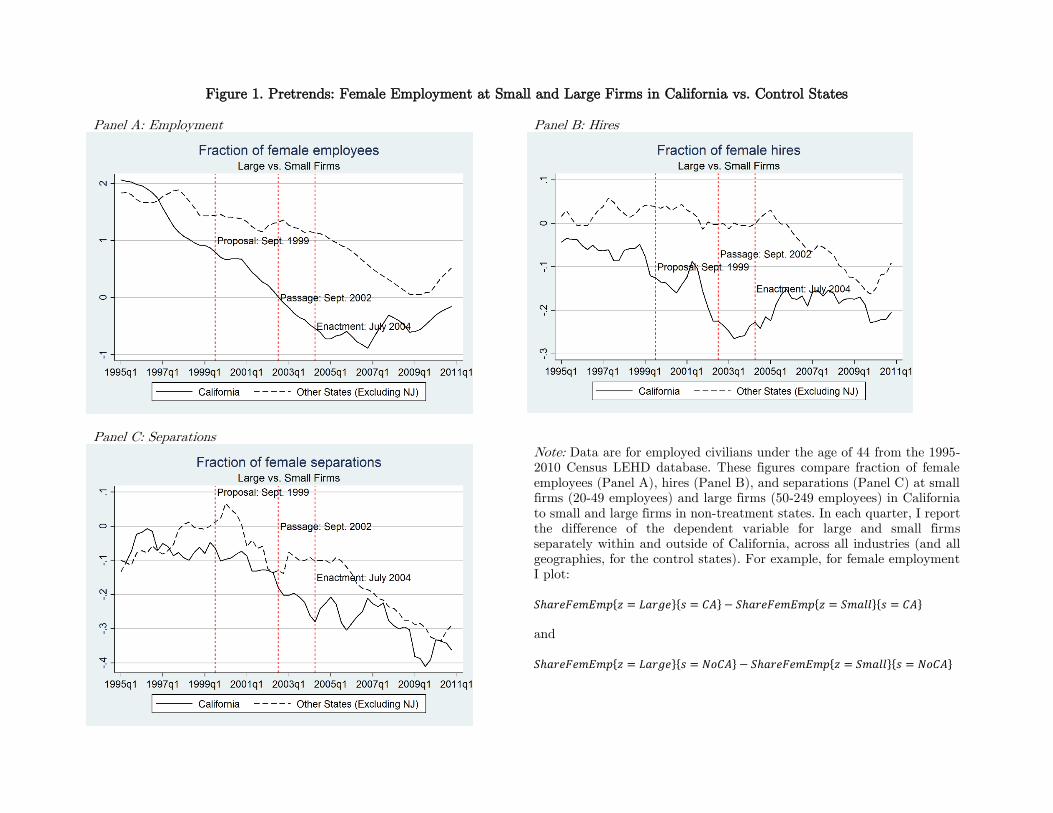
Figure 1. Pretrends: Female Employment at Small and Large Firms in California vs. Control States
Panel A: Employment Panel B: Hires
Panel C: Separations
Note: Data are for employed civilians under the age of 44 from the 1995-
2010 Census LEHD database. These figures compare fraction of female
employees (Panel A), hires (Panel B), and separations (Panel C) at small
firms (20-49 employees) and large firms (50-249 employees) in California
to small and large firms in non-treatment states. In each quarter, I report
the difference of the dependent variable for large and small firms
separately within and outside of California, across all industries (and all
geographies, for the control states). For example, for female employment
I plot:
𝑆ℎ𝑎𝑟𝑒𝐹𝑒𝑚𝐸𝑚𝑝{𝑧 = 𝐿𝑎𝑟𝑔𝑒}{𝑠 = 𝐶𝐴} − 𝑆ℎ𝑎𝑟𝑒𝐹𝑒𝑚𝐸𝑚𝑝{𝑧 = 𝑆𝑚𝑎𝑙𝑙}{𝑠 = 𝐶𝐴}
and
𝑆ℎ𝑎𝑟𝑒𝐹𝑒𝑚𝐸𝑚𝑝{𝑧 = 𝐿𝑎𝑟𝑔𝑒}{𝑠 = 𝑁𝑜𝐶𝐴} − 𝑆ℎ𝑎𝑟𝑒𝐹𝑒𝑚𝐸𝑚𝑝{𝑧 = 𝑆𝑚𝑎𝑙𝑙}{𝑠 = 𝑁𝑜𝐶𝐴}
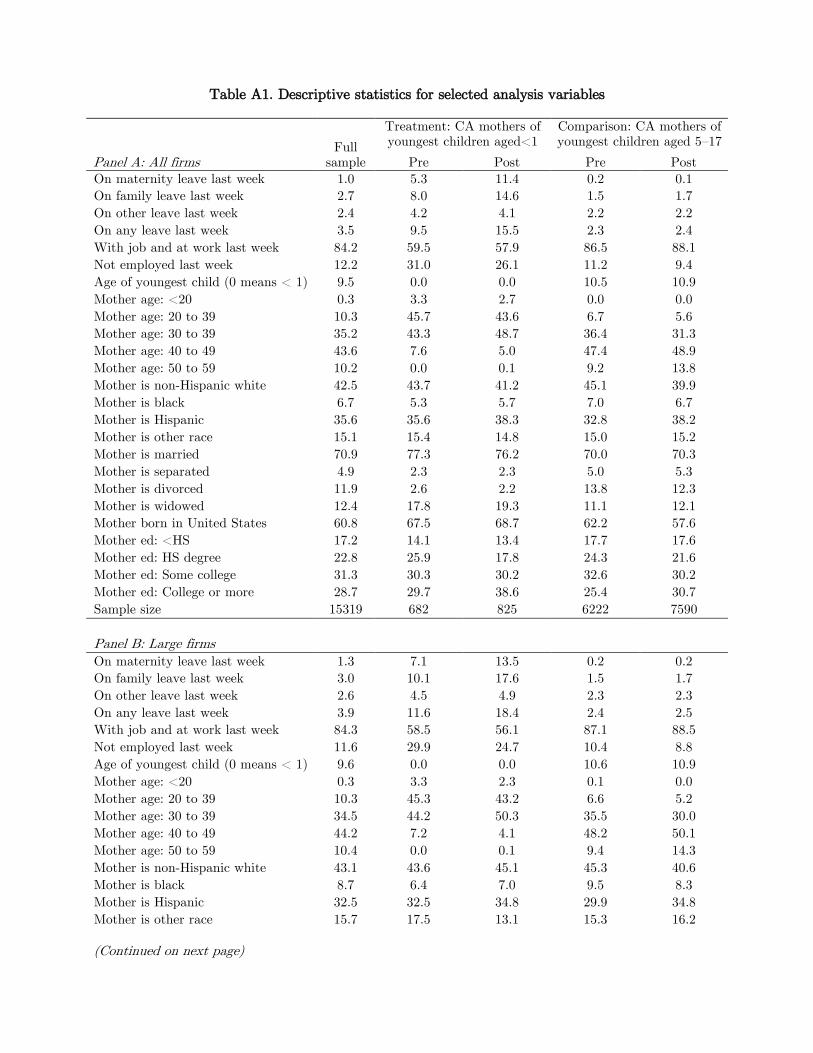
Table A1. Descriptive statistics for selected analysis variables
Full
sample
Treatment: CA mothers of
youngest children aged<1
Comparison: CA mothers of
youngest children aged 5–17
Panel A: All firms Pre Post Pre Post
On maternity leave last week 1.0 5.3 11.4 0.2 0.1
On family leave last week 2.7 8.0 14.6 1.5 1.7
On other leave last week 2.4 4.2 4.1 2.2 2.2
On any leave last week 3.5 9.5 15.5 2.3 2.4
With job and at work last week 84.2 59.5 57.9 86.5 88.1
Not employed last week 12.2 31.0 26.1 11.2 9.4
Age of youngest child (0 means < 1) 9.5 0.0 0.0 10.5 10.9
Mother age: <20 0.3 3.3 2.7 0.0 0.0
Mother age: 20 to 39 10.3 45.7 43.6 6.7 5.6
Mother age: 30 to 39 35.2 43.3 48.7 36.4 31.3
Mother age: 40 to 49 43.6 7.6 5.0 47.4 48.9
Mother age: 50 to 59 10.2 0.0 0.1 9.2 13.8
Mother is non-Hispanic white 42.5 43.7 41.2 45.1 39.9
Mother is black 6.7 5.3 5.7 7.0 6.7
Mother is Hispanic 35.6 35.6 38.3 32.8 38.2
Mother is other race 15.1 15.4 14.8 15.0 15.2
Mother is married 70.9 77.3 76.2 70.0 70.3
Mother is separated 4.9 2.3 2.3 5.0 5.3
Mother is divorced 11.9 2.6 2.2 13.8 12.3
Mother is widowed 12.4 17.8 19.3 11.1 12.1
Mother born in United States 60.8 67.5 68.7 62.2 57.6
Mother ed: <HS 17.2 14.1 13.4 17.7 17.6
Mother ed: HS degree 22.8 25.9 17.8 24.3 21.6
Mother ed: Some college 31.3 30.3 30.2 32.6 30.2
Mother ed: College or more 28.7 29.7 38.6 25.4 30.7
Sample size 15319 682 825 6222 7590
Panel B: Large firms
On maternity leave last week 1.3 7.1 13.5 0.2 0.2
On family leave last week 3.0 10.1 17.6 1.5 1.7
On other leave last week 2.6 4.5 4.9 2.3 2.3
On any leave last week 3.9 11.6 18.4 2.4 2.5
With job and at work last week 84.3 58.5 56.1 87.1 88.5
Not employed last week 11.6 29.9 24.7 10.4 8.8
Age of youngest child (0 means < 1) 9.6 0.0 0.0 10.6 10.9
Mother age: <20 0.3 3.3 2.3 0.1 0.0
Mother age: 20 to 39 10.3 45.3 43.2 6.6 5.2
Mother age: 30 to 39 34.5 44.2 50.3 35.5 30.0
Mother age: 40 to 49 44.2 7.2 4.1 48.2 50.1
Mother age: 50 to 59 10.4 0.0 0.1 9.4 14.3
Mother is non-Hispanic white 43.1 43.6 45.1 45.3 40.6
Mother is black 8.7 6.4 7.0 9.5 8.3
Mother is Hispanic 32.5 32.5 34.8 29.9 34.8
Mother is other race 15.7 17.5 13.1 15.3 16.2
(Continued on next page)
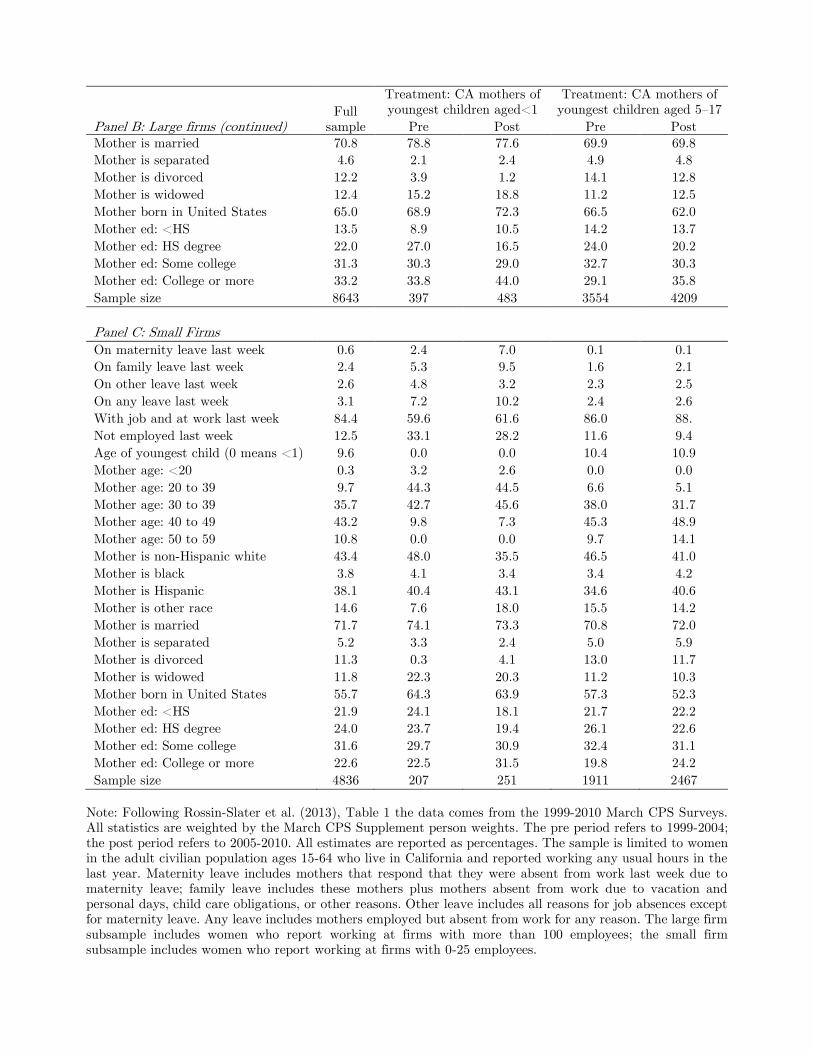
Full
sample
Treatment: CA mothers of
youngest children aged<1
Treatment: CA mothers of
youngest children aged 5–17
Panel B: Large firms (continued) Pre Post Pre Post
Mother is married 70.8 78.8 77.6 69.9 69.8
Mother is separated 4.6 2.1 2.4 4.9 4.8
Mother is divorced 12.2 3.9 1.2 14.1 12.8
Mother is widowed 12.4 15.2 18.8 11.2 12.5
Mother born in United States 65.0 68.9 72.3 66.5 62.0
Mother ed: <HS 13.5 8.9 10.5 14.2 13.7
Mother ed: HS degree 22.0 27.0 16.5 24.0 20.2
Mother ed: Some college 31.3 30.3 29.0 32.7 30.3
Mother ed: College or more 33.2 33.8 44.0 29.1 35.8
Sample size 8643 397 483 3554 4209
Panel C: Small Firms
On maternity leave last week 0.6 2.4 7.0 0.1 0.1
On family leave last week 2.4 5.3 9.5 1.6 2.1
On other leave last week 2.6 4.8 3.2 2.3 2.5
On any leave last week 3.1 7.2 10.2 2.4 2.6
With job and at work last week 84.4 59.6 61.6 86.0 88.
Not employed last week 12.5 33.1 28.2 11.6 9.4
Age of youngest child (0 means <1) 9.6 0.0 0.0 10.4 10.9
Mother age: <20 0.3 3.2 2.6 0.0 0.0
Mother age: 20 to 39 9.7 44.3 44.5 6.6 5.1
Mother age: 30 to 39 35.7 42.7 45.6 38.0 31.7
Mother age: 40 to 49 43.2 9.8 7.3 45.3 48.9
Mother age: 50 to 59 10.8 0.0 0.0 9.7 14.1
Mother is non-Hispanic white 43.4 48.0 35.5 46.5 41.0
Mother is black 3.8 4.1 3.4 3.4 4.2
Mother is Hispanic 38.1 40.4 43.1 34.6 40.6
Mother is other race 14.6 7.6 18.0 15.5 14.2
Mother is married 71.7 74.1 73.3 70.8 72.0
Mother is separated 5.2 3.3 2.4 5.0 5.9
Mother is divorced 11.3 0.3 4.1 13.0 11.7
Mother is widowed 11.8 22.3 20.3 11.2 10.3
Mother born in United States 55.7 64.3 63.9 57.3 52.3
Mother ed: <HS 21.9 24.1 18.1 21.7 22.2
Mother ed: HS degree 24.0 23.7 19.4 26.1 22.6
Mother ed: Some college 31.6 29.7 30.9 32.4 31.1
Mother ed: College or more 22.6 22.5 31.5 19.8 24.2
Sample size 4836 207 251 1911 2467
Note: Following Rossin-Slater et al. (2013), Table 1 the data comes from the 1999-2010 March CPS Surveys.
All statistics are weighted by the March CPS Supplement person weights. The pre period refers to 1999-2004;
the post period refers to 2005-2010. All estimates are reported as percentages. The sample is limited to women
in the adult civilian population ages 15-64 who live in California and reported working any usual hours in the
last year. Maternity leave includes mothers that respond that they were absent from work last week due to
maternity leave; family leave includes these mothers plus mothers absent from work due to vacation and
personal days, child care obligations, or other reasons. Other leave includes all reasons for job absences except
for maternity leave. Any leave includes mothers employed but absent from work for any reason. The large firm
subsample includes women who report working at firms with more than 100 employees; the small firm
subsample includes women who report working at firms with 0-25 employees.
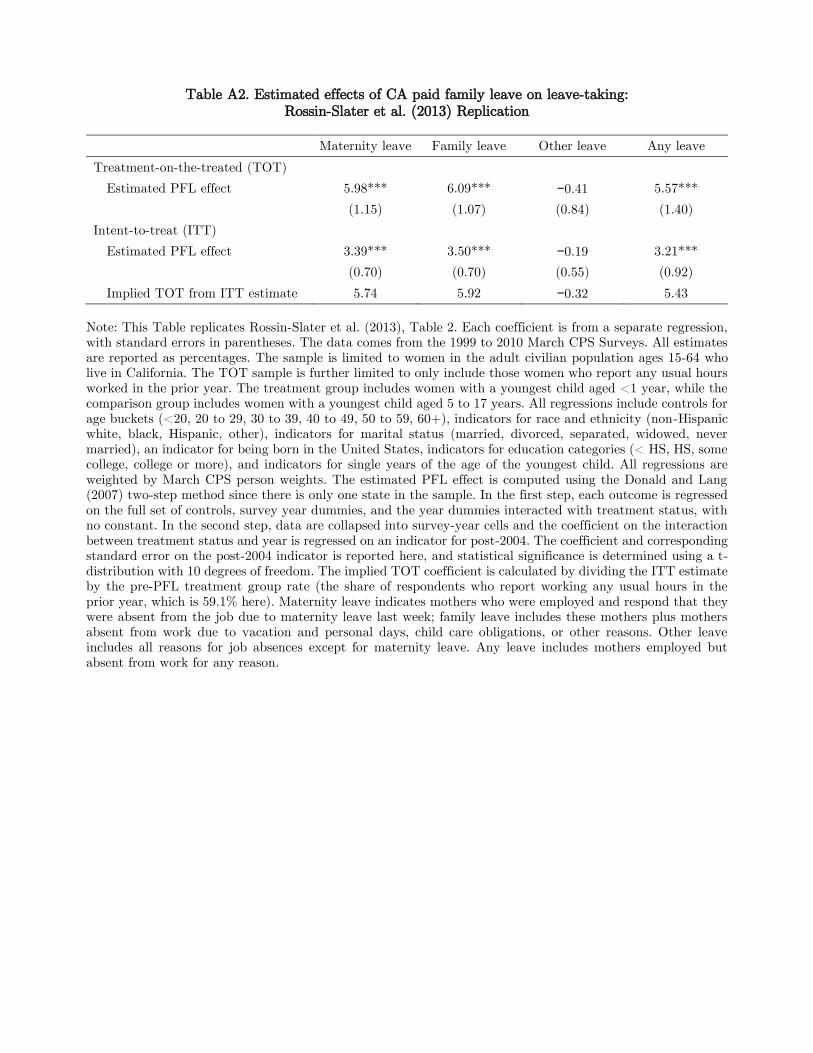
Table A2. Estimated effects of CA paid family leave on leave-taking: Rossin-Slater et al. (2013) Replication
Maternity leave Family leave Other leave Any leave
Treatment-on-the-treated (TOT)
Estimated PFL effect 5.98*** 6.09*** −0.41 5.57***
(1.15) (1.07) (0.84) (1.40)
Intent-to-treat (ITT)
Estimated PFL effect 3.39*** 3.50*** −0.19 3.21***
(0.70) (0.70) (0.55) (0.92)
Implied TOT from ITT estimate 5.74 5.92 −0.32 5.43
Note: This Table replicates Rossin-Slater et al. (2013), Table 2. Each coefficient is from a separate regression,
with standard errors in parentheses. The data comes from the 1999 to 2010 March CPS Surveys. All estimates
are reported as percentages. The sample is limited to women in the adult civilian population ages 15-64 who
live in California. The TOT sample is further limited to only include those women who report any usual hours
worked in the prior year. The treatment group includes women with a youngest child aged <1 year, while the
comparison group includes women with a youngest child aged 5 to 17 years. All regressions include controls for
age buckets (<20, 20 to 29, 30 to 39, 40 to 49, 50 to 59, 60+), indicators for race and ethnicity (non-Hispanic
white, black, Hispanic, other), indicators for marital status (married, divorced, separated, widowed, never
married), an indicator for being born in the United States, indicators for education categories (< HS, HS, some
college, college or more), and indicators for single years of the age of the youngest child. All regressions are
weighted by March CPS person weights. The estimated PFL effect is computed using the Donald and Lang
(2007) two-step method since there is only one state in the sample. In the first step, each outcome is regressed
on the full set of controls, survey year dummies, and the year dummies interacted with treatment status, with
no constant. In the second step, data are collapsed into survey-year cells and the coefficient on the interaction
between treatment status and year is regressed on an indicator for post-2004. The coefficient and corresponding
standard error on the post-2004 indicator is reported here, and statistical significance is determined using a t-
distribution with 10 degrees of freedom. The implied TOT coefficient is calculated by dividing the ITT estimate
by the pre-PFL treatment group rate (the share of respondents who report working any usual hours in the
prior year, which is 59.1% here). Maternity leave indicates mothers who were employed and respond that they
were absent from the job due to maternity leave last week; family leave includes these mothers plus mothers
absent from work due to vacation and personal days, child care obligations, or other reasons. Other leave
includes all reasons for job absences except for maternity leave. Any leave includes mothers employed but
absent from work for any reason.
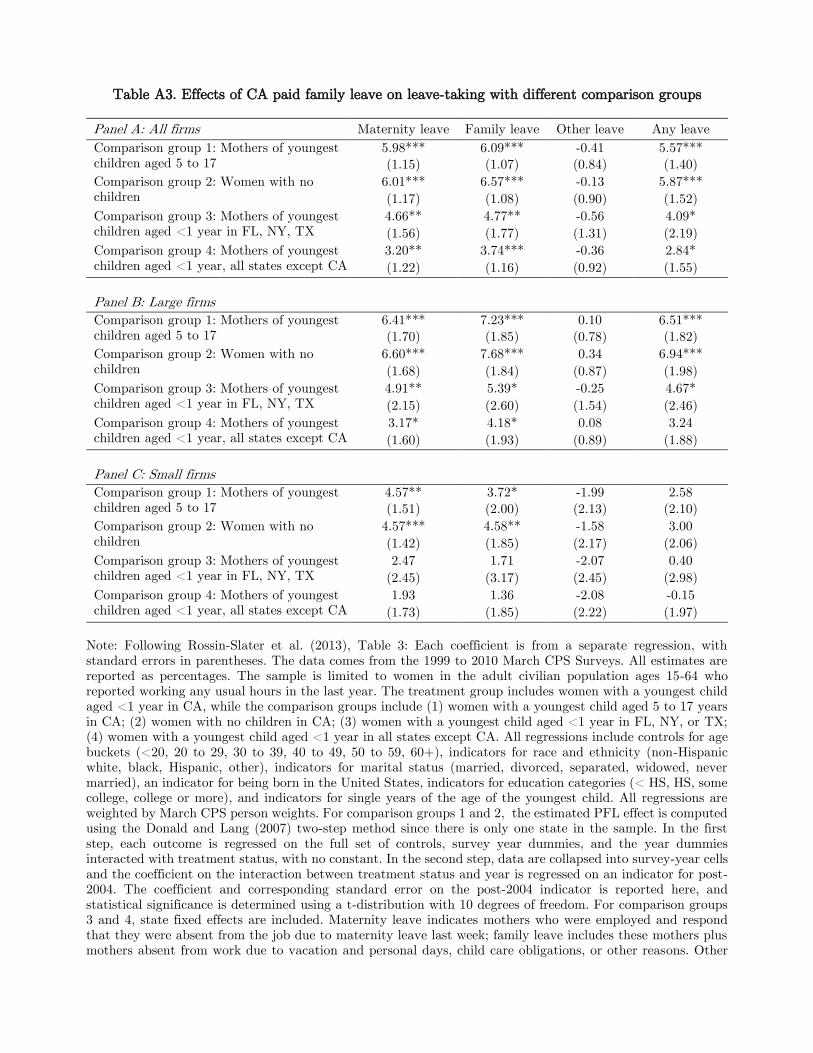
Table A3. Effects of CA paid family leave on leave-taking with different comparison groups
Panel A: All firms Maternity leave Family leave Other leave Any leave
Comparison group 1: Mothers of youngest
children aged 5 to 17
5.98*** 6.09*** -0.41 5.57***
(1.15) (1.07) (0.84) (1.40)
Comparison group 2: Women with no
children
6.01*** 6.57*** -0.13 5.87***
(1.17) (1.08) (0.90) (1.52)
Comparison group 3: Mothers of youngest
children aged <1 year in FL, NY, TX
4.66** 4.77** -0.56 4.09*
(1.56) (1.77) (1.31) (2.19)
Comparison group 4: Mothers of youngest
children aged <1 year, all states except CA
3.20** 3.74*** -0.36 2.84*
(1.22) (1.16) (0.92) (1.55)
Panel B: Large firms
Comparison group 1: Mothers of youngest
children aged 5 to 17
6.41*** 7.23*** 0.10 6.51***
(1.70) (1.85) (0.78) (1.82)
Comparison group 2: Women with no
children
6.60*** 7.68*** 0.34 6.94***
(1.68) (1.84) (0.87) (1.98)
Comparison group 3: Mothers of youngest
children aged <1 year in FL, NY, TX
4.91** 5.39* -0.25 4.67*
(2.15) (2.60) (1.54) (2.46)
Comparison group 4: Mothers of youngest
children aged <1 year, all states except CA
3.17* 4.18* 0.08 3.24
(1.60) (1.93) (0.89) (1.88)
Panel C: Small firms
Comparison group 1: Mothers of youngest
children aged 5 to 17
4.57** 3.72* -1.99 2.58
(1.51) (2.00) (2.13) (2.10)
Comparison group 2: Women with no
children
4.57*** 4.58** -1.58 3.00
(1.42) (1.85) (2.17) (2.06)
Comparison group 3: Mothers of youngest
children aged <1 year in FL, NY, TX
2.47 1.71 -2.07 0.40
(2.45) (3.17) (2.45) (2.98)
Comparison group 4: Mothers of youngest
children aged <1 year, all states except CA
1.93 1.36 -2.08 -0.15
(1.73) (1.85) (2.22) (1.97)
Note: Following Rossin-Slater et al. (2013), Table 3: Each coefficient is from a separate regression, with
standard errors in parentheses. The data comes from the 1999 to 2010 March CPS Surveys. All estimates are
reported as percentages. The sample is limited to women in the adult civilian population ages 15-64 who
reported working any usual hours in the last year. The treatment group includes women with a youngest child
aged <1 year in CA, while the comparison groups include (1) women with a youngest child aged 5 to 17 years
in CA; (2) women with no children in CA; (3) women with a youngest child aged <1 year in FL, NY, or TX;
(4) women with a youngest child aged <1 year in all states except CA. All regressions include controls for age
buckets (<20, 20 to 29, 30 to 39, 40 to 49, 50 to 59, 60+), indicators for race and ethnicity (non-Hispanic
white, black, Hispanic, other), indicators for marital status (married, divorced, separated, widowed, never
married), an indicator for being born in the United States, indicators for education categories (< HS, HS, some
college, college or more), and indicators for single years of the age of the youngest child. All regressions are
weighted by March CPS person weights. For comparison groups 1 and 2, the estimated PFL effect is computed
using the Donald and Lang (2007) two-step method since there is only one state in the sample. In the first
step, each outcome is regressed on the full set of controls, survey year dummies, and the year dummies
interacted with treatment status, with no constant. In the second step, data are collapsed into survey-year cells
and the coefficient on the interaction between treatment status and year is regressed on an indicator for post-
2004. The coefficient and corresponding standard error on the post-2004 indicator is reported here, and
statistical significance is determined using a t-distribution with 10 degrees of freedom. For comparison groups
3 and 4, state fixed effects are included. Maternity leave indicates mothers who were employed and respond
that they were absent from the job due to maternity leave last week; family leave includes these mothers plus
mothers absent from work due to vacation and personal days, child care obligations, or other reasons. Other

leave includes all reasons for job absences except for maternity leave. Any leave includes mothers employed
but absent from work for any reason. The large firm subsample includes women who report working at firms
with more than 100 employees; the small firm subsample includes women who report working at firms with 0-
25 employees.
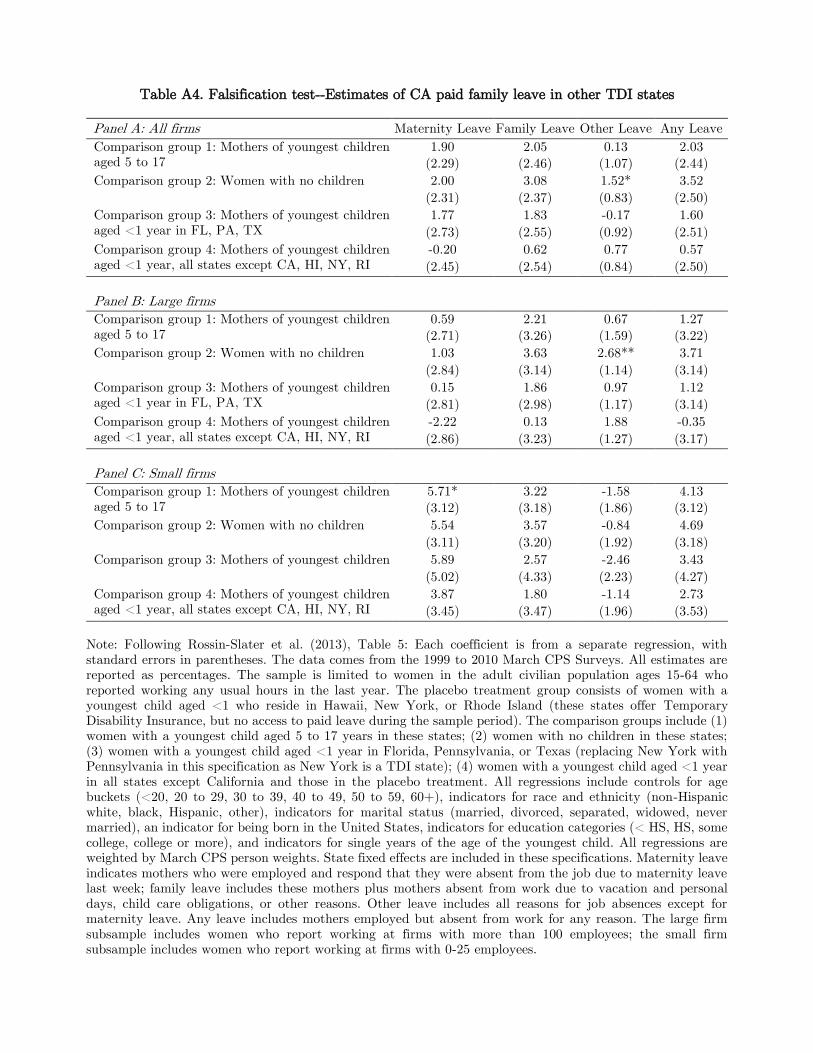
Table A4. Falsification test--Estimates of CA paid family leave in other TDI states
Panel A: All firms Maternity Leave Family Leave Other Leave Any Leave
Comparison group 1: Mothers of youngest children
aged 5 to 17
1.90 2.05 0.13 2.03
(2.29) (2.46) (1.07) (2.44)
Comparison group 2: Women with no children 2.00 3.08 1.52* 3.52
(2.31) (2.37) (0.83) (2.50)
Comparison group 3: Mothers of youngest children
aged <1 year in FL, PA, TX
1.77 1.83 -0.17 1.60
(2.73) (2.55) (0.92) (2.51)
Comparison group 4: Mothers of youngest children
aged <1 year, all states except CA, HI, NY, RI
-0.20 0.62 0.77 0.57
(2.45) (2.54) (0.84) (2.50)
Panel B: Large firms
Comparison group 1: Mothers of youngest children
aged 5 to 17
0.59 2.21 0.67 1.27
(2.71) (3.26) (1.59) (3.22)
Comparison group 2: Women with no children 1.03 3.63 2.68** 3.71 (2.84) (3.14) (1.14) (3.14)
Comparison group 3: Mothers of youngest children
aged <1 year in FL, PA, TX
0.15 1.86 0.97 1.12
(2.81) (2.98) (1.17) (3.14)
Comparison group 4: Mothers of youngest children
aged <1 year, all states except CA, HI, NY, RI
-2.22 0.13 1.88 -0.35
(2.86) (3.23) (1.27) (3.17)
Panel C: Small firms
Comparison group 1: Mothers of youngest children
aged 5 to 17
5.71* 3.22 -1.58 4.13
(3.12) (3.18) (1.86) (3.12)
Comparison group 2: Women with no children 5.54 3.57 -0.84 4.69
(3.11) (3.20) (1.92) (3.18)
Comparison group 3: Mothers of youngest children
aged <1 year in FL, PA, TX
5.89 2.57 -2.46 3.43 (5.02) (4.33) (2.23) (4.27)
Comparison group 4: Mothers of youngest children
aged <1 year, all states except CA, HI, NY, RI
3.87 1.80 -1.14 2.73
(3.45) (3.47) (1.96) (3.53)
Note: Following Rossin-Slater et al. (2013), Table 5: Each coefficient is from a separate regression, with
standard errors in parentheses. The data comes from the 1999 to 2010 March CPS Surveys. All estimates are
reported as percentages. The sample is limited to women in the adult civilian population ages 15-64 who
reported working any usual hours in the last year. The placebo treatment group consists of women with a
youngest child aged <1 who reside in Hawaii, New York, or Rhode Island (these states offer Temporary
Disability Insurance, but no access to paid leave during the sample period). The comparison groups include (1)
women with a youngest child aged 5 to 17 years in these states; (2) women with no children in these states;
(3) women with a youngest child aged <1 year in Florida, Pennsylvania, or Texas (replacing New York with
Pennsylvania in this specification as New York is a TDI state); (4) women with a youngest child aged <1 year
in all states except California and those in the placebo treatment. All regressions include controls for age
buckets (<20, 20 to 29, 30 to 39, 40 to 49, 50 to 59, 60+), indicators for race and ethnicity (non-Hispanic
white, black, Hispanic, other), indicators for marital status (married, divorced, separated, widowed, never
married), an indicator for being born in the United States, indicators for education categories (< HS, HS, some
college, college or more), and indicators for single years of the age of the youngest child. All regressions are
weighted by March CPS person weights. State fixed effects are included in these specifications. Maternity leave
indicates mothers who were employed and respond that they were absent from the job due to maternity leave
last week; family leave includes these mothers plus mothers absent from work due to vacation and personal
days, child care obligations, or other reasons. Other leave includes all reasons for job absences except for
maternity leave. Any leave includes mothers employed but absent from work for any reason. The large firm
subsample includes women who report working at firms with more than 100 employees; the small firm
subsample includes women who report working at firms with 0-25 employees.
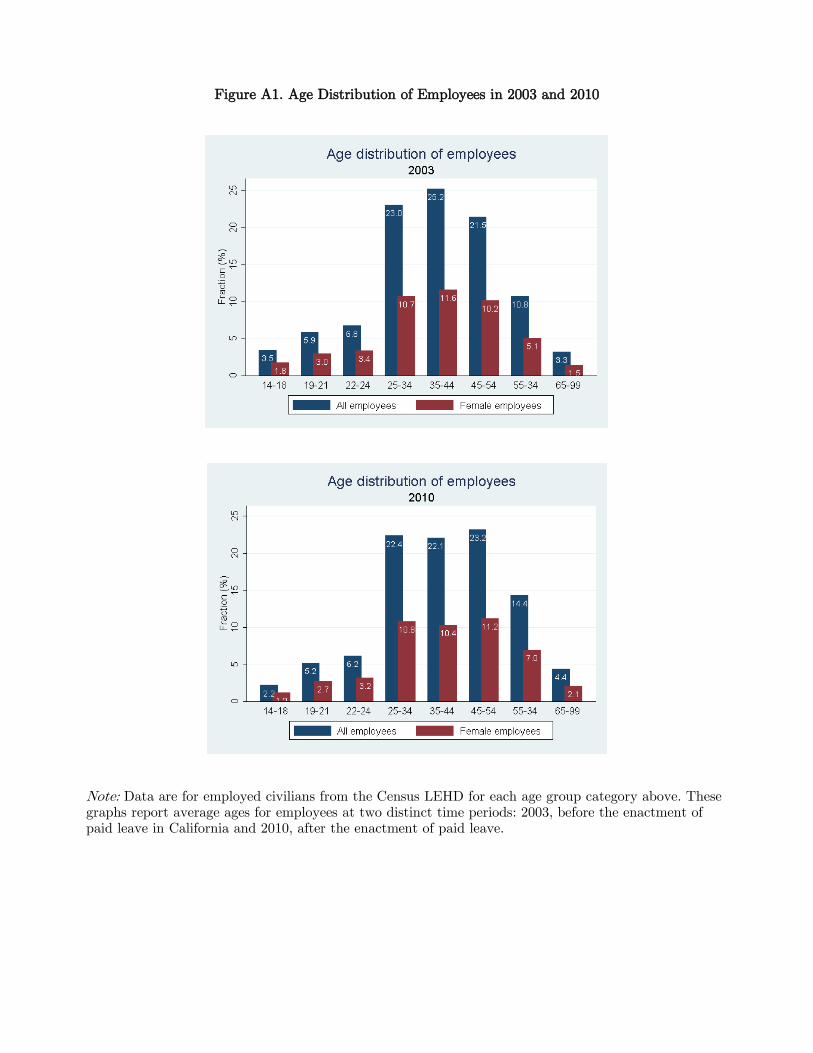
Figure A1. Age Distribution of Employees in 2003 and 2010
Note: Data are for employed civilians from the Census LEHD for each age group category above. These graphs report average ages for employees at two distinct time periods: 2003, before the enactment of paid leave in California and 2010, after the enactment of paid leave.

Figure A2. Geographic Distribution of Female Employees in 2003 and 2010
2003
2010
Note: Data are for employed civilians from the Census LEHD for each state. These maps report percentage of female employees at two distinct time periods: 2003, before the enactment of paid leave in California and 2010, after the enactment of paid leave.


![Maternity Leave Rights [FAQ] Answered](https://static.fdocuments.in/doc/165x107/58775eca1a28ab4e4f8b636f/maternity-leave-rights-faq-answered.jpg)