THE IMPACT OF JAMKESMAS ON HEALTHCARE UTILIZATION IN ...
18
Jurnal Ekonomi & Studi Pembangunan Volume 19, Nomor 2, Oktober 2018, hlm. 116-133 DOI: 10.18196/jesp.19.2.5003 THE IMPACT OF JAMKESMAS ON HEALTHCARE UTILIZATION IN EASTERN REGIONS OF INDONESIA: A PROPENSITY SCORE MATCHING METHOD Novat Pugo Sambodo Erasmus School of Health Policy and Management, Erasmus Universiteit Rotterdam Research Associate Pusat Kebijakan Pembiayaan dan Manajemen Asuransi Kesehatan, Medical Faculty Universitas Gadjah Mada Jl. Farmako, Sekip Utara, Yogyakarta 55281 Correspondence E-mail: [email protected] Received: September 2018; Accepted: October 2018 Abstract: Underutilization of health care for the poor is one critical problem in Indonesia. Out of pocket share is dominant on overall health financing. Therefore, it is plausible that low demand of modern healthcare services mainly relates to financial aspect. In 2008, the government of Indonesia has introduced health insurance schemes for the poor to help them overcome the problem of medical costs barrier called Jamkesmas (Social Health Insurance). This paper examines the impact evaluation of Jamkesmas to health care utilization in Eastern Indonesia. Data are drawn from Indonesia Family Life Survey East (IFLS-East) that held in 2012. This data only covers the eastern regions of Indonesia that widely known has relatively lower performance in development and infrastructure. Moreover, this study employs Propensity Score Matching (PSM) approach to analyse the data. The results show that average treatment effect for treated group are positive for outpatient utilization. In addition, availability of the healthcare facility variables, travelling time and distance to district capital are fac- tors that determine Jamkemas coverage in Eastern Indonesia. Keywords: social health insurance, healthcare utilization, impact evaluation JEL Classification: I13, I15, H43 INTRODUCTION Underutilization of health care for the poor is one critical problem in Indonesia. Ac- cording to Somanathan (2008), out of pocket share during 1995 to 2004 was between 60-70% on overall health financing. Therefore, it is plausible that low demand of modern healthcare services mainly relates to financial aspect (Somanathan 2008, p. 1). Hence, Gov- ernment of Indonesia (GoI) tries to reform social safety nets in order to protect the most vulnera- ble family in the hardship situation, i.e. eco- nomics crises in 1997 and 2008. GoI has intro- duced various health insurance schemes for the poor to help them overcome the problem of medical costs barrier. Health insurance in Indonesia had been gone through several evolutions. It started with Dana Sehat in 1969, Jaminan Pemeliharaan Kesehatan Masyarakat (JPKM) in 1992, and Health Card in 1994. After that, it was followed by Social Safety Nets or Jaring Pengaman Sosial (JPS) which was introduced to mitigate the im- pact of Asian Financial Crisis in 1997-1998. Then, the GoI initiated Asuransi Kesehatan Untuk Masyarakat Miskin (Askeskin) in 2005-2007, and finally it is replaced by Jaminan Kesehatan Masyarakat (Jamkesmas) 1 in 2008 (Vidyatama et al. 2014). Jamkesmas is a social assistance for healthcare that is provided for the poor and those who cannot afford the healthcare fee. GoI has allocated around 500 million USD or around 20% of all social assistance budget to funding Jamkesmas program. In addition, 1 To avoid any confusion, there is also JAMKESDA which is a similar insurance but the regulation and coverage are under district or city local government responsibility.
Transcript of THE IMPACT OF JAMKESMAS ON HEALTHCARE UTILIZATION IN ...

Jurnal Ekonomi & Studi Pembangunan Volume 19, Nomor 2, Oktober 2018, hlm. 116-133 DOI: 10.18196/jesp.19.2.5003
THE IMPACT OF JAMKESMAS ON HEALTHCARE UTILIZATION IN EASTERN REGIONS OF INDONESIA: A PROPENSITY SCORE
MATCHING METHOD
Novat Pugo Sambodo
Erasmus School of Health Policy and Management, Erasmus Universiteit Rotterdam Research Associate Pusat Kebijakan Pembiayaan dan Manajemen Asuransi Kesehatan,
Medical Faculty Universitas Gadjah Mada Jl. Farmako, Sekip Utara, Yogyakarta 55281
Correspondence E-mail: [email protected]
Received: September 2018; Accepted: October 2018
Abstract: Underutilization of health care for the poor is one critical problem in Indonesia. Out of pocket share is dominant on overall health financing. Therefore, it is plausible that low demand of modern healthcare services mainly relates to financial aspect. In 2008, the government of Indonesia has introduced health insurance schemes for the poor to help them overcome the problem of medical costs barrier called Jamkesmas (Social Health Insurance). This paper examines the impact evaluation of Jamkesmas to health care utilization in Eastern Indonesia. Data are drawn from Indonesia Family Life Survey East (IFLS-East) that held in 2012. This data only covers the eastern regions of Indonesia that widely known has relatively lower performance in development and infrastructure. Moreover, this study employs Propensity Score Matching (PSM) approach to analyse the data. The results show that average treatment effect for treated group are positive for outpatient utilization. In addition, availability of the healthcare facility variables, travelling time and distance to district capital are fac-tors that determine Jamkemas coverage in Eastern Indonesia. Keywords: social health insurance, healthcare utilization, impact evaluation JEL Classification: I13, I15, H43
INTRODUCTION
Underutilization of health care for the
poor is one critical problem in Indonesia. Ac-
cording to Somanathan (2008), out of pocket
share during 1995 to 2004 was between 60-70%
on overall health financing. Therefore, it is
plausible that low demand of modern
healthcare services mainly relates to financial
aspect (Somanathan 2008, p. 1). Hence, Gov-
ernment of Indonesia (GoI) tries to reform social
safety nets in order to protect the most vulnera-
ble family in the hardship situation, i.e. eco-
nomics crises in 1997 and 2008. GoI has intro-
duced various health insurance schemes for the
poor to help them overcome the problem of
medical costs barrier.
Health insurance in Indonesia had been
gone through several evolutions. It started with
Dana Sehat in 1969, Jaminan Pemeliharaan
Kesehatan Masyarakat (JPKM) in 1992, and
Health Card in 1994. After that, it was followed
by Social Safety Nets or Jaring Pengaman Sosial
(JPS) which was introduced to mitigate the im-
pact of Asian Financial Crisis in 1997-1998.
Then, the GoI initiated Asuransi Kesehatan Untuk
Masyarakat Miskin (Askeskin) in 2005-2007, and
finally it is replaced by Jaminan Kesehatan
Masyarakat (Jamkesmas)1 in 2008 (Vidyatama et
al. 2014). Jamkesmas is a social assistance for
healthcare that is provided for the poor and
those who cannot afford the healthcare fee. GoI
has allocated around 500 million USD or
around 20% of all social assistance budget to
funding Jamkesmas program. In addition,
1To avoid any confusion, there is also JAMKESDA which is a similar insurance but the regulation and coverage are under district or city local government responsibility.
The Impact of Jamkesmas on Healthcare Utilization… (Novat Pugo Sambodo) 117
Ministry of Health appointed to implement this
program starting from 2008 until early 2014.
Currently, BPJS (Social Security Agency) pro-
gram substitutes Jamkesmas with broader cover-
age, i.e. not only for the poor. However, the
lesson from Jamkesmas implementation remains
relevant and valuable for policy analysis.
There have been many studies evaluating
health insurance program in Indonesia. The lat-
est study by Vidyatama et al. (2014) finds that
health insurance owner 8% more likely using
healthcare service when falling sick and it be-
comes 5% if people who are not sick are in-
cluded in the estimation. Other study tries to
contrast the effect of Askeskin and non-Askeskin
(Aji et al. 2013). Their research finding supports
the argument of financial barrier; both types of
health insurance program can decrease out of
pocket payment. Distance and location factors
also have a significant influence on healthcare
utilisation, especially for rural community. In
contrast, people living in urban community are
less sensitive to distance, but relatively more
sensitive to medical fee (Erlyana et al. 2011).
In brief, contributions of this paper have
three points. First, this paper gives more atten-
tion to eastern region of Indonesia than try to
get national level studies. Most previous studies
on the health insurance impact evaluation in
Indonesia have a limitation on capturing geo-
graphical aspect and eastern Indonesia focus.
Nevertheless, this region is relatively lacking in
many social development indicators as com-
pared to the western regions. Furthermore, In-
donesia Statistic Office reported that 70% of
underdeveloped districts are located in eastern
Indonesia. It hopes give more understanding of
Jamkesmas implementation than get only general
idea of national level.
Second, this study also includes more var-
iables such as travel time, distance and availa-
bility of service variables. Unlike other datasets
such as SUSENAS and RISKESDAS used by
Vidayatama et.al (2014), and Sparrow et.al
(2013), IFLS-East has a possibility to merge be-
tween individual and household information
with community or village data. IFLS-East data
is the newest IFLS since the previous IFLS, IFLS
4 taken in 2007. Thus, this paper expect more
update information as compared with other
paper using previous IFLS data like IFLS 3 (Er-
lyana et al. 2011) or IFLS 1 and IFLS 2 (Hidayat
et al. 2010).
This paper aims to analyse the impact of
Jamkesmas on healthcare utilization in eastern
part of Indonesia. With this objective, the study
attempts to answer two research questions: (1)
Does Jamkesmas significantly help the poor
household to increase their health care utiliza-
tion when falling ill? (2) Is there any difference
of household choice preference between the
public and the private health services given var-
iables in the model?
The following part of this essay briefly de-
scribes Indonesian health insurance from re-
form from 1998 (after economic crisis) with So-
cial Safety Net (SSN) until recent implementa-
tion of Social Security Agency (BPJS). Section 3
outlines some characteristics of data we use in
this research. Empirical challenge and method-
ology to deal with those challenges will be dis-
cussed in section 4. Section 5 discusses the re-
sult of this study and discussion. A final section
highlights what this paper main finding and
policy implication that we can make given the
result from this paper.
Reform in Indonesian Social Insurance
Recently the Government of Indonesia
(GoI) has set an ambition to have every citizen
covered by insurance. GoI initiated Social Secu-
rity Agency or Badan Penyelenggara Jaminan So-
sial (BPJS) in 2014. It is a part of the implemen-
tation of National Social Security System Law
2004 no. 40 and Social Security Agency Law
2011 no. 24. The law is introduced as a response
of a rigid limitation in the insurance coverage
that could only reach people with formal em-
ployment status. These insurances include As-
pen, Askes, Jamsostek and Asabri. Hence, the ul-
timate goal of BPJS is to expand the coverage
and improve the service to its beneficiaries.
118 Jurnal Ekonomi & Studi Pembangunan Vol. 19, No. 2, Oktober 2018: 116-133
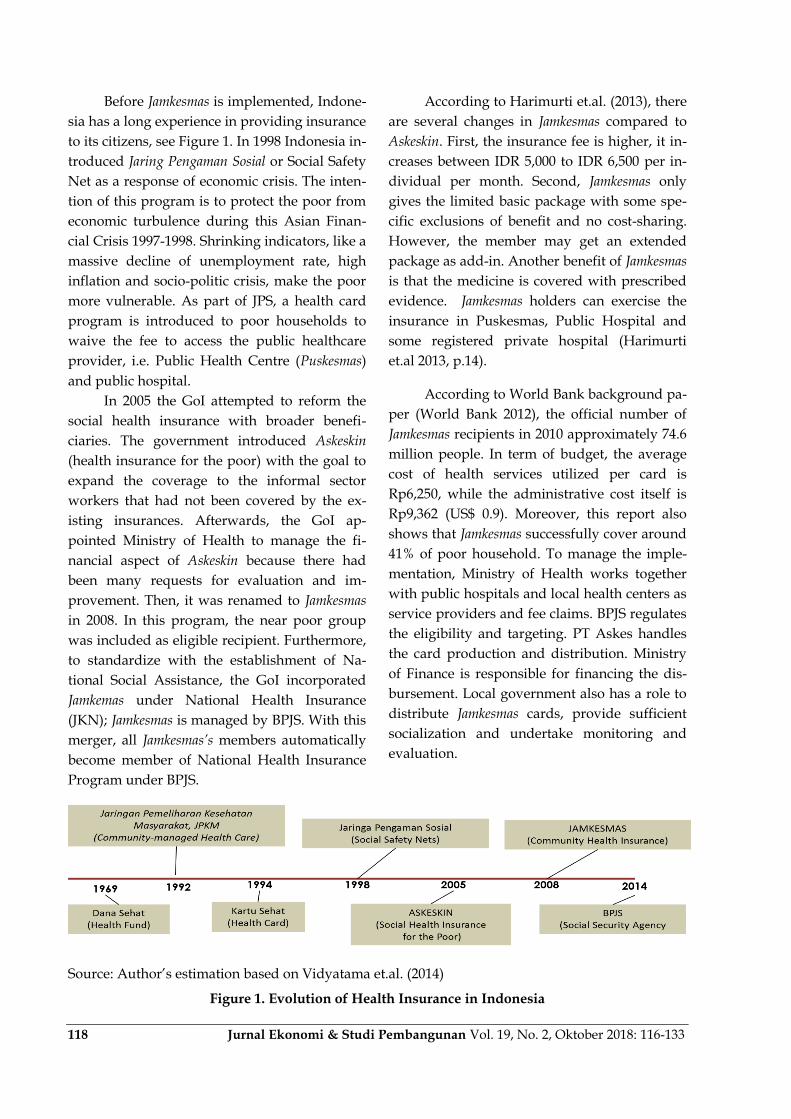
Before Jamkesmas is implemented, Indone-
sia has a long experience in providing insurance
to its citizens, see Figure 1. In 1998 Indonesia in-
troduced Jaring Pengaman Sosial or Social Safety
Net as a response of economic crisis. The inten-
tion of this program is to protect the poor from
economic turbulence during this Asian Finan-
cial Crisis 1997-1998. Shrinking indicators, like a
massive decline of unemployment rate, high
inflation and socio-politic crisis, make the poor
more vulnerable. As part of JPS, a health card
program is introduced to poor households to
waive the fee to access the public healthcare
provider, i.e. Public Health Centre (Puskesmas)
and public hospital.
In 2005 the GoI attempted to reform the
social health insurance with broader benefi-
ciaries. The government introduced Askeskin
(health insurance for the poor) with the goal to
expand the coverage to the informal sector
workers that had not been covered by the ex-
isting insurances. Afterwards, the GoI ap-
pointed Ministry of Health to manage the fi-
nancial aspect of Askeskin because there had
been many requests for evaluation and im-
provement. Then, it was renamed to Jamkesmas
in 2008. In this program, the near poor group
was included as eligible recipient. Furthermore,
to standardize with the establishment of Na-
tional Social Assistance, the GoI incorporated
Jamkemas under National Health Insurance
(JKN); Jamkesmas is managed by BPJS. With this
merger, all Jamkesmas’s members automatically
become member of National Health Insurance
Program under BPJS.
According to Harimurti et.al. (2013), there
are several changes in Jamkesmas compared to
Askeskin. First, the insurance fee is higher, it in-
creases between IDR 5,000 to IDR 6,500 per in-
dividual per month. Second, Jamkesmas only
gives the limited basic package with some spe-
cific exclusions of benefit and no cost-sharing.
However, the member may get an extended
package as add-in. Another benefit of Jamkesmas
is that the medicine is covered with prescribed
evidence. Jamkesmas holders can exercise the
insurance in Puskesmas, Public Hospital and
some registered private hospital (Harimurti
et.al 2013, p.14).
According to World Bank background pa-
per (World Bank 2012), the official number of
Jamkesmas recipients in 2010 approximately 74.6
million people. In term of budget, the average
cost of health services utilized per card is
Rp6,250, while the administrative cost itself is
Rp9,362 (US$ 0.9). Moreover, this report also
shows that Jamkesmas successfully cover around
41% of poor household. To manage the imple-
mentation, Ministry of Health works together
with public hospitals and local health centers as
service providers and fee claims. BPJS regulates
the eligibility and targeting. PT Askes handles
the card production and distribution. Ministry
of Finance is responsible for financing the dis-
bursement. Local government also has a role to
distribute Jamkesmas cards, provide sufficient
socialization and undertake monitoring and
evaluation.
Source: Author‟s estimation based on Vidyatama et.al. (2014)
Figure 1. Evolution of Health Insurance in Indonesia
The Impact of Jamkesmas on Healthcare Utilization… (Novat Pugo Sambodo) 119
RESEARCH METHOD
Data
This paper utilizes the IFLS-East 2012
(Sikoki et al. 2013), which is the first survey that
specifically covers the eastern provinces of In-
donesia that have never been surveyed by 4
previous IFLS. It covers the information in indi-
vidual, household and community level. There
are seven provinces surveyed: Kalimantan Ti-
mur, Nusa Tenggara Timur, Maluku, Maluku
Utara, Papua, Papua Barat, and Sulawesi
Tenggara. Moreover, IFLS-East data involves 99
villages consisting of 3,159 and 2,547 house-
holds. Within these households, 10,887 individ-
uals are interviewed (Satriawan et al. 2014). The
richness of information presented in this dataset
supports the analysis, thus leading to better es-
timates in explaining the independent variables.
IFLS-East data is accessible at this URL
<http://surveymeter.org/research/3/iflseast>.
This study exercises some dependent var-
iables, including outpatient variables for total,
public health centres and private health ser-
vices. This paper also tries to capture the impact
of Jamkesmas on inpatient utilization. Similar to
outpatient outcome, it also classifies both public
and private. Using the household expenditure
dataset from IFLS, this paper constructs the out
of pocket variables and the catastrophic health
expenditure incident if the health expenditure
of the household exceeds 15% of its total.
The fundamental interest of this program
evaluation study is to investigate the real im-
pact of Jamkesmas on the main outcome. How-
ever, we face some empirical challenges in the
data. First, it is required to estimate the out-
comes that capture the “true” difference be-
tween the impact of Jamkesmas to the treated
group and the untreated group. This cannot be
done by simply estimating the outcome, like the
outpatient and inpatient service utilization or
health expenditure variable of people with and
without Jamkesmas. That naive approach is not
sufficient to capture the causal effect relation-
ship between program and outcomes. Hence,
the main challenge for this impact evaluation
study is to get the counterfactual group in the
data. Each household needs to get match com-
parison with other household with same char-
acteristic before get the program.
Second, the allocation of Jamkesmas is
based on the eligibility determined by
Indonesian Ministry of Health, and certainly it
is not selected randomly. Jamkesmas is only
provided for the poor and the non-poor. Hence,
measuring the outcome with simple Ordinary
Least Square could produce a bias estimation.
This is because there is also a possibility that
some poor and near poor households who are
eligible, but they do not receive the benefit of
Jamkesmas. These eligible households have a
tendency to have less utilization, even if they
hold a health insurance. If the randomness of
data is satisfied, we could make an estimation
with other estimation model, such as
randomized selection, regression discontinuity
and difference-in-difference. However, since the
randomness is not satisfied, the IFLS-East da-
taset is a cross-sectional data. Lastly, we as-
sumed that the eligibility of Jamkesmas are ob-
servable in variables contained in IFLS-East da-
taset.
In this non-ideal condition, there is one
method that can solve the counterfactual group
problem. It is by looking the counterfactual
group within dataset that has a similar or exact
characteristic of the treated group, except the
fact that they get the insurance. This can be
done by using the exact match Propensity Score
Matching (PSM).According to Rosenbaum &
Rubin (1983), propensity score which is also
known as balancing score, represent the condi-
tional probability of observation that will be
given a treatment based on the definite pre-
treatment specification. Furthermore, the fun-
damental reason of PSM is the absence of
experimental framework of program and allo-
cation of program in non-random setting. Then,
the difference of treatment group and control
group is not only in their status in program as a
receiver, but also on the other characteristics
120 Jurnal Ekonomi & Studi Pembangunan Vol. 19, No. 2, Oktober 2018: 116-133
that might impact on the outcome. This bias can
be avoided if we can get the corresponding sim-
ilar households or individuals. After estimating
the outcome of both groups, we then compare
those outcomes. The average difference out-
come of treated and untreated groups allows us
to get impact of the program on beneficiaries.
PSM approach has tree steps in order to
get the average impact of the treatment. First,
we need to estimate the probability of house-
holds in datasets who are receiving Jamkesmas.
This is based on several selected control varia-
bles, which are observable. In this step, we can
utilize Logit or Probit estimation. Both esti-
mates only have minor difference, and the se-
lection is based on the researcher‟s adjustment.
In this study, the Logit method is used. The
next step is to limit our analysis only for house-
holds that have a range of common supports.
Then, after obtaining the range of common
support for each treatment group, we pair them
with the untreated household having the same
or the closest balancing score. Finally, in the last
step we produce the average treatment effect on
the treated group (ATT) by acquiring the aver-
age difference of expected outcome (outpatient,
inpatient, health spending) from people with
and without Jamkesmas.
Based on Jamkesmas and datasets charac-
teristics, this research prefer to use PSM model
that also used by Sparrow et al. (2013) and Pra-
dhan et al. (2004) for Askeskin and Health Card
program, respectively. As an extension of their
work, this paper is to add more specific infor-
mation data on the community infrastructure,
travel time or distance, and availability of
healthcare facility characteristic both public and
private healthcare provider. The matching
model using Logit estimation is shown as fol-
low:
( )
(1)
Equation (1) is the matching model, where Yi is
an outcome of household probability that is
covered by Jamkesmas (Pr (Yi=1)) i.e Y=1 if yes
and Y=0 if no.
In this logit estimation (equation 1) there
are some variables that are included in the con-
trol variables. The variables in the category αind
represent factors attached to person in demo-
graphic categories such as age, sex, years of ed-
ucation, education level, marital status, while
the category αhh represents the household level
characteristics, such as education of household
head, whether of household head is female and
household expenditure (food, non-food and
medical expenditure). Variables in the category
αfas include the availability of the supply sides,
such as the availability of health center facilities,
tools availability and number of staff. The cate-
gory αcomm comprises of community character-
istics, such as geographical and infrastructure
variables. This research also gives more atten-
tion in this aspect as the sample relatively lacks
in infrastructure. Furthermore, self-reported
illness is not included in these covariates. It is
because the inclusion of self-reported illness
could lead us to a selection bias because the
probability for people who are sick and actively
looking for Jamkesmas is relatively high. This is
also related that rich people has more tendency
to report their illness rather than the poor.
This research employs the five nearest-
neighbours matching approach to match the
treated group with the control group. The
matching is based on the propensity score. Af-
ter this process, the difference between those
two groups is possible to calculate. To estimate
the average impact of a treatment for a house-
hold that get Jamkesmas in notation 𝑝𝑠𝑚, we
determine the disparity between the expected
outcome of the treatment group and the ex-
pected outcome of the non-treated group as
mentioned earlier. In mathematical notation,
this can be expressed as follow (see Sparrow
et.al 2013):
𝑝𝑠𝑚=𝐸 (𝑦𝑖𝐴=1, S=1) −𝐸 (𝑊𝑖𝑦𝑖𝐴=0, S=1) (2)
In equation (2), (𝑦𝑖𝐴=1, S=1) is the expected out-
come of household groups who receive

The Impact of Jamkesmas on Healthcare Utilization… (Novat Pugo Sambodo) 121
Jamkesmas (A=1) and having a common support
(S=1) as conditional requirement. Then, E
(𝑊𝑖𝑦𝑖𝐴=0, =1) shows the potential outcome of
„artificial‟ control groups based on the propen-
sity score that do not have Jamkesmas (A=0) and
have common support (S=1). We denote the
weight estimated balancing score.
RESULT AND DISCUSSION
Jamkesmas Coverage
Table 3 shows the experiment result of
Jamkesmas coverage that has been classified into
rural and urban groups, quartiles as well as
gender. It is to be noted that this table is in in-
dividual level. Even though the allocation
might not be entirely received by the targeted
groups, quartile 1 and quartile 2 still have the
highest percentage of people holding the insur-
ance, i.e. 52.61% and 43.21%, respectively. This
pattern indicates that Jamkesmas has reached the
target that is the poor and the near poor group.
However, there is an indication that Jamkesmas
is utilized by unintended groups, i.e. quartile 3
and quartile 4. This means that there is leakage
of Jamkesmas allocation in eastern region of In-
donesia. This finding is similar with a study
done by Sparrow et al. (2013) and Vidyatama
et.al (2014) in the national level case. In addi-
tion, more people in the rural area take the ben-
efit of Jamkesmas rather than the urban counter-
parts. Around 44.71% of people in the rural area
who receive Jamkesmas, while only 22.86% of
urban people who receive Jamkesmas. Another
finding is that there is no significant difference
of allocation for male or female groups. They
are equally likely to receive Jamkesmas.
Source: Author‟s calculation based on IFLS-East 2012
Figure 2. Targeting of Jamkesmas Coverage in 2012
Table 1. Utilization and Health Spending for Household with or without Jamkesmas Holder
Household with no Jamkesmas holder
Household with Jamkesmas holder
Total
Outpatient 0.163 0.176 0.168 Public 0.086 0.122 0.101 Private 0.068 0.050 0.061
Inpatient 0.044 0.035 0.040 Public 0.037 0.034 0.036 Private 0.015 0.007 0.012
Out of pocket health expenditure (%) 1.539 0.861 1.267 Catastrophic health spending (more than 15% of total expenditure) (%)
0.020 0.007 0.015
Source: Author‟s estimation based on IFLS-East 2012
122 Jurnal Ekonomi & Studi Pembangunan Vol. 19, No. 2, Oktober 2018: 116-133
Table 1 exhibits a naïve comparison be-
tween household with and without Jamkesmas
with regards to the utilization of healthcare ser-
vice, out of pocket expenditure and catastrophic
health incidence. This table is based on the
household level data. Jamkesmas’s holder has a
slightly higher average of visitation than house-
hold with no Jamkesmas. The value of 0.176
means that 17.6% of household with Jamkesmas
is reported to access modern healthcare (either
public or private) in the past 4 weeks. The dif-
ference gets bigger in public healthcare pro-
vider, which is 0.122 for Jamkesmas holder and
only 0.086 for non- Jamkesmas household. This
pattern differs from the case of outpatient pri-
vate healthcare; the average number of people
go to private healthcare provider is larger for
non- Jamkesmas household. In terms of spend-
ing, out of pocket health expenditure for non-
Jamkesmas household is relatively higher, and
that is almost double. Similarly, catastrophic
health incidence spending is also higher for
non- Jamkesmas household, though the value is
very small. In general, it can be inferred that
with this naïve analysis the utilization of
healthcare is higher for the Jamkesmas holder
and they pay less health spending.
In Propensity Score Matching analysis,
there are two properties that must be satisfied.
First, there should be enough common support
in balancing the treated and the untreated
group. Second, the balancing properties are sat-
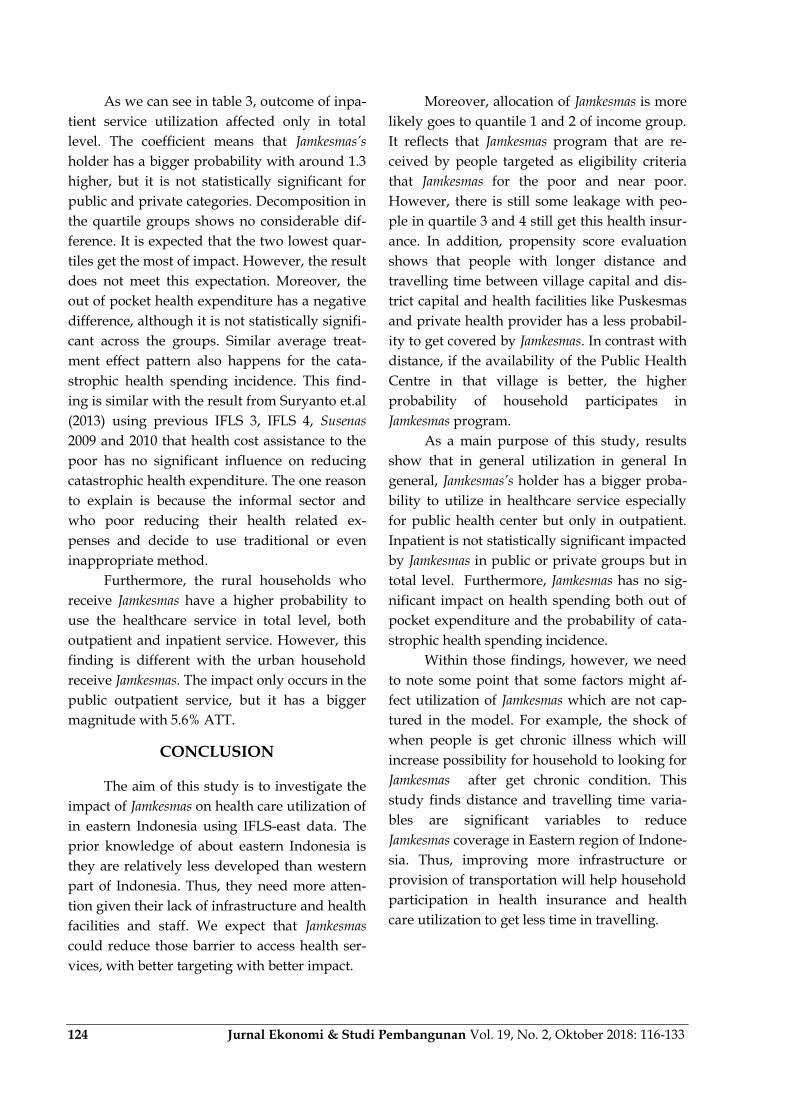
isfied. Estimation on the propensity score
shown in the table 6 on the appendix consists of
54 propensity score estimated for each variable.
Using Logit estimation, the probability of
household getting Jamkesmas coverage is
calculated.
Some variables show a positive coeffi-
cient, which means that it has higher probabil-
ity to receive Jamkesmas. For example, Uncondi-
tional Cash Transfer (BBM BLT) is introduced
as the compensation of subsidy cut on fuel; this
might be the same eligibility requirement be-
tween Jamkesmas and BLT. Other variables that
also indicate a positive coefficient are the size of
household, the accessibility to clean water, the
accessibility to piped water, the private clinic‟s
accessibility to water, and the residency of
household in rural area Unexpected positive
sign appears from group that has far proximity
with hospital. This means that the longer travel
time might positively correlates with the proba-
bility to get Jamkesmas. There are also positive
sign variables, although they are not statisti-
cally significant, that are interesting to note.
There are private clinics that provide health
check-up examination services. Many villages
have public transport facilities, and their main
road is made from asphalt. We expect that im-
proving availability and infrastructure might
broaden the allocation of Jamkesmas.
In contrast, there are variables that can
significantly reduce the probability of Jamkesmas
coverage. Variables, like Askes, Jamsostek and
company insurance, have a negative sign and
they are significant. This shows that households
having other kind of insurance are less likely to
receive Jamkesmas. Moreover, variables related
to household assets, such asthe size of house
(m2) and the vehicle ownership also reduce the
probability of Jamkesmas coverage. This is desir-
able because the richer households should have
less probability to be covered by Jamkesmas.
Interestingly, if one of the household members
working in the government office, their propen-
sity score is significantly lower. This could be
because they are automatically covered by Ask-
es. Moreover, the variable of the distance of vil-
lage capital to district capital in kilometres has a
negative value. This result is expected. Other
distance and travel time related variables also
have a negative sign, but not significant.
The availability of private clinics is deter-
mined by many variables. It is predicted that
these variables have a positive sign. The accessi-
bility of clean water is positive and significant.
However, there is a variable that has a negative
sign, i.e. the availability of dental service in pri-
vate clinic.
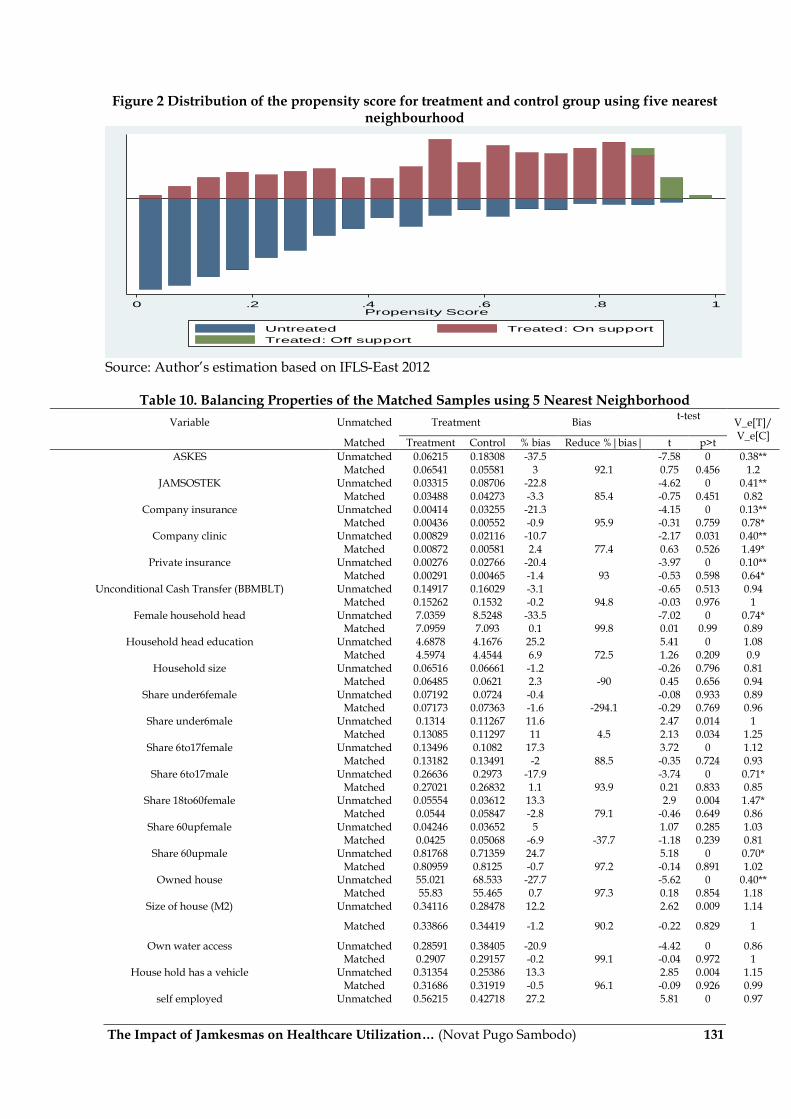
In the first property of balancing common
support, PSM analysis does not obtain lack of
The Impact of Jamkesmas on Healthcare Utilization… (Novat Pugo Sambodo) 123
common support. Table 9 in the appendices re-
veals range of common support based on the
number of observation whether it is off support
or on support. In this table there are 36 out of
1953 are off support. It means 36 observation of
treated group does not have match comparison
group and dropped as a consequences.
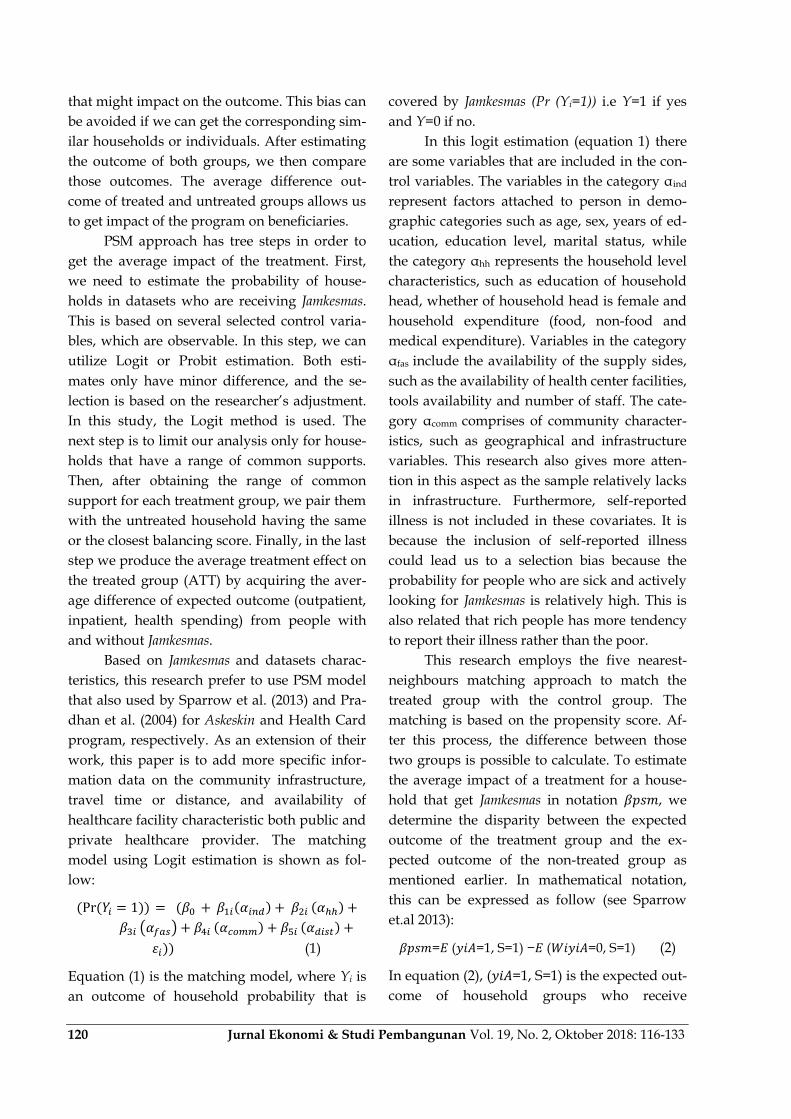
Meanwhile in the Figure 2 Distribution of the
propensity score for treatment and control
group, it shows the overlap pattern and also
present how each group of treated are com-
pared with some group of control (untreated).
Furthermore in this matching step, 5 Nearest
Neighborhood matching technique is em-
ployed.
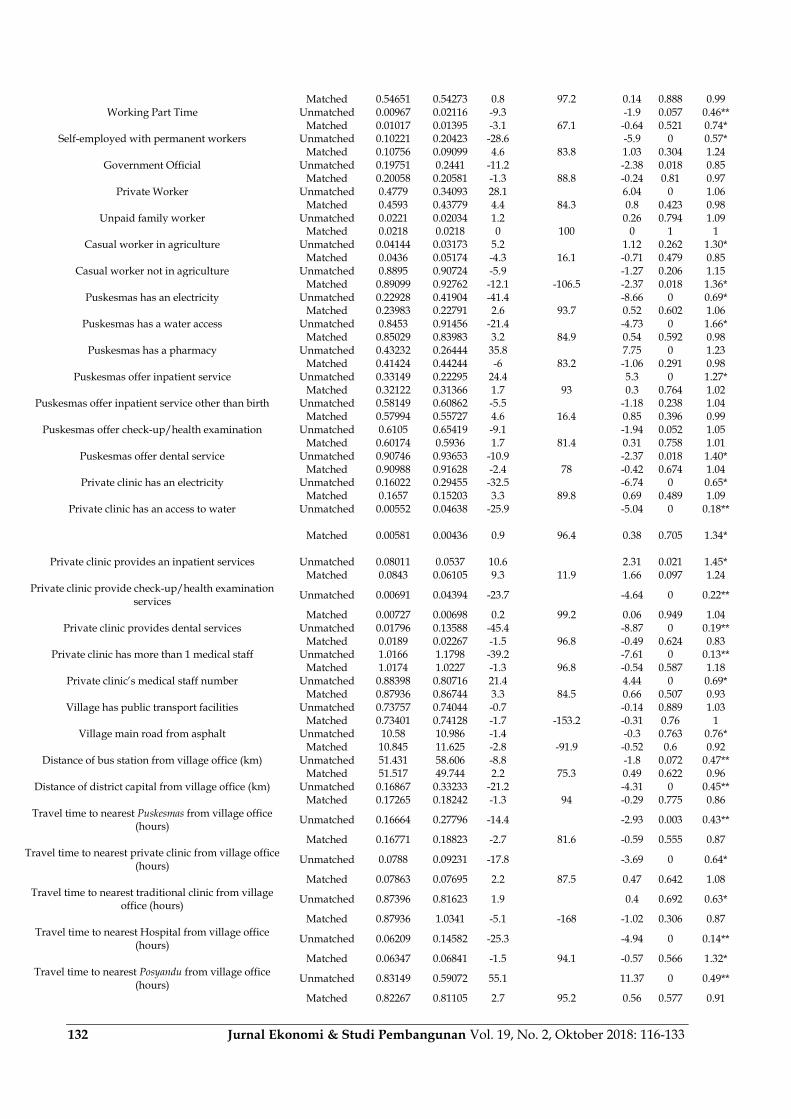
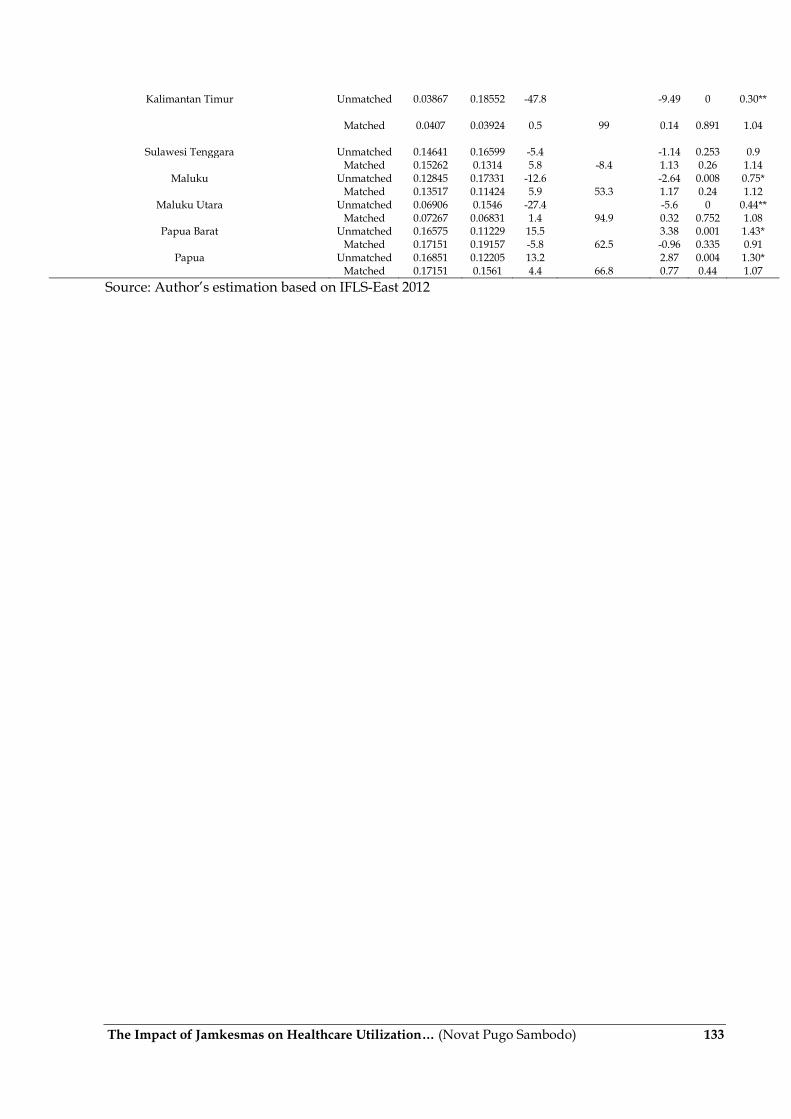
In the balancing properties in table 10 in
the Appendices, we can see that there are some
variables do not satisfy balancing property. It
means some of the differences between treated
and control groups are large in those variables
indicated by t-test show significant result. The
author try to make some changes in the covari-
ates by make some interaction variable but the
significant feature in the t-test are unchanged.
As a consequence, we need to get the new set of
covariates that satisfied balancing properties.
Due to the time constraint, author will limit the
analysis here and will update with the newest
balanced set of controls.
Impact of Jamkesmas on Healthcare Utiliza-
tion and Healthcare Expenditure
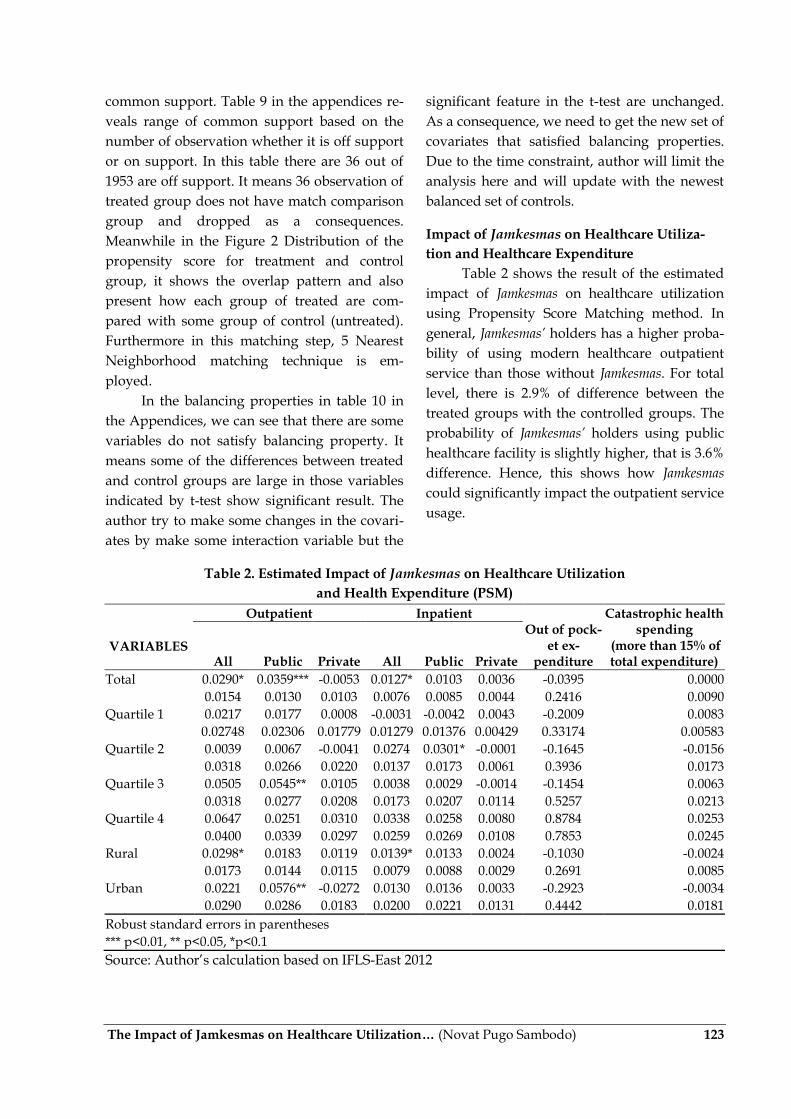
Table 2 shows the result of the estimated
impact of Jamkesmas on healthcare utilization
using Propensity Score Matching method. In
general, Jamkesmas’ holders has a higher proba-
bility of using modern healthcare outpatient
service than those without Jamkesmas. For total
level, there is 2.9% of difference between the
treated groups with the controlled groups. The
probability of Jamkesmas’ holders using public
healthcare facility is slightly higher, that is 3.6%
difference. Hence, this shows how Jamkesmas
could significantly impact the outpatient service
usage.
Table 2. Estimated Impact of Jamkesmas on Healthcare Utilization
and Health Expenditure (PSM)
Outpatient Inpatient
Out of pock-et ex-
penditure
Catastrophic health spending
(more than 15% of total expenditure)
VARIABLES All Public Private All Public Private
Total 0.0290* 0.0359*** -0.0053 0.0127* 0.0103 0.0036 -0.0395 0.0000
0.0154 0.0130 0.0103 0.0076 0.0085 0.0044 0.2416 0.0090
Quartile 1 0.0217 0.0177 0.0008 -0.0031 -0.0042 0.0043 -0.2009 0.0083
0.02748 0.02306 0.01779 0.01279 0.01376 0.00429 0.33174 0.00583
Quartile 2 0.0039 0.0067 -0.0041 0.0274 0.0301* -0.0001 -0.1645 -0.0156
0.0318 0.0266 0.0220 0.0137 0.0173 0.0061 0.3936 0.0173
Quartile 3 0.0505 0.0545** 0.0105 0.0038 0.0029 -0.0014 -0.1454 0.0063
0.0318 0.0277 0.0208 0.0173 0.0207 0.0114 0.5257 0.0213
Quartile 4 0.0647 0.0251 0.0310 0.0338 0.0258 0.0080 0.8784 0.0253
0.0400 0.0339 0.0297 0.0259 0.0269 0.0108 0.7853 0.0245
Rural 0.0298* 0.0183 0.0119 0.0139* 0.0133 0.0024 -0.1030 -0.0024
0.0173 0.0144 0.0115 0.0079 0.0088 0.0029 0.2691 0.0085
Urban 0.0221 0.0576** -0.0272 0.0130 0.0136 0.0033 -0.2923 -0.0034
0.0290 0.0286 0.0183 0.0200 0.0221 0.0131 0.4442 0.0181
Robust standard errors in parentheses
*** p<0.01, ** p<0.05, *p<0.1
Source: Author‟s calculation based on IFLS-East 2012
124 Jurnal Ekonomi & Studi Pembangunan Vol. 19, No. 2, Oktober 2018: 116-133
As we can see in table 3, outcome of inpa-
tient service utilization affected only in total
level. The coefficient means that Jamkesmas’s
holder has a bigger probability with around 1.3
higher, but it is not statistically significant for
public and private categories. Decomposition in
the quartile groups shows no considerable dif-
ference. It is expected that the two lowest quar-
tiles get the most of impact. However, the result
does not meet this expectation. Moreover, the
out of pocket health expenditure has a negative
difference, although it is not statistically signifi-
cant across the groups. Similar average treat-
ment effect pattern also happens for the cata-
strophic health spending incidence. This find-
ing is similar with the result from Suryanto et.al
(2013) using previous IFLS 3, IFLS 4, Susenas
2009 and 2010 that health cost assistance to the
poor has no significant influence on reducing
catastrophic health expenditure. The one reason
to explain is because the informal sector and
who poor reducing their health related ex-
penses and decide to use traditional or even
inappropriate method.
Furthermore, the rural households who
receive Jamkesmas have a higher probability to
use the healthcare service in total level, both
outpatient and inpatient service. However, this
finding is different with the urban household
receive Jamkesmas. The impact only occurs in the
public outpatient service, but it has a bigger
magnitude with 5.6% ATT.
CONCLUSION
The aim of this study is to investigate the
impact of Jamkesmas on health care utilization of
in eastern Indonesia using IFLS-east data. The
prior knowledge of about eastern Indonesia is
they are relatively less developed than western
part of Indonesia. Thus, they need more atten-
tion given their lack of infrastructure and health
facilities and staff. We expect that Jamkesmas
could reduce those barrier to access health ser-
vices, with better targeting with better impact.
Moreover, allocation of Jamkesmas is more
likely goes to quantile 1 and 2 of income group.
It reflects that Jamkesmas program that are re-
ceived by people targeted as eligibility criteria
that Jamkesmas for the poor and near poor.
However, there is still some leakage with peo-
ple in quartile 3 and 4 still get this health insur-
ance. In addition, propensity score evaluation
shows that people with longer distance and
travelling time between village capital and dis-
trict capital and health facilities like Puskesmas
and private health provider has a less probabil-
ity to get covered by Jamkesmas. In contrast with
distance, if the availability of the Public Health
Centre in that village is better, the higher
probability of household participates in
Jamkesmas program.
As a main purpose of this study, results
show that in general utilization in general In
general, Jamkesmas’s holder has a bigger proba-
bility to utilize in healthcare service especially
for public health center but only in outpatient.
Inpatient is not statistically significant impacted
by Jamkesmas in public or private groups but in
total level. Furthermore, Jamkesmas has no sig-
nificant impact on health spending both out of
pocket expenditure and the probability of cata-
strophic health spending incidence.
Within those findings, however, we need
to note some point that some factors might af-
fect utilization of Jamkesmas which are not cap-
tured in the model. For example, the shock of
when people is get chronic illness which will
increase possibility for household to looking for
Jamkesmas after get chronic condition. This
study finds distance and travelling time varia-
bles are significant variables to reduce
Jamkesmas coverage in Eastern region of Indone-
sia. Thus, improving more infrastructure or
provision of transportation will help household
participation in health insurance and health
care utilization to get less time in travelling.

The Impact of Jamkesmas on Healthcare Utilization… (Novat Pugo Sambodo) 125
REFERENCES
Aji, B., De Allegri, M.D., Souares, A., and Sauer-
born, R. (2013). The Impact of Health In-
surance Programs on Out-of-Pocket Ex-
penditures in Indonesia: An Increase or
a Decrease?. International Journal of Envi-
ronmental Research and Public Health,
10(7), 2995-3013.
Erlyana, E., Damrongplasit, K.K., and Melnick,
G. (2011). Expandinghealth Insurance
To Increase Health Care Utilization:
Will It Have Different Effects In Rural
Vs Urban Areas?. Health Policy, 100,
273–81.
Government Regulation Number 40 Year 2004
Concerning National Social Security
System (Republic of Indonesia).
Government Regulation Number 24 Year 2011
Concerning National Social Security
Agency (Republic of Indonesia).
Harimurti, P., Pambudi, E., Pigazzini, A and
Tandon, A. (2013). The nuts and bolts of
Jamkesmas, Indonesia‟s government-fi-
nanced health coverage program for the
poor and near-poor, The World Bank,
UNICO Studies Series 8, Washington.
Viewed 4 June 2015, <http://www-
wds.worldbank.org/external/default/
WDSContentServer/WDSP/
IB/2013/03/25/000333037_20130325130
647/Rendered/PDF/749960REVISED00
00PUBLIC00Indonesia1.pdf>.
Hidayat, B., and Pokhrel, S. (2010). The Selec-
tion of an Appropriate Count Data
Model for Modelling Health Insurance
and Health Care Demand: Case of In-
donesia, International Journal of Environ-
mental Research and Public Health, 7(1), 9-
27.
Satriawan, E., Priebe, J., Prima, R.A., and How-
ell, F. (2014). An introduction into the
IFLS-East 2012: Sampling, question-
naires, maps and socio-economic back-
ground characteristics, TNP2K (Tim
Nasional Percepatan Penanggulangan
Kemiskinan). Viewed 16 March 2015,
<http://www.tnp2k.go.id/images/ up-
loads/downloads/WP%2011a%20Intro
duction%20to%20IFLS%20East%202012.
pdf>.
Sikoki, B., Witoelar, F., Strauss J., Meijer, E., and
Suriastini N.W. (2013). Indonesia Family
Life Survey East 2012: User's guide and
field report. Yogyakarta: Survey ME-
TER.
Somanathan, A. (2008). The impact of price sub-
sidies on child health care use: evalua-
tion of the Indonesian healthcard.
Viewed 20 March 2015, <https://
openknowledge.worldbank.org/bitstrea
m/handle/10986/6682/wps4622.pdf?se
quence=1>.
Sparrow, R., Suryahadi A., and Widyanti, W.
Social Health Insurance for the Poor:
Targeting and Impact of Indonesia‟s
Askeskin Programme. Social Science &
Medicine, 96, 264–71.
Suryanto, B.A., Mukti, A.G., Kusnanto, H., and
Satriawan, E. (2015). The Role of Health
Insurance, Borrowing and Aids to Pay
for Health Care on Reducing Cata-
strophic Health Expenditure in Indone-
sia. Viewed 4 June 2015,
http://papers.ssrn.com/sol3/papers.cf
m?abstract_id=2586648.
Vidyatama, Y., Miranti, R., and Resosudarmo,
B.P. (2014). The role ofhealth insurance
membership in health service utilization
in Indonesia. Bulletin of Indonesian
Economic Studies 50(3), 393-413.
World Bank. (2012), Jamkesmas health service
fee waiver social assistance program
and public expenditure review, World
Bank Background Paper, viewed 4 June
2015,http://www.wds.worldbank.org
/external/default/WDSContentServer/
WDSP/IB/2012/03/06/000356161_2012
0306010803/Rendered/PDF/673120WP
00PUBL0Background0Paper0040.pdf.

126 Jurnal Ekonomi & Studi Pembangunan Vol. 19, No. 2, Oktober 2018: 116-133
APPENDICES
Table 3. Utilization of Outpatient and Inpatient at Public and Private Health Facility, IFLS East 2012
Outpatient Inpatient
All Public Private All Public Private
Quartile 1 (poorest) 0.137 0.090 0.041 0.023 0.023 0.003 Quartile 2 0.170 0.108 0.061 0.038 0.038 0.006 Quartile 3 0.180 0.106 0.056 0.042 0.034 0.014 Quartile 4 (richest) 0.191 0.089 0.098 0.068 0.052 0.029 Urban 0.170 0.106 0.055 0.062 0.049 0.022 Rural 0.165 0.094 0.064 0.025 0.025 0.004 Male 0.139 0.084 0.047 0.035 0.029 0.010 Female 0.194 0.113 0.074 0.046 0.041 0.013 Non-Papua Island 0.167 0.094 0.063 0.036 0.03 0.012 Papua Island 0.166 0.114 0.052 0.055 0.053 0.011
Total 0.167 0.099 0.061 0.040 0.035 0.012
Source: Author‟s estimation based on IFLS-East 2012
Table 4. Distribution of Out-of-Pocket Health Expenditure, Non-Food Spending Share and Inci-dence of Catastrophic Spending Occurence (Percentages)
Out of pocket expenditure
Share of non-food spending
Catastrophic health spend-ing (more than 15% of
total expenditure)
Quartile 1 (poorest) 0.807 33.171 0.005 Quartile 2 1.208 38.100 0.015 Quartile 3 1.350 40.913 0.016 Quartile 4 (richest) 1.945 46.421 0.026 Urban 1.837 47.403 0.024 Rural 0.844 32.848 0.008 Male 1.297 38.803 0.016 Female 1.227 39.114 0.013 Non-Papua Island 1.242 39.844 0.012 Papua Island 1.328 35.927 0.023
Total 1.261 38.962 0.015
Source: Author‟s estimation based on IFLS-East 2012
Table 5. Health Expenditure Regression, 2012, Ordinary Least Square
VARIABLES Coefficient Standard Error
JAMKESMAS -339.617 (3,324.383) ASKES 9,486.302 (6,865.709) JAMSOSTEK -10,329.332 (8,109.217) Company insurance 799.733 (8,378.626) Company clinic -368.546 (7,594.197) Private Insurance 17,963.538 (18,190.075) Unconditional Cash Transfer (BBMBLT) -5,251.233* (2,147.330) Female household head -9,737.538+ (5,203.506) Household head education 24.536 (691.828) Household size -4,677.177** (1,367.664) Share under 6 female -18,317.522 (16,172.800) Share under 6 male -6,671.307 (13,702.742) Share 6 to 17male -10,869.672 (11,613.777) Share 18 to 60 female 6,338.932 (18,026.549) Share 60 up female -16,677.414 (11,078.186) Share 60 up male -5,552.574 (15,899.435) Owned House -5,484.773 (5,955.024) House size (m2) 90.276+ (49.385) Own water access -842.489 (3,132.538)
The Impact of Jamkesmas on Healthcare Utilization… (Novat Pugo Sambodo) 127
Own vehicle 1,593.262 (6,333.295) Own piped water -9,784.529 (6,973.282) Self employed 9,808.427* (4,991.176) Self Employed with permanent workers 4,161.914 (16,331.479) Self Employed with permanent workers 6,710.701 (6,209.129) Working part-time 5,266.362 (5,049.198) Government official -915.305 (6,811.227) Casual worker in agriculture -3,825.328 (4,564.503) Casual worker non in agriculture -7,978.930 (7,309.612) Puskesmas has a water access 6,487.737 (5,506.652) Puskesmas offer check-up/health examination 6,404.672 (4,008.677) Puskesmas offer inpatient service -3,947.382 (4,974.984) Puskesmas offer dental service -3,719.917 (6,357.939) Puskesmas has a pharmacy 5,957.999+ (3,070.323) Private clinic has an electricity 7,731.782* (3,715.223) Private clinic has an access to water -756.747 (6,328.137) Private clinic provides an inpatient services -10,592.019 (17,199.239) Private clinic provides dental services 17,211.214+ (10,207.628) Private clinic has more than 1 medical staff 19,429.780 (19,735.290) Private clinic‟s medical staff number 6,933.733 (13,742.041) Private clinic provide check-up/health examination services -14,558.457* (6,050.481) Village has public transport facilities 4,328.199 (3,890.562) Village main road from asphalt -1,000.469 (2,721.279) Distance of district capital from village office (km) 30.379 (33.255) Distance of bus station from village office (km) 47.645 (77.010) Travel time to nearest PUSKESMAS from village office (hours) -20,912.816** (6,869.707) Travel time to nearest private clinic from village office (hours) 14,211.392** (5,373.004) Travel time to nearest traditional clinic from village office (hours) -18,367.031 (29,020.811) Travel time to nearest hospital from village office (hours) 917.153 (646.347) rural -14,109.628+ (7,360.844) Constant 15,267.004 (14,286.709)
Observations 2,009 R-squared 0.122
Robust standard errors in parentheses ** p<0.01, * p<0.05, + p<0.1
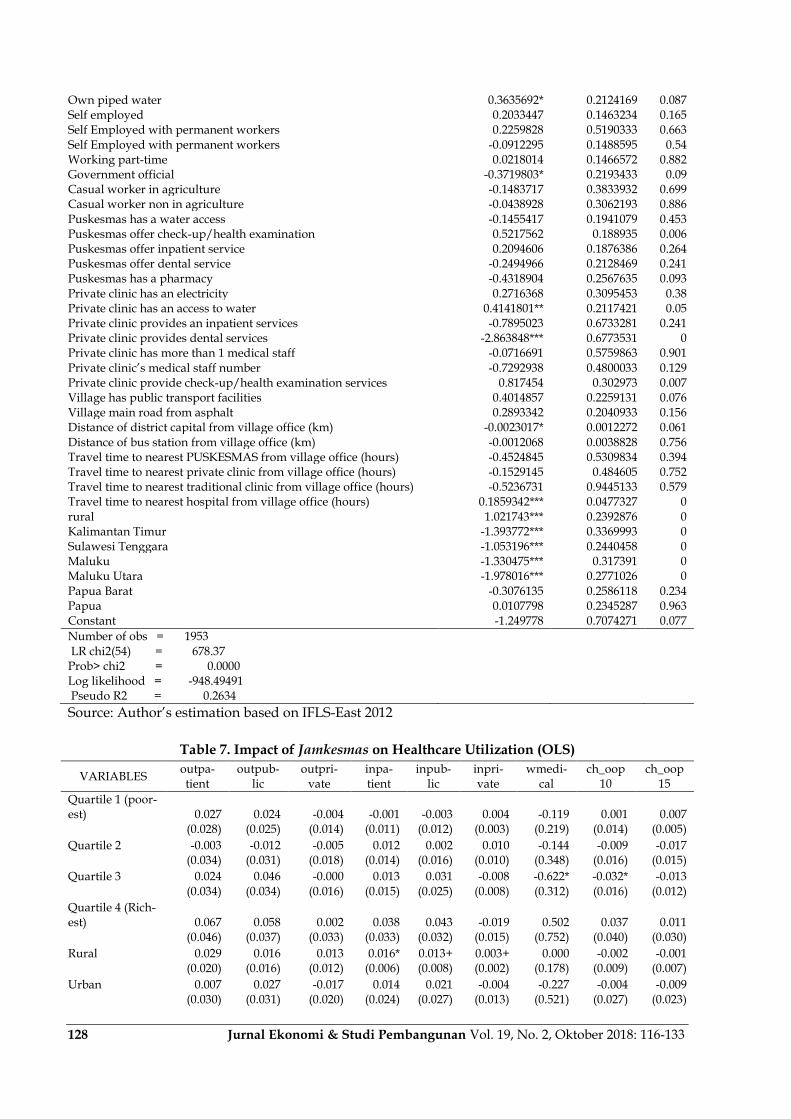
Table 6. Propensity Score Function, Probability of Jamkesmas Coverage (Logit Estimates)
VARIABLES Coefficient Standard Error P>|z|
ASKES -0.8039761*** 0.250713 0.001 JAMSOSTEK -0.6501821** 0.2969173 0.029 Company insurance -1.140431* 0.6489512 0.079 Company clinic -0.1234484 0.5685474 0.828 Private Insurance -1.020746 0.7798305 0.191 Unconditional Cash Transfer (BBMBLT) 0.9906677*** 0.1352175 0 Female household head -0.0704081 0.1917069 0.713 Household head education -0.0012435 0.0158683 0.938 Household size 0.2013327*** 0.0348588 0 Share under 6 female -0.7868103 0.5262906 0.135 Share under 6 male -0.2807972 0.5155342 0.586 Share 6 to 17male 0.6789076 0.418534 0.105 Share 18 to 60 female 0.1915376 0.3982037 0.631 Share 60 up female 1.020724 0.4501642 0.023 Share 60 up male -0.3541693 0.5264139 0.501 Owned House 0.1857353 0.1565389 0.235 House size (m2) -0.003937*** 0.0015075 0.009 Own water access 0.256806** 0.1448193 0.076 Own vehicle -0.0985058** 0.1461105 0.5
128 Jurnal Ekonomi & Studi Pembangunan Vol. 19, No. 2, Oktober 2018: 116-133
Own piped water 0.3635692* 0.2124169 0.087 Self employed 0.2033447 0.1463234 0.165 Self Employed with permanent workers 0.2259828 0.5190333 0.663 Self Employed with permanent workers -0.0912295 0.1488595 0.54 Working part-time 0.0218014 0.1466572 0.882 Government official -0.3719803* 0.2193433 0.09 Casual worker in agriculture -0.1483717 0.3833932 0.699 Casual worker non in agriculture -0.0438928 0.3062193 0.886 Puskesmas has a water access -0.1455417 0.1941079 0.453 Puskesmas offer check-up/health examination 0.5217562 0.188935 0.006 Puskesmas offer inpatient service 0.2094606 0.1876386 0.264 Puskesmas offer dental service -0.2494966 0.2128469 0.241 Puskesmas has a pharmacy -0.4318904 0.2567635 0.093 Private clinic has an electricity 0.2716368 0.3095453 0.38 Private clinic has an access to water 0.4141801** 0.2117421 0.05 Private clinic provides an inpatient services -0.7895023 0.6733281 0.241 Private clinic provides dental services -2.863848*** 0.6773531 0 Private clinic has more than 1 medical staff -0.0716691 0.5759863 0.901 Private clinic‟s medical staff number -0.7292938 0.4800033 0.129 Private clinic provide check-up/health examination services 0.817454 0.302973 0.007 Village has public transport facilities 0.4014857 0.2259131 0.076 Village main road from asphalt 0.2893342 0.2040933 0.156 Distance of district capital from village office (km) -0.0023017* 0.0012272 0.061 Distance of bus station from village office (km) -0.0012068 0.0038828 0.756 Travel time to nearest PUSKESMAS from village office (hours) -0.4524845 0.5309834 0.394 Travel time to nearest private clinic from village office (hours) -0.1529145 0.484605 0.752 Travel time to nearest traditional clinic from village office (hours) -0.5236731 0.9445133 0.579 Travel time to nearest hospital from village office (hours) 0.1859342*** 0.0477327 0 rural 1.021743*** 0.2392876 0 Kalimantan Timur -1.393772*** 0.3369993 0 Sulawesi Tenggara -1.053196*** 0.2440458 0 Maluku -1.330475*** 0.317391 0 Maluku Utara -1.978016*** 0.2771026 0 Papua Barat -0.3076135 0.2586118 0.234 Papua 0.0107798 0.2345287 0.963 Constant -1.249778 0.7074271 0.077
Number of obs = 1953 LR chi2(54) = 678.37 Prob> chi2 = 0.0000 Log likelihood = -948.49491 Pseudo R2 = 0.2634
Source: Author‟s estimation based on IFLS-East 2012
Table 7. Impact of Jamkesmas on Healthcare Utilization (OLS)
VARIABLES outpa-tient
outpub-lic
outpri-vate
inpa-tient
inpub-lic
inpri-vate
wmedi-cal
ch_oop10
ch_oop15
Quartile 1 (poor-est) 0.027 0.024 -0.004 -0.001 -0.003 0.004 -0.119 0.001 0.007
(0.028) (0.025) (0.014) (0.011) (0.012) (0.003) (0.219) (0.014) (0.005)
Quartile 2 -0.003 -0.012 -0.005 0.012 0.002 0.010 -0.144 -0.009 -0.017
(0.034) (0.031) (0.018) (0.014) (0.016) (0.010) (0.348) (0.016) (0.015)
Quartile 3 0.024 0.046 -0.000 0.013 0.031 -0.008 -0.622* -0.032* -0.013
(0.034) (0.034) (0.016) (0.015) (0.025) (0.008) (0.312) (0.016) (0.012)
Quartile 4 (Rich-est) 0.067 0.058 0.002 0.038 0.043 -0.019 0.502 0.037 0.011
(0.046) (0.037) (0.033) (0.033) (0.032) (0.015) (0.752) (0.040) (0.030)
Rural 0.029 0.016 0.013 0.016* 0.013+ 0.003+ 0.000 -0.002 -0.001
(0.020) (0.016) (0.012) (0.006) (0.008) (0.002) (0.178) (0.009) (0.007)
Urban 0.007 0.027 -0.017 0.014 0.021 -0.004 -0.227 -0.004 -0.009
(0.030) (0.031) (0.020) (0.024) (0.027) (0.013) (0.521) (0.027) (0.023)

The Impact of Jamkesmas on Healthcare Utilization… (Novat Pugo Sambodo) 129
Papua 0.071* 0.059* 0.023 0.019 0.046+ -0.011 -0.218 -0.003 -0.023
(0.034) (0.028) (0.025) (0.021) (0.028) (0.008) (0.541) (0.030) (0.022)
Non Papua 0.018 0.009 0.002 0.010 0.003 0.004 -0.057 -0.000 0.000 (0.019) (0.018) (0.011) (0.010) (0.010) (0.006) (0.240) (0.013) (0.010) Total 0.028+ 0.028+ -0.004 0.015+ 0.015 0.001 -0.234 -0.013 -0.010 (0.017) (0.015) (0.010) (0.008) (0.010) (0.004) (0.200) (0.011) (0.008)
Source: Author‟s estimation based on IFLS-East 2012
Table 8. Descriptive Statistics
Variables Observation
mean
Standar Devia-tion min max
Outpatient total 2,411 0.167 0.243 0 1
Outpatient public 2,401 0.098
7 0.200 0 1
Outpatient private 2,401 0.062
8 0.165 0 1
Inpatient total 2,411 0.038
6 0.119 0 1
Inpatient public 2,357 0.035
5 0.125 0 1
Inpatient private 2,357 0.011
0 0.0743 0 1
Out of pocket health expenditure Share 2,411 1.291 3.550 0 73.6
7
Catastrophic health spending 10% 2,411 0.028
2 0.166 0 1
Catastrophic health spending 15% 2,411 0.013
7 0.116 0 1 illness 2,411 0.725 0.296 0 1 JAMKESMAS 2,411 0.361 0.480 0 1 ASKES 2,411 0.129 0.335 0 1
JAMSOSTEK 2,411 0.056
8 0.232 0 1
Company insurance 2,411 0.018
7 0.135 0 1
Private insurance 2,411 0.014
9 0.121 0 1
Company clinic 2,411 0.013
7 0.116 0 1 Household head female 2,411 0.161 0.367 0 1 HH head education 2,411 7.737 4.569 0 18 Household size 2,411 4.288 2.057 1 16
Share under 6 female 2,411 0.066
8 0.119 0 0.66
7
Share under 6 male 2,411 0.070
5 0.122 0 0.60
0 Share 6 to 17 female 2,411 0.117 0.161 0 1 Share 6 to 17 male 2,411 0.119 0.155 0 1 Share 18 to 60 female 2,411 0.290 0.186 0 1 Share 18 to 60male 2,411 0.261 0.205 0 1
Share 60 up female 2,411 0.046
5 0.151 0 1
Share 60 up male 2,411 0.039
2 0.119 0 1 Household own BBM BLT card 2,400 0.229 0.420 0 1 Owns house 2,411 0.763 0.425 0 1 House size (m2) 2,410 62.25 49.92 4 800 Owns water access 2,411 0.307 0.461 0 1

130 Jurnal Ekonomi & Studi Pembangunan Vol. 19, No. 2, Oktober 2018: 116-133
Household has a vehicle 2,411 0.316 0.465 0 1 self employed 2,411 0.287 0.453 0 1 Working Part Time 2,411 0.484 0.500 0 1
Self-employed with permanent workers 2,411 0.015
3 0.123 0 1 Government Official 2,411 0.155 0.362 0 1 Private Worker 2,411 0.202 0.402 0 1 Unpaid family worker 2,411 0.388 0.487 0 1
Casual worker in agriculture 2,411 0.020
7 0.143 0 1
Casual worker not in agriculture 2,411 0.037
7 0.191 0 1 Puskesmas has an electricity 2,411 0.847 0.360 0 1 Puskesmas has a water access 2,411 0.320 0.467 0 1 Puskesmas has a pharmacy 2,411 0.895 0.306 0 1 Puskesmas offer inpatient service 2,384 0.305 0.461 0 1 Puskesmas offer inpatient service other than birth 2,384 0.263 0.441 0 1 Puskesmas offer check-up/health examination 2,384 0.570 0.495 0 1 Puskesmas offer dental service 2,384 0.613 0.487 0 1 Private clinic has an electricity 2,411 0.858 0.349 0 1 Private clinic has an access to water 2,411 0.226 0.419 0 1
Private clinic provides an inpatient services 2,276 0.027
7 0.164 0 1 Private clinic provide check-up/health examination services 2,276
0.0558 0.230 0 1
Private clinic provides dental services 2,276 0.026
4 0.160 0 1
Private clinic has more than 1 medical staff 2,411 0.078
8 0.269 0 1 Private clinic's number of medical staff 2,411 1.102 0.432 1 4 Village has public transport facilities 2,411 0.809 0.393 0 1 Village main road from asphalt 2,411 0.687 0.464 0 1 Distance of bus station from village office (km) 2,323 9.728 26.69 0.01000 200 Distance of district capital from village office (km) 2,213 56.03 83.42 0.500 450 Travel time to nearest PUSKESMAS from village office (hours) 2,411 0.450 1.898 0 16 Travel time to nearest private clinic from village of-fice (hours) 2,411 0.254 0.801 0 6 Travel time to nearest traditional clinic from village office (hours) 2,411
0.0813 0.0752 0
0.500
Travel time to nearest Hospital from village office (hours) 2,411 0.697 2.828 0 24 Travel time to nearest POSYANDU from village of-fice (hours) 2,411 0.118 0.345 0 3 rural 2,411 0.706 0.456 0 1 HH size square 2,411 22.62 22.43 1 256 Papua 2,411 0.285 0.451 0 1
Source: Author‟s estimation based on IFLS-East 2012
Table 9. Common Support by Number of Observations using 5 Nearest Neighborhood
Treatment Assignment
Common Support
Off support On Support Total
Untreated 0 1229 1229 Treated 36 688 724
Total 36 1917 1953
The Impact of Jamkesmas on Healthcare Utilization… (Novat Pugo Sambodo) 131
Figure 2 Distribution of the propensity score for treatment and control group using five nearest neighbourhood
Source: Author‟s estimation based on IFLS-East 2012
Table 10. Balancing Properties of the Matched Samples using 5 Nearest Neighborhood
Variable Unmatched Treatment Bias t-test
V_e[T]/ V_e[C]
Matched Treatment Control % bias Reduce %|bias| t p>t
ASKES Unmatched 0.06215 0.18308 -37.5
-7.58 0 0.38**
Matched 0.06541 0.05581 3 92.1 0.75 0.456 1.2
JAMSOSTEK Unmatched 0.03315 0.08706 -22.8
-4.62 0 0.41**
Matched 0.03488 0.04273 -3.3 85.4 -0.75 0.451 0.82
Company insurance Unmatched 0.00414 0.03255 -21.3
-4.15 0 0.13**
Matched 0.00436 0.00552 -0.9 95.9 -0.31 0.759 0.78*
Company clinic Unmatched 0.00829 0.02116 -10.7
-2.17 0.031 0.40**
Matched 0.00872 0.00581 2.4 77.4 0.63 0.526 1.49*
Private insurance Unmatched 0.00276 0.02766 -20.4
-3.97 0 0.10**
Matched 0.00291 0.00465 -1.4 93 -0.53 0.598 0.64*
Unconditional Cash Transfer (BBMBLT) Unmatched 0.14917 0.16029 -3.1
-0.65 0.513 0.94
Matched 0.15262 0.1532 -0.2 94.8 -0.03 0.976 1
Female household head Unmatched 7.0359 8.5248 -33.5
-7.02 0 0.74*
Matched 7.0959 7.093 0.1 99.8 0.01 0.99 0.89
Household head education Unmatched 4.6878 4.1676 25.2
5.41 0 1.08
Matched 4.5974 4.4544 6.9 72.5 1.26 0.209 0.9
Household size Unmatched 0.06516 0.06661 -1.2
-0.26 0.796 0.81
Matched 0.06485 0.0621 2.3 -90 0.45 0.656 0.94
Share under6female Unmatched 0.07192 0.0724 -0.4
-0.08 0.933 0.89
Matched 0.07173 0.07363 -1.6 -294.1 -0.29 0.769 0.96
Share under6male Unmatched 0.1314 0.11267 11.6
2.47 0.014 1
Matched 0.13085 0.11297 11 4.5 2.13 0.034 1.25
Share 6to17female Unmatched 0.13496 0.1082 17.3
3.72 0 1.12
Matched 0.13182 0.13491 -2 88.5 -0.35 0.724 0.93
Share 6to17male Unmatched 0.26636 0.2973 -17.9
-3.74 0 0.71*
Matched 0.27021 0.26832 1.1 93.9 0.21 0.833 0.85
Share 18to60female Unmatched 0.05554 0.03612 13.3
2.9 0.004 1.47*
Matched 0.0544 0.05847 -2.8 79.1 -0.46 0.649 0.86
Share 60upfemale Unmatched 0.04246 0.03652 5
1.07 0.285 1.03
Matched 0.0425 0.05068 -6.9 -37.7 -1.18 0.239 0.81
Share 60upmale Unmatched 0.81768 0.71359 24.7
5.18 0 0.70*
Matched 0.80959 0.8125 -0.7 97.2 -0.14 0.891 1.02
Owned house Unmatched 55.021 68.533 -27.7
-5.62 0 0.40**
Matched 55.83 55.465 0.7 97.3 0.18 0.854 1.18
Size of house (M2) Unmatched 0.34116 0.28478 12.2
2.62 0.009 1.14
Matched 0.33866 0.34419 -1.2 90.2 -0.22 0.829 1
Own water access Unmatched 0.28591 0.38405 -20.9
-4.42 0 0.86
Matched 0.2907 0.29157 -0.2 99.1 -0.04 0.972 1
House hold has a vehicle Unmatched 0.31354 0.25386 13.3
2.85 0.004 1.15
Matched 0.31686 0.31919 -0.5 96.1 -0.09 0.926 0.99
self employed Unmatched 0.56215 0.42718 27.2
5.81 0 0.97
0 .2 .4 .6 .8 1Propensity Score
Untreated Treated: On support
Treated: Off support
132 Jurnal Ekonomi & Studi Pembangunan Vol. 19, No. 2, Oktober 2018: 116-133
Matched 0.54651 0.54273 0.8 97.2 0.14 0.888 0.99
Working Part Time Unmatched 0.00967 0.02116 -9.3
-1.9 0.057 0.46**
Matched 0.01017 0.01395 -3.1 67.1 -0.64 0.521 0.74*
Self-employed with permanent workers Unmatched 0.10221 0.20423 -28.6
-5.9 0 0.57*
Matched 0.10756 0.09099 4.6 83.8 1.03 0.304 1.24
Government Official Unmatched 0.19751 0.2441 -11.2
-2.38 0.018 0.85
Matched 0.20058 0.20581 -1.3 88.8 -0.24 0.81 0.97
Private Worker Unmatched 0.4779 0.34093 28.1
6.04 0 1.06
Matched 0.4593 0.43779 4.4 84.3 0.8 0.423 0.98
Unpaid family worker Unmatched 0.0221 0.02034 1.2
0.26 0.794 1.09
Matched 0.0218 0.0218 0 100 0 1 1
Casual worker in agriculture Unmatched 0.04144 0.03173 5.2
1.12 0.262 1.30*
Matched 0.0436 0.05174 -4.3 16.1 -0.71 0.479 0.85
Casual worker not in agriculture Unmatched 0.8895 0.90724 -5.9
-1.27 0.206 1.15
Matched 0.89099 0.92762 -12.1 -106.5 -2.37 0.018 1.36*
Puskesmas has an electricity Unmatched 0.22928 0.41904 -41.4
-8.66 0 0.69*
Matched 0.23983 0.22791 2.6 93.7 0.52 0.602 1.06
Puskesmas has a water access Unmatched 0.8453 0.91456 -21.4
-4.73 0 1.66*
Matched 0.85029 0.83983 3.2 84.9 0.54 0.592 0.98
Puskesmas has a pharmacy Unmatched 0.43232 0.26444 35.8
7.75 0 1.23
Matched 0.41424 0.44244 -6 83.2 -1.06 0.291 0.98
Puskesmas offer inpatient service Unmatched 0.33149 0.22295 24.4
5.3 0 1.27*
Matched 0.32122 0.31366 1.7 93 0.3 0.764 1.02
Puskesmas offer inpatient service other than birth Unmatched 0.58149 0.60862 -5.5
-1.18 0.238 1.04
Matched 0.57994 0.55727 4.6 16.4 0.85 0.396 0.99
Puskesmas offer check-up/health examination Unmatched 0.6105 0.65419 -9.1
-1.94 0.052 1.05
Matched 0.60174 0.5936 1.7 81.4 0.31 0.758 1.01
Puskesmas offer dental service Unmatched 0.90746 0.93653 -10.9
-2.37 0.018 1.40*
Matched 0.90988 0.91628 -2.4 78 -0.42 0.674 1.04
Private clinic has an electricity Unmatched 0.16022 0.29455 -32.5
-6.74 0 0.65*
Matched 0.1657 0.15203 3.3 89.8 0.69 0.489 1.09
Private clinic has an access to water Unmatched 0.00552 0.04638 -25.9
-5.04 0 0.18**
Matched 0.00581 0.00436 0.9 96.4 0.38 0.705 1.34*
Private clinic provides an inpatient services Unmatched 0.08011 0.0537 10.6
2.31 0.021 1.45*
Matched 0.0843 0.06105 9.3 11.9 1.66 0.097 1.24
Private clinic provide check-up/health examination services
Unmatched 0.00691 0.04394 -23.7
-4.64 0 0.22**
Matched 0.00727 0.00698 0.2 99.2 0.06 0.949 1.04
Private clinic provides dental services Unmatched 0.01796 0.13588 -45.4
-8.87 0 0.19**
Matched 0.0189 0.02267 -1.5 96.8 -0.49 0.624 0.83
Private clinic has more than 1 medical staff Unmatched 1.0166 1.1798 -39.2
-7.61 0 0.13**
Matched 1.0174 1.0227 -1.3 96.8 -0.54 0.587 1.18
Private clinic‟s medical staff number Unmatched 0.88398 0.80716 21.4
4.44 0 0.69*
Matched 0.87936 0.86744 3.3 84.5 0.66 0.507 0.93
Village has public transport facilities Unmatched 0.73757 0.74044 -0.7
-0.14 0.889 1.03
Matched 0.73401 0.74128 -1.7 -153.2 -0.31 0.76 1
Village main road from asphalt Unmatched 10.58 10.986 -1.4
-0.3 0.763 0.76*
Matched 10.845 11.625 -2.8 -91.9 -0.52 0.6 0.92
Distance of bus station from village office (km) Unmatched 51.431 58.606 -8.8
-1.8 0.072 0.47**
Matched 51.517 49.744 2.2 75.3 0.49 0.622 0.96
Distance of district capital from village office (km) Unmatched 0.16867 0.33233 -21.2
-4.31 0 0.45**
Matched 0.17265 0.18242 -1.3 94 -0.29 0.775 0.86
Travel time to nearest Puskesmas from village office (hours)
Unmatched 0.16664 0.27796 -14.4
-2.93 0.003 0.43**
Matched 0.16771 0.18823 -2.7 81.6 -0.59 0.555 0.87
Travel time to nearest private clinic from village office (hours)
Unmatched 0.0788 0.09231 -17.8
-3.69 0 0.64*
Matched 0.07863 0.07695 2.2 87.5 0.47 0.642 1.08
Travel time to nearest traditional clinic from village office (hours)
Unmatched 0.87396 0.81623 1.9
0.4 0.692 0.63*
Matched 0.87936 1.0341 -5.1 -168 -1.02 0.306 0.87
Travel time to nearest Hospital from village office (hours)
Unmatched 0.06209 0.14582 -25.3
-4.94 0 0.14**
Matched 0.06347 0.06841 -1.5 94.1 -0.57 0.566 1.32*
Travel time to nearest Posyandu from village office (hours)
Unmatched 0.83149 0.59072 55.1
11.37 0 0.49**
Matched 0.82267 0.81105 2.7 95.2 0.56 0.577 0.91
The Impact of Jamkesmas on Healthcare Utilization… (Novat Pugo Sambodo) 133
Kalimantan Timur Unmatched 0.03867 0.18552 -47.8
-9.49 0 0.30**
Matched 0.0407 0.03924 0.5 99 0.14 0.891 1.04
Sulawesi Tenggara Unmatched 0.14641 0.16599 -5.4
-1.14 0.253 0.9
Matched 0.15262 0.1314 5.8 -8.4 1.13 0.26 1.14
Maluku Unmatched 0.12845 0.17331 -12.6
-2.64 0.008 0.75*
Matched 0.13517 0.11424 5.9 53.3 1.17 0.24 1.12
Maluku Utara Unmatched 0.06906 0.1546 -27.4
-5.6 0 0.44**
Matched 0.07267 0.06831 1.4 94.9 0.32 0.752 1.08
Papua Barat Unmatched 0.16575 0.11229 15.5
3.38 0.001 1.43*
Matched 0.17151 0.19157 -5.8 62.5 -0.96 0.335 0.91
Papua Unmatched 0.16851 0.12205 13.2
2.87 0.004 1.30*
Matched 0.17151 0.1561 4.4 66.8 0.77 0.44 1.07
Source: Author‟s estimation based on IFLS-East 2012