The Impact of Institutional Support in SMEs Marketing, and...
19
Open Journal of Business and Management, 2016, 4, 408-426 Published Online July 2016 in SciRes. http://www.scirp.org/journal/ojbm http://dx.doi.org/10.4236/ojbm.2016.43043 How to cite this paper: Osei, A., Shao, Y.F., Forkuoh, K.S. and Osei, M.A. (2016) The Impact of Institutional Support in SMEs Marketing, and Growth—A Case Study of Retail SMEs in Ghana. Open Journal of Business and Management, 4, 408-426. http://dx.doi.org/10.4236/ojbm.2016.43043 The Impact of Institutional Support in SMEs Marketing, and Growth—A Case Study of Retail SMEs in Ghana Abraham Osei 1 , Yunfei Shao 1 , Kwarteng Solomon Forkuoh 1* , Michael Aboagye Osei 2 1 School of Management and Economics, University of Electronic Science and Technology of China (UESTC), Chengdu, China 2 School of Teacher Education, Zhejiang Normal University, Jinhua, China Received 22 April 2016; accepted 28 June 2016; published 1 July 2016 Copyright © 2016 by authors and Scientific Research Publishing Inc. This work is licensed under the Creative Commons Attribution International License (CC BY). http://creativecommons.org/licenses/by/4.0/ Abstract Small and Medium Enterprises (SMEs) are still hailed as the panacea of economic development of many countries, since they play a fundamental part of the economic fabric in developing a crucial role in furthering growth, innovation and prosperity. In the quest to achieve growth, SMEs unfor- tunately face severe challenges including the marketing of their products, which stem from unqu- alified employees in the marketing department, inadequate finance to undertake marketing re- search, go international, and to participate in trade fairs among other factors. Leaving most SMEs to face these challenges alone usually leads to high rate of demise and low growth rate, hence gov- ernment and other multi donor organizations provide support to these SMEs in the area of finance, market, managerial capacity building among others. This research assesses the impact of the gov- ernment support in the form of marketing assistance (training of marketing staffs, access to for- eign marketing, trade fairs and exhibitions) to some selected retail SMEs in the ten Regional Capi- tals of Ghana on their growth. Using firm data report, the results indicated that the provision of support for SMEs to participate in trade shows and exhibitions highly impact positively on SMEs growth, followed by the provision of support in access to international market, and support in the training of marketing staffs of SMEs. Keywords SMEs, Growth, Marketing Challenges, Government Support * Corresponding author.
Transcript of The Impact of Institutional Support in SMEs Marketing, and...

Open Journal of Business and Management, 2016, 4, 408-426 Published Online July 2016 in SciRes. http://www.scirp.org/journal/ojbm http://dx.doi.org/10.4236/ojbm.2016.43043
How to cite this paper: Osei, A., Shao, Y.F., Forkuoh, K.S. and Osei, M.A. (2016) The Impact of Institutional Support in SMEs Marketing, and Growth—A Case Study of Retail SMEs in Ghana. Open Journal of Business and Management, 4, 408-426. http://dx.doi.org/10.4236/ojbm.2016.43043
The Impact of Institutional Support in SMEs Marketing, and Growth—A Case Study of Retail SMEs in Ghana Abraham Osei1, Yunfei Shao1, Kwarteng Solomon Forkuoh1*, Michael Aboagye Osei2 1School of Management and Economics, University of Electronic Science and Technology of China (UESTC), Chengdu, China 2School of Teacher Education, Zhejiang Normal University, Jinhua, China
Received 22 April 2016; accepted 28 June 2016; published 1 July 2016
Copyright © 2016 by authors and Scientific Research Publishing Inc. This work is licensed under the Creative Commons Attribution International License (CC BY). http://creativecommons.org/licenses/by/4.0/
Abstract Small and Medium Enterprises (SMEs) are still hailed as the panacea of economic development of many countries, since they play a fundamental part of the economic fabric in developing a crucial role in furthering growth, innovation and prosperity. In the quest to achieve growth, SMEs unfor-tunately face severe challenges including the marketing of their products, which stem from unqu-alified employees in the marketing department, inadequate finance to undertake marketing re-search, go international, and to participate in trade fairs among other factors. Leaving most SMEs to face these challenges alone usually leads to high rate of demise and low growth rate, hence gov-ernment and other multi donor organizations provide support to these SMEs in the area of finance, market, managerial capacity building among others. This research assesses the impact of the gov-ernment support in the form of marketing assistance (training of marketing staffs, access to for-eign marketing, trade fairs and exhibitions) to some selected retail SMEs in the ten Regional Capi-tals of Ghana on their growth. Using firm data report, the results indicated that the provision of support for SMEs to participate in trade shows and exhibitions highly impact positively on SMEs growth, followed by the provision of support in access to international market, and support in the training of marketing staffs of SMEs.
Keywords SMEs, Growth, Marketing Challenges, Government Support
*Corresponding author.
A. Osei et al.
409
1. Introduction Several researchers across the globe have recommended the need for external support from both government and non-governmental institutions to improve SMEs’ performance for the needed economic growth [1]-[4]. Realiz-ing the significant role external support had on the growth of SMEs, most governments from both developed and developing countries had come out with policy interventions based on the needs of SMEs in their jurisdiction, all with the aim of boosting growth [5].
In the UK, the government policies for SMEs development entered crescendo following the Bolton Report in 1971 [6], leading to the establishment of the Small Firms’ Services (SFS), which happened to be UK govern-ment’s first SMEs focus support agency. Further research on the challenges facing SMEs in Africa by [7]-[9], made a recommendations that external governmental support is needed for the SMEs to flourish.
Studies have shown that, aside the governmental support, other multinational institutions such as the World Bank, European Commission, DANIDA, ADRA, GTZ among other organizations have been supporting SMEs, in the form of finance, advisory services, management capacity building and training [10].
Though some researchers like [11] has argued that the impact of the support on SMEs growth is difficult to ascertain. Yet empirical evidence on the impact of the institutional support on SMEs growth had been estab-lished among SMEs in the Asian countries such as: North Korea, Japan and China [12]. In another development, [2] was of the view that, for maximum returns from support offered to the SMEs, the external support should base on developing the owner or manager networking efficiency, provision of additional capital and advisory services among other services and all with the aim of improving business performance and growth. This view had been supported and proven empirically by [13], when they observed that, government assistance to SMEs in Tanzania in the form of favorable business environmental regulation in the area of taxes, improvement in infra-structures and the provision of financial assistance in the form of loans, grants and subsidies were translated into the growth of the country’s SMEs which resulted in the growth of GDP.
Aside financial challenges, SMEs are faced with non-financial challenges such as inadequate technical skills, poor access to market and lack of information. These were revealed by [14], researching on SMEs challenges in South Africa where a positive correlation between problems experienced by SMEs entrepreneurs and the mana-gerial skills they possess, including poor marketing skills well established. Again, similar sentiments are ree-choed by [15] in a research that, the marketing functions of SMEs is inhibited by several constraints such as size, resources constraints, poor cash flow, managerial incompetence, customer related problems, lack of clear strat-egy among others. The marketing challenges has been attributed to several causes, as [16] posited that, most SMEs do not motivate their employees well, because of inadequate finance compelling them to employ incom-petent staff to help implement the business strategies which include marketing strategy, as they put it “limited financial resources at the disposal of the entrepreneurs, therefore use the scanty financial resources on other ac-tivities such as procurement of key assets and other recurrent expenditure at the negligence of marketing issues”. Similar sentiments have been expressed by [17] in a research into the high rate of failure of SMEs in South Africa, attributed to the fact that SMEs do not have enough fund to hire more competent marketing staff and es-tablished a positive correlation between business success and the employment of skilled marketers.
Coming out with a product or service and the presence of a market alone may not represent success for the business. But as [18] established that, the efficacious marketing of the products or services maters the most and this calls for effective marketing strategies, but when it comes to the SMEs marketing, they are perceived to lack the sophisticated marketing strategic tools due to managerial incompetence among several other challenges [19]. This is because SMEs marketing is based on certain inherent characteristics such as limited size, weak manage-ment and so on [20].
Looking at the enormous challenges SMEs face in the sector of marketing, in relation to the poor survival rate of SMEs as compared with their larger counterpart is very low as [7], reported that only 16% of SMEs startups sur- vived the 5th year in developing countries, while similar research by [21] on the survival rate of SMEs in the United Kingdom, revealed the only 19% of SMEs startups survive their 6 years of operations. It will be in good taste that, support for SMEs growth target the marketing aspect to maximize returns from the scarce resources invested.
2. Empirical Literature Review 2.1. Forms of Institutional Support to SMEs Depending on the mode and form external support to SMEs may take, the support can be grouped into financial
A. Osei et al.
410
assistance (grants, soft loans, credit suppliers or subsides), managerial capacity building (training or workshops) advisory services and marketing facilitation [22] [23].
Similarly, [24] classified the support into four categories, as capital assets (physical, social, natural and human capital), the study further explained that the physical comprises provision of infrastructure such as water, elec-tricity, and road and business site. Social support also consists of the development of business linkages, through information dissymmetry, cluster, business association and access of external marketing information. The hu-man capital is also made up of the provision of training towards capacity building, consultancy services, man-agement training and customer service related training. Whiles, the natural capacity refers to the environmental issues and sustainability of the eco-system. Some researchers [4] [22], just classifies the external institutional support into social and human capital assets.
2.2. Empirical Evidence on Institutional Support and SMEs Growth Several findings by researchers on the impact of external institutional support on SMEs growth shows a positive correlation between them [25] [26]. As there is ample evidence on the positive impact of external institutional support on SMEs growth in the UK, since the recommendations by Bolton Commission.
In a comprehensive survey by [25], on the impact of the external support on over 5000 SMEs in the UK, the results indicated that, 19% of the SMEs had increased the workforce (number of employees gone up), 64% were employing the same number, while 17% have reduced the workforce, but in the end there was a net employee increase over the survey period from 2012 to 2013. Also 72% of the SMEs had an increase in their annual profit over the period under review [25]. Out of the 532 SMEs surveyed, 45% ad sought for external business support. This finding was in line with the earlier study by [26], where there was a positive correlation between the exter-nal institutional support and SMEs growth in the UK.
In determining the impact of external institutional support on the operations of SMEs in the area of access to external finance, growth, decision marking, managerial training and capacity building, in all there was a positive impact on the growth and development of the SMEs [27]-[30]. Similarly, research by [27] [30] [31], shows the vital role play by external accountants in the SMEs sector, which confirms the rationale for an increase in de-mand for external accountants by SMEs in the area of external support.
Studies conducted by numerous researcher, [7] [22] [32] on the impact of institutional support on SMEs growth in the US and most parts of Europe, also indicated a positive correlation between the support and SMEs growth.
A renewed Ghana government policies on SMEs growth were intensified upon the introduction of the second Growth and Policy Reduction Strategy (GPRS II 2006 to 2009), and Growth Agenda (GA III 2010-2013), which saw the state increasing it support to SMEs in diverse forms. All with the aim of reducing poverty and moving Ghana to the middle-income country, with SMEs growth as the catalyst. The positive impact of the policy on the economy of Ghana led the World Bank and [33] ranking Ghana 10th in the best Global reformer for the period 2006 to 2009.
Specifically, obtaining external advice in the field of business strategy and staff recruitment have a positive impact on the growth of SMEs, these findings came out from a research conducted by [32] on the impact of in-stitutional support and SMEs growth in member countries, though there is a little evidence statistically on the contribution on the external support of SMEs growth as indicated by [34] on the contribution of the external support of SMEs growth. [35], in earlier research concluded that, there is no significant contribution of the pro-vision of managerial training support on SMEs growth. [36] gave the reason as the problems associated in estab-lishing the real contribution of the external support the SMEs growth as several factors may have accounted for such growth.
It is therefore not surprise for an upsurge in demand for external institutional support in the form of Accoun-tants’ advice financial and managerial support from several support institutions over the years. [37] said this shows that there is a growing trust and interest in the activities of the support institutions globally [38].
2.3. The Need for External Support in the Training of Marketing Staffs of SMEs Research by the [39] indicated a high failure rate of SMEs in 25 EU countries, with over 50% not surviving the first five years of their establishment and the annual average demise rate is 7%. Similar research by [40] on the survival rate of SMEs in the USA recorded a lower survival rate even more than it pertains in the UE and this

A. Osei et al.
411
was attributed to economic dynamism and market failure among other factors. The research further established that, increasing global competition and limited market size may be pushing entrepreneurs to creative destruction tactics.
Research by [41], established a positive relationship between SMEs failure and the absence of proper and adequate marketing skills among entrepreneurs in South Africa. This has been attributed to the fact that most SMEs do not pay enough attention to marketing issues [42]. While [43] is of the view that, entrepreneurs exhibit certain character traits which does not support marketing research and formal marketing leading to business failures.
SMEs marketing challenges was also given prominence by [44], in a research on the challenges faced by SMEs, where market size and distortions was ranked as the second most challenging problem of the SMEs sur-veyed in developing countries, while research by [45], on SMEs market challenges, revealed that there is a thin line between marketing and selling in most SMEs firms, since marketing usually take place at point of selling process, and attributed this to inadequate marketing skills among entrepreneurs.
Again, marketing problem faced by most SMEs, were highlighted by recent research conducted by the [46] on the challenges face by SMEs in the region, where “Finding Customer” was the most concern of the businesses as 24% of the respondent cited inadequate customers (market) following by cost of production and access to fi- nance.
Research by [15] basing on the findings by [47] on the failure of SMEs in Macedonia also established that inadequate customers resulting in low sales was ranked as the topmost challenge.
The situation is not much different among SMEs in developing countries, even though research conducted by [7] on the challenges facing SMEs in the region, ranked access to finance as their major constrain followed by limited size of the market, and the marketing challenges have been blamed on poor marketing staff among other issues. There is therefore the need to boost the marketing staff competence through training, education and ca-pacity building [48]. We therefore hypothesized that, external support in the training of marketing staffs of SMEs have positive impact on the growth in the SMEs in the form of sales.
2.4. Access to Foreign Marketing and SMEs Growth Internationalization and international entrepreneurship among small and medium-sized enterprises (SMEs) is receiving much attention in recent times due to contemporary relevance that researchers have identify with cross-border trade, such as business growth and economic development in the long-run levels [49]. Empirically, research by [50] on the impact of cross-border trade on firms’ growth, established an increase in profit and mar-ket share of hospital device manufacturers in the UK, which was also the major rationale for going international. Growth in the area of profit and market share as well as finding external distributors, remain the major motivator for most SMEs going international [51] [52]. This motive explain the high growth rate associated with firms that are engage in cross-border business as it open access and integration into the lucrative supply chains of interna-tional players [53]. The [54] reported that firms in Danish, Dutch, Finnish, Norwegian and Swedish enterprises involve in the global business frequently gain due to sourcing from outside their home country.
Despite these goodies in trading abroad, several challenges such as 1) shortage of working capital to finance exports; 2) Identifying foreign business opportunities; 3) Limited information to locate/analyze markets; and 4) Inability to contact potential overseas customers restrict some SMEs especially from the developing countries [55]. Others are of the view that, when it comes to SMEs accessing the international market, problems including; ignorance of regulations and standards, lack of financial assistance, foreign exchange fluctuation problems, tax-es and inadequate of information, weak network linkages limits their activities in international marketing [55], coupled with the negative perception the overseas market have on products from the developing countries as in-ferior. Against this backdrop that [20] suggested the involvement of home governments in the provision and up-grading of business environment conducive for international business.
The SMEs are again, been reported by [56] as facing challenges in the strategic marketing for commercializa-tion.
It has been suggested that, measures to ease SMEs international marketing challenges have been focused on access to international markets [51]. This is in line with empirical evidence from the support in the form of ex-port credit guarantees, pre-shipment financing, and working capital augmenting facilities provided by Austral-ia’s export credit agency and Export Finance and Insurance Corporation (EFIC) which have resulted in a boost
A. Osei et al.
412
in international trade among SMEs in the region. Likewise in Russia, the Chamber of Commerce Network is involved in developing the SME export support program. Also the French Chambers of Commerce support its SMEs and others with a wide variety of services, including market research, expert advice, prospecting clients and training sessions financed by the government [51].
Against this backdrop, we hypotheses that, the provision of support in SMEs access to international market, impact positively on the growth of SMEs in the form of sales.
2.5. Trade Fairs and Exhibitions and SMEs Growth Studies into the effect of trade fairs and exhibitions on firms’ performance indicate a positive returns in the forms of sales and profit, as research by [57] posited that, trade shows and fairs provide positive economic re-turns to the firms as well as evidence of a positive effects on generating product awareness and interest. The Center for Exhibition Industry Research [58] revealed the following about trade shows:88% of attendees have not been seen by a member of your company’s sales staff in the preceding 12 months, Seven out of ten attendees plan to buy one or more products, 76% asked for quotes and 26% signed purchase orders (average all shows), 72% of show visitors say the show influenced their buying decision, 87% of attendees will share some of the infor-mation obtained at an exhibition, 64% of attendees tell at least 6 other people about the event, 58% attend only the show in which you are exhibiting, 40% are first-time attendees.
Despite the enormous benefits accrue to firms that participate in trade fairs and shows, in developing coun-tries, only few firms are able to participate the scantly organized fairs, partly due to the associated high cost, ig-norance of the benefits, and unavailability of fairs. As study by [57] [59] [60], indicates that, the trade fairs and shows expenditures are the second largest item in the marketing activities budget after advertisement, and that account for nearly one-fifth of the total budget for U.S. firms, and approximately one-fourth for the European firms.
Looking at the under listed objectives for the adoption of trade fairs and shows: a) Exploring new mar-kets/(discovering market niches); b) Assessing the overall competitiveness; c) Assessing export chances; d) As-sessing the overall industry situation; e) Exchanging experiences; f) Forging successful partnerships; g) Taking part in professional events; h) Spotting new trends; i) Tapping into new markets for the company/product; j) Combining participation with other measures (activities, seminars, company tours); k) Meeting competitors (which competitors exhibit at which trade fairs?); l) Increasing sales volume [61].
Trade fairs and shows are not only to be seen as an efficient communication and sales tool, but also have the tendencies of influencing product and pricing strategies [62]. We therefore hypothesize that, the provision of support for SMEs to participate in trade shows and exhibitions will impact positively on SMEs growth.
3. Methodology This study adopted a positive, quantitative and qualitative research approach [63]. According to [64] a quantita-tive approach ensured that the logical reasoning is applied to the research so that precision, objectivity and rigor replace hunches, experience and intuition as the means of investigation research problems’. Notwithstanding this benefit, [65] noted that a quantitative approach to the study of small business implied that some questions simp-ly do not get asked or cannot be asked.
Evidence was collected in the form of taped interviews, and field notes using the daily diary approach. Also, focus groups representing a “diagonal slice” through the organization were interviewed to give broader and deeper data and to obtain triangulation [66] [67].
Wherefore, a psychometric analysis was used in finding the relationship between SMEs growth and TFE, TSM, AFM. The survey of the SMEs was done on a large scale, comprising 500 SMEs (owner/managers) in ten regional capitals of Ghana. The questioners consist of two parts, with the first part concentrated on the bio-graphic information of respondents and the second section consisting of Likert scale items demanding the ex-tents of agreement and disagreement to items specified for the study regarding the impact of independent va-riables on the growth and developments of their businesses.
The use of both qualitative and quantitative approaches was to obtain in-depth information from the selected support institutions through interviews in addition to the primary data obtained through the use of the question-naires.
A. Osei et al.
413
The analysis of the quantitative data gathered was undertaken by the use of Statistical Package for the Social Sciences (SPSS), Microsoft excel and excel tool package. Obtained data was presented and analyzed using sta-tistical techniques such as descriptive statistic (frequencies and simple percentages), Principal Component Analysis with Factor Analysis as an extraction method followed by a CFA to confirm the measurement items and a Structural Equation Model.
Validity and reliability test were computed to validate and confirm the strength of items on each constructs. Convergent and discriminant validity were considered for indications of validity problems whiles Composite and Cronbach’s alpha values were examined for reliability issues.
Utilizing the stats tools package (excel), estimates were computed for convergent validity (with AVE and square root for AVEs).Composite reliability (CR) ratios were simultaneously computed for all factors and were compared with a minimum threshold of 0.70. The section next describes in detail the outcome of the analysis.
4. Presentation and Discussion of Research Analysis As this study bents on exploring the potential relationships between combinations of constructs, five modified scales from existing studies were used for data collection from purposively sampled views of 500 entrepreneurs located in the ten regional capitals of Ghana.437 cases constituting 87.4 % were retrieved for analysis whiles respondents’ bio-characteristics were not factored as prerequisites for selection. It is discernible that, 224 (51.3%) males and 213 (48.7%) females from which 104 (23.7%) constituted SHS &below education, 108 (24.7%) with CERT/DIP/HND, 113(25.8%) with First Degree education and 112 (25.6%)with above First Degree education took part in the study. On the score of age, 100 (22.8%) of them fell into the age range of 25 years & below, 115 (26.3%) fell into 26 to 35 years, 113 (25.8%) fell into the age range of 36 to 45 years and respondents of ages 46 years and above constituted 109 representing 24.9%.
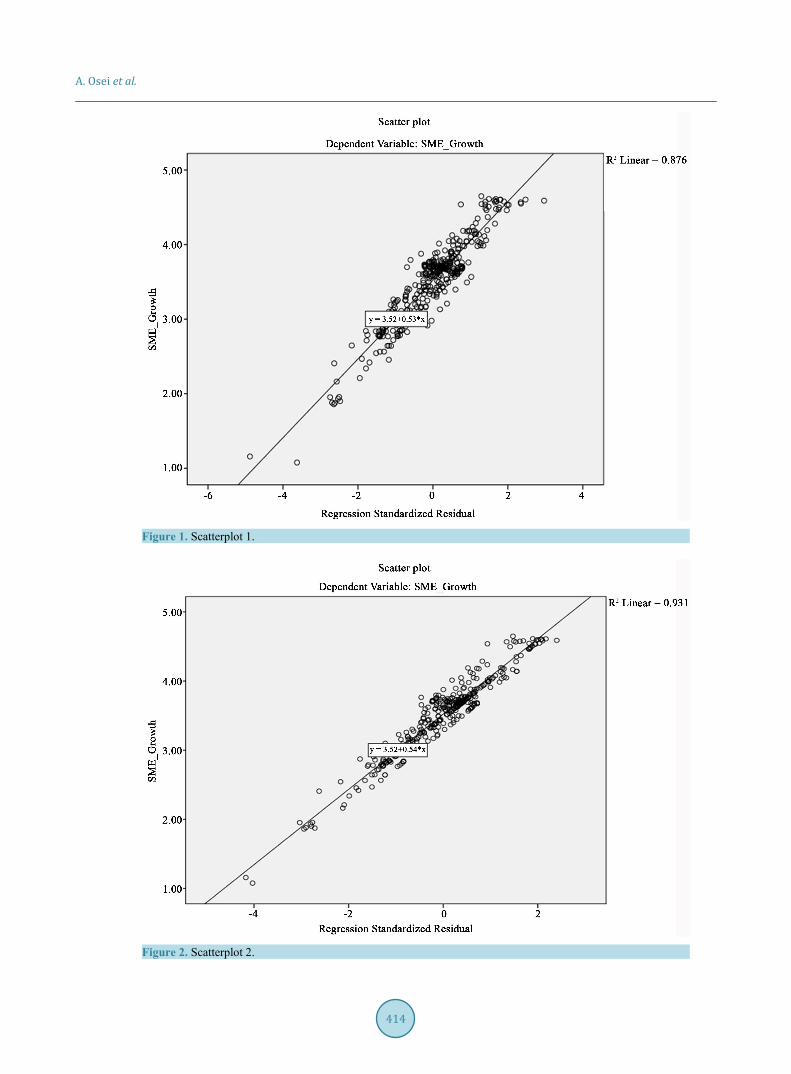
On warp and woof of Pallet’s (2011) assertion about the need for screened data in research studies, the gathered data for this study was put through series of screening and cleaning. Dreadful issues of unengaged responses and missing data were outlined. The analysis adduced SD values ranging from 0.690 to 0.977 which obviously discern no dislikeable pattern of responses to the items for the study. Then again, normality assumptions were vehemently met as three rules from the central theorem [68], was applied in the study. Table 1 displays that, the results ob-tained for both bio-data and the Likert scale items vigorously suggest no evidence of extreme problematic skewness and kurtosis issues, such that, the observed values for skewness ranged from 0.059 to 0.148 while the values for kurtosis ranged from-0.090 to 1.892 go to support.
Successively, the need to share light on concerns of discordant relationship between the data and the proposed model was equally imperative. In respect, matters of relationships, curves or equation as and quadratic, cubic, inverse, power, exponential, logistic, compound and logarithmic equations were concurrently examine in the re-search data and compared to the linear equation or relationship present in the data to evince whether the data gathered sufficiently beseem the proposed model. It is unambiguously discernible that, the research data stre-nuously befit the proposed model such that, the observed values for linear equation between all independent va-riables and the criterion variable is adequately significant. Given the linear relationship between TFE, TSM, AFM and SMEs Growth, it is evidential in Table 2 that, there exists enough linear relationship among con-structs in the data set which goes to evince a true reflection of the proposed relationship in the model formulated for the study.
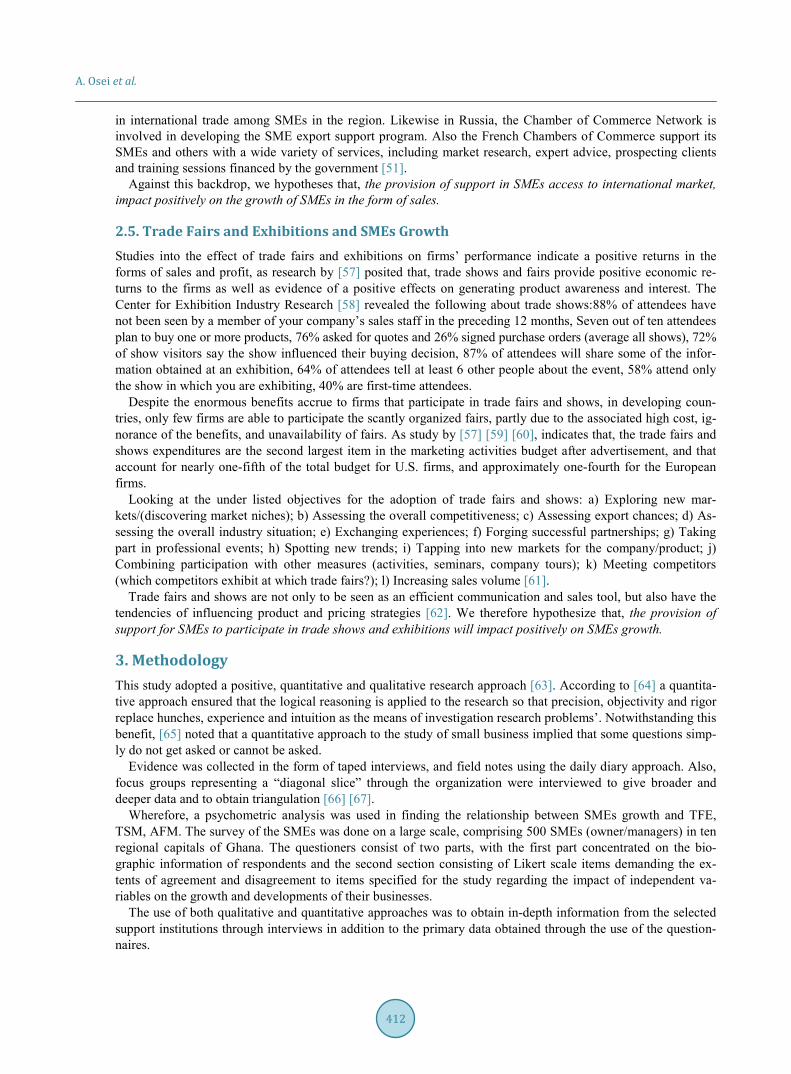
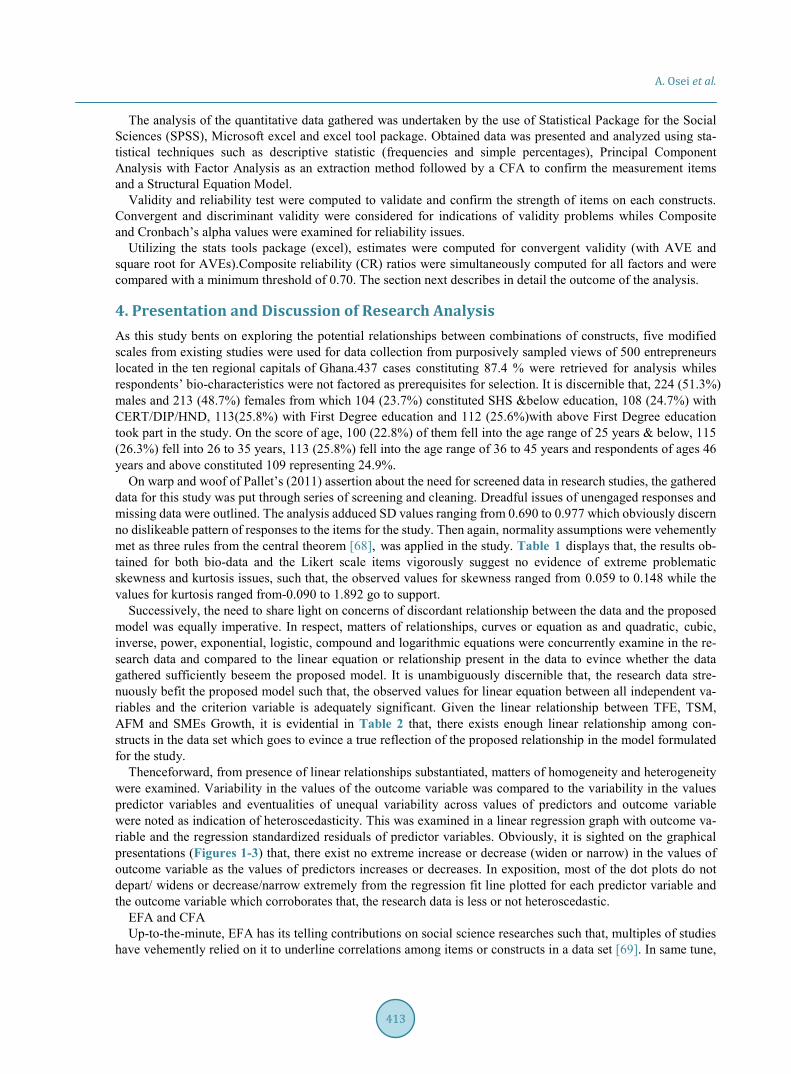
Thenceforward, from presence of linear relationships substantiated, matters of homogeneity and heterogeneity were examined. Variability in the values of the outcome variable was compared to the variability in the values predictor variables and eventualities of unequal variability across values of predictors and outcome variable were noted as indication of heteroscedasticity. This was examined in a linear regression graph with outcome va-riable and the regression standardized residuals of predictor variables. Obviously, it is sighted on the graphical presentations (Figures 1-3) that, there exist no extreme increase or decrease (widen or narrow) in the values of outcome variable as the values of predictors increases or decreases. In exposition, most of the dot plots do not depart/ widens or decrease/narrow extremely from the regression fit line plotted for each predictor variable and the outcome variable which corroborates that, the research data is less or not heteroscedastic.
EFA and CFA Up-to-the-minute, EFA has its telling contributions on social science researches such that, multiples of studies
have vehemently relied on it to underline correlations among items or constructs in a data set [69]. In same tune,
A. Osei et al.
414
Figure 1. Scatterplot 1.
Figure 2. Scatterplot 2.
A. Osei et al.
415
Table 1. Descriptive statistics of cases.
N Mean Std. Deviation Variance Skewness Kurtosis
Statistic Statistic Statistic Statistic Statistic Statistic
Q1TFE 437 2.73 0.831 0.691 0.291 −0.395
Q2TFE 437 2.86 0.894 0.799 0.104 −0.804
Q3TFE 437 2.72 0.885 0.784 0.299 −0.475
Q4TFE 437 3.09 0.913 0.834 −0.286 −0.681
Q5TFE 437 2.99 0.945 0.892 −0.083 −0.883
Q7TMS 437 2.88 0.897 0.804 0.064 −0.627
Q8TMS 437 2.40 0.938 0.881 0.835 0.193
Q9TMS 437 2.36 0.977 0.955 0.706 −0.090
Q10TMS 437 2.20 0.826 0.683 0.811 0.596
Q11TMS 437 2.25 0.913 0.834 0.707 0.020
Q15AFM 437 4.03 0.709 0.503 −0.703 0.989
Q16AFM 437 3.97 0.702 0.493 −0.696 1.299
Q17AFM 437 3.98 0.710 0.504 −0.598 0.955
Q18AFM 437 3.98 0.691 0.477 −0.597 1.135
Q19AFM 437 4.05 0.705 0.496 −0.564 0.844
Q35SMEG 437 3.88 0.725 0.526 −0.891 1.892
Q36SMEG 437 3.88 0.740 0.547 −0.626 0.980
Q37SMEG 437 3.75 0.762 0.581 −0.727 0.989
Q38SMEG 437 3.75 0.716 0.513 −0.671 1.034
Q39SMEG 437 3.47 0.909 0.827 −0.256 −0.365
Gender 437 1.51 0.500 0.250 −0.053 −2.008
Age 437 2.74 1.348 1.816 0.149 −1.218
Education 437 2.52 1.154 1.332 −0.059 −1.437
TFE 437 14.3979 3.68494 13.579 −0.100 −0.042
TMS 437 12.0916 3.69287 13.637 0.625 0.442
AFM 437 20.0105 3.17964 10.110 −0.694 1.350
SME_Growth 437 18.7277 3.15134 9.931 −0.737 1.606
Table 2. Model summary and parameter estimates of equations in the data set.
Equation TFE TMS AFM
R Square F Sig. R Square F Sig. R Square F Sig.
Linear 0.085 35.329 .000 0.067 27.383 0.000 0.249 125.829 0.000
Logarithmic 0.073 29.919 0.000 0.066 26.667 0.000 0.230 113.194 0.000
Inverse 0.052 20.978 0.000 0.056 22.570 0.000 0.181 83.728 0.000
Quadratic 0.089 18.490 0.000 0.068 13.785 0.000 0.250 63.204 0.000
Cubic 0.090 12.386 0.000 0.068 9.185 0.000 0.263 44.959 0.000
Compound 0.080 32.931 0.000 0.065 26.303 0.000 0.235 116.996 0.000
Power 0.074 30.549 0.000 0.066 26.664 0.000 0.222 108.162 0.000
Exponential 0.080 32.931 0.000 0.065 26.303 0.000 0.235 116.996 0.000
Logistic 0.080 32.931 0.000 0.049 19.628 0.000 0.235 116.996 0.000
The independent variable is TFE1, TMS, AFM.

A. Osei et al.
416
Figure 3. Scatterplot 3.
this study amply engages EFA technique to outline the extent of correlation among the specified items in this study and thenceforth extract items on their corresponding construct while obtaining unambiguous factor pattern. It is evidential from the output generated that, the research data profusely shows sufficient correlation for factor analysis with X2 of 5622.8697 DF of 190 is p = 0.000 it expression afore is statistically reinforced. Then also, the Kaiser Mayor Oklin (KMO) measure of sampling adequacy is classified superb for obtaining a value of 0.903. Concurrently, all other assumptions regarding observed values for communalities, MSAs, and the pattern of rotated component matrix were met as shown in Table 3 in accordance with psychometric properties.
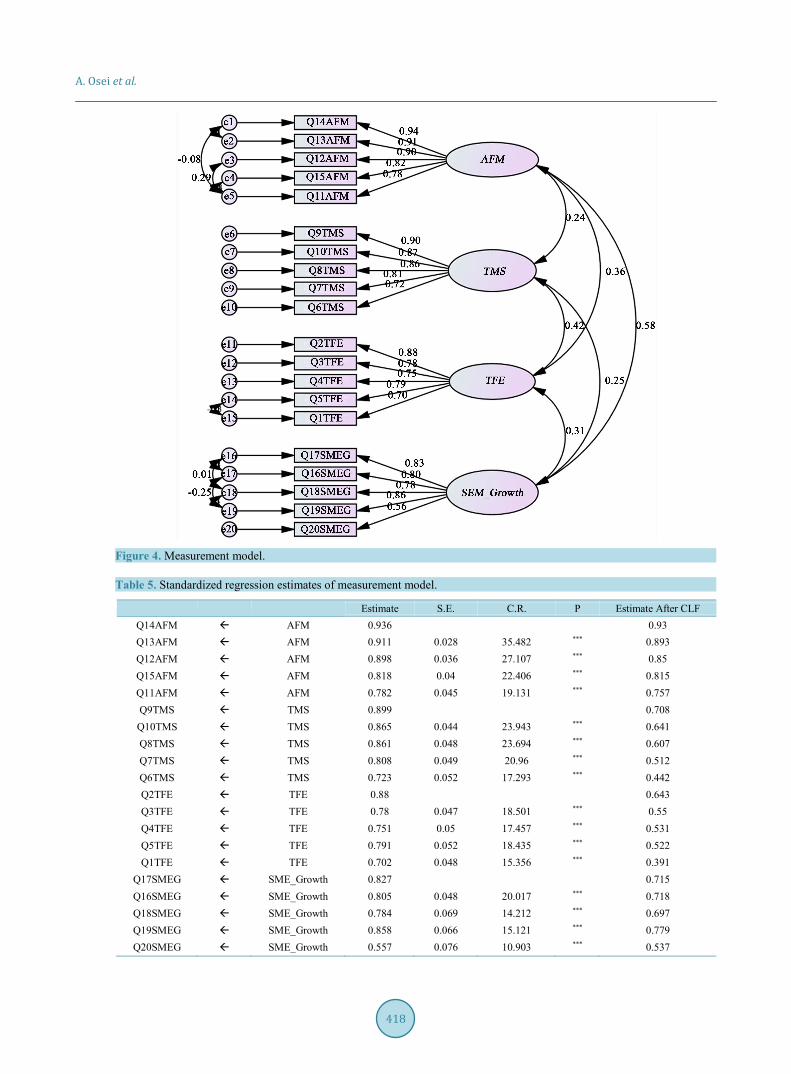
Resultantly, a measurement model was generated and validated in a covariance based method from the rotated factor matrix. The modification indices adduced suggested a clear opportunity to improve the measurement model. Respectively, the error terms e1, e2, e3, e4 and e5 in the AFM construct, e14 and e15 in the TFE con-struct and e16, e17, e18 and e19 in the SME Growth construct were simultaneously covaried to obtain a decent model (Figure 4).
The import thereafter was tremendously telling with sufficient relationships between observed measures (in-dicator) and their corresponding latent variables. It is discernible from examining the goodness of fit indices that, the measurement model poses strong predictive ability with a X2168.136, p-value = 0.223 and at the 155Df while Cmin, RMR, RMSEA, NFI and PCFI satisfactorily met their critical thresholds (Table 4).
Then again, same is true with the estimates for the paths of items to their latent variables (β = or > 0.50, 0.60 in most cases as shown in Table 5 and Figure 4) further confirming cogently to the level of fit of the measure-ment model.
In extant studies, matters of validity and reliability have been intimated on the relevance of validating regard-ing convergent and discriminant of factors and their items as well as examining the strength of consistency within items have their compelling effect on research findings. This study is not a reverberation of these asser-tions however its accord credence to this assumptions. Respectfully, this study scrutinizes items and constructs in the research data to evince problematic issues of validity concerns. In the process, convergent validity was examined with computed AVEs and the square roots of AVEs were compared to inter-factor correlations. Con-

A. Osei et al.
417
Table 3. KMO and Bartlett’s test.
Kaiser-Meyer-Olkin(KMO) Measure of Sampling Adequacy. 0.903
Bartlett's Test of Sphericity
Approx. Chi-Square 5641.218
Df 190
Sig. 0.000
Total Variance Explained
Component Initial Eigenvalues Extraction Sums of Squared Loadings Rotation Sums of Squared Loadings
Total % of Variance
Cumulative % Total % of
Variance Cumulative
% Total % of Variance
Cumulative %
1 7.411 37.053 37.053 7.411 37.053 37.053 4.104 20.518 20.518
2 3.332 16.662 53.715 3.332 16.662 53.715 3.948 19.741 40.260
3 2.122 10.612 64.328 2.122 10.612 64.328 3.424 17.118 57.378
4 1.823 9.117 73.445 1.823 9.117 73.445 3.213 16.067 73.445
5 0.700 3.498 76.943 6 0.573 2.863 79.805 7 0.528 2.640 82.445 8 0.458 2.289 84.734 9 0.395 1.974 86.708
10 0.359 1.794 88.503 11 0.345 1.726 90.229 12 0.300 1.502 91.731 13 0.285 1.427 93.158 14 0.281 1.404 94.563 15 0.256 1.278 95.840 16 0.238 1.188 97.029 17 0.188 0.938 97.967 18 0.160 0.801 98.768 19 0.148 0.741 99.509 20 0.098 0.491 100.000
Extraction method: Principal component analysis.
Table 4. Goodness of fit test (measurement model).
Chi-square 168.136
Degrees of freedom (Df) 155
Probability level 0.223
Observed Values Thresholds
Goodness Fit Indices
CMIN/DF 1.085 1 to 3
CFI 0.998 >0.95
RMR 0.024 <0.09
GFI 0.996 >0.95
AGFI 0.945 >080
NFI 0.971 >0.90
RMSEA 0.015 <0.05
PCLOSE 0.1 >0.05
A. Osei et al.
418
Figure 4. Measurement model.
Table 5. Standardized regression estimates of measurement model.
Estimate S.E. C.R. P Estimate After CLF Q14AFM AFM 0.936 0.93 Q13AFM AFM 0.911 0.028 35.482 *** 0.893 Q12AFM AFM 0.898 0.036 27.107 *** 0.85 Q15AFM AFM 0.818 0.04 22.406 *** 0.815 Q11AFM AFM 0.782 0.045 19.131 *** 0.757 Q9TMS TMS 0.899 0.708 Q10TMS TMS 0.865 0.044 23.943 *** 0.641 Q8TMS TMS 0.861 0.048 23.694 *** 0.607 Q7TMS TMS 0.808 0.049 20.96 *** 0.512 Q6TMS TMS 0.723 0.052 17.293 *** 0.442 Q2TFE TFE 0.88 0.643 Q3TFE TFE 0.78 0.047 18.501 *** 0.55 Q4TFE TFE 0.751 0.05 17.457 *** 0.531 Q5TFE TFE 0.791 0.052 18.435 *** 0.522 Q1TFE TFE 0.702 0.048 15.356 *** 0.391
Q17SMEG SME_Growth 0.827 0.715 Q16SMEG SME_Growth 0.805 0.048 20.017 *** 0.718 Q18SMEG SME_Growth 0.784 0.069 14.212 *** 0.697 Q19SMEG SME_Growth 0.858 0.066 15.121 *** 0.779 Q20SMEG SME_Growth 0.557 0.076 10.903 *** 0.537
A. Osei et al.
419
currently, MSVs and ASVs were calculated and compared to justify the level of disparity among factors in the research model. Likewise, a composite reliability (CR) values were computed and compared to a threshold of 0.70 to indicate issues of problematic internal consistency of the survey items. As referenced in the table la-beled…, the observed values for both MSV and ASV are extremely less than the AVE values to explain the dis-tinctiveness of the factors in the research model. In confirmation, the AVE values obtained were greater than 0.50 (all above 0.60) while the entire square roots of the AVEs (on the diagonal matrix in Table 6) are far higher than the correlations among the factors. Similarly, the values obtained for CR were sufficiently above the mini-mum threshold of 0.70, (observed values ranges from 0.873 to 0.958) with p-value < 0.001 for the path loadings for all items and their latent constructs. Table 6 exhibits in detail.
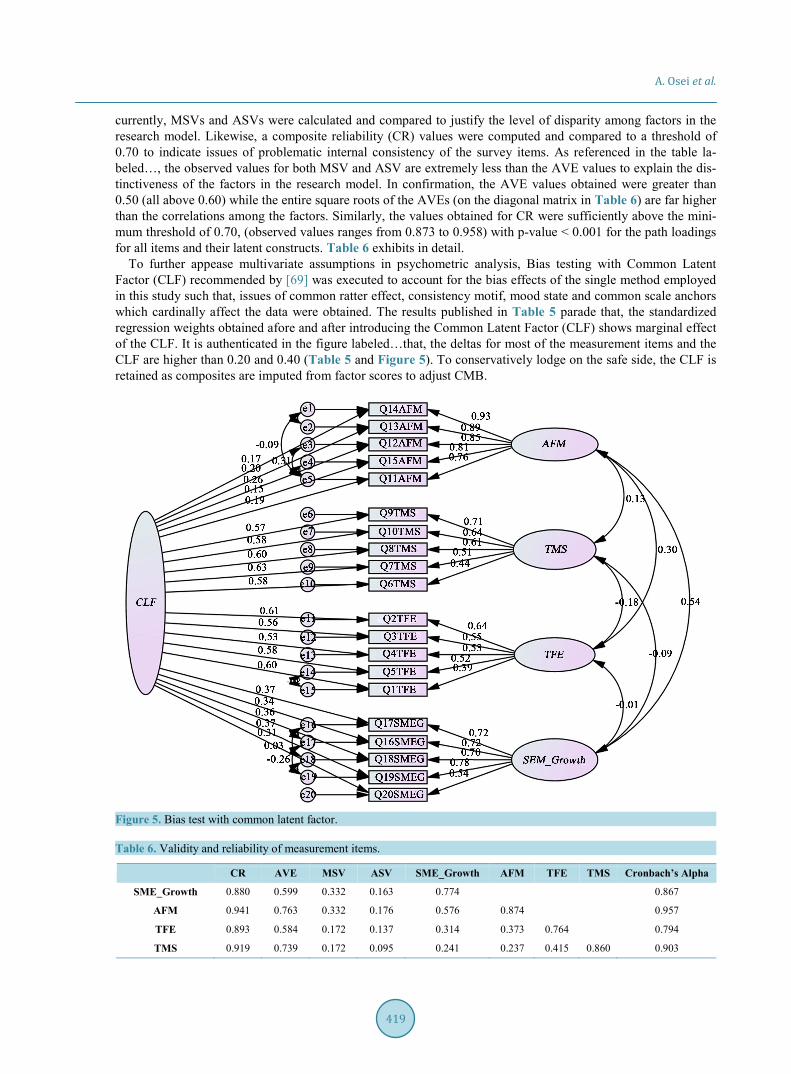
To further appease multivariate assumptions in psychometric analysis, Bias testing with Common Latent Factor (CLF) recommended by [69] was executed to account for the bias effects of the single method employed in this study such that, issues of common ratter effect, consistency motif, mood state and common scale anchors which cardinally affect the data were obtained. The results published in Table 5 parade that, the standardized regression weights obtained afore and after introducing the Common Latent Factor (CLF) shows marginal effect of the CLF. It is authenticated in the figure labeled…that, the deltas for most of the measurement items and the CLF are higher than 0.20 and 0.40 (Table 5 and Figure 5). To conservatively lodge on the safe side, the CLF is retained as composites are imputed from factor scores to adjust CMB.
Figure 5. Bias test with common latent factor.
Table 6. Validity and reliability of measurement items.
CR AVE MSV ASV SME_Growth AFM TFE TMS Cronbach’s Alpha
SME_Growth 0.880 0.599 0.332 0.163 0.774 0.867
AFM 0.941 0.763 0.332 0.176 0.576 0.874 0.957
TFE 0.893 0.584 0.172 0.137 0.314 0.373 0.764 0.794
TMS 0.919 0.739 0.172 0.095 0.241 0.237 0.415 0.860 0.903
A. Osei et al.
420
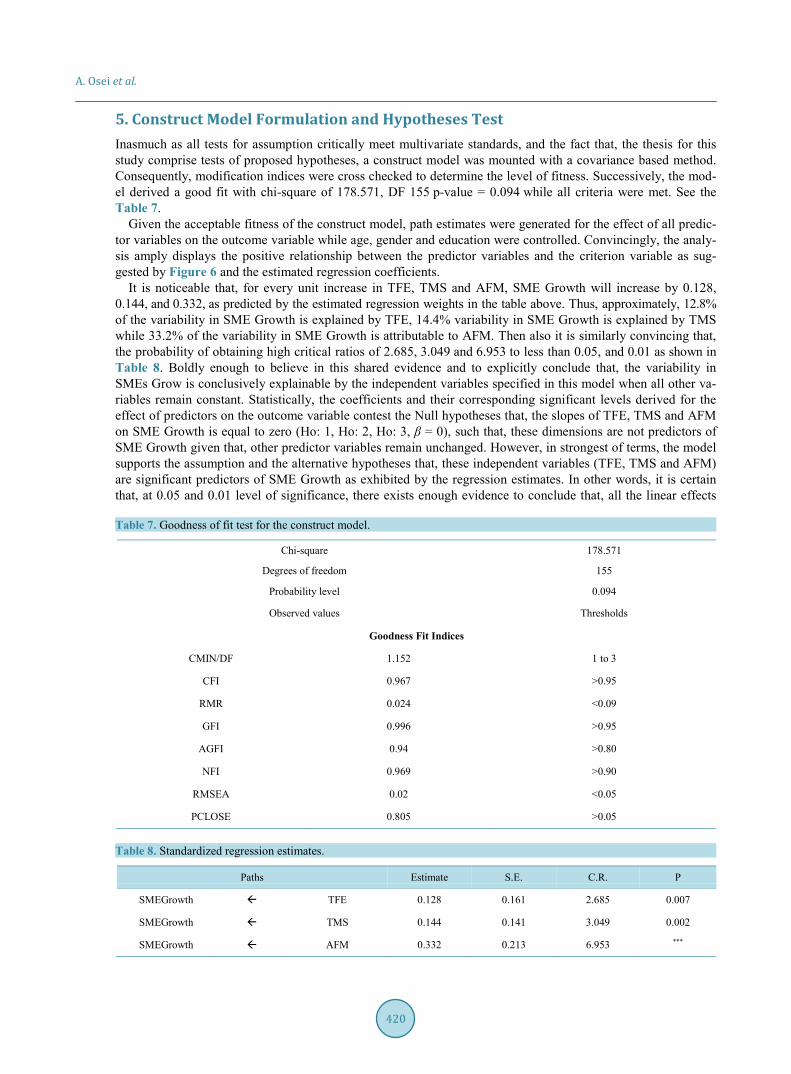
5. Construct Model Formulation and Hypotheses Test Inasmuch as all tests for assumption critically meet multivariate standards, and the fact that, the thesis for this study comprise tests of proposed hypotheses, a construct model was mounted with a covariance based method. Consequently, modification indices were cross checked to determine the level of fitness. Successively, the mod-el derived a good fit with chi-square of 178.571, DF 155 p-value = 0.094 while all criteria were met. See the Table 7.
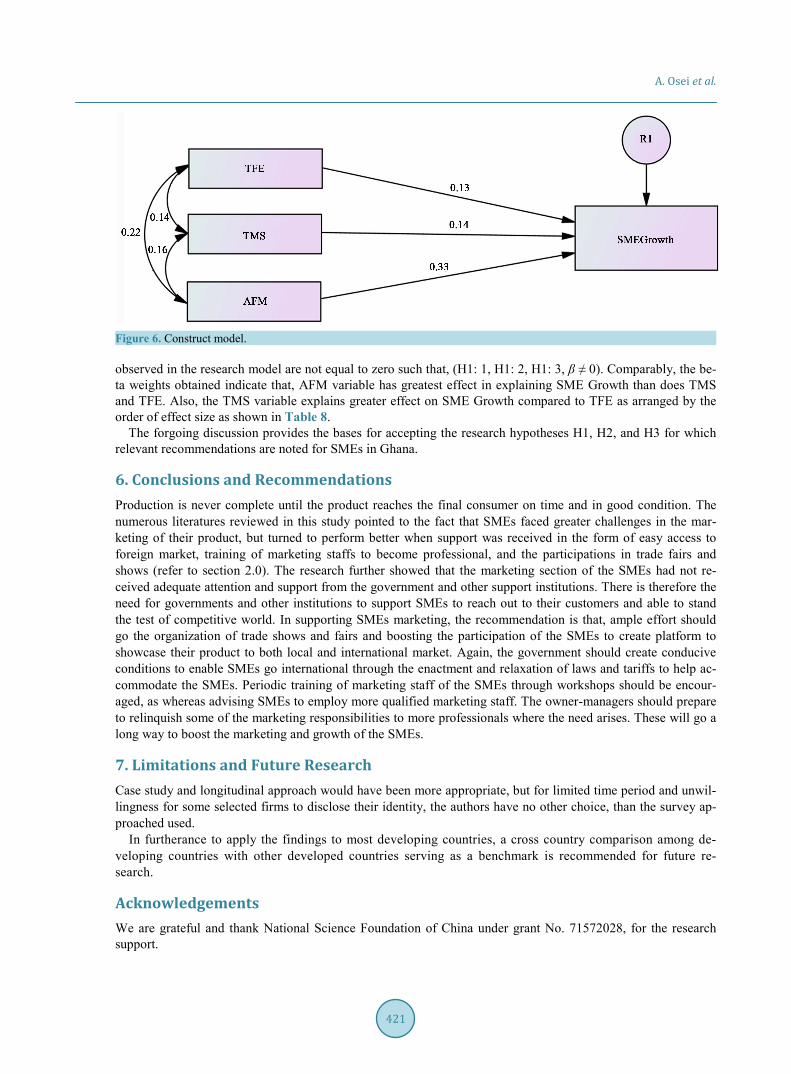
Given the acceptable fitness of the construct model, path estimates were generated for the effect of all predic-tor variables on the outcome variable while age, gender and education were controlled. Convincingly, the analy-sis amply displays the positive relationship between the predictor variables and the criterion variable as sug-gested by Figure 6 and the estimated regression coefficients.
It is noticeable that, for every unit increase in TFE, TMS and AFM, SME Growth will increase by 0.128, 0.144, and 0.332, as predicted by the estimated regression weights in the table above. Thus, approximately, 12.8% of the variability in SME Growth is explained by TFE, 14.4% variability in SME Growth is explained by TMS while 33.2% of the variability in SME Growth is attributable to AFM. Then also it is similarly convincing that, the probability of obtaining high critical ratios of 2.685, 3.049 and 6.953 to less than 0.05, and 0.01 as shown in Table 8. Boldly enough to believe in this shared evidence and to explicitly conclude that, the variability in SMEs Grow is conclusively explainable by the independent variables specified in this model when all other va-riables remain constant. Statistically, the coefficients and their corresponding significant levels derived for the effect of predictors on the outcome variable contest the Null hypotheses that, the slopes of TFE, TMS and AFM on SME Growth is equal to zero (Ho: 1, Ho: 2, Ho: 3, β = 0), such that, these dimensions are not predictors of SME Growth given that, other predictor variables remain unchanged. However, in strongest of terms, the model supports the assumption and the alternative hypotheses that, these independent variables (TFE, TMS and AFM) are significant predictors of SME Growth as exhibited by the regression estimates. In other words, it is certain that, at 0.05 and 0.01 level of significance, there exists enough evidence to conclude that, all the linear effects
Table 7. Goodness of fit test for the construct model.
Chi-square 178.571
Degrees of freedom 155
Probability level 0.094
Observed values Thresholds
Goodness Fit Indices
CMIN/DF 1.152 1 to 3
CFI 0.967 >0.95
RMR 0.024 <0.09
GFI 0.996 >0.95
AGFI 0.94 >0.80
NFI 0.969 >0.90
RMSEA 0.02 <0.05
PCLOSE 0.805 >0.05
Table 8. Standardized regression estimates.
Paths Estimate S.E. C.R. P
SMEGrowth TFE 0.128 0.161 2.685 0.007
SMEGrowth TMS 0.144 0.141 3.049 0.002
SMEGrowth AFM 0.332 0.213 6.953 ***
A. Osei et al.
421
Figure 6. Construct model.
observed in the research model are not equal to zero such that, (H1: 1, H1: 2, H1: 3, β ≠ 0). Comparably, the be-ta weights obtained indicate that, AFM variable has greatest effect in explaining SME Growth than does TMS and TFE. Also, the TMS variable explains greater effect on SME Growth compared to TFE as arranged by the order of effect size as shown in Table 8.
The forgoing discussion provides the bases for accepting the research hypotheses H1, H2, and H3 for which relevant recommendations are noted for SMEs in Ghana.
6. Conclusions and Recommendations Production is never complete until the product reaches the final consumer on time and in good condition. The numerous literatures reviewed in this study pointed to the fact that SMEs faced greater challenges in the mar-keting of their product, but turned to perform better when support was received in the form of easy access to foreign market, training of marketing staffs to become professional, and the participations in trade fairs and shows (refer to section 2.0). The research further showed that the marketing section of the SMEs had not re-ceived adequate attention and support from the government and other support institutions. There is therefore the need for governments and other institutions to support SMEs to reach out to their customers and able to stand the test of competitive world. In supporting SMEs marketing, the recommendation is that, ample effort should go the organization of trade shows and fairs and boosting the participation of the SMEs to create platform to showcase their product to both local and international market. Again, the government should create conducive conditions to enable SMEs go international through the enactment and relaxation of laws and tariffs to help ac-commodate the SMEs. Periodic training of marketing staff of the SMEs through workshops should be encour-aged, as whereas advising SMEs to employ more qualified marketing staff. The owner-managers should prepare to relinquish some of the marketing responsibilities to more professionals where the need arises. These will go a long way to boost the marketing and growth of the SMEs.
7. Limitations and Future Research Case study and longitudinal approach would have been more appropriate, but for limited time period and unwil-lingness for some selected firms to disclose their identity, the authors have no other choice, than the survey ap-proached used.
In furtherance to apply the findings to most developing countries, a cross country comparison among de-veloping countries with other developed countries serving as a benchmark is recommended for future re-search.
Acknowledgements We are grateful and thank National Science Foundation of China under grant No. 71572028, for the research support.

A. Osei et al.
422
References [1] Bennett, R.J. and Robson, P.J.A. (1999) The Use of External Business Advice by SMEs in Britain. Entrepreneurship &
Regional Development, 11, 155-180. http://dx.doi.org/10.1080/089856299283245 [2] Chrisman, J.J. and McMullan, W.D. (2004) Outsider Assistance as a Knowledge Resource for New Venture Survival.
Journal of Small Business Management, 42, 229-244. [3] Massey, C. (2003) Enterprise Assistance: Response from the Public and Private Sectors. Journal of Small Business and
Enterprise Development, 10, 128-135. http://dx.doi.org/10.1108/14626000310473157 [4] Ramsden, M. and Bennett, R.J. (2005) The Benefit of External Support to SMEs: “Hard” versus “Soft” Outcomes and
Satisfaction Level. Journal of Small Business and Enterprise Development, 12, 227-243. http://dx.doi.org/10.1108/14626000510594629
[5] Blackburn, R. (2012) Segmenting the SME Market and Implications for Service Provision: A Literature Review. Re-search Paper Ref., 9, 12.
[6] Bolton, J.E. (1971) Small Firms. Report of the Committee of Inquiry on Small Firms. London: Her Majesty’s Statio-nery Office.
[7] Beck, T. and Robert, C. (2014) Small- and Medium-Sized Enterprise Finance in Africa. Global Economy and Devel-opment Program, 16.
[8] Murphy, S. (2009) Corporate Social Responsibility Initiative. Harvard, 52. [9] OECD (2004) SME Statistics: Towards a More Systematic Statistical Measurement of SME Behaviour. Background
Report for the 2nd OECD Conference of Ministers Responsible for Small and Medium Enterprises (SMEs), 10. [10] Beck, T., Demirgüç-Kunt, V. and Maksimovic, A. (2008) Financing Patterns around the World: Are Small Firms Dif-
ferent. Journal of Financial Economics, 89, 467-487. http://dx.doi.org/10.1016/j.jfineco.2007.10.005 [11] Manuh, T. (1988) The Asantehemaa’s Court and Its Jurisdiction over Women: A Study in Legal Pluralism. Research
Review, 4, 50-66. [12] Netswera, F.G. (2001) Perception of Johannesburg Small Business Operators about Their Small Business Support Sys-
tems. South African Journal of Business Management, 32, 31-37. [13] Verspreet, D. and Berlage, L. (1999) Small Scale Manufacturing Sector in Tanzania: Business Support Services and
the Regulatory Environment. Catholic University of Leuven, Leuven. [14] Scheers, S. and van Radipere, L. (2007) Why Are So Many Managers Not “Managing”? African Journal of Business
Management, 85-91. [15] Marjanova Jovanov, T. and Stojanovski, M. (2012) Marketing Knowledge and Strategy for SMEs: Can They Live
without It? Thematic Collection of Papers of International Significance: “Reengineering and Entrepreneurship under the Contemporary Conditions of Enterprise Business”, 131-143.
[16] Arnolds, C.A. and Venter, D.J.L. (2007) The Strategic Importance of Motivational Rewards for Lower-Level Em-ployees in the Manufacturing and Retailing Industries. SA Journal of Industrial Psychology, 33, 15-23. http://dx.doi.org/10.4102/sajip.v33i3.390
[17] Cant, M. (2012) Challenges Faced by SME’s in South Africa: Are Marketing Skills Needed? International Business & Economics Research Journal, 11, 1107.
[18] Smith, D. (1990) Small Is Beautiful, but Difficult: Towards Cost-Effective Research for Small Business. Journal of the Market Research Society, 32, 37-60.
[19] Cromie, S. (1991) The Problems Experienced by Young Firms. International Small Business Journal, 9, 43-61. http://dx.doi.org/10.1177/026624269100900303
[20] Fariza, H. (2012) Challenges for the Internationalization of SMEs and the Role of Government: The Case of Malaysia. Journal of International Business and Economy, 13, 97-122.
[21] Storey, D.J. and Cressy, R. (1996) Small Business Risk: A Firm Bank Perspective. Centre for Small and Medium Sized Enterprises, Warwick Business School.
[22] Lambrecht, J. and Pimay, F. (2005) An Evaluation of Public Support Measures for Private External Consultancies to SMEs in the Valloon Region of Belgium. Entrepreneurship & Regional Development, 17, 89-108.
[23] Rogerson, C. (2001) In Search of the African Miracle: Debates on Successful Small Enterprise Development in Africa. Habitat International, 25, 115-142. http://dx.doi.org/10.1016/S0197-3975(00)00033-3
[24] Carney, D. (1998) Sustainable Rural Livelihoods, What Contribution Calf Lye Make? DFID, London. [25] BIS (2013) Small and Medium-Sized Enterprise (SME) Journey towards Raising External Finance: A Report by BMG
Research.
A. Osei et al.
423
[26] Wren, C. and Storey, D.J. (2002) Evaluating the Effect of Soft Business Support upon Small Firm Performance. Ox-ford Economic Papers, 54, 334-365. http://dx.doi.org/10.1093/oep/54.2.334
[27] Carey, P. (2008) The Benefit Small and Medium-Sized Enterprises Derive from External Audit. Monash University, Melbourne.
[28] Cassar, G. and Holmes, S. (2003) Capital Structure and Financing of SMEs: Australian Evidence. Accounting & Finance, 43, 123-147.
[29] Lee, G. and McGuiggan, R. (2008) Understanding Small- and Medium-Sized Firms’ Financial Skill Needs. Journal of International Finance and Economics, 8, 93-103.
[30] Shailer, G.E.P. (1999) The Relevance of Owner-Manager Signals and Risk Proxies to the Pricing of Bank Loans. Ac-counting and Business Research, 30, 57-72. http://dx.doi.org/10.1080/00014788.1999.9728924
[31] Shanmugam, B. (1998) Credit Management: The Risk Factor. Armidale N.S.W. 2351, University of New England. [32] OECD (2014) Economic Outlook for Southeast Asia, China and India 2014 beyond the Middle-Income Trap. OECD
Publishing. [33] IMF (2009) Ghana: Poverty Reduction Strategy Paper—2006 Annual Progress Report 09/237. [34] Beck, T., Demirgüç-Kunt, A. and Levine, R. (2005) SMEs, Growth, and Poverty: Cross-Country Evidence. Journal of
Economic Growth, 10, 199-229. http://dx.doi.org/10.3386/w11224 [35] Westhead, P. and Storey, D. (1996) Management Training and Small Finn Performance: Why Is the Link so Weak?
International Small Business Journal, 14, 13-24. http://dx.doi.org/10.1177/0266242696144001 [36] Patton, D., Marlow, S. and Hannon, P. (2000) The Relationship between Training and Small Firm Performance; Re-
search Frameworks and Lost Quests. International Small Business Journal, 19, 11-27. [37] Yesseleva, M. (2013) Professional Advice and Its Possible Effect on Small and Medium-Sized Enterprises’ Access to
External Debt Finance in Australia. Global Business and Management Research: An International Journal, 5, 24-31. [38] Mole, K.M., Hart, S.R. and Saal, D. (2008) Assessing the Effectiveness of Business Support Services in England: Evi-
dence from a Theory Based Evaluation. International Small Business Journal, 27, 557-582. [39] European Union (2007) Sectoral e-Business Policies in Support of SMEs. Innovative Approaches, Good Practices and
Lessons to Be Learned. Final Report of the Study “Benchmarking Sectoral Policy Initiatives in Support of e-Business for SMEs”.
[40] OECD (2012) Financing SMEs and Entrepreneurs 2012: An OECD Scoreboard. OECD Publishing, Paris. [41] Benzazoua, A. and Bouazza, D.A.O.A. (2015) Establishing the Factors Affecting the Growth of Small and Me-
dium-sized Enterprises in Algeria. American International Journal of Social Science, 4, 101-121. [42] Van Scheers, L. (2011) SMEs’ Marketing Skills Challenges in South Africa. African Journal of Business Management,
5, 5048-5056. [43] Murphy, M. (2006) Small Business Management. Financial Times Pitman Publishing, London. [44] Cant, M.C. and Johannes, A.W. (2013) Establishing The Challenges Affecting South African SMEs. International
Business & Economics Research Journal, 12, 707-716. [45] Marjanova, T.J. (2012) Marketing and SMEs: Can an Organization of Any Size Use Marketing Plans? Conference of
the International Journal of Arts & Sciences, 5, 169-173. [46] European Central Bank (2014) Survey on the Access to Finance of Small and Medium-Sized Enterprises in the Euro
Area. European Central Bank. [47] Dun & Bradstreet (1977) The Business Failure Record 1976. Dun & Bradstreet, Inc., New York, 12-13. [48] Kotler, P. and Keller, K.L. (2012) Framework for Marketing Management. Pearson Education, India. [49] European Commission (2007) Supporting the Internationalization of SMEs: Final Report of the Expert Group. Brus-
sels. [50] Barnes, B.R., Chakrabarti, R. and Palihawadana, D. (2006) Investigating the Export Marketing Activity of SMEs Op-
erating in International Healthcare Markets. Journal of Medical Marketing, 6, 209-221. http://dx.doi.org/10.1057/palgrave.jmm.5050033
[51] OECD (2009) Top Barriers and Drivers to SME Internationalisation. Report by the OECD Working Party on SMEs and Entrepreneurship, OECD.
[52] Davidsson, P. and Delmar, F. (1997) High-Growth Firms and Their Contribution to Employment: The Case of Sweden 1987-96. OECD Working Party on SMEs, Paris.
[53] OECD (2008) Review of Innovation Policies in China. OECD Publishing, Paris. [54] Nielsen, P.B. (2008) International Sourcing-Moving Business Functions Abroad. Statistics Denmark.

A. Osei et al.
424
www.dst.dk/publ/InterSourcing [55] Kazimoto, P. (2014) Assessment of Challenges facing Small and Medium Enterprises towards International Marketing
Standards: a Case Study of Arusha Region Tanzania. International Journal of Academic Research in Accounting, Finance and Management Sciences, 4, 303-311.
[56] Gliga, G. and Natasha, E. (2010) Marketing Challenges for High-Tech SMEs. Innovative Marketing, 6, 104-112. [57] Gopalakrishna, S., Lilien, G.L., Williams, J.D. and Sequeira, I.K. (1995) Do Trade Shows Pay Off? Journal of Mar-
keting, 59, 75-83. http://dx.doi.org/10.2307/1252121 [58] CEIR (2014) The Value of Trade Shows Increases with a Plan. [59] Jacobson, D. (1990) Marketers Say They’ll Boost Spending. Business Marketing, 75, 31-32. [60] Schafer, J. (1987) Foreign Trade Shows are a Timely Way to Cut Trade Deficit. Marketing News, 21 (20 November). [61] Lilien, G.L. and Weinstein, D. (1984) An International Comparison of the Determinants of Industrial Marketing Ex-
penditures. Journal of Marketing, 48, 46-53. http://dx.doi.org/10.2307/1251309 [62] AUMA (2013) Successful Participation in Trade Fairs Association. Ausstellungs- und Messe-Ausschuss der Dtsch.
Wirtschaft e.V. [63] Gill, J. and Johnson, P. (1991) Research Methods for Managers. Paul Chapman Publishing Ltd., London. [64] Hussey, J. and Hussey, R. (1997) Business Research: A Practical Guide for Undergraduate and Postgraduate Students.
Macmillan, London. [65] Gartner, W.B. and Birley, S. (2002) Introduction to the Special Issue on Qualitative Methods in Entrepreneurship Re-
search. Journal of Business Venturing, 17, 387-395. http://dx.doi.org/10.1016/S0883-9026(01)00077-5 [66] Saunders, M., Lewis, P. and Thorhill, A. (2007) Research Methods for Business Students. 4th Edition, Pearson Educa-
tion Ltd., New York. [67] Malhotra, N. and Birks, D. (2007) Marketing Research: An Applied Approach. Prentice Hall. [68] Berry, C.R. and William, G.H. (2007) Accountability and Local Elections: Rethinking and Retrospective Voting. The
Journal of Politics, 69, 844-858. http://dx.doi.org/10.1111/j.1468-2508.2007.00579.x [69] Russell, D. (2002) In Search of Underlying Dimensions: The Use (and Abuse) of Factor Analysis in Personality and
Social Psychology Bulletin. Personality and Social Psychology Bulletin, 28, 1629-1646. http://dx.doi.org/10.1177/014616702237645
A. Osei et al.
425
Appendix QUESTIONNAIRES This research work is undertaking to have an insight on the impact of institutional support to SMEs marketing and growth in developing countries with much emphasis on Ghana. All information you provide will be treated as confidential and anonymous, and also will be used for academic research only. Thank you. A TYPES OF MARKETING SUPPORT Please tick (√) the most applicable ones to your business for the last three (3) years (2012-2015). 1. Strongly disagree 2. Disagree 3. Neither agree nor disagree 4. Agree 5. Strongly agree
A Training of marketing staffs 1 2 3 4 5 1 Employing well experienced staffs are too expensive for my business 2 I employ young people from the second cycle schools 3 Training staffs very expensive for my business 4 My marketing staffs are not up to the current techniques 5 My competitors have more competent marketing staffs. 6 There are no workshops for training of marketing staffs 7 The owner of the firm is in charge of marketing B Access to foreign Market 1 2 3 4 5 8 I am aware of the opportunities in trading outside my country 9 I am not familiar with the processes involve in going international
10 My limited finances prevent me going international 11 The taxes and tariffs in international trade is too much 12 My business is too small to go international 13 I don’t have foreign trading partners C Trade fairs and exhibitions 1 2 3 4 5 14 Trade fairs are organized periodically 15 Trade fairs offer me opportunities to showcase my product 16 It is very expensive to participate in trade fairs and exhibitions 17 The venue for the fairs are too far from my business location 18 I know I can gain a lot from attending trade fairs and exhibitions 19 The size of my business is too small to participate in trade fairs
C GROWTH INDICATORS OF SMEs 1 2 3 4 5 20 The business is labor intensive 21 The labor force has increased significantly over the years 22 I employ more relevant experienced people 23 Academic qualification of my employees counts 24 Full time employees are more than part time and contract employees 25 The number of hours worked by employees has increased significantly 26 The output per employee has gone up significantly 27 More capital goes are used in place of labor 28 My wage bill has gone up 29 Employees welfare benefits has gone up 30 There has been a significant increase in total sales 31 The customer base of the business has increased 32 Existing customers has increased their purchases 33 New customers has been recorded 34 Profit has increased due to increase in sales revenue 35 More branches have been opened 36 I access overseas market 37 Dividends to shareholders has increased significantly
A. Osei et al.
426
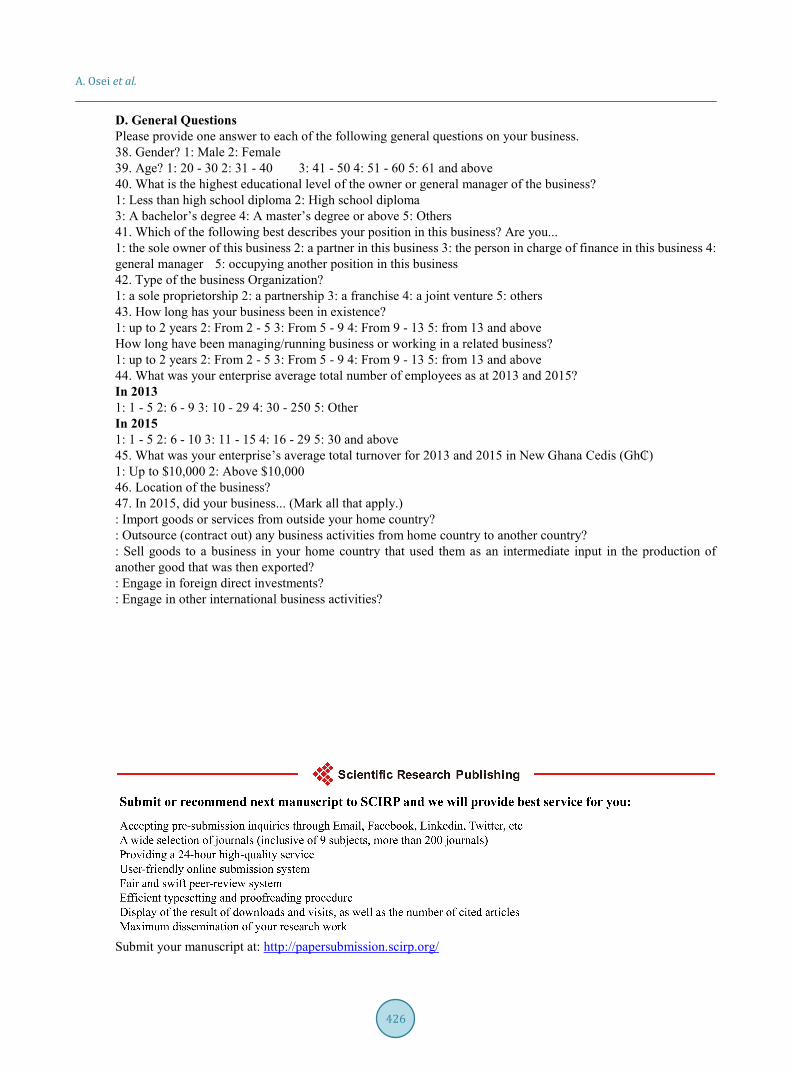
D. General Questions Please provide one answer to each of the following general questions on your business. 38. Gender? 1: Male 2: Female 39. Age? 1: 20 - 30 2: 31 - 40 3: 41 - 50 4: 51 - 60 5: 61 and above 40. What is the highest educational level of the owner or general manager of the business? 1: Less than high school diploma 2: High school diploma 3: A bachelor’s degree 4: A master’s degree or above 5: Others 41. Which of the following best describes your position in this business? Are you... 1: the sole owner of this business 2: a partner in this business 3: the person in charge of finance in this business 4: general manager 5: occupying another position in this business 42. Type of the business Organization? 1: a sole proprietorship 2: a partnership 3: a franchise 4: a joint venture 5: others 43. How long has your business been in existence? 1: up to 2 years 2: From 2 - 5 3: From 5 - 9 4: From 9 - 13 5: from 13 and above How long have been managing/running business or working in a related business? 1: up to 2 years 2: From 2 - 5 3: From 5 - 9 4: From 9 - 13 5: from 13 and above 44. What was your enterprise average total number of employees as at 2013 and 2015? In 2013 1: 1 - 5 2: 6 - 9 3: 10 - 29 4: 30 - 250 5: Other In 2015 1: 1 - 5 2: 6 - 10 3: 11 - 15 4: 16 - 29 5: 30 and above 45. What was your enterprise’s average total turnover for 2013 and 2015 in New Ghana Cedis (Gh₵) 1: Up to $10,000 2: Above $10,000 46. Location of the business? 47. In 2015, did your business... (Mark all that apply.) : Import goods or services from outside your home country? : Outsource (contract out) any business activities from home country to another country? : Sell goods to a business in your home country that used them as an intermediate input in the production of another good that was then exported? : Engage in foreign direct investments? : Engage in other international business activities?
Submit your manuscript at: http://papersubmission.scirp.org/