The impact of influential investors on accounting ...The case of Warren Buffett and Berkshire...
67
Caution: Very Preliminary and Incomplete The impact of influential investors on accounting, governance and investing decisions: The case of Warren Buffett and Berkshire Hathaway Robert M. Bowen PricewaterhouseCoopers & Alumni Professor of Accounting Foster School of Business University of Washington Box 353200, WA 98195 Tel no. 206 543 4569, Fax no. 206 685 9392 Email: [email protected] Shiva Rajgopal* Herbert O. Whitten Endowed Professor Foster School of Business University of Washington Box 353200, WA 98195 Tel no. 206 543 7913, Fax no. 206 685 9392 Email: [email protected] Mohan Venkatachalam Fuqua School of Business Duke University P.O. Box 90120; Durham, NC 27708 Tel: 919 660 7859, Fax no. 919 660 7971 E-mail: [email protected] April 14, 2009 Please do not cite without permission Abstract: Little is known about whether and how influential investors affect the management practices of companies they invest in. To examine whether such investors affect key management practices, we rely on the public statements of a well known and influential investor, Warren Buffett, “the oracle of Omaha,” and test whether investees of Berkshire Hathaway exhibit more timely and transparent financial reporting, stronger governance and superior investing decisions relative to the average firm. Our preliminary findings indicate that, consistent with Buffett’s publicly stated preferences, Berkshire investees generally make transparent conservative accounting and disclosure decisions, measured as timely disclosure of good and bad news, better mapping of accruals to cash flows, voluntary expensing of stock option expense and a lower assumed rate of return on pension assets. In the area of governance, some of Buffett’s preferred compensation practices are followed by BH investees (especially higher CEO pay for performance sensitivity and lower “excess” CEO compensation), but board composition is generally inconsistent with his views. BH investee boards are larger and are no different from the average firm in terms of proportion of outside directors and directors share holdings. Consistent with Buffett’s statements, his investees enjoy substantially higher rates of return on equity, longer periods when firms’ sales growth and ROE growth outperforms their industry, lower volatility in such rates of return, lower leverage and have stock prices that trade closer to their intrinsic values. There is little evidence of change in investees’ practices subsequent to Berkshire’s initial investment. Berkshire’s stock returns outperform the Fama-French four-factor model over 1977-2006, but not over the most recent decade (1997-2006). Berkshire’s equity investments and a portfolio of equity holdings that statistically mimics the attributes that Buffett favors beats the market but not the four-factor model over most of the sample period. *Corresponding author. We acknowledge financial assistance from our respective schools. We thank Feng Li for generously providing us with data on Fog Index. All errors are ours alone.
Transcript of The impact of influential investors on accounting ...The case of Warren Buffett and Berkshire...

Caution: Very Preliminary and Incomplete
The impact of influential investors on accounting, governance and investing decisions: The case of Warren Buffett and Berkshire Hathaway
Robert M. Bowen
PricewaterhouseCoopers & Alumni Professor of Accounting Foster School of Business University of Washington Box 353200, WA 98195
Tel no. 206 543 4569, Fax no. 206 685 9392 Email: [email protected]
Shiva Rajgopal* Herbert O. Whitten Endowed Professor
Foster School of Business University of Washington Box 353200, WA 98195
Tel no. 206 543 7913, Fax no. 206 685 9392 Email: [email protected]
Mohan Venkatachalam
Fuqua School of Business Duke University
P.O. Box 90120; Durham, NC 27708 Tel: 919 660 7859, Fax no. 919 660 7971
E-mail: [email protected]
April 14, 2009 Please do not cite without permission
Abstract: Little is known about whether and how influential investors affect the management practices of companies they invest in. To examine whether such investors affect key management practices, we rely on the public statements of a well known and influential investor, Warren Buffett, “the oracle of Omaha,” and test whether investees of Berkshire Hathaway exhibit more timely and transparent financial reporting, stronger governance and superior investing decisions relative to the average firm. Our preliminary findings indicate that, consistent with Buffett’s publicly stated preferences, Berkshire investees generally make transparent conservative accounting and disclosure decisions, measured as timely disclosure of good and bad news, better mapping of accruals to cash flows, voluntary expensing of stock option expense and a lower assumed rate of return on pension assets. In the area of governance, some of Buffett’s preferred compensation practices are followed by BH investees (especially higher CEO pay for performance sensitivity and lower “excess” CEO compensation), but board composition is generally inconsistent with his views. BH investee boards are larger and are no different from the average firm in terms of proportion of outside directors and directors share holdings. Consistent with Buffett’s statements, his investees enjoy substantially higher rates of return on equity, longer periods when firms’ sales growth and ROE growth outperforms their industry, lower volatility in such rates of return, lower leverage and have stock prices that trade closer to their intrinsic values. There is little evidence of change in investees’ practices subsequent to Berkshire’s initial investment. Berkshire’s stock returns outperform the Fama-French four-factor model over 1977-2006, but not over the most recent decade (1997-2006). Berkshire’s equity investments and a portfolio of equity holdings that statistically mimics the attributes that Buffett favors beats the market but not the four-factor model over most of the sample period.
*Corresponding author. We acknowledge financial assistance from our respective schools. We thank Feng Li for generously providing us with data on Fog Index. All errors are ours alone.
1
The impact of influential investors in accounting, governance and investing decisions: The case of Warren Buffett and Berkshire Hathaway
1.0 Introduction
Short-term pressures on management to sustain overvalued stock prices are often blamed
for the landmark accounting frauds at Enron and WorldCom (Jensen, Murphy and Wruck 2004).
More recently, allegedly myopic over-investment in mortgage backed securities by American
banks led to a credit crunch and arguably the greatest financial crisis to hit the United States since
the great depression. These developments have been blamed on accounting subterfuge, weak
corporate governance and poor investment decisions. Influential investors can potentially
monitor management and affect these decisions. Influential investors are those with substantial
investments and/or substantial credibility and include sovereign wealth funds, private equity
funds, public pension funds such as the California Public Employees' Retirement System
(CALPERS) and powerful individual investors such as Warren Buffett. Such investors are
believed to generally eschew short-term pressures to boost stock price and earnings in favor of
long-term performance.
The rising importance of influential and powerful investors with longer investment
horizons raises several questions about the practices of such investors including (i) What types of
firms do such investors invest in? (ii) Do such investors influence the target firms’ accounting,
governance and investing practices? (iii) Are such investors able to increase shareholder wealth
of targeted firms? (iv) Do targeted firms report superior subsequent operating performance? (v)
Can the model of good governance, accounting and investing espoused by these influential
investors enable us to identify other potential investment targets? Evidence on these questions
would shed light on whether influential investors can serve as an effective monitoring mechanism
and whether other investors can replicate their investment strategy.
In this study, we analyze the common stock investments and influence of a powerful
investor with a long investment horizon: Warren Buffett. Buffett, the Chairman and CEO of
2
Berkshire Hathaway Inc. (BH), is a former student of value investor Benjamin Graham and one
of the most admired and successful investors and managers in the U.S. history. BH is one of the
largest investment funds in the U.S. with a market value as of 3/9/2009 of $131.76 billion.1
We examine the set of accounting, governance and investing practices of BH investees.
We test whether these practices are consistent with Buffett’s public statements and whether BH’s
involvement leads to subsequent improvement in investees’ accounting, governance and investing
decisions. Although Buffett is a vocal advocate of transparency in accounting policies and
governance, he is also a major investor in and serves as a director at Coca-Cola, a company that
spun off 51% of its bottling division to outside shareholders (the “49% solution”) and in the
process tunneled resources from the bottlers and actively managed its reported ROA and leverage
(Atanasov, Black and Ciccotello 2007).2 Further, in June 2008, the SEC asked BH to report “a
more robust disclosure” of factors used to value derivative contracts on which there were billions
of dollars of unrealized mark-to-market losses (Stempel 2008).
While it is interesting to observe whether Buffett invests in firms with relatively
transparent reporting and good governance, it is arguably more important to examine Buffett’s
influence in investee’s practices subsequent to BH’s investment (influential investor hypothesis).
Critics have recently alleged that although Buffett owns a substantial stake in Moody’s, he has
done little to change Moody’s lax credit ratings practices, which many believe contributed to the
ongoing credit crisis (Segal 2009). However, one could counter-argue that BH, on average,
invests in firms with currently optimal accounting, governance and investment practices, so
further changes would not be necessary or expected, ceteris paribus.
1 In comparison, the market value of CALPERS funds stood at $159.9 billion (source: htttp://www.calpers.ca.gov/). 2 Even though the bottler spinoff occurred in 1986, two years before Buffett’s significant investment in Coke, equity-method accounting for the bottlers hinges on the definition of control. Coke’s equity-method treatment has been labeled gimmickry and inappropriate given the strong tacit control Coke exerts over its minority-owned bottlers (Fink 2000; Foust 2004). Presumably, Buffett could have exerted influence on Coke to consolidate their bottlers despite the minority ownership.

3
Finally, we investigate whether BH investees outperform the stock market in subsequent
years and whether BH’s investment strategy can successfully produce abnormal returns when
applied to a set of firms that econometrically resemble BH’s investment portfolio.
It is interesting to study Buffet and BH for three reasons. First, unlike other influential
and successful investors, Buffett’s speeches and writings enable outsiders to obtain an
understanding of his accounting, governance and investing philosophy and to build econometric
models to reflect such thinking. In contrast, most investors, whether influential or not, tend to be
secretive about their investment strategies. Second, Buffett, often described as the “oracle or sage
of Omaha,” is a legendary investor and his influence on accounting, governance and investment
practices are topics that are inherently worthy of academic attention. If an outspoken investor
such as Buffett is effective at improving the accounting, governance and decision-making of BH
investees, it suggests other powerful investors can also influence their investees. Prior research
has considered governance initiatives proposed by powerful investors such as TIAA-CREF
(Carleton, Nelson, and Weisbach 1998), CALPERS (Smith 1996; Prevost and Rao 1996) and
Hermes in the United Kingdom (Becht, Franks, Mayer and Rossi 2008). Third, there is
incomplete consensus on what constitutes “good” accounting or governance practices. For
example, governance scorecards produced by commercial governance rating agencies such as
Institutional Shareholder Services appear to be uninformative and noisy. In contrast, Buffett’s
model of good governance has evolved over a long period of time and flows from a coherent
philosophy of investing and hence, less likely to be a mechanical or a formulaic evaluation of
governance. Buffett’s writings give us an opportunity to model and evaluate what he considers to
be good governance practices. Because of these writings, we are able to test his premise that
influential investors are a way to substantially improve corporate governance.
Consistent with Buffett’s writings about accounting and disclosure practices, our
preliminary findings indicate that Berkshire’s investees often tend to follow more transparent
accounting and disclosure strategies, as measured by timely disclosure of both good and bad

4
news, lower absolute abnormal accruals, better mapping of accruals to cash flows, and lower
assumed rates of return on pension assets. There is some evidence to suggest that Berkshire
investees are more likely to voluntarily expense stock options before the passage of FAS 123R.
However, three findings seem inconsistent with Buffett’s writings in that Berkshire investees are
as likely as the average control firm to (i) rely on pro-forma earnings; (ii) issue earnings
guidance; and (iii) to have annual reports that are relatively difficult to read.
Turning to compensation practices that are consistent with Buffett’s writings, CEOs at
Berkshire investees are paid less and their pay is more sensitive to performance relative to their
counterparts in the control sample. However, inconsistent with Buffett’s writings, there is no
difference between CEO pay at Berkshire investees and the average control firm with regard to (i)
sensitivity of CEO pay to negative performance; (ii) the effect of market wide increases in stock
prices on CEOs’ compensation; (iii) reliance on stock options; (iv) sensitivity to earnings adjusted
for the cost of capital; and (v) the tendency for the firm to boost CEO pay if that CEO’s pay falls
in the lower half of their industry peers in the previous year.
Inconsistent with Buffett’s statements about other governance practices, Berkshire
investees have larger boards than the average control firm. These boards are more likely to have
women but are less likely to have directors of non-Caucasian descent. Also inconsistent with
Buffett’s writings, there is no statistical difference between Berkshire investees and the average
control firm in the number of outside directors and the extent of stock owned by outside directors.
Consistent with Buffett’s writings about investing practices, relative to the average
control firm, Berkshire investments enjoy substantially higher rates of return on equity, longer
periods when firms’ sales growth and ROE growth outperforms their industry, lower volatility in
such rates of return, lower leverage and have stock prices that trade closer to their intrinsic values.
Inconsistent with his statements, Buffett’s investees do not differ from the average firm in terms
of (i) pension and OPEB obligations; and (ii) number of stock splits.
5
In contrast to recent evidence of activism by activist funds such as TIAA-CREF,
CALPERS or Hermes, we find little evidence to suggest that the accounting, compensation and
governance practices change after Buffett buys stock in a company. This result suggests that
Buffett, although influential, is not an activist investor as he seems to prefer picking stocks that
display the attributes he advocates rather than intervening to change his investees’ practices after
purchasing shares.
Next, we turn to an analysis of the stock returns of BH and its investees. Consistent with
Martin and Puthenpurackal (2008) we find that, BH has outperformed the market over the last
three decades. However, BH does not outperform the four-factor Fama-French benchmark
portfolios over the last decade (1997-2006). Turning to BH’s portfolio of publicly traded stocks,
as opposed to BH itself, we find that such a portfolio handily beats the market return but does not
outperform the Fama-French four-factor model for most of the sample period (1987-2006).
Because our attempts to create a mimicking portfolio of stocks that capture investing, accounting
and governance attributes preferred by Buffett are based on BH’s portfolio of publicly traded
stocks, the ability of our mimicking portfolio to outperform benchmark portfolios is limited by
the performance of BH’s portfolio. Accordingly, our mimicking portfolio generates excess
returns relative to the market portfolio but not the four-factor model.
The remainder of the paper is organized as follows. Section 2 we discuss prior literature
and provide background information on Buffett’s philosophy of identifying targets and his views
on what constitutes good governance. In sections 3, 4 and 5 we discuss the accounting,
governance and investing principles and the empirical evaluation of whether BH’s investees
reflect these principles. In section 6 we provide evidence on (i) whether BH’s involvement
changes the accounting, governance and investing decisions of investee firms; and on (ii) whether
applying Buffett’s investing and governance philosophy can identify other mispriced target firms.
Section 7 concludes.
6
2.0 Prior literature and Buffett’s philosophies
2.1 Literature
2.1.1 Models of accounting, governance and investing practices
The finance, accounting and economic literature has not resolved important questions
such as: (i) what are good accounting and disclosure practices? (ii) what is good governance? and
(iii) what are good investing practices? The literature has generally relied on statistical and
economic models to address each question (e.g., see cites in Fields, Lys and Vincent 2001;
Gompers, Ishii Metrick 2007; Bebchuk, Cohen and Ferrell 2009). Such empirical models tend to
favor external over internal validity and are fraught with conceptual and specification problems
and often yield mixed results. We do not discount the value of this approach but, in this paper,
we take an alternative perspective that favors internal over external validity. We investigate the
actions of a successful investor, Warren Buffett, who has spent his career studying these issues
and has invested billions of dollars implementing trading strategies at least partially influenced by
his model of accounting, governance and investing practices. He has massive ‘skin in the game.’
By studying the practices of BH investees, we hope to gain increased internal consistency (one
overall model) at the potential loss of generalizability. Martin and Puthenpurackal (2008) report
abnormal returns of 4% soon after BH invests in a stock, consistent with Buffett having unusually
good insights in his investment decisions and being important to the economy in his own right.
In our view, studying Buffett’s actions and the practices of his investees is an important addition
to the literature.
2.1.2 Influential investors and activism
Recent research in finance has examined the role of influential investors such as pension
funds in the U.S. capital markets. In particular, researchers have studied the kinds of investments
that CALPERS and TIAA-CREF make the types of firms that such funds target for improvement
in governance and whether their actions affect subsequent operating and stock return performance
of the targeted firms (Carleton, Nelson and Weisbach 1998; Smith 1996; Prevost and Rao 1996).
7
However, such investor activism encounters several limitations in that pension funds (i)
themselves suffer from agency problems with respect to their beneficiaries (Coffee 1991); (ii)
churn their portfolios too often and can sell their holdings in a poorly governed firm rather than
stay and fix governance problems (Porter 1992; Bhide 1993); (iii) lack long-term stable
relationships with their investee firms to make credible governance changes, unlike in Japan
(Kojima 1997), and (iv) may have less consistent, more statistics-based investing models over
time relative to Buffett.3 BH arguably suffers fewer agency problems with its investees due to
Buffett’s reputation as a trustworthy steward. For example, he is known for his long-term and
stable relationships with investees (e.g., his investment in Washington Post Company dates back
to 1973). Hence, we believe that focusing on Buffett’s investees should help us understand the
accounting, governance and investing practices of firms with influential investors.
2.1.3 Experts on detecting earnings quality or investing leads
Academic research has long been interested in understanding whether certain experts can
detect red flags in accounting quality or investing leads before the average market participant.
For instance, Foster (1979) investigates the market reaction to new articles written in Barron’s by
Abe Briloff, a renowned commentator on accounting gimmickry, and found a negative return of
8% around the days on which the article appeared. Desai and Jain (2004) researched all the
articles Briloff wrote for Barron’s prior to the year 2000. The authors discovered that the
negative market effect on stocks in response to a Briloff article remained even after one year had
elapsed and might well carry forward over a two-year period.
In the investing domain, several papers have studied the nature of Value Line’s stock
picks and whether such stock picks can time the market (e.g., Shelton 1967; Black 1973, Stickel
1985; Huberman and Kandel 1990). Other papers in this genre include studies of stock picks and
3 “Investors should be skeptical of history-based models. Constructed by a nerdy-sounding priesthood using esoteric terms such as beta, gamma, sigma and the like, these models tend to look impressive. Too often, though, investors forget to examine the assumptions behind the symbols. Our advice: Beware of geeks bearing formulas.” (Buffett’s letter to Berkshire Hathaway shareholders, 2/27/09)
8
market timing by investment newsletters (e.g., Graham and Harvey 1996, 1998, Graham 1999,
Metrick 1999), expert equity recommendations (Barber and Loeffler 1993) and superstar money
managers in Barron’s (Desai and Jain 1995). Warren Buffett is often regarded as more
knowledgeable on accounting, governance and investing matters than several of the
commentators already studied in the academic literature. Hence, we believe that an academic
investigation into his stated “best practices” in the matters of accounting, governance and
investing matters and his stock picks is long overdue.
2.2 Accounting, Governance and Investing Principles
We have compiled Buffett’s views on investing and governance from his speeches to BH
shareholders, some of which have been previously summarized by Cunningham (1998, revised
2001). For expositional ease, we have organized his views into three areas that can be
empirically tested: (a) accounting; (b) governance, and (c) investing/financing decisions. We
reproduce excerpts from his speeches and writings to support each major research hypothesis. In
the ensuing discussion, reference to the year relates to Buffett’s annual letter to BH shareholders.
2.2.1 Accounting practices
Buffett prefers that firms make transparent accounting and disclosure decisions.
“As a corollary, we tell them (the CEOs) that they should not let any of their decisions be affected even slightly by accounting considerations. We want our managers to think about what counts, not how it will be counted.” (1998) “It’s only when the tide goes out that you learn who’s been swimming naked.” (1993) “…suggestions for investors: First, beware of companies displaying weak accounting. If a company still does not expense options, or if its pension assumptions are fanciful, watch out. When managements take the low road in aspects that are visible, it is likely they are following a similar path behind the scenes. There is seldom just one cockroach in the kitchen. … Second, unintelligible footnotes usually indicate untrustworthy management. If you can’t understand a footnote or other managerial explanation, it’s usually because the CEO doesn’t want you to.” (2002)
Buffett supported former SEC Chairman Levitt’s work in cracking down on selective disclosure
(2000). These writings lead to our first main hypothesis cross-sectional (H1a).

9
H1a: BH investees make transparent accounting and disclosure decisions.
In addition to the hypothesis that Buffett may prefer investing in companies with
transparent accounting and disclosure practices, it is plausible that Buffett may either implicitly or
explicitly promote his views and preferences on accounting and disclosure practices to investee
companies subsequent to BH’s initial investment (activism hypothesis). Given Buffett’s long
term investing focus, it is likely that the expected benefits to BH investees from following his
preferred accounting and disclosure practices are greater than the costs of changing the
practice(s). Therefore, the activism hypothesis predicts the accounting and disclosure practices of
BH investees to change over time in the direction of Buffett’s preferences.
HIb: BH investees accounting and disclosure practices become more transparent subsequent to BH’s initial investment.
2.2.2 Governance practices
Buffett advocates good corporate governance in three areas: executive compensation,
board of director practices, and monitoring by outside investors. Examples of his writings in
these areas include:
On executive compensation: “It has become fashionable at public companies to describe almost every compensation plan as aligning the interests of management with those of shareholders. In our book, alignment means being a partner in both directions, not just on the upside. Many “alignment" plans flunk this basic test, being artful forms of "heads I win, tails you lose."”(1994) On directors’ responsibilities to govern executive pay, and their failings to act independently in representing the shareholders: “This costly charade should cease. Directors should not serve on compensation committees unless they are themselves capable of negotiating on behalf of owners. They should explain both how they think about pay and how they measure performance. Dealing with shareholders’ money, moreover, they should behave as they would were it their own.” (2002) On powerful outside investors: “Twenty, or even fewer, of the largest institutions, acting together, could effectively reform corporate governance at a given company, simply by withholding their votes for directors who were tolerating odious behavior. In my view, this kind of concerted action is the only way that corporate stewardship can be meaningfully improved.” (2002)
These statements suggest our second main hypothesis in cross-sectional (H2a) and time-series
(H2b) versions:
10
H2a: BH investees exhibit relatively good corporate governance (as specified by Buffett).
H2b: BH investees exhibit improved corporate governance (as specified by Buffett) subsequent to BH’s initial investment.
2.2.3 Investing and financing practices
We also examine Buffett’s views of good corporate investing and financing practices.
We assume BH’s investees employ these principles.
“The primary test of managerial economic performance is the achievement of a high earnings rate on equity capital employed (without undue leverage, accounting gimmickry, etc.) and not the achievement of consistent gains in earnings per share.” (1979)
This statements leads to our third main hypothesis in cross-sectional (H3a) and time-series (H3b)
versions:
H3a: BH investees make relatively good investment and financing decisions (as specified by Buffett).
H3b: BH investees exhibit improved investment and financing decisions (as specified by
Buffett) subsequent to BH’s initial investment.
3.0 Empirical Methods – Accounting Practices
To clarify which specific accounting practices are favored by Buffett, we create a
taxonomy of his fine-grained comments on accounting policy choices. In particular, we list the
principle he espouses and follow that by a quote or the source. Again, the year in parentheses
refers to the BH annual report in which the quote can be found.
A1: Firms should place less emphasis on EBITDA and pro forma earnings.
A2: Firms should report relatively high earnings quality. “References to EBITDA make us shudder. Why exclude depreciation from earnings? These are real costs that a company incurs.” (2000) “Bad terminology is the enemy of good thinking. When companies or investment professionals use terms such as “EBITDA” and “pro forma,” they want you to unthinkingly accept concepts that are dangerously flawed.” (2001) “Trumpeting EBITDA is a particularly pernicious practice. Doing so implies that depreciation is not truly an expense, given that it is a ‘non-cash’ charge. That’s nonsense. In truth, depreciation
11
is a particularly unattractive expense because the cash outlay it represents is paid up front, before the asset acquired has delivered any benefits to the business.” (2002) A3: Firms should abstain from a) making earnings and growth forecasts and b) trying to meet/beat these forecasts. “.. be suspicious of companies that trumpet earnings projections and growth expectations. Businesses seldom operate in a tranquil, no-surprise environment, and earnings simply don’t advance smoothly (except, of course, in the offering books of investment bankers).” (2002) “Charlie and I think it is both deceptive and dangerous for CEOs to predict growth rates for their companies.” “Charlie and I tend to be leery of companies run by CEOs who woo investors with fancy predictions. A few of these managers will prove prophetic – but others will turn out to be congenital optimists, or even charlatans. 4” (2000) “Charlie and I not only don’t know today what our businesses will earn next year – we don’t even know what they will earn next quarter. We are suspicious of those CEOs who regularly claim they do know the future – and we become downright incredulous if they consistently reach their declared targets. Managers that always promise to “make the numbers” will at some point be tempted to make up the numbers.” (2002) A4: Firms should avoid using restructuring charges to manage earnings. A5: Firms should expense stock option costs before FAS 123-R was enacted. Too long to quote here, Buffett states his opinions in his 1998 letter to BH shareholders on option expensing, earnings management, and the use of restructuring charges to manage earnings. Buffett strongly opposes each of these actions. As an example, Buffett makes a downward adjustment to reported earnings for option expense before making any investment decision. A6: Firms should use relatively conservative pension assumptions. “.. a company still does not expense options, or if its pension assumptions are fanciful, watch out. When managements take the low road in aspects that are visible, it is likely they are following a similar path behind the scenes. There is seldom just one cockroach in the kitchen.” (2002) A7: Firms should use relatively clear and simple explanations in their footnotes. “…suggestions for investors: … Second, unintelligible footnotes usually indicate untrustworthy management. If you can’t understand a footnote or other managerial explanation, it’s usually because the CEO doesn’t want you to.” (2002)
4 Charlie Munger is Vice Chairman of BH and chairman of Wesco Financial Corporation, a majority-owned subsidiary of Berkshire Hathaway. Munger serves on numerous boards representing BH. Buffett characterized Munger as his business partner.

12
3.1 Timely reporting (overall test of H1):
One way to operationalize transparent accounting practices is to test for the timely
disclosure of good news and bad news. Our empirical proxies for reporting timeliness are: i) the
firm-specific measure of the timeliness of reporting bad news relative to good news (CSCORE)
and ii) timeliness of good news (GSCORE), proposed by Khan and Watts (2007). Khan and
Watts rewrite the standard Basu (1997) regression specification to allow coefficients to vary
across firms and over time:
Xi,t/Pi,t-1= β1,t + β2,t Di,t + β3,i,t Ri,t + β4,i,t Di,t Ri,t + ei,t (1)
where i and t are firm and time subscripts, X is earnings, P is price, R is returns (measuring
news), D is a dummy variable equal to 1 when R<0 and equal to 0 otherwise, and e is the
residual. The firm-year good news timeliness measure is β3,i,t. The measure of incremental
timeliness for bad news over good news (i.e., asymmetric timeliness) or firm-year conservatism is
β4,i,t. To estimate the timeliness with which accounting reflects both good news and
conservatism, Khan and Watts (2007) specify that both the timeliness of good news and the
incremental timeliness of bad news are linear functions of time-varying firm-specific
characteristics:
GSCORE (β3,i,t) = μ1,t + μ2,t Sizei,t + μ3,t M/Bi,t + μ4,t Levi,t (2)
CSCORE (β4,i,t) = λ1,t + λ2,t Sizei,t + λ3,t M/Bi,t + λ4,t Levi,t (3)
Empirical estimators of λi and μi, i=1 to 4, are constant across firms, but vary over time.
Substituting equations (2) and (3) into regression equation (1), yields equation (4) below. Cscore
is the firm-year measure of conservatism, while GSCORE is the firm-year measure of good news
timeliness. To compute the CSCORE and GSCORE, we first estimate the following empirical
model in annual cross-sections to get coefficient estimates for μis and λis, where i = 1 to 4, from
the following model:
Xi,t/Pi,t-1 = β1 + β2 Di,t + Ri,t (μ1 + μ2 Sizei,t + μ3 M/Bi,t + μ4 Levi,t) +
Di,t Ri,t (λ1 + λ2 Sizei,t + λ3 M/Bi,t + λ4 Levi,t) + εi,t (4)
13
where, X is measured as net income before extraordinary items; P is market value of equity at the
end of the prior fiscal year; R is annual returns obtained by cumulating monthly returns starting
from the fourth month after the firm’s fiscal year end; Size is measured as natural log of market
value of equity; M/B is market value of equity divided by the book value of equity; and Lev is
long-term debt and debt in current liabilities, deflated by market value of equity. Khan and Watts
(2007) find that firms with higher CSCORE (GSCORE) are also more likely to disclose bad
(good) news early as measured by the Basu (1997) asymmetric timeliness metric.5 We expect
Berkshire firms to have a higher CSCORE and GSCORE.
3.2 Pro-forma reporting (for A1)
Following Doyle et al. (2003), we measure GAAP earnings as earnings per share before
extraordinary items and discontinued operations, using either basic or diluted, depending on the
I/B/E/S primary and diluted indicator (PDI). Again following Doyle et al. (2003), we use I/B/E/S
reported actual earnings per share, unadjusted for stock splits and dividends, as our measure of
“Street” earnings.6 The gap between I/B/E/S earnings and GAAP earnings (PRO_FORMA GAP)
is scaled by split-adjusted stock price at the beginning of the quarter. Firms that report a greater
difference between the I/B/E/S income measure and the GAAP income measure are deemed to
rely more heavily on pro forma type income measures. We expect Berkshire firms to report a
smaller PRO_FORMA GAP.
3.3 Earnings quality (for A2):
Our first measure of earnings quality is based on an approach proposed by Dechow and
Dichev (2002). The principal idea behind Dechow and Dichev (2002) is that earnings quality is
higher when accruals capture more of the variation in current, past and future cash flows.
5 As in Khan and Watts (2007) we also consider an alternate measure for CSCORE and GSCORE after incorporating the main effects (i.e., Size, M/B and Lev) in equation (4). Our inferences are unchanged. 6 We acknowledge that this machine-readable measure of “street earnings” might potentially differ from the hand-collected measure of pro-forma earnings (e.g., Bhattacharya et al. 2003).
14
Dechow and Dichev (2002), supplemented by modifications proposed by Francis et al. (2005)
and McNichols (2002), model the relation between accruals and cash flows as follows:
0 1 1 2 3 1 4 5it it it it it it itTCA CFO CFO CFO REV PPEϕ ϕ ϕ ϕ ϕ ϕ ν− += + + + + Δ + + (5)
where all variables including the intercept are scaled by average assets. TCA is total current
accruals calculated as ΔCA – ΔCL – ΔCash + ΔSTDEBT; ΔCA is change in current assets; ΔCL is
change in current liabilities; ΔCash is change in cash; and ΔSTDEBT is change in debt in current
liabilities. CFO is cash flow from operations computed as IBEX – TCA + DEPN, where IBEX is
net income before extra-ordinary items; and DEPN is depreciation and amortization expense. For
years subsequent to 1987, CFO is obtained from the cash flow statements reported under FAS 95
and TCA is computed as IBEX – CFO +DEPN. ΔREV is change in revenue. PPE is gross value
of property, plant and equipment. Subscripts i and t are firm and time subscripts, respectively.
We estimate equation (5) for every firm-year in each of two-digit sic codes where have at
least 20 firms in year t.7 For firms in the two-digit sic codes without enough observations we
estimate equation (5) with observations in one-digit sic codes. If there are not enough
observations within the one-digit sic code we use the entire sample to estimate the parameters.
Under equation (5), higher accrual quality implies that accruals capture more of the variation in
current, past and future cash flows and as a consequence the firm-specific residual, νit, forms the
basis of the earnings quality proxy used in the study. Specifically, the earnings quality (DDit)
metric is defined as the standard deviation of firm i’s residuals, calculated over years t-4 through t
i.e., DDit = σ(νit-4,t). We interpret larger (smaller) DD as an indication of poor (good) accruals
and earnings quality.
As an alternative measure of earnings quality, we consider the absolute value of the
firm’s abnormal accruals. This measure relies on the idea that changes in a firm’s accruals are
primarily determined by changes in firm fundamentals and in particular changes in revenues and
7 Consistent with Francis et al. (2005), we winsorize the extreme values of the distribution of the
dependent and the independent variables to the 1 and 99 percentiles.
15
changes in property, plant and equipment. If a firm’s accruals deviate significantly from the level
determined by changes in firm fundamentals then such deviations are deemed abnormal and such
abnormal accruals are assumed to reduce the quality of accruals and hence, earnings quality.
To determine our second measure of earnings quality, the absolute value of abnormal
accruals (|ABACC|), we apply the modified Jones’ (1991) model, and estimate the following
regression for each of the years following a similar procedure described above (all variables
including the intercept are scaled by average assets).
0 1 , , 2( )it i t i t it itTA REV AR PPEδ δ δ η= + Δ −Δ + + (6)
where TA = firm i’s total accruals, computed as TCA-DEPN and AR is accounts receivable.8 The
other terms have been defined before. The industry-and year-specific parameter estimates
obtained from equation (6) are used to estimate firm-specific normal accruals (as a percent of
average total assets):
, 0 1 , , 2ˆ ˆ ˆ( )i t i t i t itNA REV AR PPEδ δ δ= + Δ −Δ + (7)
where NA refers to “normal” accruals. We calculate abnormal accruals, ABACC, in year t as TAit
- NAit and treat the absolute value of ABACC as our second proxy for earnings quality. We
interpret higher (lower) values of |ABACC| as measures of lower (higher) earnings quality.
3.4 Earnings guidance and propensity to meet or beat analyst forecasts (for A3)
Our proxy for earnings guidance comes from whether a firm’s management earnings
forecast of quarterly earnings per share is obtained from the First Call database. We code
GUIDANCE as the number of times per year when a firm provides a management forecast.
To determine manager’s success in meeting or beating forecasts, we measure the
proportion of quarters in a year for which the firm manages to meet or beat the analyst consensus
forecast just before the earnings announcement (MEET_BEAT). Because it is difficult to
8 Kothari, Leone and Wasley (2005) suggest that adjusting for firm performance is important when determining abnormal levels of accruals. In sensitivity analysis (unreported) we estimate equation (6) after controlling for firm performance proxied by return on assets. Our inferences are unaffected when we conduct analyses using the accruals obtained by using the modified equation (6).
16
disentangle superior performance from expectations or earnings management we conduct
additional analysis where we determine manager’s propensity to meet or beat expectations by a
very small margin, a penny. That is, we compute the proportion of quarters in which firms
manage to meet or beat the analyst consensus forecast exactly by a penny (SMALL_BEAT). To
ensure reliable measurement, we restrict the sample to firms that have available data on at least
three quarters during a year. We expect Berkshire firms to have smaller coefficients on
GUIDANCE, MEET_BEAT, and SMALL_BEAT.
3.5 Restructuring charges (for A4)
Tracking restructuring charges and their reversals is not immediately feasible from large
machine readable databases. Hence, we do not implement A4. For completeness, we include
propositions in the text that we cannot fully test in order to capture Buffett’s principles as
comprehensively as possible.
3.6 Voluntary expensing of stock options (for A5)
We ascertain whether a firm voluntary expenses the fair value of stock as per FAS 123 by
looking for the inclusion of the firm’s name in the Bear Stearns report identifying such firms
dated 12/14/2004 (EXPENSER). We expect Berkshire firms to have a larger coefficient on
EXPENSER.
3.7 Conservative pension assumptions (for A6)
A manager of a firm with pension assets that are large relative to operating earnings has
an economically meaningful opportunity to manipulate reported earnings. Accordingly, the
primary measure of pension sensitivity is the ratio of income statement effect of pension assets
(i.e., assumed rate of return on pension plan assets multiplied by pension assets) to operating
earnings (PENSENS). This measure implicitly captures the extent to which managements’
assumption about the expected rate of return on pension plan assets can be used as a lever to
manage earnings.
17
An alternative way to measure the extent to which managers are aggressive with assumed
rate of return on pension assets is to perform a regression analysis suggested by Bergstresser,
Desai and Rauh (2006). Specifically, we estimate a regression of the assumed rate of return on
pension assets on the log ratio of pension assets to operating income, BERK dummy and an
interaction term (BERK dummy * log ratio of pension assets to operating income). The variable,
log ratio of pension assets to operating income, captures the extent to which pension rate of return
assumption would influence reported earnings. Therefore, a positive coefficient on this variable
implies greater likelihood of opportunistic pension rate of return assumption. Consistent with
Bergstresser et al. (2006) we predict the coefficient on log ratio of pension assets to operating
income to be positive. If Berkshire investees use more conservative pension rate of returns
assumption, the coefficient on the interaction term should be negative.
3.8 Clear language (for A7)
To evaluate the intelligibility of financial statements, we follow Li (2008) and compute the
FOG INDEX for the text that appears in the annual report of a firm as (words per sentence +
percent of complex words) * 0.4. The intuition, drawn from computational linguistics based on
syntactical textual features is that, all else equal, more syllables per word or more words per
sentence make a more difficult to read and interpret. Relative to the average control firm, we
expect Berkshire investees’ annual reports to be easier to read and thus to have a lower coefficient
on FOG INDEX.
3.9 Sample
We obtain a list of Berkshire’s holdings every calendar quarter during the period 1980 to
2006 from CDA/Spectrum Institutional Money Manager Holdings database, which is based on
Form 13F filings with the SEC. Institutional investment managers are required to file a 13F if
their aggregate investments (publicly traded equity, in our case) at the end of a calendar month
exceed $100 million. The reporting requirement mandates that all securities with 10,000 shares
or an aggregate fair market value of $200,000 are required to be filed with the SEC. However,

18
institutional investment managers may request confidential treatment of certain securities
ordinarily reported on Form 13F and Berkshire is known to have asked for such privilege.
CDA/Spectrum database does not backfill data on delayed investment disclosure due to the
confidentiality treatment. Hence, our sample is likely to be skewed in favor of less-secret
Berkshire holdings.
We initially identify a sample of 624 firm year observations (and 206 unique firms)
representing Berkshire Holdings between 1980 and 2006. Table 1 presents information about the
sample by year. The average number of Berkshire holdings per year, as per column (2), is 23.11
while the median holding is 14 stocks. The discrepancy between the average and median holding
is influenced by 1980 where Berkshire holds 112 stocks. However, when we restrict our attention
to investments in which Berkshire holdings at least 5% of the target firm’s equity, the number of
1980 holdings falls to 13, suggesting that most of the 112 stocks in 1980 represented small
investments. We report results in the paper for the complete sample. We have replicated all the
regressions reported in the paper for holdings representing 5% or more of the target firm’s equity
but we do not tabulate these results for parsimony.
Our control sample for the regressions comprises of all available firms in the Compustat
universe during the same time period. To be clear, proxies for the accounting, governance and
investing principles for Berkshire investees are examined for all available years during the period
Berkshire invests (or retains his investment) in the target firm. We have ensured that the holding
company Berkshire Hathaway has been deleted from the sample. We discuss cross-sectional
evidence on accounting, governance and investing practices related to H1a, H2a and H3a in the
following sections. Evidence related to H1b, H2b and H3b representing the time-series tests to
assess whether practices change after Buffett’s investment in companies is delayed until section
5.
19
3.10 Results on accounting practices
We begin by presenting univariate data in panel A of Table 2 on the accounting practices
espoused by Buffett. To confirm these univariate results, we estimate a multivariate regression of
each accounting practice variable on an intercept, BERK dummy and year dummies and industry
dummies based on two-digit SIC codes. We cluster the standard errors by firm to account for any
serial correlation in error terms. We tabulate the coefficient on BERK in panel B of Table 2.
Because of the numerous analyses in the paper, to provide a quick overview we have summarized
all our findings in the Appendix.
Panel A shows that Berkshire investees report statistically higher GSCORE and
CSCORE measures (0.051 and 0.601) relative to the average Compustat firm (0.029 and 0.370
respectively) suggesting that Berkshire investees report both good and bad news earlier than the
average firm (t-statistics of 10.92 and 14.97 respectively). The multivariate results in panel B are
similar. Turning to PRO_FORMA GAP we find no statistical difference between Berkshire
investees and the average control firm. This is somewhat surprising given Buffett’s strong
statements against reliance on EBITDA and other non-GAAP earnings measures. However, we
acknowledge that we rely on a proxy for pro-forma earnings (I/B/E/S street earnings) as opposed
to an actual measure of pro-forma earnings itself (as in Bhattacharya et al. 2003).
Recall that lower values of both the DD and |ABACC| measures suggest higher quality
earnings. The univariate data in Table 2 indicates that Berkshire investees have higher quality
earnings as the DD measure is 0.025 relative to 0.049 for the average control firm (t-statistic for
the difference is 11.04). Similarly, the absolute value of abnormal accruals for Berkshire
investments is smaller at 0.032 relative to 0.068 for the average firm (t-statistic for the difference
is 10.18). The multivariate results reported in panel B are consistent with the univariate results.
Although the univariate data in panel A suggest that Berkshire investees provide
guidance more often than the average control firm (about 4 times a year for Berkshire firms
versus 2.6 times a year for the control firms), this difference disappears in the multivariate

20
version reported in panel B. It is noteworthy, however, that despite Buffett’s distaste for earnings
guidance, his investees seem to guide as often as the control firms. Surprisingly, Berkshire firms
are more likely to meet or beat the analyst consensus estimate (70.74% relative to 63.17% for
MEET_BEATS). However, there is no statistical difference in the proportion of
SMALL_BEATS between the two samples (18.98% versus 17.17%) suggesting that most of
Berkshire investees’ propensity to beat earnings estimates by a wide margin are more likely
attributable to superior performance, as opposed to earnings or expectations management. The
univariate data indicate that Berkshire investees are more likely to voluntarily expense options
(43.3% versus 31.3%) although the multivariate results reported in panel B are much weaker as
the coefficient on BERK is 0.030 (p-value = 0.09, one-tailed).
The pension sensitivity (PENSENS), i.e., the proportion of income effect from pension
assumptions relative to operating income is significantly lower for Berkshire investees (0.119
relative to 0.222 for control firms, t-statistic for the difference is -6.11). This is consistent with
less opportunistic manipulation of pension rate of return assumptions by Berkshire investees.
Results in Panel C further corroborate this finding. The coefficient on the Log (Pension
assets/operating income)*BERK is negative and marginally significant (-0.173, p-value = 0.06,
one-tailed) suggesting that the sensitivity of operating income to changes in the assumed rates of
return is smaller for Berkshire firms and hence less susceptible to upward earnings management
via increases in assumed rate of return on pension assets. Surprisingly, there is no statistical
difference between the readability of the annual reports of Berkshire firms compared to the
average control firm as measured by the FOG INDEX.
Tentatively, pending further analyses, our evidence suggests that Berkshire investees tend
to make relatively transparent and conservative disclosures, i.e., they generally practice what
Buffett preaches. In addition, our results on the accounting and disclosure practices of Berkshire
investees are consistent with the notion that the measures used to detect earnings management
and voluntary disclosure in our literature capture economically meaningful phenomena. Several

21
scholars question the empirical validity of the measures used to detect earnings management such
as discretionary accruals or tendency to meet or beat earnings benchmarks (see Guay, Kothari and
Watts 2005; Durtshci and Easton 2005).
4.0 Empirical Methods - Governance and Compensation Principles
CEO Compensation
In this section, we identify specific governance principles that Buffett advocates and
describe the empirical measurement of these principles.
B1: Senior executives should not be “excessively” compensated. B2: Pay for executives ought to be characterized by greater pay-for-performance sensitivity. B3: Pay for executives should be less subject to overall upward creep (Lake Woebegone effect).9 “The deck is stacked against investors when it comes to the CEO's pay. Outlandish 'goodies' are showered upon CEOs simply because of a corporate version of the argument we all used when children: 'But, Mom, all the other kids have one.'” (2006) “The upshot is that a mediocre-or-worse CEO – aided by his handpicked VP of human relations and a consultant from the ever-accommodating firm of Ratchet, Ratchet and Bingo – all too often receives gobs of money from an ill-designed compensation arrangement.” (2006) B4: Pay for executives ought to be more sensitive to negative performance “If able but greedy managers over-reach and try to dip too deeply into shareholders’ pockets, directors must slap their hand.” (2002) On directors’ responsibilities to govern executive pay, and their failings to act independently in representing the shareholders: “This costly charade should cease. Directors should not serve on compensation committees unless they are themselves capable of negotiating on behalf of owners. They should explain both how they think about pay and how they measure performance. Dealing with shareholders’ money, moreover, they should behave as they would were it their own.” … “Directors should stop such piracy. There’s nothing wrong with paying well for truly exceptional business performance. But, for anything short of that, it’s time for directors to shout ‘Less!’ It would be a travesty if the bloated pay of recent years became a baseline for future compensation. Compensation committees should go back to the drawing boards.” (2002)
9 Lake Wobegone is the fictional Minnesota town in the radio series A Prairie Home Companion by Garrison Keillor, where "all the women are strong, all the men are good-looking, and all the children are above average." Applied in this context, escalation in executive compensation occurs when executives are considered above-average.
22
“It has become fashionable at public companies to describe almost every compensation plan as aligning the interests of management with those of shareholders. In our book, alignment means being a partner in both directions, not just on the upside. Many “alignment" plans flunk this basic test, being artful forms of "heads I win, tails you lose." (2002) B5: Pay ought to be more sensitive to sensitive to earnings net of cost of capital. A common form of misalignment occurs in the typical stock option arrangement, which does not periodically increase the option price to compensate for the fact that retained earnings are building up the wealth of the company. Indeed, the combination of a ten-year option, a low dividend payout, and compound interest can provide lush gains to a manager who has done no more than tread water in his job. A cynic might even note that when payments to owners are held down, the profit to the option-holding manager increases.” (1994) As Buffett explains, however, simply by retaining and reinvesting earnings, managers can report annual earnings increases without so much as lifting a finger to improve real returns on capital (Cunningham, page 6). Buffett emphasizes that performance should be the basis for executive pay decisions. Executive performance should be measured by profitability, after profits are reduced by a charge for the capital employed in the relevant business or earnings retained by it. (Cunningham page 6) B6: Firms ought to rely less on stock options to pay executives “Better yet, as at Berkshire, stock options should simply not be part of an executive's compensation.” (Cunningham, page 6)
4.1 CEO excess compensation (for B1)
“Excess” compensation is notoriously difficult to measure. However, we attempt to
measure abnormal compensation after accounting for several economic determinants of
compensation. In particular, we regress the natural logarithm of annual compensation, defined as
the sum of salary, actual bonus, target long-term incentive plan payments, pension contributions
and other perquisites, the Black-Scholes value of stock option grants, and the market value of
restricted and unrestricted stock grants, on several economic determinants such as firm size (using
the natural logarithm of market capitalization), stock return performance, operating performance
(return on assets), investment opportunity set (market-to-book), risk (measured as the log of the
standard deviation of returns), leverage, CEO’s age, CEO tenure with the firm, new CEO dummy,
the existing portfolio of stock and options measured as the natural logarithm of one plus the
intrinsic value of the CEO’s equity portfolio of stock, restricted stock, and option holdings (both

23
vested and unvested), along with industry dummies and year fixed effects dummies to control for
differences in pay levels across industries and time (Murphy 1999). We also insert a dummy
variable, BERK, set to one if the firm is a BH investee in that firm-year and zero otherwise. In
particular, we employ the following parsimonious specification to investigate several
compensation related propositions in the paper:
Ln (annual compensation)jt = β0 + β1 Returns-firmit + β2 Returns-markett + β3 BERK jt + β4 Returns-firmit * BERK jt + β5 Returns-marketit * BERK jt + β6 Negdum jt (8) + β7 Negdum jt *BERK jt + β8 Ln Market Cap jt + β9 ROAit + β10 Market-to-bookit +β11 Ln standard deviation of returnsit + β12 Leverageit + β13 CEO ageit
+ β14 CEO tenurejt + β15 New CEOjt + β16 Ln (CEO’s stock and option portfolio)jt + Industry dummiesj + Year dummiest + error jt.
A negative coefficient, β3, on BERK in equation (8) would suggest that CEOs at BH investees
draw relatively less “excessive” compensation, after accounting for economic factors and
executive specific variables known to affect annual compensation.
4.2 Greater pay-for-performance sensitivity (for B2)
In equation (8) above, β2 captures pay-for-performance sensitivity (PPS) for the sample
as a whole whereas coefficient β4, on the interaction term Returns-firm*BERK, represents the
PPS for the Berkshire investee sample. We expect β4 to be positive, consistent with CEO
compensation for Berkshire firms being relatively more sensitive to firm performance.
4.3 Sensitivity to negative stock market performance (for B4)
To explore the sensitivity of compensation to negative stock market performance, we
incorporate a dummy variable, Negdum, in equation (8) to identify cases where firms’ stock
returns are negative. Coefficient on this variable, β6, captures the sensitivity of compensation to
negative stock returns and predicted to be negative. The coefficient on the interaction of
Negdum*BERK, β7, captures the incremental sensitivity of negative returns for Berkshire firms.
Consistent with the predictions earlier, β7 is expected to be negative.
24
4.4 Payout sensitivity to earnings net of cost of capital (for B5)
Following Frankel and Lee (1998), we measure earnings net of the cost of capital as
“abnormal” and measure abnormal earnings as the difference between earnings per share scaled
by the opening book value of equity (eps/bvt-1) and the cost of capital defined as the two
industry-based discount rates computed by Fama and French (1997). We insert abnormal
earnings as an independent variable in equation (8) and use the coefficient on such abnormal
earnings as a measure of the sensitivity of senior managers’ pay to earnings that build wealth in
excess of the cost of capital.
4.5 Reliance on stock options (for B6)
We measure a firm’s reliance on stock options in its compensation as the ratio of the
Black-Scholes value of annual option grants to annual compensation, which is measured as the
sum of salary, actual bonus, target long-term incentive plan payments, pension contributions and
other perquisites, the Black-Scholes value of stock option grants, and the market value of
restricted and unrestricted stock grants (%OPTIONS).
4.6 Lower Lake Woebegone effect (for B3)
We test for the Lake Woebegone effect, i.e., increase in CEO compensation merely to
compensate for below average salary, in two ways. First, in equation (8), we evaluate whether
coefficient β5, which captures the sensitivity of annual compensation to overall market wide
performance, is negative. A negative coefficient is consistent with Berkshire investees not
rewarding CEOs for a market wide increase in stock prices.
Second, we adapt the specification in Bizjak et al. (2008) and regress change in annual
compensation on several control variables, a dummy variable, LOWCOMP, that takes the value
one if the CEO was below the median compensation of his peer group (i.e., below median
compensation of his size and industry counterparts) for the previous year, and an interaction term
LOWCOMP*BERK. Bizjak et al. (2008) find that CEOs whose compensation fall below their
peer group in the previous year, receive a pay hike relative to their counterparts whose pay is

25
above the peer group median, consistent with the Lake Woebegone effect. Using the
specification employed by Bizjak et al. (2008), we expect a positive coefficient on LOWCOMP
and a negative coefficient on LOWCOMP*BERK in equation (9):
Log(annual compensationit /annual compensationit-1) = β0 + β1 Returns-firmit + β2 Returns-markett + β3 BERK jt +β4 LOWCOMPit + β5 LOWCOMP*BERKit+ β6 Ln Market Cap jt + β7ΔROAit + β8 Log (Salesit / Sales it-1)+ Industry dummiesj+ Year dummiest + error jt. (9)
Board Structure
Internal monitoring-Board of directors B7: Boards ought to be a) small in size and b) composed mostly of outside directors. The most common situation, however, is a corporation without a controlling shareholder. This is where management problems are most acute, Buffett says. It would be helpful if directors could supply necessary discipline, but board congeniality usually prevents that. To maximize board effectiveness in this situation, Buffett believes the board should be small in size and composed mostly of outside directors. The strongest weapon a director can wield in these situations remains his or her threat to resign. (Cunningham article, page 5) B8: Firms ought to hold executive sessions with independent directors “These social difficulties argue for outside directors regularly meeting without the CEO – a reform that is being instituted and that I enthusiastically endorse.” – 2002 Holding regular meetings without the chief executive to review his or her performance would be a marked improvement in corporate governance (Cunningham article, page 5). B9: Directors ought to own more stock “We now have eleven directors and each of them, combined with members of their families, owns more than $4 million of Berkshire stock. In addition, director fees are nominal. Thus, the upside from Berkshire for all eleven is proportionately the same as the upside for any Berkshire shareholder. And it always will be. The bottom line for our directors: You win, they win big; you lose, they lose big. Our approach might be called owner-capitalism. We know of no better way to engender true independence.” – 2003 B10: Directors’ compensation ought to be less dependent on fees. In general, Buffett feels there is an overall lack of board independence. Too often directors rely too heavily on board fees as a source of income. When this happens, directors are too worried about pleasing management so they can remain on the board and so they get a good reputation in the business community. This good reputation may lead to further board appointments, which is important to the director who relies on board fees as a material source of income. As a result, the main factor in determining director independence, in Buffett’s opinion, is how much their board fees are, relative to other sources of income. (Cunningham)

26
External monitoring by block holders B11: Buffett would prefer to see more coordinated institutional activism to improve corporate governance. B12: Firms ought to pick CEOs that will perform capably regardless of weak structural restraints. The best solution, Buffett instructs, is to take great care in identifying CEOs who will perform capably regardless of weak structural restraints. (Cunningham article, page 4) “When the manager cares deeply and the directors don’t, what’s needed is a powerful countervailing force – and that’s the missing element in today’s corporate governance. Getting rid of mediocre CEOs and eliminating overreaching by the able ones requires action by owners – big owners. The logistics aren’t that tough: The ownership of stock has grown increasingly concentrated in recent decades, and today it would be easy for institutional managers to exert their will on problem situations. Twenty, or even fewer, of the largest institutions, acting together, could effectively reform corporate governance at a given company, simply by withholding their votes for directors who were tolerating odious behavior. In my view, this kind of concerted action is the only way that corporate stewardship can be meaningfully improved.” (2002) B13: Firms’ directors ought to be chosen for their business savvy, their interest and owner-orientation and not necessarily for adding diversity or prominence to a board. Outstanding CEOs do not need a lot of coaching from owners, although they can benefit from having a similarly outstanding board. Directors therefore must be chosen for their business savvy, their interest, and their owner-orientation. According to Buffett, one of the greatest problems among boards in corporate America is that members are selected for other reasons, such as adding diversity or prominence to a board. (Cunningham article, page 4) 4.7 Board size and outside directors (for B7)
We obtain data on board size (BOARD SIZE) and the proportion of directors that are
outsiders (OUTSIDERS%) from the Directors data set compiled by IRRC (Investor
Responsibility Research Center). We predict BOARD SIZE to be smaller and OUTSIDER% to
be larger for Berkshire investees.
4.8 Executive sessions (for B8)
We could not identify a machine-readable database to assess whether the board of a
company holds executive sessions. Hence, we do not test this hypothesis.

27
4.9 Stock held by directors and fee income (for B9 and B10)
We rely on the Directors data set compiled by IRRC to compute the proportion of stock
owned by directors (DIRECTOR OWN%). Unfortunately, data on directors’ compensation is
only available for three years in our sample period (2005, 2006 and 2007). Hence, testing
Buffett’s principles related to fees is not feasible.
4.10 Coordinated activism and CEO selection (for B11 and B12)
Because coordinated activism by institutional owners and the CEO selection are relatively
rare events in a large sample of firms, we do not implement Buffett’s recommendations B11 and
B12.
4.11 Diverse or prominent board members (for B13)
To proxy for diversity in board membership, we use the percentage of females
(%FEMALE) and the proportion of ethnic minorities of non-Caucasian descent on the board
(%ETHNIC). Both variables are obtained from IRRC Directors database. Consistent with
Buffett’s writings we predict both variables to be lower for Berkshire investees. Prominence of
board membership is more difficult to obtain from machine-readable databases. Even if we were
to hand collect this data, the subjective nature of this variable is likely to manifest in significant
measurement error.
4.12 Results - Compensation and Governance
Although the overall annual compensation levels are much higher at BH firms on a
univariate basis ($9.5 million versus $4.5 million; results not tabled), multivariate results reported
in Table 3 show that the coefficient on BERK is negative and significant (-0.301, t-statistic = -
2.32). That is, CEOs of BH investees are paid less than the average control firm after controlling
for several factors known to affect compensation levels. BH investees report significantly higher

28
pay-for-performance sensitivity, as evidenced by the positive and significant coefficient 0.446 on
Returns-firm*BERK in Table 3.10
There is no evidence to suggest that either Berkshire firms or control firms filter out the
effect of market wide increases in stock prices from their CEOs’ compensation (coefficient on
Returns-market and Returns-market*BERK is not significant). Note that pay does not appear to
be sensitive to ROA as the coefficient on ROA is statistically insignificant (t-statistic = -0.53).
Untabulated results show that compensation is not sensitive to abnormal earnings in the entire
sample or for Berkshire firms, inconsistent with B5. Although CEO pay for the average control
firm falls when stock returns turn negative (coefficient on Negdum is -0.152, t-statistic = -7.60),
CEOs at Berkshire firms do not seem to be incrementally affected in downturns (coefficient on
Negdum*BERK is weakly positive).
Results (untabulated) suggest that there is no statistical difference in the reliance on stock
options as a proportion of the CEO’s annual compensation between Berkshire firms and the
control firms. Results presented in Table 4 indicate that if the CEO belonged to the below-
median group in terms of pay, he/she is likely to get a pay hike in the following year (coefficient
on LOWCOMP is 0.518, t-statistic = 32.27), there is no evidence that such a Lake Woebegone
effect is any different at Berkshire firms (coefficient on LOWCOMP*BERK is insignificant). In
sum, although Berkshire firms are associated with lower “excess” pay and higher PPS, several of
the nuanced compensation principles espoused by Buffett do not appear to be practiced at
Berkshire investees.
Turning to governance variables, boards at Berkshire firms are larger, inconsistent with
our prediction. On average, Berkshire firms have 11.4 board members relative to 9.5 members
for control firms. This results hold in the multivariate analysis (the coefficient on BOARD SIZE
10 In untabulated results, we control for other forces that influence the pay-for-performance sensitivity by interacting returns with firm size and variability of returns in equation (8), consistent with Baker and Hall (2000) and Aggarwal and Samwick (1999). However, our inferences remain unchanged.

29
in panel B is 1.37, t-statistic =3.18). Berkshire firms have more women but fewer ethnic
members (the coefficient on %FEMALE is 0.027, t-statistic =2.18; coefficient on %ETHNIC is -
0.092, t-statistic = 25.96). There is no statistical difference between Berkshire firms and the
average control firm in terms of the proportion of outsiders on the board and the extent of stock
owned by directors. In sum, governance principles espoused by Buffett that we can test do not
appear to be practiced at Berkshire investees.
5.0 Investing Principles
Types of Businesses
C1: BH investments provide consistent profits from stable uncomplicated businesses “Severe change and exceptional returns usually don’t mix” (1987) Buffett’s approach is “very much profiting from lack of change. That’s the kind of business I like.” (Business Week July 5, 1999) “Charlie and I have not learned how to solve difficult problems. What we have learned is to avoid them. To the extent that we have been successful, it is because we concentrated in identifying one-foot hurdles that we could step over rather than because we have acquired any ability to clear seven-footers.” (1989) C2: BH prefers investments with enduring long term competitive advantages “We like stocks that generate high returns on invested capital where there is a strong likelihood that it will continue to do so.” (1995) “I look at long-term competitive advantage and whether that’s something that’s enduring.” (St. Petersburg Times, December 15, 1999) “The key to investing is determining the competitive advantage of any given company and, above all, the durability of that advantage. The products or services that have wide, sustainable moats around them are the ones that deliver rewards to investors.” (Fortune, November 22, 1999). “Look for the durability of a franchise. The most important thing to me is figuring out how big a moat there is around the business. What I love, of course, is a big castle and a big moat with piranhas and crocodiles.” (U.S. News and World Report, June 20, 1994). “The definition of a great company is one that will be great for 25 or 30 years.” (1996).
30
C3: BH wants companies with extra cash but below-average investment returns to repay such cash to its investors “A company that provides average or below-average investment returns but generates cash in excess of its needs has three options: (1) It can ignore the problem and continue to reinvest at below average rates, (2) it can buy growth, or (3) it can return the money to shareholders. It is here that management will behave rationally or irrationally (Hagstrom 1997, page 81). “In Buffett's mind, the only reasonable and responsible course for companies that have a growing pile of cash that cannot be reinvested at above-average rates is to return that money to shareholders by raising the dividend, or buying back shares.” (Hagstrom 1997, page 85). C4: BH firms are characterized by higher “owner earnings” relative to comparable companies ‘Owner earnings’ is a measure Buffett uses for firm valuation, rather than GAAP figures. Owner earnings = (reported earnings) + (depreciation, depletion, and amortization) – (average annual amount of capitalized expenditures for plant and equipment, etc. that the business needs to fully maintain its long-term competitive position and unit volume). (Chapter 5, Cunningham) It is common on Wall Street to value businesses using a calculation of cash flows equal to (a) operating earnings plus (b) depreciation expense and other non-cash charges. Buffett regards that calculation as incomplete. After taking (a) operating earnings and adding back (b) non-cash charges, Buffett argues that you must then subtract something else: (c) required reinvestment in the business. Buffett defines (c) as "the average amount of capitalized expenditures for plant and equipment, etc., that the business requires to fully maintain its long-term competitive position and its unit volume." Buffett calls the result of (a) + (b) - (c) "owner earnings." (Cunningham SSRN article, page 16) “Thus our first lesson: businesses logically are worth far more than net tangible assets when they can be expected to produce earnings on such assets considerable in excess of market rates of return. The capitalized value of this excess return is economic goodwill.” (Chapter 5, Cunningham) C5: BH investments are characterized by consistently high return on equity capital employed after controlling for undue leverage and accounting gimmickry. C6: BH investments are characterized by relatively low leverage. “The primary test of managerial economic performance is the achievement of a high earnings rate on equity capital employed (without undue leverage, accounting gimmickry, etc.) and not the achievement of consistent gains in earnings per share (1978). C7: BH favors companies that, ceteris paribus, rely less on net tangible assets to produce earnings. “Ultimately, business experience, direct and vicarious, produced my present strong preference for businesses that possess large amounts of enduring goodwill and that utilize a minimum of tangible assets.” (Chapter 5, Cunningham) In inflationary times, buying firms which rely on fewer net tangible assets to produce earnings is the best and cheapest way to grow. (Chapter 5, Cunningham)

31
C8: BH avoids investing in firms with high OPEB and pension liabilities. “In making acquisitions, Charlie and I have tended to avoid companies with significant post-retirement liabilities. As a result, Berkshire’s present liability and future costs for post-retirement health benefits – though we now have 22,000 employees – are inconsequential.” (Chapter 5, Cunningham) C9: BH firms are characterized by few stock splits. “Berkshire's common stock was priced in the market at nearly $50,000 per share and the company's book value, earnings, and intrinsic value have steadily increased well in excess of average annual rates. Yet the company has never effected a stock split, and has not paid a cash dividend in three decades.”(Cunningham SSRN article, page 13) Intrinsic Value C10: BH firms prefer stock prices to trade around their intrinsic value. Unlike many CEOs, who desire their company's stock to trade at the highest possible prices in the market, Buffett prefers Berkshire stock to trade at or around its intrinsic value—neither materially higher nor lower. Such linkage means that business results during one period will benefit the people who owned the company during that period. Maintaining the linkage requires a shareholder group with a collective long-term, business-oriented investment philosophy, rather than a short-term, market-oriented strategy. (Cunningham SSRN article, page 11). C11: BH firms’ share-purchases are made only when the prevailing stock price is lower than the intrinsic value per share. “There are too many share repurchases these days, and sometimes for the wrong reasons. Managers often make repurchases in an effort to support the stock price, even when they are paying an amount in excess of the share’s intrinsic value.” (1999) Berkshire retains and reinvests earnings when doing so delivers at least proportional increases in per share market value over time. It uses debt sparingly and sells equity only when it receives as much in value as it gives. (Cunningham SSRN article) C12: BH firms issue equity when the intrinsic value per share is at least as high as the offer price per share. BH firms are involved in stock-for-stock mergers only when its stock price is greater than or equal to its intrinsic value. BH prefers undervalued firms to buy back stock rather than acquire companies “If the worst thing to do with undervalued stock is to use it to pay for an acquisition, the best thing is to buy it back. Obviously, if a stock is selling in the market at half its intrinsic value, the company can buy $2 in value by paying $1 in cash. There would rarely be better uses of capital than that. Yet many more undervalued shares are paid to effect value-destroying stock acquisitions than are repurchased in value enhancing stock buy-backs.” (Cunningham SSRN article, page 14).
32
C13: BH’s acquisitions involve small acquisition premiums. Contrary to common practice, Buffett argues that in buying all of a business, there is rarely any reason to pay a premium. The rare cases involve businesses with franchise characteristics - those that can raise prices rather easily and only require incremental capital investment to increase sales volume or market share. (Cunningham SSRN article, page 13). The empirical operationalization of the above principles is discussed next. 5.1 Consistent stable uncomplicated businesses (C1, C2 and C4)
We would expect relatively stable businesses to deliver consistent operating profits over
time. Hence, we compute the annual growth and volatility in owner earnings scaled by book
value of equity (OWNER_RET). Consistent with Buffett’s statements in C1 and C2, we compute
owner’s earnings as reported earnings + depreciation, depletion and amortization – average
annual amount of capital expenditure calculated over the last three years. The volatility in
owners’ return over the past five years is used to proxy for the stability of the business
(VOL_OWNER_RET).
To address C7, we compute a version of OWNER_RET where the scale variable is
tangible book of value of equity, computed as book value of equity minus intangible assets such
as goodwill, patents and trademarks (OWNER_RET_TANGIBLE). To facilitate comparisons,
we also report data on regular ROE, defined as income before extra-ordinary items scaled by
book value of equity. To deal with outliers in observations related to returns, we winsorize return
observations at -100% and 100%.
Following Brealey (1983) and Chan, Karceski and Lakonishok (2003), we define
consistency as achieving an annual growth rate above the median annual growth rate for a
consecutive number of years relative to firms in the same two digit SIC code (labeled a “RUN”).
We ensure that we have at least five firms in a two digit SIC code for this test. We report run
statistics for four variables: (i) SALES; (ii) OWNERS’ RETURN; (iii) income before extra-
ordinary items (IBEX); and (iv) operating income before interest and depreciation (OIBD). At
the end of each sample period, we calculate how many firms achieve runs over five years in the

33
past. The median growth rate is computed for all growth rate observations available for that year,
and, is hence, subject to survivorship bias. Note that the RUN statistics can also be viewed as a
measure of the long term competitive advantage enjoyed by firms (C2).
5.2 Repay cash (C3)
Based on 3.5.1, we identify firms that earn below-median returns. Next, we sort on
firms’ free cash flow scaled by total assets over last five years. We identify the proportion of
firms earning below median returns that announce share repurchases and dividend increases for
both the Buffett sample and the control group (%REPAYERS). Because we do not have access
to the repurchase data at the present time, we intend to pursue this variable in future versions.
5.3 Leverage (C6)
We measure leverage in two ways: i) ratio of book value of short-term debt and long-
term debt to the book value of total assets (BLEV), ii) ratio of book value of short term debt and
long-term debt to market value of assets, defined as the market value of equity plus the book
value of debt (MLEV). To address Buffett’s point about high owners’ return after adjusting for
leverage and accounting gimmickry, we regress owners’ return on an intercept, BERK dummy,
leverage and accrual quality (as defined before). We expect the coefficient on BERK to be
positive and significant.
5.4 High OPEB and pension liabilities (for C8)
We identify a firm’s OPEB (OPEB) and pension liabilities (PENS_LIAB) from
Compustat and scale such liabilities by total assets.
5.5 Stock splits (for C9)
We use the CRSP tapes to identify firms that have split their stock and count the number
of times a firm has split its stock in the previous five years (SPLIT_#) for both the Buffett sample
and the control group.

34
5.6 Stock price around intrinsic value (for C10)
At the end of every fiscal year, we compute V/P ratio, where V is the intrinsic value of
shares and P is the stock price. Following Frankel and Lee (1998), we compute intrinsic value as
of the fiscal year end date using as a finite three-period valuation model, outlined in equation
(10), that includes a terminal value estimate and uses the latest observed historical ROE.
Essentially, the terminal value is determined by assuming that the third period forecasted ROE is
earned by the firm into perpetuity. We do not rely on analysts’ consensus earnings per share
forecasts because limiting our sample to firms covered in I/B/E/S will unduly reduce our sample.
1, 1(1 )( ) (1 ) ( * )
Ti e
t i T e t t i e t ie
rV t B r E X r B TVr
−−
= + + −
+= + Σ + − + (10)
In equation (10), Bt is the book value of equity per share at beginning of year t, Xt is net
income, re is the cost of equity capital and T is horizon. TV is terminal value computed as the
two year average expected earnings for the last two years of the horizon (T). We use a three year
time horizon for our empirical analyses. Forecasted values of Bt are derived from the clean
surplus equation, which specifies that the change in equity book value from period to period
equals earnings minus dividends, i.e., Bt+1=Bt + Xt+1 – dt+1. Specifically, we use realized values of
dividends to compute book values. The equity cost of capital estimate (re) is set to 10% as
previous research finds that intrinsic value estimates are not sensitive to this parameter (Frankel
and Lee 1998). Consistent with prior research we remove firms with stock prices less than $1 and
firms with negative intrinsic value that may be primarily due to negative book values and loss
firms.
V/P ratio helps us evaluate whether BH firms trade around their intrinsic values. To
assess whether stock prices of BH investments trade around their intrinsic values, we compute the
absolute value of the difference between V/P and one for each year for each firm (|V/P-1|). We
expect BH firms to have smaller deviations than the control sample. Admittedly, the intrinsic
35
value measure (“V”) that we rely on is a crude proxy for the intrinsic value measure that Buffett
perhaps actually uses before acquiring companies.
5.7 Repurchases (C11)
The objective is to assess whether the average price paid for share repurchases by the
firm is smaller or equal to the intrinsic value per share. Unfortunately, firms are not required to
disclose the dates on which they buy back stock. Dates on which firms announce a buyback
program can be collected but such dates are not useful for our purpose because companies that
announce a buyback program may choose not to buyback shares. In addition, our schools do not
subscribe to the “repurchases” portion of the Securities Data Corporation (SDC) database at this
time. We intend to pursue this hypothesis in later versions.
5.8 SEOs and acquisitions involving stock (C12)
We evaluate whether the firm issues stock when its intrinsic value is above the stock
price at which the firm trades before the SEO announcement. We obtain all secondary offer data
from SDC database during the period 1980-2006. For each fiscal year we compute the ratio of
intrinsic value of share computed at the beginning of the fiscal year by the SEO offer price
(V/SEO PRICE) and report (i) the proportion of cases where the firm issued equity at a price
lower than the intrinsic value per share (GOOD SEO%); and (ii) the average of the ratio of
V/SEO PRICE.
We try to identify whether a firm’s acquires targets at a time when its stock price exceeds
the intrinsic value of the share as of the beginning of the fiscal year. The sample of acquisitions
comes from the Securities Data Company's (SDC) U.S. Mergers and Acquisitions Database. We
select acquisitions with announcement dates between 1980 and 2006. We scale the intrinsic
value of the firm by stock price of the firm at the beginning of the fiscal year (V/P before Acq)
and report (i) the proportion of cases where the firm issued equity at a price greater than the
intrinsic value per share (GOOD ACQ%); and (ii) the average of the ratio of (V/P).
36
5.9 Acquisition premiums (for C13)
We measure the acquisition premium (ACQ PREMIUM) as the difference between the
highest price paid per share in the acquisition and the target firm’s share price four weeks before
the announcement of the acquisition, as a percentage of the target share price four weeks before
the announcement date. We intend to get to this measure in the next version of the paper.
5.10 Evidence on investing principles
We present both univariate and multivariate results as before. However, for brevity we
discuss only the multivariate results presented in Panel B of Table 6. Consistent with C4,
owner’s return for Berkshire firms is 11.7% higher than for the average control firm (the
coefficient on BERK in the OWNER_RET regression reported in panel B is 0.117, t-statistic =
76.23). After controlling for leverage and earnings quality, the differential in owner’s equity is
still high at 9.05% (t-statistic on BERK is 4.58; not tabled). Similar big advantages in ROE and
owner’s return on intangible assets are seen in Berkshire firms. Consistent with Buffett’s desire
to hold firms with stable businesses, the volatility of owner’s return computed over a five year
period is much lower for Buffett’s firms (coefficient on BERK in the VOL_OWNER_RET
regression reported in panel B is -0.136, t-statistic = -4.66).
Buffett’s firms appear to enjoy a longer average run in terms of years in which they
outperform the industry median relative to the average control firm. In particular, the coefficient
on BERK in the RUN-SALES (RUN-OWNER’s RET) regression reported in panel B is 0.0918
(0.0457) and both coefficients are significant at conventional levels. In keeping with Buffett’s
interest in low leverage, Berkshire firms are significantly less levered than the average control
firm (coefficient on MLEV = -0.0703, t-statistic = 4.12). Surprisingly, there is no evidence to
suggest that Berkshire investees have smaller pension and OPEB obligations or fewer stock splits
when compared to the average control firm as the coefficient on BERK for the PENS, OPEB and
SPLIT# regressions is statistically insignificant.
37
Interestingly, Berkshire firms appear to trade at prices that are closer to their intrinsic
values relative to their control sample counterparts. Note that the coefficient on BERK in the
|V/P-1| regression in panel B is -0.333 (t-statistic = -2.37). Somewhat surprisingly, the proportion
of GOOD SEOS, or cases where the SEO offer price is larger than the intrinsic value computed at
the beginning of the fiscal year, is smaller for Berkshire firms as the coefficient on BERK in the
GOOD SEO regressions is -0.2501 (t-statistic = -1.68). However, note that only 12 SEOs were
made by the Berkshire firms in the entire sample period when Buffett owns stock in these
companies. Although we find only 15 acquisitions were made by Berkshire firms concurrent
with Buffett’s ownership, we find a greater proportion of GOOD ACQs, defined as the proportion
of cases where the firm issued equity at a price lower than the intrinsic value per share, in
Berkshire firms. Moreover, V/P ratio prior to acquisition is statistically lower at Berkshire firms
as the coefficient on BERK in the V/P regression in panel B is -0.1574 (t-statistic = -1.92).
6.0 Additional Analyses
6.1 Selection or intervention
One of the important open questions related to the influence of powerful investors, such
as Buffett, in governance is whether he selects stocks with the characteristics outlined above or
whether he intervenes and changes the accounting and governance characteristics of his target
firms. Hypotheses related to changes after Buffett’s intervention are posited in H1b, H2b and
H3b. To give the intervention hypothesis the best chance of success, we restrict the sample to
firms where (i) BH has a 5% or more holding; and (ii) at least one year of data is available before
and after his purchase of a stock. However, restricting to stocks with ownership of 5% or more
reduces the number of observations.
We conduct a regression of each of the firm characteristics (e.g., earnings quality
conservatism score) investigated against the BERK dummy for a sample consisting of only BH
investments. Recall that the BERK dummy is set to one only when BH invests in the firm’s
38
stock. Hence, the coefficient on BERK estimated for the sample of BH firms, would indicate
whether the corporate practice under investigation changed after Buffett assumed a stake in the
company.
Results reported in Table 7 suggest very little intervention by Buffett. In general, we
cannot find statistically significant differences before and after Buffett’s investments in the
timeliness of reporting good and bad news (CSCORE and GSCORE in panel A) or in the extent
of abnormal accruals. Surprisingly, we observe a fall in the Dechow-Dichev (DD) measure of
earnings quality after Buffett buys stock but we need to interpret this finding with caution
because DD is an average of five years of accrual and cash flow data. Hence, nailing down the
precise timing of Buffett’s intervention into the DD measure is difficult. There is some tentative
evidence to suggest that SMALL_MEET_BEATS fall whenever Buffett owns stock (coefficient
on BERK in panel A is -0.041, p-value = 0.09, one-tailed). Evidence in panel B shows that the
assumed rate of return remains unchanged after Buffett buys stock (coefficient on BERK is –
0.1709, t-statistic = -0.93) but the sensitivity of the pension rate of return to operating income is
lower (coefficient on the interaction is -0.0881, p = 0.07; one tailed).
Turning to compensation, there is no evidence of any change in compensation practices
tabled in panel D. Panel E suggests that “excess” pay at Berkshire investments falls after
Buffett’s buys stock (coefficient on BERK = -0.294, t-statistic = -2.94) but CEOs at such firms
are also more likely to get a pay hike if they were underpaid relative to their industry peers last
year. Hence, the data in panel E does not lend itself to a clear interpretation.
Board size appears to fall after Buffett buys stock in a company (coefficient on BERK in
the Board Size regressions in panel D is -1.072, t-statistic = -2.56) but there is no other change in
board composition. Panel F suggests that there is no noticeable change in owner’s return, ROE or
in the volatility of owner’s return after Buffett buys stock. Neither is there any change in
leverage or in the volatility of the deviation of intrinsic values relative to stock prices. In sum,
unlike activist investors such as Hermes or CALPERS, there is no evidence to suggest that

39
Buffett’s involvement changes any of the investees’ accounting, governance and investing
practices in a substantive manner.
6.2 Berkshire Hathaway performance
Before we embark on the process of finding stocks similar to BH investees, it might be
worthwhile to examine the performance of BH’s stock and of the equity investments held by BH
over time. An obvious reason to consider the performance of both BH and its investees is that
BH holds several securities beside its equity investments such as stakes in private companies,
convertible bonds and its insurance business. Table 8 presents results from a regression of
monthly excess returns of BH stock and an equally weighted portfolio of BH investees on (i)
monthly returns on the market factor; and (ii) monthly returns on the SMB, HML and UMD
factors, data for which is obtained from Ken French’s website at Dartmouth. We limit our
analysis to the period from January 1, 1977 to December 31, 2006 or 360 months of return data.
The results in panel A suggest that BH is able to handily beat both the market and the
three-factor model over the entire sample period. This is consistent with recent evidence in
Martin and Puthenpurackal (2008). The alpha with respect to the market (four-factor) model is
1.4% (0.93%) per month and the t-statistic is 3.88 (2.65). To evaluate whether there are inter-
temporal differences in such alpha, we divide the sample period into three decades: (i) 1/77-
12/86; (ii) 1/87-12/96; and (iii) 1/97-12/06. The results suggest that BH does not generate a
statistically significant alpha in excess of returns to the four-factor model in the last period
(0.08% per month, t-statistic = 0.15). However, BH’s performance in the first two decades is
strong as evidenced by alphas for three-factor model of 1.5% per month and 1.09% per month (t-
statistics of 1.99 and 2.08 respectively). Turning to the coefficients on the other three factors in
the regression, it is interesting to note that the coefficient on SMB is never statistically significant
in the three sub-periods. However, the coefficient on HML is positive and is statistically
significant in the first and the third decade. The positive coefficient suggests that BH follows a
40
value-strategy of investing in high book-to-market stocks. Thus, one way to interpret the
evidence is that BH is unable to extract a premium above and beyond the “value” premium.
In panel B, we examine the stock return performance of an equally-weighted portfolio of
BH investees. We form portfolios based on the quarterly 13-F filings. In particular, we form
portfolios following the end of the calendar quarter for which BH files its 13-F report, to ensure
that our portfolio formation starts after the 45 day 13-F filing deadline. Similar to the analysis for
Berkshire Hathaway stock we present excess returns to both market model and a four factor
model. Results are weaker than those reported in panel A in that BH’s stock portfolio does not
produce alphas in excess of the four factor model during the last two decades. Moreover, the
magnitude of excess returns is about 30% to 50% smaller in comparison to that reported for
Berkshire Hathaway stock in Panel A. We attribute the differential magnitude in excess returns
to two plausible explanations. First, the timing of portfolio formation has implications for the
returns generated for Berkshire. Martin and Puthenpurackal (2008) find that there are significant
returns (about 4%) to the announcement of a stock investment by Berkshire Hathaway. Thus, our
portfolio formation ignores this uptick in announcement day returns. Second, and perhaps more
important, Berkshire Hathaway has several investments beside publicly traded equity such as its
stake in private companies, its insurance business and non-financial assets such as gold and
bullion. Therefore, the excess returns to Berkshire Hathaway stock may not be limited to returns
to the equity portfolio.
Absence of a statistically significant alpha for BH in the last decade and for Berkshire’s
equity portfolio in the last two decades has important implications for our next analysis where we
attempt to identify stocks that statistically resemble BH’s investees. First, the appropriate
benchmark for comparing returns for a mimicking portfolio that reflects Buffett’s principles is the
returns to Berkshire’s equity portfolio. Second, although richer data on accounting, governance
and investing practices has become available in the last decade it may be difficult to identify
firms that closely resemble the values espoused by Buffett (such as integrity of the management

41
and boardroom atmosphere). Consequently, there is a distinct possibility that our mimicking
portfolio might not earn abnormal returns.
6.3 Propensity score matched portfolio returns
In this section, we attempt to identify firms that statistically resemble characteristics of
Berkshire’s equity investees and examine whether excess returns can be earned for such a
Berkshire-mimicking portfolio. We use a propensity score-matching procedure that matches BH
investees with other firms along the accounting, compensation, governance and investing
dimensions discussed in the preceding sections. 11 Propensity score is essentially the probability
estimate that a firm with given characteristics resembles the accounting, investing and
governance attributes of a Berkshire investee firm. This matching procedure has gained
popularity in both the accounting and finance literatures (e.g., Hillion and Vermaelen 2004;
Armstrong, Jagolinzer and Larcker 2008). This procedure involves three steps. We first obtain
the propensity score for each of our treatment firms by using a logit estimation with the following
explanatory variables: (i) accounting variables, CSCORE, GSCORE, PRO_FORMA GAP, DD,
|ABACC|, FORECAST_QTRS, EXPENSER, SMALL_MEETS_BEATS, PENSENS, (ii)
governance variables, BOARD SIZE, %OUTSIDERS, %DIRECTOR_OWN, %FEMALE,
%ETHNIC, and (iii) investing variables, OWNER_RET, VOL_OWNER_RET, RUN-SALES,
SPLIT#, PENS_LIAB, OPEB, MLEV. With respect to compensation variables, it is difficult to
capture firm-specific pay for performance sensitivity and Lake-Woebegone effects because they
represent a single parameter estimate across firms. Therefore, as an alternative proxy, we use
excess compensation estimated as the residual from equation (8) without the variables that have a
BERK dummy. We estimate equation (8) for each of the years and use the residual
11 As noted in detail in the preceding section, BH’s actual stock picks sometimes do not appear to reflect some of Buffett’s principles. Hence, an alternative to the propensity score technique is to rank firms based on each of Buffett’s principles and then average such ranks across all the principles discussed to derive a composite rank for each stock. Firms with the largest ranks would represent stocks that most closely reflect Buffett’s principles. The downside to this strategy, unlike the propensity score method, is the equal weighting of each of Buffett’s principles. We intend to pursue this strategy at a later date.
42
(EXCESSCOMP) as a proxy for excess compensation. A disadvantage with using the residual is
that the excess compensation measure is likely to capture other unknown and uncontrolled for
cross-sectional differences in firm characteristics. With respect to the investing variables, we are
careful not to include variables that are likely to be very highly correlated and hence, redundant in
an empirical specification. Specifically, we exclude ROE, OWNER_RET_TANGIBLE, RUN-
OWNERSRETURN, RUN-OIBD and RUN-IBEX. We also exclude SEO and acquisition related
variables because of the limited sample size for which data is available. We also exclude intrinsic
value variables because they are computed using information in future earnings which would
introduce look-ahead bias. Instead, we include the book to market ration (BMRATIO) as a proxy
for the intrinsic value measures. Finally, we include a size proxy, the natural logarithm of market
value (LOGMVE) to control for size.
Note that we do not have data on certain key governance, and accounting variables for
several of our sample firms. To avoid sample restrictions due to missing data we include dummy
variables that are set to one if a particular firm-year has missing data for a particular variable. For
example, if BOARD SIZE is missing a BOARD SIZE DUMMY is set to one for that firm-year.
Correspondingly, the missing BOARD SIZE variable is set to zero for that firm-year. The
advantage of including the dummy variables (also called the zero-order regression) is that we
avoid deleting observations due to lack of data. The zero-order regression essentially replaces
every missing observation with the mean of the variable that is missing. A downside of this
approach is that it leads to biased coefficient estimates. We err on the side of a larger sample by
incorporating such dummy variables in the logit estimation.
Our second step in implementing propensity matching is to use the coefficient estimates
from the logit model and compute the conditional probability (p) that a firm given the identified
characteristics (also called covariates) resembles the attributes of a BH investee. The propensity
score is computed as 1n ((1−p)/p). We identify five firms (with replacement) whose propensity
scores (the predicted probability of a Buffett stock) are the closest to the propensity score of each

43
BH investee. We are careful to eliminate duplicate matching firms that are selected for different
Berkshire investee firms. In the final step we use the matched firms to form portfolios.
We estimate the logit model separately for each year from 1980 to 2006. We do not pool
the observations across time for two reasons. First, year by year analysis avoids look-ahead bias
when forming stock portfolios. Second, such analysis allows for different parameter estimates for
each year thereby capturing potentially evolving philosophies underlying Berkshire strategies.
Based on the parameter estimate each year we obtain propensity scores and obtain up to five
matches for each of the firms in the Berkshire sample. We then form portfolios for each month
from April 1981 to December 2006. To avoid look-ahead bias, we begin portfolio formation in
April of the year following the propensity score estimation. That is, the composition of the
portfolios are determined April of each year based on the propensity scores that corresponds to
the Berkshire portfolio for the previous calendar year. For example, in forming portfolios for
April 2001 we use the propensity model estimation for year 2000. This ensures that we have all
financial data prior to portfolio formation.
In computing portfolio returns, we rebalance the portfolios every April based on the new
portfolio list generated by the propensity score estimation. In the event that a firm in the portfolio
exits due to acquisition or delisting, we replace the returns for that firm with the risk free rate. As
before, we present results for portfolio excess returns based on a market model and Fama-French
four factor model (see panel C of Table 8). The propensity score matched sample beats the
market but has a harder time beating the four factor Fama-French model. We find that the alpha
for a propensity score matched portfolio across the time-period 1981-2006 is approximately 50%
of the alpha for Berkshire’s equity portfolio (compare Panel B of Table 8). Consistent with the
absence of a significant alpha for the most two recent decades for Berkshire’s equity portfolio
using the four factor model, the propensity matched portfolio earns insignificant abnormal
returns. Weaker results for the mimicking portfolio should not be surprising because we are
unable to incorporate some of the important soft attributes of Buffett’s investing philosophies
44
such as honesty and integrity of management and we do not have the benefit of Buffett’s
subjective intrinsic value estimates for his investments.
While we are unable to generate compelling returns to a portfolio that mimics Berkshire’s
strategies, the evidence presented here indicates that refining the portfolio may be a worthy
endeavor. In particular, more timely incorporation of his evolving ideologies such as forming
portfolios on a quarterly basis, keeping portfolio turnover low by retaining portfolios for a longer
period, subjecting the portfolio to the same industry restrictions that Buffett imposes (e.g.,
avoiding technology stocks) could result in an improvement in the portfolio returns.
7. Conclusions
In this paper we examine whether influential investors affect important management
practices. We rely on public statements of Buffett regarding best practices and examine whether
his investment decisions through Berkshire Hathaway are consistent with these practices. In
particular, we examine whether investees of Berkshire Hathaway exhibit more transparent
accounting, better disclosure, stronger governance and superior investing decisions relative to the
average firm. We are among the first in the academic literature to provide evidence on Buffett’s
model of a well-governed firm and a great stock pick.
Preliminary findings are broadly consistent with Berkshire investees following what
Buffett preaches. However we note several exceptions, especially in executive compensation and
board composition. There is little evidence of change in investees’ practices subsequent to
Berkshire’s initial investment. In terms of stock return performance, we find that Berkshire’s
stock returns outperform the four factor model over the period 1977-2006. However, this
superior performance is attributable to the early time period as we observe no significant alphas
over the most recent decade (1997-2006). A mimicking portfolio of firms that statistically
resemble Buffett’s equity picks generates abnormal returns of a smaller magnitude than that
obtained for Berkshire’s equity portfolio.

45
In sum, the data suggests that Buffett is not an activist investor. Instead, he picks stocks
of firms that employ transparent accounting and disclosure practices, make CEO pay more
responsive to performance, do not overpay CEOs and enjoy abnormally high ROEs, streaks in
ROE and sales growth, lower return volatility and lower leverage. Our study takes an important
step towards characterizing the behavior of an influential investor and best practices espoused by
him. Future work may want to examine whether Buffett’s recommended best practices are
associated with superior outcomes in other settings.
46
References
Atanasov, V., B. Black and C. Ciccotello. 2007. Unbundling and measuring tunneling. http://ssrn/com/abstract=1030529 Aggarwal, Rajesh, and Andrew A. Samwick. 1999. The other side of the tradeoff: The impact of risk on executive compensation. Journal of Political Economy 107 (February): 65–105. Armstrong, C., A. Jagolinzer, and D. Larcker. 2009. Chief Executive Officer Equity Incentives and Accounting Irregularities. Working Paper, Stanford University. Baker, G., and B. J. Hall. 2004. CEO incentives and firm size. Journal of Labor Economics 22(4): Barber, B. and D. Loeffler. 1993. The "Dartboard" Column: Second-Hand Information and Price Pressure. The Journal of Financial and Quantitative Analysis 28(2): 273-284. Basu, S. 1997. The conservatism principle and the asymmetric timeliness of earnings. Journal of Accounting and Economics: 3-37. Bebchuk, L., A. Cohen and A. Ferrell. 2009. What Matters in Corporate Governance? Review of Financial Studies 22: 783-827. Becht, M., J. Franks, C. Mayer, and S. Rossi. 2008. Returns to shareholder activism: evidence from a clinical study of the Hermes UK Focus Fund. Review of Financial Studies. RFS Advance Access published on May 28, 2008, DOI 10.1093/rfs/hhn054. Bergstresser. D., M.A. Desai and J.D. Rauh. 2006. Earnings manipulation, pension assumptions, and managerial investment decisions. Quarterly Journal of Economics 121:157–95. Bhattacharya, N., E.L. Black, T. Christensen and C. R. Larson. 2003. Assessing the relative informativeness and permanence of pro forma earnings and GAAP operating earnings. Journal of Accounting and Economics, Vol. 36, Nos. 1-3, 2003, pp. 285-319. Bhide, A. 1993. The hidden costs of stock market liquidity. Journal of Financial Economics 34:31-52. Bizjak, J., M. Lemmon, and L. Naveen, 2008. Does the use of peer groups contribute to higher pay and less efficient compensation? Journal of Financial Economics, 90 (2): 152-168. Black, F. 1973. Yes, Virginia, there is hope: Test of the Value Line ranking system. Financial Analysts Journal 29 (September/October): 10- 14. Brealey, R. 1983. An Introduction to Risk and Return from Common Stocks. MIT Press. Cambridge. Buffett, M., and D. Clark. 2006. The Tao of Warren Buffett: Warren Buffett's Words of Wisdom: Quotations and Interpretations to Help Guide You to Billionaire Wealth and Enlightened Business Management. Scribner Publishing.

47
Carleton. W. T., J.M. Nelson and M. Weisbach. 1998. The influence of institutions on corporate governance through private negotiations: Evidence from TIAA-CREF. Journal of Finance 53: 1335-1362. Chan, L., J. Karceski, J. Lakonishok. 2003. The level and persistence of growth rates. Journal of Finance, April, 2 634-684. Coffee, J. 1991. Liquidity versus control: the institutional investor as corporate monitor. Columbia Law Review 91: 1277-1368. Cunningham, L. A., 1997, 2001. The Essays of Warren Buffett: Lessons for Corporate America. Dechow, P. M., and I. D. Dichev. 2002. The quality of accounting and earnings: The role of accrual estimation errors. The Accounting Review 77 (Supplement): 35-59. Desai, H. and P.C. Jain. 1995. An Analysis of the Recommendations of the "Superstar" Money Managers at Barron's Annual Roundtable. Journal of Finance 50(4): 1257-1273. Desai, H. and P.C. Jain. 2004. Long-Run Stock Returns Following Briloff's Analyses. Financial Analysts Journal 60(2): 47-56. Doyle, J. T., Lundholm, R. J., & Soliman, M. T. (2003). The predicative value of expenses excluded from pro forma earnings. Review of Accounting Studies, 8, 145–174. Durtschi, C. and P.D. Easton. 2005. Earnings management? The shapes of frequency distributions of earnings metrics are not evidence ipso facto. Journal of Accounting Research 43: 557–592. Fama, E. and K. French. 1997. Industry costs of equity. Journal of Financial Economics 93, 153-194. Fields, T., T. Lys and L. Vincent. 2001. Empirical Research on Accounting Choice. Journal of Accounting and Economics. 31(3-1): 255-301. Fink, R. 2000. The Real Thing: Bottling Plan Taps Coke's Profits, CFO Magazine, April. Foust, D. 2004. Gone Flat. Business Week, December 20. Foster, G. 1979. Briloff and the Capital Market. Journal of Accounting Research 17(1): 262-274. Francis, J., R. LaFond, P. Olsson, and K. Schipper. 2005. The market pricing of accruals quality. Journal of Accounting and Economics 39, 295-327. Frankel, R., and C. M. C. Lee. 1998. Accounting valuation, market expectation, and cross-sectional stock returns. Journal of Accounting and Economics 25 (June): 283-319. Gompers, P. J. Ishii and A. Metrick, Corporate governance and equity prices, Quarterly Journal of Economics 118 (2003), pp. 107–155. Graham. J. 1999. Herding among Investment Newsletters: Theory and Evidence. Journal of Finance 54(1): 237-268.
48
Graham, J. and C. R. Harvey. 1996. Market timing ability and volatility implied in investment newsletters' asset allocation recommendations. Journal of Financial Econom- ics 42, 397-421. Guay, W, S.P. Kothari and Watts, R., 1996, A market-based evaluation of discretionary-accrual models, Journal of Accounting Research Supplement 34, 83-115 Hagstrom, R.G. 1997. The Warren Buffett way: investment strategies of the world's greatest investor. John Wiley and Sons. Hillion, P., and T. Vermaelen. 2004. Death spiral convertibles, Journal of Financial Economics, Vol. 71 (2), 381-415. Huberman, G. and S. Kandel. Market Efficiency and Value Line's Record. Journal of Business 63(2): 187-216. Khan, M. and R. Watts. 2007. Estimation and empirical properties of a firm-year measure of conservatism. Available at SSRN: http://ssrn.com/abstract=967348. Kojima, K. 1997. Corporate Governance: An International Comparison. Hajime Printing. Porter, M.E. 1992. Capital disadvantage: America’s failing capitalist investment system. Harvard Business Review 70: 65-82. Kothari, S. P., A. Leone, and C. Wasley. 2005. Performance matched discretionary accrual measures. Journal of Accounting and Economics 39, 163-197. Jones, J. 1991. Earnings management during import relief investigations. Journal of Accounting Research 29, 193-228. Li, F. 2008. Annual report readability, current earnings, and earnings persistence. Journal of Accounting and Economics 45:221-247 Martin, G. and J. Puthenpurackal. 2008. Imitation is the sincerest form of flattery: Warren Buffett and Berkshire Hathaway, working paper. McNichols, M. 2002. Discussion of ‘The quality of accruals and earnings: The role of accrual estimation errors. The Accounting Review 77(Supplement), 61-69. Murphy, K. 1999. Executive compensation in O. Ashenfelter and D. Card eds., Handbook of Labor Economics, Vol. 3b, Ch. 38, 2485-2563. Porter, M.E. 1992. Capital Disadvantage: America’s Failing Capital Investment System. Harvard Business Review, 70: 65–82. Prevost, A. K. and R. P. Rao. 2000. Of what value are shareholder proposals sponsored by public pension funds? The Journal of Business 73: 177-204. Segal, D. 2009. Buffett Is Unusually Silent on Rating Agencies. New York Times. March 19. Shelton. J. 1967. The Value Line Contest: A Test of Predictability of Stock-Price Changes. The Journal of Business 40(3): 251-269.

49
Smith, M.P. 1996, Shareholder activism by institutional investors: Evidence from CalPERS. Journal of Finance 51: 227-252. Stempel, J. 2008. SEC asked Buffett's Berkshire for derivative data, Nov 21. Reuters. Stickel, S. E. 1985. The effect of Value Line Investment Survey rank changes on com- mon stock prices. Journal of Financial Economics 14:121-44.

Appendix Summary Table of Results
A. Accounting and Disclosure Practices Data source Test variable Selection Intervention
Table Result Table Result
BH investees tend to:
H1 be timely in reporting both good and bad news Compustat, CRSP GSCORE; CSCORE 2, Panel B ***; *** 7, Panel A NS;NS
A1 place less emphasis on EBITDA & pro forma earnings
Compustat; IBES PRO_FORMA GAP 2, Panel B NS 7, Panel A NS
A2 have relatively high quality earnings Compustat DD; |ABACC| 2, Panel B ***; *** 7, Panel A NS
A3 make fewer forecasts; meet/beat these forecasts First Call; IBES
GUIDANCE; MEET_BEATS;
SMALL_MEET_BEATS 2, Panel B
NS; NS; NS
7, Panel A NS; NS;
* A4 avoid using restructuring charges NA NA NA NA NA NA
A5 voluntarily expense stock option costs Bear Stearns EXPENSER 2, Panel B * NA NA
A6 use relatively conservative pension assumptions Compustat PENSENS;
Log(Penson assets/operating income)*BERK
2, Panel B; 2, Panel C ***; * NA;
7, Panel B NA;
*
A7 have relatively clear explanations in their footnotes
10-K; Li (2008) FOG INDEX 2, Panel B NS 7, Panel A NS
Notes: All results are based on multivariate tests from the tables indicated. *,**,*** represent significance at the 10%, 5%, and 1% level, one-tailed, respectively. NS indicates not significant in predicted direction at conventional levels. NA indicates not applicable.

51
Appendix (continued) Summary Table of Results
B. Governance Practices
Data source Test variable Selection Intervention Table Result Table Result
Compensation BH investees tend to:
B1 pay less “excess” compensation to the CEO Compustat; Execucomp BERK Dummy 3 *** 7, panel C NS
B2 exhibit greater pay-for-performance sensitivity ” Returns-firm*BERK 3 *** 7, panel C ns B3 have less upward creep in CEO pay ” LOWCOMP*BERK 4 ns 7, panel D ns
B4 have pay more sensitive to negative stock price performance ” Negdum*BERK 3 ns 7, panel C ns
B5 have pay more sensitive to earnings net of the cost of capital ” Abnormal Earnings NA NS NA NS
B6 rely less on stock options Execucomp %OPTIONS NA NS NA NS
Board Structure
BH investees tend to:
B7 have i) smaller boards and ii) composed mostly of outside directors IRRC BOARD SIZE;
%OUTSIDERS 5, panel B NS; NS 7, panel E NS;NS
B8 hold executive sessions with outside directors NA NA NA NA NA NA B9 have directors that own more stock Execucomp %DIRECTORS_OWN 5, panel B ns 7, panel E Ns
B10 have director compensation less dependent on fees NA NA NA NA NA NA
External Monitoring BH investees tend to:
B11 experience coordinated institutional activism NA NA NA NA NA NA B12 have CEOs that perfom despite poor governance NA NA NA NA NA NA
B13 have board members chosen for savvy, not political correctness IRRC %FEMALE; %ETHNIC 5, panel B NS; *** 7, panel E NS;NS
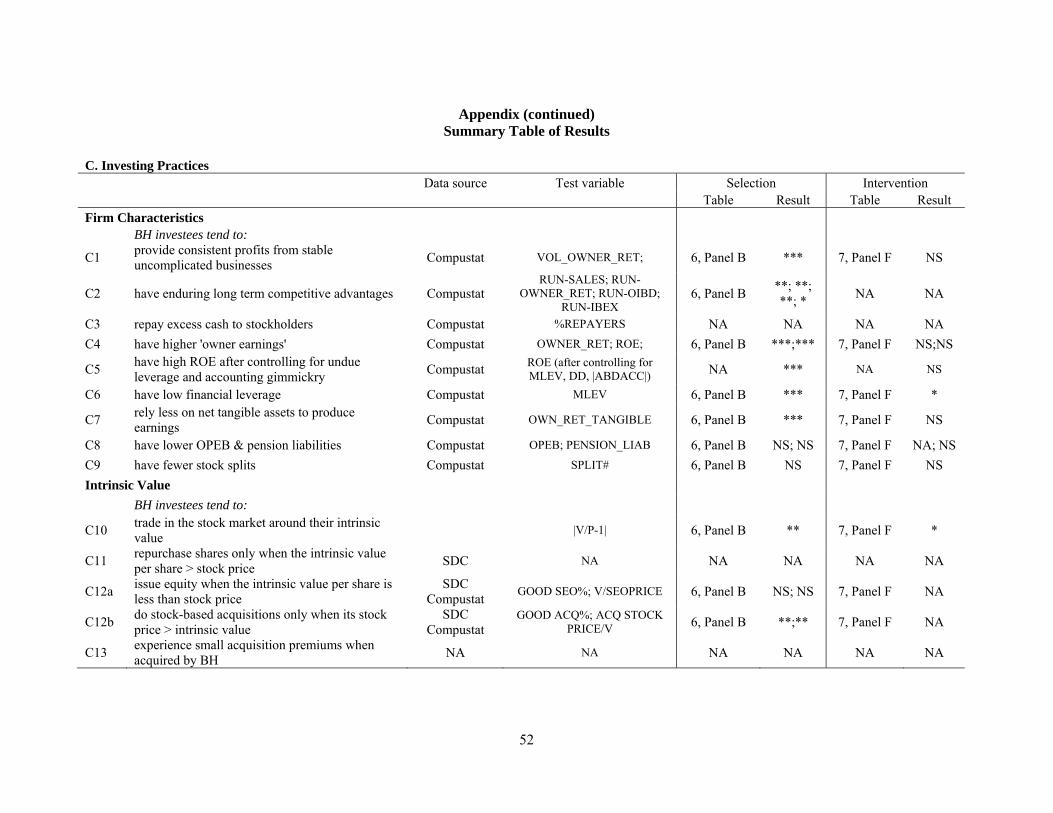
52
Appendix (continued) Summary Table of Results
C. Investing Practices
Data source Test variable Selection Intervention Table Result Table Result
Firm Characteristics BH investees tend to:
C1 provide consistent profits from stable uncomplicated businesses Compustat VOL_OWNER_RET; 6, Panel B *** 7, Panel F NS
C2 have enduring long term competitive advantages Compustat RUN-SALES; RUN-
OWNER_RET; RUN-OIBD; RUN-IBEX
6, Panel B **; **; **; * NA NA
C3 repay excess cash to stockholders Compustat %REPAYERS NA NA NA NA C4 have higher 'owner earnings' Compustat OWNER_RET; ROE; 6, Panel B ***;*** 7, Panel F NS;NS
C5 have high ROE after controlling for undue leverage and accounting gimmickry Compustat ROE (after controlling for
MLEV, DD, |ABDACC|) NA *** NA NS
C6 have low financial leverage Compustat MLEV 6, Panel B *** 7, Panel F *
C7 rely less on net tangible assets to produce earnings Compustat OWN_RET_TANGIBLE 6, Panel B *** 7, Panel F NS
C8 have lower OPEB & pension liabilities Compustat OPEB; PENSION_LIAB 6, Panel B NS; NS 7, Panel F NA; NS C9 have fewer stock splits Compustat SPLIT# 6, Panel B NS 7, Panel F NS Intrinsic Value
BH investees tend to:
C10 trade in the stock market around their intrinsic value |V/P-1| 6, Panel B ** 7, Panel F *
C11 repurchase shares only when the intrinsic value per share > stock price SDC NA NA NA NA NA
C12a issue equity when the intrinsic value per share is less than stock price
SDC Compustat GOOD SEO%; V/SEOPRICE 6, Panel B NS; NS 7, Panel F NA
C12b do stock-based acquisitions only when its stock price > intrinsic value
SDC Compustat
GOOD ACQ%; ACQ STOCK PRICE/V 6, Panel B **;** 7, Panel F NA
C13 experience small acquisition premiums when acquired by BH NA NA NA NA NA NA

Table 1 Berkshire Hathaway Holdings in our Sample
This table reports the number of Berkshire Hathaway equity investees sorted by year. Data on all equity investments (investments where Berkshire owns 5% or more of a target company) is reported in columns 2 (3) respectively, as obtained by the intersection of CDA/Spectrum and Compustat databases. Although CDA/Spectrum reports quarterly data on equity holdings, we have averaged these holdings based on the investee’s fiscal year for the analyses in this paper.
Year
Number of
firms Number of firms
where holding ≥ 5%(1) (2) (3)
1980 112 13 1981 44 13 1982 24 10 1983 14 9 1984 19 8 1985 14 5 1986 11 6 1987 13 6 1988 17 6 1989 12 6 1990 12 8 1991 12 9 1992 12 10 1993 14 10 1994 12 11 1995 9 8 1996 9 8 1997 8 7 1998 8 7 1999 14 10 2000 33 17 2001 33 14 2002 30 13 2003 32 13 2004 30 12 2005 34 11 2006 42 11 Average 23.11 9.67 Median 14 10

54
Table 2 Accounting Practices of Berkshire Hathaway Investees
Panel A: Univariate Data on Accounting Practices of Berkshire Investees
This table compares the mean levels for various proxies for underlying accounting practices espoused by Warren Buffett for Berkshire Hathaway investees compared to a control sample. CSCORE and GSCORE represent the timeliness with which bad news and good news is disclosed by the firm to the market as specified in Khan and Watts (2008). PRO_FORMA GAP is the difference between GAAP earnings per share, defined as income before extraordinary items – available for common, adjusted for stock splits and dividends and I/B/E/S reported actual earnings, scaled by split-adjusted stock price at the beginning of the quarter. DD and |ABACC| are two proxies for the quality of earnings. DD is the standard deviation of the residual from a regression of current accruals for a year on operating cash flows for the last year, current year and the next year and control variables as per Dechow and Dichev (2002) and McNichols (2002). |ABACC| is the absolute value of abnormal accruals for a year as defined in the text. FORECAST_QTRS is the number of quarters for which a firm manages to meet or beat its management forecast of earnings. EXPENSER is set to one if a firm is identified as voluntarily expensing the fair value of stock as per SFAS 123 in the Bear Stearns report dated 12/14/2004. PENSION RATE is the assumed rate of return on pension assets. FOG INDEX is the (words per sentence + percent of complex words) * 0.4 as per Li (2008). BERK is set to one if Berkshire holds an investment in the firm during a year. Robust standard errors clustered at the firm level have been used to compute test statistics in panel B and C. The number of observations, reported in the last column of panel A and relevant to panel B, underlying these analyses varies depending on the availability of data.
Variable Mean Berkshire firms
Mean Control Sample
t-statistic for difference
N Berkshire sample,
Control sample
CSCORE 0.601 0.370 14.97 605, 140870 GSCORE 0.051 0.029 10.92 605, 140870 PRO_FORMA GAP 0.003 0.004 -1.08 332, 64596 DD 0.025 0.049 -11.04 457, 87945 |ABACC| 0.032 0.068 -10.18 478, 110487 GUIDANCE 3.993 2.645 6.55 144, 21561 MEET_BEATS 0.707 0.632 4.15 303, 52968 SMALL_MEETS_BEATS 0.190 0.172 1.36 303, 52968 EXPENSER 0.433 0.313 2.43 90, 4562 PENSENS 0.119 0.222 -6.11 185,20438 FOG INDEX 19.348 19.400 -0.48 172, 49261

55
Table 2 (continued) Accounting Practices of Berkshire Hathaway Investees
Panel B: Multivariate Analysis of the Accounting Practices of Berkshire Hathaway Investees Accounting choice variable in column (1) = f(Intercept, BERK, industry dummies, year dummies)
Dependent variable Coefficient on BERK dummy t-statistic p-value
(1) (2) (3) (4) CSCORE 0.206 14.52 <0.01 GSCORE 0.008 5.23 <0.01 PRO_FORMA GAP -0.001 -0.50 0.61 DD -0.014 -6.30 <0.01 |ABACC| -0.026 -9.35 <0.01 GUIDANCE 0.690 3.22 <0.01 MEET_BEATS 0.053 2.42 0.02 SMALL_MEET_BEATS 0.022 0.92 0.36 EXPENSER 0.030 1.32 0.19 PENSENS -0.085 -2.72 <0.01 FOG INDEX -0.009 -0.06 0.95
Panel C: Multivariate Analysis of Pension Rate Assumptions of Berkshire Hathaway Investees PENSION_RATE = f (Intercept, log ratio of pension assets to operating income, BERK dummy, BERK dummy*pension sensitivity, industry dummies, year dummies)
Independent variable Coefficient t-statistic p-value (1) (2) (3) (4)
Log (Pension assets/operating income)
0.068 10.49 <0.01
BERK 0.186 1.50 0.13 Log (Pension assets/operating income)*BERK
-0.173 -1.59 0.11
N 22470 Note: Intercept, industry and year dummies are included in the regressions but not reported.
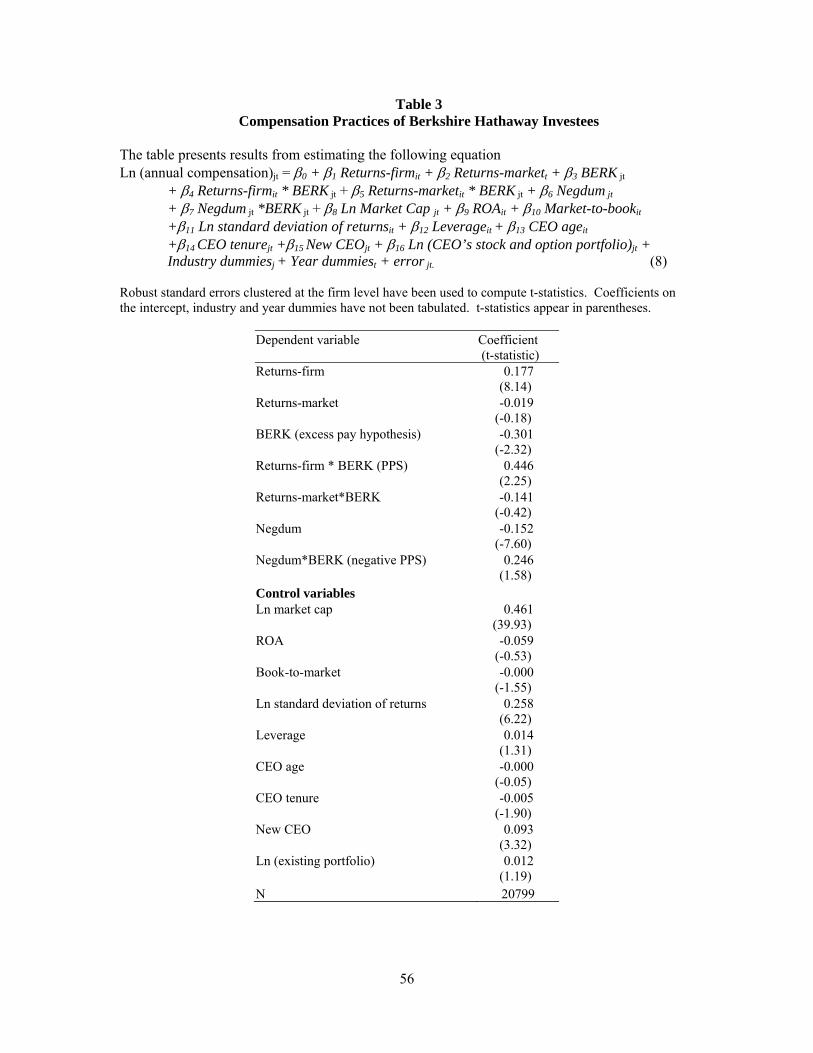
56
Table 3 Compensation Practices of Berkshire Hathaway Investees
The table presents results from estimating the following equation Ln (annual compensation)jt = β0 + β1 Returns-firmit + β2 Returns-markett + β3 BERK jt
+ β4 Returns-firmit * BERK jt + β5 Returns-marketit * BERK jt + β6 Negdum jt + β7 Negdum jt *BERK jt + β8 Ln Market Cap jt + β9 ROAit + β10 Market-to-bookit +β11 Ln standard deviation of returnsit + β12 Leverageit + β13 CEO ageit
+β14 CEO tenurejt +β15 New CEOjt + β16 Ln (CEO’s stock and option portfolio)jt + Industry dummiesj + Year dummiest + error jt. (8)
Robust standard errors clustered at the firm level have been used to compute t-statistics. Coefficients on the intercept, industry and year dummies have not been tabulated. t-statistics appear in parentheses.
Dependent variable
Coefficient (t-statistic)
Returns-firm
0.177 (8.14)
Returns-market
-0.019 (-0.18)
BERK (excess pay hypothesis)
-0.301 (-2.32)
Returns-firm * BERK (PPS)
0.446 (2.25)
Returns-market*BERK
-0.141 (-0.42)
Negdum
-0.152 (-7.60)
Negdum*BERK (negative PPS)
0.246 (1.58)
Control variables Ln market cap
0.461 (39.93)
ROA
-0.059 (-0.53)
Book-to-market
-0.000 (-1.55)
Ln standard deviation of returns
0.258 (6.22)
Leverage
0.014 (1.31)
CEO age
-0.000 (-0.05)
CEO tenure
-0.005 (-1.90)
New CEO
0.093 (3.32)
Ln (existing portfolio)
0.012 (1.19)
N 20799

57
Table 4 Lake Woebegone Effect at Berkshire Hathaway Investees
The table presents results from estimating the following equation
Log(annual compensationit /annual compensationit-1) = β0 + β1 Returns-firmit + β2 Returns-markett + β3 BERK jt +β4 LOWCOMPit + β5 LOWCOMP*BERKit+ β6 Ln Market Cap jt + β7ΔROAit + β8 log(Salesit/Salesit-1) + Industry dummiesj+ Year dummiest + error jt. (9)
Robust standard errors clustered at the firm level have been used to compute t-statistics. Coefficients on the intercept, industry and year dummies have not been tabulated. t-statistics appear in parentheses.
Dependent variable Coefficient
(t-statistic) Returns-firm
0.243 (13.07)
Returns-market
0.110 (0.67)
BERK
-0.155 (-2.23)
LOWCOMP (Lake Woebegone effect)
0.518 (32.27)
LOWCOMP* BERK (Lake Woebegone effect at Berkshire firms)
0.026 (0.28)
Control variables Ln market cap
0.049 (14.66)
ΔROA 0.012 (0.18)
log(Salesit/Salesit-1)
0.193 (6.25)
Number of firm-year observations 17326
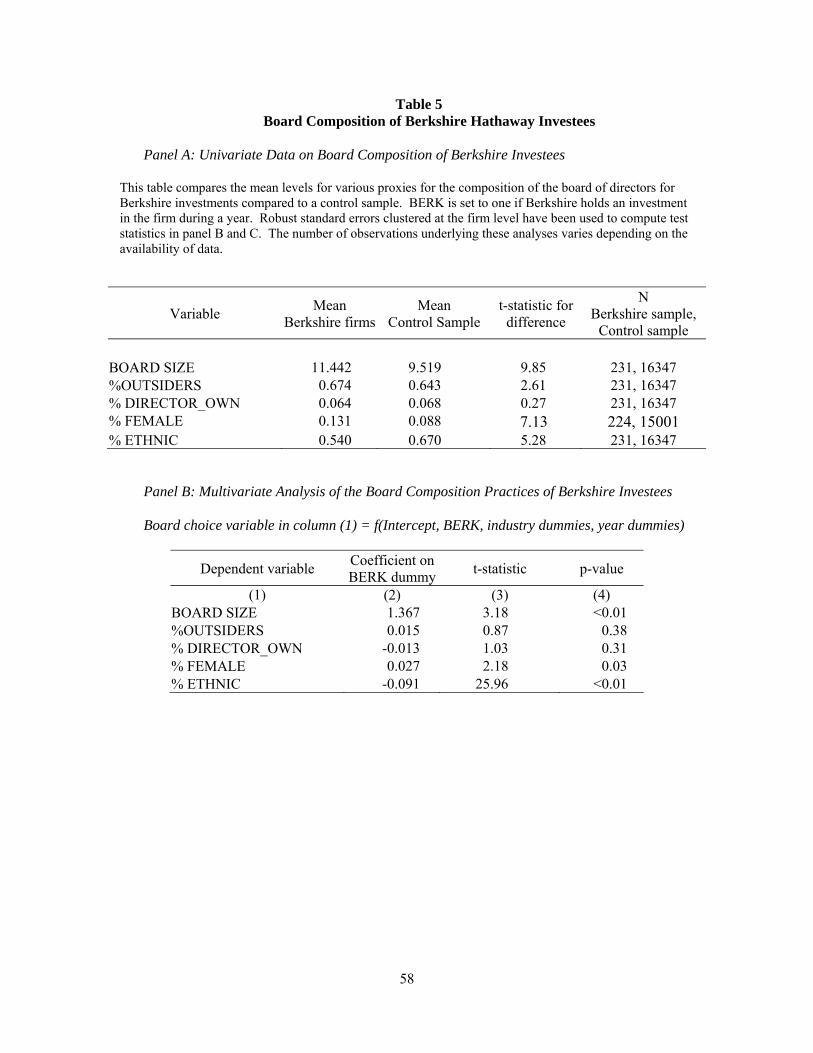
58
Table 5 Board Composition of Berkshire Hathaway Investees
Panel A: Univariate Data on Board Composition of Berkshire Investees
This table compares the mean levels for various proxies for the composition of the board of directors for Berkshire investments compared to a control sample. BERK is set to one if Berkshire holds an investment in the firm during a year. Robust standard errors clustered at the firm level have been used to compute test statistics in panel B and C. The number of observations underlying these analyses varies depending on the availability of data.
Variable Mean Berkshire firms
Mean Control Sample
t-statistic for difference
N Berkshire sample,
Control sample
BOARD SIZE 11.442 9.519 9.85 231, 16347 %OUTSIDERS 0.674 0.643 2.61 231, 16347 % DIRECTOR_OWN 0.064 0.068 0.27 231, 16347 % FEMALE 0.131 0.088 7.13 224, 15001 % ETHNIC 0.540 0.670 5.28 231, 16347
Panel B: Multivariate Analysis of the Board Composition Practices of Berkshire Investees Board choice variable in column (1) = f(Intercept, BERK, industry dummies, year dummies)
Dependent variable Coefficient on BERK dummy t-statistic p-value
(1) (2) (3) (4) BOARD SIZE 1.367 3.18 <0.01 %OUTSIDERS 0.015 0.87 0.38 % DIRECTOR_OWN -0.013 1.03 0.31 % FEMALE 0.027 2.18 0.03 % ETHNIC -0.091 25.96 <0.01

59
Table 6 Evidence on Investing Principles of Berkshire Hathaway Investees
Panel A: Univariate Data on Investing Principles of Berkshire Investees
This table compares the mean levels for various proxies for the investing principles underlying Berkshire investments compared to a control sample. BERK is set to one if Berkshire holds an investment in the firm during a year. Robust standard errors clustered at the firm level have been used to compute test statistics in panel B and C. The number of observations underlying these analyses varies depending on the availability of data.
Variable Mean Berkshire firms
Mean Control Sample
t-statistic for difference
N Berkshire sample,
Control sample Investing principles OWNER_RET 0.276 0.068 12.51 454, 108637 ROE 0.178 0.011 12.16 478, 110166 VOL_OWNER_RET 0.118 0.329 13.91 486, 117953 OWNER_RET_TANGIBLE 0.292 0.085 10.31 454, 108637 RUN-SALES (years) 3.056 2.711 5.22 445, 80472 RUN-OWNERS RETURN (years)
3.036 3.092 1.10 445, 80472
RUN-OIBD (years) 3.034 2.794 0.83 445, 80472 RUN-IBEX (years) 2.964 2.819 2.84 445, 80472 % REPAYERS BLEV 0.211 0.227 2.11 478, 110166 MLEV 0.210 0.248 4.24 478, 108637 PENS_LIAB 0.109 0.104 0.54 287, 39180 OPEB 0.020 0.029 2.94 57, 3087 SPLIT# 0.564 0.521 0.9 374, 85146 Intrinsic value |V/P-1| 0.478 0.757 2.59 474, 97652 GOOD SEO% 0.333 0.797 1.68 12, 5467 V/SEOPRICE 1.255 0.714 2.95 12, 5467 GOOD ACQ% 0.867 0.789 0.73 15, 3829 V/P before acquisition 0.693 0.681 0.08 15, 3829

60
Table 6 (continued) Evidence on Investing Principles of Berkshire Hathaway Investees
Panel B: Analysis of the Investing Principles of Berkshire Investments Dependent variable in column (1) = f(Intercept, BERK, industry dummies, year dummies) T-statistic shown in parentheses.
Dependent variable Coefficient on BERK dummy
OWNER_RET
0.1170 (76.23)
ROE
0.114 (7.66)
VOL_OWNER_RET
-0.136 (4.66)
OWNER_RET_TANGIBLE
0.146 (3.18)
RUN-SALES
0.092 (2.72)
RUN-OWNERS RETURN
0.046 (1.98)
RUN-OIBD
0.060 (2.42)
RUN-IBEX
0.033 (1.58)
MLEV
-0.070 (4.12)
PENS_LIAB
0.001 (0.06)
OPEB
-0.004 (-0.84)
SPLIT#
-0.040 (0.44)
|V/P-1|
-0.333 (2.37)
GOOD SEO%
-0.2501 (1.68)
V/SEOPRICE
0.249 (1.24)
GOOD ACQ%
0.177 (2.33)
V/P before Acquisition
-0.157 (1.92)

61
Table 7 Selection or Intervention at Berkshire Hathaway Investees
We restrict the sample to firms here (i) BH has a 5% or more holding; and (ii) BH has not held the stock for at least one year during the sample period. We regress select firm characteristics (e.g., earnings quality conservatism score) against the BERK dummy for a sample consisting of only BH investments. Certain characteristics such as EXPENSER are not considered due to very limited data. The BERK dummy is set to one only when BH invests in the firm’s stock. Hence, the coefficient on BERK would indicate whether the corporate practice under investigation changed after Buffett assumed a stake in the company.
Dependent variable Coefficient on BERK dummy t-statistic p-value N Post investment,
N pre-investment
CSCORE 0.013 0.51 0.60 190, 447 GSCORE -0.004 -1.58 0.11 190, 447 PRO_FORMA GAP 0.002 0.71 0.47 189, 224 DD 0.012 3.22 <0.01 195, 325 |ABACC| 0.006 1.13 0.26 204, 346 GUIDANCE 0.456 0.48 0.63 52, 36 MEET_BEATS -0.043 -0.97 0.33 121, 196 SMALL_MEET_BEATS -0.041 -1.33 0.18 121, 196 FOG INDEX 0.036 0.14 0.89 87, 67
Panel B: Multivariate Analysis of Pension Rate Assumptions of Berkshire Investees PENSION_RATE = f (Intercept, log ratio of pension assets to operating income, BERK dummy, BERK dummy*pension sensitivity, industry dummies, year dummies)
Independent variable Coefficient T-statistic p-value (1) (2) (3) (4)
Log (Pension assets/operating income) 0.057 1.36 0.17 BERK -0.171 -0.93 0.35 Log (Pension assets/operating income)*BERK
-0.088 -1.49 0.13
Intercept, industry and year dummies included but not reported
N 212
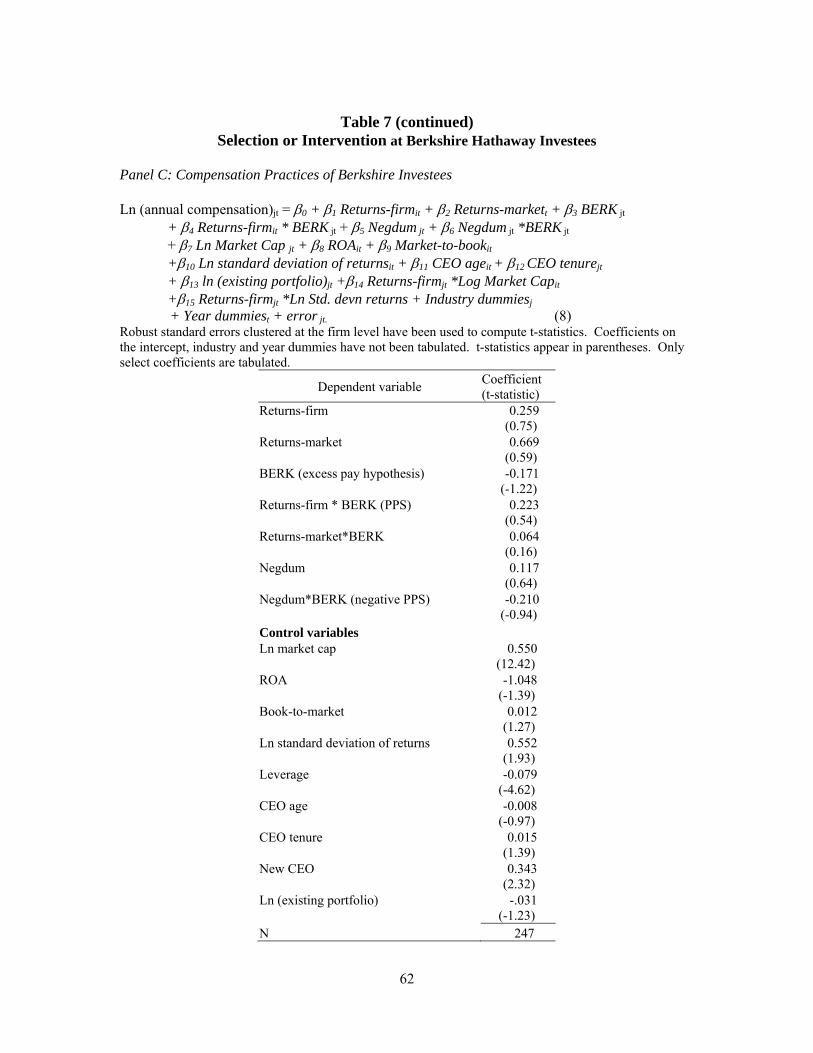
62
Table 7 (continued)
Selection or Intervention at Berkshire Hathaway Investees
Panel C: Compensation Practices of Berkshire Investees Ln (annual compensation)jt = β0 + β1 Returns-firmit + β2 Returns-markett + β3 BERK jt
+ β4 Returns-firmit * BERK jt + β5 Negdum jt + β6 Negdum jt *BERK jt + β7 Ln Market Cap jt + β8 ROAit + β9 Market-to-bookit +β10 Ln standard deviation of returnsit + β11 CEO ageit + β12 CEO tenurejt + β13 ln (existing portfolio)jt +β14 Returns-firmjt *Log Market Capit +β15 Returns-firmjt *Ln Std. devn returns + Industry dummiesj
+ Year dummiest + error jt. (8) Robust standard errors clustered at the firm level have been used to compute t-statistics. Coefficients on the intercept, industry and year dummies have not been tabulated. t-statistics appear in parentheses. Only select coefficients are tabulated.
Dependent variable Coefficient (t-statistic)
Returns-firm
0.259 (0.75)
Returns-market
0.669 (0.59)
BERK (excess pay hypothesis)
-0.171 (-1.22)
Returns-firm * BERK (PPS)
0.223 (0.54)
Returns-market*BERK
0.064 (0.16)
Negdum
0.117 (0.64)
Negdum*BERK (negative PPS)
-0.210 (-0.94)
Control variables Ln market cap
0.550 (12.42)
ROA
-1.048 (-1.39)
Book-to-market
0.012 (1.27)
Ln standard deviation of returns
0.552 (1.93)
Leverage
-0.079 (-4.62)
CEO age
-0.008 (-0.97)
CEO tenure
0.015 (1.39)
New CEO
0.343 (2.32)
Ln (existing portfolio)
-.031 (-1.23)
N 247

63
Table 7 (continued) Selection or Intervention at Berkshire Hathaway Investees
Panel D: Lake Woebegone Effect at Berkshire Investees The table presents results from estimating the following equation
Log(annual compensationit /annual compensationit-1) = β0 + β1 Returns-firmit + β2 Returns-markett + β3 BERK jt +β4 LOWCOMPit + β5 LOWCOMP*BERKit+ β6 Ln Market Cap jt + β7ΔROAit + β8 log(Salesit/Salesit-1) + Industry dummiesj+ Year dummiest + error jt. (9)
Robust standard errors clustered at the firm level have been used to compute t-statistics. Coefficients on the intercept, industry and year dummies have not been tabulated. t-statistics appear in parentheses. Only select coefficients are tabulated. N=217 firm-years.
Dependent variable Coefficient
(t-statistic) Returns-firm
0.202 (1.38)
Returns-market
-1.417 (-1.18)
BERK
-0.294 (-2.94)
LOWCOMP (Lake Woebegone effect)
0.250 (2.09)
LOWCOMP* BERK (at Berkshire firms)
0.327 (2.32)
N 217
Panel E: Multivariate Analysis of the Board Composition of Berkshire Investees Board choice variable in column (1) = f(Intercept, BERK, industry dummies, year dummies)
Dependent variable Coefficient on BERK dummy t-statistic p-value N Post investment,
N pre-investment (1) (2) (3) (4)
BOARD SIZE -1.072 -2.56 0.01 104, 85 %OUTSIDERS -0.018 -0.61 0.54 104, 85 % DIRECTOR_OWN 0.006 0.36 0.72 104, 85 % FEMALE -0.003 -0.36 0.72 103,73 % ETHNIC 0.022 0.71 0.48 104, 85

64
Table 7 (continued) Selection or Intervention at Berkshire Hathaway Investees
Panel F: Investing principles
Dependent variable Coefficient on BERK dummy t-statistic p-value N Post investment,
N pre-investment
OWNER_RET -0.002 -0.05 0.96 188, 334 ROE -0.004 0.14 0.88 204, 346 VOL_OWNER_RET -0.003 -0.09 0.93 208, 346 OWNER_RET_TANGIBLE 0.082 1.05 0.29 188, 334 MLEV -0.038 -1.51 0.132 204, 345 PENS_LIAB 0.001 0.06 0.949 165, 183 SPLIT# -0.089 -0.65 0.515 197, 238 |V/P-1| -0.182 -1.36 0.174 203, 358
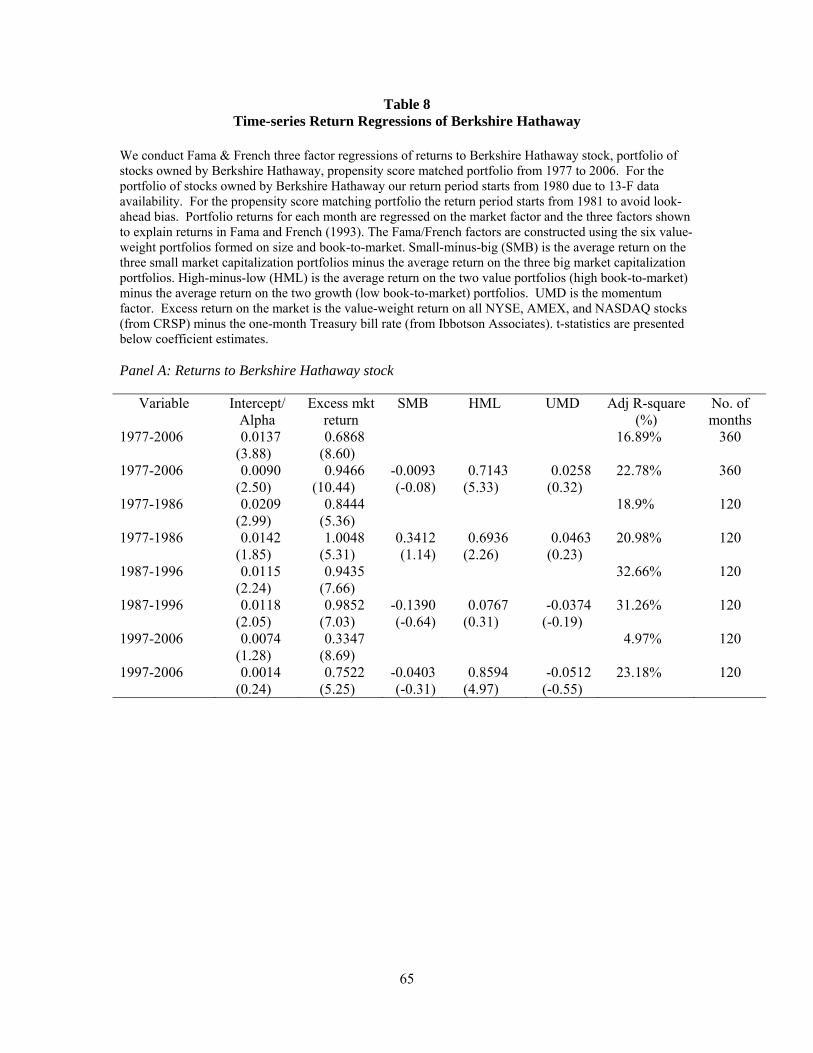
65
Table 8 Time-series Return Regressions of Berkshire Hathaway
We conduct Fama & French three factor regressions of returns to Berkshire Hathaway stock, portfolio of stocks owned by Berkshire Hathaway, propensity score matched portfolio from 1977 to 2006. For the portfolio of stocks owned by Berkshire Hathaway our return period starts from 1980 due to 13-F data availability. For the propensity score matching portfolio the return period starts from 1981 to avoid look-ahead bias. Portfolio returns for each month are regressed on the market factor and the three factors shown to explain returns in Fama and French (1993). The Fama/French factors are constructed using the six value-weight portfolios formed on size and book-to-market. Small-minus-big (SMB) is the average return on the three small market capitalization portfolios minus the average return on the three big market capitalization portfolios. High-minus-low (HML) is the average return on the two value portfolios (high book-to-market) minus the average return on the two growth (low book-to-market) portfolios. UMD is the momentum factor. Excess return on the market is the value-weight return on all NYSE, AMEX, and NASDAQ stocks (from CRSP) minus the one-month Treasury bill rate (from Ibbotson Associates). t-statistics are presented below coefficient estimates. Panel A: Returns to Berkshire Hathaway stock
Variable Intercept/ Alpha
Excess mkt return
SMB HML UMD Adj R-square (%)
No. of months
1977-2006 0.0137 (3.88)
0.6868 (8.60)
16.89% 360
1977-2006 0.0090 (2.50)
0.9466 (10.44)
-0.0093 (-0.08)
0.7143 (5.33)
0.0258 (0.32)
22.78% 360
1977-1986 0.0209 (2.99)
0.8444 (5.36)
18.9% 120
1977-1986 0.0142 (1.85)
1.0048 (5.31)
0.3412 (1.14)
0.6936 (2.26)
0.0463 (0.23)
20.98% 120
1987-1996 0.0115 (2.24)
0.9435 (7.66)
32.66% 120
1987-1996 0.0118 (2.05)
0.9852 (7.03)
-0.1390 (-0.64)
0.0767 (0.31)
-0.0374 (-0.19)
31.26% 120
1997-2006 0.0074 (1.28)
0.3347 (8.69)
4.97% 120
1997-2006 0.0014 (0.24)
0.7522 (5.25)
-0.0403 (-0.31)
0.8594 (4.97)
-0.0512 (-0.55)
23.18% 120
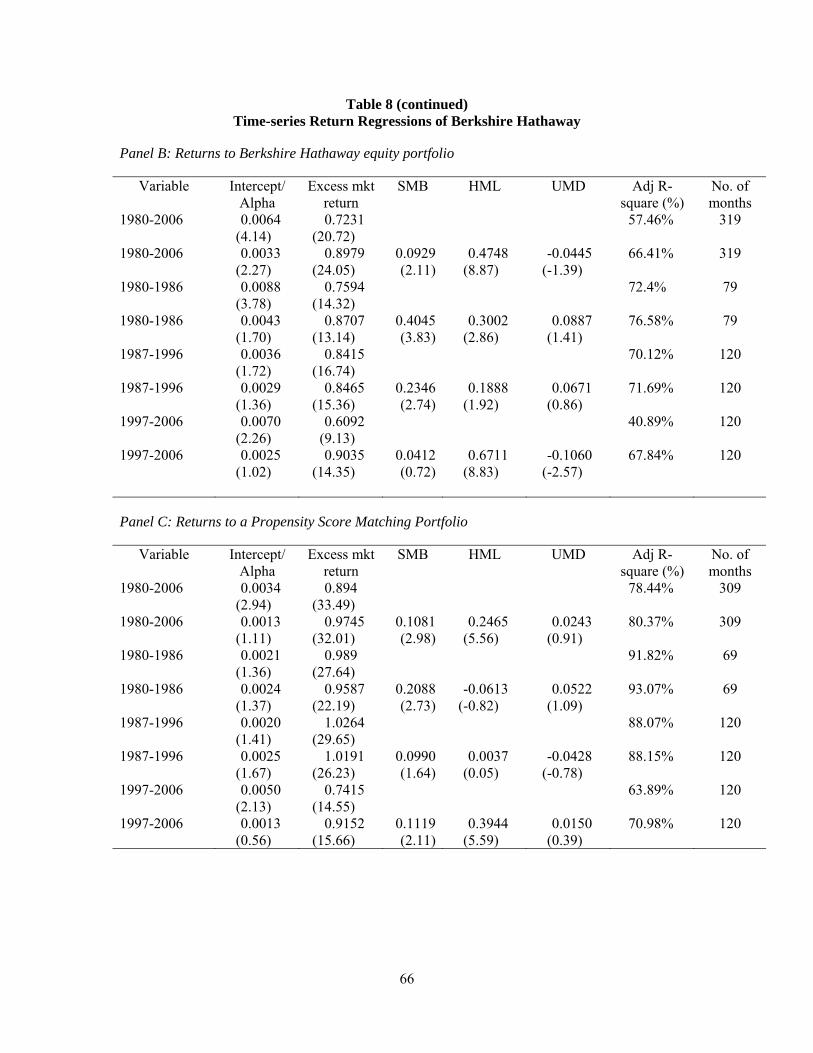
66
Table 8 (continued) Time-series Return Regressions of Berkshire Hathaway
Panel B: Returns to Berkshire Hathaway equity portfolio
Variable Intercept/ Alpha
Excess mkt return
SMB HML UMD Adj R-square (%)
No. of months
1980-2006 0.0064 (4.14)
0.7231 (20.72)
57.46% 319
1980-2006 0.0033 (2.27)
0.8979 (24.05)
0.0929 (2.11)
0.4748 (8.87)
-0.0445 (-1.39)
66.41% 319
1980-1986 0.0088 (3.78)
0.7594 (14.32)
72.4% 79
1980-1986 0.0043 (1.70)
0.8707 (13.14)
0.4045 (3.83)
0.3002 (2.86)
0.0887 (1.41)
76.58% 79
1987-1996 0.0036 (1.72)
0.8415 (16.74)
70.12% 120
1987-1996 0.0029 (1.36)
0.8465 (15.36)
0.2346 (2.74)
0.1888 (1.92)
0.0671 (0.86)
71.69% 120
1997-2006 0.0070 (2.26)
0.6092 (9.13)
40.89% 120
1997-2006 0.0025 (1.02)
0.9035 (14.35)
0.0412 (0.72)
0.6711 (8.83)
-0.1060 (-2.57)
67.84% 120
Panel C: Returns to a Propensity Score Matching Portfolio
Variable Intercept/ Alpha
Excess mkt return
SMB HML UMD Adj R-square (%)
No. of months
1980-2006 0.0034 (2.94)
0.894 (33.49)
78.44% 309
1980-2006 0.0013 (1.11)
0.9745 (32.01)
0.1081 (2.98)
0.2465 (5.56)
0.0243 (0.91)
80.37% 309
1980-1986 0.0021 (1.36)
0.989 (27.64)
91.82% 69
1980-1986 0.0024 (1.37)
0.9587 (22.19)
0.2088 (2.73)
-0.0613 (-0.82)
0.0522 (1.09)
93.07% 69
1987-1996 0.0020 (1.41)
1.0264 (29.65)
88.07% 120
1987-1996 0.0025 (1.67)
1.0191 (26.23)
0.0990 (1.64)
0.0037 (0.05)
-0.0428 (-0.78)
88.15% 120
1997-2006 0.0050 (2.13)
0.7415 (14.55)
63.89% 120
1997-2006 0.0013 (0.56)
0.9152 (15.66)
0.1119 (2.11)
0.3944 (5.59)
0.0150 (0.39)
70.98% 120