The impact of income and household situation on the utilisation of long-term care - comparing Sweden...
47
The impact of income The impact of income and household and household situation on the situation on the utilisation of long- utilisation of long- term care term care - - comparing Sweden (data from the comparing Sweden (data from the SNAC study) and Japan (Handa) SNAC study) and Japan (Handa) Mårten Lagergren Mårten Lagergren Brussels, October 30th, 2008 Brussels, October 30th, 2008
-
Upload
domenic-henderson -
Category
Documents
-
view
215 -
download
2
Transcript of The impact of income and household situation on the utilisation of long-term care - comparing Sweden...

The impact of income and The impact of income and household situation on the household situation on the
utilisation of long-term utilisation of long-term carecare
- - comparing Sweden (data from the SNAC comparing Sweden (data from the SNAC study) and Japan (Handa)study) and Japan (Handa)
Mårten Lagergren Mårten Lagergren Brussels, October 30th, 2008Brussels, October 30th, 2008

The system of long-term care of The system of long-term care of the elderly in Swedenthe elderly in Sweden
Social services are provided by the municipality Social services are provided by the municipality in ordinary or special housing. Health care in ordinary or special housing. Health care mainly provided by the country council. mainly provided by the country council. Financing by taxes.Financing by taxes.
Many elderly live alone – but with help from Many elderly live alone – but with help from their children their children
Principle of ‘Aging in place’ – support in order Principle of ‘Aging in place’ – support in order to be able to continue independent livingto be able to continue independent living
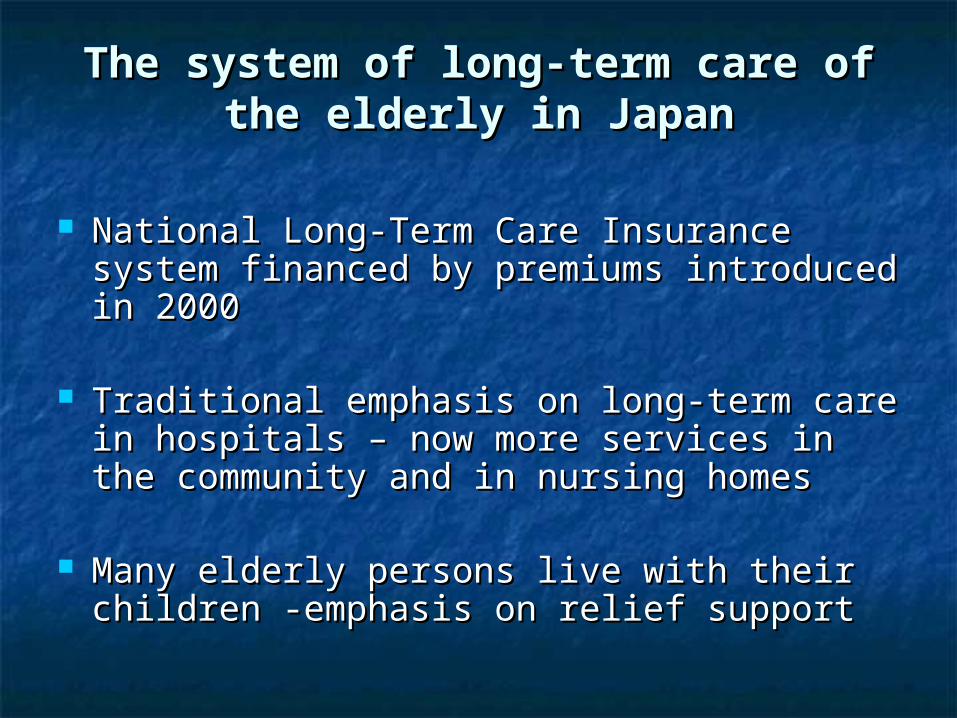
The system of long-term care of The system of long-term care of the elderly in Japanthe elderly in Japan
National Long-Term Care Insurance National Long-Term Care Insurance system financed by premiums introduced system financed by premiums introduced in 2000in 2000
Traditional emphasis on long-term care in Traditional emphasis on long-term care in hospitals – now more services in the hospitals – now more services in the community and in nursing homescommunity and in nursing homes
Many elderly persons live with their Many elderly persons live with their children -emphasis on relief supportchildren -emphasis on relief support

Long-term care activities in Long-term care activities in Sweden and JapanSweden and Japan
Care activity Japan Sweden
Home help Home help Home help
Other home activities
Home bath
Aids
Home medical care
Home health care
Activities outside home
Day care
Day rehabilitation
Day care
Day rehabilitation Short-time care Nursing home, short time
Health home, short time
Hospital care, short time
Nursing home, short time
Institutional care
Group living
Nursing home
Hospital long-term care
Special housing - around-the-clock care

Assessment of aged care Assessment of aged care needs in Swedenneeds in Sweden
Informal assessment by care managers in Informal assessment by care managers in the municipalitythe municipality
According to the law the entire life According to the law the entire life situation of the old person should be taken situation of the old person should be taken into considerationinto consideration
Detailed decision concerning type and Detailed decision concerning type and amount of services amount of services

Assessment of aged care Assessment of aged care needs in Japan needs in Japan
Very formal assessment of needs through Very formal assessment of needs through detailed questionnaire and computer detailed questionnaire and computer calculationcalculation
According to law only personal According to law only personal dependency should form basis of decision dependency should form basis of decision

Allotment of services in Allotment of services in SwedenSweden
Large differencies between municipalities Large differencies between municipalities when it comes to coverage and amount of when it comes to coverage and amount of allotted services allotted services
Very low co-payments – average 4%. High Very low co-payments – average 4%. High uptake of allotted services uptake of allotted services
Actually executed services may differ from Actually executed services may differ from decideddecided

Allotment of services in Allotment of services in JapanJapan
The assessment results in an allotted care The assessment results in an allotted care level – actual content within that level is level – actual content within that level is decided by the old person in co-operation decided by the old person in co-operation with a care managerwith a care manager
Fairly high co-payments (10%) result in Fairly high co-payments (10%) result in relatively low uptake of services in relation relatively low uptake of services in relation to the allotted care level (40%)to the allotted care level (40%)
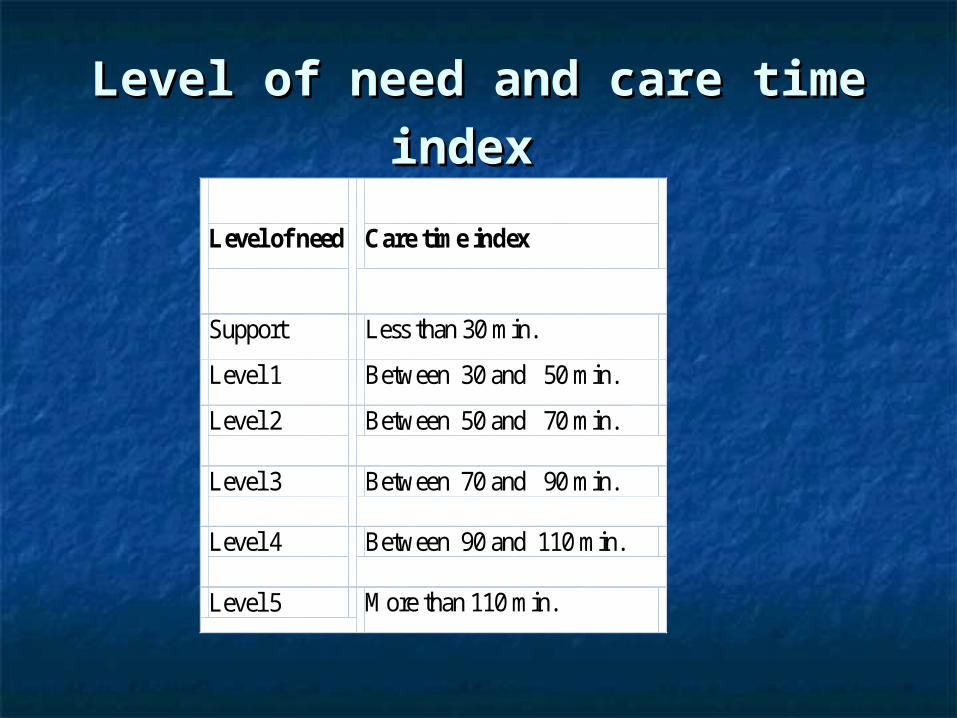
Level of need and care time Level of need and care time
indexindex
Level of need
Care time index
Support Less than 30 min.
Level 1 Between 30 and 50 min.
Level 2
Between 50 and 70 min.
Level 3
Between 70 and 90 min.
Level 4
Between 90 and 110 min.
Level 5 More than 110 min.
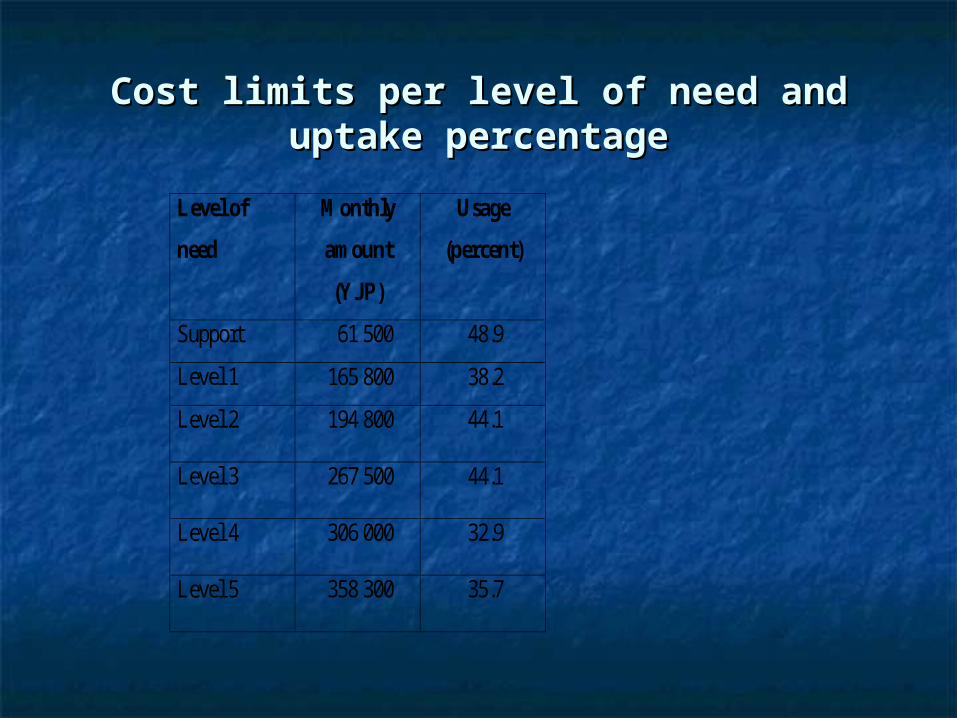
Cost limits per level of need and uptake Cost limits per level of need and uptake percentagepercentage
Level of
need
Monthly
amount
(YJP)
Usage
(percent)
Support 61 500 48.9
Level 1 165 800 38.2
Level 2
194 800 44.1
Level 3
267 500 44.1
Level 4
306 000 32.9
Level 5
358 300 35.7
Data set from SwedenData set from Sweden
Data collected in the SNAC study – care Data collected in the SNAC study – care system part, Kungsholmen, 2002 -2005system part, Kungsholmen, 2002 -2005
Data include needs assessment variables Data include needs assessment variables and allotted services and allotted services
Dataset contains 2676 observations Dataset contains 2676 observations

SNACSNACSwedish National Swedish National
study on Ageing and study on Ageing and CareCare

SNACSNAC
The development of longitudinal areaThe development of longitudinal area
databases for monitoring and analysis ofdatabases for monitoring and analysis of
the system of long-term care for elderlythe system of long-term care for elderly
persons in Swedenpersons in Sweden

SNAC - a four-centre SNAC - a four-centre individual-based longitudinal study individual-based longitudinal study
intended tointended to describe the ageing processdescribe the ageing process from different from different
aspects aspects the development of health, the development of health, functional and cognitive ability, social and functional and cognitive ability, social and economic situation etc., and economic situation etc., and
monitor the total consumption of health monitor the total consumption of health and social careand social care of the elderly population in of the elderly population in the area. the area.

Four different areasFour different areas Five municipalities in Region SkåneFive municipalities in Region Skåne
(Eslöv, Hässleholm, Malmö, Osby, Ystad)(Eslöv, Hässleholm, Malmö, Osby, Ystad)
KarlskronaKarlskrona municipality in Blekingemunicipality in Blekinge
Kungsholmen district, StockholmKungsholmen district, Stockholm
Municipality of NordanstigMunicipality of Nordanstig
All four areas follow the same design and use All four areas follow the same design and use the same core protocol the same core protocol

Basic study designBasic study design
Population perspectivePopulation perspective in order to describe the life situation of in order to describe the life situation of
the elderly and the ageing process the elderly and the ageing process
Care system perspective Care system perspective in order to describe the functioning of the in order to describe the functioning of the
system of health and social care for the system of health and social care for the elderly in relation to their needselderly in relation to their needs

Care system perspectiveCare system perspective
Systematic, longitudinal, individual-based Systematic, longitudinal, individual-based collection of data concerning the operations of collection of data concerning the operations of the system of long-term care for the elderly the system of long-term care for the elderly
All changes in the provision of long-term care All changes in the provision of long-term care by municipality or county council are recorded by municipality or county council are recorded
The recording includes measures of The recording includes measures of dependency/ functional ability, housing and dependency/ functional ability, housing and informal care and allotted servicesinformal care and allotted services
Data set from Japan Data set from Japan
Data collected in Handa municipality in Data collected in Handa municipality in connection to needs assessment in connection to needs assessment in National Long-Term Care Insurance National Long-Term Care Insurance
Data include need assessment variables, Data include need assessment variables, allotted level of need (0 (support) and 1 – allotted level of need (0 (support) and 1 – 5 ) and provided services5 ) and provided services
Comparability of dataComparability of data
Swedish and Japanese datasets differ Swedish and Japanese datasets differ but contain essentially comparable but contain essentially comparable information information
Sometimes combinations of variables Sometimes combinations of variables or calibration is needed in order to or calibration is needed in order to achieve comparabilityachieve comparability
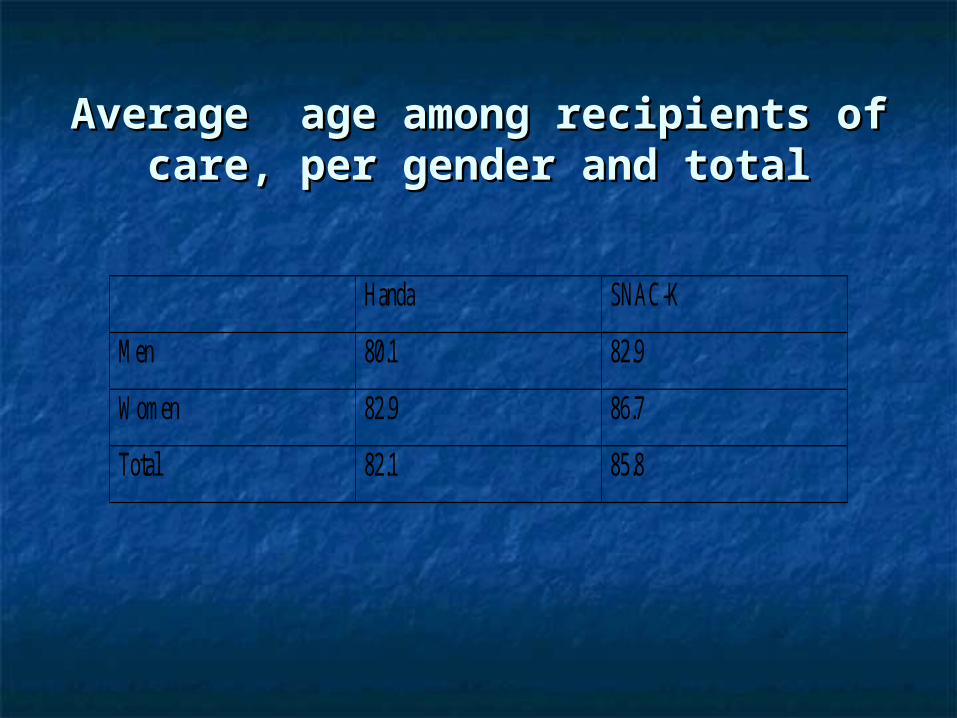
Average age among recipients of Average age among recipients of care, per gender and totalcare, per gender and total
Handa SNAC-K
Men 80.1 82.9
Women 82.9 86.7
Total 82.1 85.8
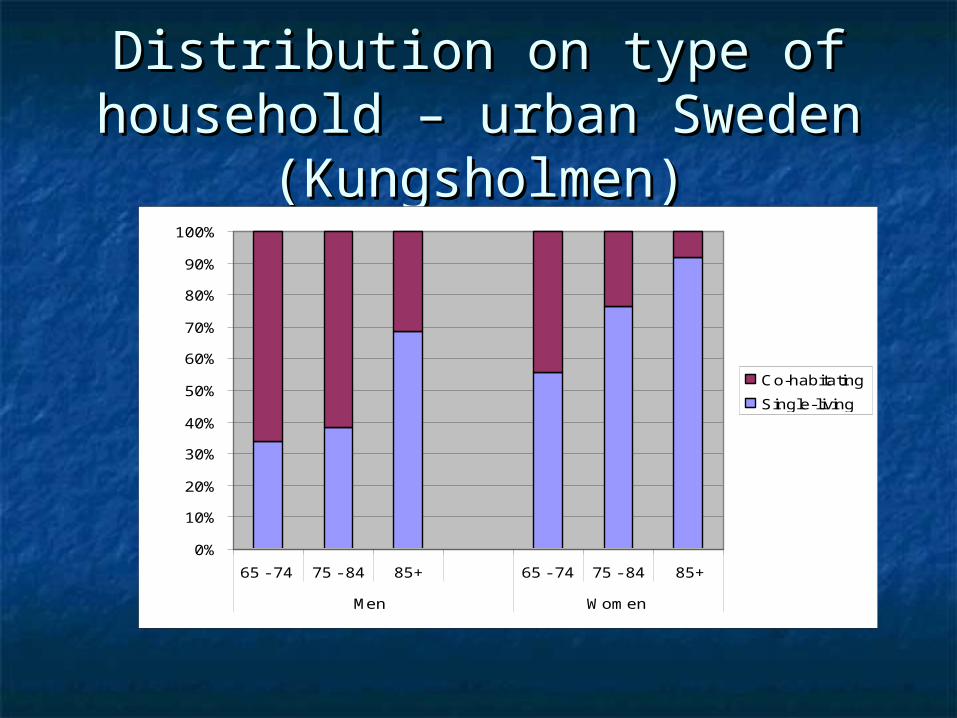
Distribution on type of Distribution on type of household – urban Sweden household – urban Sweden
(Kungsholmen)(Kungsholmen)
0%
10%
20%
30%
40%
50%
60%
70%
80%
90%
100%
65 - 74 75 - 84 85+ 65 - 74 75 - 84 85+
Men Women
Co-habitating
Single-living
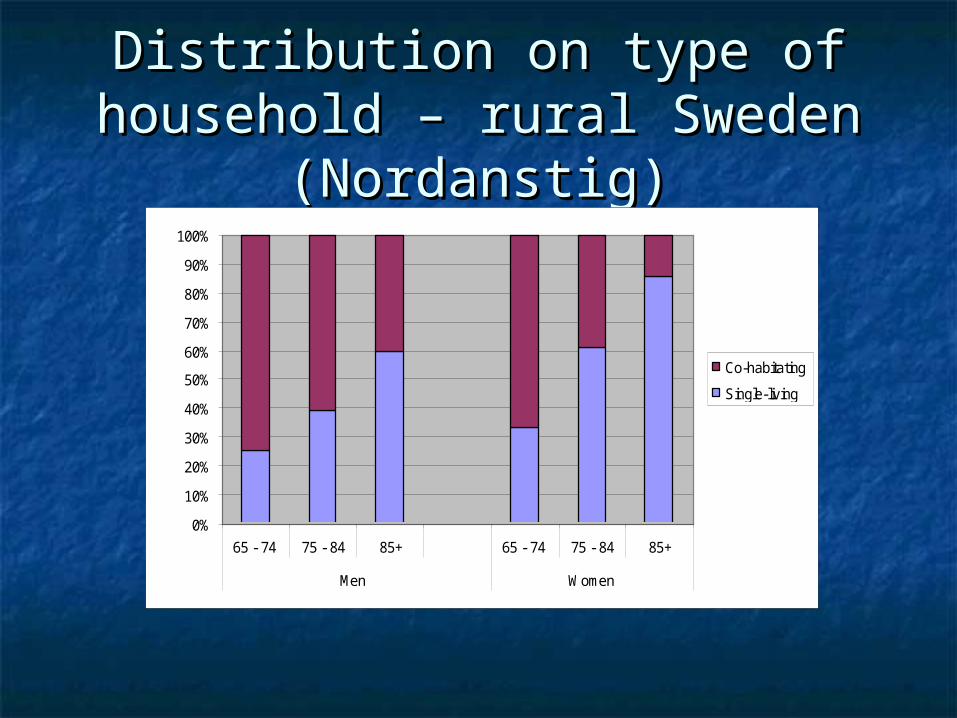
Distribution on type of Distribution on type of household – rural Sweden household – rural Sweden
(Nordanstig)(Nordanstig)
0%
10%
20%
30%
40%
50%
60%
70%
80%
90%
100%
65 - 74 75 - 84 85+ 65 - 74 75 - 84 85+
Men Women
Co-habitating
Single-living

Distribution on type of Distribution on type of household – recipients of LTC household – recipients of LTC urban Sweden urban Sweden (Kungsholmen)(Kungsholmen)
0%
10%
20%
30%
40%
50%
60%
70%
80%
90%
100%
65 - 74 75 - 84 85+ 65 - 74 75 - 84 85+
Men Women
Co-habitating
Single-living

Distribution on type of Distribution on type of household – recipients of LTC, household – recipients of LTC,
rural Sweden rural Sweden (Nordanstig)(Nordanstig)
0%
10%
20%
30%
40%
50%
60%
70%
80%
90%
100%
65 - 74 75 - 84 85+ 65 - 74 75 - 84 85+
Men Women
Co-habitating
Single-living

Recipients of LTC care – SwedenRecipients of LTC care – Sweden Distribution on income-groups per Distribution on income-groups per
age-group and genderage-group and gender
0%
10%
20%
30%
40%
50%
60%
70%
80%
90%
100%
65-74 75-84 85+ 65-74 75-84 85+
Men Women
15000- SEK
10000-14999 SEK
7500 - 9999 SEK
5000 - 7499 SEK
< 5000 SEK
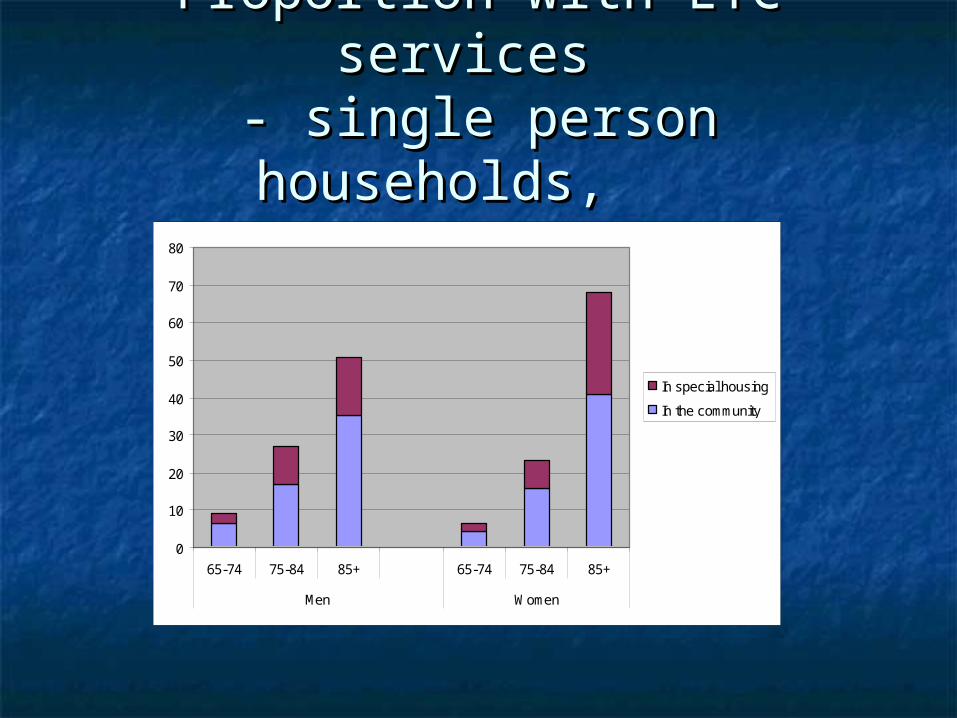
Proportion with LTC services Proportion with LTC services - single person households, - single person households,
Sweden (Kungsholmen)Sweden (Kungsholmen)
0
10
20
30
40
50
60
70
80
65-74 75-84 85+ 65-74 75-84 85+
Men Women
In special housing
In the community
0
10
20
30
40
50
60
70
80
65-74 75-84 85+ 65-74 75-84 85+
Men Women
In special housing
In the community
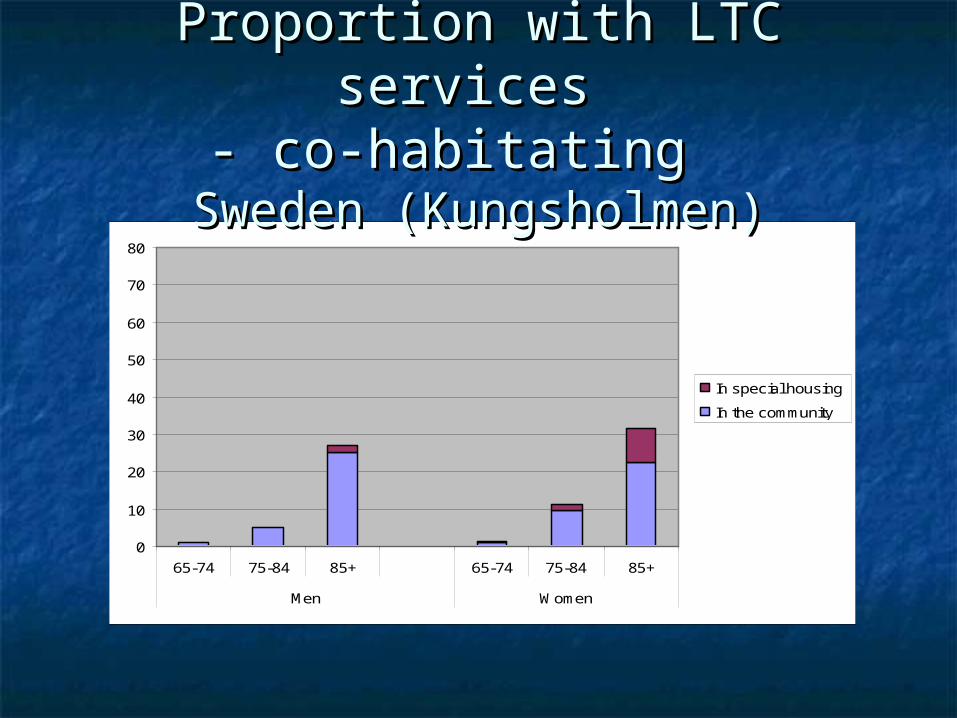
Proportion with LTC services Proportion with LTC services - co-habitating - co-habitating
Sweden (Kungsholmen)Sweden (Kungsholmen)

Average dependency (SNAC-Average dependency (SNAC-index) per income-groupindex) per income-group
- recipients of LTC, Kungsholmen- recipients of LTC, Kungsholmen
0,0
2,0
4,0
6,0
8,0
10,0
12,0
< 5000SEK
5000 - 7499SEK
7500 - 9999SEK
10000-14999SEK
15000-SEK
Men
Women
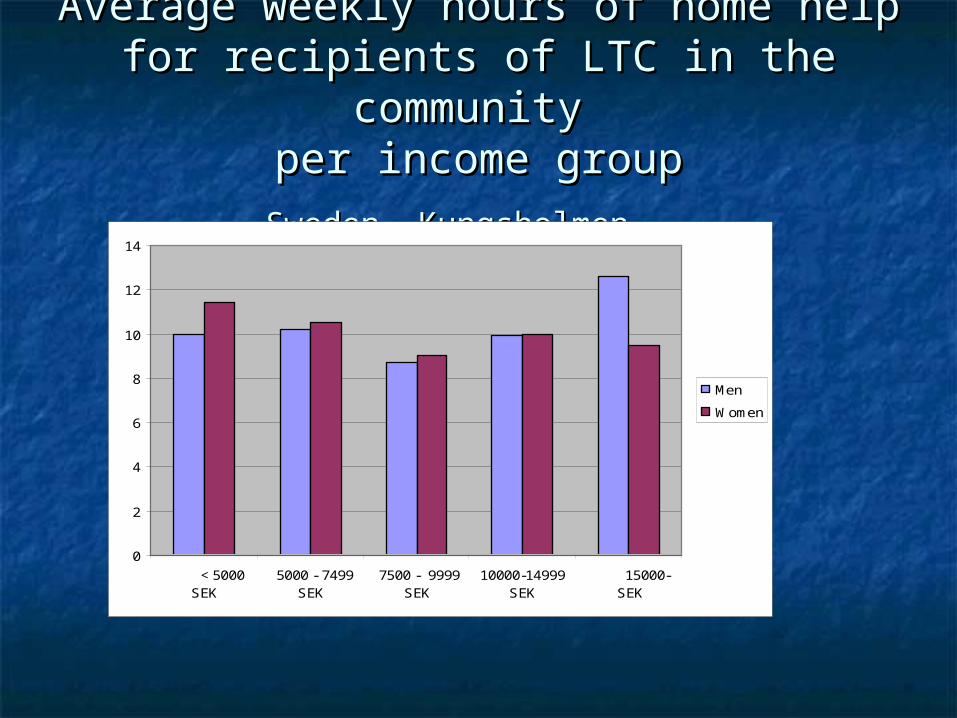
Average weekly hours of home help for Average weekly hours of home help for recipients of LTC in the communityrecipients of LTC in the community
per income groupper income group
Sweden, KungsholmenSweden, Kungsholmen
0
2
4
6
8
10
12
14
< 5000SEK
5000 - 7499SEK
7500 - 9999SEK
10000-14999SEK
15000-SEK
Men
Women
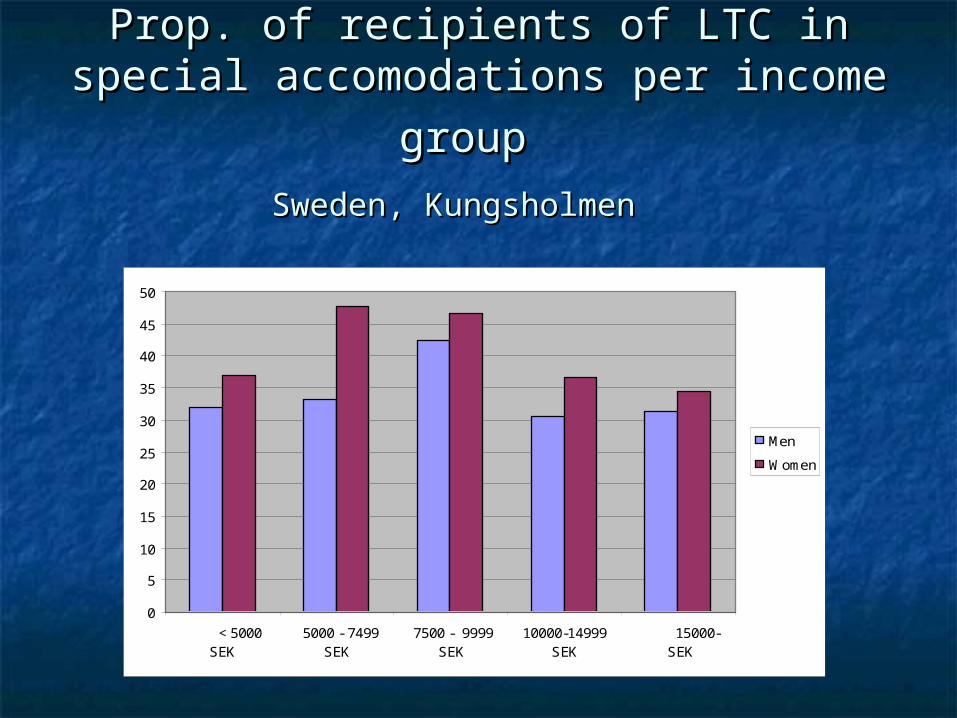
Prop. of recipients of LTC in special Prop. of recipients of LTC in special
accomodations per income groupaccomodations per income group Sweden, Kungsholmen Sweden, Kungsholmen
0
5
10
15
20
25
30
35
40
45
50
< 5000SEK
5000 - 7499SEK
7500 - 9999SEK
10000-14999SEK
15000-SEK
Men
Women

Distribution on type of Distribution on type of household for recipients of LTC household for recipients of LTC
– Japan (Handa)– Japan (Handa)
0%
20%
40%
60%
80%
100%
65-74 75-84 85+ 65-74 75-84 85+
Men Women
Co-habitating other
Co-habitating 3 - generations
Co-habitating 2 -generations
Co-habitating with spouse
Single-living

Distribution on income-group per Distribution on income-group per age-group and gender, Japan age-group and gender, Japan
(Handa)(Handa)
0%
10%
20%
30%
40%
50%
60%
65-74 75-84 85+ 65-74 75-84 85+
Men Women
Income group 1
Income group 2
Income group 3
Income group 4
Income group 5

Distribution on income-groups per Distribution on income-groups per
type of household, Japan (Handa)type of household, Japan (Handa)
0%
10%
20%
30%
40%
50%
60%
70%
80%
Single-living Co-habitatingw ith spouse
Co-habitating, 2-generations
Co-habitating, 3-generations
Co-habitating,
other
Income group 1
Income group 2
Income group 3
Income group 4
Income group 5
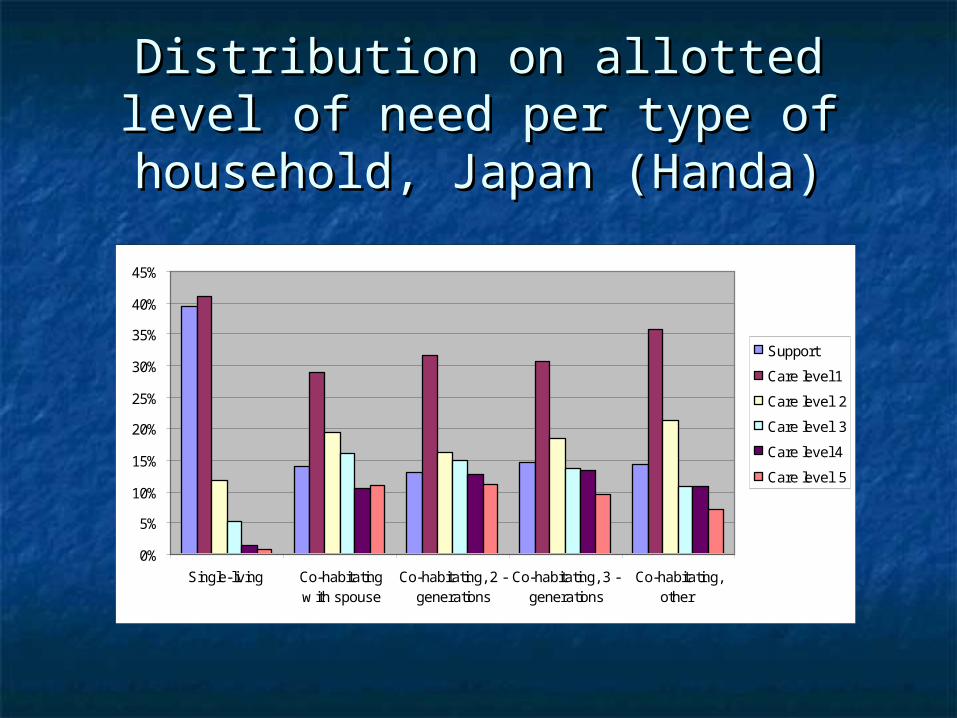
Distribution on allotted level of Distribution on allotted level of need per type of household, Japan need per type of household, Japan
(Handa)(Handa)
0%
5%
10%
15%
20%
25%
30%
35%
40%
45%
Single-living Co-habitatingw ith spouse
Co-habitating, 2 -generations
Co-habitating, 3 -generations
Co-habitating,other
Support
Care level 1
Care level 2
Care level 3
Care level 4
Care level 5

Distribution on level of need per Distribution on level of need per income-group, Japan (Handa)income-group, Japan (Handa)
0%
5%
10%
15%
20%
25%
30%
35%
Income group 1 Income group 2 Income group 3 Income group 4 Income group 5
Support
Care level 1
Care level 2
Care level 3
Care level 4
Care level 5
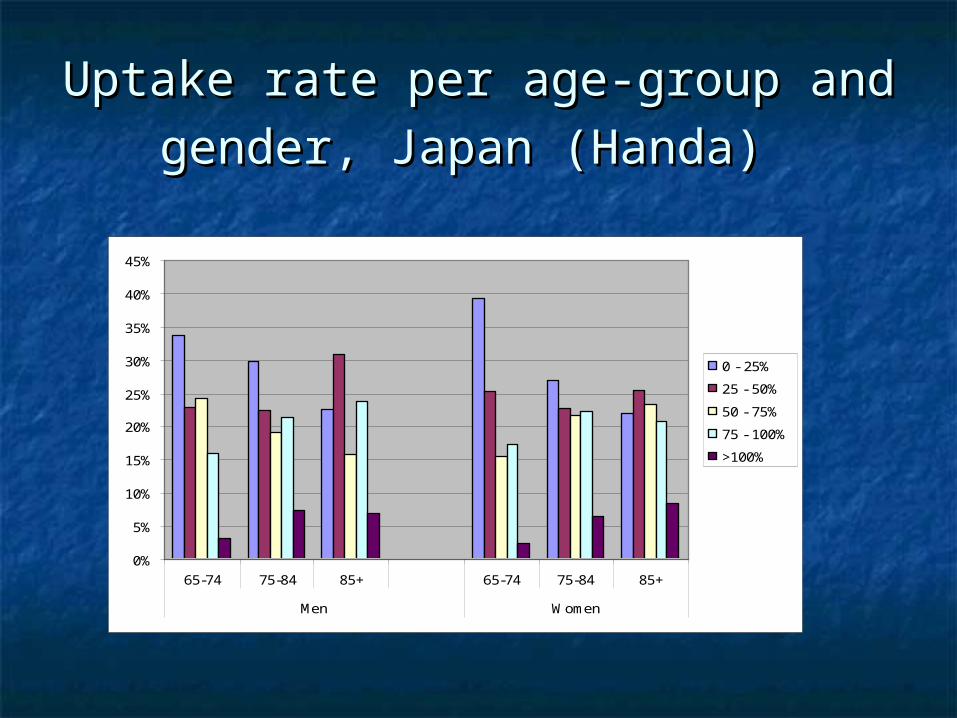
Uptake rate per age-group and Uptake rate per age-group and
gender, Japan (Handa)gender, Japan (Handa)
0%
5%
10%
15%
20%
25%
30%
35%
40%
45%
65-74 75-84 85+ 65-74 75-84 85+
Men Women
0 - 25%
25 - 50%
50 - 75%
75 - 100%
>100%

Average up-take rate per age-Average up-take rate per age-group and gender, Japan (Handa)group and gender, Japan (Handa)
0%
10%
20%
30%
40%
50%
60%
65-74 75-84 85+ 65-74 75-84 85+
Men Women
Mean value

Uptake rate per level of Uptake rate per level of dependency (PADL-groups), Japan dependency (PADL-groups), Japan
(Handa)(Handa)
0%
5%
10%
15%
20%
25%
30%
35%
40%
45%
No or slightdependency
Moderatedependency
Dependent Verydependent
Totaldependency
Total
0 - 25%
25 - 50%
50 -75%
75 - 100%
>100%

Average uptake rate per level of Average uptake rate per level of dependency (PADL-groups), Japan dependency (PADL-groups), Japan
(Handa)(Handa)
0%
10%
20%
30%
40%
50%
60%
70%
No or slightdependency
Moderatedependency
Dependent Verydependent
Totaldependency
Total
Mean value
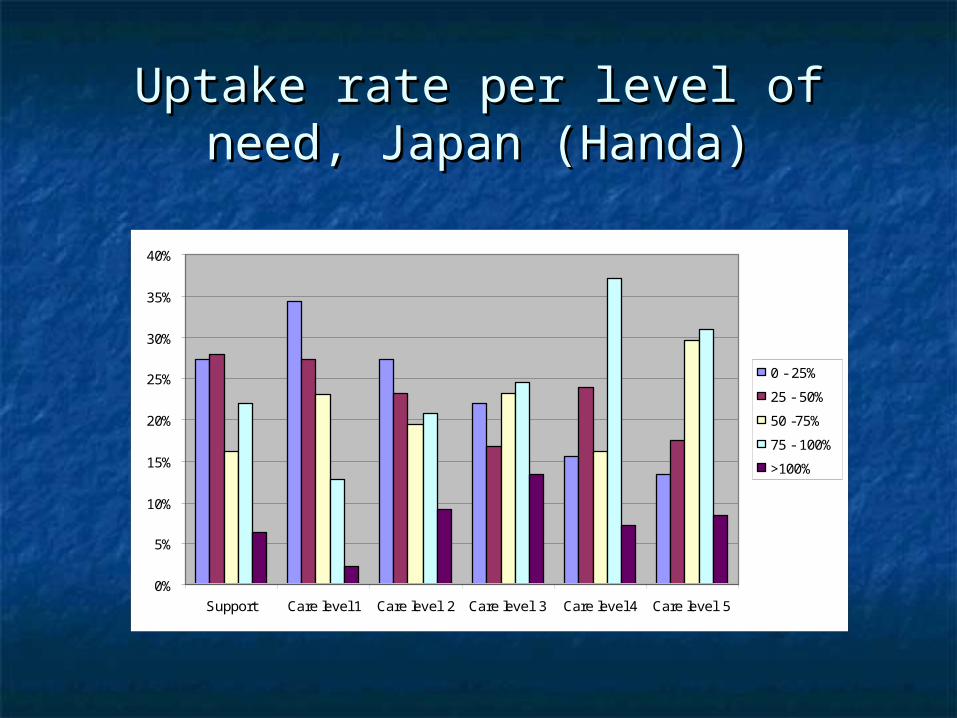
Uptake rate per level of need, Uptake rate per level of need, Japan (Handa)Japan (Handa)
0%
5%
10%
15%
20%
25%
30%
35%
40%
Support Care level 1 Care level 2 Care level 3 Care level 4 Care level 5
0 - 25%
25 - 50%
50 -75%
75 - 100%
>100%
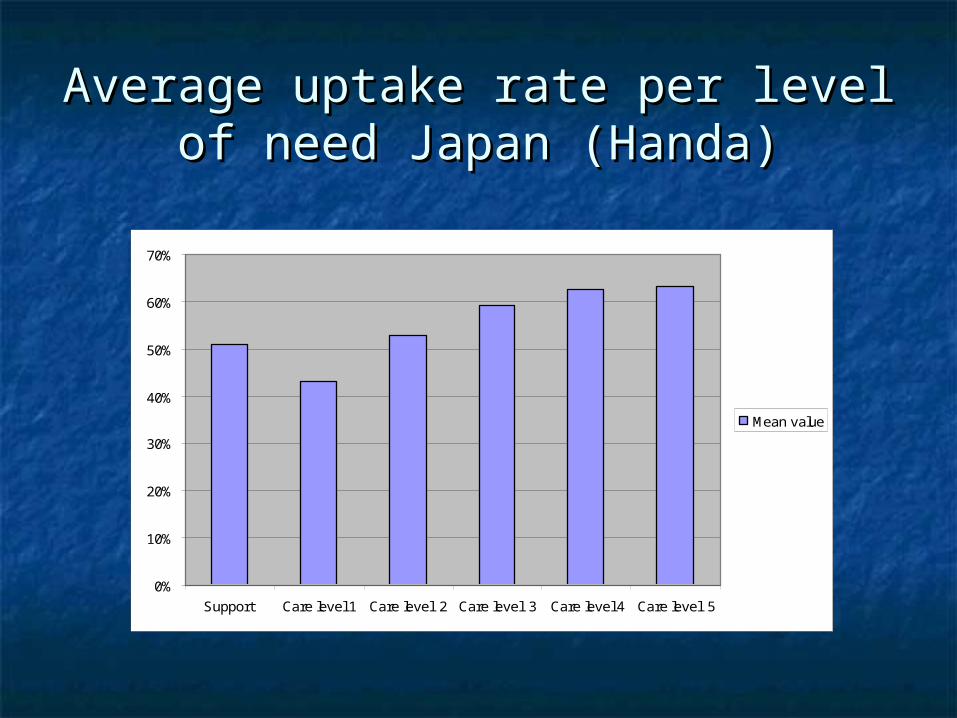
Average uptake rate per level of Average uptake rate per level of need Japan (Handa)need Japan (Handa)
0%
10%
20%
30%
40%
50%
60%
70%
Support Care level 1 Care level 2 Care level 3 Care level 4 Care level 5
Mean value

Uptake rate per income group, Uptake rate per income group, Japan (Handa)Japan (Handa)
0%
5%
10%
15%
20%
25%
30%
35%
Income group 1 Income group 2 Income group 3 Income group 4 Income group 5
0 - 25%
25 - 50%
50 - 75%
75 - 100%
>100%
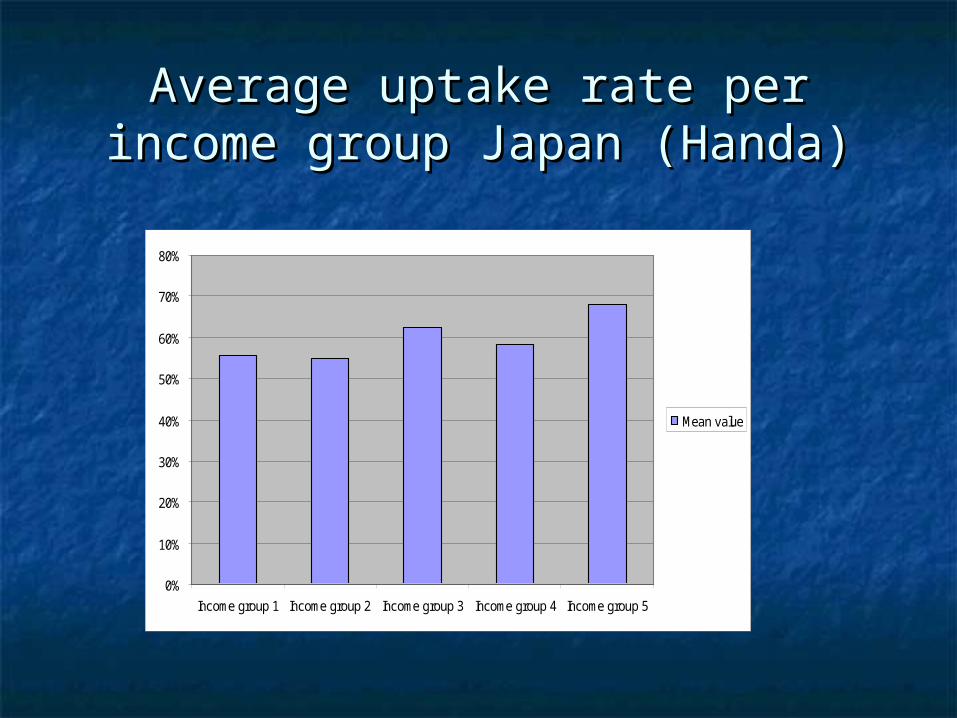
Average uptake rate per income Average uptake rate per income group Japan (Handa)group Japan (Handa)
0%
10%
20%
30%
40%
50%
60%
70%
80%
Income group 1 Income group 2 Income group 3 Income group 4 Income group 5
Mean value
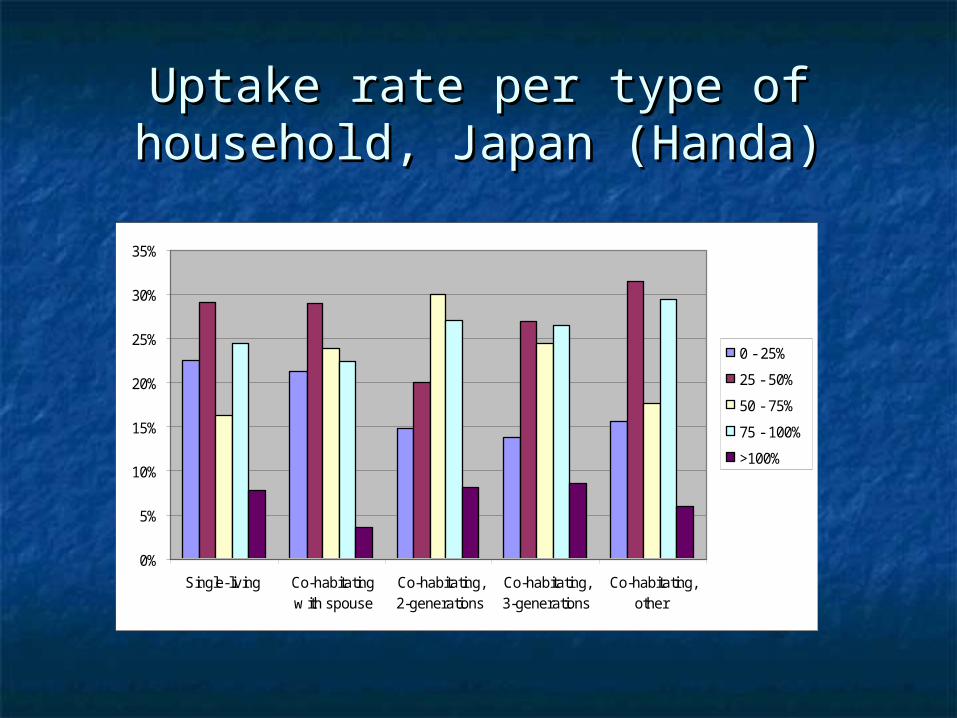
Uptake rate per type of household, Uptake rate per type of household, Japan (Handa)Japan (Handa)
0%
5%
10%
15%
20%
25%
30%
35%
Single-living Co-habitatingw ith spouse
Co-habitating,2-generations
Co-habitating,3-generations
Co-habitating,other
0 - 25%
25 - 50%
50 - 75%
75 - 100%
>100%

Average uptake rate per type of Average uptake rate per type of household, Japan (Handa)household, Japan (Handa)
0%
10%
20%
30%
40%
50%
60%
70%
80%
Single-living Co-habitatingw ith spouse
Co-habitating, 2-generations
Co-habitating, 3-generations
Co-habitating,other
Mean value

Main conclusions Main conclusions
Income does not seem to affect the provision of Income does not seem to affect the provision of care in Sweden, but type of household makes a big care in Sweden, but type of household makes a big difference when it comes to receiving servicesdifference when it comes to receiving services
Some differences between income groups in Some differences between income groups in Sweden conc. type of LTC services Sweden conc. type of LTC services
In Japan allotted level of need in Japan is generally In Japan allotted level of need in Japan is generally lower for single-living than co-habitating persons lower for single-living than co-habitating persons reflecting differences in possibility to copereflecting differences in possibility to cope
Income and type of household affect uptake rate in Income and type of household affect uptake rate in Japan reflecting higher co-paymentsJapan reflecting higher co-payments

That´s all folks! That´s all folks!
Thanks for your attentionThanks for your attention