The Impact of Hurricane Katrina on Trust in...
18
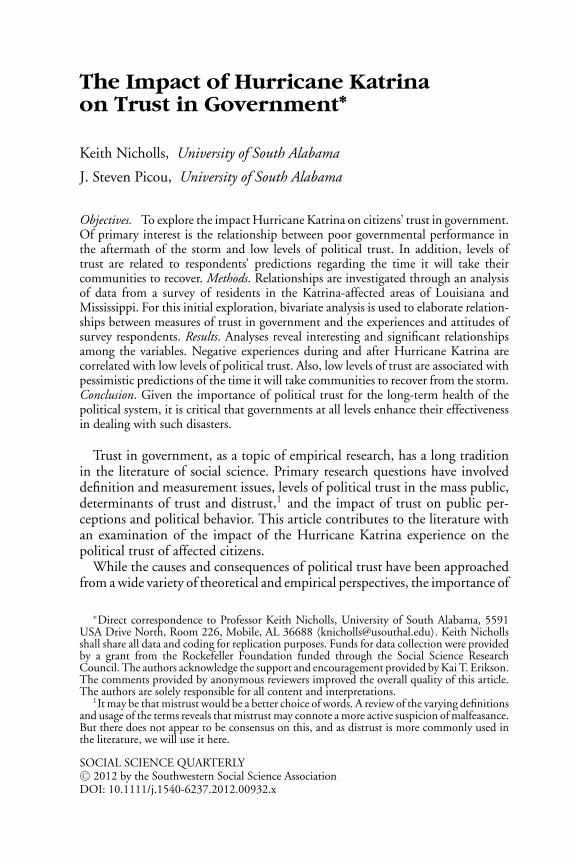
The Impact of Hurricane Katrina on Trust in Government ∗ Keith Nicholls, University of South Alabama J. Steven Picou, University of South Alabama Objectives. To explore the impact Hurricane Katrina on citizens’ trust in government. Of primary interest is the relationship between poor governmental performance in the aftermath of the storm and low levels of political trust. In addition, levels of trust are related to respondents’ predictions regarding the time it will take their communities to recover. Methods. Relationships are investigated through an analysis of data from a survey of residents in the Katrina-affected areas of Louisiana and Mississippi. For this initial exploration, bivariate analysis is used to elaborate relation- ships between measures of trust in government and the experiences and attitudes of survey respondents. Results. Analyses reveal interesting and significant relationships among the variables. Negative experiences during and after Hurricane Katrina are correlated with low levels of political trust. Also, low levels of trust are associated with pessimistic predictions of the time it will take communities to recover from the storm. Conclusion. Given the importance of political trust for the long-term health of the political system, it is critical that governments at all levels enhance their effectiveness in dealing with such disasters. Trust in government, as a topic of empirical research, has a long tradition in the literature of social science. Primary research questions have involved definition and measurement issues, levels of political trust in the mass public, determinants of trust and distrust, 1 and the impact of trust on public per- ceptions and political behavior. This article contributes to the literature with an examination of the impact of the Hurricane Katrina experience on the political trust of affected citizens. While the causes and consequences of political trust have been approached from a wide variety of theoretical and empirical perspectives, the importance of ∗ Direct correspondence to Professor Keith Nicholls, University of South Alabama, 5591 USA Drive North, Room 226, Mobile, AL 36688 [email protected]. Keith Nicholls shall share all data and coding for replication purposes. Funds for data collection were provided by a grant from the Rockefeller Foundation funded through the Social Science Research Council. The authors acknowledge the support and encouragement provided by Kai T. Erikson. The comments provided by anonymous reviewers improved the overall quality of this article. The authors are solely responsible for all content and interpretations. 1 It may be that mistrust would be a better choice of words. A review of the varying definitions and usage of the terms reveals that mistrust may connote a more active suspicion of malfeasance. But there does not appear to be consensus on this, and as distrust is more commonly used in the literature, we will use it here. SOCIAL SCIENCE QUARTERLY C 2012 by the Southwestern Social Science Association DOI: 10.1111/j.1540-6237.2012.00932.x
Transcript of The Impact of Hurricane Katrina on Trust in...
The Impact of Hurricane Katrinaon Trust in Government∗
Keith Nicholls, University of South Alabama
J. Steven Picou, University of South Alabama
Objectives. To explore the impact Hurricane Katrina on citizens’ trust in government.Of primary interest is the relationship between poor governmental performance inthe aftermath of the storm and low levels of political trust. In addition, levels oftrust are related to respondents’ predictions regarding the time it will take theircommunities to recover. Methods. Relationships are investigated through an analysisof data from a survey of residents in the Katrina-affected areas of Louisiana andMississippi. For this initial exploration, bivariate analysis is used to elaborate relation-ships between measures of trust in government and the experiences and attitudes ofsurvey respondents. Results. Analyses reveal interesting and significant relationshipsamong the variables. Negative experiences during and after Hurricane Katrina arecorrelated with low levels of political trust. Also, low levels of trust are associated withpessimistic predictions of the time it will take communities to recover from the storm.Conclusion. Given the importance of political trust for the long-term health of thepolitical system, it is critical that governments at all levels enhance their effectivenessin dealing with such disasters.
Trust in government, as a topic of empirical research, has a long traditionin the literature of social science. Primary research questions have involveddefinition and measurement issues, levels of political trust in the mass public,determinants of trust and distrust,1 and the impact of trust on public per-ceptions and political behavior. This article contributes to the literature withan examination of the impact of the Hurricane Katrina experience on thepolitical trust of affected citizens.
While the causes and consequences of political trust have been approachedfrom a wide variety of theoretical and empirical perspectives, the importance of
∗Direct correspondence to Professor Keith Nicholls, University of South Alabama, 5591USA Drive North, Room 226, Mobile, AL 36688 〈[email protected]〉. Keith Nichollsshall share all data and coding for replication purposes. Funds for data collection were providedby a grant from the Rockefeller Foundation funded through the Social Science ResearchCouncil. The authors acknowledge the support and encouragement provided by Kai T. Erikson.The comments provided by anonymous reviewers improved the overall quality of this article.The authors are solely responsible for all content and interpretations.
1It may be that mistrust would be a better choice of words. A review of the varying definitionsand usage of the terms reveals that mistrust may connote a more active suspicion of malfeasance.But there does not appear to be consensus on this, and as distrust is more commonly used inthe literature, we will use it here.
SOCIAL SCIENCE QUARTERLYC© 2012 by the Southwestern Social Science AssociationDOI: 10.1111/j.1540-6237.2012.00932.x

2 Social Science Quarterly
trust for the long-term health of the political system appears to be universallyaccepted. The rationale for this acceptance is well stated by Warren (1999):
A society that fosters robust relations of trust is probably also a society that canafford fewer regulations and greater freedoms, deal with more contingencies,tap the energy and ingenuity of its citizens, limit the inefficiencies of rule-based means of coordination, and provide a greater sense of existential securityand satisfaction (2).
Thus, a trusting citizenry is viewed as a critical ingredient of a successfulpolitical system, contributing to its optimum performance and long-termstability.
The shocking devastation caused by Hurricane Katrina in 2005 and thesensational and controversial role of government in dealing with its aftermathprovide a unique opportunity to expand our understanding of the impact ofsuch experiences on political trust. Indeed, the Katrina experience providesan excellent example of an event that has raised contingencies, demandedthe energy and ingenuity of citizens, exposed inefficiencies, and called intoquestion our sense of security and satisfaction. As much as any other event inmodern American history, it might be expected to have a significant impacton citizens’ trust in government.
Of primary interest is whether levels of trust in the areas affected by Katrinaare lower than levels in the general population, and the extent to which respon-dents’ low levels of trust are related to the high levels of stress and devastationexperienced during the storm. In addition, levels of trust in government areused to help explain respondents’ projections regarding the time it will taketheir communities to fully recover from the hurricane.
We address these questions using data from a survey of residents in theKatrina-ravaged areas of Louisiana and Mississippi. The target populationincluded all adults (over 18) in two counties in Mississippi (Hancock andHarrison) and five parishes in Louisiana (Jefferson, Orleans, Plaquemines, St.Bernard, and St. Tammany). The sample was constructed using standard RDDprocedures and supplemented with approximately 10 percent cell phone num-bers. Interviews were conducted by the USA Polling Group2 from April 16,2008, to September 2, 2008. A total of 2,333 interviews were completed, yield-ing an overall margin of error of ±2 percent at the 95 percent confidence level.
The first task here is to review definitions of trust from previous literatureto serve as a guide for this research. Secondly, various ways in which trust haspreviously been measured will be reviewed and the measure used here will bedescribed. Following is a general review of the literature on the determinantsand consequences of political trust, which will serve as a framework for ex-pectations of relationships to be explored in the Katrina survey data. Next is
2USA Polling Group is a multi-disciplinary survey research center located on the Universityof South Alabama’s main campus in Mobile, Alabama. Over its 17-year history, the PollingGroup has conducted over 600 surveys using a state-of-the-art computer-assisted telephoneinterview system.
The Impact of Hurricane Katrina on Trust in Government 3
a discussion and elaboration of such expectations, followed by a preliminaryanalysis of the impact of the Katrina experience on trust in government andthe impact of political trust on predictions for the future. Finally, findings aresummarized and plans for future research are described.
Defining Political Trust
It is important to note that political trust is conceptually distinct fromsocial trust (sometimes referred to as interpersonal trust or generalized trust).Political trust, as one might expect, involves dispositions and attitudes towardgovernment, including the democratic system writ large, as well as the institu-tions, processes, policies, and actors that make up the system. Unfortunately,many of the contributors to the literature on political trust make no attemptto explicitly define the concept, under the assumption, perhaps, that we allgenerally know what it means. But as Hetherington (2005) reminds us, “Po-litical trust, in general, is a concept that people think they understand untilthey are asked to define it.” Hetherington goes on to use the definition offeredby one of the pioneers in the empirical study of the determinants of politicaltrust, Arthur Miller:
Political trust can be thought of as a basic evaluative or affective orientationtoward the government. . . . The dimension of trust runs from high trust tohigh distrust or political cynicism. Cynicism thus refers to the degree ofnegative affect toward the government and is a statement of the belief thatthe government is not functioning and producing outputs in accord withindividual expectations (1974a:952).
In this definition, Miller equates distrust with political cynicism, claimingthat if there is sufficient disapproval of government functions and outputs overtime, the basic dispositions of citizens will change from positive (trusting) tonegative (not trusting). For Miller, then, the concept of political trust reflectsbasic dispositions and deeply held attitudes toward government. While levelsof trust may change over time, they do not change quickly or easily in responseto fleeting political issues or personalities. This conception of political trust,while reasonable and relevant, is not universally accepted.
In a response to Miller’s work, Citrin (1974) initiated a widely referenceddebate in the literature. Citrin claimed that political trust reflects short-termevaluations of governmental policies and the performance of public officials,rather than stable dispositions. Miller (1974b) responded by equating politicaltrust with legitimacy and lack of trust with alienation, again claiming that theseare deeply held dispositions, rather than fleeting attitudes. Such distinctionsare important when it comes to measurement and model specification (asdiscussed below), but for definitional purposes, they need not be consideredmutually exclusive.
4 Social Science Quarterly
It is also important to note that when it comes to trusting, individuals may:(1) actively trust, expecting that government will do what is right; (2) withholdjudgment on whether or not government can be expected to do what is right;or (3) actively distrust government, expecting that government will not dowhat is right (for discussion, see Cook and Gronke, 2005). Such considerationmust be taken into account when approaching the task of measuring politicaltrust.
These differing perspectives tend to suggest that political trust is multi-dimensional: it begins with fundamental predispositions toward governmentstemming from early childhood socialization; it incorporates evolving dispo-sitions based upon experiences with government over-time; and it includes arunning affective tally based upon regular evaluations of governmental pro-cesses and outputs. Thus, political trust reflects normative expectations of whatgovernment ought to do and how it ought to do it, tempered by the recogni-tion of reasonable constraints. Leaning toward the conceptualization favoredby Citrin, we propose that trust varies according to the extent to which govern-ment meets such expectations. Since it is clear that government performanceduring and after Hurricane Katina did not meet reasonable expectations, acontention discussed more fully below, our goal here is to demonstrate thatthe Katrina experience had a significant negative impact on levels of trust.
Measuring Political Trust
Consensus on the appropriate means of measuring political trust has beenelusive. Much research in the area, especially in the early years, used five itemsfrom the National Election Study that were initially designed to measuregeneral feelings of favorability toward government (Stokes, 1962):
1. How much of the time do you think you can trust the government inWashington to do what is right—just about always, most of the time, oronly some of the time?
2. Would you say the government is pretty much run by a few big interestslooking out for themselves or that it is run for the benefit of all thepeople?
3. Do you think that people in the government waste a lot of the moneywe pay in taxes, waste some of it, or do not waste very much of it?
4. Do you feel that almost all of the people running the government aresmart people who usually know what they are doing, or do you thinkthat quite a few of them do not seem to know what they are doing?
5. Do you think that quite a few of the people running the government area little crooked, not very many are, or do you think hardly any of themare crooked at all?
Although these items have been used, both individually and combinedas a scale, by numerous researchers (Miller, 1974a, 1974b; Citrin, 1974;

The Impact of Hurricane Katrina on Trust in Government 5
Citrin and Green, 1986; Chanley, Rudolph, and Rahn, 2000; Anderson andLoTempio, 2002; Hetherington, 2005; etc.), their use has been criticized onvarious grounds. In the first place, these measures tend to reflect more symbolicattitudes: positive answers (trusting) represent diffuse support for the politicalsystem, while negative answers (distrusting) are viewed as synonymous withcynicism. This is not an unreasonable approach, but it represents only oneof a number of ways to conceptualize political trust. The items would notbe so useful when measuring trust as a reflection of specific support forgovernmental policies and officials (for discussion, see Weatherford, 1987).Even if one focuses more narrowly on Item 1, which specifically mentionstrust, there is a problematic lack of symmetry. The response categories for thisNational Election Study (NES) Item 1 include: just about always, most of thetime, or only some of the time. There is no option for trusting governmentnone of the time.3
The NES series also mixes two different dimensions of political trust as itrelates to the protection of interests. Specifically, governments may betray thepublic’s interests in ways which fall into two broad categories: malfeasanceand misfeasance. In the area of malfeasance, the public’s interest in an honest,ethical, and just government is betrayed when government officials wantonlyparticipate in immoral acts, such as financial corruption, influence peddling, orextra-marital affairs and other sexual peccadilloes. This type of interest is alsobetrayed through unethical and unjust institutionalized bias, such as making“separate but equal” the law of the land without any pretense toward equality.These concepts are captured in the NES scale with Items 2 and 5 (above).
When it comes to misfeasance, trust is betrayed when governmental officialsare incompetent and governmental procedures are inefficient, both of whichcan result in diminished governmental performance and the waste of scarcegovernment resources in the form of hard-earned tax dollars. Evaluations ofthis sort of misfeasance are captured in the NES Items 3 and 4.
It is easily conceivable that some individuals may not trust governmentwhen it comes to misfeasance, while fully trusting government when it comesto malfeasance—bureaucrats are not bad people, they are just incompetent.One could also make the opposite case, that bureaucrats may be efficient, butthey are bad people—Nazi Germany would serve as a good example. Thus,the use of these measures as parts of the same scale may serve more to cloudthe issues than to provide clarity.
Even though researchers regularly acknowledge such problems, some con-tinue to use these measures. Hetherington, for example, admits, “These sur-vey questions have come under a great deal of criticism, much of it justified”(2005:14). He then goes on to use them throughout his book. Their con-tinued use despite their obvious shortcomings is due to the fact that much
3Subsequent iterations of the NES utilized four points that allowed respondents to opinethat the government could be trusted to do what is right: all of the time, most of the time,some of the time, or never.
6 Social Science Quarterly
of the work in this area consists of secondary analyses of existing data sets;thus, researchers use them not because they are ideal, but because they areavailable. In addition, use of the items is a necessary evil when attemptingto track changes in political trust over time—changes in the questions couldsignificantly diminish the potential for comparability.
This is not to suggest that the NES questions are the only measurementsused in the literature. For example, Weatherford (1992) includes additionalitems in the trust scale that require respondents to rank the institutions ofgovernment (Congress, Supreme Court, President, political parties) accordingto which are most trusted to do what is right. Other researchers use measuresof confidence in governmental institutions as surrogates for political trust(Brehm and Rahn, 1997; Cook and Gronke, 2005; Zmerli and Newton,2008). Still others have used general approval of governmental institutions assurrogates for trust (Bowler and Karp, 2004).
While confidence and approval are certainly related to political trust, forour purposes, it seems more appropriate to focus explicitly on the conceptitself. If the key issue involves the extent to which people trust government,why not ask them directly? In addition, it is important to insure that responseoptions allow respondents to indicate a complete lack of trust. Based onthese considerations, we used the following measure in the Hurricane KatrinaSurvey:
For these next set of questions, please indicate your level of trust in (alter-natively: local government; state government; federal government): Do youhave: a great deal of trust; a good deal of trust; some trust; very little trust;or, no trust at all?
Determinants and Consequences of Political Trust
Scholarly interest in the determinants of political trust heightened dramat-ically in the 1970s as levels of trust in the mass public declined. In just 6 yearsbetween 1964 and 1970, the proportion of Americans who trusted the gov-ernment in Washington to do what is right “just about always” or “most of thetime” dropped from three-fourths to only slightly over one-half (Miller, 1974).It was this precipitous decline that initiated the debate over the competingexplanations of Miller (1974a,1974b) and Citrin (1974). One might expectthat their disagreement would be resolved by subsequent changes in levels oftrust (or the lack thereof ) relative to political developments. But while changeshave occurred, they have not provided any definitive resolution. Levels of trust(measured as noted above) dropped to 40 percent in 1974 and to under 20percent in 1980. But after recovering to around 35 percent in 1984, trust hithistoric lows of just over 10 percent in the early 1990s (Chanley et al., 2000).Then it recovered again in the mid-1990s, only to reach new lows in the later1990s (Brooks and Cheng, 2001). This instability seems to suggest that levels
The Impact of Hurricane Katrina on Trust in Government 7
of trust respond to short term political events (per Citrin). The fact that theyhave stayed so low relative to the early 1960s might alternatively be cited tosupport Miller. While the controversy has not been resolved, it has generatedextensive empirical research that enhances our understanding.
The findings of Miller and Citrin that negative evaluations of governmentalpolicies and performance diminish political trust have been confirmed in anumber of studies (Hetherington, 1998; Owen and Dennis, 2001). But resultstend to vary according to how trust is measured. It would appear that measuresasking explicitly about trusting government to do what is right are morestrongly related to short-term evaluations, such as approval of Congress andwhether the country is on the right track, while measures that reflect confidencein governmental institutions seem to reflect longer-lasting predispositions(Cook and Gronke, 2005; Zmerli and Newton, 2008). This tends to furthervalidate our approach in directly asking respondents how much trust theyhave in government.
A number of other political variables have been related to trust. Sharingpolitical party identification with those in political power increases trust ingovernment (Citrin, 1974; Gershtenson et al., 2006), while having votedfor losers in an election diminishes political trust (Anderson and LoTempio,2002). Also, changes in partisan control of Congress and the presidency impacttrust (Keele, 2005). Conversely, trust declines with the extent to which peoplebelieve that governmental processes are inconsistent with their preferences(Hibbing and Theiss-Morse, 2001). Declining levels of political trust havealso been related to the incidence of governmental and political scandals(Chanley et al., 2000; Bowler and Karp, 2004) and exposure to high-conflicttelevision programming in the political arena (Foregette and Morris, 2006).
Another approach to investigating the causes of declining political trust hasbeen to attempt to connect it with declining levels of social trust (generalizedlevels of trust in others), often within the framework of social capital theory(Keele, 2007). While there does appear to be a relationship between the twoconcepts, the results are mixed. A number of studies have found political trustonly weakly correlated with social trust (Craig, 1993; Orren, 1997; Newton,1999; Mishler and Rose, 2005). Other analyses have yielded much strongerrelationships (Jagodzinski and Manabe, 2004; Zmerli et al., 2007; Denterset al., 2007), and especially in cross-national comparisons when countries aretreated as the unit of analysis (Zmerli and Newton, 2008).
Other concepts that have been found to impact political trust includeindividual circumstances, such as one’s personal economic situation (Cookand Gronke, 2005; Newton and Norris, 2000; Lipset and Schneider, 1987),and general societal conditions, such as state of the economy (Hetherington,1998; Chanley et al., 2000) and concern about crime (Chanley et al., 2000).
The impact of demographics on political trust has also been studied,but results are mixed. Some researchers have found minimal impact ofdemographic measures on trust (Lawrence, 1997; Citrin and Luks, 2001;Hetherington, 2005). Others have found that, depending on time, context,
8 Social Science Quarterly
and measurement, political trust may be affected by race (Howell and Fagan,1988; King, 1997; Brooks and Cheng, 2001; Cook and Gronke, 2005), sex(King, 1997; Cook and Gronke, 2005), education (King, 1997; Brooks andCheng, 2001; Cook and Gronke, 2005), religiosity (Cook and Gronke, 2005),and income (King, 1997).
While not so extensive as the literature on the determinants of political trust,the consequences of declining trust have received considerable attention. Lackof trust results in lack of support for governmental policies (Hetherington,1998, 2005; Chanley et al., 2000; Hetherington and Globetti, 2002; Rudolphand Evans, 2005), as well as negative evaluations of governmental effectivenessand diminished approval of incumbent politicians (Howell and Fagan, 1988;Hetherington, 1998; Chanley et al., 2000). In addition, political distrustincreases support for challengers and third party candidates (Peterson andWrighton, 1998; Hetherington, 1999). Trust even affects the willingness ofcitizens to pay their taxes (Scholz and Lubell, 1998). In the internationalarena, political trust affects international trust which in turn affects supportfor various foreign policy positions, such as isolationist attitudes, diplomacypreferences, and support for military intervention (Brewer, 2004; Breweret al., 2004).
Impact of Hurricane Katrina on Trust
In speculating about the impact of Hurricane Katrina on levels of trust ingovernment, this literature provides needed guidance. A critical aspect of thehurricane experience was poor governmental performance, both in the lead-up to the hurricane (building and maintaining levees, contingency planning,evacuations, etc.) and in the aftermath of the hurricane (rescuing victims,providing for survivors, and rebuilding communities, etc.). If governmentalperformance matters when it comes to political trust, and if poor governmentperformance in the Katrina disaster is a given (and we believe it is), then theextent to which poor performance actually affects an individual should berelated to political trust. Since direct evaluations of government performanceare not available in the survey data, the relationship between governmentperformance and trust must be tested indirectly. The assumption is that directnegative experiences with the failures of government and extensive mediacoverage of those failures cause negative evaluations of performance, which inturn result in diminished political trust.
The extensive failures of the government in the response to the hurri-cane, especially the federal government, were widely publicized by the media;coverage was extensive and overwhelmingly negative (Sommers et al., 2006;Barnes et al., 2008; Littlefield and Quenette, 2007). Further, Littlefield andQuenette (2007:27) demonstrated that “the media stepped outside their roleof objective observer and assumed a privileged position to point blame towardthose with legitimate authority.” This attitude was interestingly illustrated by
The Impact of Hurricane Katrina on Trust in Government 9
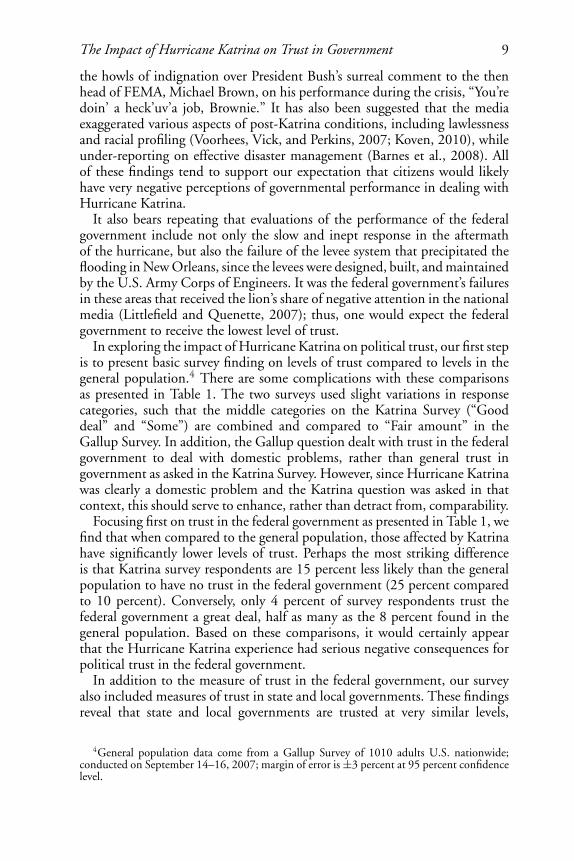
the howls of indignation over President Bush’s surreal comment to the thenhead of FEMA, Michael Brown, on his performance during the crisis, “You’redoin’ a heck’uv’a job, Brownie.” It has also been suggested that the mediaexaggerated various aspects of post-Katrina conditions, including lawlessnessand racial profiling (Voorhees, Vick, and Perkins, 2007; Koven, 2010), whileunder-reporting on effective disaster management (Barnes et al., 2008). Allof these findings tend to support our expectation that citizens would likelyhave very negative perceptions of governmental performance in dealing withHurricane Katrina.
It also bears repeating that evaluations of the performance of the federalgovernment include not only the slow and inept response in the aftermathof the hurricane, but also the failure of the levee system that precipitated theflooding in New Orleans, since the levees were designed, built, and maintainedby the U.S. Army Corps of Engineers. It was the federal government’s failuresin these areas that received the lion’s share of negative attention in the nationalmedia (Littlefield and Quenette, 2007); thus, one would expect the federalgovernment to receive the lowest level of trust.
In exploring the impact of Hurricane Katrina on political trust, our first stepis to present basic survey finding on levels of trust compared to levels in thegeneral population.4 There are some complications with these comparisonsas presented in Table 1. The two surveys used slight variations in responsecategories, such that the middle categories on the Katrina Survey (“Gooddeal” and “Some”) are combined and compared to “Fair amount” in theGallup Survey. In addition, the Gallup question dealt with trust in the federalgovernment to deal with domestic problems, rather than general trust ingovernment as asked in the Katrina Survey. However, since Hurricane Katrinawas clearly a domestic problem and the Katrina question was asked in thatcontext, this should serve to enhance, rather than detract from, comparability.
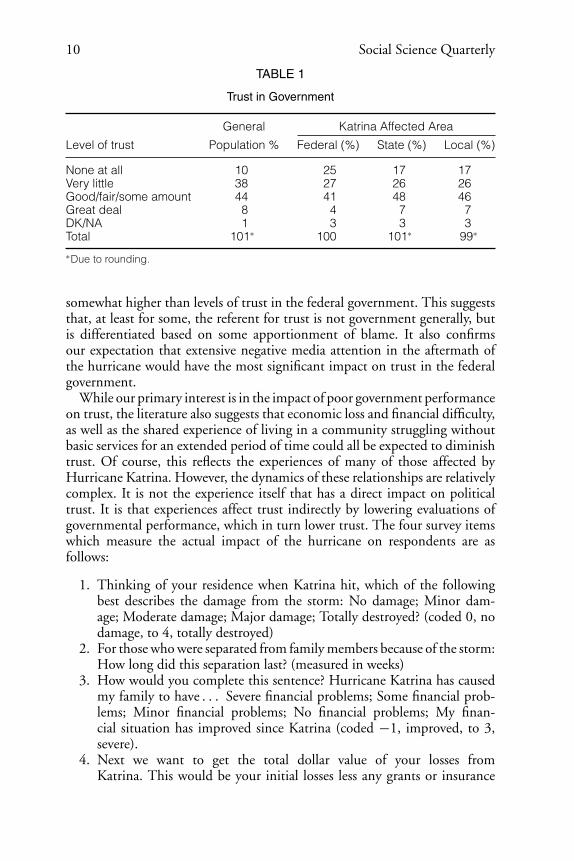
Focusing first on trust in the federal government as presented in Table 1, wefind that when compared to the general population, those affected by Katrinahave significantly lower levels of trust. Perhaps the most striking differenceis that Katrina survey respondents are 15 percent less likely than the generalpopulation to have no trust in the federal government (25 percent comparedto 10 percent). Conversely, only 4 percent of survey respondents trust thefederal government a great deal, half as many as the 8 percent found in thegeneral population. Based on these comparisons, it would certainly appearthat the Hurricane Katrina experience had serious negative consequences forpolitical trust in the federal government.
In addition to the measure of trust in the federal government, our surveyalso included measures of trust in state and local governments. These findingsreveal that state and local governments are trusted at very similar levels,
4General population data come from a Gallup Survey of 1010 adults U.S. nationwide;conducted on September 14–16, 2007; margin of error is ±3 percent at 95 percent confidencelevel.
10 Social Science Quarterly
TABLE 1
Trust in Government
General Katrina Affected Area
Level of trust Population % Federal (%) State (%) Local (%)
None at all 10 25 17 17Very little 38 27 26 26Good/fair/some amount 44 41 48 46Great deal 8 4 7 7DK/NA 1 3 3 3Total 101∗ 100 101∗ 99∗
∗Due to rounding.
somewhat higher than levels of trust in the federal government. This suggeststhat, at least for some, the referent for trust is not government generally, butis differentiated based on some apportionment of blame. It also confirmsour expectation that extensive negative media attention in the aftermath ofthe hurricane would have the most significant impact on trust in the federalgovernment.
While our primary interest is in the impact of poor government performanceon trust, the literature also suggests that economic loss and financial difficulty,as well as the shared experience of living in a community struggling withoutbasic services for an extended period of time could all be expected to diminishtrust. Of course, this reflects the experiences of many of those affected byHurricane Katrina. However, the dynamics of these relationships are relativelycomplex. It is not the experience itself that has a direct impact on politicaltrust. It is that experiences affect trust indirectly by lowering evaluations ofgovernmental performance, which in turn lower trust. The four survey itemswhich measure the actual impact of the hurricane on respondents are asfollows:
1. Thinking of your residence when Katrina hit, which of the followingbest describes the damage from the storm: No damage; Minor dam-age; Moderate damage; Major damage; Totally destroyed? (coded 0, nodamage, to 4, totally destroyed)
2. For those who were separated from family members because of the storm:How long did this separation last? (measured in weeks)
3. How would you complete this sentence? Hurricane Katrina has causedmy family to have . . . Severe financial problems; Some financial prob-lems; Minor financial problems; No financial problems; My finan-cial situation has improved since Katrina (coded −1, improved, to 3,severe).
4. Next we want to get the total dollar value of your losses fromKatrina. This would be your initial losses less any grants or insurance
The Impact of Hurricane Katrina on Trust in Government 11
TABLE 2
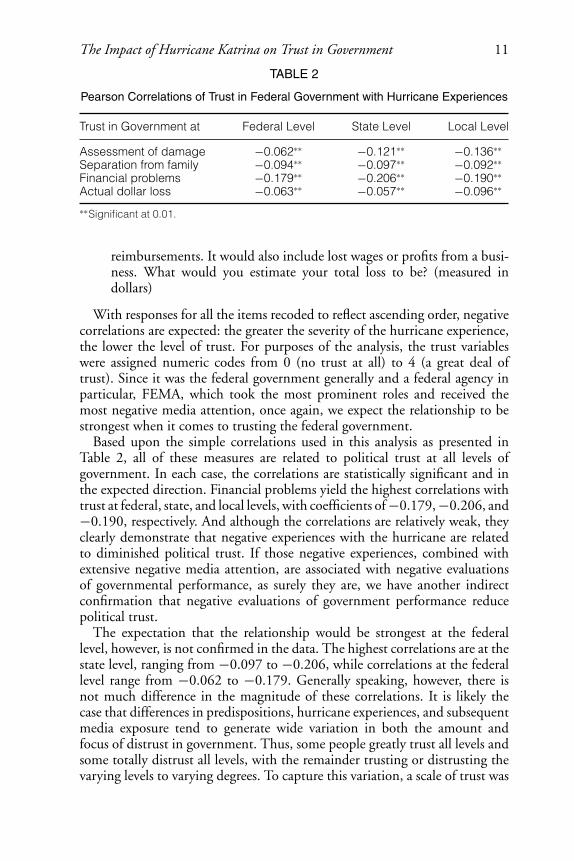
Pearson Correlations of Trust in Federal Government with Hurricane Experiences
Trust in Government at Federal Level State Level Local Level
Assessment of damage −0.062∗∗ −0.121∗∗ −0.136∗∗
Separation from family −0.094∗∗ −0.097∗∗ −0.092∗∗
Financial problems −0.179∗∗ −0.206∗∗ −0.190∗∗
Actual dollar loss −0.063∗∗ −0.057∗∗ −0.096∗∗
∗∗Significant at 0.01.
reimbursements. It would also include lost wages or profits from a busi-ness. What would you estimate your total loss to be? (measured indollars)
With responses for all the items recoded to reflect ascending order, negativecorrelations are expected: the greater the severity of the hurricane experience,the lower the level of trust. For purposes of the analysis, the trust variableswere assigned numeric codes from 0 (no trust at all) to 4 (a great deal oftrust). Since it was the federal government generally and a federal agency inparticular, FEMA, which took the most prominent roles and received themost negative media attention, once again, we expect the relationship to bestrongest when it comes to trusting the federal government.
Based upon the simple correlations used in this analysis as presented inTable 2, all of these measures are related to political trust at all levels ofgovernment. In each case, the correlations are statistically significant and inthe expected direction. Financial problems yield the highest correlations withtrust at federal, state, and local levels, with coefficients of −0.179, −0.206, and−0.190, respectively. And although the correlations are relatively weak, theyclearly demonstrate that negative experiences with the hurricane are relatedto diminished political trust. If those negative experiences, combined withextensive negative media attention, are associated with negative evaluationsof governmental performance, as surely they are, we have another indirectconfirmation that negative evaluations of government performance reducepolitical trust.
The expectation that the relationship would be strongest at the federallevel, however, is not confirmed in the data. The highest correlations are at thestate level, ranging from −0.097 to −0.206, while correlations at the federallevel range from −0.062 to −0.179. Generally speaking, however, there isnot much difference in the magnitude of these correlations. It is likely thecase that differences in predispositions, hurricane experiences, and subsequentmedia exposure tend to generate wide variation in both the amount andfocus of distrust in government. Thus, some people greatly trust all levels andsome totally distrust all levels, with the remainder trusting or distrusting thevarying levels to varying degrees. To capture this variation, a scale of trust was
12 Social Science Quarterly
TABLE 3
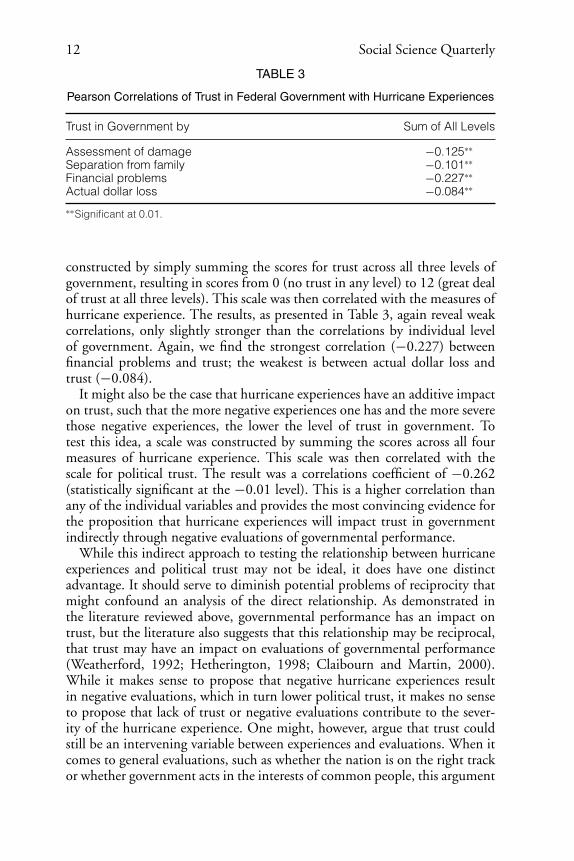
Pearson Correlations of Trust in Federal Government with Hurricane Experiences
Trust in Government by Sum of All Levels
Assessment of damage −0.125∗∗
Separation from family −0.101∗∗
Financial problems −0.227∗∗
Actual dollar loss −0.084∗∗
∗∗Significant at 0.01.
constructed by simply summing the scores for trust across all three levels ofgovernment, resulting in scores from 0 (no trust in any level) to 12 (great dealof trust at all three levels). This scale was then correlated with the measures ofhurricane experience. The results, as presented in Table 3, again reveal weakcorrelations, only slightly stronger than the correlations by individual levelof government. Again, we find the strongest correlation (−0.227) betweenfinancial problems and trust; the weakest is between actual dollar loss andtrust (−0.084).
It might also be the case that hurricane experiences have an additive impacton trust, such that the more negative experiences one has and the more severethose negative experiences, the lower the level of trust in government. Totest this idea, a scale was constructed by summing the scores across all fourmeasures of hurricane experience. This scale was then correlated with thescale for political trust. The result was a correlations coefficient of −0.262(statistically significant at the −0.01 level). This is a higher correlation thanany of the individual variables and provides the most convincing evidence forthe proposition that hurricane experiences will impact trust in governmentindirectly through negative evaluations of governmental performance.
While this indirect approach to testing the relationship between hurricaneexperiences and political trust may not be ideal, it does have one distinctadvantage. It should serve to diminish potential problems of reciprocity thatmight confound an analysis of the direct relationship. As demonstrated inthe literature reviewed above, governmental performance has an impact ontrust, but the literature also suggests that this relationship may be reciprocal,that trust may have an impact on evaluations of governmental performance(Weatherford, 1992; Hetherington, 1998; Claibourn and Martin, 2000).While it makes sense to propose that negative hurricane experiences resultin negative evaluations, which in turn lower political trust, it makes no senseto propose that lack of trust or negative evaluations contribute to the sever-ity of the hurricane experience. One might, however, argue that trust couldstill be an intervening variable between experiences and evaluations. When itcomes to general evaluations, such as whether the nation is on the right trackor whether government acts in the interests of common people, this argument

The Impact of Hurricane Katrina on Trust in Government 13
TABLE 4
Tell Me How Long You Believe It Will Be before Your Community Is CompletelyRecovered from the Impact of Hurricane Katrina?
Frequency Percent
Already recovered 229 9.81–2 years 235 10.13–5 years 393 16.86–10 years 647 27.7More than 10 years 342 14.7Will never fully recover 188 8.1DK/NA 299 5.6Total 2,333 100
seems reasonable, as the evaluations themselves are somewhat symbolic. Butwhen it comes to evaluations based upon extensive and traumatic personalexperiences, compounded by extensive negative media coverage, as was thecase with Hurricane Katrina, the argument is much harder to make.
Impact of Trust on Expectations
Given that political trust does have consequences, it seems reasonable tosuggest that levels of trust would be related to expectations for the future.In the case of those living in the hurricane-ravaged areas of Mississippi andLouisiana, perhaps the most important such expectation would involve com-munity recovery. If government is instrumental in the recovery and people donot trust government, they will be more pessimistic about how long the recov-ery will take. This assumes, of course, that people view the role of governmentas instrumental in the recovery of the hurricane-ravaged areas. Given the scaleof the devastation and the billions of federal dollars already appropriated tothe recovery, this assumption seems warranted. Results on the expected lengthof recovery, measured in years and collapsed into categories, are presented inTable 4.
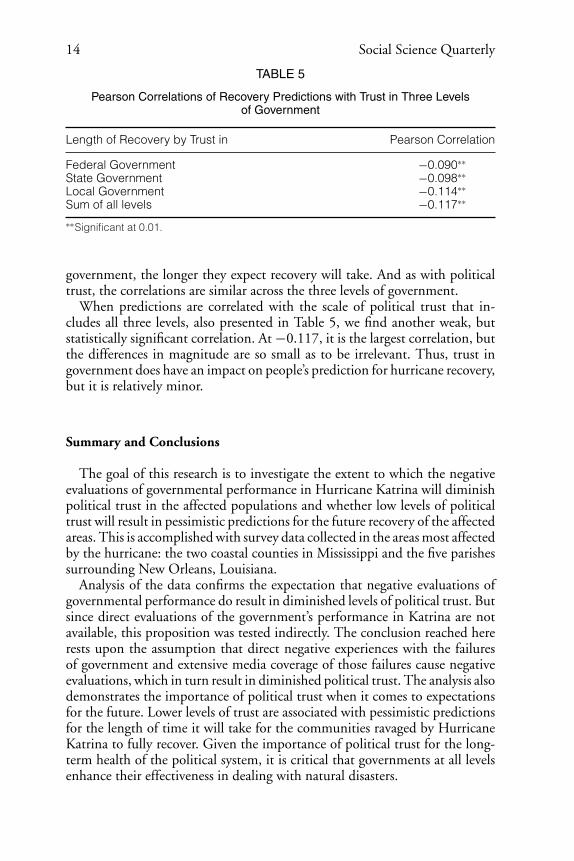
More than half of respondents (a total of 59.2 percent) believe recovery willtake more than 5 years from the time of the survey (2008), and an additional8.1 percent claim that their community will never fully recover. Clearly, peopleare pessimistic, but is that pessimism the reflection of low levels of politicaltrust or does it stem from other factors? Correlation of political trust at thethree different levels of government with estimates of the time it will takefor recovery are presented in Table 5. Here we find weak, but statisticallysignificant correlations ranging from a low of −0.090 at the federal levelto a high of −0.114 at the local level. As predicted, the less people trust
14 Social Science Quarterly
TABLE 5
Pearson Correlations of Recovery Predictions with Trust in Three Levelsof Government
Length of Recovery by Trust in Pearson Correlation
Federal Government −0.090∗∗
State Government −0.098∗∗
Local Government −0.114∗∗
Sum of all levels −0.117∗∗
∗∗Significant at 0.01.
government, the longer they expect recovery will take. And as with politicaltrust, the correlations are similar across the three levels of government.
When predictions are correlated with the scale of political trust that in-cludes all three levels, also presented in Table 5, we find another weak, butstatistically significant correlation. At −0.117, it is the largest correlation, butthe differences in magnitude are so small as to be irrelevant. Thus, trust ingovernment does have an impact on people’s prediction for hurricane recovery,but it is relatively minor.
Summary and Conclusions
The goal of this research is to investigate the extent to which the negativeevaluations of governmental performance in Hurricane Katrina will diminishpolitical trust in the affected populations and whether low levels of politicaltrust will result in pessimistic predictions for the future recovery of the affectedareas. This is accomplished with survey data collected in the areas most affectedby the hurricane: the two coastal counties in Mississippi and the five parishessurrounding New Orleans, Louisiana.
Analysis of the data confirms the expectation that negative evaluations ofgovernmental performance do result in diminished levels of political trust. Butsince direct evaluations of the government’s performance in Katrina are notavailable, this proposition was tested indirectly. The conclusion reached hererests upon the assumption that direct negative experiences with the failuresof government and extensive media coverage of those failures cause negativeevaluations, which in turn result in diminished political trust. The analysis alsodemonstrates the importance of political trust when it comes to expectationsfor the future. Lower levels of trust are associated with pessimistic predictionsfor the length of time it will take for the communities ravaged by HurricaneKatrina to fully recover. Given the importance of political trust for the long-term health of the political system, it is critical that governments at all levelsenhance their effectiveness in dealing with natural disasters.
The Impact of Hurricane Katrina on Trust in Government 15
While the expected relationships are confirmed in the data, the correlationsreported are relatively weak. We believe it would be unrealistic to expectstrong relationships. Even though governmental failures played a significantrole both in the lead-up to the hurricane and in its aftermath, people recognizethat the storm itself was a natural disaster. Thus, it would be unreasonable tohold the government solely responsible for all of the negative consequencesof the hurricane. In addition, other factors that have been shown to affectpolitical trust, such as demographic, psychological, and political variables,would predispose some people to trust or distrust more than others regardlessof hurricane experiences. The shared culpability for the disaster combinedwith predispositions pulling in different directions would act to diminishthe strength of the relationships that might be expected between negativehurricane experiences and political trust. We must also acknowledge that 3years had elapsed between the hurricane (2005) and the survey (2008). Duringthis time, respondents may have had many experiences and interactions withgovernment agencies that would tend to complicate and perhaps obfuscatethese relationships.
Finally, we believe that future research in this area can be enhanced in acouple of ways to more fully elaborate these relationships. First, the HurricaneKatrina survey project is a panel study. In follow-up rounds of interviewing,additional questions could be included to better capture the predispositionsof respondents. These might include the following: measures of social orinterpersonal trust; political variables, such as partisanship and political par-ticipation; other measures of political trust such as confidence in institutions;and psychosocial measures of alienation, cynicism, and apathy. In addition, itwould be helpful to include direct evaluations of governmental performance.Secondly, more sophisticated statistical techniques could be used to model therelationships. The development of multiple regression models would likely bemost appropriate. Model specification might include those measures notedabove, plus demographic variables such as age, education, sex, race, income,and state of residence. This approach would allow for a more precise assess-ment of the individual impact of experiences on trust, and of trust on futureexpectations.
REFERENCES
Anderson, Christopher J., and Andrew J. LoTempio. 2002. “Winning, Losing and PoliticalTrust in America.” British Journal of Political Science 32(2):335–51.
Barnes, M. D., C. L. Hanson, L. B. Novilla, A. T. Meacham, E. McIntyre, and B. C. Erickson.2008. “Analysis of Media Agenda Setting During and After Hurricane Katrina: Implicationsfor Emergency Preparedness, Disaster Response, and Disaster Policy.” American Journal ofPublic Health 98(4):604–10.
Bowler, Shaun, and Jeffrey A. Karp. 2004. “Scandals, and Trust in Government.” PoliticalBehavior 26(3):271–87.
16 Social Science Quarterly
Brehm, John, and Wendy Rahn. 1997. “Individual-Level Evidence for the Causes and Conse-quences of Social Capital.” American Journal of Political Science 41(3):999–1023.
Brewer, Paul R. 2004. “Public Trust in (Or Cynicism about) Other Nations across Time.”Political Behavior 26(4):317–41.
Brewer, Paul K., Kimberly Fross, Sean Aday, and Lars Willnat. 2004. “International Trust andPublic Opinion about World Affairs.” American Journal of Political Science 48(1):93–109.
Brooks, Clem, and Simon Cheng. 2001. “Declining Government Confidence and PolicyPreferences in the U.S.: Devolution, Regime Effects, or Symbolic Change?” Social Forces79(4):1343–75.
Chanley, Virginia A., Thomas J. Rudolph, and Wendy M. Rahn. 2000. “The Origins and Con-sequences of Public Trust in Government: A Time Series Analysis.” Public Opinion Quarterly64(3):239–56.
Citrin, Jack. 1974. “Comment: The Political Relevance of Trust in Government.” AmericanPolitical Science Review 68(3):973–88.
Citrin, Jack, and Donald P. Green. 1986. “Presidential Leadership and the Resurgence of Trustin Government.” British Journal of Political Science 16:431–53.
Citrin, Jack, and Samantha Luks. 2001. “Political Trust Revisited; Deja vu All Over Again?”Pp. 9–27 in John R. Hibbing and Elizabeth Theiss-Morse, eds., What Is It About Governmentthat Americans Dislike? New York: Cambridge University Press.
Claibourn, Michele P., and Paul S. Martin. 2000. “Trusting and Joining? An Empirical Test ofthe Reciprocal Nature of Social Capital Trusting and Joining?” Political Behavior 22(4):267–91.
Cook, Timothy E., and Paul Gronke. 2005. “The Skeptical American: Revisiting the Meaningsof Trust in Government and Confidence in Institutions.” Journal of Politics 67(3):784–803.
Craig, Stephen. 1993. The Malevolent Leaders: Popular Discontent in America. Boulder, CO:Westview Press.
Denters, Bas, Oscar Gabriel, and Mariano Torcal. 2007. “Political Confidence in RepresentativeDemocracies.” In Jan van Deth, Jose Ramon Montero, and Anders Westholm, eds., Citizenshipand Involvement in European Democracies: A Comparative Analysis. London: Routledge.
Forgette, Richard, and Jonathan S. Morris. 2006. “High-Conflict Television News and PublicOpinion.” Political Research Quarterly 59(3):447–56.
Gershtenson, Joseph, Jeffrey Ladewig, and Dennis L. Plane. 2006. “Parties, Institutional Con-trol, and Trust in Government.” Social Science Quarterly 87(4):882–902.
Hetherington, Marc J. 1998. “The Political Relevance of Political Trust.” The American PoliticalScience Review 92(4):791–808.
———. 1999. “The Effect of Political Trust on the Presidential Vote, 1968–96.” The AmericanPolitical Science Review 93(2):311–26.
Hetherington, Marc J. 2005. Why Trust Matters. Princeton, NJ: Princeton University Press.
Hetherington, Marc J., and Suzanne Globetti. 2002. “Political Trust and Racial Policy Prefer-ences.” American Journal of Political Science 46(2):253–275.
Hibbing, John R., and Elizabeth Theiss-Morse. 2001. “Process Preferences and American Pol-itics: What the People Want Government to Be.” American Political Science Review 95(1):145–53.
Howell, Susan E., and Deborah Fagan. 1988. “Race and Trust in Government: Testing thePolitical Reality Model.” Public Opinion Quarterly 52(3):343–50.
The Impact of Hurricane Katrina on Trust in Government 17
Jagodzinski, Wolfgang, and Kazufumi Manabe. 2004. “How to Measure Interpersonal Trust?A Comparison of Two Different Measures.” ZA Information 55:85–97.
Keele, Luke. 2005. “The Authorities Really Do Matter: Party Control and Trust in Govern-ment.” Journal of Politics 67(3):873–86.
———. 2007. “Social Capital and the Dynamics of Trust in Government.” American Journalof Political Science 51(2):241–54.
King, David C. 1997. “The Polarization of American Parties and Mistrust of Government.”Pp. 155–78 in Joseph S. Nye Jr, Philip D. Zelikow, and David C. King, eds., Why People Don’tTrust Government. Cambridge, MA: Harvard University Press.
Koven, S. 2010. “Image Construction in the Wake of Hurricane Katrina.” Public OrganizationReview 10(4):339–55.
Lawrence, Robert Z. 1997. “Is it Really the Economy, Stupid?” Pp. 111–32 in Joseph S. Nye Jr,Philip D. Zelikow, and David C. King, eds., Why People Don’t Trust Government. Cambridge,MA: Harvard University Press.
Lipset, Seymour, and William Schneider. 1987. The Confidence Gap: Business, Labor, andGovernment in the Public Mind, rev. ed. Baltimore: Johns Hopkins University Press.
Littlefield, R. S., and Quenette, A. M. 2007. “Crisis Leadership and Hurricane Katrina: ThePortrayal of Authority by the Media in Natural Disasters.” Journal of Applied CommunicationResearch 35(1):26–47.
Miller, Arthur H. 1974a. “Political Issues and Trust in Government: 1964–1970.” AmericanPolitical Science Review 68(3):951–72.
———. 1974b. “Rejoinder to “Comment” by Jack Citrin: Political Discontent or Ritualism?”American Political Science Review 68(3):989–1001.
Miller, Arthur H., Edie N. Goldenberg, and Lutz Erbring. 1979. “Type-Set Politics: Impactof Newspapers on Public Confidence.” American Political Science Review 73(1):67–84.
Mishier, William, and Richard Rose. 2005. “What Are the Political Consequences of Trust?: ATest of Cultural and Institutional Theories in Russia.” Comparative Political Studies 38:1050–78.
Newton, Kenneth. 1999. “Social and Political Trust in Established Democracies.” In PippaNorris, ed., Critical Citizens. Global Support for Democratic Government. Oxford: OxfordUniversity Press.
Newton, Kenneth. 2007. “Social and Political Trust.” In Russell Dalton and Hans DieterKlingemann, eds., The Oxford Handbook of Political Behaviour. Oxford: Oxford UniversityPress.
Newton, Kenneth, and Pippa Norris. 2000. “Confidence in Public Institutions: Faith. Culture,or Performance?” In Susan Pharr and Roben Putnam, eds., Disaffected Democracies: What’sTroubling the Trilateral Countries? Princeton, NJ: Princeton University Press.
Orren, Gary. 1997. “Fall from Grace: The Public’s Loss of Faith in Government.” In JosephNye Jr., Philip Zelikow, and David King, eds., Why People Don’t Trust Government. Cambridge:Harvard University Press.
Owen, Diana, and Jack Dennis. 2001. “Trust in Federal Government: The Phenomenon andIts Antecedents.” Pp. 209–26 in John R. Hibbing and Elizabeth Theiss-Morse, eds., What IsIt About Government that Americans Dislike? New York: Cambridge University Press.
Peterson, Geoff, and J. Mark Wrighton. 1998. “Expressions of Distrust: Third-Party Votingand Cynicism in Government.” Political Behavior 20(1):17–34.
18 Social Science Quarterly
Rudolph, Thomas J., and Jillian Evans. 2005. “Political Trust, Ideology, and Public Supportfor Government Spending.” American Journal of Political Science 49(3):660–71.
Scholz, John T., and Mark Lubell. 1998. “Trust and Taxpaying: Testing the Heuristic Approachto Collective Action.” American Journal of Political Science 42:398–417.
Sommers, Samuel R., Evan P. Apfelbaum, Kristin N. Dukes, Negin Toosi, and Elsie J. Wang.2006. “Race and Media Coverage of Hurricane Katrina: Analysis, Implications, and FutureResearch Questions.” Analyses of Social Issues and Public Policy 6(1):39–55.
Stokes, Donelad E. 1962. “Popular Evaluations of Government: An Empirical Assessment”in Harlan Cleveland and Harold D. Lasswell, eds., Ethics and Business: Scientific, Academic,Religious, Political and Military. New York: Harper and Brothers.
Voorhees, C. W., Vick, J., and Perkins, D. D. 2007. ‘‘Came Hell and High Water: TheIntersection of Hurricane Katrina, the News Media, Race and Poverty.” Journal of Communityand Applied Social Psychology 17(6):415–29.
Warren, Mark. 1999. “Democratic Theory and Trust.” In Mark Warren, ed., Democracy andTrust. Cambridge: Cambridge University Press.
Weatherford, Steven. 1987. “How Does Government Performance Influence Political Sup-port?” Political Behavior 9:5–28.
Weatherford, M. Stephen. 1992. “Measuring Political Legitimacy.” American Political ScienceReview 86(1):149–66.
Zmerli, Sonja, and Ken Newton. 2008. “Social Trust and Attitudes Toward Democracy.”Public Opinion Quarterly 72(4):706–24.
Zmerli, Sonja, Kenneth Newton, and Jose Romon Montero. 2007. “Trust in People, Confi-dence in Political Institutions, and Satisfaction with Democracy.” In Jan van Deth, Jose RamonMontero, and Anders Westholm, eds., Citizenship and Involvement in European Democracies: AComparative Analysis. London: Routledge.