The Impact of Gartner's Maturity Curve, Adoption Curve, Strategic ...
22
The Impact of Gartner’s Maturity Curve, Adoption Curve, Strategic Technologies on Information Systems Research, with Applications toArtificial Intelligence, ERP, BPM, and RFID Daniel E. O’Leary University of Southern California ABSTRACT: How does technology maturity and adoption affect samples, research issues, and use of methodologies in information systems? What is a source of some research issues in strategic and emerging technologies? This paper addresses these questions and others using some frameworks generated by a well-known corporate research group. Gartner Group has been an icon to its corporate clients. However, Gartner has received only limited attention by academics. This paper examines three related frame- works used by Gartner for analyzing information systems IS and accounting informa- tion systems AIS research. Although researchers have previously examined the adop- tion curve, they generally have ignored the impact of the technology maturity curve and the interaction of the two curves. The paper generates a number of findings, including the finding that where a technology is on the maturity curve limits and facilitates the type of research questions that can be addressed regarding that technology. In addi- tion, Gartner’s “strategic technologies” can provide a basis for understanding which technologies are likely to be appropriate for analysis by researchers. Keywords: Gartner; maturity curve; adoption curve; strategic technologies; AIS research; information systems research; artificial intelligence; enterprise resource planning systems; ERP; business process management; BPM; radio frequency identification; RFID. INTRODUCTION T he Gartner Group provides information about a wide range of technologies, generally to corporate clients, to facilitate the analysis and purchase of technologies. Although Gartner is well-known in practice, there has been limited research in information systems IS or accounting information systems AIS regarding frameworks used by Gartner for technology This is an extended version of an earlier paper that was presented at the 2008 American Accounting Association Annual Meeting in Anaheim, CA. The author thanks Paul Steinbart for his comments and suggestions on an earlier version of this paper. 1 BY: REV: netscape@pub4/third/CLS_journals3/GRP_eta/JOB_v6-i1/DIV_002901eta JOURNAL OF EMERGING TECHNOLOGIES IN ACCOUNTING American Accounting Association Vol. 6 DOI: XXXX 2009 pp. 1–XXXX Corresponding author: Daniel E. O’Leary Email: [email protected] Published Online: xx xxxx 1
Transcript of The Impact of Gartner's Maturity Curve, Adoption Curve, Strategic ...
e,
P,
che
sete
ase-a-p-ndnghedi-ch
ISseM;
erally toGartner
s �IS� orhnology
1BY: REV: netscape@pub4/third/CLS_journals3/GRP_eta/JOB_v6-i1/DIV_002901eta
JOURNAL OF EMERGING TECHNOLOGIES IN ACCOUNTING American Accounting AssociationI: XXXX
The Impact of Gartner’s Maturity CurvAdoption Curve, Strategic Technologieson Information Systems Research, with
Applications to Artificial Intelligence, ERBPM, and RFID
Daniel E. O’LearyUniversity of Southern California
ABSTRACT: How does technology maturity and adoption affect samples, researissues, and use of methodologies in information systems? What is a source of somresearch issues in strategic and emerging technologies? This paper addresses thequestions and others using some frameworks generated by a well-known corporaresearch group.
Gartner Group has been an icon to its corporate clients. However, Gartner hreceived only limited attention by academics. This paper examines three related framworks used by Gartner for analyzing information systems �IS� and accounting informtion systems �AIS� research. Although researchers have previously examined the adotion curve, they generally have ignored the impact of the technology maturity curve athe interaction of the two curves. The paper generates a number of findings, includithe finding that where a technology is on the maturity curve limits and facilitates ttype of research questions that can be addressed regarding that technology. In adtion, Gartner’s “strategic technologies” can provide a basis for understanding whitechnologies are likely to be appropriate for analysis by researchers.
Keywords: Gartner; maturity curve; adoption curve; strategic technologies; Aresearch; information systems research; artificial intelligence; enterpriresource planning systems; ERP; business process management; BPradio frequency identification; RFID.
INTRODUCTION
The Gartner Group provides information about a wide range of technologies, gencorporate clients, to facilitate the analysis and purchase of technologies. Althoughis well-known in practice, there has been limited research in information system
accounting information systems �AIS� regarding frameworks used by Gartner for tec
Vol. 6 DO2009pp. 1–XXXX
This is an extended version of an earlier paper that was presented at the 2008 American Accounting Association AnnualMeeting in Anaheim, CA. The author thanks Paul Steinbart for his comments and suggestions on an earlier version of thispaper.
Corresponding author: Daniel E. O’LearyEmail: [email protected]
Published Online: xx xxxx
1
strategicrspectivefrom thetance.
issue ofkinds of995�, toor other
ld be in-
and thatflow ofests the
ther into
studyingiffusion.tion and
of threesystems.tured bybout thata meth-Rogers’
ining theine the
research.lar timesycle andrable tostrategicresearch
otivationhe adop-n on theetail the� curve.
acilitates
1BY: REV: netscape@pub4/third/CLS_journals3/GRP_eta/JOB_v6-i1/DIV_002901eta
O’Leary
maturity or adoption. Further, there has been limited research using Gartner’s so-called “technologies.” Although O’Leary �2008� initiated an analysis of AIS research from the peof Gartner’s so-called “hype cycle,” this paper analyzes information systems researchperspective of the maturity and adoption curves, which have found broader-based accep
Purpose of this PaperPrevious AIS researchers �e.g., Murthy and Wiggins 1999� have examined the overall
what constitutes research in AIS. Other researchers have suggested the use of particularresearch, e.g., case studies �Baker 2002� or design science �e.g., March and Smith 1investigate information systems research issues. However, it is not clear when case studiesmethodologies �e.g., design science� are appropriate, or which technologies likely shouvestigated.
In addition, researchers �Sutton 2005� have indicated that AIS is an applied disciplineAIS research can guide practice. However, there has been limited assessment of thecontribution from practice to AIS. By using some of Gartner’s models, this paper suggnotion that practice also influences theory, and that both could gain from taking each oaccount.
Rogers �1983� and others have examined the impact of the “adoption curve,” e.g.,characteristics of firms at different stages, such as “innovator firms,” for technology dHowever, the role of the maturity of technology has not received the same level of attenhas not been juxtaposed to technology adoption.
Accordingly, the specific purpose of this paper is to examine some of the implicationsdifferent theoretical frameworks, used in practice, on research in accounting informationIn particular, I will examine how the passage of a technology through a life cycle �as capGartner’s maturity cycle and the adoption curve� affects the research that is done on or atechnology. In addition, I will examine how using that life cycle can facilitate choice ofodology and a technology to analyze the effect of the technology. Further, I integrate�1983� adoption curve into the analysis in order to drive additional understanding, examjoint impact of the stage of technology and adoption curve on firms. Finally, I exampotential use of Gartner’s strategic technologies to facilitate the choice of technologies to
I find that different research methodologies are appropriate or inappropriate at particuin the technology life cycle, based on factors that can be identified from the maturity cadoption curves. In addition, I find that empirical research about technologies is vulnesample bias, depending on where technologies are in their life cycle. I also find that the “technologies” concept provides an apparent approach for identifying new technologiesinvestigations in AIS.
Outline of this PaperThis paper proceeds in the following manner. The first section has provided the m
and the outline of the paper. The next section briefly reviews Gartner’s maturity curve, ttion curve, and Gartner’s notion of strategic technologies. The third section drills dowmaturity curve and its implications for AIS research. The fourth section analyzes in more dadoption curve, examining both Gartner’s cumulative adoption curve and Rogers’ �1983The fifth section studies the impact of integrating the maturity and adoption curves, and f
2
an understanding that empirical research may be gathering biased samples. The sixth sectionprovides an example to illustrate the discussion, using enterprise resource planning systems. Theseventh section examines some extensions to the maturity curve. The eighth section analyzes
Journal of Emerging Technologies in Accounting Volume 6, 2009American Accounting Association
gies aresses the
GY”ife cyclematurityn curve,urve are
r needs,apabilityrated bys for the
1BY: REV: netscape@pub4/third/CLS_journals3/GRP_eta/JOB_v6-i1/DIV_002901eta
3
Gartner’s notions of strategic technologies as a basis of understanding which technololikely to have an impact in AIS. The final section briefly summarizes the paper, and discucontribution and some extensions.
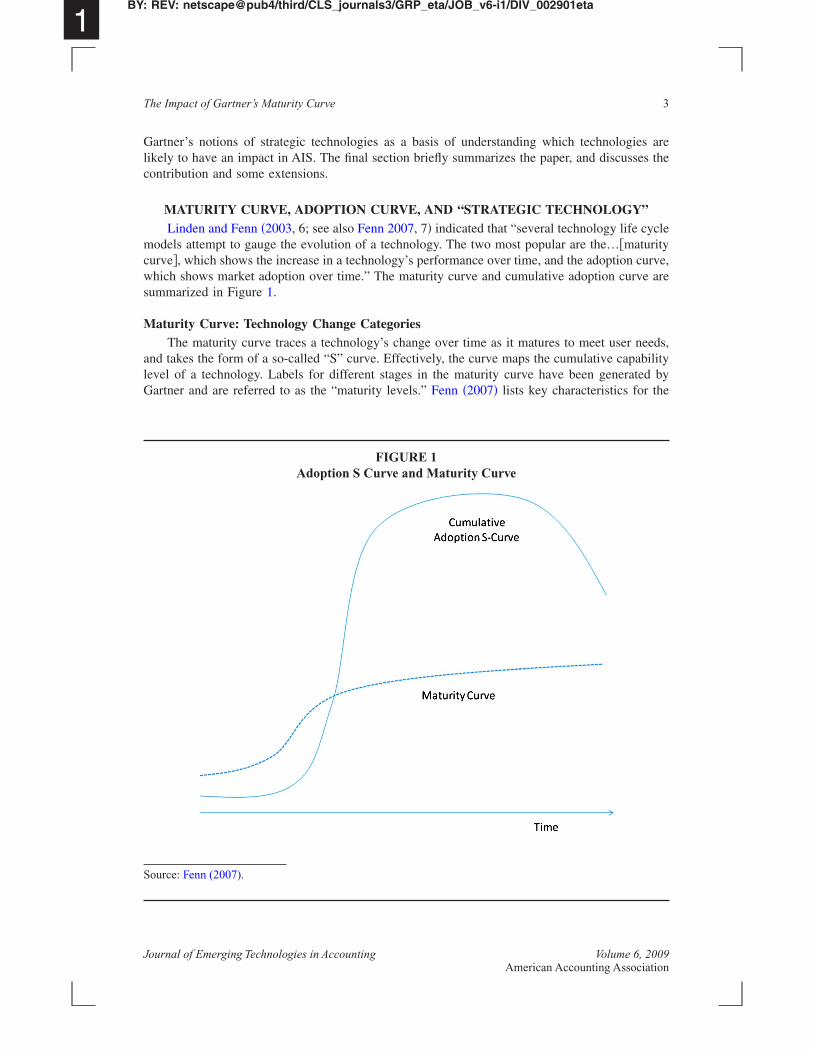
MATURITY CURVE, ADOPTION CURVE, AND “STRATEGIC TECHNOLOLinden and Fenn �2003, 6; see also Fenn 2007, 7� indicated that “several technology l
models attempt to gauge the evolution of a technology. The two most popular are the…�curve�, which shows the increase in a technology’s performance over time, and the adoptiowhich shows market adoption over time.” The maturity curve and cumulative adoption csummarized in Figure 1.
Maturity Curve: Technology Change CategoriesThe maturity curve traces a technology’s change over time as it matures to meet use
and takes the form of a so-called “S” curve. Effectively, the curve maps the cumulative clevel of a technology. Labels for different stages in the maturity curve have been geneGartner and are referred to as the “maturity levels.” Fenn �2007� lists key characteristic
FIGURE 1Adoption S Curve and Maturity Curve
The Impact of Gartner’s Maturity Curve
Source: Fenn (2007).
Journal of Emerging Technologies in Accounting Volume 6, 2009American Accounting Association
escence,ted with
on, usedtime. At
hly a 20technol-
on to thes seen inadopted:of these
impliesthe tech-defines a
ors
h priceon
ess
re out ofs
endors
e focus
only
1BY: REV: netscape@pub4/third/CLS_journals3/GRP_eta/JOB_v6-i1/DIV_002901eta
O’Leary
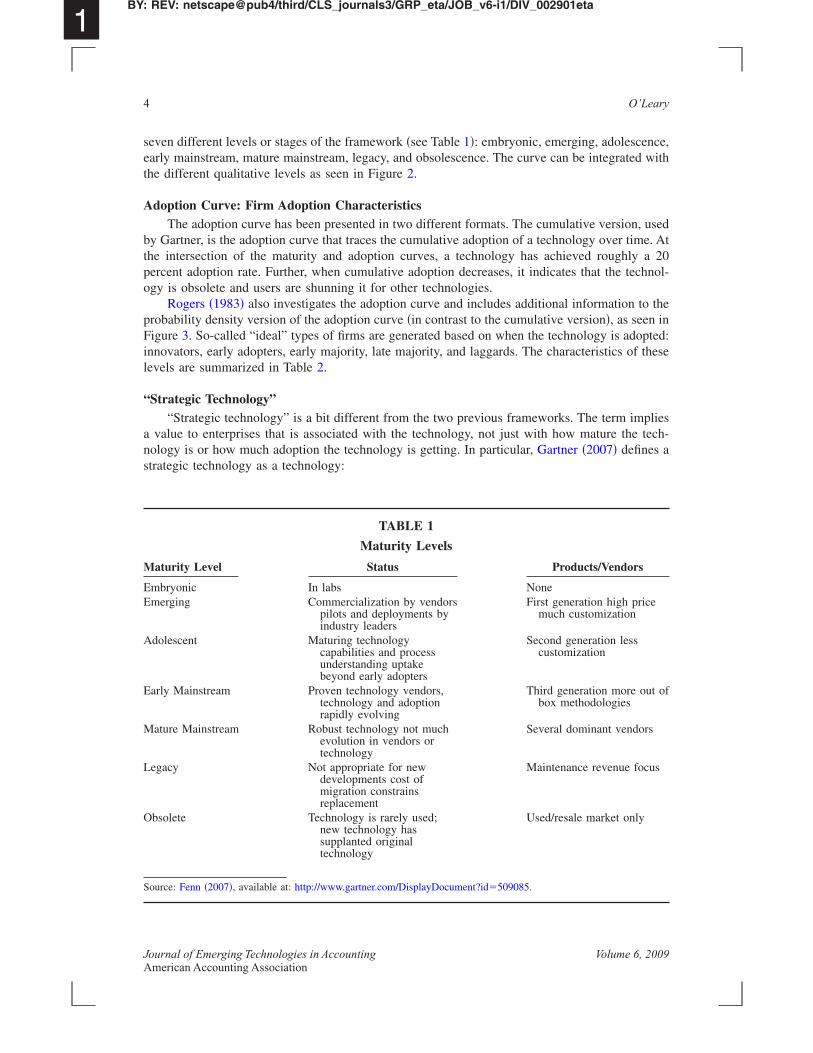
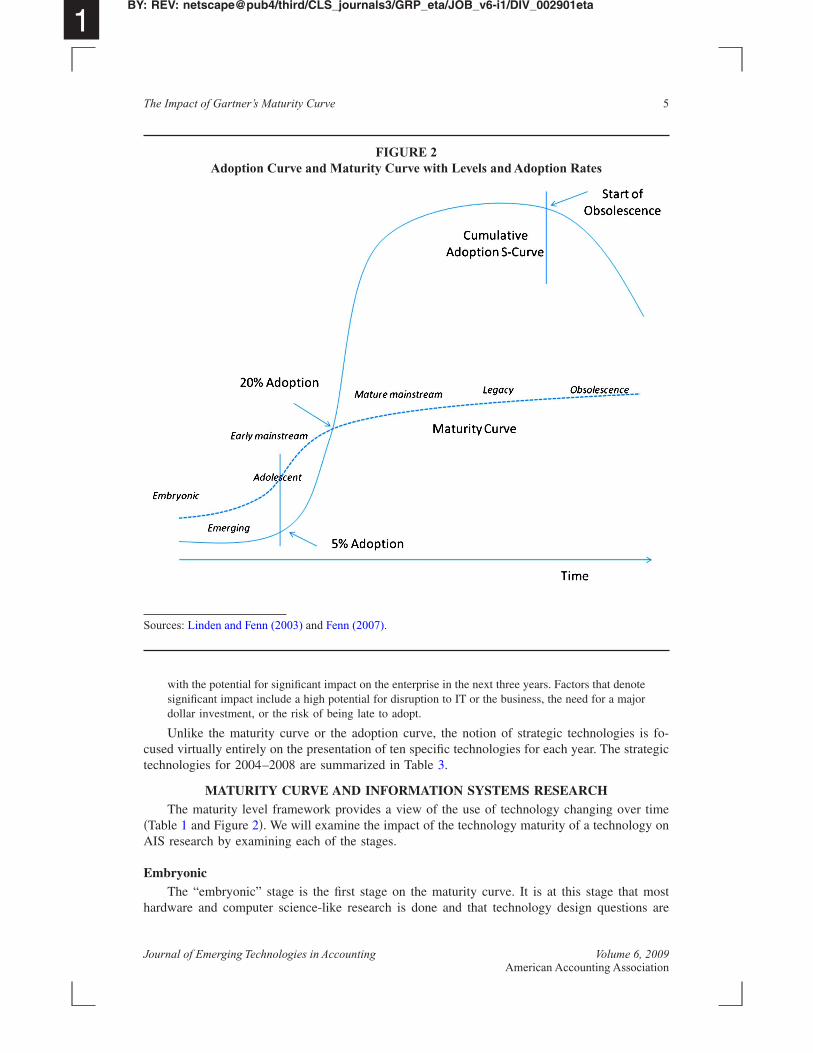
seven different levels or stages of the framework �see Table 1�: embryonic, emerging, adolearly mainstream, mature mainstream, legacy, and obsolescence. The curve can be integrathe different qualitative levels as seen in Figure 2.
Adoption Curve: Firm Adoption CharacteristicsThe adoption curve has been presented in two different formats. The cumulative versi
by Gartner, is the adoption curve that traces the cumulative adoption of a technology overthe intersection of the maturity and adoption curves, a technology has achieved rougpercent adoption rate. Further, when cumulative adoption decreases, it indicates that theogy is obsolete and users are shunning it for other technologies.
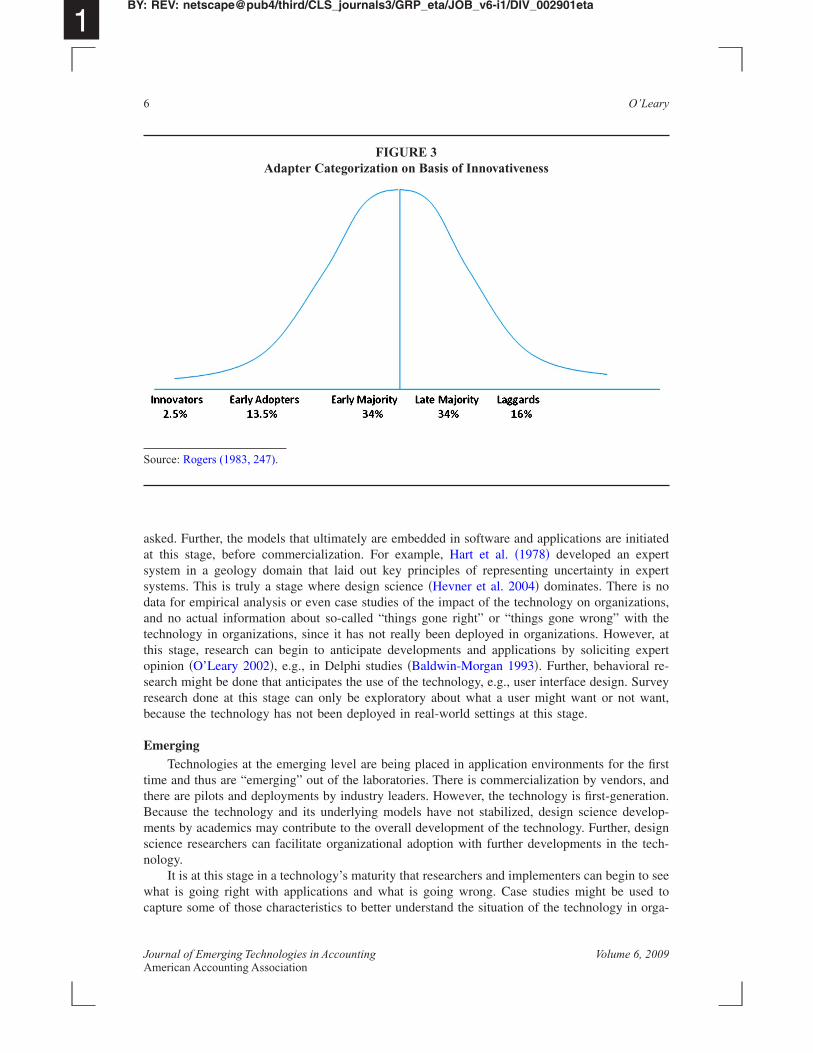
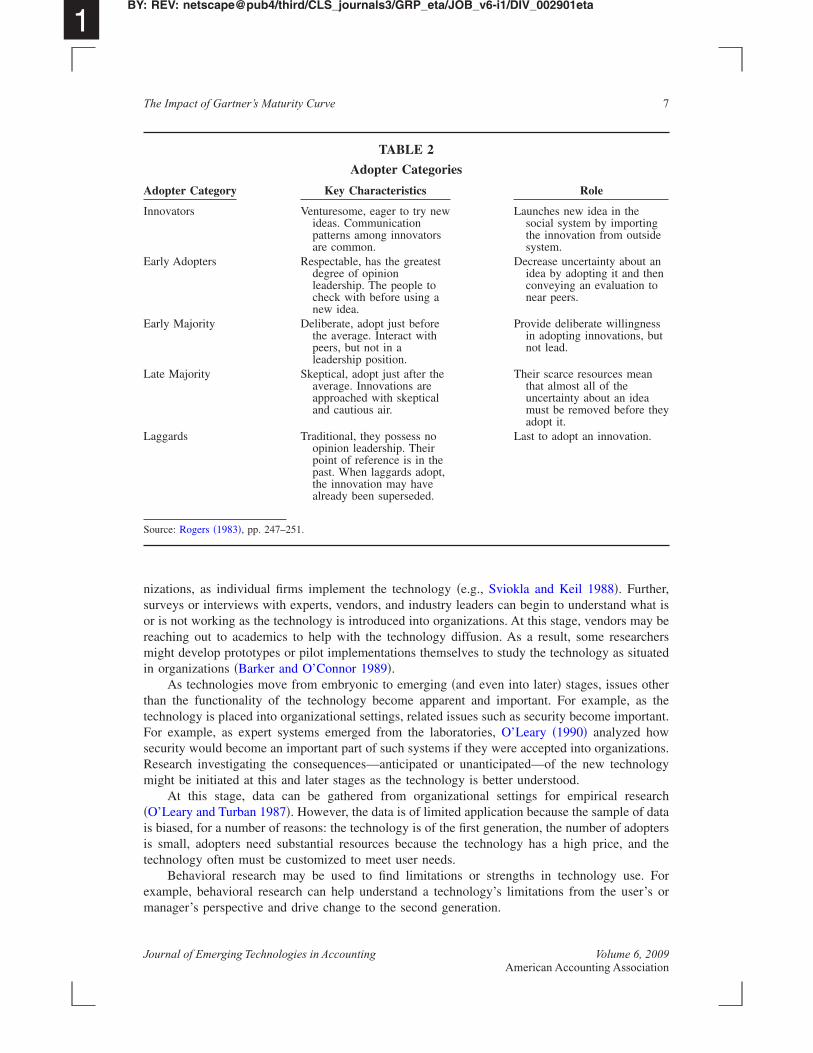
Rogers �1983� also investigates the adoption curve and includes additional informatiprobability density version of the adoption curve �in contrast to the cumulative version�, aFigure 3. So-called “ideal” types of firms are generated based on when the technology isinnovators, early adopters, early majority, late majority, and laggards. The characteristicslevels are summarized in Table 2.
“Strategic Technology”“Strategic technology” is a bit different from the two previous frameworks. The term
a value to enterprises that is associated with the technology, not just with how maturenology is or how much adoption the technology is getting. In particular, Gartner �2007�strategic technology as a technology:
TABLE 1
Maturity Levels
Maturity Level Status Products/Vend
Embryonic In labs NoneEmerging Commercialization by vendors
pilots and deployments byindustry leaders
First generation higmuch customizati
Adolescent Maturing technologycapabilities and processunderstanding uptakebeyond early adopters
Second generation lcustomization
Early Mainstream Proven technology vendors,technology and adoptionrapidly evolving
Third generation mobox methodologie
Mature Mainstream Robust technology not muchevolution in vendors ortechnology
Several dominant v
Legacy Not appropriate for newdevelopments cost ofmigration constrainsreplacement
Maintenance revenu
Obsolete Technology is rarely used;new technology hassupplanted originaltechnology
Used/resale market
4
Source: Fenn �2007�, available at: http://www.gartner.com/DisplayDocument?id�509085.
Journal of Emerging Technologies in Accounting Volume 6, 2009American Accounting Association
noteajor
es is fo-strategic
ver timeology on
1BY: REV: netscape@pub4/third/CLS_journals3/GRP_eta/JOB_v6-i1/DIV_002901eta
5
with the potential for significant impact on the enterprise in the next three years. Factors that designificant impact include a high potential for disruption to IT or the business, the need for a mdollar investment, or the risk of being late to adopt.
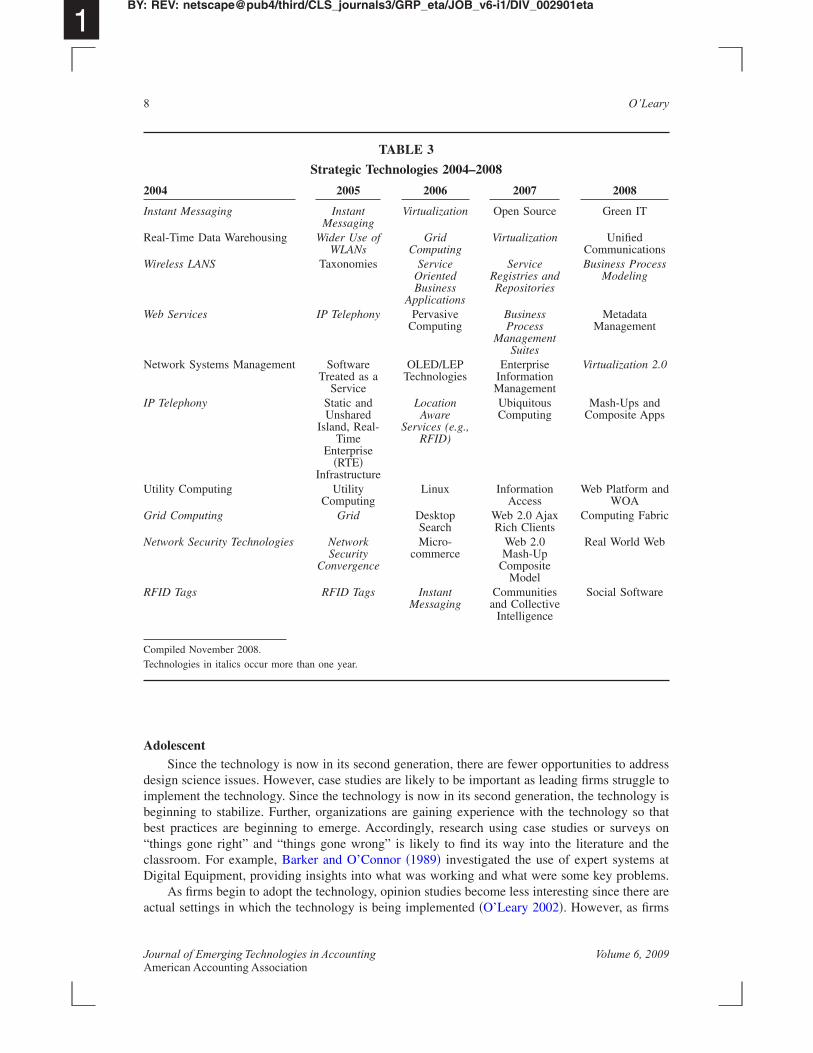
Unlike the maturity curve or the adoption curve, the notion of strategic technologicused virtually entirely on the presentation of ten specific technologies for each year. Thetechnologies for 2004–2008 are summarized in Table 3.
MATURITY CURVE AND INFORMATION SYSTEMS RESEARCHThe maturity level framework provides a view of the use of technology changing o
�Table 1 and Figure 2�. We will examine the impact of the technology maturity of a technAIS research by examining each of the stages.
FIGURE 2Adoption Curve and Maturity Curve with Levels and Adoption Rates
Sources: Linden and Fenn (2003) and Fenn (2007).
The Impact of Gartner’s Maturity Curve
EmbryonicThe “embryonic” stage is the first stage on the maturity curve. It is at this stage that most
hardware and computer science-like research is done and that technology design questions are
Journal of Emerging Technologies in Accounting Volume 6, 2009American Accounting Association
initiatedn expertn expertere is noizations,with theever, at
g expertioral re-. Surveyot want,
the firstors, and
neration.develop-r, designthe tech-
1BY: REV: netscape@pub4/third/CLS_journals3/GRP_eta/JOB_v6-i1/DIV_002901eta
O’Leary
asked. Further, the models that ultimately are embedded in software and applications areat this stage, before commercialization. For example, Hart et al. �1978� developed asystem in a geology domain that laid out key principles of representing uncertainty isystems. This is truly a stage where design science �Hevner et al. 2004� dominates. Thdata for empirical analysis or even case studies of the impact of the technology on organand no actual information about so-called “things gone right” or “things gone wrong”technology in organizations, since it has not really been deployed in organizations. Howthis stage, research can begin to anticipate developments and applications by solicitinopinion �O’Leary 2002�, e.g., in Delphi studies �Baldwin-Morgan 1993�. Further, behavsearch might be done that anticipates the use of the technology, e.g., user interface designresearch done at this stage can only be exploratory about what a user might want or nbecause the technology has not been deployed in real-world settings at this stage.
EmergingTechnologies at the emerging level are being placed in application environments for
time and thus are “emerging” out of the laboratories. There is commercialization by vendthere are pilots and deployments by industry leaders. However, the technology is first-geBecause the technology and its underlying models have not stabilized, design sciencements by academics may contribute to the overall development of the technology. Furthescience researchers can facilitate organizational adoption with further developments innology.
FIGURE 3Adapter Categorization on Basis of Innovativeness
Source: Rogers (1983, 247).
6
It is at this stage in a technology’s maturity that researchers and implementers can begin to seewhat is going right with applications and what is going wrong. Case studies might be used tocapture some of those characteristics to better understand the situation of the technology in orga-
Journal of Emerging Technologies in Accounting Volume 6, 2009American Accounting Association
Further,what is
s may beearcherssituated
es other, as theportant.
zed howizations.hnology
researche of dataadoptersand the
theportingoutside
bout anand thention to
lingnessons, but
meane
ideafore they
ation.
1BY: REV: netscape@pub4/third/CLS_journals3/GRP_eta/JOB_v6-i1/DIV_002901eta
7
nizations, as individual firms implement the technology �e.g., Sviokla and Keil 1988�.surveys or interviews with experts, vendors, and industry leaders can begin to understandor is not working as the technology is introduced into organizations. At this stage, vendorreaching out to academics to help with the technology diffusion. As a result, some resmight develop prototypes or pilot implementations themselves to study the technology asin organizations �Barker and O’Connor 1989�.
As technologies move from embryonic to emerging �and even into later� stages, issuthan the functionality of the technology become apparent and important. For exampletechnology is placed into organizational settings, related issues such as security become imFor example, as expert systems emerged from the laboratories, O’Leary �1990� analysecurity would become an important part of such systems if they were accepted into organResearch investigating the consequences—anticipated or unanticipated—of the new tecmight be initiated at this and later stages as the technology is better understood.
At this stage, data can be gathered from organizational settings for empirical�O’Leary and Turban 1987�. However, the data is of limited application because the samplis biased, for a number of reasons: the technology is of the first generation, the number ofis small, adopters need substantial resources because the technology has a high price,technology often must be customized to meet user needs.
TABLE 2
Adopter Categories
Adopter Category Key Characteristics Role
Innovators Venturesome, eager to try newideas. Communicationpatterns among innovatorsare common.
Launches new idea insocial system by imthe innovation fromsystem.
Early Adopters Respectable, has the greatestdegree of opinionleadership. The people tocheck with before using anew idea.
Decrease uncertainty aidea by adopting itconveying an evaluanear peers.
Early Majority Deliberate, adopt just beforethe average. Interact withpeers, but not in aleadership position.
Provide deliberate wilin adopting innovatinot lead.
Late Majority Skeptical, adopt just after theaverage. Innovations areapproached with skepticaland cautious air.
Their scarce resourcesthat almost all of thuncertainty about anmust be removed beadopt it.
Laggards Traditional, they possess noopinion leadership. Theirpoint of reference is in thepast. When laggards adopt,the innovation may havealready been superseded.
Last to adopt an innov
Source: Rogers �1983�, pp. 247–251.
The Impact of Gartner’s Maturity Curve
Behavioral research may be used to find limitations or strengths in technology use. Forexample, behavioral research can help understand a technology’s limitations from the user’s ormanager’s perspective and drive change to the second generation.
Journal of Emerging Technologies in Accounting Volume 6, 2009American Accounting Association
addressruggle toology is
y so thatrveys on
and thestems at
08
n IT
ifiednications
Processeling
adataement
ation 2.0
ps andite Apps
tform andOAng Fabric
rld Web
oftware
1BY: REV: netscape@pub4/third/CLS_journals3/GRP_eta/JOB_v6-i1/DIV_002901eta
O’Leary
AdolescentSince the technology is now in its second generation, there are fewer opportunities to
design science issues. However, case studies are likely to be important as leading firms stimplement the technology. Since the technology is now in its second generation, the technbeginning to stabilize. Further, organizations are gaining experience with the technologbest practices are beginning to emerge. Accordingly, research using case studies or su“things gone right” and “things gone wrong” is likely to find its way into the literatureclassroom. For example, Barker and O’Connor �1989� investigated the use of expert sy
TABLE 3
Strategic Technologies 2004–2008
2004 2005 2006 2007 20
Instant Messaging InstantMessaging
Virtualization Open Source Gree
Real-Time Data Warehousing Wider Use ofWLANs
GridComputing
Virtualization UnCommu
Wireless LANS Taxonomies ServiceOrientedBusiness
Applications
ServiceRegistries andRepositories
BusinessMod
Web Services IP Telephony PervasiveComputing
BusinessProcess
ManagementSuites
MetManag
Network Systems Management SoftwareTreated as a
Service
OLED/LEPTechnologies
EnterpriseInformationManagement
Virtualiz
IP Telephony Static andUnshared
Island, Real-Time
Enterprise�RTE�
Infrastructure
LocationAware
Services (e.g.,RFID)
UbiquitousComputing
Mash-UCompos
Utility Computing UtilityComputing
Linux InformationAccess
Web PlaW
Grid Computing Grid DesktopSearch
Web 2.0 AjaxRich Clients
Computi
Network Security Technologies NetworkSecurity
Convergence
Micro-commerce
Web 2.0Mash-Up
CompositeModel
Real Wo
RFID Tags RFID Tags InstantMessaging
Communitiesand Collective
Intelligence
Social S
Compiled November 2008.Technologies in italics occur more than one year.
8
Digital Equipment, providing insights into what was working and what were some key problems.As firms begin to adopt the technology, opinion studies become less interesting since there are
actual settings in which the technology is being implemented �O’Leary 2002�. However, as firms
Journal of Emerging Technologies in Accounting Volume 6, 2009American Accounting Association
interest.e firms
be usingof RFIDd. Thus,
rsions ofrther, the
aknessesto drivenstream.
rganiza-pted theanalyze
as manyimilarly,pted thehnologyed since
sociatedearchersmpirical. On thelogy �oro longerments.employst systemould not
s of thescience,dressed.
ormationBisbal et
rns. For
1BY: REV: netscape@pub4/third/CLS_journals3/GRP_eta/JOB_v6-i1/DIV_002901eta
9
adopt the technology, impact studies about the actual effect of the technology gatherFurther, survey research about the use of the technology can be developed since somactually are implementing the technology.
Sample bias using empirical research can emerge at this step. Some firms maydifferent �either first or second� generations of the technology. For example, the adoptionby Metro �Ton et al. 2005� requires choosing which generation of RFID chips is to be useempirical findings about RFID and other technologies may be driven by the different vethe technologies actually used, as well as by the firms using them, as discussed below. Fucoexistence of multiple generations may confound and camouflage results.
Again, behavioral research may drive a better understanding of the strengths and weof technology usage. Behavioral research can be an important source of informationchange in technology to the third generation, introduced as the technology goes early mai
Early MainstreamAs applications go mainstream, unbiased sample empirical research that relates to o
tional adoption becomes more feasible, because a larger sample of firms has now adotechnology. As a result, it is at this stage that large-scale empirical analysis can begin tofirm characteristics. However, design science and modeling issues become less important,of the major problems have already been addressed in the third generation of products. Scase studies are of less interest because a number of organizations have already adotechnology. The quality of opinion data is overridden by actual experience with the tec�e.g., O’Leary 2002�. Behavioral research that needs mature artifacts can now be developthe third generation of products exists �e.g., Arnold et al. 2006�.
Mature MainstreamSimilar to early mainstream, in the mature mainstream, important research issues as
with technology adoption and diffusion can be addressed using empirical research, as rescan follow the flow of adoption across firms and industries. It is at this stage that full eanalysis of unbiased samples of accounting and stock market data is likely to be feasibleother hand, design science applications generally are too late, unless they push the technoa portion of it� back in the maturity curve through new developments. Case studies are nof much interest, because the technology is already implemented in a number of environ
Behavioral research can be used at this stage. In particular, behavioral research thatfully developed artifacts can be used. For example, Arnold et al. �2006� analyzed an experthat probably would be categorized as early or mature mainstream. Their research likely cbe done until an artifact that was sufficiently developed could be investigated.
LegacyAs systems move into legacy environments there are a large number of example
technology, but the technology is so widespread that few “secrets” of its use exist. Designcases, opinion, surveys, etc., are not of general interest, since most issues have been adLegacy technologies are well accepted and widely dispersed. Unfortunately, from an infsystems perspective, so-called legacy systems have received only limited attention �e.g.,al. 1999�.
At times, the need to fix legacy systems has generated additional research conce
The Impact of Gartner’s Maturity Curve
example, with the year 2000 problem, substantial attention was devoted to legacy software. Asfirms make additional applications available online, potentially including legacy applications,issues of the security of legacy applications may become increasingly important. In general,
Journal of Emerging Technologies in Accounting Volume 6, 2009American Accounting Association
are lessasonablethere is
from they.”
analysisormation
portanthnology
lar, whatort by a
differentch as the
there issciencebryonic
that canert opin-ology insamples.n it will
re main-hnologyples of
easures,science,
ch ques-ork, fo-
ormationcounting
stage ist charac-likely toalso areof suchlopment
1BY: REV: netscape@pub4/third/CLS_journals3/GRP_eta/JOB_v6-i1/DIV_002901eta
O’Leary
legacy systems can provide a large sample; because of the systems’ legacy status, firmslikely to be concerned about the disclosure of value-creating capabilities. As a result, resamples of firms conceivably could be generated for empirical research. Unfortunately,likely to be only limited interest in studies about legacy systems. However, as we can seechanging maturity levels, “Today’s emerging technology is tomorrow’s legacy technolog
ObsoleteAs technologies move out of the legacy category, they become obsolete. A life cycle
leads to an interesting finding that apparently little research �AIS or management infsystems� is done on technology at this stage. However, it would appear that there are imresearch questions that can be addressed. For example, understanding what makes a tec“obsolete” might be used to predict when a technology will become obsolete. In particusignals can suggest that a technology is no longer going to be used? Is it lack of suppvendor that ultimately categorizes a technology as obsolete?
Applying to AIS ResearchDifferent methodologies and corresponding research questions can be addressed at
stages of a technology. For example, at the embryonic stage, design science activities, sudevelopment of models, software, and hardware, are likely to drive the research, sincelimited descriptive data about how the technology works. At the embryonic stage, designapproaches, such as prototyping or modeling, can be the primary tools. Further, at the emstage, expert opinion about the technology or its use is likely to be sought out.
At the emerging and adolescent stages, there is likely to be a focus on case studiesgenerate information about best practices, things gone right, and things gone wrong. Expion may be of interest in the case of emerging issues such as the situation of the technorganizations. At these stages, empirical research is likely to be generated using biasedAs an example, technology at the emerging stage is first-generation and is more costly thabe at later stages. Such “mixes” of technologies may bias away from finding results.
However, as the technology moves into later maturity levels, such as early and matustream, alternative research approaches become feasible and preferred. Movement of a tecinto early mainstream and mature mainstream allows researchers to gather larger samtechnology uses and to examine issues such as the impact on stock prices or accounting mwithout biased samples, using empirical archival studies. However, at these stages, designcase studies, surveys, and opinions are not of general interest.
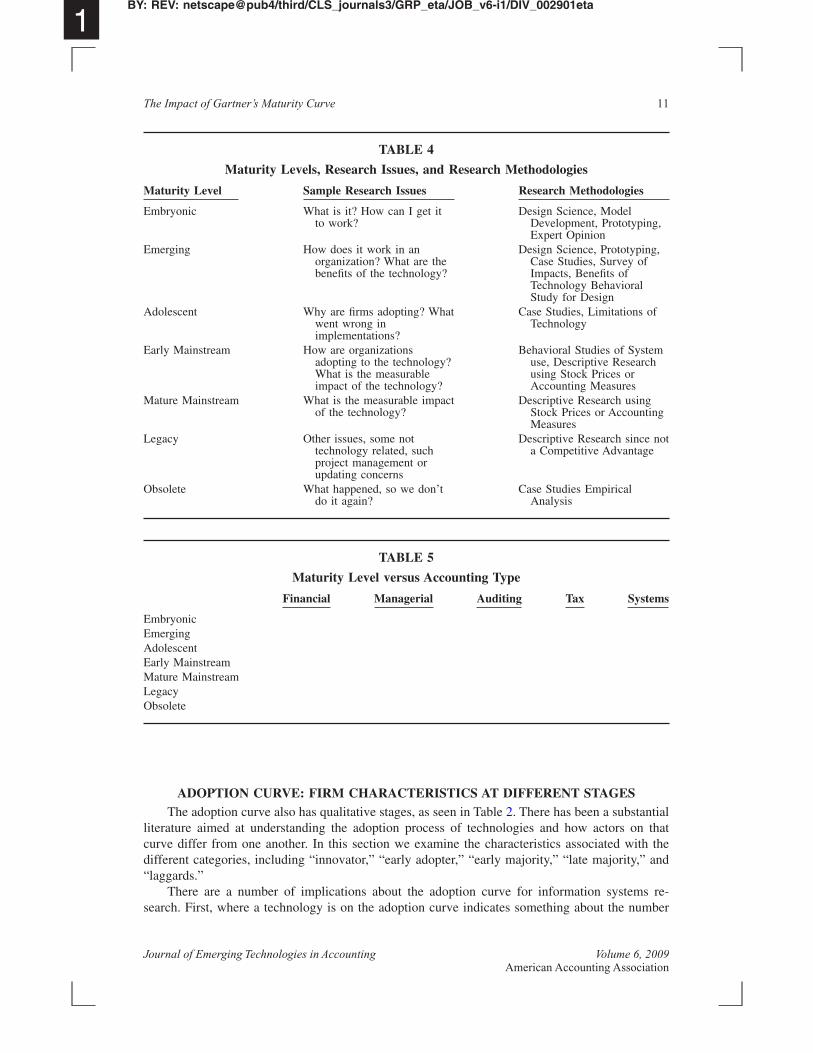
Particular technology maturity levels are likely to be amenable to particular researtions. For example, Table 4 summarizes some applications to the maturity level framewcusing on potential research issues and methodologies that match the maturity level infand research issues. Table 5 provides another approach to map maturity level onto acapplication type.
Finally, from a sample perspective, it is likely that the sample of firms at eachdifferent. For example, firms involved at the embryonic stage are likely to have differenteristics than firms involved only at the legacy stage. Firms at the embryonic stage arehave research and development dollars that can be spent on such activities. Such firmslikely to be in industries where it may be necessary to be aware of the developmenttechnologies. Accordingly, more dynamic industries are likely to be involved in the deve
10
of a technology at the embryonic stages. From a research perspective, that suggests a potential biasin the sample of firms gathered at particular stages. Accordingly, maturity stage may be a corre-lated omitted variable that should be accounted for in empirical studies.
Journal of Emerging Technologies in Accounting Volume 6, 2009American Accounting Association
Sbstantialon that
with theity,” and
gies
elotyping,
typing,ey off
ioral
ions of
Systemsearchorresusing
counting
since notantage
al
Systems
1BY: REV: netscape@pub4/third/CLS_journals3/GRP_eta/JOB_v6-i1/DIV_002901eta
11
ADOPTION CURVE: FIRM CHARACTERISTICS AT DIFFERENT STAGEThe adoption curve also has qualitative stages, as seen in Table 2. There has been a su
literature aimed at understanding the adoption process of technologies and how actorscurve differ from one another. In this section we examine the characteristics associateddifferent categories, including “innovator,” “early adopter,” “early majority,” “late major
TABLE 4
Maturity Levels, Research Issues, and Research Methodologies
Maturity Level Sample Research Issues Research Methodolo
Embryonic What is it? How can I get itto work?
Design Science, ModDevelopment, ProtExpert Opinion
Emerging How does it work in anorganization? What are thebenefits of the technology?
Design Science, ProtoCase Studies, SurvImpacts, Benefits oTechnology BehavStudy for Design
Adolescent Why are firms adopting? Whatwent wrong inimplementations?
Case Studies, LimitatTechnology
Early Mainstream How are organizationsadopting to the technology?What is the measurableimpact of the technology?
Behavioral Studies ofuse, Descriptive Reusing Stock PricesAccounting Measu
Mature Mainstream What is the measurable impactof the technology?
Descriptive ResearchStock Prices or AcMeasures
Legacy Other issues, some nottechnology related, suchproject management orupdating concerns
Descriptive Researcha Competitive Adv
Obsolete What happened, so we don’tdo it again?
Case Studies EmpiricAnalysis
TABLE 5
Maturity Level versus Accounting Type
Financial Managerial Auditing Tax
EmbryonicEmergingAdolescentEarly MainstreamMature MainstreamLegacyObsolete
The Impact of Gartner’s Maturity Curve
“laggards.”There are a number of implications about the adoption curve for information systems re-
search. First, where a technology is on the adoption curve indicates something about the number
Journal of Emerging Technologies in Accounting Volume 6, 2009American Accounting Association
available
here aremple, astivenessranches,tes firms
ogy varybased ons along arve cat-
But they
ta pointse criticalanalysis
hat pointsing thee., such aswill notmples ofgies for
mpact ofor somers likely� inves-internal
lligence,ts of the
ERSUS
me pointate large
of user.ying there 2, wee. Quali-logy hasadoption
1BY: REV: netscape@pub4/third/CLS_journals3/GRP_eta/JOB_v6-i1/DIV_002901eta
O’Leary
of firms that are available as a sample for research. In the beginning there are few firmsfor empirical analysis, while by the end there are substantial numbers of firms.
Second, as discussed in Rogers �1983�, Mahler and Rogers �1999�, and others, tdistinct differences between the firms in the five categories on the adoption curve. For exanoted in Mahler and Rogers �1999, 730�, “Strong relationships exist between innovascores and various indicators of bank size, such as total assets, employees, number of bnumber of subsidiaries, and number of customers.” In a range of studies, “size” differentiathat fall into different categories, such as “innovators” �Mahajan et al. 1990�.
Third, as discussed by Harrison and Waite �2006�, the benefits of adopting a technolsignificantly by adoption curve category. As a result, the business cases apparently differwhich category the firm occupies, with innovators generating substantially greater benefitrange of dimensions. In addition, Pennings and Harianto �1992� found that adoption cuegory was dependent, in part, on existing technology infrastructure and prior experience.also found size was an important variable.
Applying to IS and AIS ResearchIn any case, this discussion illustrates that both the number of firms available as da
and the categories of firms on the adoption curve have different characteristics. These arfindings from a research perspective, since they imply that the findings of any empiricalof firms will vary based on which group of firms the research is conducted upon and at walong the adoption curve the research is done. Further, simply the number of firms utechnology and available as data points will vary based on location in the adoption cycl
In particular, since the different categories of adopters have different characteristicssize, this would suggest that analyses of firms that are innovators or early adoptersgeneralize to other categories. For example, innovators and laggards provide different safirms, and have not only different characteristics, but also different reasons and strateadopting a technology. As a result, we are likely to find different results in terms of the ia technology if we use a sample of innovators as compared to a sample of laggards,broader base of firms. Accordingly, the results of an analysis on innovators or early adoptewill not generalize to other groups of firms. As an example, O’Leary and Watkins �1995tigated general characteristics of firms that had implemented artificial intelligence inauditing. Because the results were obtained largely from “innovator” firms in artificial inteit is likely that some of the results generated may not generalize to firms in other paradoption curve.
INTERACTION BETWEEN ADOPTION AND MATURITY CURVES: FIRMS VTECHNOLOGY
Empirical research depends on analysis of the behavior of large groups of firms at soin time. As a result, in order to do empirical research, we need to be able to generunbiased samples of firms, or recognize that the results are limited to a particular category
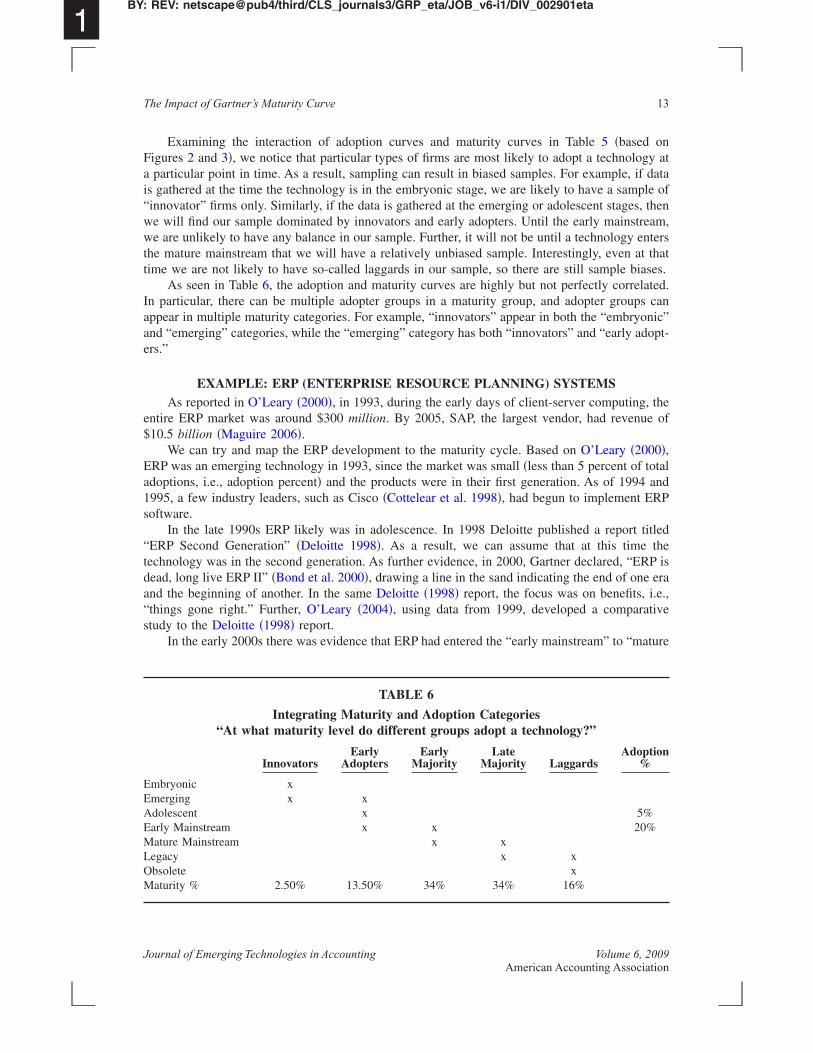
The joint interaction between the adoption and maturity curves is useful in identiftypes of firms involved at different technology adoption levels. For example, from Figucan map the 5 percent adoption and the 20 percent adoption marks to the maturity curvtatively we can see that roughly 5 percent of the adoptions occur by the time the technomoved from “embryonic” to “emerging” to “adolescence.” Further, 20 percent of the
12
corresponds to having the technology move through “early mainstream.” Further, we can map thequalitative categories from adoption and maturity to each other as seen in Table 6 providing a mapof the types of firms in the sample at the different portions of the technology life cycle.
Journal of Emerging Technologies in Accounting Volume 6, 2009American Accounting Association
ased onology at
e, if dataample ofges, thennstream,y entersn at thatbiases.
rrelated.ups can
bryonic”ly adopt-
ting, thevenue of
�2000�,t of total994 andent ERP
ort titledtime the“ERP is
f one erafits, i.e.,parative
“mature
Adoption%
5%20%
1BY: REV: netscape@pub4/third/CLS_journals3/GRP_eta/JOB_v6-i1/DIV_002901eta
13
Examining the interaction of adoption curves and maturity curves in Table 5 �bFigures 2 and 3�, we notice that particular types of firms are most likely to adopt a techna particular point in time. As a result, sampling can result in biased samples. For examplis gathered at the time the technology is in the embryonic stage, we are likely to have a s“innovator” firms only. Similarly, if the data is gathered at the emerging or adolescent stawe will find our sample dominated by innovators and early adopters. Until the early maiwe are unlikely to have any balance in our sample. Further, it will not be until a technologthe mature mainstream that we will have a relatively unbiased sample. Interestingly, evetime we are not likely to have so-called laggards in our sample, so there are still sample
As seen in Table 6, the adoption and maturity curves are highly but not perfectly coIn particular, there can be multiple adopter groups in a maturity group, and adopter groappear in multiple maturity categories. For example, “innovators” appear in both the “emand “emerging” categories, while the “emerging” category has both “innovators” and “earers.”
EXAMPLE: ERP (ENTERPRISE RESOURCE PLANNING) SYSTEMSAs reported in O’Leary �2000�, in 1993, during the early days of client-server compu
entire ERP market was around $300 million. By 2005, SAP, the largest vendor, had re$10.5 billion �Maguire 2006�.
We can try and map the ERP development to the maturity cycle. Based on O’LearyERP was an emerging technology in 1993, since the market was small �less than 5 percenadoptions, i.e., adoption percent� and the products were in their first generation. As of 11995, a few industry leaders, such as Cisco �Cottelear et al. 1998�, had begun to implemsoftware.
In the late 1990s ERP likely was in adolescence. In 1998 Deloitte published a rep“ERP Second Generation” �Deloitte 1998�. As a result, we can assume that at thistechnology was in the second generation. As further evidence, in 2000, Gartner declared,dead, long live ERP II” �Bond et al. 2000�, drawing a line in the sand indicating the end oand the beginning of another. In the same Deloitte �1998� report, the focus was on bene“things gone right.” Further, O’Leary �2004�, using data from 1999, developed a comstudy to the Deloitte �1998� report.
In the early 2000s there was evidence that ERP had entered the “early mainstream” to
TABLE 6
Integrating Maturity and Adoption Categories“At what maturity level do different groups adopt a technology?”
InnovatorsEarly
AdoptersEarly
MajorityLate
Majority Laggards
Embryonic xEmerging x xAdolescent xEarly Mainstream x xMature Mainstream x xLegacy x x
The Impact of Gartner’s Maturity Curve
Obsolete xMaturity % 2.50% 13.50% 34% 34% 16%
Journal of Emerging Technologies in Accounting Volume 6, 2009American Accounting Association
enteredhere was
date in2005, it
planningst cases,ponds to995� in-ems wasife cycleand was
lified byfoundeden ERPher ERPMcAfeegh earlyace withwith the
rs in the1989–
bryonic,y inves-tentiallyr admin-e is thatng stagethe cost
re recentt set of
ODELulting inin otherof manynologies, knowl-d statis-
1BY: REV: netscape@pub4/third/CLS_journals3/GRP_eta/JOB_v6-i1/DIV_002901eta
O’Leary
mainstream” level, since most ERP software had become web-enabled, and the technologythe third generation. As a result, it was not surprising, if we look back and take note, that ta criticism of the use of expert opinion, as a research methodology, at a relatively lateERP’s maturity curve �O’Leary 2002� because actual data existed. By sometime aroundwas likely that ERP had entered the mature mainstream level of the maturity cycle.
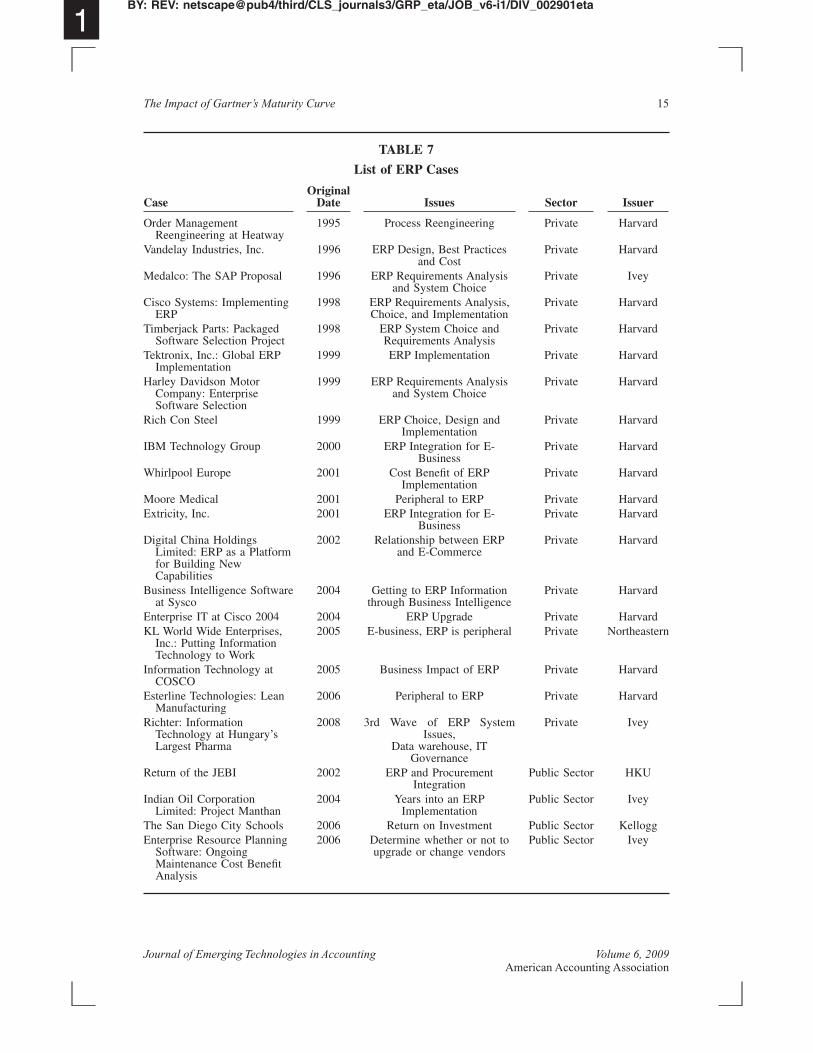
ERP CasesIn order to further analyze this issue, I have summarized the enterprise resource
�ERP� systems case studies available from the Harvard collection �Table 7�. The very firpublished in 1995 and 1996, were concerned with processes and ERP systems. This corresissues addressed with emerging and adolescent technologies. The case by Davenport �1vestigating Heatway, suggests that the relationship between reengineering and ERP systnot well-understood. Through 1996 and into 1999, the concern was with the classic ERP lof requirements analysis, choice, and implementation, when ERP was in its adolescencebecoming early mainstream. The limited understanding of the technology is exempCisco’s budget generation and project time estimates, which were found to be relatively un�Cottelear et al. 1998�. However, around 2000, the focus shifted to integration betwesystems and integration of ERP systems with so-called “e-business.” Since that time otcases have focused on emerging issues such as upgrading an existing ERP system �e.g.,et al. 2004� or business intelligence. That corresponds to the technology going throumainstream to mature mainstream, as issues related to how the systems would interfcustomers and internal systems were addressed along with issues such as making moneytechnology.
ERP Research and the Maturity CycleInterestingly, some empirical work on ERP systems was done by a number of autho
early 2000s. Poston and Grabski �2001� was a groundbreaking study that used data from1997. As a result, it is possible that their sample was biased to maturities in the ememerging, or possibly the beginning of adolescence stages. In addition, the firms that thetigated were likely “innovators” or at least “early adopters;” that likelihood could also pobias the results. Poston and Grabski �2001� found no improvement in selling, general oistrative, or residual income. An alternative potential explanation from the maturity curvthe technology will have a high price and be highly customized in general in the emergior not meet user needs. Based on the maturity curve argument, we would anticipate thatfunction changes as the technology moves along the maturity curve. As a result, a mosample of firms, associated with third-generation technology, might provide a differenfindings; of course, this is an empirical question.
EXTENSION: CHANGES TO TECHNOLOGIES THROUGH THE MATURITY MA number of changes can influence technologies and affect their life cycle, res
changes to the maturity curve �e.g., Fenn 2007�. First, technologies can be embeddedtechnologies and cease to function as stand-alone. This seems to be a life cycle aspectdevelopments in artificial intelligence �e.g., O’Leary and Watkins 1992�. Second, techmay splinter into other concepts, or other technologies may merge together. For exampleedge discovery is generally thought to consist of techniques from artificial intelligence an
14
tics. Third, technologies can become extinct, or at least substantially decrease in apparent use, atany point in the life cycle. Fourth, the audience for a technology can change, also influencing thelife cycle. For example, KPMG’s knowledge management system was initially aimed only at
Journal of Emerging Technologies in Accounting Volume 6, 2009American Accounting Association
Issuer
arvard
arvard
Ivey
arvard
arvard
arvard
arvard
arvard
arvard
arvard
arvardarvard
arvard
arvard
arvardrtheastern
arvard
arvard
Ivey
HKU
Ivey
elloggIvey
1BY: REV: netscape@pub4/third/CLS_journals3/GRP_eta/JOB_v6-i1/DIV_002901eta
15
TABLE 7
List of ERP Cases
CaseOriginal
Date Issues Sector
Order ManagementReengineering at Heatway
1995 Process Reengineering Private H
Vandelay Industries, Inc. 1996 ERP Design, Best Practicesand Cost
Private H
Medalco: The SAP Proposal 1996 ERP Requirements Analysisand System Choice
Private
Cisco Systems: ImplementingERP
1998 ERP Requirements Analysis,Choice, and Implementation
Private H
Timberjack Parts: PackagedSoftware Selection Project
1998 ERP System Choice andRequirements Analysis
Private H
Tektronix, Inc.: Global ERPImplementation
1999 ERP Implementation Private H
Harley Davidson MotorCompany: EnterpriseSoftware Selection
1999 ERP Requirements Analysisand System Choice
Private H
Rich Con Steel 1999 ERP Choice, Design andImplementation
Private H
IBM Technology Group 2000 ERP Integration for E-Business
Private H
Whirlpool Europe 2001 Cost Benefit of ERPImplementation
Private H
Moore Medical 2001 Peripheral to ERP Private HExtricity, Inc. 2001 ERP Integration for E-
BusinessPrivate H
Digital China HoldingsLimited: ERP as a Platformfor Building NewCapabilities
2002 Relationship between ERPand E-Commerce
Private H
Business Intelligence Softwareat Sysco
2004 Getting to ERP Informationthrough Business Intelligence
Private H
Enterprise IT at Cisco 2004 2004 ERP Upgrade Private HKL World Wide Enterprises,
Inc.: Putting InformationTechnology to Work
2005 E-business, ERP is peripheral Private No
Information Technology atCOSCO
2005 Business Impact of ERP Private H
Esterline Technologies: LeanManufacturing
2006 Peripheral to ERP Private H
Richter: InformationTechnology at Hungary’sLargest Pharma
2008 3rd Wave of ERP SystemIssues,
Data warehouse, ITGovernance
Private
Return of the JEBI 2002 ERP and ProcurementIntegration
Public Sector
Indian Oil CorporationLimited: Project Manthan
2004 Years into an ERPImplementation
Public Sector
The San Diego City Schools 2006 Return on Investment Public Sector KEnterprise Resource Planning 2006 Determine whether or not to Public Sector
The Impact of Gartner’s Maturity Curve
Software: OngoingMaintenance Cost BenefitAnalysis
upgrade or change vendors
Journal of Emerging Technologies in Accounting Volume 6, 2009American Accounting Association
ever, theworkers.nting orsuch as
maturityly chainompletein capa-ology ispoint inp in the
capabili-fter anybecauseidentifi-
iers usedped, butbe read,elied onisruptiveeases in
1BY: REV: netscape@pub4/third/CLS_journals3/GRP_eta/JOB_v6-i1/DIV_002901eta
O’Leary
partners �Gladstone and Eccles 1995� and not at lower-level knowledge workers. Howsystem ultimately was implemented to focus on providing knowledge to all knowledgeFifth, technologies can go on “hold” or have no recognized specific applications in accouauditing. For example, “grid computing” appears to have limited applications for domainsaccounting and auditing.
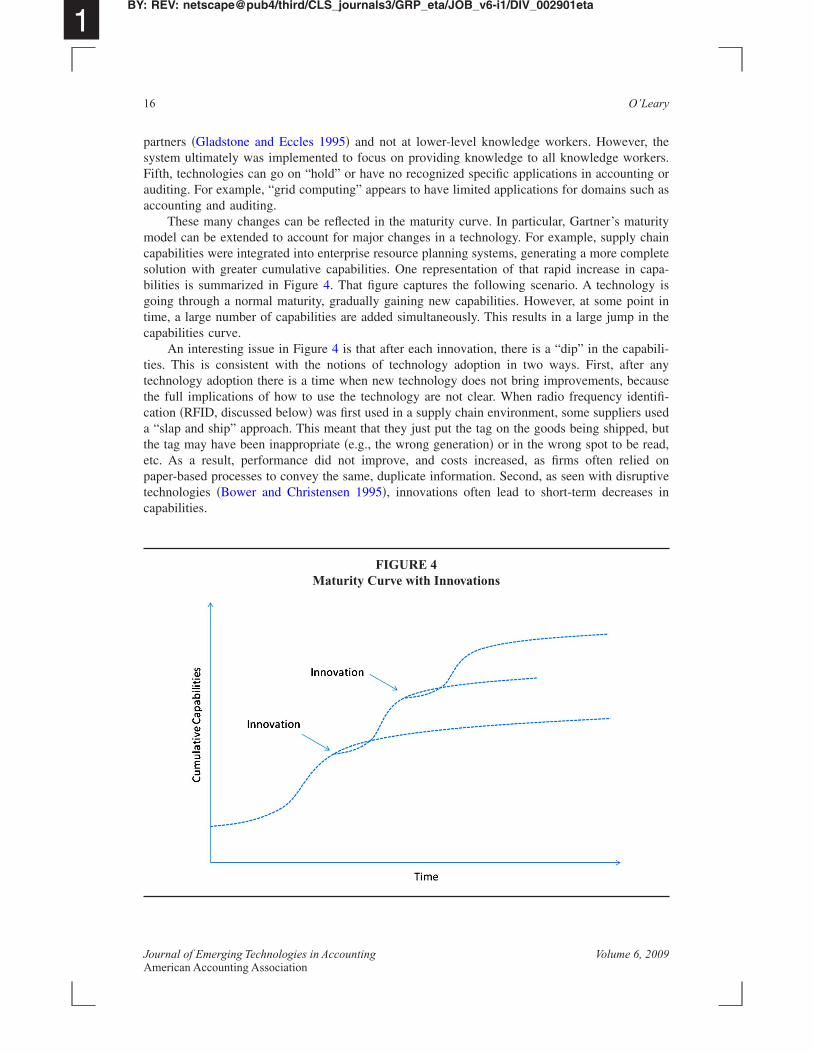
These many changes can be reflected in the maturity curve. In particular, Gartner’smodel can be extended to account for major changes in a technology. For example, suppcapabilities were integrated into enterprise resource planning systems, generating a more csolution with greater cumulative capabilities. One representation of that rapid increasebilities is summarized in Figure 4. That figure captures the following scenario. A techngoing through a normal maturity, gradually gaining new capabilities. However, at sometime, a large number of capabilities are added simultaneously. This results in a large jumcapabilities curve.
An interesting issue in Figure 4 is that after each innovation, there is a “dip” in theties. This is consistent with the notions of technology adoption in two ways. First, atechnology adoption there is a time when new technology does not bring improvements,the full implications of how to use the technology are not clear. When radio frequencycation �RFID, discussed below� was first used in a supply chain environment, some suppla “slap and ship” approach. This meant that they just put the tag on the goods being shipthe tag may have been inappropriate �e.g., the wrong generation� or in the wrong spot toetc. As a result, performance did not improve, and costs increased, as firms often rpaper-based processes to convey the same, duplicate information. Second, as seen with dtechnologies �Bower and Christensen 1995�, innovations often lead to short-term decrcapabilities.
FIGURE 4Maturity Curve with Innovations
16
Journal of Emerging Technologies in Accounting Volume 6, 2009American Accounting Association
re thosere likelymework.ing in alogies is
e casesnt suites
ven news in fournd “gridoncerns.pics. Forovide an
r some rrs mightclearest
plications a basiscountingenerally,oblem orve well-ting area
follow-
r anisci-
niza-pro-both
nologiestechnol-
countingright keyt of that
1BY: REV: netscape@pub4/third/CLS_journals3/GRP_eta/JOB_v6-i1/DIV_002901eta
17
STRATEGIC TECHNOLOGIES AND AISGartner’s “strategic technologies” list provides insights into what Gartner thinks a
technologies that will have a large impact in the next three years or so. As a result, these ato be technologies that are in the adolescent or early mainstream stages in the maturity fraThe notion of a strategic technology has limited theoretical structure, generally resultyearly list of particular technologies. A summary of five years of top ten strategic technogiven in Table 3.
In Table 3, I have italicized those technologies that show up more than once. In somthe names are exact, while in others they are just very similar �business process managemeversus business process modeling, and grid computing versus grid�.
There were roughly 36 different technologies over the five-year period, or about setechnologies per year. Web services/software as a service lasted the longest, with versiondifferent years. Many of the technologies, such as “instant messaging,” “virtualization,” acomputing,” apparently do not have substantial uniquely accounting application or cHowever, this list would appear to provide a starting point for a range of AIS research toexample, as discussed later in the paper, business process management appears to primportant technology for AIS researchers.
Research strategies could include choosing technologies that had appeared on “r” �fogreater than or equal to 1� different lists of strategic technologies. Alternatively, researchelimit their selection to the most recent set of technologies, or focus on those that had theaccounting and auditing applications.
In AIS, in addition to the technology, researchers need to consider the area of ap�Table 5�. In particular, that typically means that researchers choose a technology that hain one of the functional areas of accounting, e.g., financial accounting or management ac�e.g., business process management�, but also occurs early in the life of the technology. GAIS researchers would chose a technology for which there is a match to an accounting praccounting subdiscipline. Some technologies, such as RFID, at this time do not haestablished or direct accounting ties. As a result, the matching of technology to accounbecomes a critical research activity early in the life cycle.
Business Process ManagementBusiness process management �BPM� has been given many definitions, including the
ing definition by Microsoft:
BPM is the use of an integrated set of key performance indicators that are used to monitoorganizational process in real time. Business process management �BPM� is a management dpline that combines a process-centric and cross-functional approach to improving how orgations achieve their business goals. A BPM solution provides the tools that help make thesecesses explicit, as well as the functionality to help business managers control and changemanual and automated workflows.
In 2007 business process management was included among the top ten strategic tech�Gartner 2007�. Further, based on Table 3, we can see that BPM shows up as a strategicogy in both of the last two years.
Business process management is a virtual merger of management accounting and acinformation systems. BPM is about managing a process, but it is also about choosing theperformance indicators—ones that are aligned with strategy and facilitate managemen
The Impact of Gartner’s Maturity Curve
process. Interestingly, apparently there has been little research by AIS academics in the area ofBPM. O’Leary �2009� provides a BPM design science structure for a particular accounting pro-cess. Based on the discussion earlier in the paper, we are likely to find some different kinds of
Journal of Emerging Technologies in Accounting Volume 6, 2009American Accounting Association

r “thingsppear asies haveresearch. As theeasures
the early
le timeson et al.as muchrt of Ton
limitedme largebeen ex-ology ison et al.xample,
supplierse allowshile the
hat went
y �2006�used to
fic iden-t RFID,
O’Learyso-calledta about
ools thatxaminedg infor-
on curveteractiont various.g., case
1BY: REV: netscape@pub4/third/CLS_journals3/GRP_eta/JOB_v6-i1/DIV_002901eta
O’Leary
research as we move through either the maturity cycle. For example, “things gone right” ogone wrong,” based on information flows about positive or negative events, are likely to aa technology goes into adolescence or even early mainstream. Recently, some case studbegun to be developed illustrating some of the BPM issues �O’Leary 2009�. Behavioralmight examine design issues at first and then move to analysis of implemented systemstechnology matures, we might see research about how stock market price or accounting mare influenced by disclosures about BPM, as the sample becomes less biased away fromadopters.
RFID (Radio Frequency Identification)RFID is a technology that can be used to uniquely identify objects. We find it multip
in the top ten strategic technologies over the time period 2004–2008. In 2004, Metro �T2005� and other large retailers began implementing the first generation of RFID. There wtalk about how the technology needed to come down in price, and expenses are a key paet al. �2005�. At that time, few firms had really adopted the technology, and there wasexperience with the technology by firms. Although there was a substantial push by soretailers, such as Wal-Mart, apparently RFID had not received the attention that hadpected. Thus, RFID fits nicely into the “emerging” technology category. Because the technemerging, we would expect case studies like Ton et al. �2005� as a first step. In addition, T�2005� begins to provide an analysis of “what went right” and “what went wrong.” For ein 2004, Metro’s plan was to have over 250 retail stores, 10 distribution centers, and 100using RFID, but at the time of the case there were 13, nine, and 33, respectively. The casanalysis of why the number of retail stores and suppliers was substantially lower, wdistribution center target was almost reached. Thus, the case study allows analysis of wright and what went wrong and where the technology fits.
There has been little research on RFID and accounting information systems. O’Leardiscussed a number of potential accounting uses of RFID. For example, RFID could beimplement specific identification of inventory as a financial reporting strategy. Such specitification also could be useful in an auditing context as part of inventory analysis. Withouspecific identification of individual items would be too costly or not feasible. Geerts and�2008� generated a design theory investigation of a database modeling of RFID based on“highly visible supply chains.” Until RFID has a larger base of adopters, the amount of daRFID and the extent to which that data is biased will provide limited analysis.
SUMMARY, EXTENSIONS, AND CONTRIBUTIONSThis paper has focused on the maturity curve, the adoption curve, and some of the t
Gartner has developed to analyze the maturity and adoption of a technology. The paper ehow those tools might be used to understand and anticipate research issues in accountinmation systems. It was found that different portions of the maturity curve and the adoptihave different characteristics and different research opportunities. Accordingly, the inbetween the two curves provides us with insights as to how the sample may be biased apoints in time. Further, the curves provide insight as to when particular types of research, estudies or design science applications, are likely to occur.
Extensions
18
There are a number of extensions to this research. First, although the growth curve has beenthe subject of substantial research, e.g., Rogers �1983� and others, the maturity curve has notreceived the same level of academic investigation. As a result, future research could investigate
Journal of Emerging Technologies in Accounting Volume 6, 2009American Accounting Association
maturitycould beumerousued thatn impor-of thosees in thearadox”
e expen-ages. Asadoption
heir use.ikely goperspec-ologies,
1BY: REV: netscape@pub4/third/CLS_journals3/GRP_eta/JOB_v6-i1/DIV_002901eta
19
characteristics of that curve in more detail. Second, Figure 4 provides an extension to thecurve based on adding a large portion of capabilities. However, other versions likelydeveloped for other sets of changes in capabilities. Third, although this paper provides nexamples, additional examples could be elicited and examined. Fourth, this paper argempirical research might be using biased samples in a number of settings. Accordingly, atant extension would be to review previous studies and try to determine where somebiases have slipped in and how the results were affected. Fifth, the issue of biased samplanalysis of technology may also be applied to the notion of the so-called “productivity p�Grover et al. 1998� �e.g., Pennings and Harianto 1992�. For example, technology is morsive and more brittle at the emerging stage, but less expensive and more flexible at latter sta result, greater productivity gains, at lower costs, are likely later in the maturity andcurves.
Further, this same approach can be used outside of technology and refer to ideas and tFor example, accounting concepts such as activity-based costing or Sarbanes-Oxley lthrough the same maturity and adoption curves, and thus could be studied from the sametives, as technology. In the same sense that there are potential sample biases with techn
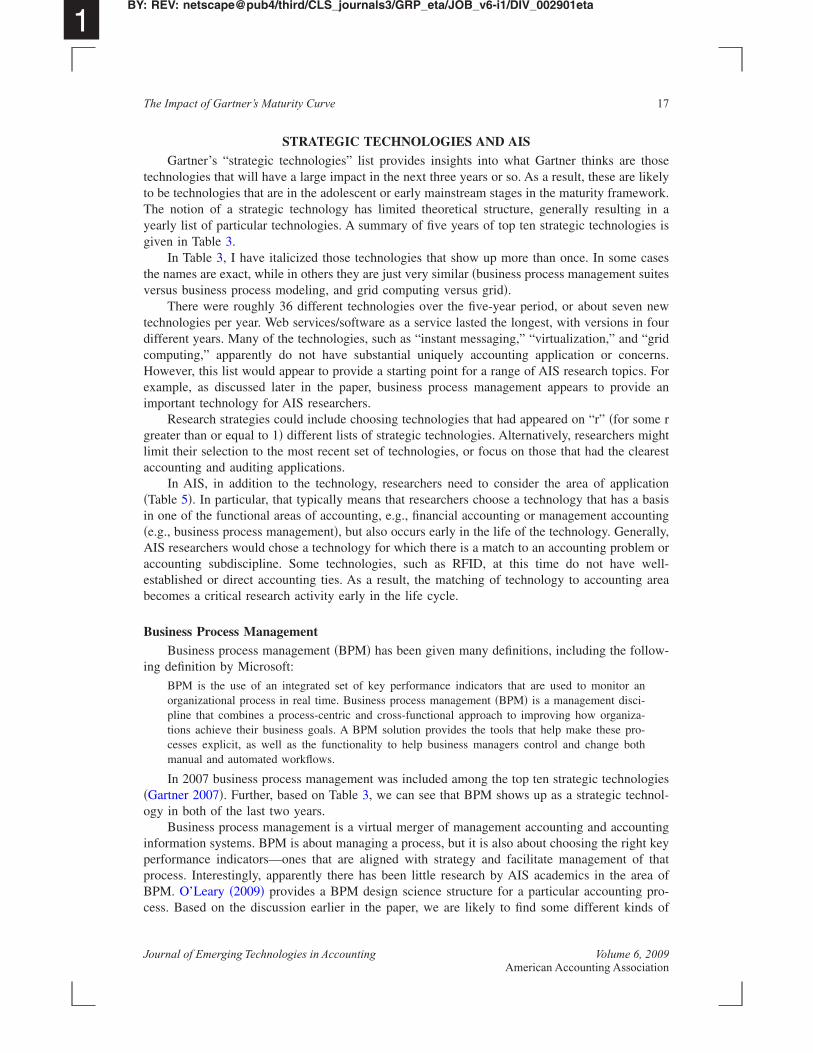
FIGURE 5Public versus Private Sector Adoption Curves for ERP
The Impact of Gartner’s Maturity Curve
there would be potential sample biases in those studies.Table 6 also provides an additional potential extension. The data gathered there suggests that
public and private sectors go through different adoption cycles at different times. As seen in the
Journal of Emerging Technologies in Accounting Volume 6, 2009American Accounting Association
ad beenbetween
tner intoresearchresearch
is paperhnology
done isa result,, design
ages thatne using
earch. Inbe found
owledge-
ccounting
2001: A
the ACM
irections.
e ERP II.df..Business
Business
Case No.
at: http://
1BY: REV: netscape@pub4/third/CLS_journals3/GRP_eta/JOB_v6-i1/DIV_002901eta
O’Leary
table, cases about the public sector were addressing some of the same issues that haddressed a decade earlier in the private sector. One example of a potential relationshipERP adoption curves is illustrated in Figure 5.
ContributionsApparently, there has been limited integration of research from firms such as Gar
academic research. This research used the maturity cycle and level to investigate whichmethods can be used at different points in the life cycle of a technology. Accordingly, thishas brought important frameworks that relate to technology diffusion into AIS.
While most previous research focused on the adoption curve �e.g., Rogers 1983�, thexamined the maturity curve. In particular, this paper merged the two concepts of tecmaturity and enterprise adoption �e.g., Table 5�.
Another contribution of this paper is the notion that the type of research that can betied to where the technology is on the maturity curve and adoption curve, and that, asresearchers have different strategies when doing research in technologies. For exampleresearch is most likely at the embryonic or emerging stages. Further, it is at those same stopinion research is most helpful. However, empirical research at those stages will be dobiased samples.
In addition, this paper provides a contribution to potential and existing empirical resparticular, the adoption and maturity curves help understand the potential biases that canin samples of firms when empirical research is undertaken.
REFERENCES
Arnold, V., N. Clark, P. Collier, S. Leech, and S. Sutton. 2006. The differential use and effect of knbased system explanations in novice and expert judgment decisions. MIS Quarterly 30: 79.
Baker, C. 2002. Towards increased use of action research in accounting information systems. AForum 24 �4�: 366–378.
Baldwin-Morgan, A. 1993. The impact of expert system audit tools on auditing firms in the yearDelphi investigation. Journal of Information Systems 7 �1�: 16–34.
Barker, V., and D. O’Connor. 1989. Expert systems for configuration at Digital. Communications of32 �3�: 298–318.
Bisbal, J., D. Lawless, B. Wu, and J. Grimson. 1999. Legacy information systems: Issues and dIEEE Software �October�: 2–10.
Bond, B., Y. Genovese, N. Miklovic, B. Zrimsek, and N. Rayner. 2000. ERP is dead, long livGartner Group research note. October 4. Available at: http://www.pentaprise.de/cms_showp
Bower, J. L., and C. M. Christensen. 1995. Disruptive technologies: Catching the wave. HarvardReview �January–February�: 43–53.
Cottelear, M., R. Austin, and R. Nolan. 1998. Cisco Systems, Inc.: Implementing ERP. HarvardSchool Case No. 9-699-022. Boston, MA: Harvard Business Publishing.
Davenport, T. 1995. Order Management Reengineering at Heatway. Harvard Business School9-996-005. Boston, MA: Harvard Business Publishing.
Deloitte. 1998. ERP’s Second Wave. New York, NY: Deloitte Consulting.Fenn, J., and A. Linden. 2005. Gartner’s hype cycle special report for 2005. August 5. Available
www.gartner.com/DisplayDocument?doc_cd�130115.
20
——–. 2007. Understanding Gartner’s hype cycles, 2007. July 5. Available at: http://www.gartner.com/DisplayDocument?id�509085.
Gartner. 2007. Gartner defines the top ten strategic technologies for 2008. Press release. October 9. Availableat: http://www.gartner.com/it/page.jsp?id�530109.
Journal of Emerging Technologies in Accounting Volume 6, 2009American Accounting Association

n Scienceing. Ana-
ss School
usion andmation &
enefits of
r mineral
research.
eport No.
.com/erp/
nnovation
e criticalolicy 23:
Decision
Business
formation
ms Man-
uirementsystems in
ner.ss.systems?
Emerging
ccounting
Account-
se study.
l banking
1BY: REV: netscape@pub4/third/CLS_journals3/GRP_eta/JOB_v6-i1/DIV_002901eta
21
Geerts, G., and D. O’Leary. 2008. RFID and Inventory in the Supply Chain: An REA and DesigApproach for Visibility. Proceedings of the American Accounting Association Annual Meetheim, CA.
Gladstone, J., and R. Eccles. 1995. KPMG Peat Marwick: The Shadow Partner. Harvard BusineCase No. 9-492-002, Boston, MA: Harvard Business Publishing.
Grover, V., J. Teng, A. Segars, and K. Fielder. 1998. The influence of information technology diffbusiness process change on perceived productivity: The IS executive’s perspective. InforManagement 34 �3�: 141–59.
Harrison, T., and K. Waite. December 2006. A time-based assessment of the influences, uses, and bintermediary website adoption. Information & Management 43 �8�: 1002–1013.
Hart, P., R. Duda, and M. Einaudi. 1978. Model design in the prospector consultant system foexploration. Mathematical Geology 10 �5�.
Hevner, A., S. March, J. Park, and S. Ram. March 2004. Design science in information systemsManagement Information Systems Quarterly 28 �1�: 75–106.
Linden, A., and J. Fenn. 2003. Understanding Gartner’s Hype Cycles. Gartner Strategic Analysis RR-1971. May 30. Stamford, CT: Gartner Inc.
Maguire, J. 2006. The future of ERP. November 15. Available at: http://itmanagement.earthwebarticle.php/3643966.
Mahajan, V., E. Muller, and R. K. Srivastava. 1990. Determination of adopter categories by using idiffusion models. Journal of Marketing Research 27 �1�: 37–55.
Mahler, A., and E. Rogers. 1999. The diffusion of interactive communication innovations and thmass: The adoption of telecommunication services by German banks. Telecommunications P719–740.
March, S., and G. Smith. 1995. Design and natural science research in information technology.Support Systems 15: 251–266.
McAfee, A., F. W. McFarlan, and A. Wagonfeld. 2004. Enterprise IT at Cisco (2004). HarvardSchool Case No. 9-605-015. Boston, MA: Harvard Business Publishing.
Murthy, U., and C. Wiggins. 1999. A perspective on information systems research. Journal of InSystems 13 �1�: 3–6.
O’Leary, D. E., and E. Turban. 1987. The organizational impact of expert systems. Human Systeagement 7 �1�: 11–19.
——–. 1990. Security in expert systems. IEEE Expert 5 �3�: 59–70.——–, and P. R. Watkins. 1992. Integration of intelligent systems and conventional systems: Req
for coordinating multiple agents for diagnostic systems. International Journal of Intelligent SAccounting Finance & Management 1 �2�: 135–150.
——–, and P. R. Watkins. 1995. Expert Systems in Internal Auditing. New York, NY: Markus Wie——–. 2000. Enterprise Resource Planning Systems. Cambridge, U.K.: Cambridge University Pre——–. 2002. When and how do we use heterogeneous expert opinion as a basis for research on ERP
Journal of Information Systems 16: 115–126.——–. 2004. Enterprise resource planning systems: An empirical analysis of benefits. Journal of
Technologies in Accounting 1: 63–72.——–. 2006. Radio Frequency Identification (RFID) and AIS. Proceedings of the American A
Association Annual Meeting, Washington, D.C., August.——–. 2008. Gartner’s hype cycle and information system research issues. International Journal of
ing Information Systems 9: 240–252.——–. 2009. Generating and using knowledge for business process management: SYSCO as a ca
Advances in Business Process Management �forthcoming�.Pennings, J. M., and F. Harianto. 1992. The diffusion of technological innovation in the commercia
The Impact of Gartner’s Maturity Curve
industry. Strategic Management Journal 13: 29–46.Poston, R., and S. Grabski. 2001. Financial impacts of enterprise resource planning implementations. Inter-
national Journal of Accounting Information Systems 2: 271–294.Rogers, E. 1983. Diffusion of Innovations. New York, NY: The Free Press.
Journal of Emerging Technologies in Accounting Volume 6, 2009American Accounting Association

Informa-
. Boston,
ss School
1BY: REV: netscape@pub4/third/CLS_journals3/GRP_eta/JOB_v6-i1/DIV_002901eta
O’Leary
Sutton, S. 2005. The role of AIS research in guiding practice. International Journal of Accountingtion Systems �March�: 1–4.
Sviokla, J., and M. Keil. 1998. DuPont’s Artificial Intelligence Implementation Strategy #189036MA: Harvard Business School Press.
Ton, Z., V. Dessain, and M. Stachowiak-Joulain. 2005. RFID at the Metro Group. Harvard BusineCase No. 9-606-053. Boston, MA: Harvard Business Publishing.
22
Journal of Emerging Technologies in Accounting Volume 6, 2009American Accounting Association