
The impact of fairtrade and other sustainability practices ...
76
Master thesis in Economics · 30 hec · A2E Agricultural programme – Economics and Management Degree thesis/SLU, Department of Economics, No 1338 · ISSN 1401- 4084 Uppsala 2021 The impact of fairtrade and other sustainability practices on cocoa farmers’ income of in Guayas and Manabi provinces, Ecuador Stefania Celi Garofalo
Transcript of The impact of fairtrade and other sustainability practices ...

Master thesis in Economics · 30 hec · A2E Agricultural programme – Economics and Management Degree thesis/SLU, Department of Economics, No 1338 · ISSN 1401-4084 Uppsala 2021
iiii
The impact of fairtrade and other sustainability practices on cocoa farmers’ income of in Guayas and Manabi provinces, Ecuador
Stefania Celi Garofalo
iii
Swedish University of Agricultural Sciences
Faculty of Natural Resources and Agricultural Sciences Department of Economics
The impact of fairtrade and other sustainability practices on cocoa farmers’ income of in Guayas and Manabi provinces, Ecuador Stefania Celi Garofalo Supervisor: Prof. Dr. Yves Surry, Swedish University of Agricultural Sciences, Department of Economics Assistant supervisor: Prof. Dr. Silke Hüttel, University of Bonn, Department of Production Economics Examiner: Jens Rommel, Swedish University of Agricultural Sciences, Department of Economics Credits: 30 hec Level: A2E Course title: Master thesis in Economics Course code: EX0905
Programme/Education: Agricultural Economics and Management, Master’s Programme
Responsible dep.: Department of Economics Faculty: Faculty of Natural Resources and Agricultural Sciences Place of publication: Uppsala Year of publication: 2021 Cover picture: Stefania Celi Garofalo, SLU Name of Series: Degree project/SLU, Department of Economics Part number: 1338 ISSN: 1401-4084 Online publication: http://stud.epsilon.slu.se Keywords: Certifications, cocoa, Fairtrade, livelihood, Sustainability
Sourcing Practices (SSP), sustainable value chain, Voluntary Sustainability Standards (VSS)

iii
Acknowledgements
I would like to express my sincere gratitude to my first supervisor Prof. Dr. Yves Surry. His
research and meaningful advice have helped me write this thesis and, hence, finish my MSc in
Business and Economics at the Swedish University of Agricultural sciences. I also want to
thank my second supervisor at the University of Bonn, Prof. Dr. Silke Huttel, for all her
dedication and great advice that proved vital towards my thesis's culmination and the successful
completion of the European joint master's degree AFEPA. I want to thank Ing. Rosa Perez,
Manager of the Association of Cocoa producer CECAO group belonging to the Fair for Life
Certification; for sharing her knowledge about the cocoa industry, and for letting me perform
interviews with their farmers' group and as well as for taking me to visit some households at
their farms. To Mr. Freddy Cabello, Manager of UNOCACE, an association of cocoa farmers
belonging to Fairtrade, for letting me visit the many cooperatives associated with Fairtrade and
introducing me to their teams. To Olam Ecuador S.A. for funding my trip to San Isidro. I wish
to express my thanks to Saurabh Mitra, General Manager at Olam Ecuador, for his diligence,
time, and approval to collect data for my master thesis from their farmers' group. I also wish to
show my gratitude to Mr. George Hawken, Cocoa Sourcing Manager at Olam, for taking me to
the field to collect data, visit some farmers at their house, for showing me the intervention of
Olam in the farms, and for organizing a training session with their farmers and gather several
farmers randomly at the same time. I want to especially thank all the 132 farmers whose
participation in the interviews was a milestone in completing this project, sharing their time,
small talk, and a smile given their circumstances. Thanks to my amazing friends that I have met
during my master's and my Ecuadorean friends, listing their names would require another extra
page, who encouraged me to keep going and gave me support when needed, especially in
moments of crisis. I want to acknowledge the support, and the great love of my family, to my
cousins that came with me at 5.00 am to travel to the countryside, so I didn't have to go alone.
And finally, to my parents Alonso and Clarita, for all the work they have to do for giving my
siblings and me the best education and support and giving me the strength to reach for the stars
and chase my dreams. I could not have done it without them. Thanks, Dad, for always tell me
that the world is for women. Thanks, Mom, for always been there and empower me to become
the best version of myself.

iv
Abstract
Voluntary sustainability standards on the one side, and, sustainable sourcing practices on the
other side, are two favored ways of the cocoa industry for a more effective, social and
environmental friendly value chains. But how well do these two kinds of sustainability schemes
improve the cocoa farmers’ income? This thesis investigates the major factors affecting the
income among cocoa farmers certified under Fairtrade and Fair for life, and non-certified cocoa
farmers participating in Olam’s own sustainability program in the provinces of Guayas and
Manabi, in the coastal region of Ecuador. The analysis uses survey data gathered through field
interviews with a sample of each participating group during the end of the main crop period
March-April 2019. The first part of the anlysis consist of multinomial probit regressions to
understand what motivates a farmer to choose a program or not. The results identify that a male
household is more likely to choose fair trade programs while for Olam younger farmers
increases the probability to join their program. Larger farms are more likely to join Olam, while
for Fairtrade this decreases the probability to join the program. Farmers with only cocoa
monocultures are less likely to choose Olam. The regression model shows that income increases
with accumulated program experience, larger cocoa farms, livelihood diversification,
participation in training, yield, and farming experience. Minimum floor prices increase the
income to FT and FL, meanwhile monetary premiums increase income for farmers belonging
to Olam. Different results among the groups suggest that there is a need for better
harmonization of sustainability practices, if sustainable practices will be implemented, between
schemes to benefit farmers incomes.

v
Abbreviations
ANECACAO: The National Association of Ecuador’s Cocoa Exporters and Industrials (by its
Spanish initials)
BCE: Central Bank of Ecuador (by its Spanish initials)
CECAO: Cocoa Exporting Company (by its Spanish initials)
CSO: Civil Societies
CSR: Corporate Social Responsibility
ESPAC: Surface and Continuous Agricultural Production Survey (by its Spanish initials)
FLA: Fair Labor Association
FMP: Fairtrade Minimum Price
ICCO: International Cocoa Organization
IMO: Institute for Marketecology
INEC: National Institute of Statistics and Census (by its Spanish initials)
MAGAP: Ministry of Agriculture and Livestock (by its Spanish initials)
MNP: Multinomial Probit
NEK: Swedish abbreviation for economics
NGOs: Non-Governmental
OLC: Olam Livelihood Charter
OSS: Olam Sustainability Standard
SDG: United Nation's Sustainable Development Goals
SDGs: United Nation's Sustainable Development Goals
SLU: The Swedish University of Agricultural Sciences
SRL: Sustainable Rural Livelihood
SSP: Sustainable Sourcing Practices
UN: United Nations
UNOCACE: Union of Peasant Cocoa Organizations of Ecuador (by its Spanish initials)
UPAs: Agricultural Production Unit (by its Spanish initials)
VSS: Voluntary Sustainable Standards

vi
Contents
1 INTRODUCTION ................................................................................................................. 1
1.1 PROBLEM BACKGROUND AND STATEMENT ......................................................................... 1 1.2 AIM AND DELIMITATIONS ................................................................................................... 2 1.3 STRUCTURE OF THE REPORT ............................................................................................... 2
2 CONCEPTUAL FRAMEWORK ........................................................................................ 3
2.1 RURAL SUSTAINABLE LIVELIHOOD FRAMEWORK .............................................................. 3 2.2 VOLUNTARY SUSTAINABILITY STANDARDS (VSS) AND SUSTAINABLE SOURCING
PRACTICES (SSP) ..................................................................................................................... 3
3 REVIEW OF THE LITERATURE AND EMPIRICAL CONTEXT .............................. 6
3.1 DETERMINANTS ON BETTER INCOME .................................................................................. 7 3.2 OVERVIEW OF THE COCOA SECTOR IN ECUADOR ................................................................ 8
3.2.1 Fair-trade organizations ............................................................................................ 9 3.2.3 Comparison of sustainability programs ................................................................... 11
4 DATA COLLECTION PROCESS AND DATA .............................................................. 12
4.1 DATA COLLECTION ........................................................................................................... 12 4.1.1 Survey Area............................................................................................................... 12 4.1.2 Questionnaire ........................................................................................................... 13 4.1.3 Data Collection Process ........................................................................................... 13 4.1.4 Ethical Aspects and consent ..................................................................................... 14
4.2 DATA PREPARATION AND SAMPLE DESCRIPTIVE STATISTICS ............................................ 14 4.2.1 Household characteristics and farm characteristic ................................................. 14 4.2.2 Farm profits and cocoa revenue ............................................................................... 15
5 ECONOMETRIC MODEL AND SPECIFICATION ..................................................... 19
5.1 MODELING FARMERS’ CHOICE .......................................................................................... 19 5.1.1 Factors influencing the sustainability program decision ......................................... 20
5.2 MODELING THE EFFECTS ON INCOME................................................................................ 21 5.2.1 Determinants affecting the farmer’s income ............................................................ 22
5.3 THREATS TO INTERNAL VALIDITY .................................................................................... 23
6 RESULTS AND DISCUSSION.......................................................................................... 25
6.1 RESULTS OF THE MULTINOMIAL PROBIT MODEL ............................................................... 25 6.2 SUSTAINABILITY SCHEMES AND THEIR EFFECT ON A HIGHER INCOME .............................. 28
6.2.1 The effect of adding sustainability practices rewarded by the market to income .... 31
7 CONCLUSIONS.................................................................................................................. 34
BIBLIOGRAPHY .................................................................................................................. 36
Literature and publications ............................................................................................... 36 Internet............................................................................................................................... 38
APPENDIX 1: SUSTAINABILITY LIVELIHOOD FRAMEWORK .............................. 41
APPENDIX 2. LIST OF TOWNS AND VILLAGES WHERE INTERVIEWS WERE
CONDUCTED ........................................................................................................................ 42
vii
APPENDIX 3: QUESTIONNAIRE (ENGLISH VERSION) ............................................. 43
APPENDIX 4: QUESTIONNAIRE (SPANISH) ................................................................. 50
APPENDIX 5: MONTHLY PRICES OF COCOA COLLECTION CENTERS IN
GUAYAS ................................................................................................................................. 56
APPENDIX 6: MONTHLY PRICES OF COCOA COLLECTION CENTERS IN
MANABI ................................................................................................................................. 59
APPENDIX 7: PREDICTED PROBABILITIES AFTER MULTINOMIAL PROBIT
ESTIMATION ........................................................................................................................ 61
APPENDIX 8: PICTURES OF FIELD RESEARCH ......................................................... 63

viii
List of figures
Figure 1. Thesis Structure. ......................................................................................................... 2 Figure 2. Average prices per year for the purchase of dried cocoa beans in rural markets. .... 9 Figure 3. Locations where the survey was carried out. ........................................................... 12 Figure 4. Perceived benefits of Sustainability Programs ........................................................ 17 Figure 5. Perceived constraints of Sustainability Programs. .................................................. 18 Figure 6: Sustainability Livelihood Framework. ..................................................................... 41
List of tables
Table 1. Overview of determinants on better income. ................................................................ 7 Table 2. Comparison of Cocoa Sustainability Schemes ........................................................... 11 Table 3. Survey questionnaire structure. ................................................................................. 13 Table 4. Farm Household and Farm Characteristics (Categorical Variables) ....................... 15 Table 5. Income by a source per month (average). .................................................................. 16 Table 6. Income and Cocoa Farm Characteristics (discrete and continuous variables) ........ 16 Table 7. Overview of potential factors influencing the decision-making process of
participating in a program.................................................................................................. 20 Table 8. Overview of potential determinants affecting income ................................................ 22 Table 9. Overview of potential determinants rewarded by the market affecting income......... 23 Table 10. MNP estimations for determinants influencing the sustainability program decision.
........................................................................................................................................... 25 Table 11. Average Marginal effects after Multinomial Probit Model estimations for
determinants influencing the sustainability program decision.......................................... 26 Table 12. Results of regression on determinants affecting the farmer’s income ..................... 28 Table 13. Estimated effects of suggested determinants on income model 1. ........................... 29 Table 14. Estimated effects of suggested determinants on better income when adding
sustainability rewards........................................................................................................ 32
1
1 Introduction
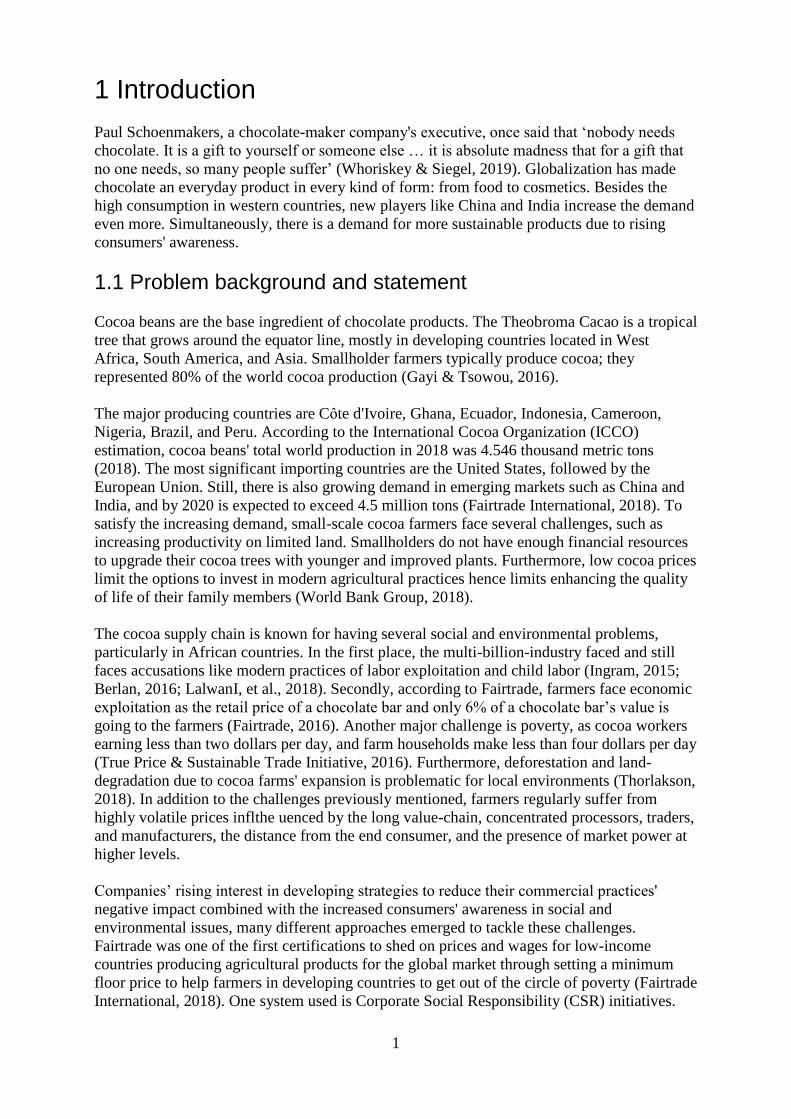
Paul Schoenmakers, a chocolate-maker company's executive, once said that ‘nobody needs
chocolate. It is a gift to yourself or someone else … it is absolute madness that for a gift that
no one needs, so many people suffer’ (Whoriskey & Siegel, 2019). Globalization has made
chocolate an everyday product in every kind of form: from food to cosmetics. Besides the
high consumption in western countries, new players like China and India increase the demand
even more. Simultaneously, there is a demand for more sustainable products due to rising
consumers' awareness.
1.1 Problem background and statement
Cocoa beans are the base ingredient of chocolate products. The Theobroma Cacao is a tropical
tree that grows around the equator line, mostly in developing countries located in West
Africa, South America, and Asia. Smallholder farmers typically produce cocoa; they
represented 80% of the world cocoa production (Gayi & Tsowou, 2016).
The major producing countries are Cote d'Ivoire, Ghana, Ecuador, Indonesia, Cameroon,
Nigeria, Brazil, and Peru. According to the International Cocoa Organization (ICCO)
estimation, cocoa beans' total world production in 2018 was 4.546 thousand metric tons
(2018). The most significant importing countries are the United States, followed by the
European Union. Still, there is also growing demand in emerging markets such as China and
India, and by 2020 is expected to exceed 4.5 million tons (Fairtrade International, 2018). To
satisfy the increasing demand, small-scale cocoa farmers face several challenges, such as
increasing productivity on limited land. Smallholders do not have enough financial resources
to upgrade their cocoa trees with younger and improved plants. Furthermore, low cocoa prices
limit the options to invest in modern agricultural practices hence limits enhancing the quality
of life of their family members (World Bank Group, 2018).
The cocoa supply chain is known for having several social and environmental problems,
particularly in African countries. In the first place, the multi-billion-industry faced and still
faces accusations like modern practices of labor exploitation and child labor (Ingram, 2015;
Berlan, 2016; LalwanI, et al., 2018). Secondly, according to Fairtrade, farmers face economic
exploitation as the retail price of a chocolate bar and only 6% of a chocolate bar’s value is
going to the farmers (Fairtrade, 2016). Another major challenge is poverty, as cocoa workers
earning less than two dollars per day, and farm households make less than four dollars per day
(True Price & Sustainable Trade Initiative, 2016). Furthermore, deforestation and land-
degradation due to cocoa farms' expansion is problematic for local environments (Thorlakson,
2018). In addition to the challenges previously mentioned, farmers regularly suffer from
highly volatile prices inflthe uenced by the long value-chain, concentrated processors, traders,
and manufacturers, the distance from the end consumer, and the presence of market power at
higher levels.
Companies’ rising interest in developing strategies to reduce their commercial practices'
negative impact combined with the increased consumers' awareness in social and
environmental issues, many different approaches emerged to tackle these challenges.
Fairtrade was one of the first certifications to shed on prices and wages for low-income
countries producing agricultural products for the global market through setting a minimum
floor price to help farmers in developing countries to get out of the circle of poverty (Fairtrade
International, 2018). One system used is Corporate Social Responsibility (CSR) initiatives.

2
Another method used is third-party non-governmental organizations, such as Fairtrade,
Rainforest, or UTZ, to provide verification and certification. Alternatively, there are modern
own-value-chains with sustainable sourcing practices (SSPs) that promises traceability and
transparency (Thorlakson, 2018). Even though there is a rapid growth of fair trade products
and an increase of people purchasing fair-trade products, there is a lack of scientific evidence
that confirms fair-trade certification effects on farmers’ level (Dragusanu, et al., 2014;
Barrientos, 2016; Glasbergen, 2018). Likewise Fairtrade, companies' sustainability programs
in the cocoa industry started to materialize two decades ago (Thorlakson, 2018). Nowadays,
international third-party certifications, also known as Voluntary Sustainability Standards
(VSS), play an essential role in the industry, and so corporate social responsibility initiatives
such as Sustainable Sourcing Practices (SSP). This aspect has not yet given much attention to
the farmers' livelihood outcomes of certifications compared to alternatives initiatives like
sustainable sourcing practices.
1.2 Aim and delimitations
This project aims to understand how different cocoa sustainability program can improve
cocoa smallholders' income. The following research questions will guide this work:
1. To what extent are sustainable schemes driven by commercial concerns over the future
social and economic sustainability of cocoa sourcing in the dynamic cocoa–chocolate
value chain?
2. What is the effect of sustainable schemes on small-scale cocoa producers' income in
Ecuador?
This work will only focus on two types of sustainable programs: Voluntary Sustainable
Standards (VSS) such as Fairtrade and Fair for life and the second as Sustainable Sourcing
Practices (SSP) implemented by private companies, such as Olam Ecuador S.A. in the cocoa
industry in Ecuador. This work's geographical scope is limited to Guayas and Manabí, two of
the major cocoa producing provinces in Ecuador.
1.3 Structure of the report
The structure of the thesis is as follows: section 2 will introduce the conceptual framework
motivating this study, section 3 is a literature review that includes an overview of the
Ecuadorean cocoa sector, as well as a review of current research regarding third-party
certification schemes. The fourth section describes the data collection process and the
preliminary survey results. Section 5 describes the method and model specification. After
that, the results are presented, analyzed, and discussed (section 6). The last part (7) concludes
the study and draws an outlook on further research and possible developments. Figure 1
graphs the sequence of the sections.
Figure 1. Thesis Structure.
1. Introduction
2. Conceptual Framework
3. Literature Review
4. Data5.
Econometric model
6. Results and Analysis
7. Conclusion

3
2 Conceptual Framework
This section defines the concepts and describes the sustainable livelihood framework and its
application to certification systems. This section aims to provide a conceptual background for
our study and introduce the different certification systems types.
2.1 Rural Sustainable Livelihood Framework
The conceptual framework applied to assess the effect of Fairtrade certification and other
sustainability programs on the livelihood of cocoa farmers is the concept of sustainable
livelihood as presented by Chambers and Conway (1992):
‘livelihood comprises the capabilities, assets (stores, resources, claims, and access) and
activities required for a means of living: a livelihood is sustainable which can cope with and
recover from stress and shocks, maintain or enhance its capabilities and assets, and provide
sustainable livelihood opportunities for the next generation; which contributes net benefits to
other livelihoods at the local and global levels, and in the short and long term’ (p. 13),
and later as: sustainable rural livelihood by Scoones (1998). The framework's basics explain
how households, individuals use, enhance, or maintain their assets, tangible or intangible
resources. In the rural framework, organizations and institutions can influence farmers'
livelihood outcomes by developing a livelihood strategy, e.g., agricultural intensification or
income diversification (Scoones, 1998). (Davies and Hossain, 1997) defined institutions as:
‘the social cement which links stakeholders to access to capital of different kinds to the means
of exercising power and so define the gateways through which they pass on the route to
positive or negative [livelihood] adaptation’ (p. 24).
Understanding organizations and institutions allow them to identify limitations and
opportunities to achieve a sustainable livelihood framework (Morse and McNamara, 2013).
Organizations and institutions are public and private structures that enable a different set of
factors that affect livelihoods, such as policies and regulations, social norms and practices,
and agreements that incentivize smallholders' choice for better trade-offs (Serrat, 2017).
Figure 2 in Annex 1 presents the sustainable livelihood framework showing how interventions
can transform smallholders' livelihood. Organizations and institutions are entities capable of
transforming smallholders’ livelihood strategies and outcomes. Four types of interventions to
address challenges in the cocoa industry, such as civil societies (CSO) and non-governmental
(NGOs), voluntary sustainable standards (VSS) and individual cooperate initiatives
2.2 Voluntary Sustainability Standards (VSS) and Sustainable Sourcing Practices (SSP)
Voluntary Sustainability Standards (VSS) are a set of different mechanisms such as standards,
codes of conduct, and requirements for more sustainable development of global consumption
and production. Various stakeholders implement VSS in the value chain. Third-party
organizations such as certifying bodies enforce VSS. Lamolle et al. (2019) defined VSS as:
‘non-governmental, voluntary, usually third party-assessed (i.e., certification) norms and
standards relating to environmental, social, ethical and food safety issues, adopted by

4
companies to demonstrate the performance of their organizations or products in specific
areas’ (Lamolle et al., 2019, p. 265).
The number of VSS in the agricultural value chain has increased over the last 30 years, and
most vital agricultural commodities follow at least one VSS (Salmon, 2002). These
sustainability initiatives implemented by external actors embrace the Sustainable
Development Goals by the United Nations in poverty, decent work, economic development,
food security, education, gender equality, climate change and environmental restoration, and
responsible consumption and production.
Growing consumer awareness in matters of ethics, environment, quality, and safety also
encouraged the proliferation of VSS around the world. Developed countries set VSS (Mitiku
et al., 2017). Another motivation for institutions and organizations to develop and implement
VSS is that consumers are willing to pay a higher price for a social, environmental, and
ethical traded product. Market power also plays a role in the increasing number of VSS. Food
processors and retailers' concentration imposed more requirements on quality and
sustainability to their suppliers via codes and standards (Ingram et al., 2018b; Lamolle et al.,
2019). VSS can be adopted by any stakeholder in the supply chain, from product
manufacturers, traders, and processors, and retailers, to gain a competitive advantage in the
marketplace with their sustainable-trade product. By shortening the supply chain through
VSS, producers, and buyers can reduce costs and risks (Ruben, 2017; Ssebunya et al., 2019).
Cocoa VSS emerged over 20 years ago (Ingram et al., 2018b) with initiatives implemented by
the industry in public-private partnerships type. However, those initiatives were not
monitored or audited regularly, leading to the rise of independent certification bodies.
Certification bodies are multi-stakeholder groups and NGOs. A company can supply from
VSS entities but does not necessarily have to comply with the standard. VSS is the initiative
with more acceptance by the consumer and the industry because of their transparency
approach (Ingram et al., 2018b). Companies are implementing sustainable sourcing practices
SSP to secure sustainable supply (Thorlakson, 2018).
Sustainable sourcing practices (SSP) refer to individual corporate initiatives. A business
commits monitoring and compliance with ethical practices and standards playfully and
following national regulation and international norms. SSPs are directly related to corporate
social responsibility and self-compliance and go beyond their business objectives or the law
(Ingram et al., 2018b). SSPs are voluntary and, just as VSS, also tackle sustainability
challenges on global consumption and production. SSP is defined as ‘voluntary practices
companies pursue to improve the social and environmental management of their suppliers'
activities’ (Thorlakson et al., 2018, p. 1).
The proliferation of VSS is one motivation for companies to commit to sustainability (Ruben
and Zuniga, 2011) under sustainable sourcing practices (SSP). To obtain higher sustainable
outcomes, firms tend to create partnerships with relevant and well-known voluntary standards
for their industries (e.g., Fairtrade, UTZ) and their suppliers (Lalwani et al., 2018). Firms will
invest in the standard that best fits their objectives and interests and invest in improving their
sustainable strategy within their supply chain (Lamolle et al., 2019). Another motivation is the
growing market share for products marked as responsible, ethical and sustainable traded,
which influenced individual firms to implement SSP, in addition to their commitments to VSS
(Ruben and Zuniga, 2011).

5
One difference between the two type of programs is that SSP follows internal norms within
the company or industry and does not comply with an international standard. Conversely to
traditional CSR schemes, companies with SSP will report their sustainable practices by third-
party auditors or external verification (Thorlakson et al., 2018). Both VSS and SSP are
sustainability schemes that pursue socio-economic and environmental development in
different value chains.

6
3 Review of the literature and empirical context
Several studies have analyzed the impact of voluntary sustainability standards and sustainable
sourcing practices on smallholders' livelihoods in developing countries. What can be
concluded is that the majority of studies that evaluated the impact of certifications in
commodities focus on a single certification and a single commodity (DeFries et al., 2017).
Given the increasing number of sustainability-focused programs, certification schemes, the
vast number of certified products, and indicators assessed, the study expects that studies on
impact evaluation lead to different results. Many studies report mixed findings with some
negative results from their estimations and positive benefits from the qualitative evidence
(Vellema et al., 2015). Overall the impact of certifications on the household income of coffee
farmers compared to their corresponding counterpart is statistically not significant; however,
certifications have demonstrated positives benefits in terms of yield, market access, input use,
organization, safety, and health for cocoa and coffee farmers (Jena et al., 2017; Ruben and
Fort, 2012).
Some studies in FT-certified coffee find significant positive effects on the income and poverty
reduction for private and double certification schemes: FT-organic (Chiputwa et al., 2015;
Ruben and Zuniga, 2011). Ingram et al. (2018b) found modest results in UTZ cocoa
certification; higher yield resulting from intensive training services in agricultural practices
instead of price premiums or higher market prices ensure better income. Meanwhile,
Akinwale et al. (2019) found that farmers with more knowledge on certifications lead to
obtaining higher benefits from the certificate itself. They have a high level of compliance with
agricultural practices. Studies concerning farmers’ willingness to adopt a certification in the
cocoa sector, Aidoo and Fromm (2015) showed that membership in farmers’ cooperatives and
knowledge about aspects related to certification has a significant positive effect, while farm
size produces a negative effect.
Concerning methods applied to projects on the impact of certification, a wide range of
information is in the literature, from qualitative research to more complex quantitative
methods using econometric models. Selected qualitative studies used systematic review
methods to collect data from currently available studies that assessed the impact of
certification programs found on those studies (Bray and Neilson, 2017; Dammert and Mohan,
2015; Oya et al., 2018). Quantitative methods used to evaluate the impact of certifications and
results obtained are mixed and differ from each other depending on the context of the study
(Jena et al., 2017). In this context, Ruben and Zuniga (2011), Jena et al. (2017), and Mitiku et
al. (2017) combined different econometric models. To reduce the participants' selection bias
in the sample and to evaluate the effect of programs, researchers use propensity score
matching (PSM) techniques. In the first place, a logit regression (Aidoo and Fromm, 2015) or
probit to estimate the likelihood of a farmer joining a particular certification (Chiputwa et al.,
2015; Jena et al., 2017; Ruben and Fort, 2012; Ruben and Zuniga, 2011). Based on the scores
obtained, certified and non-certified farmers are matched to construct a balanced comparison
group.
The second part of the methodology consists of executing estimations that help identify the
real welfare effect of the VSS or SSP. Ruben and Zuniga (2011) and Mitiku et al. (2017) used
a difference-analysis approach by calculating the difference in outcome between certified
farmers and non-certified nearest neighbors from the comparison group. Chiputwa et al.
(2015) estimated the average treatment effect to evaluate the impacts of different
sustainability programs on the treated. Likewise, Jena et al. (2017) used an endogenous
7
switching regression (ESR) model to compare the impact of certifications among certified and
noncertified farmers. Beuchelt and Zeller (2011) used a different quantitative approach to
compare certified and non-certified coffee farmers' profitability, based on the net income
resulting from gross margins, production costs, profits, breakeven yield, and price analysis.
3.1 Determinants on better income
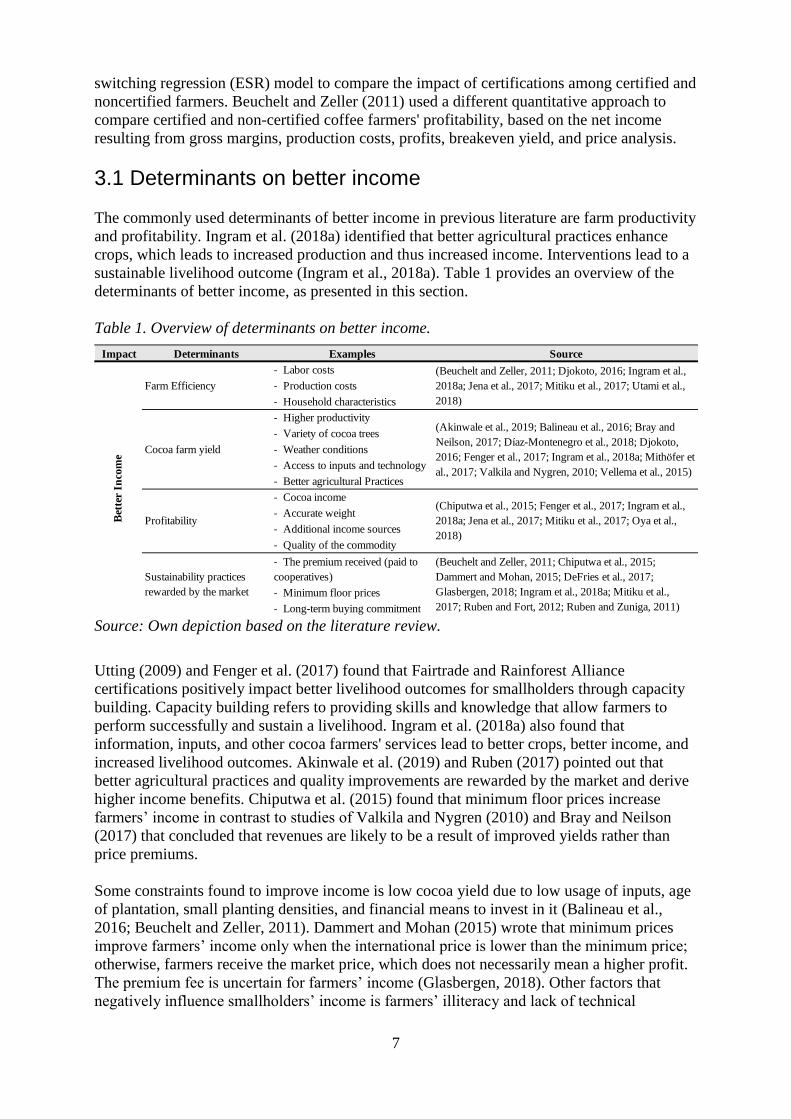
The commonly used determinants of better income in previous literature are farm productivity
and profitability. Ingram et al. (2018a) identified that better agricultural practices enhance
crops, which leads to increased production and thus increased income. Interventions lead to a
sustainable livelihood outcome (Ingram et al., 2018a). Table 1 provides an overview of the
determinants of better income, as presented in this section.
Table 1. Overview of determinants on better income.
Source: Own depiction based on the literature review.
Utting (2009) and Fenger et al. (2017) found that Fairtrade and Rainforest Alliance
certifications positively impact better livelihood outcomes for smallholders through capacity
building. Capacity building refers to providing skills and knowledge that allow farmers to
perform successfully and sustain a livelihood. Ingram et al. (2018a) also found that
information, inputs, and other cocoa farmers' services lead to better crops, better income, and
increased livelihood outcomes. Akinwale et al. (2019) and Ruben (2017) pointed out that
better agricultural practices and quality improvements are rewarded by the market and derive
higher income benefits. Chiputwa et al. (2015) found that minimum floor prices increase
farmers’ income in contrast to studies of Valkila and Nygren (2010) and Bray and Neilson
(2017) that concluded that revenues are likely to be a result of improved yields rather than
price premiums.
Some constraints found to improve income is low cocoa yield due to low usage of inputs, age
of plantation, small planting densities, and financial means to invest in it (Balineau et al.,
2016; Beuchelt and Zeller, 2011). Dammert and Mohan (2015) wrote that minimum prices
improve farmers’ income only when the international price is lower than the minimum price;
otherwise, farmers receive the market price, which does not necessarily mean a higher profit.
The premium fee is uncertain for farmers’ income (Glasbergen, 2018). Other factors that
negatively influence smallholders’ income is farmers’ illiteracy and lack of technical
Impact Determinants Examples Source
- Labor costs
- Production costs
- Household characteristics
- Higher productivity
- Variety of cocoa trees
- Weather conditions
- Access to inputs and technology
- Better agricultural Practices
- Cocoa income
- Accurate weight
- Additional income sources
- Quality of the commodity
- The premium received (paid to
cooperatives)
- Minimum floor prices
- Long-term buying commitment
Bet
ter
Inco
me
Farm Efficiency
(Beuchelt and Zeller, 2011; Djokoto, 2016; Ingram et al.,
2018a; Jena et al., 2017; Mitiku et al., 2017; Utami et al.,
2018)
Cocoa farm yield
(Akinwale et al., 2019; Balineau et al., 2016; Bray and
Neilson, 2017; Díaz-Montenegro et al., 2018; Djokoto,
2016; Fenger et al., 2017; Ingram et al., 2018a; Mithöfer et
al., 2017; Valkila and Nygren, 2010; Vellema et al., 2015)
Profitability
(Chiputwa et al., 2015; Fenger et al., 2017; Ingram et al.,
2018a; Jena et al., 2017; Mitiku et al., 2017; Oya et al.,
2018)
Sustainability practices
rewarded by the market
(Beuchelt and Zeller, 2011; Chiputwa et al., 2015;
Dammert and Mohan, 2015; DeFries et al., 2017;
Glasbergen, 2018; Ingram et al., 2018a; Mitiku et al.,
2017; Ruben and Fort, 2012; Ruben and Zuniga, 2011)

8
knowledge. According to Iritié and Djaléga (2016), this blocks farmers from diversifying their
income sources through other innovative and profitable farm activities. Worldwide, farmers
need to diversify their income to sustain their livelihood (Iritié and Djaléga, 2016; Vellema et
al., 2015). Environmental concerns such as climate change or soil erosion can impact cocoa
productivity, resulting in low yield and limited income (Mithöfer et al., 2017).
Farm households’ characteristics also have an impact on the income of the family. For
instance, the farming experience can increase the yield given the necessary resources;
meanwhile, family size can reduce labor costs because adult family members can join the
labor force (Djokoto, 2016). Farm size (Vellema et al., 2015) and studies in gender (Jena et
al., 2017) have found that larger farms and women participation can lead to higher income.
Training provided by VSS and SSP leads to better income as farmers gain more
entrepreneurial and specialized; meanwhile, better working and safety conditions,
environmental and chemical management contributes to better living standards (Ingram et al.,
2018a). Chiputwa et al. (2015) found that certified farmers have higher income, which leads
to rising household expenditure and, therefore, a reduction in the poverty rate and gains in
living standards.
3.2 Overview of the cocoa sector in Ecuador Ecuador is one of the five largest countries producing cocoa beans, accounting for
approximately 280 thousand metric tons of cocoa's global during 2017-2018 (ICCO, 2018).
According to The National Association of Cocoa Exporters (ANECACAO), the total exports
of cocoa and cocoa products in 2018, from January to December was approximately 295,000
metric tons for beans and 20,000 of sub-products (2018), which represents more than 4% of
national exports of traditional non-oil products after bananas and shrimp in volumetric terms
(BCE, 2018). Cocoa farms represent 20% of the Ecuadorian agricultural land; in 2017, the
total agricultural land planted with cocoa trees was 573.516 hectares; meanwhile, the land
harvested was 264.546 hectares (MAG, 2018). In Ecuador, around 28.717 units of
Agricultural Production (UPAs1) with less than 10 hectares produce cocoa as a monoculture,
from which 60% are smallholders and have less than 5 hectares (ESPAC-INEC, 2017).
In Ecuador, the cocoa sector has around 39 international standards like voluntary sustainable
standards, quality standards, norms, and registered sustainable sourcing practices
(Sustainability Trade Map, 2020). For instance, several companies in the industry: Olam
Ecuador S.A., Nestle Ecuador S.A., Cargill Ecuador S.A., Barry Callebaut, have developed
their sustainable cocoa supply chain and operations. Moreover, public organizations Ministry
of Agriculture (MAGAP), and national private organizations National Association of Cocoa
Exporters (ANECACAO), play an essential role in the cocoa sector of the country. Cocoa
production is a labor-intensive activity; most cocoa jobs have low-wages and temporary
contracts due to the crop seasonality: the main harvest goes from August to January, and mid-
crop goes from March to June. Another characteristic of the Ecuadorean cocoa sector is the
variety of trees; in Ecuador, CCN51 (ordinary hybrid cocoa tree) and Fine Aroma Cocoa
(National Cacao tree) are the main production varieties.
Fine Aroma Cocoa is part of the plan for reactivating the cocoa sector in the country
implemented by the Ecuadorian Ministry of Agriculture. Governments are implementing
national guidelines for ethical and environmentally friendly practices across industries and
demand sustainability commitment (Lamolle et al., 2019). Local initiatives in the cocoa sector
1 UPA in Ecuador is a Unit of Agricultural Production. It is an extension of land of 500 m² or
more, dedicated totally or partially to agricultural production, considered as an economic unit.

9
in Ecuador can be positive for marginalized farmers. Still, a study realized in three provinces
found that public interventions have to be in conjunction with policies and other measures to
improve farmers' quality of life (Clark and Martínez, 2016). For instance, a high-quality cocoa
type for chocolate makers, Fine Cocoa, was expected to increase prices. Still, in rural markets,
dried Fine Aroma cocoa beans do not have a significant price difference between varieties, yet
the yield is half from CCN51, see figure 4 (MAG-SIPA, 2020). Díaz-Montenegro et al.
(2018) found that policies implemented to produce Fine Cocoa do not guarantee higher
income to sustain a cocoa farmers’ livelihood strategy. Many certifications aim to enhance the
cocoa quality with better agricultural and environmentally friendly practices so prices can
rise. Sepúlveda et al. (2018) studied how farmers perceive quality labels in coffee and cocoa
farmers in Manabí, Ecuador. The study found that farmers are motivated to produce under
quality standards because they can access broader markets. That premium received for
complying with the label specifications is moderate.
Figure 2. Average prices per year for the purchase of dried cocoa beans in rural markets.
Source: Own Author graph based on monthly prices of cocoa collection centers reported by
the MAGAP
3.2.1 Fair-trade organizations
Fairtrade (FT) is an international organization well-known as a voluntary standard since 1997.
To ensure compliance with the standard, FT is compound by two independent organizations:
one develops and reviews FT standards (FLO International). The second one certifies that
producers and traders are following FT standards (FLOcert). Meanwhile, Fair for life (FL) is
an international organization developed by the Swiss Bio Foundation in 2006, certified by
Institute for Marketecology (IMO), and belongs to the Ecocert group. IMO ensures
compliance with the standard (Fair for Life, 2018). Both fair trade organizations have the
main objective of ensuring that farmers receive prices that cover their production costs and
sustain their livelihood. Another objective of FT and FL has been to promote labor rights and
protect children.
Fairtrade (FT) focuses on developing countries; contrariwise, Fair for Life (FL) has an
approach that is not exclusive to producers in developing countries but also producers from
North or South the globe with a socio-economic disadvantage (Jaffee and Howard, 2016). FT
and FL provide farmers access to international markets by facilitating trading contracts and
long-term and strong relationships with buyers. Smallholders and workers benefit from the
global food trade system and give them financial security (Fairtrade International, 2018).
60
70
80
90
100
110
120
130
2012 2013 2014 2015 2016 2017 2018 2019 2020
US
D p
er b
ag (
10
0lb
)
Prices in Rural Markets
Cacao CCN51 Dry Cocoa Dry mixed Fine Cocoa Dry

10
Fair-trade organizations guarantee that farmers get a minimum floor price, and farmers also
receive a monetary premium, which is later invested at the cooperative and community level.
Farmers benefit from the minimum floor price guarantee, which compensates when the
market price falls under the optimum of sustainable livelihood. A fairtrade minimum price
(FMP) is the lowest price a trader or any other stakeholder can pay for FT or FL certified
product. FMP for cocoa is 2000 USD per metric ton of cocoa, and if the cocoa is organic, the
FMP is 300 USD additional. Producers and traders can negotiate higher prices based on
quality and other characteristics (Fairtrade, 2016). The cooperative premium can be invested
in development projects such as infrastructure, training, tools, machinery, and social projects
(Fairtrade International, 2018).
The main requirement to join the FT certification scheme is that farmers must be organized
groups either in a cooperative or association. The cooperative has to incur certification fees
and audit fees. Meanwhile, FL certifies producers groups and smallholders even if they are
not part of a cooperative or have a production contract with a buyer or NGO (Fair for Life,
2019). However, they also receive premiums for investments in their farms. Another
differentiating characteristic is that Fair for Life is a certification throughout the whole supply
chain: producers, handlers (traders and manufacturers), and brand holders (Fair for Life,
2018). In FL, responsible sourcing principles are applied equally in every stage of the custody
chain, and performance information about each stakeholder is available to the public. This
whole supply chain approach enables long-term partnerships and responsible distribution of
value-added to all the value chain (Jaffee and Howard, 2016).
3.2.2 Olam Ecuador S.A.
Olam International is a leading global food and agricultural business company, with
operations in more than 60 countries. Olam's portfolio supplies food ingredients, feed, and
fiber to more than 19 thousand customers worldwide (Olam, 2020). Olam has designed its
strategy Olam Sustainability Standard (OSS) based on its policies, codes, and other
international standards (Olam, 2019). Olam Supplier Code defines that Olam's suppliers of
raw materials and products have to produce in a way that is socially and environmentally
responsible and economically profitable (Olam, 2019).
Olam Livelihood Charter (OLC) was the first program for cocoa that focused on eight
principles to tackle economic, environmental, and social challenges. In 2019, the new
initiative: Cocoa Compass started. The key targets of Olam's Cocoa Compass are set by 2030
and aligned with the United Nation's Sustainable Development Goals (SDGs). Cocoa
Compass focuses on farmers and aims to provide a living income that is not only for survival
by improving cocoa practices, product quality, and diversifying farm incomes (Olam, 2019).
Focus on farmers' pursue to promotes cocoa production as a prosperous business for younger
generations. The second pillar, which focuses on the environment, aims to protect forests and
regenerate natural assets. Natural assets cost to produce cocoa is quantified by assessing land-
use change, greenhouse gas emission, chemical application levels, water usage, among other
factors. It is used to re-evaluate sustainability initiatives (Olam, 2019). Olam Cocoa Compass
is country-specific; for instance, in Ecuador, the Bee Sustainable Project is an additional
income source for cocoa farmers. Each beehive can increase the farm income by USD 400 per
year (Olam, 2019); this represents 10% of the national yearly minimum salary. Until 2019, in
Ecuador, approximately 5,500 cocoa farmers belong to Olam Sustainability Strategy (Olam,
2017).

11
3.2.3 Comparison of sustainability programs Under the framework of Sustainable Livelihood, voluntary sustainability standards (VSS) and
sustainable sourcing practices (SSP) act as an external stakeholder capable of influencing
access to livelihood resources and promoting livelihood strategies to impact smallholders to
achieve sustainable livelihood outcomes. Table 2 provides different characteristics of the
sustainability programs in this study.
Table 2. Comparison of Cocoa Sustainability Schemes
Source: Own depiction based on a literature review. 23
2 Base on ANECACAO, 2019 Report of Ecuadorean Exports. Report does not differentiate
between conventional and sustainable certified cocoa. 3 Data is approximately and is up to 2019.
UNOCACE (FT) CECAO (FL) OLAM ECUADOR S.A.
Sustainability Program Fairtrade International Fair for Life Olam Cocoa Compass
Type of Sustainability
initiativeVSS VSS SSP
Traded MT (dry beans) 1.316,79 3.272,36 42148,62 2
Traded MT (sub-
products)14 - -
Farmers in program 3 1.400 1.868 5.500
Pricing Minimum Floor Price Minimum Price Market Price
Premium Flo Premium Development Premium Agricultural inputs
Premium amount USD 200 per MT5% of the Producer
Operation-
Credit NAPre-finance and social
creditNA
Standards FLO standards
ILO conventions, FLO
standards, SA 8000, and
the ETI Base Code
-
Verification FLO-Cert Eco-Cert External Auditors
Key aspectsLabor rights and livelihood
income
Labor rights, fair trade, and
responsible supply chains
Farmers’ income,
environmental impact, and
child and labor rights
Technical Assistance
Local farmers' Co-
operatives and
Associations
Local farmers' Co-
operatives and
Associations
Good Agricultural
Practices (GAP)
Supply chain coverage Supply records Chain of Custody AtSource traceability
Community outreachThe premium can be used
in farmers' community
The linkage between
producers and
manufacturers, premiums
can be used in development
projects for their
communities
Projects in cocoa
communities
Main Focus FairnessFairness and shared
responsibilityResponsible Sourcing

12
4 Data Collection Process and Data
This section discusses the research approach used for the data collection and data analysis
process. It complies with the different methods used to gather and analyze the empirical data.
At first, is presented the data collection process followed by the descriptive data.
4.1 Data collection A survey can provide broad quantitative data coverage and allows them to do various
statistical tests (Mazzocchini, 2008). Secondly, collected data quality significantly impacts
econometric processing; therefore, the primary data collection process implies greater
responsibility for achieving the research objectives (Mazzocchini, 2008). In this particular
research, the surveys were confidential and not anonymous; the respondent’s identity was
coded; however, it is possible to trace the response source. Before the field research, the
project supervisor revised the survey questionnaire. Later on, the survey was sent and agreed
with the organizations participating in this study and their representatives.
4.1.1 Survey Area
The survey was carried out in Ecuador's coastal region, in two out of 17 cocoa producing
provinces. The province of Guayas and Manabí is part of the top cocoa-producing provinces
in the country. In Guayas, the land is flat, and in Manabí, the landscape has hills. Both areas
are suitable for agricultural production and commerce due to their fertile soil, access to water,
and infrastructure that facilitates transportation to Guayaquil's main port. Cocoa production in
the province of Manabí and Guayas plays an essential role as an income-generating activity.
In Guayas, 51,000 ha are for cocoa plantations; meanwhile, in Manabí, 52,000 ha (ESPAC-
INEC, 2017). Figure 6 represents a cocoa-production map of Ecuador. The map includes
cocoa collection centers, cocoa productive areas, cocoa farms, and finally, the survey
locations.
Figure 3. Locations where the survey was carried out.
Source: MAGAP
Surveyed area

13
4.1.2 Questionnaire
To structure the questionnaire follows the previous literature about smallholders and the
impact of certification schemes on livelihood outcomes. It was not limited to cocoa surveys
but also considered surveys on coffee. The survey used structured and standardized questions
(Mazzocchini, 2008). The questionnaire had in total 28 questions divided into five sections:
A. general information about the farmers and their household, B. general information about
their farm and income sources, C. productivity in relation the cocoa activity, D. related to the
voluntary sustainability standard, and sustainable sourcing practices they belong, and E.
gather farmers’ perception of the sustainable programs. Table 3 summarizes the structure of
the questionnaire.
Table 3. Survey questionnaire structure.
Source: Own depiction based on questionnaire design.
The structure and measurement scale selected for the question type was dichotomous (just
allows two outcomes), multiple-choice, and finally, Likert scale-like. For sensitive questions
like income sources, direct quantification was avoided (Mazzocchini, 2008). The
questionnaire was prepared in English and translated to Spanish as the official language of
Ecuador is Spanish. The full questionnaire version in English and Spanish versions are in
Appendix 2 and 3.
4.1.3 Data Collection Process
During December and January, the researcher contacted prominent business executives
representing cocoa exporting companies in Ecuador. The main intention was to obtain details
of their sustainability practices and invite their companies to develop this research. To get
approval to survey their farmers, the researcher had several remote meetings with the group
representing Olam. It took several months until the headquarters approved the participation.
Discussions with other cocoa exporting companies with sustainability programs did not
support the research due to upper management's lack of permission and unknown reasons.
The involvement of Fair-trade groups in this study did not represent any significant concern.
The questionnaire was revised during February and March with the thesis supervisor before
traveling to Ecuador. Fairtrade UNOCACE, Fair for Life CECAO, and Olam's Sustainable
Section Topics Variables
AFarmer household
characteristics
Gender, age, size of household, level of education, household
head, sources of income
B Farm characteristicsFarm ownership, farm area, experience in farming, co-
operative membership
C Cocoa Production
Labor, production costs, changes in production, intercropping,
variety of cocoa, type of production system, commercial
practices (dry/wet beans), quantity sold
DSustainability Standards
and Practices
Sustainability program participation, contract/agreement of
participation, area of production that is for certification, years in
the program, training received, the premium received, minimum
floor price received, changes in production due to certification
EPerception of
Sustainability Practices
Economic, social, and environmental perception of the
sustainability program, benefits, and constraints of certification,
future of certification
14
and Operations Managers received a copy of the questionnaire with a letter of intention and
research goals. To ensure that the questions were understandable and easy to answer, a pilot
test was done with one farmer from FT-UNOCACE. The pilot test took 20 minutes and
served as a reference to point out that academic questions were not easy to understand. Due to
the farmers' limited literacy level, the survey was carried out face-to-face and in Spanish
using everyday language.
The field data collection started with the province of Guayas with the Fairtrade group.
Interviews were carried out in several farmers' co-operatives in the main building with
farmers who delivered their cocoa. For the second group: Fair for life, it was necessary to visit
some households on their farms. In mid-April, the field trip began to interview the farmers
belonging to Olam's Sustainability Program in the province of Manabí. The village is 9 hours
away from the port-city Guayaquil. Olam's managers arranged a training session where
farmers joined randomly. To minimize selection bias, the farmers did not know that they
would also participate voluntarily in an interview until they arrived at the training center.
Surveyed farmers were isolated from the rest of the group to reduce the risk of learned
answers from other respondents. The process of data collection started between the end of
March and April 2019 in Guayas and Manabí. In March, the mid-crop season starts and have
bad weather conditions, heavy rains, and low yield. Hence some farmers did not visit their co-
operatives, and as a result of it, the number of respondents was lower than the expected. The
final sample includes 132 smallholders, certified cocoa farmers as FT or FL, and the non-
certified farmers belong to a sustainability program with Olam.
4.1.4 Ethical Aspects and consent
When conducting survey research in every stage of the process, from sample selection to
questionnaire design, reporting, and analysis, the study considered ethical aspects. Ethical
elements such as protecting human subjects, the privacy of the information, accuracy when
presenting results, and the findings reflect the respondents' answers must be taken into
account in survey research (Oldendick, 2012). Before every interview, the farmer received an
introduction to the study's topic and the research intentions and objectives, and that they could
terminate the survey at any moment without any negative consequence. Additionally, the
interviewers informed the farmers that the data collected will be treated confidentially and
only for academic purposes. Finally, a cover letter was at the beginning of the questionnaire;
this form included information about the thesis topic and the research purpose, the
organization behind the study, data treatment, confidentiality, and contact information.
4.2 Data preparation and sample descriptive statistics
In this section, descriptive statistics of the sample are shown after the culmination of the
fieldwork. Before the statistical processing, the questionnaire information needed to be
transferred into an electronic format. The dataset was carefully assessed, organized, and coded
with variables. This process greatly impacts the data's quality, improving subsequent
econometric analysis (Mazzocchi, 2008).
4.2.1 Household characteristics and farm characteristic
Table 4 presents the cocoa farm household and farm characteristics of the sample. Out of 132
interviewed farmers, only 20 respondents were female farmers responsible for the cocoa farm.
The results show that 73% of the surveyed farmers are more than 45 years old, of which 20%
are over 65 years old, which is the retirement age in Ecuador. The majority of the farmers

15
have a primary school education, equivalent to 6 years of studies. However, it is not
confirmed if the surveyed farmer has completed primary school. The education level is
deficient among farmers with an overall average of 7 years of schooling and a standard
deviation of 3.01. The results also show that 75% of the sample has less than 5 hectares, with
a farm size concentration between 0.5 hectares to 3 hectares. In contrast, only 9% of the
surveyed household has a farm size larger than 10 hectares. Farm ownership stands for the
farm's legal status from which most of the farmers have inherited their land.
Regarding the farming experience, around 64% of the sample has more than 40 years of
working as farmers. The sample distribution among the sustainability scheme type is 53% for
voluntary sustainability standards (VSS) and 47% for sustainable sourcing practices (SSP). In
VSS groups, it is expected that all the farmers of the sample have a cooperative membership
since it is part of the requirements in other to belong to FT. For farmers that belong to SSP,
such as Olam, 63% of the farmers had training in the last year; meanwhile, only 19% of the
farmers in Fairtrade received training in the previous year. Only 42 farmers received non-
monetary benefits, such as tools, machinery, inputs. Finally, only 25% of the farmers
perceived that they could access market information due to the sustainability program.
Table 4. Farm Household and Farm Characteristics (Categorical Variables)
Source: Own depiction based on survey data.
4.2.2 Farm profits and cocoa revenue
Since most of the sample respondents use mixed intercropping systems, the survey
questionnaire failed to collect direct information on farm income, cocoa income, and expenses
due to several reasons. First, most farmers have limited farm business management and
accounting skills. Hence, they were unable to give precise values to the total sales of the
previous harvest. Secondly, multiple crops impeded to collect of information on cocoa
revenue. As income is a sensitive question, the questions related to income were asked in
intervals to avoid direct quantification and make it easier for the farmer to allocated their
income interval per income source (Mazzocchini, 2008). Table 5 presents a summary of
income by type of activity and group.
Sustainability Program
Categorical Variables Freq. % Freq. % Freq. % Freq. %
Sample Distribution 37 28% 33 25% 62 47% 132 100%
Gender (Male) 35 95% 27 82% 51 82% 113 86%
Age group ( > 45 years old) 32 86% 25 76% 39 63% 96 73%
Household Head (Male) 34 92% 27 82% 53 85% 114 86%
Family size ( < 4 family members) 20 54% 16 48% 29 47% 65 49%
Education Level (at least primary school) 34 92% 31 94% 57 92% 122 92%
Farming experience ( > 40 years) 34 92% 18 55% 32 52% 84 64%
Farm Size (< 5 ha) 33 89% 26 79% 40 65% 99 75%
Farm onwership (heir) 31 84% 29 88% 54 87% 114 86%
Membership of cooperatives 36 97% 33 100% 0 0% 69 52%
Training participation (last year) 7 19% 17 52% 39 63% 63 48%
Non monetary benefits (accessed) 10 27% 11 33% 21 34% 42 32%
Market information (agree) 12 32% 11 33% 10 16% 33 25%
% (graph)
Fairtrade OlamFair for Life Full Sample

16
Table 5. Income by a source per month (average).
Note: Income is in USD. Sample size: n=132. Source: Author's own based on survey data.
The monthly average income was calculated by taking the median of each income interval
and identifying the income source type. Farmers belonging to Fair for life (FL) have higher
incomes compared to the other groups. During 2019, the minimum salary per month was 394
USD, and the basic food basket in Ecuador is 715.85 USD, whereas the survival food basket
was 501.52 USD (INEC, 2019; Ministerio del Trabajo, 2018). Other monetary income refers
to premium and minimum prices per bag of cacao sold; this was calculated based on the
number of bags sold and the compensation received per bag.
This study used the total number of cocoa bags sold during the previous year multiply by the
average price in their respective township published by the Minister of Agriculture to estimate
only cocoa's income. This table is not including the minimum price per bag or any other
monetary incentive received. Fair for life (FL) presents the highest mean with 3,274 USD and
a standard deviation of 2,716 USD. It is essential to mention that FL has the highest cocoa
crop area and a mean for yield than the other two groups. The variable bags sold and the
variable intercrop number of hectares for cacao allowed us to calculate an approximate cocoa
yielding. The average farm size used for cocoa is 3.62 hectares, with a 2.75-standard
deviation. In Ecuador, around 49% of cocoa farms have less than 10 hectares (ESPAC-INEC,
2017). Appendix 4 and appendix 5 presents a summary of cocoa prices.
Table 6. Income and Cocoa Farm Characteristics (discrete and continuous variables)
Note: n=132. Source: Own depiction based on survey data.
Perceived benefits and perceived disadvantages from involvement in Sustainability Programs
It is essential to know if farmers perceive benefits or difficulties by participating in cocoa
certification to understand how sustainability programs affect small-scale cocoa farmers. In
the survey, questions were structured, and the answers had a Likert scale from 1 to 5. The
surveyed farmers had to respond on how strongly they agreed or disagreed with different
statements about benefits and constraints. Figures 6 and 7 summarize the overall advantages
and disadvantages perceived by farmers, respectively, from the different sustainability
programs.
By Type
By Income source per
month (median in usd)
Temporary
crops
Permanent
cropsPoultry Livestock Subtotal Trading Salary Others Subtotal
Monetary
Premiums
Minimun
priceSubtotal
Fairtrade 11 242 5 1 259 24 72 24 120 2 36 38 418
Fair for life 21 386 27 3 438 50 20 18 88 0 51 51 576
Olam 17 278 32 35 362 0 15 15 29 ,35 0 ,35 391
Full Sample 16 295 23 17 352 19 32 18 69 2 87 89 511
Farm activities Off-farm activities OtherTotal
(average)
Sustainability Program
Continuous Variables Mean Std. Dev. Mean Std. Dev. Mean Std. Dev. Mean Std. Dev. Min Max
Education (in years) 7,57 3,14 7,70 3,06 6,82 2,88 7,25 3,01 0 12
Cacao Plantation (Ha) 3,18 2,00 3,91 2,87 3,73 3,06 3,62 2,75 ,50 14
Incomer per year (all sources) 4.557 2.834 6.309 6.218 4.694 2.752 5.059 3.963 600 36.000
Income per year (only cacao) 2.145 1.826 3.274 2.716 1.609 1.326 2.153 1.980 254,1 13.445
Bags sold last year (100 lb) 24 20 36 30 19 25 20 22 3 150
Yield (bags x Ha) 8 4 10 4 6 3 7 4 ,75 20
Fairtrade Fair for Life Olam Full Sample

17
Figure 4. Perceived benefits of Sustainability Programs
Note: n=132. Source: Own Depiction based on survey data.
Most farmers have responded positively to the section related to knowledge and training.
More than 76% of the sample agreed that the main perceived benefits of their involvement in
a sustainability scheme are the training received, followed by learning new and better
agricultural practices and improvement of knowledge in cocoa culture. Secondly, farmers
recognized that their cocoa plantations had increased productivity and yield; however, 1/3 of
the sample responded that they do not agree or disagree. Conversely, the question related to
perceived economic benefits has the highest disagreement in our sample. One reason for this
is that farmers involved in the Olam sustainability program do not receive premiums in
monetary terms, and Olam is the largest group.
Based on the literature review, the main perceived disadvantages for farmers adopting a
sustainability scheme are the cost and time. Nevertheless, according to our sample's survey
results, the main disadvantage is that the price received is too low; 30% of the sample
strongly agreed with this statement. All three groups responded that they disagreed with
disadvantages implying that participating in a sustainable scheme is costly, labor-intensive,
and time-consuming. However, a large part of the interviewed farmers viewed the presented
possible constraints of the scheme neutral.
The second perceived disadvantage is related to the transparency of the administration. In this
case, farmers belonging to a voluntary sustainable standard were more likely to respond that
they agreed and strongly agreed that the administration is not transparent with the information
shared and with the decisions made by their cooperatives. Meanwhile, farmers belonging to
Olam replied that they strongly disagreed with this statement, which is acceptable as Olam’s
farmers are not members of an association or cooperative. They do not have a voting decision
on the treatment of premiums.
80% 60% 40% 20% 0% 20% 40% 60% 80%
Premiums
Minimum Price support
Learning new and good agricultural practices
The training received
Improvement of the knowledge cocoa culture
Increase in volume / productivity
Perceived Benefits of Sustainability Programs
Strongly Disagree Disagree Neutral Agree Strongly Agree n=132

18
Figure 5. Perceived constraints of Sustainability Programs.
Note: Sample size n=132. Source: Own Depiction based on survey data.
80% 60% 40% 20% 0% 20% 40%
High cost
A lot of work
It takes time
Lack of transparency
No disadvantages
Other disadvantages ….
Perceived constrains of Sustainability Programs
Strongly Disagree Disagree Neutral Agree Strongly Agree n=132
0% 50%
.
I don't know
19
5 Econometric model and specification
This section discusses the method used to assess the impact of different sustainability
schemes on cocoa farmers' livelihood in Ecuador quantitatively. The model specification
consists of an econometric approach based on previous literature to estimate the sustainability
program's impact on the farmers’ livelihood.
5.1 Modeling farmers’ choice
To model the farmers’ choice of participation in a particular sustainable scheme, either VSS
(e.g., FT or FL) or SSP (e.g., Olam), the study uses the utility framework. A farmer will
choose a program that will maximize their utility. Utility, U, is determined by a set of
variables 𝑥𝑖, such as farm and household characteristics, also influence the farmers’
willingness to join a certification scheme.
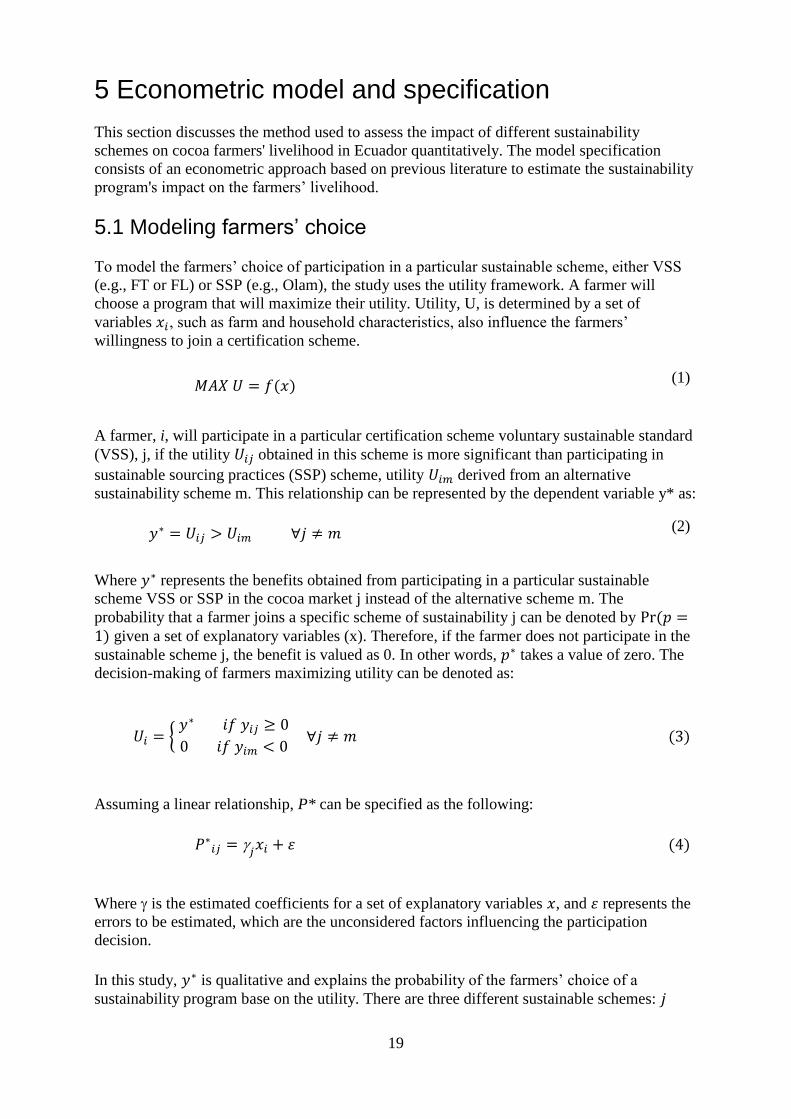
𝑀𝐴𝑋 𝑈 = 𝑓(𝑥) (1)
A farmer, i, will participate in a particular certification scheme voluntary sustainable standard
(VSS), j, if the utility 𝑈𝑖𝑗 obtained in this scheme is more significant than participating in
sustainable sourcing practices (SSP) scheme, utility 𝑈𝑖𝑚 derived from an alternative
sustainability scheme m. This relationship can be represented by the dependent variable y* as:
𝑦∗ = 𝑈𝑖𝑗 > 𝑈𝑖𝑚 ∀𝑗 ≠ 𝑚 (2)
Where 𝑦∗ represents the benefits obtained from participating in a particular sustainable
scheme VSS or SSP in the cocoa market j instead of the alternative scheme m. The
probability that a farmer joins a specific scheme of sustainability j can be denoted by Pr (𝑝 =1) given a set of explanatory variables (x). Therefore, if the farmer does not participate in the
sustainable scheme j, the benefit is valued as 0. In other words, 𝑝∗ takes a value of zero. The
decision-making of farmers maximizing utility can be denoted as:
𝑈𝑖 = { 𝑦∗ 𝑖𝑓 𝑦𝑖𝑗 ≥ 0
0 𝑖𝑓 𝑦𝑖𝑚 < 0 ∀𝑗 ≠ 𝑚 (3)
Assuming a linear relationship, P* can be specified as the following:
𝑃∗𝑖𝑗 =
𝑗𝑥𝑖 + 𝜀 (4)
Where is the estimated coefficients for a set of explanatory variables 𝑥, and 𝜀 represents the
errors to be estimated, which are the unconsidered factors influencing the participation
decision.
In this study, 𝑦∗ is qualitative and explains the probability of the farmers’ choice of a
sustainability program base on the utility. There are three different sustainable schemes: 𝑗

20
(FT, FL, and Olam) that a smallholder can choose to participate in; the outcome variable can
take more than two values but only one at a time.
To predict the farmers’ choice to participate in a sustainability scheme j, the following
sustainable schemes can be defined as:
𝑗 = {
0 = 𝑓𝑜𝑟 ℎ𝑜𝑢𝑠𝑒ℎ𝑜𝑙𝑑𝑠 𝑡ℎ𝑎𝑡 𝑎𝑟𝑒 𝐹𝑇1 = 𝑓𝑜𝑟 ℎ𝑜𝑢𝑠𝑒ℎ𝑜𝑙𝑑𝑠 𝑡ℎ𝑎𝑡 𝑎𝑟𝑒 𝐹𝐿
2 = 𝑓𝑜𝑟 ℎ𝑜𝑢𝑠𝑒ℎ𝑜𝑙𝑑𝑠 𝑡ℎ𝑎𝑡 𝑎𝑟𝑒 𝑂𝑙𝑎𝑚
(5)
To fix the latent variable to zero, FT is the base outcome, so the remaining outcome variables
measure the preference of the other programs Olam and Fair for Life, relative to Fairtrade.
Following Gujarati's (2008) empirical applications, a multinomial probit model predicts the
probability of participation in one of each cocoa sustainability scheme. In a multinomial
probit model, the dependent variable can take more than two categorical outcomes. Still, only
one at a time values are finite, discrete, and cannot be ordered in any way.
5.1.1 Factors influencing the sustainability program decision
To find the effect of VSS (e.g., FT or FL) or SSP (e.g., Olam) in cocoa farmers' income and
improved wellbeing is necessary in the first place to find the farmers' choice for a particular
sustainable program. In an imperfect market, utility maximization differs from profit
maximization (Chiputwa et al., 2015). Hence, factors that influence a sustainability program's
participation may vary as each sustainability scheme (FT, FL, Olam) requirements and
benefits are different. Table 7 summarizes a set of covariates that cocoa farmers
hypothetically consider in the decision-making process.
Table 7. Overview of potential factors influencing the decision-making process of
participating in a program
Category Variable Name Variable definition
Hou
seh
old
chara
cter
isti
cs
x1: Male household
head
Qualitative variable, categorical, dichotomous
1 Male, 0 No
x2: Age of household
head
Qualitative variable, categorical, ordinal
1 (18-25), 2 (26-35), 3 (36-45), 4 (46-55), 5 (56-65), 6
(66 - 75), 7 (>75)
x3: Education of
household head
(years)
Quantitative Variable, numerical, discrete
1 Primary school = 6 years; 2 Secondary school =9
years; 3 High school =12 years; 4 Institute/College
=11 years; 5 University =17 years; 6 Other =13 years;
7 Nothing = 0 years
x4: Household size Qualitative variable, categorical, ordinal
1 (1 – 3 people), 2 (4 – 7 People), 3 (> 7 people)
x5: Years working in
farming cocoa
Qualitative variable, categorical, ordinal
1 (<5 years), 2 (5-10 years), 3 (11-20 years), 4 (21-40
years), 5 (41-50 years), 6(>51 years)
x6: Livelihood
diversification
Qualitative variable, categorical, ordinal
1 “1 income source”, 2 "2 income sources", 3 "3
income sources", 4 "4 income sources"

21
Farm
Ch
ara
cter
isti
cs x7: Farm size
Qualitative variable, categorical, ordinal
10-1 ha; 2 1-2 ha; 3 2-3 ha; 4 3-4 ha; 5 4-5 ha; 6 5-10
ha; 7 >10 ha
x8: Labour
Qualitative variable, categorical, dichotomous
1 (1 – 3 people) 2 (4 – 7 People)
3 (> 7 people)
x9: Production system
(No intercrop, only
cocoa)
Qualitative variable, categorical, dichotomous
1 Yes, 0 No
Source: Own depiction based on previous literature review.
5.2 Modeling the effects on income
The type of sustainability scheme VSS (e.g., FT or FL) or SSP (e.g., Olam) and a set of
selected explanatory variables will describe how it affects the cocoa farmers' income
(dependent variable). Based on the literature review presented in section 3, several predictor
variables 𝑥𝑖 have been identified as potential determinants of a better income. For estimating
the effect of Fairtrade, Fair for life, and Olam program on income, besides the variables on
household and farm characteristics, the model will use a dummy variable for each
sustainability scheme. However, income differences among the smallholder farmers of the
different programs are not necessarily due to their choice. Other factors might influence the
income differences, such as productivity, management skills, and location.
The study will use a multiple regression model to estimate how each covariate (𝑥) affect the
outcome variable income 𝑌, holding all else constant. A multiple regression model allows
determining the model's overall fit and the relative effect of each of the predictors to the total
variance explained income. The model takes the general regression form specified by the
following formula:
𝑌𝑖𝑘 = 𝛽0 + 𝛽𝑛𝑋 + 𝜀2𝑖 (6)
where the betas are parameters to be estimated in the income regression model, k is the
farmers’ choice of sustainability scheme (VSS = 1, SSP = 0):
𝑘 = {1 = 𝑓𝑜𝑟 ℎ𝑜𝑢𝑠𝑒ℎ𝑜𝑙𝑑𝑠 𝑡ℎ𝑎𝑡 𝑎𝑟𝑒 𝑉𝑉𝑆0 = 𝑓𝑜𝑟 ℎ𝑜𝑢𝑠𝑒ℎ𝑜𝑙𝑑𝑠 𝑡ℎ𝑎𝑡 𝑎𝑟𝑒 𝑆𝑆𝑃
(7)
𝛽𝑛 are the parameters estimated that show the effect of the covariate on the income of cocoa
farmers and 𝜀2𝑖 is the error term for the income regression model. The dependent variable
income uses the log-transformation to reduce the skewness of the data and normalize the
distribution:
log (𝑌𝑖𝑘) = 𝛽0 + 𝛽𝑛𝑋 + 𝜀2𝑖 (8)
For the analysis of the results, the interpretation for the estimated coefficients �� will be in
terms of for every 1-unit increase in 𝑥1 will result in an expected increase in 𝑙𝑜𝑔 − 𝑌 of 𝛽1
units. Regarding the income itself, without the log-transformation, for every 1-unit increase in
𝑥1 the expected outcome of 𝑌 is multiplied by 𝑒��.

22
5.2.1 Determinants affecting the farmer’s income In the first stage, the study will analyze the determinants that affect smallholders' income
using some of the probit model's significant parameters. As the probit model is based on the
utility theory, it is expected that the independent variables used in the model will also affect
farmers' income. Based on the literature review presented in section number 3, the
explanatory variables used in the regression model assumed to affect outcome variable
income are detailed in table 8.
Table 8. Overview of potential determinants affecting income
Category Variable Name Variable definition Expected
sign
Hou
seh
old
chara
cter
isti
cs x1: Education of
household head
1. Primary school =6 years; 2. Secondary
school =9 years; 3. High school =12 years; 4.
Institute/College =11 years; 5. University
=17 years; 6. Other =13 years; 7 = 0 years
Positive
x2: Years working
in farming
1. (<5 years), 2. (5-10 years), 3. (11-20
years), 4. (21-40 years), 5. (41-50 years), 6.
(>51 years): median
Positive
x3: Livelihood
diversification
1. “1 income source”, 2. "2 income sources",
3. "3 income sources", 4 "4 income sources." Positive
Farm
Ch
ara
cte
rist
ics
an
d C
om
pet
itiv
enes
s
x4: Labor force 1. (1 – 3 people) 2. (4 – 7 People)
3. (> 7 people) Positive
x5: Farm size 1. 0-1 ha; 2. 1-2 ha; 3. 2-3 ha; 4. 3-4 ha; 5. 4-
5 ha; 6. 5-10 ha; 7. >10 ha Positive
x6: Average
production cost
(only cocoa)
Median of ranked costs Negative
x7: Cocoa Yield Bags of dry beans sold per ha Positive
x8: Experience in
Sustainability
Scheme
Number of years in the program Positive
Source: Own depiction based on previous literature review.
Following the conceptual framework of sustainable rural livelihood, institutional resources
are essential for improving smallholders' income (Jena et al., 2017; Marsh, 2003). In the
current model potential determinants affecting the income associated to the sustainability
scheme are added. Voluntary sustainability standards (VSS), FT, or FL are only possible; in
most cases, through cooperative membership, this type of sustainability program allows
farmers to have floor prices, enhancing their income. Meanwhile, with sustainable sourcing
practices (SSP), farmers are not required to be cooperative members, but a long-term buying
commitment also exists. For the human capital component variables from household
characteristics, such as years of education, family size, farming experience, and services
received from sustainability programs (e.g., training) to improve farming practices and years
of experience in the sustainability program. Table 9 describes the additional variables
included in the model.

23
These variables provide capabilities that improve the farmer's skills and knowledge to develop
a livelihood strategy to achieve a livelihood outcome such as better income (Jena et al., 2017;
Meemken et al., 2019; Scoones, 1998; Vellema et al., 2015). Larger farm sizes allow farmers
to have more considerable means of livelihood (Jena et al., 2017). Income from non-farming
activities is considered a livelihood strategy to improve livelihood outcomes as the income
and risk is diversified (Jena et al., 2017; Ruben and Zuniga, 2011).
Table 9. Overview of potential determinants rewarded by the market affecting income
Category Variable Name Variable definition Expected
sign
Su
stain
ab
ilit
y p
ract
ices
rew
ard
ed
by t
he
mark
et
x9: Premium
received Total premium = qty sold * premium in
USD per bag Positive
x10: Other non-
monetary premiums
(intensity)
Count of other non-monetary categories
received such as tools, machinery, inputs,
social help, other
Positive
x11: Minimum floor
prices Total minimum price = qty sold * min price
in USD per bag Positive
x12: Training
Intensity Total number of training received in overall Positive
x13: Perceived
access to market
information
1. Strongly Disagree; 2. Somewhat
disagree; 3. Neutral; 4. Somewhat Agree; 5.
Strongly Agree; 6. I do not know; 7. Not
applicable
Positive
x14: Perceived
access to inputs and
technology
1. Strongly Disagree; 2. Somewhat
disagree; 3. Neutral; 4. Somewhat Agree; 5.
Strongly Agree; 6. I do not know; 7. Not
applicable
Positive
Source: Own depiction based on previous literature review.
5.3 Threats to internal validity
Guarantee that every surveyed farmer in the sample has a nonzero probability of being
selected is difficult to achieve. Farmers where randomly surveyed in different provinces and
in specific locations. Since, selection bias at the sample level can significantly affect the
estimation results is important to correct. One alternative solution to reduce the selection bias
of the sample can be by estimating the effect of the independent variables over the outcome
(income) in the overall representation of the sample, and later estimating the income by each
subgroup (VSS vs SSP). Another option is to by using a two-step procedure, where in the first
part the multinomial probit is calculated and then for each farmer the inverse mills ratio is
calculated. The estimated rate is used as a regressor in a second model or this research in the
income model (Wooldridge, 2010). Finally, there is no evidence of endogeneity and the OLS
is consistent, results can be presented. However, this correction is not possible to perform
within the time frame for this thesis and the data is too limited to find a control group, a group
of farmers that are conventional. Another problem is with omitted variable bias (OBV) when explanatory variables are not
included in the regression model. According to Wooldridge (2010), bias also occurs when
regressors are under or overestimated due to the missing variables. In the present thesis, the
risk of omitted variable bias exists because of data unavailability as it was not possible to
24
collect all explanatory variables for income. For example, it was not possible to collect
information for the analysis with the farmer's existing assets due to time and budget. Another
reason is that the sample was very small, and it was not possible to add more variables to our
model as we could risk having instable coefficients.
Measurement error occurs when the data present errors either on the dependent or
independent variables. This could happen because, first, interviews were held in most
collection centers of each sustainability scheme. Farmers probably answered the interview
accordingly to what their organization expected. Even though the survey was face-to-face,
farmers might feel compromised to their organization and did not give their genuine opinions.
Secondly, questions about the farmer's perception of the sustainability program benefits and
constraints depend mainly on farmers' interpretation. There is a risk of bias due to slightly
different understandings among the surveyed farmers, which is inevitable. On the other hand,
data related to quantities sold, minimum prices received, or income sources show that farmers
could not estimate these amounts correctly. Finally, to avoid collinearity problems between
the covariates, as the sample size is small, and to prevent numerical instability and avoid
underestimated standard errors and inaccurate regressors, limited variables are being used
(Wooldridge, 2010).

25
6 Results and Discussion
This chapter presents the results of the econometric model and the respective analysis. The
econometric model examines the determinants of choosing specific sustainability programs
and the effects on cocoa farmers' income following a two-step analytical procedure.
6.1 Results of the multinomial probit model
The analysis examines the factors influencing cocoa farmers' sustainability program decisions
through a multinomial probit (MNP). Table 10 describes the results of the MNP model. The
Wald chi-square test 53.98 is significant, with a p-value of less than 1% implies that the
regressors as a whole are statistically significant in the multinomial probit model. In other
words, the model explains better than a model with no predictors the probability of farmers
choosing a sustainability program over Fairtrade (FT). FT group is set as the base outcome.
The statically significant regressors are household head age, household gender male, years of
education, farming experience, cocoa income, farm size, labor, production system (means
only cocoa no intercrop), and income diversification.
Table 10. MNP estimations for determinants influencing the sustainability program decision.
Note: ***p<0,01; **p<0,05; *p<0,1 Source: Survey data computation based on the MPM results in Stata/IC
16.1.
Olam
Male household head -0.2591 0.5549 -0.47 0.641 -1.3468 0.8285
Age of household head -0.7626 0.2244 -3.40 0.001 *** -1.2025 -0.3227
Education of household head (years) -0.2578 0.0764 -3.38 0.001 *** -0.4076 -0.1081
Household size -0.4945 0.3617 -1.37 0.172 -1.2034 0.2143
Years working in farming cocoa -0.5870 0.2170 -2.71 0.007 *** -1.0123 -0.1618
Livelihood diversification 0.3591 0.2660 1.35 0.177 -0.1622 0.8805
Farm size 0.3931 0.1280 3.07 0.002 *** 0.1424 0.6439
Labour 1.5596 0.8164 1.91 0.056 * -0.0405 3.1598
Production system (No intercrop, only cocoa) -0.1976 0.6116 -0.32 0.747 -1.3963 1.0011
Intercept 5.6906 1.9902 2.86 0.004 1.7898 9.5913
Fair_for_Life
Male household head -1.5318 0.5436 -2.82 0.005 ** -2.5973 -0.4664
Age of household head -0.3822 0.2274 -1.68 0.093 * -0.8280 0.0635
Education of household head (years) -0.0483 0.0773 -0.62 0.532 -0.1998 0.1032
Household size -0.2719 0.3725 -0.73 0.466 -1.0021 0.4583
Years working in farming cocoa -0.4608 0.2210 -2.09 0.037 ** -0.8939 -0.0277
Livelihood diversification -0.1739 0.2886 -0.60 0.547 -0.7396 0.3918
Farm size 0.3295 0.1325 2.49 0.013 ** 0.0699 0.5891
Labour 0.4616 0.9776 0.47 0.637 -1.4544 2.3776
Production system (No intercrop, only cocoa) 1.4138 0.5723 2.47 0.013 ** 0.2922 2.5354
Intercept 4.1130 2.1002 1.96 0.050 -0.0033 8.2292
Number of obs = 132
Prob > chi2 = 0.000
Wald chi2(18) = 53.98
Log likelihood = -97.1019
Fairtrade
[95% Conf.
I nterval]
Dependent variable = Sustainability Program
(base outcome)
Variables Coefficient Std. Err. z P>z

26
To better interpret the results, the study will use the average marginal effects of a certain
covariate on each outcome variable. Because a multinomial probit model is a non-linear
model, interpreting its coefficients will only explain an event's odds-ratio. However, it would
not explain the effect on the outcome. In the multinomial probit, the p-value will explain the
relevance of a coefficient in the model specification, test for statistical significance, whether
or not to include a certain regressor. Not including one covariate can affect the results and
significance of the remaining coefficients. A regressor can influence the probability of
choosing a sustainability program over the probability of choosing the baseline program
positively on the ratio, but the same covariate in average marginal effect estimation, can
negatively affects the probability of choosing or not a specific sustainability program. The
marginal effect explains the changes in the probability of the observed outcome. The
summary of every sustainability program's average marginal effects after the multinomial
probit is in table 11.
Table 11. Average Marginal effects after Multinomial Probit Model estimations for
determinants influencing the sustainability program decision.
Note: Standard errors are reported in parenthesis, ***p<0,01; **p<0,05; *p<0,1.
Source: Survey data computation based on average marginal effect results in Stata/IC 16.1
The marginal effect is positive for a male household head choosing Fairtrade (FT) at a 10%
level of significance; meanwhile, the marginal effect is negative for a male farmer to choose
Fair for life (FL) at 1% of significance. The marginal effect of a household head being male,
holding all other factors constant, increases the probability for a farmer choosing Fairtrade
(FT) at a 0.14-point percentage and decreases 0.25-point percentage the likelihood of a farmer
choosing Fair for life (FL); meanwhile, the covariate is not significant for farmers choosing
Olam.
The coefficient for household age is favorable for farmers choosing FT at a 1% level of
significance; meanwhile is negative for farmers choosing Olam at the same level of
Variables FT Olam FL
Male household head 0.138756 * 0.113756 -0.252512 ***
0.0813 0.0831 0.0661
Age of household head 0.103240 *** -0.116586 *** 0.013346
0.0304 0.0353 0.0334
Education of household head (years) 0.028921 *** -0.048273 *** 0.019352 *
0.0103 0.0120 0.0116
Household size 0.068725 -0.072978 0.004253
0.0548 0.0626 0.0572
Years working in farming cocoa 0.091794 *** -0.071525 ** -0.020269
0.0318 0.0319 0.0288
Livelihood diversification -0.022449 0.093623 ** -0.071174 *
0.0409 0.0442 0.0431
Farm size -0.063017 *** 0.045618 ** 0.017399
0.0179 0.0200 0.0184
Labour -0.187472 0.273457 *** -0.085985
0.1364 0.1112 0.1269
Production system (No intercrop, only cocoa) -0.085128 -0.195714 ** 0.280842 ***
0.0873291 0.091821 0.0711455
Number of obs = 132
Average Marginal Effects (dy/dx)

27
significance. The marginal effect of a farmer being older, holding all the rest constant,
increases the probability by 10-point percent to choose FT. For Olam, the relation is the
opposite; by 12-point percent. This is plausible because the Olam sustainability program has
less than three years in the market and farmers are younger within this group.
The estimated coefficient for years of education significantly determines farmers’ choice
decisions towards Fairtrade and Olam at a 1% level of significance. The marginal effect of
education of a 3-point percentage, while holding all other factors constant, increases the
probability that a farmer participates in FT by 3%. The marginal effect for farmers choosing
Olam decreases by 4% the likelihood if the farmers have more years of education. Higher
education level is translated to a higher understanding of information and business. As cocoa
farmers choosing FT must be associated at a cooperative level, they need to have some
education to improve supply, contract, and price negotiation.
The marginal effect of years of experience in farming increases the probability of joining FT
by 6% while holding the rest of the variables constant at a 1% level of significance. It can be
explained as the farmers in FT has a higher number of older farmers, and farmers have ample
working experience associated with cooperatives. For Olam, at a significance level of 5%, the
marginal effect of working experience decreases the probability of choosing Olam as a
sustainability program by 7% because farmers with more experience in cacao farming will
select a program with more experience in the market. For FL, the experience does not
influence the decision-making process of choosing FL or not.
The estimated coefficient for farm size is negative and significant and determines farmers'
choosing Fairtrade at a 1% level of significance. The marginal effect of the farm size variable
of 0.063017 point-percent denotes that an increase in farm size leads to a 6.30% decrease in
the possibility of the cocoa farmers to join the Fairtrade sustainability program while holding
other factors constant. This is realistic; one of the conditions to join a FT program is that farm
size must be a smallholder according to the national parameters. Secondly, cocoa farmers
with larger farm sizes may have more bargaining power to sell to other private buyers than
FT. Farm size is also significant at 5% for farmers' choosing Olam as a sustainability
program; controversy larger farm sizes positively affects the decision-making process. The
marginal impact of farm size is a 0.046-point percentage; as farm size increases, the
probability of joining the Olam increases by 4,5%. The Olam program does not have any
limitations on the farm's size.
Regarding the estimated coefficient of labor, it is positive and statistically significant for
farmers choosing Olam. The marginal effect of labor is a 27-point percentage, while
everything else is constant. The probability of a farmer choosing Olam as a sustainability
program increases by 27% when a larger labor force is working at the farm. Larger farm sizes
require a larger workforce.
The estimated coefficient that is also statistically significant in the decision-making process is
the intercropping system for farmers with cacao crops only, monocultures. At a 1% level of
confidence, the marginal effect of having only cocoa crop increases the probability of a
farmer to join to FL by 28%, holding the rest of the explanatory variables constant.
Meanwhile, the variable is negative and significant at a 5% level of significance for farmers
choosing Olam. The marginal effect of farms with only cocoa crops decreases a farmer's
probability of joining Olam by 19%. One of the reasons is that farmers in Manabí have mixed
farms, which means they use various crops in the same plot due to the farms' sizes.

28
Income diversification is explained as the number of income sources a farmer has. Income
sources can be from farm activities and off-farm activities. The marginal effect of having
additional income sources decreases the probability of joining FL by 7% at a 5% confidence
interval. Inversely, the likelihood increases by 9% when a farmer selects Olam. Intercropping
system; mix farms increased the probability of joining Olam, which means then that income
sources will also positively affect the decision-making process because the number of
multiple crops explains the number of income sources. Appendix 7 shows a table of the
predicted probabilities of an individual choosing one of the alternatives in the estimation
sample and the summary of predicted outcomes.
6.2 Sustainability schemes and their effect on a higher income
The results of table 12, determinants on income (income per year in USD), shows that when
regressing for the whole sample (n=132) without making any segregation by type of
sustainability program, household and farm characteristics such as education, income
diversification, farm size, yield and program experience have a positive effect on income.
Production costs have a negative effect on the model. Explanatory variables such as
livelihood diversification, farm size, production costs, yield, experience in the program
(years), are statistically significant at 1% level of confidence, and education of the household
head is significant at a 5% level of confidence, holding all other variables constant.
Table 12. Results of regression on determinants affecting the farmer’s income
Note: Standard errors are reported in parenthesis, ***p<0.01; **p<0.05; *p<0.1. Source:
Survey data computation based on multiple regression model on income in Stata/IC 16.1.
Experience is measured as the number of years in farming. Working experience in agriculture
was asked in class intervals during the survey. For the regression, the intervals were
transformed into continuous numbers by calculating the median of the intervals. The same
Variables Coefficient Std. Err. t
Education of household head (years) 0.03492 0.01471 2.37 0.02 ** 0.00580 0.06404
Years working in farming cocoa 0.00180 0.00277 0.65 0.52 -0.00369 0.00729
Livelihood diversification 0.22784 0.05584 4.08 0.00 * 0.11729 0.33838
Labour 0.04176 0.12007 0.35 0.73 -0.19592 0.27944
Farm size 0.07657 0.01352 5.66 0.00 * 0.04981 0.10334
Average production cost (only cocoa) -0.24178 0.09710 -2.49 0.01 * -0.43399 -0.04958
Cocoa Yield 0.04473 0.01227 3.64 0.00 * 0.02043 0.06903
Experience in Sustainability Scheme 0.20805 0.05403 3.85 0.00 * 0.10109 0.31500
Type of sustainability scheme (VVS=1) -0.01884 0.10974 -0.17 0.86 -0.23608 0.19839
Constant 6.89313 0.35034 19.68 0.00 6.19959 7.58667
Number of obs = 132
F(9, 122) = 8.48
Prob > F = 0.0000
R-squared = 0.3847
Adj R-squared = 0.3393
Root MSE = 0.47672
P>|t|
[95% Conf.
Interval]
Dependent variable = Log I ncome

29
technique, the median of each interval, was used for education and years of experience in the
sustainability program. Yield is calculated based on the number of bags sold the previous year
and the number of hectares of cocoa planted calculated from the question of intercrop
"cacao". The amount only indicates an approximate productivity per hectare of cacao.
However, it does not consider cocoa trees ratio per hectare or distribution of crops when it is a
mixed farm type.
For the analysis, the multiple regression model is perform by each sustainability scheme
(variable type of program: VSS = FT & FL; SSP = Olam). In this way, it is possible to see
each effect of the farmer's income determinants according to the sustainability group. Due to
the small sample size, the significance levels found in the regression of the full sample
changed when running the regressions for each sustainability scheme. For every regression,
the sample was adjusted to the size of each group. Table 13 contains the three regression
results for the full sample including all groups, then a regression per sustainability scheme
VSS, and SSP. The table summarizes the first model (1) for FT and FL together under the
VSS group and SSP is for Olam. The log-transformed outcome variable must be considered to
evaluate the effects on income itself for interpreting the results. To interpret the amount of
change in the income, is necessary to first exponentiate the coefficients of each variable to
obtain the exponential of each, and to calculate the percent change we subtract this result and
then multiply it by 100.
Table 13. Estimated effects of suggested determinants on income model 1.
Note: Standard errors are reported in parenthesis, ***p<0.01; **p<0.05; *p<0.1. Source:
Survey data computation based on multiple regression model on income in Stata/IC 16.1
Variables All Groups
VVS
(FT & FL)
SSP
(Olam)
Education of household head (years) 0,035* 0.028 0.031
-0.015 -0.018 -0.021
Years working in farming cocoa 0.002 -0.002 0,011*
-0.003 -0.003 -0.004
Livelihood diversification 0,228*** 0,379*** 0.1
-0.056 -0.077 -0.069
Labour 0.042 0.416 -0.105
-0.12 -0.248 -0.127
Farm size 0,077*** 0,126*** 0.032
-0.014 -0.021 -0.016
Average production cost (only cocoa) -0,242* -0.058 -0,328*
-0.097 -0.127 -0.131
Cocoa Yield 0,045*** 0,037** 0,041*
-0.012 -0.014 -0.02
Experience in Sustainability Scheme 0,208*** 0,201** 0,185*
-0.054 -0.063 -0.08
Type of program -0.019
-0.11
Intercept 6,893*** 5,990*** 7,550***
-0.35 -0.455 -0.477
Number of obs = 132 70 62
F(9, 122) = 8.48
F(8, 61) = 12.07
F(8, 53) = 4.57
Prob > F = 0.000 0.000 0.000
R-squared = 0.385 0.613 0.408
Adj R-squared = 0.339 0.562 0.319
Dependent variable = Log Income

30
Income diversification is positive and statically significant only for VSS group at a 1% level
of significance. The scale for income diversification is ordered from 1 to 4. Hence, an
increase in the number of income sources results in an increase in income by 46%. Surveyed
farmers had seven income sources categories: temporary crops, permanent crops, poultry,
livestock, trading, salary, or other. Out of the whole sample, the maximum number of income
sources found was four income sources. It is reasonable that higher number of income sources
increase income. This is congruent with the finding in the literature review income
diversification from farming, and non-farming activities are a livelihood strategy and help
improve livelihood outcomes, in this case, better income, as the risk is diversified and farmers
don’t rely in only one source (Jena et al., 2017; Ruben and Zuniga, 2011).
Farm size is divided into seven categorical groups, with 1-hectare interval up to 5 hectares
and then one interval of 5-hectares and finally one last interval equivalent to >10 hectares.
The median of the farm size interval is used as the explanatory variable to facilitate the
results' interpretation. The positive relationship between farm size and income for farmers
belonging to VSS can be illustrated as per every 1-ha increase in the farm size, income
increases by 13.43% per year, at a 1% level of significance and holding the rest of the
regressors constant. Larger farms also imply higher yield and higher income; this is consistent
with Vellema et al. (2015) findings.
Yield, in terms of bags per hectares, is significant at 5% for FT-FL and significant 10% for
Olam farmers showing a positive relationship with income. For every increase in yield, 1-bag
per hectare, income increases by 3.78% and 4.19% for VSS and SSP respectively, while
holding the rest of the covariates constant. In monetary terms this means an increase of USD
223 and USD 196.83 for VSS and SSP group respectively. Productivity increases income as
higher number of bags per hectare can be sold in cocoa markets. Increased productivity can
result from skills and experience (Djokoto, 2016; Ingram et al., 2018a). It can also be
anticipated that as annual income increases, it can influence the farm's size as it enables
farmers to expand their cocoa farms.
Farming experience, years working in farming, is significant when estimating for SSP group
at 10%. The coefficient has a positive effect on income, for every year of gained farming
experience income increase by 1.11%. The percentage change is very low and represents an
increase per year of USD 51. For the VSS, farming experience is not statistically significant
but is possible to see that the effect of farming experience has a negative effect on income.
Farmers belonging to Fairtrade and Fair for life have many years as members of their
sustainability program, what is more 81% of the sample were older that 45 years old.
Experience has a learning curve that starts decreasing after certain point and explains why the
sign is negative for VSS (FT, FL).
As expected, the correlation of production cost is negative to income, which means as cost
increases, income decreases. For interpreting the results, the answers should be allocated
within the scale 0-4, being the lowest 0-as "no-cost," 1- as "not important cost," up to 4- as
"very important cost." For SSP-Olam, at a 10% significance level, if production cost increases
in the rank by 1-unit, the income will decrease by 38.82%. This coefficient is relatively high
in comparison to the effect that other explanatory variables have on the income. For SSP
farmers, the mean production cost is 2.32, which is falls between the "somewhat important"
and "important" production cost rank; meanwhile, the mean for VSS farmers is 1.97, which is
one level less than the group in question. It could be explained since farmers in Olam have
higher fuel costs for transportation and water supply. The first one is the distance the farmers
have to the collection center in San Isidro. The second one is due topography of the province

31
and the location of the county. Manabí is characterized as a hilly landscape; hence irrigation is
done using water bombs that collect the water from rivers at the bottom of the hills. Water
bomb requires fuel to impulse the water up to the plantation (MAG, 2018).
Years in the program are positive and statically significant at a 5% level of significance for
farmers that are Fairtrade and Fair for life (VSS) and at a 1% level of significance for Olam
farmers, holding the rest of the variables constant. When experience in sustainability program
increases by one year, income increases by 22.26% for FT&FL. In VSS (FT & FL) the mean
of the income per year is equal to USD 5912.12; hence 22.26 percent change is equivalent to
USD 1316.03 additional per year. For Olam, a 1-year increase in program experience results
in an 20.32% increase in income. The mean of income per year for Olam is equal to USD
4697.71; the percentage change in the income represents USD 954.57 per year for every year
of experience in the program acquired by the farmer. This result is extremely rare because of
the size of the coefficient. Is important to mention that in sample there are neither farmers that
have left the program nor farmers that are conventional and doesn’t belong to any program or
farmers that choose not to enter to the program. This can be an explanation of the huge effect
of this covariate on income due to small sample size and the absence of a control group.
6.2.1 The effect of adding sustainability practices rewarded by the market to income
In equation 2 additional covariates that potentially have an effect on the farmers’ income were
included. More specifically, explanatory variables suggested in the literature as sustainability
practices rewarded by the market such as premiums, non-monetary premiums, minimum floor
prices, training intensity. Also, variables such as access to market information, inputs and
technology were included in the regression, but these variables are measured as the farmer’s
perception of suggested benefits of a sustainability program. After including all the suggested
additional variables to the income equation and regressing for the whole sample (n=132), only
the effect on livelihood diversification did not change in significance. The first set of
variables related to household characteristic either changed in significance level or lost the
significance statically, results can be found in table 14. This statistical technique allows
testing of the relationship between the two variables and assessment of how the relationship is
affected by the grouping.
Out of the 6 new variables included in the model (equation 2), the results indicate that when
estimating for the whole sample without group segregation, only the variable minimum floor
price (MNP) is positive and significant at 1% level of confidence. When estimating per group,
minimum floor price is significant at 10% for the VSS, but the magnitude of the coefficient is
so small that when converting into percentage change the effect of minimum floor prices on
income is 0.14%. This means that for every USD 1 increase in the MFP, the farmers’ income
increases by 0.14%, which is USD 8.27 per year. Minimum floor price refers to the price
established by the programs: Fairtrade and Fair for life, and prices are established by metric
ton of dried cocoa beans. Olam group (SSP) doesn’t have a minimum floor prices hence the
variable was omitted when regressing for the group. The results are consistent with Chiputwa
et al. (2015) findings in which that minimum floor prices increase farmers’ income. Is also
important to consider that an increase of USD 8.27 per year is relative low even in a
developing country as is Ecuador, Dammert and Mohan (2015) wrote that minimum prices
improve farmers’ income only when the international price is lower than the minimum price;
otherwise, farmers receive the market price, which does not necessarily mean a higher profit.
Another important characteristic of sustainability program are the premiums they provide to
their farmers groups. In the regression, when including the covariate monetary premiums, the

32
effect on income is only significant for farmers belonging to SSP. The effect is positive and
increases income by 0.69%. Monetary premiums in Olam are based on the workshops the
farmers’ affiliate, for example if there’s an improvement in their agricultural practices,
following technical trainings, farmers receive a compensation for their efforts in reducing
fertilizers usage or in implementing agroforestry systems in their farms. These monetary
premium increases income by USD 32.41 per year. For the fair-trade groups (FT, FT) the
monetary premium is not significant for the regression, this is reasonable as these premiums
are given to their cooperative for improvement in infrastructure or developing projects in their
communities, therefore farmers don’t receive that money in their hand, but they receive it in-
kind.
Table 14. Estimated effects of suggested determinants on better income when adding
sustainability rewards
Note: Standard errors are reported in parenthesis, ***p<0.01, **p<0.05, *p<0.1. Source:
Survey data computation based on multiple regression model on income in Stata/IC 16.1
(1) (2) (1) (2) (1) (2)
Variables
Education of household head (years) 0,035* 0.028 0.028 0.019 0.031 0.023
-0.015 -0.014 -0.018 -0.02 -0.021 -0.021
Years working in farming cocoa 0.002 0.003 -0.002 -0.003 0,011* 0,009*
-0.003 -0.003 -0.003 -0.003 -0.004 -0.004
Livelihood diversification 0,228*** 0,188*** 0,379*** 0,335*** 0.1 0.08
-0.056 -0.053 -0.077 -0.077 -0.069 -0.07
Labour 0.042 -0.08 0.416 -0.046 -0.105 -0.101
-0.12 -0.115 -0.248 -0.301 -0.127 -0.123
Farm size 0,077*** 0,045** 0,126*** 0,086** 0.032 0.025
-0.014 -0.015 -0.021 -0.03 -0.016 -0.017
Average production cost (only cocoa) -0,242* -0.148 -0.058 -0.075 -0,328* -0.181
-0.097 -0.095 -0.127 -0.133 -0.131 -0.142
Cocoa Yield 0,045*** 0,029* 0,037** 0.025 0,041* 0,042*
-0.012 -0.012 -0.014 -0.015 -0.02 -0.019
Experience in Sustainability Scheme 0,208*** 0.078 0,201** 0.09 0,185* 0.124
-0.054 -0.057 -0.063 -0.078 -0.08 -0.086
Type of program -0.019 -0.045
-0.11 -0.152
Premium received 0.001 0 0,007*
-0.001 -0.001 -0.003
Other non-monetary premiums (intensity) 0.012 -0.028 0.044
-0.047 -0.072 -0.063
Minimum floor prices 0,000*** 0,000*
0 0
Training Intensity 0.062 0,129* 0.029
-0.033 -0.06 -0.039
Perceived access to market information 0.033 0.024 0.011
-0.033 -0.051 -0.045
Perceived access to inputs and technology 0.021 0.004 0.022
-0.03 -0.039 -0.048
Intercept 6,893*** 7,110*** 5,990*** 6,892*** 7,550*** 7,278***
-0.35 -0.375 -0.455 -0.586 -0.477 -0.529
Number of obs = 132 132 70 70 62 62
Prob > F = 0.000 0.000 0.000 0.000 0.000 0.000
R-squared = 0.385 0.510 0.613 0.670 0.408 0.512
Adj R-squared = 0.339 0.446 0.562 0.586 0.319 0.379
omitted
Dependent variable = Log Income
All Groups VVS : (FT & FL) SSP : (Olam)

33
Sustainability programs invest a lot of time and money in providing trainings to their target
farmer groups. According to Utting (2009) and Fenger et al. (2017), certifications can
positively impact the income through capacity building and capacity building refers to
providing to farmers access to skills and knowledge so they can improve their livelihood
outcome, in this case income. In the regression model, the variable training intensity is
measured as the counts of trainings received per topic. As per the results of the model, higher
training intensity doesn’t translate into higher income, SSP (Olam group) has higher number
of trainings received, the mean is 3.40 meanwhile for VSS the mean is only half of it: 1.19.
Though, training intensity is only significant for VSS, at 10% level of confidence, holding the
rest of variables constant, the effect is positive and as training intensity increases by 1 unit the
income increase 13.73% per year, in dollars is equivalent to USD 811.73 per year.
Is important to mention that trainings has a focus on improvement of agricultural practices,
and according to Akinwale et al. (2019) and Ruben (2017): better agricultural practices and
quality improvements derive higher income benefits. For farmers belonging to Olam group,
the sustainability program is very young, only has 3 years in the market, extension services
such as training intensity and non-monetary premiums should have resulted in higher income.
Even though both covariates aren’t statistically significant, we can see that the coefficient
goes in the right direction, both variables have a positive effect on income. And finally,
variables related to the perception of the farmers in regard to access to information and inputs
at lower prices, both variables are also not statically significant for either of the sampled
groups, but both coefficients are positive, implying that the effect on income is positive. The
results goes in line with Ingram et al. (2018a) who found that information, inputs, and other
cocoa farmers' services lead to better crops, better income, and increased livelihood outcomes.

34
7 Conclusions The purpose of this thesis was to analyze the effects of various sustainability programs in the
cocoa sector in Ecuador. The research objective was to understand how different
sustainability programs operate in the country and learn more about their motivations in the
economic sustainability of the cocoa sector. Secondly, the study aim to find the effect of
different determinants on better income of on smallscale cocoa producers in Ecuador. Results
point to very different effects across programs, but are consistent with the findings in the
literature. To understand how sustainability programs work, it is important to know what are
the efforts that they are doing related to social, economic and environmental aspects of the
value chain. Two main groups participate in this research, the first group was identified as
Voluntary Sustainability Standards, Fairtrade and Fair for life, which are international
organizations that certify different actor across the value chain. Those stakeholders must
comply with the international standard. The second group is know as Sustainable Sourcing
Practices (SSP), in this group Olam Ecuador participated. Companies engage with their
suppliers and customers through SSP, this scheme is not complying with any international
standard, but companies report the results of their sustainability practices.
Organizations and companies have adjusted to current trends in the food industry, customers
increasing preferences for sustainable trade, and also have recognized the significance of
addressing key issues in the cocoa industry. This can be seen as per the prominent number of
cocoa-initiatives in the market to tackle down ethical and environmental concerns. For
companies to be competitive in the market, they must be reliable, and is only possible trough
verification, monitoring and control. Fairtrade, Fair for life, Olam are positive examples on
how sustainability programs can contribute to changes in the farmers’ livelihood and producer
associations.
The findings of this study about the factors that motivates a farmers choice for a sustainability
sheme are for VSS are that age, literacy, and farming experience enhances the probability of
farmer’s participation in fair trade cocoa market. On the other hand, larger farm sizes reduces
the likelihood of farmer’s participation in fair trade cocoa market. Male household is less
likely to choose Fair for life. For Olam, education and age decreases the probability to
choosing their program, and labor, income diversification, and larger farm sizes increases the
probability. Is also important to stress that even that the farmers were randomly interviewed
and that farmers are free to choose a sustainability scheme, the location of the program plays
an important role in their decision process.
Results from the multiple regression model confirms that income earning increment from
cocoa sector seeks for long period accumulated program experience, larger cocoa farm,
livelihood diversification, participation in training, yield, farming experience. Minimum floor
prices only have a positive effect on Farmers belonging to FT and FL, meanwhile monetary
premiums increase income only for farmers belonging to Olam. On the other hand, average
production costs tend to reduce income derived from cocoa. The experience in the program
should be interpreted with precaution because the variable might be influence by other
variables that were not included in the model such as level of satisfaction with the program,
hence omitted variables bias in the model can lead into a overestimatted other coefficients.
Limitations such as that the sample size is not large enough, and also limitations of selection
bias of the sample can lead to understimated and overstimated results. Simultanous bias exists
in the present thesis and it causes results to be inneficient. While economic growth may be
essential for poverty reduction, it also depends on the capabilities of the farmers to take
advantage of expanding economic opportunities. Secondly, smallholders know their own
35
situation but are often excluded in the design of policies and interventions that are intended to
better their life. Finally, majority of smallholders have a low income, low income is also
transferred to other dimensions such as: illiteracy, lack of social services, health issues,
vulnerability and feelings of powerlessness in general.
Future research, given the limitations of the thesis, many of the estimates risk suffering from
simultaneous bias hence it would be of interest to identify an instrumental variable that could
correct for these biases. It would of interest to use a control group without any certification or
affiliation to see the factors influencing cocoa farmers' sustainability program choice. Results
from adding additional covariates to estimate the effect of sustainability practices rewarded by
the market didn’t reveal any significance, and to better analyze the effect of the sustainability
programs in the farmers’ income, in the future, similar studies should also include a control
group, so estimations can be compared among the groups. Finally, a focus only on the income
alone underestimate the impact of interventions in smallholders' welfare, it is a suggestion for
future research to analyze this.
36
Bibliography
Literature and publications
Aidoo, R., Fromm, I., 2015. Willingness to adopt certifications and sustainable production
methods among small-scale cocoa farmers in the Ashanti region of Ghana. J. Sustain.
Dev. 8, 33–43. https://doi.org/10.5539/jsd.v8n1p33
Akinwale, J.A., Ojerinde, K.D., Owoade, E.O., 2019. Determinants of farm certification
compliance for sustainable cocoa production in Ondo State, Nigeria. J. Agric. Environ.
Int. Dev. 113, 97–112. https://doi.org/10.12895/jaeid.20191.930
Balineau, G., Bernath, S., Pahuatini, V., 2016. Cocoa farmers’ agricultural practices and
livelihoods in Cote d’Ivoire, Nothes Techniques.
Barrientos, S., 2016. Beyond Fair Trade: Why are Mainstream Chocolate Companies
Pursuing Social and Economic Sustainability in Cocoa Sourcing? . In: M. P. Squicciarini
& J. Swinnen, eds. The Economics of Chocolate. Oxford: Oxford University Press, pp.
213 - 227.
Berlan, A., 2016. Child Labour, Education and Child Rights Among Cocoa Producers in
Ghana. In: C. van den Anker, ed. Palgrave Texts in International Political Economy.
London: Palgrave Macmillan, pp. 158-178.
Beuchelt, T.D., Zeller, M., 2011. Profits and poverty: Certification’s troubled link for
Nicaragua’s organic and fairtrade coffee producers. Ecol. Econ. 70, 1316–1324.
https://doi.org/10.1016/j.ecolecon.2011.01.005
Bray, J.G., Neilson, J., 2017. Reviewing the impacts of coffee certification programmes on
smallholder livelihoods. Int. J. Biodivers. Sci. Ecosyst. Serv. Manag.
https://doi.org/10.1080/21513732.2017.1316520
Chambers, R., Conway, G.R., 1992. Sustainable rural livelihoods: practical concepts for the
21st century. IDS Discuss. Pap. 296.
Chiputwa, B., Spielman, D.J., Qaim, M., 2015. Food standards, certification, and poverty
among coffee farmers in Uganda. World Dev. 66, 400–412.
https://doi.org/10.1016/j.worlddev.2014.09.006
Clark, P., Martínez, L., 2016. Local alternatives to private agricultural certification in
Ecuador: Broadening access to “new markets”? J. Rural Stud. 45, 292–302.
https://doi.org/10.1016/j.jrurstud.2016.01.014
Dragusanu, R., Giovannucci, D. & Nunn, N., 2014. The Economics of Fair Trade. Journal of
Economic Perspectives, 28(3), p. 217–236.
Dammert, A.C., Mohan, S., 2015. A survey of the economics of fair trade. J. Econ. Surv. 29,
855–868. https://doi.org/10.1111/joes.12091
Davies, S., Hossain, N., 1997. Livelihood Adaptation, Public Action and Civil Society: A
Review of the Literature (No. 57), IDS working papers. Brighton.
DeFries, R.S., Fanzo, J., Mondal, P., Remans, R., Wood, S.A., 2017. Is voluntary certification
of tropical agricultural commodities achieving sustainability goals for small-scale
producers? A review of the evidence. Environ. Res. Lett. 12.
https://doi.org/10.1088/1748-9326/aa625e
Díaz-Montenegro, J., Varela, E., Gil, J.M., 2018. Livelihood strategies of cacao producers in
Ecuador: Effects of national policies to support cacao farmers and specialty cacao
landraces. J. Rural Stud. 63, 141–156. https://doi.org/10.1016/j.jrurstud.2018.08.004
Djokoto, J.G., 2016. Ghanaian fair-trade cocoa-producing households’ livelihood
diversification and efficiency. Int. J. Green Econ. 10, 191–212.
https://doi.org/10.1504/IJGE.2016.080536
Fenger, N., Skovmand Bosselmann, A., Asare, R., de Neergaard, A., 2017. The impact of
certification on the natural and financial capitals of Ghanaian cocoa farmers. Agroecol.

37
Sustain. Food Syst. 41, 143–166. https://doi.org/10.1080/21683565.2016.1258606
Gayi, S. K. & Tsowou, K., 2016. Cocoa industry: Integrating small farmers into the global
value chain, New York and Geneva: United Nations.
Glasbergen, P., 2018. Smallholders do not Eat Certificates. Ecol. Econ. 147, 243–252.
https://doi.org/10.1016/j.ecolecon.2018.01.023.
Ingram, V., van Rijn, F., Waarts, Y., Dekkers, M., de Vos, B., Koster, T., R., T., A., G.,
2018a. Towards Sustainable Cocoa in Cote d’Ivoire: The impacts and contribution of
UTZ certification combined with services provided by companies. Wageningen.
Ingram, V., van Rijn, F., Waarts, Y., Gilhuis, H., 2018b. The impacts of cocoa sustainability
initiatives in West Africa. Sustain. 10, 1–20. https://doi.org/10.3390/su10114249
Ingram, V., 2015. The true Price of Chocolate?. Agro Food Industry Hi Tech, 26(1), pp. 42-
46.
Iritié, B.G.J.J., Djaléga, F.S., 2016. Diversification of income sources for cocoa farm
households: a case study of the Central West of Cote d’Ivoire. African J. Econ. Sustain.
Dev. 5, 230. https://doi.org/10.1504/ajesd.2016.077412
Jaffee, D., Howard, P.H., 2016. Who’s the fairest of them all? The fractured landscape of U.S.
fair trade certification. Agric. Human Values 33, 813–826.
https://doi.org/10.1007/s10460-015-9663-2
Jena, P.R., Stellmacher, T., Grote, U., 2017. Can coffee certification schemes increase
incomes of smallholder farmers? Evidence from Jinotega, Nicaragua. Environ. Dev.
Sustain. 19, 45–66. https://doi.org/10.1007/s10668-015-9732-0
LalwanI, S. K., Nunes, B., Chicksand, D. & Boojihawon, D. K., 2018. Benchmarking self-
declared social sustainability initiatives in cocoa sourcing. Benchmarking: An
International Journal, 25(9), pp. 3986-4008.
Lalwani, S.K., Nunes, B., Chicksand, D., Boojihawon, D.K., 2018. Benchmarking self-
declared social sustainability initiatives in cocoa sourcing. Benchmarking An Int. J. 25,
3986–4008. https://doi.org/https://doi.org/10.1108/BIJ-07-2017-0186
Lamolle, M., Cabrera de Leicht, S., Taimasova, R., Russillo, A., 2019. Future Role of
Voluntary Sustainability Standards: Towards Generation 3.0?, in: Schmidt, Michael;
Giovannucci, Daniele; Palekhov, Dmitry; Hansmann, B. (Ed.), Sustainable Global Value
Chains. Springer Nature Switzerland, Cham. https://doi.org/10.1007/978-3-319-14877-9
Marsh, R.R., 2003. Working with local institutions to support sustainable livelihoods. Food
and Agriculture Organization of the United Nations, Rome.
Mazzocchini, M., 2008. Statistics for marketing and consumer research.
Meemken, E.M., Sellare, J., Kouame, C.N., Qaim, M., 2019. Effects of Fairtrade on the
livelihoods of poor rural workers. Nat. Sustain. 2, 635–642.
https://doi.org/10.1038/s41893-019-0311-5
Mithöfer, D., Roshetko, J.M., Donovan, J.A., Nathalie, E., Robiglio, V., Wau, D., Sonwa,
D.J., Blare, T., 2017. Unpacking ‘sustainable’ cocoa: do sustainability standards,
development projects and policies address producer concerns in Indonesia, Cameroon
and Peru? Int. J. Biodivers. Sci. Ecosyst. Serv. Manag. 13, 444–469.
https://doi.org/10.1080/21513732.2018.1432691
Mitiku, F., Mey, Y. de, Nyssen, J., Maertens, M., 2017. Do private sustainability standards
contribute to income growth and poverty alleviation? A comparison of different coffee
certification schemes in Ethiopia. Sustain. 9. https://doi.org/10.3390/su9020246
Morse, S., McNamara, N., 2013. The Theory Behind the Sustainable Livelihood Approach,
in: Sustainable Livelihood Approach. Springer Dordrecht, Dordrecht, pp. 15–60.
https://doi.org/10.1007/978-94-007-6268-8
Oldendick, R.W., 2012. Survey Research Ethics, in: Gideon, L. (Ed.), Handbook of Survey
Methodology for the Social Sciences. Springer, New York, pp. 22–35.
https://doi.org/10.1007/978-1-4614-3876-2

38
Oya, C., Schaefer, F., Skalidou, D., 2018. The effectiveness of agricultural certification in
developing countries: A systematic review. World Dev. 112, 282–312.
https://doi.org/10.1016/j.worlddev.2018.08.001
Ruben, R., 2017. Impact assessment of commodity standards: Towards inclusive value chains.
Enterp. Dev. Microfinance 28, 82–97. https://doi.org/10.3362/1755-1986.16-00020
Ruben, R., Fort, R., 2012. The Impact of Fair Trade Certification for Coffee Farmers in Peru.
World Dev. 40, 570–582. https://doi.org/10.1016/j.worlddev.2011.07.030
Ruben, R., Zuniga, G., 2011. How standards compete: Comparative impact of coffee
certification schemes in Northern Nicaragua. Supply Chain Manag. 16, 98–109.
https://doi.org/10.1108/13598541111115356
Salmon, G., 2002. Round table on Sustainable Development. Voluntary Sustainability
Standards and Labels (VSSLs): The Case for Fostering Them, in: Eco-Labelling and
Sustainable Development. Organisation for Economic Co-operation and Development,
Paris.
Scoones, I., 1998. Sustainable Rural Livelihoods: A Framework for Analysis, IDS Working
Paper, 72. Brighton.
Sepúlveda, W.S., Ureta, I., Mendoza, C., Chekmam, L., 2018. Ecuadorian Farmers Facing
Coffee and Cocoa Production Quality Labels. J. Int. Food Agribus. Mark. 30, 276–290.
https://doi.org/10.1080/08974438.2017.1413612
Serrat, O., 2017. The Sustainable Livelihoods Approach, in: Knowledge Solutions. Springer
Singapore, Singapore, pp. 21–26. https://doi.org/10.1007/978-981-10-0983-9
Ssebunya, B.R., Schader, C., Baumgart, L., Landert, J., Altenbuchner, C., Schmid, E., Stolze,
M., 2019. Sustainability Performance of Certified and Non-certified Smallholder Coffee
Farms in Uganda. Ecol. Econ. https://doi.org/10.1016/j.ecolecon.2018.09.004
Thorlakson, T., 2018. A move beyond sustainability certification: The evolution of the
chocolate industry’s sustainable sourcing practices. Bus. Strateg. Environ. 27, 1653–
1665. https://doi.org/10.1002/bse.2230
Thorlakson, T., De Zegher, J.F., Lambin, E.F., 2018. Companies’ contribution to
sustainability through global supply chains. Proc. Natl. Acad. Sci. U. S. A. 115, 2072–
2077. https://doi.org/10.1073/pnas.1716695115
Utting, K., 2009. Assessing the impact of fair trade coffee: Towards an integrative
framework. J. Bus. Ethics 86, 127–149. https://doi.org/10.1007/s10551-008-9761-9
Valkila, J., Nygren, A., 2010. Impacts of Fair Trade certification on coffee farmers,
cooperatives, and laborers in Nicaragua. Agric. Human Values 27, 321–333.
https://doi.org/10.1007/s10460-009-9208-7
Vellema, W., Buritica Casanova, A., Gonzalez, C., D’Haese, M., 2015. The effect of specialty
coffee certification on household livelihood strategies and specialisation. Food Policy 57,
13–25. https://doi.org/10.1016/j.foodpol.2015.07.003
Wooldridge, J.M., 2010. Econometric analysis of cross section and panel data, Second. ed.
The MIT Press, London.
Internet
ANECACAO, 2018. Resumen Mensual de Estadisticas 2018, Guayaquil: The National
Association of Ecuador’s Cocoa Exporters and Industrials.
BCE, 2018. Percentage Share of Main Products Export (FOB), Quito: Central Bank of
Ecuador.
Bloomberg, 2019. Generic 1st 'Cocoa' Future. [Online]
Available at: https://www.bloomberg.com/quote/CC1:COM
[Accessed 08 February 2019].
Bloomberg, 2020. Generic 1st 'Cocoa' Future. [Online]

39
Available at: https://www.bloomberg.com/quote/CC1:COM
[Accessed 08 February 2020].
Cecao, 2019. About us. [Online]
Available at: http://www.cecao.ec/?page_id=509
[Accessed 15 December 2019].
CECJ, 2008. Coordinadora Ecuatoriana de Comercio Justo. [Online]
Available at: http://www.cecjecuador.org.ec
[Accessed 31 January 2019].
ESPAC-INEC, 2017. Encuesta de Superficie y Producción Agropecuaria Continua, Ecuador:
Instituto Nacional de Estadística y Censos.
Fair for Life, 2018. Fair For Life programme. [Online]
Available at: www.fairforlife.org
[Accessed 15 December 2019].
Fair for Life, 2019. Key Aspects - Fair for Life. [Online]
Available at:
https://www.fairforlife.org/pmws/indexDOM.php?client_id=fairforlife&page_id=differe
nce&lang_iso639=en
[Accessed 14 December 2019].
Fairtrade International, 2018. Fairtrade Foundation. [Online]
Available at: www.fairtrade.net
[Accessed December 2018].
Fairtrade, 2016. Commodity briefing: Cocoa, London: Fairtrade Foundation.
Fountain, A. & Huetz-Adams, F., 2018. Cocoa Barometer. [Online]
Available at: http://www.cocoabarometer.org/Cocoa_Barometer/Download.html
[Accessed 09 February 2019].
ICCO, 2018. Quarterly Bulletin of Cocoa Statistics, Vol. XLIV, No. 3, Cocoa year 2017/18,
London: International Cocoa Organization.
INEC, 2019. Canasta Familiar Basica (CFB), Quito: INEC.
MAG, 2018. Rendimientos De Cacao Almendra Seca (Theobroma Cacao) En El Ecuador
2017, Quito: Ministerio de Agricultura y Ganaderia.
MAGAP, 2020. Precios Mensuales de Agroindustria, Quito: Ministerio de Agricultura.
MAG-SIPA, 2020. Precios Mensuales de Agroindustria, Quito: Ministerio de Agricultura.
Ministerio del Trabajo, 2018. Incremento del Salario Básico Unificado 2019. [Online]
Available at: http://www.trabajo.gob.ec/incremento-del-salario-basico-unificado-2019/
[Accessed April 2020].
New Food Economy, 2018. newfoodeconomy.org. [Online]
Available at: https://newfoodeconomy.org/chocolate-farmers-ivory-coast-ghana/
[Accessed January 2019].
Olam, 2017. Olam Cocoa Sustainability, Singapore: Olam International.
Olam, 2018. AtSource. [Online]
Available at: https://www.atsource.io
[Accessed 05 April 2020].
Olam, 2019. Cocoa Compass. [Online]
Available at: https://www.olamgroup.com/content/olamgroup/en/home-
page/products/confectionery-beverage-ingredients/cocoa/cocoa-sustainability.html
[Accessed 05 April 2020].
Olam, 2019. Olam Supplier Code. [Online]
Available at: https://www.olamgroup.com/about-olam/ethics-and-compliance.html
[Accessed 01 March 2020].
Olam, 2019. Plantations, Concessions & Farms Code. [Online]
Available at: https://www.olamgroup.com/sustainability/policies-codes-

40
standards/plantations-concessions-farms-code.html
[Accessed 01 March 2020].
Olam, 2019. Policies, Codes & Standards. [Online]
Available at: https://www.olamgroup.com/sustainability/policies-codes-standards.html
[Accessed 01 2020 March].
Olam, 2019. Sustainability. [Online]
Available at: https://www.olamgroup.com/sustainability.html
[Accessed 01 March 2020].
Olam, 2020. About us. [Online]
Available at: https://www.olamgroup.com/about-olam.html
[Accessed 17 March 2020].
Sustainability Trade Map, 2020. Fair for Life Summary. [Online]
Available at: https://www.sustainabilitymap.org/review-standards?short_list=141
[Accessed 10 April 2020].
True Price & Sustainable Trade Initiative, 2016. The True Price of Cocoa from Ivory Coast,
Amsterdam: IDH & True Price.
UNOCACE, 2O19. Unión de Organizaciones Campesinas Cacaoteras. [Online]
Available at: http://www.unocace.com/en/
[Accessed 1 August 2019].
Whoriskey, P. & Siegel, R., 2019. The Washington Post. [Online]
Available at: https://www.washingtonpost.com/graphics/2019/business/hershey-nestle-
mars-chocolate-child-labor-west-africa/?noredirect=on
[Accessed June 2019].
World Bank Group, 2018. The World Bank Group. [Online]
Available at: www.worldbank.org
[Accessed December 2018].
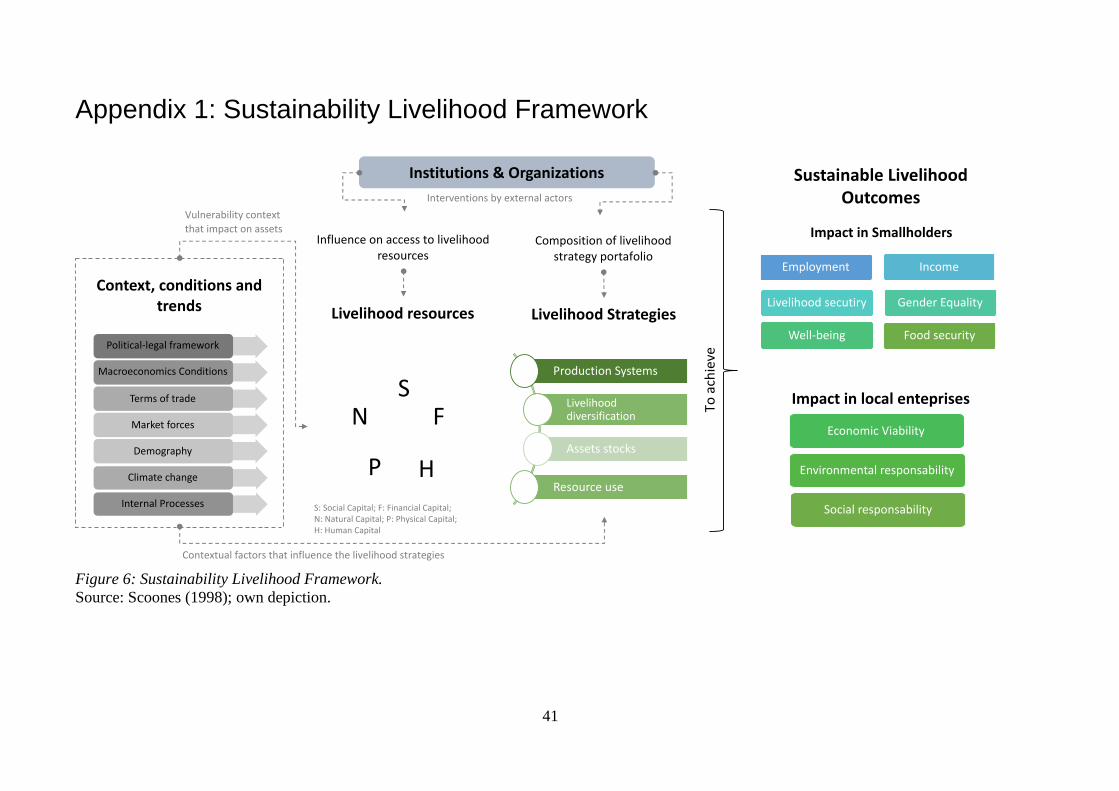
41
Appendix 1: Sustainability Livelihood Framework
Figure 6: Sustainability Livelihood Framework.
Source: Scoones (1998); own depiction.
Livelihood Strategies
Production Systems
Livelihood diversification
Assets stocks
Resource use
To a
chie
ve
Sustainable Livelihood Outcomes
Impact in Smallholders
Employment Income
Livelihood secutiry Gender Equality
Well-being
Impact in local enteprises
Economic Viability
Environmental responsability
Social responsability
Food security
FS
HP
N
Livelihood resources
S: Social Capital; F: Financial Capital; N: Natural Capital; P: Physical Capital; H: Human Capital
Context, conditions and trends
Political-legal framework
Macroeconomics Conditions
Terms of trade
Market forces
Demography
Climate change
Internal Processes
Contextual factors that influence the livelihood strategies
Vulnerability context
that impact on assets
Institutions & Organizations
Influence on access to livelihood resources
Composition of livelihood strategy portafolio
Interventions by external actors

42
Appendix 2. List of towns and villages where interviews were conducted
Province/State County/Parishes Municipality Villages # of farmers
Guayas
Milagro Milagro
Buenos Parte 2
Creo en Dios 1
El Paraiso 1
La Puntilla 11
La Sepa 1
Piñoelal 1
San Gerardo 1
Santa Rosa 2 4
Tengel 3
Yaguachi Yaguachi
Voluntad de Dios 2
Yaguachi 1
El Deseo 40
La Chiquita 2
Manabi Sucre San Isidro
Dominguillo 5
El Balsamo 1
Eloy Alfaro 1
La Industria 1
Las Mercedes 4
Many 1
Muchique 2 5
Mumi 1
Palmar 7
San Isidro 35
Santa Teresa 1
Grand Total 132
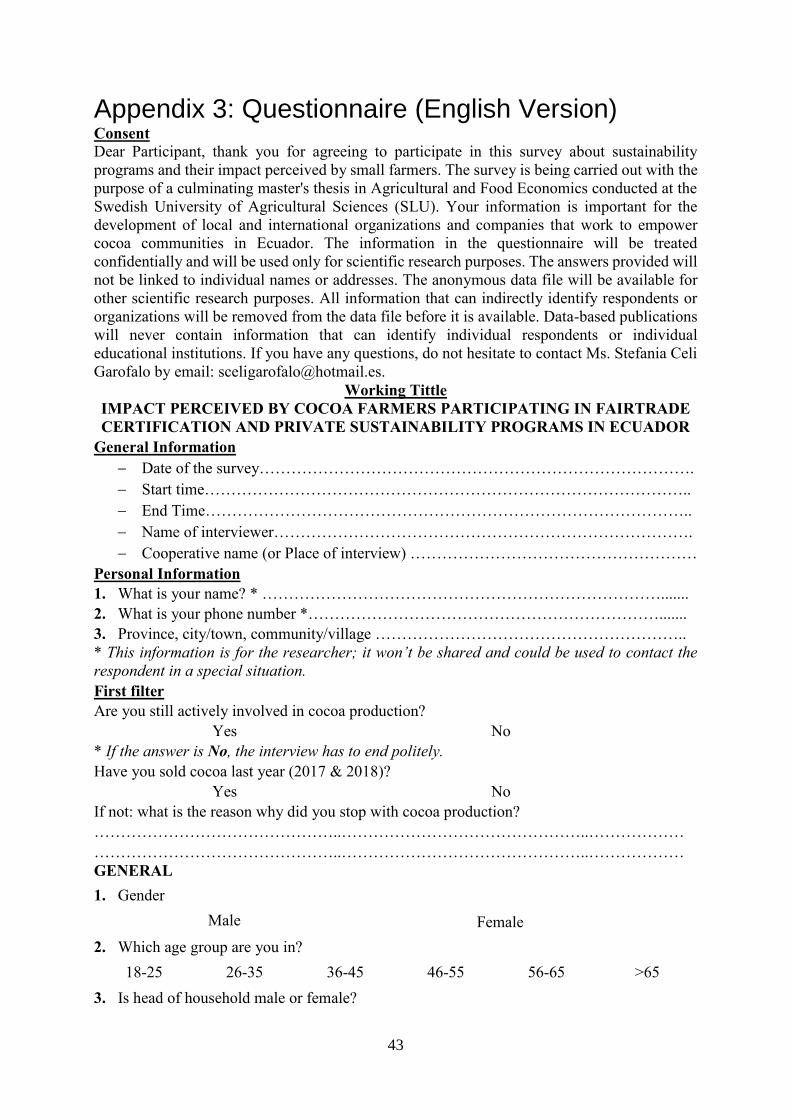
43
Appendix 3: Questionnaire (English Version) Consent
Dear Participant, thank you for agreeing to participate in this survey about sustainability
programs and their impact perceived by small farmers. The survey is being carried out with the
purpose of a culminating master's thesis in Agricultural and Food Economics conducted at the
Swedish University of Agricultural Sciences (SLU). Your information is important for the
development of local and international organizations and companies that work to empower
cocoa communities in Ecuador. The information in the questionnaire will be treated
confidentially and will be used only for scientific research purposes. The answers provided will
not be linked to individual names or addresses. The anonymous data file will be available for
other scientific research purposes. All information that can indirectly identify respondents or
organizations will be removed from the data file before it is available. Data-based publications
will never contain information that can identify individual respondents or individual
educational institutions. If you have any questions, do not hesitate to contact Ms. Stefania Celi
Garofalo by email: [email protected].
Working Tittle
IMPACT PERCEIVED BY COCOA FARMERS PARTICIPATING IN FAIRTRADE
CERTIFICATION AND PRIVATE SUSTAINABILITY PROGRAMS IN ECUADOR
General Information
Date of the survey……………………………………………………………………….
Start time………………………………………………………………………………..
End Time………………………………………………………………………………..
Name of interviewer…………………………………………………………………….
Cooperative name (or Place of interview) ………………………………………………
Personal Information
1. What is your name? * ………………………………………………………………….......
2. What is your phone number *………………………………………………………….......
3. Province, city/town, community/village …………………………………………………..
* This information is for the researcher; it won’t be shared and could be used to contact the
respondent in a special situation.
First filter
Are you still actively involved in cocoa production?
Yes No
* If the answer is No, the interview has to end politely.
Have you sold cocoa last year (2017 & 2018)?
Yes No
If not: what is the reason why did you stop with cocoa production?
………………………………………..………………………………………..………………
………………………………………..………………………………………..………………
GENERAL
1. Gender
Male Female
2. Which age group are you in?
18-25 26-35 36-45 46-55 56-65 >65
3. Is head of household male or female?

44
Male Female
4. How many people do you have in charge? (Family members) *In your charge refers to
people who regularly live in your house and who share the meal together
1 – 3 people 4 – 7 People > 7 people
5. How many years have you been working as a farmer?
<5 years 5-10 years 10-15 years 15-20 years >20 years
6. Which level of education have you achieved?
Primary Secondary High School College University Other
7. What are the major cash income sources? *Monthly estimate
Activities In USD
0 - 100 100 - 200 200 - 400 400 - 600 600 -1000 > 1000
a. Agricultural temporary crops
(e.g. rice)
b. Agricultural permanent crops
(e.g. cacao)
c. Livestock (smalls animals)
d. Livestock (large animals)
e. Trading (buying to others and
selling to the coop./company)
f. Salaries (working for others in
other activities)
g. Others, specify: …………...
FARM CHARACTERISTICS
8. What is your status in relation to the plantation? (owner, etc.)
a) Tenant
b) Administrator
c) Owner
d) Other …
* If owner, please describe:
a) Purchased
b) Heir
c) Other
9. How many people work in your farm?
1 – 3 people 4 – 7 People > 7 people
10. Can you please indicate the total size of your farm?
0-1 ha 1-2 ha 2-3 ha 3-4 ha 4-5 ha 5 – 10 ha > 10 ha
11. Are you a member of a cocoa cooperative/association?
Yes No I don’t know
12. Do you use the intercrop agriculture method?
Yes No I don’t know
If yes, which crop:
Crops: Cocoa Beans Bananas Plantain Coffee Oranges Other crops
Mark Area in ha

45
13. Rank the costs according to the importance. Only for cocoa production.
Cocoa Production Not important Somewhat
important Important
Very
important
a) Land Preparation (Only
for planting new cocoa
plants)
b) Weeding / cleaning
c) Labour Pruning
d) Chemical application
e) Labour Harvest and
splitting
f) Labour Fermentation,
drying, sorting
g) Empty bags
h) Transportation
i) Water (fuel)
j) Other costs: describe ….
COCOA PRODUCTION
14. Which quality of cocoa do you have in your plantation?
a) Conventional
b) Organic
c) Mixed
…. Which variety of cocoa trees do you have in your plantation?
a) Nacional
b) CCN51
c) Others
d) Mixed varieties
15. How do you sell your beans?
Wet beans Dry beans Both
16. How many kilos did you sell last year of cocoa? (1 quintal of 100 lb. = 46 kg.)
a) Amount .................................
b) Metric Unit ....................... (quintal / kilos / other)
c) Status …… (wet / dry)
d) I do not know
17. Has there been a change in the production of the recent year (Mar 2018 to Jan 2019)
compared to the production of the previous year (Mar 2017 to Jan 2018)?
Less than last year The same as last
year
Much more than last
year I Don’t know
CERTIFICATION / COMPANY SUSTAINABILITY PROGRAMS
18. Do you belong to any of the following programs? *Multiple answers are allowed.
a) Fairtrade: Unocace
b) Olam Cocoa Sustainability
c) Fairtrade: Kaoka
d) Nestle Cocoa Plan
e) Barry Cocoa Forever

46
f) Other
19. Do you have contract with sustainability program?
Yes No I don’t know
20. How many years have you been certified as fair-trade or have you been participating in
the companies’ sustainability program?
Program <1 year 1-2 years 2-5 years 5-10 years >10 years
Fairtrade Unocace
Olam Cocoa
Fairtrade Kaoka
Nestle Cocoa Plan
Barry Cocoa
Other…….
21. Can you please indicate the total size of your farm dedicated for any of the programs
selected above?
Program 0-1 ha 1-2 ha 2-3 ha 3-4 ha 4-5 ha 5 -10 ha >10 ha
Fairtrade Unocace
Olam Cocoa
Fairtrade Kaoka
Nestle Cocoa Plan
Barry Cocoa
Other:
22. Have you or anyone in your household participated in any of the following trainings in the
past years?
23. Have you received premiums for your cocoa that you have produced in the last year?
*(Can be other non-monetary premiums)
No
Yes *(see next question)
Not currently
Topic No training < 1 year 1-2 years
ago
2-5 years
ago
5-10 years
ago
>10 years
ago
a) School field (all topics
below together)
b) Good agricultural
practice (Cocoa
production)
c) Health and security (e.g.
secure chemicals)
d) Environmental Protection
e) Application of chemicals
f) Good social practice
(e.g.: Children's work)
g) Economic (diversification
of income….)
h) Other, please specify
……………………

47
Not yet *(see next question)
I do not know / Don’t want to answer
If yes, or not yet, how much per quintal of dry beans?
a) Amount .................................
b) Metric Unit ....................... (quintal / kilos / other) of dry beans
c) Nothing
d) Other …………………... (*see next question)
If other non-monetary premiums received please described:
e) Tools
f) Machinery
g) Inputs
h) Social help
i) Monetary (i.e.: Christmas bonus)
24. Have you received minimum support price for your cocoa during last year in the last year?
No
Yes *(see next question)
Not currently
Not yet *(see next question)
I do not know / Don’t want to answer
If yes, how much per kilos / quintal of dry beans?:
a) Amount .................................
b) Metric Unit ....................... (quintal / kilos / other) of dry beans
c) Nothing / I do not know
25. Do you think your income has changed after joining fair-trade or any of the sustainability
programs you chose above?
Program Very
Significant Significant
Neither
significant nor
insignificant
Insignificant Very
Insignificant
Fairtrade Unocace
Olam Cocoa
Fairtrade Kaoka
Nestle Cocoa Plan
Barry Cocoa
Other:
LIVELIHOOD IMPROVEMENT PERCEIVED
26. Answer following questions:
Being involved in the
certification scheme …
Strongly
Disagree
Somewh
at
disagree
Neutral Disagree Strongly
Agree
I don’t
know
No
applicabl
e
a) … has improved my income
from cocoa farm
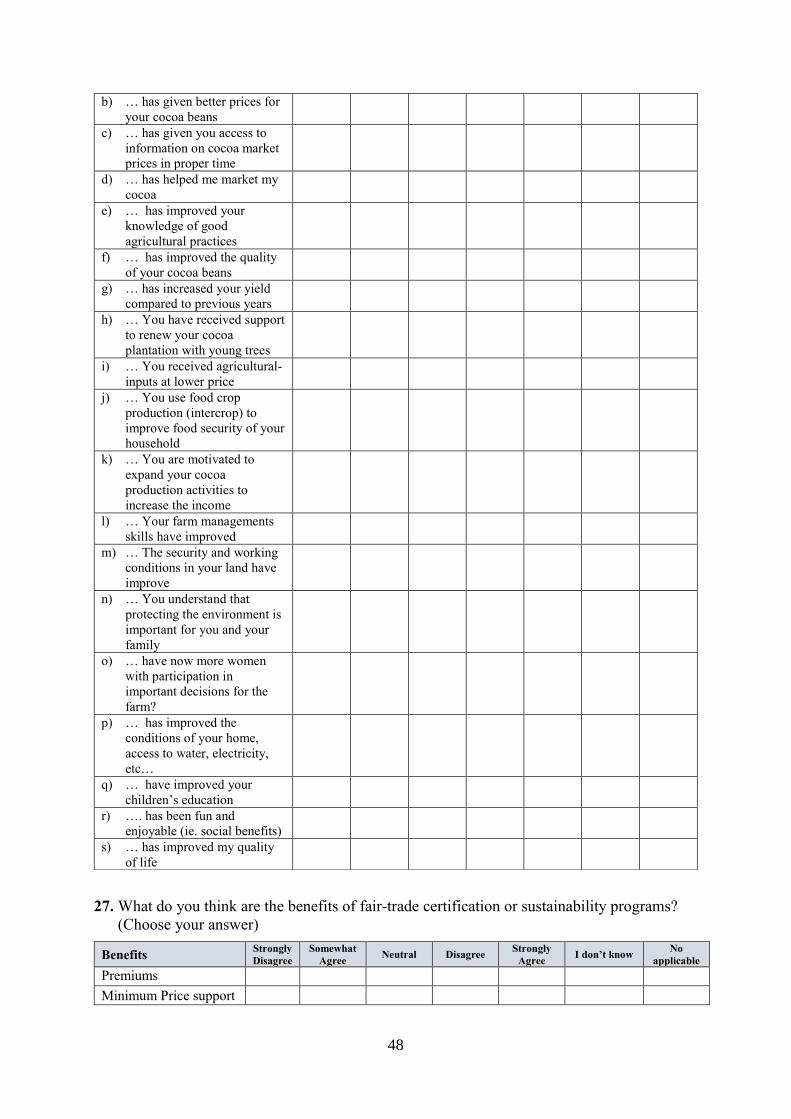
48
27. What do you think are the benefits of fair-trade certification or sustainability programs?
(Choose your answer)
Benefits Strongly
Disagree
Somewhat
Agree Neutral Disagree
Strongly
Agree I don’t know
No
applicable
Premiums
Minimum Price support
b) … has given better prices for
your cocoa beans
c) … has given you access to
information on cocoa market
prices in proper time
d) … has helped me market my
cocoa
e) … has improved your
knowledge of good
agricultural practices
f) … has improved the quality
of your cocoa beans
g) … has increased your yield
compared to previous years
h) … You have received support
to renew your cocoa
plantation with young trees
i) … You received agricultural-
inputs at lower price
j) … You use food crop
production (intercrop) to
improve food security of your
household
k) … You are motivated to
expand your cocoa
production activities to
increase the income
l) … Your farm managements
skills have improved
m) … The security and working
conditions in your land have
improve
n) … You understand that
protecting the environment is
important for you and your
family
o) … have now more women
with participation in
important decisions for the
farm?
p) … has improved the
conditions of your home,
access to water, electricity,
etc…
q) … have improved your
children’s education
r) …. has been fun and
enjoyable (ie. social benefits)
s) … has improved my quality
of life

49
Learning new and good
agricultural practices
The training received Improvement of the
knowledge cocoa
culture
Increase in volume /
productivity
I do not know
Other: …….
28. What do you think are the disadvantages of Fairtrade certification or sustainability
programs? (Choose your answer) Disadvantages Strongly
Disagree
Somewhat
Agree Neutral Disagree
Strongly
Agree
I don’t
know
No
applicable
High cost
A lot of work
It takes time
I do not know
No disadvantages
Other, specify:
29. Do you want to continue being certified over the next years?
Yes No I don’t know

50
Appendix 4: Questionnaire (Spanish) Consentimiento: Querido Participante, Gracias por aceptar participar en esta encuesta acerca
de los programas de sostenibilidad y su impacto percibido por los pequeños agricultores. La
encuesta se está llevando a cabo con el propósito de realizar una tesis de maestría en Economia
Agricola y Alimentaria realizada en la Universidad Sueca de Ciencias Agrícolas (SLU). Su
información es importante para el desarrollo de organizaciones y companias locales e
internacionales que trabajan para empoderar las comunidades cacaoteras en Ecuador. La
información en el cuestionario se tratará de manera confidencial y se usará unicamente con
fines de investigación científica. Las respuestas proporcionadas no estarán vinculadas a
nombres o direcciones individuales. El archivo de datos anónimos estará disponible para otros
fines de investigación científica. Toda la información que pueda identificar indirectamente a
los encuestados u organizaciones se eliminará del archivo de datos antes de que esté disponible.
Las publicaciones basadas en los datos nunca contendrán información que pueda identificar a
los encuestados individuales o instituciones educativas individuales. Si tiene alguna pregunta,
no dude en ponerse en contacto con la Srta. Stefania Celi Garofalo por correo electrónico:
Titulo del trabajo:
IMPACTO PERCIBIDO POR LOS PRODUCTORES DE CACAO QUE PERTENECEN EN
CERTIFICACIÓN FAIRTRADE O EN PROGRAMAS PRIVADOS DE SOSTENIBILIDAD
Información general
- Fecha de la encuesta ……………………………………………………………………
- Hora de inicio …………………………………………………………………………..
- Hora de finalización ……………………………………………………………………
- Nombre del entrevistador ………………………………………………………………
- Nombre cooperativo (o lugar de la entrevista) ………….………….………….……….
Informacion personal
- Cual es tu nombre * …………………………………………………………………….
- ¿Cuál es su número de teléfono * ………………………………………………………
- Provincia, ciudad / pueblo, comunidad / pueblo ……………………………………….
* Esta información es para el investigador, no se compartirá y podría usarse para comunicarse
con el encuestado en una situación especial.
Primer filtro
- ¿Sigues participando activamente en la producción de cacao?
Si No * Si la respuesta es No, la entrevista debe terminar cortésmente.
- ¿Has vendido cacao el año pasado (2017 y 2018)?
Si No
Si no es así, ¿por qué se detuvo con la producción de cacao?
………………………………………..………………………………………..………………
………………………………………..………………………………………..………………
A. GENERAL
1. Genero
Hombre Mujer Otros
2. En que grupo de edad se encuentra?
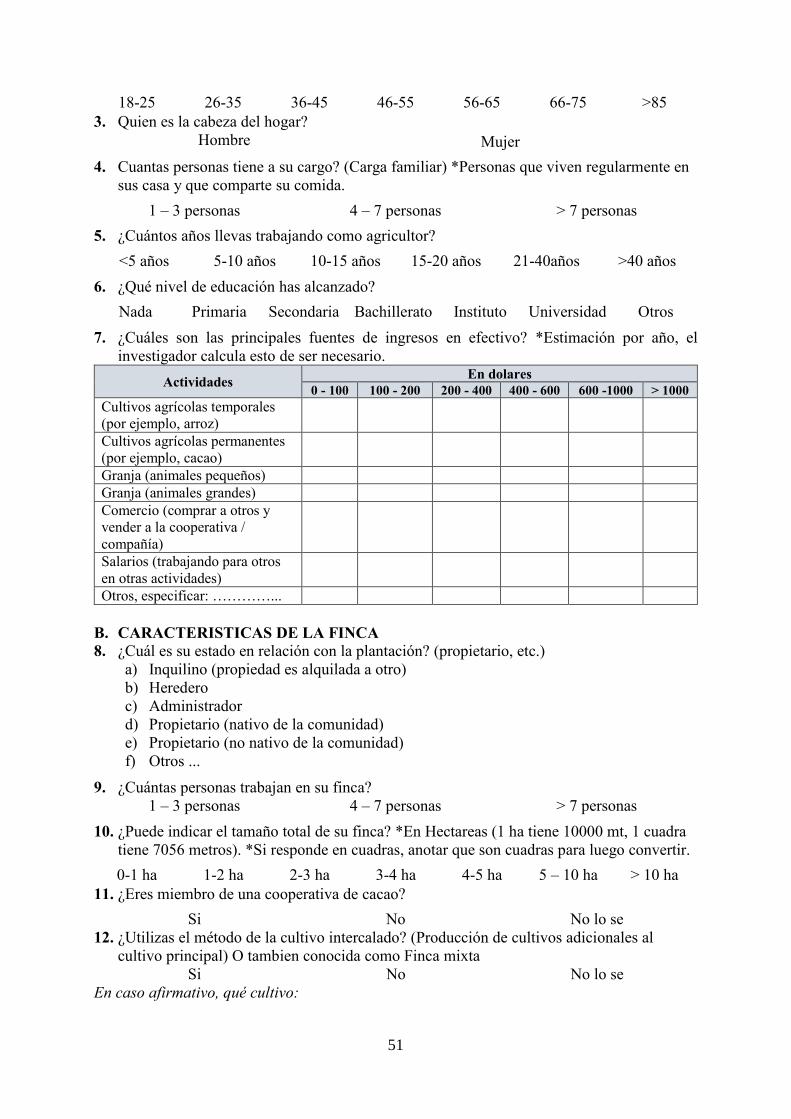
51
18-25 26-35 36-45 46-55 56-65 66-75 >85
3. Quien es la cabeza del hogar?
Hombre Mujer
4. Cuantas personas tiene a su cargo? (Carga familiar) *Personas que viven regularmente en
sus casa y que comparte su comida.
1 – 3 personas 4 – 7 personas > 7 personas
5. ¿Cuántos años llevas trabajando como agricultor?
<5 años 5-10 años 10-15 años 15-20 años 21-40años >40 años
6. ¿Qué nivel de educación has alcanzado?
Nada Primaria Secondaria Bachillerato Instituto Universidad Otros
7. ¿Cuáles son las principales fuentes de ingresos en efectivo? *Estimación por año, el
investigador calcula esto de ser necesario.
Actividades En dolares
0 - 100 100 - 200 200 - 400 400 - 600 600 -1000 > 1000
Cultivos agrícolas temporales
(por ejemplo, arroz)
Cultivos agrícolas permanentes
(por ejemplo, cacao)
Granja (animales pequeños)
Granja (animales grandes)
Comercio (comprar a otros y
vender a la cooperativa /
compañía)
Salarios (trabajando para otros
en otras actividades)
Otros, especificar: …………...
B. CARACTERISTICAS DE LA FINCA
8. ¿Cuál es su estado en relación con la plantación? (propietario, etc.)
a) Inquilino (propiedad es alquilada a otro)
b) Heredero
c) Administrador
d) Propietario (nativo de la comunidad)
e) Propietario (no nativo de la comunidad)
f) Otros ...
9. ¿Cuántas personas trabajan en su finca?
1 – 3 personas 4 – 7 personas > 7 personas
10. ¿Puede indicar el tamaño total de su finca? *En Hectareas (1 ha tiene 10000 mt, 1 cuadra
tiene 7056 metros). *Si responde en cuadras, anotar que son cuadras para luego convertir.
0-1 ha 1-2 ha 2-3 ha 3-4 ha 4-5 ha 5 – 10 ha > 10 ha
11. ¿Eres miembro de una cooperativa de cacao?
Si No No lo se
12. ¿Utilizas el método de la cultivo intercalado? (Producción de cultivos adicionales al
cultivo principal) O tambien conocida como Finca mixta
Si No No lo se
En caso afirmativo, qué cultivo:

52
Cultivo: Cacao Cacao
Organico Banano Platano Café Narajas
Otros:
……………..
Senalar con X Area en Ha
13. Clasifique los costos de acuerdo a la importancia. Solo para la producción de cacao.
Producion de Cacao No
importante
Algo
importante Importante
Muy
importante
Preparación de la tierra (para
plantar nuevas plantas de cacao)
Desherbar / limpiar hierba
Poda (mano de obra)
Aplicacion de quimicos
(fertilizantes o pesticidas)
Cosecha (mano de obra)
Fermentación, secado,
clasificación (mano de obra)
Bolsas vacías
Transporte
C. PRODUCCION DE CACAO
14. ¿Qué tipo de produccion de cacao tienes en tu plantación?
Convencional Organico
Que calidad:
d) CCN51
e) Nacional Arriba
f) Otros: …..
15. ¿Cómo vendes tus granos de cacao?
En baba Seco Semi-seco Las dos formas
16. ¿Cuántos kilos vendiste el año pasado de cacao? (1 quintal de 100 lb. = 46 kg, caneca =
8kg)
e) ................................................ Kg
f) Otra cantidad ....................... en .............. (unidad métrica) en …………. (estado)
g) No lo sé
17. ¿Ha habido un cambio en la producción del año reciente (de marzo de 2018 a enero de
2019) en comparación con la producción del año anterior (de marzo de 2017 a enero de
2018)?
Menos que el año
pasado
Lo mismo que el año
pasado.
Mucho más que el año
pasado. No lo sé
D. CERTIFICACIÓN / PROGRAMAS DE SOSTENIBILIDAD DE LA EMPRESA
18. ¿Usted y su familia pertenecen a de alguno de los siguientes programas? *Se permiten
múltiples respuestas.
g) Fairtrade
h) Olam Cocoa Sustainability
i) Guangala Cocoa
j) Barry Cocoa Forever
k) Other

53
¿Tienes contrato con ellos?
Si No No lo sé
19. ¿Puede señalar el tamaño total de su finca que esta dedicada a alguno de los programas
seleccionados anteriormente? Programa 0-1 ha 1-2 ha 2-3 ha 3-4 ha 4-5 ha 5 -10 ha >10 ha
Fairtrade
Olam Cocoa
Guangala
Cocoa
Barry Cocoa
Otro:
20. ¿Cuántos años ha sido certificado como fairtrade o ha estado participando en el programa
de sostenibilidad?
Program <1 Año 1-2 Años 2-5 Años 5-10 Años >10 Años
Fairtrade
Olam Cocoa
Guangala Cocoa
Barry Cocoa
Other…….
21. ¿Usted o alguien en su hogar ha participado en alguna de las siguientes capacitaciones?
22. ¿Ha recibido primas/premios por su cacao que ha producido en el último año? *Primas o
premios se refiere a dinero adicional al precio del cacao.
a) No
b) Si *(ver sig. pregunta)
c) No actualmente
d) No todavia *( ver sig. pregunta)
e) No lo se / Prefiero no responder
En caso afirmativo, o aún no, ¿cuánto por kg?
h) ................................................ USD por ………….. Kg
i) Otra cantidad (total) ............................ USD por ............ (unidad métrica aquí)
Tema Año Si No No lo sé
Campo escolar (todos los temas a
continuación juntos)
Buenas prácticas agrícolas
(producción de cacao).
Salud y seguridad (por ejemplo,
productos químicos seguros)
Protección del medio ambiente
Aplicación de productos químicos.
Buenas prácticas sociales (p. Ej .:
trabajo infantil)
Económico (diversificación de
ingresos….)
Otros, especificar
……………………

54
j) No lo se
23. Recibe precio minimo?
Si No No lo sé
En caso afirmativo, o aún no, ¿cuánto por kg?
a) ................................................ USD por ………….. Kg
b) Otra cantidad (total) ............................ USD por ............ (unidad métrica aquí)
c) No lo se
24. ¿Cree que sus ingresos han cambiado después de unirse al comercio justo o alguno de los
programas de sostenibilidad que eligió anteriormente?
Programa Muy
Significante Significante
Ni significativo ni
insignificante Insignificante
Muy
Insignificante
Fairtrade
Olam Cocoa
Guangala Cocoa
Barry Cocoa
Other:
E. MEJORAMIENTO en la CALIDAD DE VIDA PERCIBIDO
25. Responde las siguientes preguntas:
Estar involucrado en el esquema de
certificación ...
Muy en
desacuer
do
En
desacuer
do
Ni en
desacuerdo
ni de
acuerdo
Parcialm
ente de
acuerdo
Totalme
nte de
acuerdo
No lo se
1 2 3 4 5 0
... ha mejorado mis ingresos de la finca
… Ha dado mejores precios para sus
granos de cacao
… Le ha dado acceso a información sobre
los precios del mercado del cacao en el
momento adecuado
... me ha ayudado a comercializar mi
cacao
… Ha mejorado su conocimiento de
buenas prácticas agrícolas
… Ha mejorado la calidad de sus granos
de cacao
... ha aumentado su rendimiento en
comparación con años anteriores
... Usted ha recibido apoyo para renovar
su plantación de cacao con árboles
jóvenes
... Recibiste insumos agrícolas o
maquinaria a menor precio
… Utiliza la producción de cultivos
adicionales para su propio consumo
(seguridad alimentaria familiar)
... Usted está motivado a ampliar sus
actividades de producción de cacao para
aumentar los ingresos
… Tus habilidades de control/financiero ha mejorado.

55
26. ¿Cuáles cree que son los beneficios de la certificación de comercio justo o los programas
de sostenibilidad? (Múltiples respuestas son posibles)
Ventajas Muy en
desacuerdo
En
desacuerdo
Ni en
desacuerdo ni
de acuerdo
Parcialmente
de acuerdo
Totalmente
de acuerdo No lo se
Las primas/premios
monetarios
Precio mínimo de soporte
Aprendizaje de nuevas y
buenas prácticas agrícolas.
La formacion recibida
Mejora del conocimiento
cacaotero / conocimiento
del mercado
Aumento de volumen /
productividad
No lo sé
Otros: …….
27. ¿Cuáles cree que son las desventajas de los programas de certificación o sostenibilidad de
Comercio Justo? (Múltiples respuestas son posibles)
Desventajas Muy en
desacuerdo En desacuerdo
Ni en
desacuerdo
ni de
acuerdo
Parcialmente
de acuerdo
Totalmente
de acuerdo
No lo se / No
aplica
Alto costo
Un montón de trabajo
Toma tiempo
Transparencia en la
administracion
Sin desventajas
Otra, especificar
………………..
28. ¿Desea continuar siendo certificado en los próximos 5 años?
Si No No lo se
… Las condiciones de seguridad y de
trabajo en su tierra han mejorado.
… Usted entiende que proteger el medio
ambiente es importante para usted y su
familia.
... tienen ahora más mujeres con
participación en decisiones importantes
para la granja?
... ha mejorado las condiciones de su
hogar, el acceso a agua, electricidad, etc
... ha consumido mucho tiempo y es
costoso sin beneficios reales para mí
… Han mejorado la educación de tus hijos
... Ha sido divertido y agradable (es decir,
beneficios sociales) / Le gusta participar
en este programa / cooperativa?
… Ha mejorado mi calidad de vida
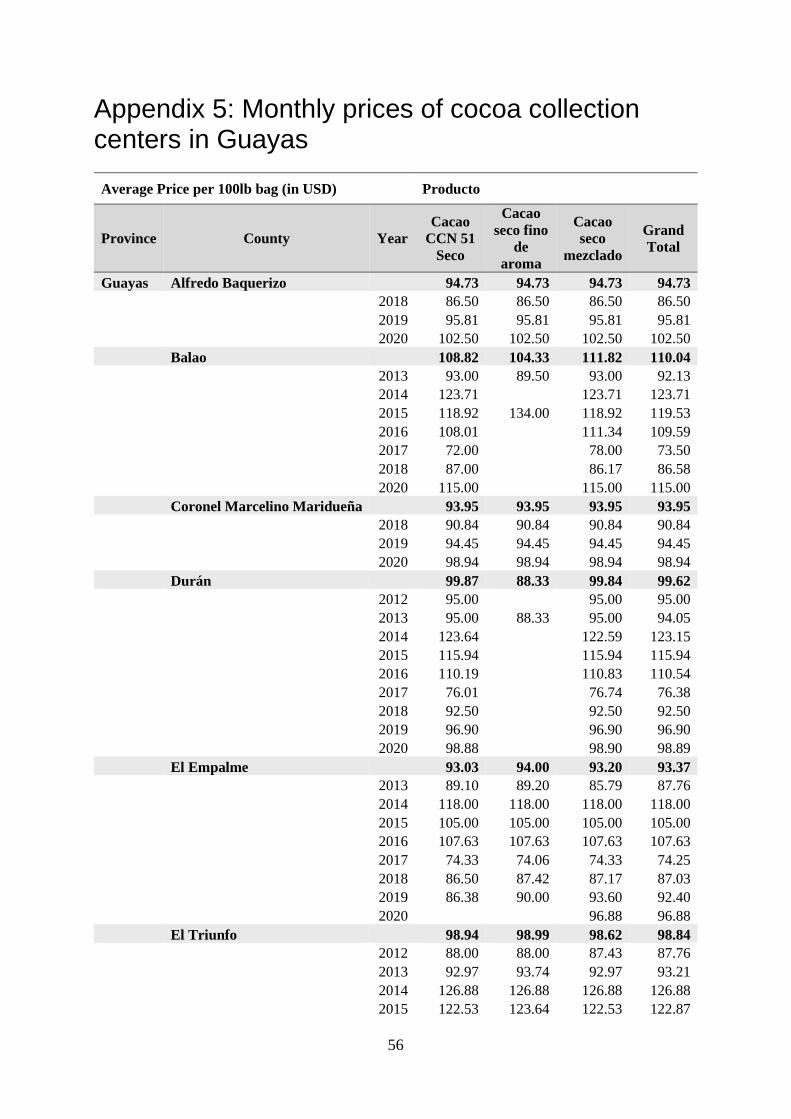
56
Appendix 5: Monthly prices of cocoa collection centers in Guayas
Average Price per 100lb bag (in USD) Producto
Province County Year
Cacao
CCN 51
Seco
Cacao
seco fino
de
aroma
Cacao
seco
mezclado
Grand
Total
Guayas Alfredo Baquerizo 94.73 94.73 94.73 94.73
2018 86.50 86.50 86.50 86.50
2019 95.81 95.81 95.81 95.81
2020 102.50 102.50 102.50 102.50
Balao 108.82 104.33 111.82 110.04
2013 93.00 89.50 93.00 92.13
2014 123.71 123.71 123.71
2015 118.92 134.00 118.92 119.53
2016 108.01 111.34 109.59
2017 72.00 78.00 73.50
2018 87.00 86.17 86.58
2020 115.00 115.00 115.00
Coronel Marcelino Maridueña 93.95 93.95 93.95 93.95
2018 90.84 90.84 90.84 90.84
2019 94.45 94.45 94.45 94.45
2020 98.94 98.94 98.94 98.94
Durán 99.87 88.33 99.84 99.62
2012 95.00 95.00 95.00
2013 95.00 88.33 95.00 94.05
2014 123.64 122.59 123.15
2015 115.94 115.94 115.94
2016 110.19 110.83 110.54
2017 76.01 76.74 76.38
2018 92.50 92.50 92.50
2019 96.90 96.90 96.90
2020 98.88 98.90 98.89
El Empalme 93.03 94.00 93.20 93.37
2013 89.10 89.20 85.79 87.76
2014 118.00 118.00 118.00 118.00
2015 105.00 105.00 105.00 105.00
2016 107.63 107.63 107.63 107.63
2017 74.33 74.06 74.33 74.25
2018 86.50 87.42 87.17 87.03
2019 86.38 90.00 93.60 92.40
2020 96.88 96.88
El Triunfo 98.94 98.99 98.62 98.84
2012 88.00 88.00 87.43 87.76
2013 92.97 93.74 92.97 93.21
2014 126.88 126.88 126.88 126.88
2015 122.53 123.64 122.53 122.87

57
2016 112.76 112.76 112.76 112.76
2017 74.55 74.55 74.55 74.55
2018 92.00 92.00 92.00 92.00
2019 96.98 96.98 96.98
2020 97.28 89.42 97.28 95.31
General Elizalde (Bucay) 90.69 90.69 94.69 92.20
2015 110.75 110.75 116.80 114.11
2016 101.17 101.17 107.04 104.43
2017 75.09 75.09 75.09 75.09
2018 92.58 92.58 92.58 92.58
2019 94.91 94.91 94.91 94.91
2020 99.63 99.63 99.63 99.63
Guayaquil 102.48 131.21 103.79 109.03
2014 124.39 135.71 124.56 127.75
2015 118.91 130.12 118.94 122.21
2016 108.46 132.19 114.20 118.79
2017 73.51 115.00 74.13 78.61
2018 87.46 88.44 88.00
2019 95.05 95.05 95.05
2020 93.83 93.83 93.83
Milagro 99.57 92.80 102.22 99.05
2012 87.00 87.00 85.33 86.29
2013 93.69 93.92 97.63 94.57
2014 120.32 114.33 119.92 119.40
2015 118.06 118.06 118.06
2016 109.58 113.64 111.38
2017 74.19 74.38 73.32 74.02
2018 89.58 89.64 89.58 89.60
2019 95.61 95.61 95.61 95.61
2020 97.75 108.75 97.75 99.32
Naranjal 98.05 90.00 98.16 97.93
2012 93.00 95.00 94.00
2013 95.25 90.00 96.00 94.67
2014 126.78 125.91 126.37
2015 113.81 113.81 113.81
2016 106.57 111.10 108.46
2017 76.04 76.42 76.22
2018 92.46 92.41 92.43
2019 96.24 96.24 96.24
2020 95.32 95.32 95.32
Naranjito 98.07 98.46 98.05 98.19
2012 82.38 82.50 82.38 82.41
2013 91.47 92.22 91.47 91.70
2014 122.90 122.90 122.90 122.90
2015 119.79 119.96 119.79 119.85
2016 110.63 110.63 110.63 110.63
2017 74.12 74.12 74.01 74.08
2018 90.50 90.50 90.42 90.47
2019 95.09 95.09 95.09 95.09
2020 100.08 100.08 100.08 100.08

58
San Jacinto De Yaguachi 97,24 89.71 100.11 96.81
2012 95.00 95.00
2013 93.83 89.50 93.83 93.21
2014 125.00 124.00 124.53
2015 116.75 116.75 116.75
2016 106.00 115.25 109.70
2017 73.64 75.63 73.95 74.09
2018 89.87 89.73 89.87 89.82
2019 93.94 93.94 93.94 93.94
2020 108.00 108.00 108.00 108.00
Simón Bolívar 97.26 89.09 97.29 95.22
2012 82.72 82.72 83.39 82.94
2013 89.87 90.63 89.87 90.11
2014 120.22 120.00 120.39 120.28
2015 115.54 115.54 115.54
2016 106.59 100.40 106.59 105.71
2017 72.86 72.86 72.86 72.86
2018 89.98 89.98 89.94 89.96
2019 94.85 94.85 94.85 94.85
2020 100.13 100.13 100.13 100.13
Grand Total 98.41 96.96 99.09 98.35
Source: Monthly prices of cocoa collection centers. Minister of Agriculture and Agricultural
Public Information System of Ecuador (MAG-SIPA, 2020)

59
Appendix 6: Monthly prices of cocoa collection centers in Manabi
Average Price per 100lb bag (in USD) Producto
Province County Year
Cacao
CCN 51
Seco
Cacao seco
fino de
aroma
Cacao seco
mezclado
Grand
Total
Manabi Bolívar 99.30 86.57 98.08
2012 93.07 78.00 85.53
2013 102.50 102.50
2014 124.29 108.00 121.58
2015 119.38 119.38
2016 100.00 100.00
2017 75.41 75.41
2018 89.42 89.42
2019 93.94 93.94
2020 100.44 100.44
Chone 82.17 93.66 78.92 92.08
2012 82.17 87.75 83.00 84.50
2013 94.00 70.75 84.70
2014 119.12 119.12
2015 113.40 113.40
2016 102.36 102.36
2017 70.94 70.94
2018 86.28 75.17 80.72
2019 90.08 77.09 83.59
2020 96.80 96.80
Flavio Alfaro* 93.20 88.63 93.07
2012 79.44 88.63 84.03
2013 94.40 94.40
2014 122.25 93.33 107.79
2015 110.00 103.33 106.67
2016 105.00 89.06 97.03
2017 70.80 70.80
2018 84.70 75.17 79.93
2019 88.64 88.64
2020 95.38 95.38
No Delimitada 104.00 104.00 104.00 104.00
2015 104.00 104.00 104.00 104.00
Pichincha 113.50 88.93 88.33 89.42
2014 130.38 130.38
2016 113.50 95.00 101.17
2017 75.36 75.00 75.18

60
2018 87.73 87.73
2019 86.00 86.00
2020 93.80 93.80
Portoviejo 83.35 78.55 80.84
2012 75.27 75.27
2013 79.50 79.50
2014 105.57 93.33 101.90
2015 93.33 103.33 100.00
2016 89.06 89.06
2017 64.38 60.17 62.07
2018 82.82 75.17 78.99
2019 84.00 77.09 80.55
2020 89.41 83.60 86.50
Santa Ana 111.67 108.00 103.83 106.69
2015 105.00 106.00 115.50 111.29
2016 115.00 109.33 92.17 102.96
2020 108.00 108.00
Grand Total 99.88 92.69 82.54 90.70
* Flavio Alfaro is the area that collects San Isidro information on prices.
Source: Monthly prices of cocoa collection centers. Minister of Agriculture and Agricultural
Public Information System of Ecuador (MAG-SIPA, 2020).

61
Appendix 7: Predicted Probabilities after multinomial probit estimation
Predicted
Probabilities
Predicted
Probabilities
Pr1 Pr2 Pr3 Pr1 Pr2 Pr3
Obs
Sust.
program FT Olam FL Obs
Sust.
program FT Olam FL
1. Fairtrade 0.230 0.687 0.083 67. Olam 0.618 0.249 0.133
2. Fairtrade 0.061 0.613 0.326 68. Olam 0.000 0.365 0.635
3. Fairtrade 0.158 0.509 0.333 69. Olam 0.620 0.228 0.153
4. Fairtrade 0.561 0.150 0.289 70. Olam 0.194 0.149 0.657
5. Fairtrade 0.322 0.509 0.170 71. Olam 0.029 0.925 0.046
6. Fairtrade 0.581 0.260 0.160 72. Olam 0.000 0.991 0.009
7. Fairtrade 0.572 0.260 0.168 73. Olam 0.502 0.354 0.144
8. Fairtrade 0.276 0.655 0.069 74. Olam 0.142 0.763 0.095
9. Fairtrade 0.509 0.421 0.070 75. Olam 0.324 0.485 0.191
10. Fairtrade 0.626 0.286 0.088 76. Olam 0.179 0.709 0.112
11. Fairtrade 0.743 0.017 0.240 77. Olam 0.147 0.810 0.043
12. Fairtrade 0.265 0.595 0.140 78. Olam 0.000 0.597 0.403
13. Fairtrade 0.640 0.050 0.309 79. Olam 0.219 0.557 0.224
14. Fairtrade 0.902 0.039 0.058 80. Olam 0.292 0.352 0.356
15. Fairtrade 0.418 0.368 0.215 81. Olam 0.290 0.489 0.221
16. Fairtrade 0.841 0.094 0.066 82. Olam 0.000 0.997 0.003
17. Fairtrade 0.783 0.098 0.119 83. Olam 0.170 0.763 0.066
18. Fairtrade 0.218 0.713 0.069 84. Olam 0.089 0.879 0.032
19. Fairtrade 0.950 0.029 0.021 85. Olam 0.075 0.851 0.074
20. Fairtrade 0.846 0.113 0.040 86. Olam 0.004 0.947 0.049
21. Fairtrade 0.766 0.006 0.229 87. Olam 0.005 0.956 0.039
22. Fairtrade 0.838 0.115 0.047 88. Olam 0.083 0.815 0.102
23. Fairtrade 0.802 0.035 0.163 89. Fair for Life 0.000 0.249 0.751
24. Fairtrade 0.455 0.055 0.490 90. Fairtrade 0.683 0.154 0.163
25. Fairtrade 0.587 0.352 0.061 91. Fair for Life 0.220 0.284 0.496
26. Fairtrade 0.924 0.034 0.043 92. Fair for Life 0.675 0.050 0.275
27. Olam 0.080 0.611 0.309 93. Fair for Life 0.176 0.716 0.108
28. Olam 0.010 0.402 0.588 94. Fair for Life 0.845 0.027 0.128
29. Olam 0.041 0.553 0.406 95. Fair for Life 0.480 0.304 0.217
30. Olam 0.359 0.552 0.088 96. Fair for Life 0.084 0.764 0.152
31. Olam 0.035 0.953 0.012 97. Fair for Life 0.090 0.053 0.857
32. Olam 0.126 0.256 0.618 98. Fair for Life 0.024 0.049 0.927
33. Olam 0.007 0.623 0.370 99. Fair for Life 0.013 0.595 0.392
34. Olam 0.107 0.540 0.353 100. Fair for Life 0.000 0.942 0.058
35. Olam 0.054 0.410 0.535 101. Fair for Life 0.046 0.448 0.506
36. Olam 0.059 0.662 0.279 102. Fair for Life 0.000 0.040 0.960
37. Olam 0.546 0.262 0.192 103. Fair for Life 0.236 0.291 0.472
38. Olam 0.420 0.566 0.013 104. Fair for Life 0.308 0.225 0.467
39. Olam 0.129 0.541 0.330 105. Fair for Life 0.340 0.423 0.237
40. Olam 0.141 0.833 0.026 106. Fair for Life 0.005 0.681 0.314
41. Olam 0.345 0.507 0.148 107. Fair for Life 0.242 0.241 0.517
42. Olam 0.371 0.464 0.165 108. Fair for Life 0.252 0.595 0.153
43. Olam 0.297 0.311 0.392 109. Fair for Life 0.505 0.222 0.273
44. Olam 0.455 0.418 0.127 110. Fair for Life 0.272 0.560 0.168
45. Olam 0.033 0.892 0.075 111. Fair for Life 0.145 0.363 0.492
46. Olam 0.075 0.737 0.188 112. Fair for Life 0.390 0.537 0.072
47. Olam 0.001 0.933 0.067 113. Fair for Life 0.609 0.023 0.368
48. Olam 0.035 0.780 0.185 114. Fairtrade 0.110 0.728 0.161
49. Olam 0.187 0.746 0.067 115. Fairtrade 0.030 0.864 0.106
50. Olam 0.122 0.750 0.129 116. Fairtrade 0.398 0.203 0.399

62
51. Olam 0.012 0.595 0.394 117. Fairtrade 0.480 0.125 0.394
52. Olam 0.181 0.775 0.044 118. Fairtrade 0.489 0.174 0.337
53. Olam 0.224 0.594 0.182 119. Fairtrade 0.863 0.069 0.067
54. Olam 0.059 0.897 0.044 120. Fairtrade 0.924 0.034 0.043
55. Olam 0.077 0.877 0.047 121. Fair for Life 0.000 0.172 0.828
56. Olam 0.332 0.414 0.254 122. Fair for Life 0.088 0.437 0.475
57. Olam 0.089 0.818 0.092 123. Fair for Life 0.436 0.282 0.282
58. Olam 0.024 0.840 0.136 124. Fair for Life 0.020 0.504 0.476
59. Olam 0.001 0.969 0.029 125. Fair for Life 0.192 0.386 0.422
60. Olam 0.047 0.364 0.589 126. Fair for Life 0.121 0.084 0.795
61. Olam 0.061 0.722 0.217 127. Fair for Life 0.505 0.222 0.273
62. Olam 0.272 0.560 0.168 128. Fair for Life 0.025 0.080 0.895
63. Olam 0.023 0.952 0.025 129. Fair for Life 0.168 0.350 0.482
64. Olam 0.140 0.735 0.125 130. Fairtrade 0.148 0.277 0.575
65. Olam 0.241 0.589 0.171 131. Fairtrade 0.455 0.055 0.490
66. Olam 0.017 0.967 0.016 132. Fairtrade 0.683 0.154 0.163

63
Appendix 8: Pictures of field research
From left to
right. Top to
bottom.
a) Unocace
All labels,
certification
and
standards
the cocoa
association
belongs.
b) Unocace
warehouse.
Beans ready
for exports.
c) Cocoa
boxes for
fermentation
process (7
days) at
Unocace.
d) Coop.
workers
changing the
beans to the
box level
below.

64
From left to
right. Top to
bottom. At
Unocace:
a) After
fermentation
beans are
transferred
to a drying
house with
elevated
tables.
b) Beans are
later dried
under the
sun.
c) Coop
workers
packing the
dry beans.
d) Beans
must be
packed in
traceable
bags with
the name of
the program.

65
From left to
right. Top to
bottom.
Unocace –
Fairtrade
group.
a) and b)
Interviews
with farmers
at their
respectives
cooperatives
c) The
oldest
farmers in
the field
research, he
has more
than 90
years old.
d) Unocace
has a
chocolate
making
facility for
internal
market.
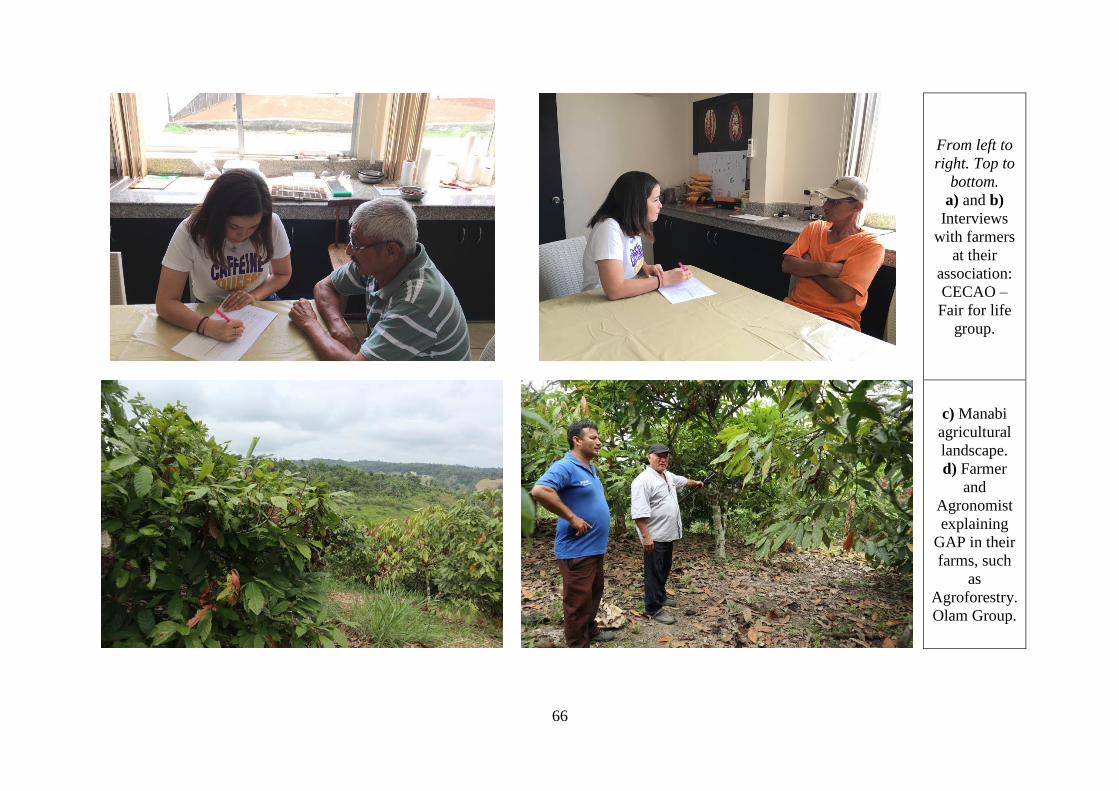
66
From left to
right. Top to
bottom.
a) and b)
Interviews
with farmers
at their
association:
CECAO –
Fair for life
group.
c) Manabi
agricultural
landscape.
d) Farmer
and
Agronomist
explaining
GAP in their
farms, such
as
Agroforestry.
Olam Group.

67
From left to
right. Top to
bottom.
a) Interview
with
farmers at
their farms.
Olam’s
group.
b) Cocoa
pod, yellow
pod can be
harvest.
c) Training
session in
San Isidro,
Manabi held
by Olam.
d) Olam’s
agricultural
and
technical
body


