THE IMPACT OF EXTERNAL ENVIRONMENTAL FORCES ON …
102
THE IMPACT OF EXTERNAL ENVIRONMENTAL FORCES ON STRATEGY DEVELOPMENT BY FIRMS OPERATING IN THE MOBILE MONEY MARKET IN KENYA BY FRANKLIN K. AMBUNDO A RESEARCH PROJECT SUBMITTED IN PARTIAL FULFILLMENT OF THE REQUIREMENTS OF THE MASTER OF BUSINESS ADMINISTRATION DEGREE, THE SCHOOL OF BUSINESS, UNIVERSITY OF NAIROBI NOVEMBER, 2013
Transcript of THE IMPACT OF EXTERNAL ENVIRONMENTAL FORCES ON …

THE IMPACT OF EXTERNAL ENVIRONMENTAL FORCES ON
STRATEGY DEVELOPMENT BY FIRMS OPERATING IN THE
MOBILE MONEY MARKET IN KENYA
BY
FRANKLIN K. AMBUNDO
A RESEARCH PROJECT SUBMITTED IN PARTIAL
FULFILLMENT OF THE REQUIREMENTS OF THE MASTER
OF BUSINESS ADMINISTRATION DEGREE, THE SCHOOL OF
BUSINESS, UNIVERSITY OF NAIROBI
NOVEMBER, 2013

ii
DECLARATION
I declare that his research project is my original work and has not been presented to
any other university for the award of a degree.
Signature
Student‟s Name Franklin, Kennedy Ambundo
D61/P/7899/1997
Date
This management research project has been submitted for the award of the degree of
Master of Business Administration with my approval as the University Supervisor.
Signature
Supervisor‟s Name Professor Martin Ogutu
Department of Business Administration
School of Business,
University of Nairobi
Date

iii
ACKNOWLEDGEMENT
I take this opportunity to first of all thank the almighty God for giving me the gift of
life and health which has enabled me pursue my academic pursuits to the best of my
ability.
I also pay tribute to my parents especially my late father, James Malack Ambundo
and my mother in Khwisero mama Doris Ambundo for inculcating early in childhood
the virtues of discipline, hard work and dedication to academic pursuit.
My gratitude goes out to my family, my wife Rachel and my children Pele, Teejay
and Jamie for their patience and understanding as I dedicated my time to the MBA
program.
Finally I pay tribute to my supervisor professor Martin Ogutu from the School of
Business, University of Nairobi who not only encouraged me to complete my
program but also spent valuable hours of supervision in guiding me appropriately

iv
DEDICATION
This work is dedicated to God for being ever so faithful, my loving mother Doris
Ambundo and departed father James Malack Ambundo, my wife Rachel and children
–Pele, Teejay and Jamie for their unswerving support in the pursuit of my academic
endeavors.

v
TABLE OF CONTENTS
DECLARATION .......................................................................................................... ii
ACKNOWLEDGEMENT ........................................................................................... iii
DEDICATION ............................................................................................................. iv
LIST OF TABLES ...................................................................................................... vii
LIST OF FIGURES ..................................................................................................... ix
Abstract ..........................................................................................................................x
CHAPTER ONE: INTRODUCTION ........................................................................1
1.1 Background of the Study .....................................................................................1
1.1.1 Strategy Development ................................................................................... 2
1.1.2 External Environmental Forces..................................................................... 3
1.1.3 The Mobile Money Market in Kenya ........................................................... 5
1.2 Research Problem ................................................................................................6
1.3 Research Objectives .............................................................................................8
1.4 Value of the Study ...............................................................................................8
CHAPTER TWO: LITERATURE REVIEW ...........................................................9
2.1 Introduction ..........................................................................................................9
2.2 Theoretical Foundation ........................................................................................9
2.3 Concept of Strategy..............................................................................................9
2.4 Environmental Forces ........................................................................................11
2.5 Strategy Development ........................................................................................13
2.6 Linking Environmental Forces, Strategy and Strategy Development ...............16
CHAPTER THREE: RESEARCH METHODOLOGY ........................................18
3.1 Introduction ........................................................................................................18
3.2 Research Design.................................................................................................18
3.3 Target Population ...............................................................................................18
3.4 Data Collection ..................................................................................................19
3.5 Data Analysis .....................................................................................................20
CHAPTER FOUR: DATA ANALYSIS, RESULTS AND DISCUSSION ...........21
4.1 Introduction ........................................................................................................21
4.2 Background Information ....................................................................................21
4.2.1 Mobile Financial Services Firms ................................................................ 21
4.2.2 Mobile Financial Services........................................................................... 22
4.2.3 Ownership Structure of the Mobile Money Firms ...................................... 23

vi
4.2.4 Number of Employees ................................................................................ 23
4.2.5 Average Annual Turnover .......................................................................... 24
4.3 Impact of External Environmental Forces On Strategy Development ..............25
4.4 Impact of Environmental Forces on Strategy Development Aspects ................29
4.5 Inferential Analysis ............................................................................................32
4.5.1 Pearson's Product Moment Correlation Coefficient ................................... 32
4.5.2 Correlation Between Independent Variables .............................................. 36
4.5.3 Correlation Between Dependent Variables ................................................. 39
4.5.4 Analysis of Variance (ANOVA) ................................................................. 40
4.5.5 Univariate ANOVA .................................................................................... 43
4.5.6 Multiple Regression Analysis ..................................................................... 59
4.6 Strategic Measures Taken To Cope With The Impact of
Environmental Forces………………………………………………….......…66
4.7 Discussion .........................................................................................................69
CHAPTER FIVE: SUMMARY CONCLUSIONS AND
RECOMMENDATIONS ...........................................................................................71
5.1 Introduction ........................................................................................................71
5.2 Summary of Findings .........................................................................................71
5.3 Conclusion .........................................................................................................75
5.4 Recommendations ..............................................................................................79
5.5 Limitations .........................................................................................................80
5.6 Suggestions for Further Research ......................................................................81
REFERENCES ...........................................................................................................82
APPENDIX: DATA GATHERING QUESTIONNAIRE ......................................88
vii
LIST OF TABLES
Table 4.1: Year of Incorporation of the Firms .............................................................22
Table 4.2: Year of Establishment of MFS ...................................................................22
Table 4.3: Ownership Structures of the Mobile Money Firms ....................................23
Table 4.4: Number of Employees Working in the MFS Firms ...................................23
Table 4.5: Average Annual Turnover of the MFS Firms .............................................24
Table 4.6 :External Environmental Forces impact on strategy development ..............25
Table 4.7: Respondent Scores On Impact of Environmental Forces ..........................27
Table 4.8:Impact of environmental Forces on Strategy development Aspects ...........30
Table 4.9 Respondent Scores On Impact of Environmental Forces on strategy
development aspect ......................................................................................................30
Table 4.10 Correlation between Independent and dependent variables ......................33
Table 4.11 Correlation between Independent variables ...............................................37
Table 4.12 Correlation between dependent variables ..................................................40
Table 4.13 Dependent variable: Mission and Vision ...................................................41
Table 4.14 Dependent Variable: strategy evaluation and strategy choice ...................42
Table 4.15 :Dependent Variable: Strategy implementation .........................................42
Table 4.16 Dependent Variable: strategic measures ....................................................43
Table 4.17 Univariate ANOVA: Political Force..........................................................43
Table 4.18 Univariate ANOVA: Economic Force .......................................................45
Table 4.19 Univariate ANOVA: Social Force .............................................................46
Table 4.20 Univariate ANOVA: Technological Force ................................................48
Table 4.21 Univariate ANOVA: Legislative Force .....................................................49
Table 4.22 Univariate ANOVA: Environmental Force ...............................................50
Table 4.23 Univariate ANOVA: Threat of substitute products ...................................52
Table 4.24 Univariate ANOVA: Bargaining power of customers ...............................53
Table 4.25 Univariate ANOVA: Bargaining Power of suppliers ................................55
Table 4.26 Univariate ANOVA: Intensity of competitive rivalry ...............................57
Table 4.27 Univariate ANOVA: Threat of new entrants .............................................58
Table 4.28 Regression : vision and mission.................................................................60
Table 4.29 Regression : strategy evaluation and strategy choice ................................62
Table 4.30 Regression : strategy implementation ........................................................63
Table 4.31 Regression: Strategic measures .................................................................65

viii
Table 4.32: Descriptives: Strategic Measures taken to cope with environmental forces68

ix
LIST OF FIGURES
Figure 4.1: Number of Employees Working in the MFS Firms ..................................24
Figure 4.2: Average Annual Turnover of the MFS Firms ...........................................25

x
Abstract
Positive organizational performance and evolution of competitive strategy has been
linked to firms that adapted their strategies faster to external forces, and also
understood the industry‟s attractiveness and their own positions than those which did
not. As such, this research was conducted to establish the impact of the key external
environmental forces on strategy development in firms operating in the mobile money
market in Kenya and also establish the strategic measures taken to cope with those
forces. All six firms providing mobile financial services i.e Safaricom Ltd, Airtel
Kenya Ltd, Telkom Orange Ltd, Essar Telecom, Mobile Pay Ltd and Mobikash Ltd
were involved, with primary data gathered through a self administered semi
structured questionnaire to 4 respondents per firm involved in heading key functional
areas. From the research, it was established that various environmental forces
impacted on strategy development to a great extent and there was also consistency
amongst the firms in the strategic measures adopted to cope with those forces to a
great extent. The study concluded that there was a need to establish more parameters
in evaluating the holistic impacts of environmental forces on strategy development.
The study recommends that mobile firms need to establish flexible organization wide,
yet structured and dynamic integrated environmental analysis systems and reengineer
the tools for strategy development and communication across all cadres of staff.
Keywords: External environmental forces, Strategy development, Strategic measures

CHAPTER ONE: INTRODUCTION
1.1 Background of the Study
The external environment consists of remote forces i.e political, economic, social,
technological, environmental and legislative as well as industry forces i.e competitors,
suppliers, customers, new entrants and substitute products. Johnson and Scholes
(1997) argue that studying these forces is critical and enables a firm evaluate its
competitive position vis a vis its strategy, internal resource capabilities and
stakeholder acceptability. Porter (1980) argues that competitive strategy evolves from
understanding the industry‟s attractiveness and a firms competitive position. As such,
the strategy development process variables include environmental scanning, SWOT
analysis, industry analysis, strategy evaluation, strategy choice and implementation.
Miles & Snow (1978) linked positive organizational performance in firms that
adapted their strategies faster to external forces than those which did not. The
challenge is for firms to ensure a fit or alignment of their strategies and organizational
capabilities to external environmental forces.
Since the first financial transaction by mobile phone in Kenya in 2007 the
Communications Commission of Kenya (CCK sector statistic report, Q3-2011/2012)
indicates phenomenal growth in the mobile money market .Currently there are six
firms offering mobile financial services (MFS) in the industry i.e Safaricom Ltd,
Airtel Kenya, Telkom Orange, Essar Communications, Mobikash Ltd and Mobile Pay
Ltd serving 18.9 million mobile money customers from a total of 29.2 million phone
users; with a total value of transactions for the year 2011 amounting to slightly over
20% of the country‟s GDP on this platform.
With this rapid growth, new macro environmental challenges e.g. the licensing of
competing non-mobile firms ; new government regulations; substitute payment
products; technology failures and transaction frauds etc have arisen with long term
implications for stakeholders in the industry .It is worth establishing the key external
environmental influences impacting firms in the industry and the strategic measures
being adopted by mobile financial service firms to cope with these forces.

2
1.1.1 Strategy Development
There is no universal consensus on what „Strategy Development‟ is amongst scholars
and practitioners of strategy. It is viewed as a multifaceted concept. Thompson et al
(2007) view it as „a blend of proactive actions and as reactions to unanticipated
developments and new market conditions‟ .This view is further supported by
Mintzberg et al (1999) who view deliberate and realized strategy as forming the
endpoints of a continuum along which strategies are crafted. Mintzberg et al (1998)
expounded on their strategy perspectives to categorize 10 strategy schools of thought
into 2 i.e. the prescriptive schools concerned with planning of strategy and the
descriptive schools i.e. those concerned with how strategy emerges .Peters &
Waterman (1982) viewed strategy development as both a prescriptive and emergent
process. Mintzberg (1987) and Mintzberg et al (2003) best capture various
dimensions of strategy development by defining strategy as a plan (deliberate), a
pattern (emerging), a position (market placement), a perspective (leadership
vision/mission ) and as a ploy (tactic to outwit competitors).
Notwithstanding, strategy development is a product of the 5 step strategy-making,
strategy-execution processes described by Thompson et al (2007) i.e. 1) developing
strategic vision 2) setting objectives 3) crafting the strategy 4) executing strategy
effectively and efficiently 5) evaluating performance and initiating corrective action.
Johnson and Scholes (1997) view it as a 3 step process involving strategy analysis,
choice, and implementation. Classical thought focused on the process as being
discrete and linear while modern thinking adopts the view that evaluation of strategy
is concurrent and ongoing. Whittington (2001) best captures the historical evolution
of strategy by various scholars with his classification of strategy into the classical,
processual, evolutionary and systemic schools of thought. Practitioners also
distinguish the levels at which strategy applies i.e. at corporate, business and
operational level.
Drucker (1969) realized the need for strategy development in an age of „discontinuity‟
i.e. random and abrupt changes in the business environment. Bourgeois & Eisenhardt
(1988) noted the‟ high velocity environment” characterized by rapid and
discontinuous change in demand, technology and or regulation that renders
information inaccurate or obsolete. To that end, various schools of thought and tools
3
have evolved and applied over time to aid the development of strategy in response to
environmental turbulence. Some of the key analysis tools include ; PESTEL
(political, economic, social, technological , environmental and legal analysis); SWOT
(strength, weaknesses, opportunities, threats) analysis propagated by Harvard
Business School (1969); for competitor and industry analysis BCG Matrix, Ansoff
Matrix, GE/Mckinsey matrix, Porters 5 forces Analysis (1979) and Porters Generic
strategies (1980) .
Why is strategy development necessary? Johnson, Scholes and Whittington (2008)
suggest 3 reasons, firstly, feasibility; the recognition that resources are scarce and
hence a need to always optimize their allocation to realize the strategy; secondly,
acceptability, in terms of risks, returns and other stakeholder expectations; thirdly,
suitability, in terms of addressing the overall strategic issues such as competitive
advantage, strategic fit between the business environment, organizational capability
and profitability.
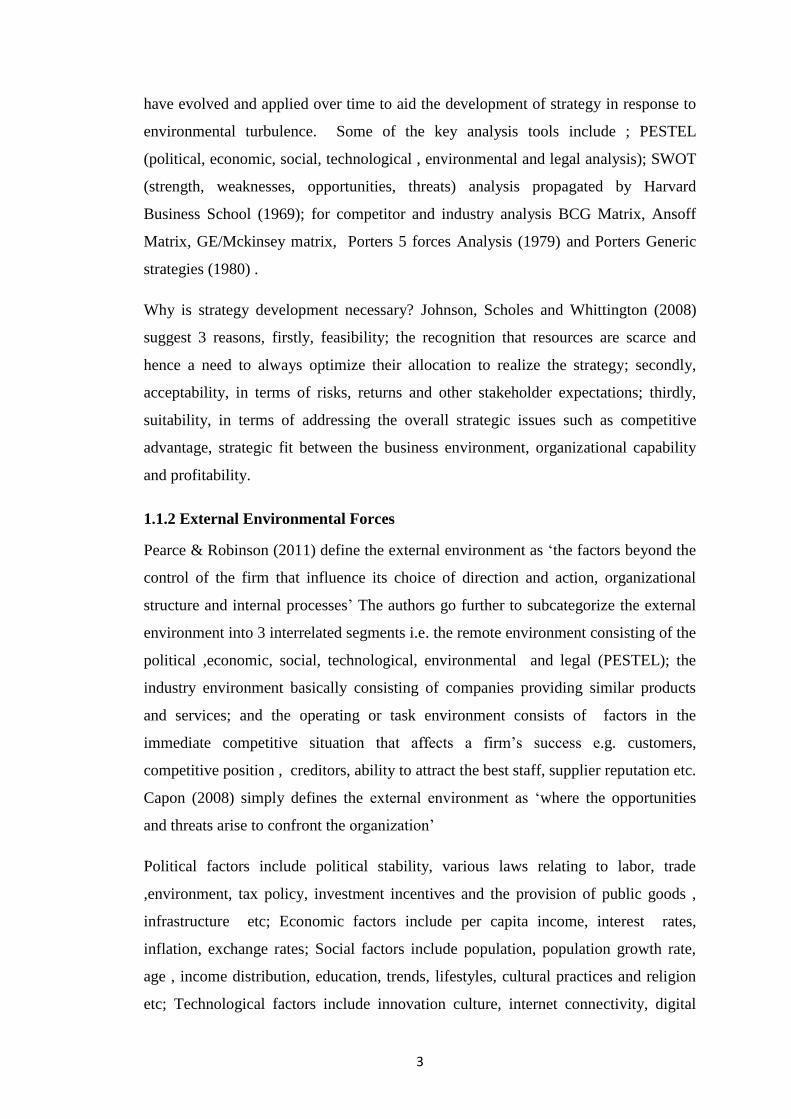
1.1.2 External Environmental Forces
Pearce & Robinson (2011) define the external environment as „the factors beyond the
control of the firm that influence its choice of direction and action, organizational
structure and internal processes‟ The authors go further to subcategorize the external
environment into 3 interrelated segments i.e. the remote environment consisting of the
political ,economic, social, technological, environmental and legal (PESTEL); the
industry environment basically consisting of companies providing similar products
and services; and the operating or task environment consists of factors in the
immediate competitive situation that affects a firm‟s success e.g. customers,
competitive position , creditors, ability to attract the best staff, supplier reputation etc.
Capon (2008) simply defines the external environment as „where the opportunities
and threats arise to confront the organization‟
Political factors include political stability, various laws relating to labor, trade
,environment, tax policy, investment incentives and the provision of public goods ,
infrastructure etc; Economic factors include per capita income, interest rates,
inflation, exchange rates; Social factors include population, population growth rate,
age , income distribution, education, trends, lifestyles, cultural practices and religion
etc; Technological factors include innovation culture, internet connectivity, digital

4
and electronic media reach, technology lifecycle, R&D etc; Environmental factors
include topography, weather, climate, climate change etc. Legislative factors include
consumer laws, labor laws, employment laws, safety laws, environmental laws,
investment laws etc
The study of external forces according to Duncan & Ginter (1990) is firstly, to
understand them; and secondly evaluate their likely impact .They further identify 4
key activities of this analysis i.e. monitoring current influences, scanning future
influences, forecasting and assessment. Stoffels (1994) argues that strategic vision
must grow out of a participatory process set up within a firm for purposes of
continually scanning the external and internal environment. Whittington et al (2005)
see the value of strategy as being concerned with environmental analysis, choice and
action.
Various tools for external environmental analysis have been used, mostly The
PESTEL and SWOT analysis. According to Thompson et al (2007) the biggest
strategy influences emanate from the immediate industry/ competitive environment.
For this, Porter‟s (1979) 5 Forces tool analyzes the impact of industry rivalry,
suppliers, customers, threat of new entrants and substitute products; Further, Porters
(1980) generic strategies analyze strategy choices from either of cost, differentiation
or focus positioning ;while The Ansoff matrix (Ansoff, 1957) from a market and
product development; the BCG matrix (Henderson,1970) analysis from a business
growth and market share view and the GE/ Mckinsey analysis tool (1971) from a
market attractiveness and competitive strength perspective
Why Conduct an External Environmental Analysis? Stoffel (1994) posits that
environmental scanning provides firms with early warning signals, assists develop
and modify strategy, realign internal structures, advances learning aspects, enhances
responsibility and organizational adaptability. On a more contemporary basis, rapid
and radical technological changes, turbulence in the global arena and emerging
environmental issues all necessitate continuous environmental analysis to ensure there
is no mismatch between an organizations strategy, resources and the external
environment.
5
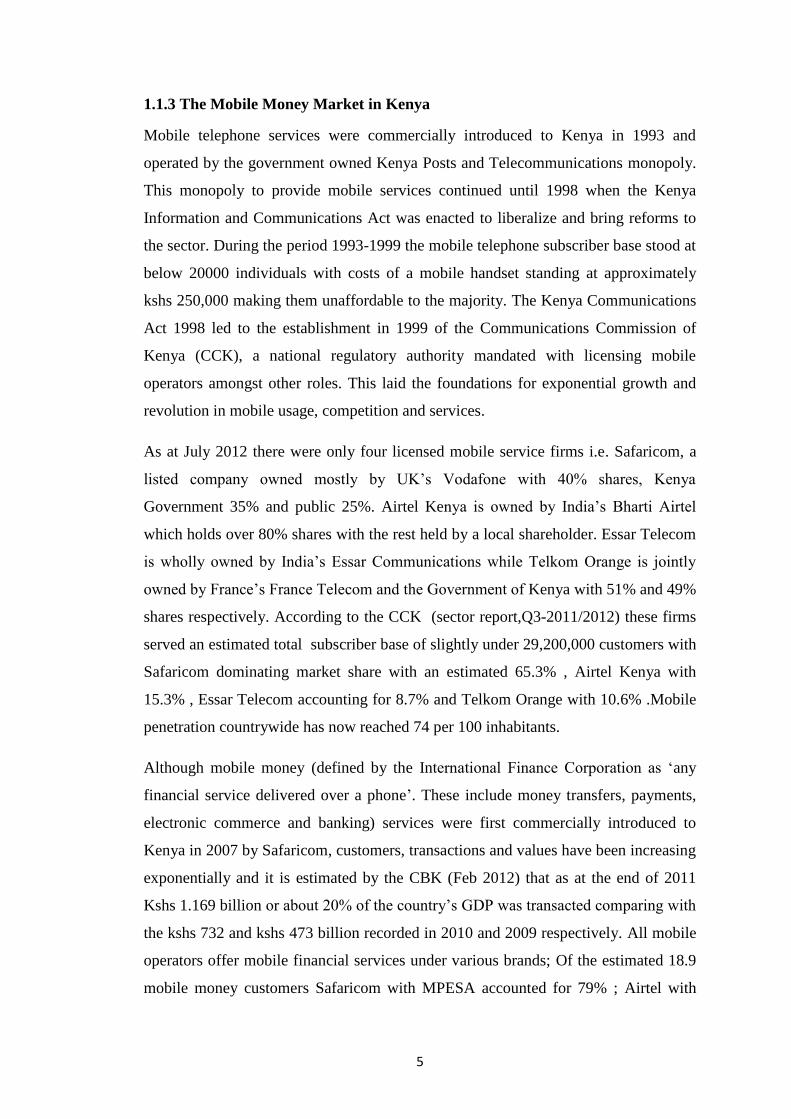
1.1.3 The Mobile Money Market in Kenya
Mobile telephone services were commercially introduced to Kenya in 1993 and
operated by the government owned Kenya Posts and Telecommunications monopoly.
This monopoly to provide mobile services continued until 1998 when the Kenya
Information and Communications Act was enacted to liberalize and bring reforms to
the sector. During the period 1993-1999 the mobile telephone subscriber base stood at
below 20000 individuals with costs of a mobile handset standing at approximately
kshs 250,000 making them unaffordable to the majority. The Kenya Communications
Act 1998 led to the establishment in 1999 of the Communications Commission of
Kenya (CCK), a national regulatory authority mandated with licensing mobile
operators amongst other roles. This laid the foundations for exponential growth and
revolution in mobile usage, competition and services.
As at July 2012 there were only four licensed mobile service firms i.e. Safaricom, a
listed company owned mostly by UK‟s Vodafone with 40% shares, Kenya
Government 35% and public 25%. Airtel Kenya is owned by India‟s Bharti Airtel
which holds over 80% shares with the rest held by a local shareholder. Essar Telecom
is wholly owned by India‟s Essar Communications while Telkom Orange is jointly
owned by France‟s France Telecom and the Government of Kenya with 51% and 49%
shares respectively. According to the CCK (sector report,Q3-2011/2012) these firms
served an estimated total subscriber base of slightly under 29,200,000 customers with
Safaricom dominating market share with an estimated 65.3% , Airtel Kenya with
15.3% , Essar Telecom accounting for 8.7% and Telkom Orange with 10.6% .Mobile
penetration countrywide has now reached 74 per 100 inhabitants.
Although mobile money (defined by the International Finance Corporation as „any
financial service delivered over a phone‟. These include money transfers, payments,
electronic commerce and banking) services were first commercially introduced to
Kenya in 2007 by Safaricom, customers, transactions and values have been increasing
exponentially and it is estimated by the CBK (Feb 2012) that as at the end of 2011
Kshs 1.169 billion or about 20% of the country‟s GDP was transacted comparing with
the kshs 732 and kshs 473 billion recorded in 2010 and 2009 respectively. All mobile
operators offer mobile financial services under various brands; Of the estimated 18.9
mobile money customers Safaricom with MPESA accounted for 79% ; Airtel with

6
Airtel Money ,16%; while other players i.e. Telkom Orange with Orange money and
Essar Telecom with YU cash shared less than 5% .Two other locally owned non-
mobile operators offering mobile cash included in these statistics are Mobile Pay Ltd
established in 2011 with its Tangaza brand and Mobikash Ltd established in 2008
with its Mobikash brand .
Since the introduction of mobile money 5 years ago, new developments in the
political, social, economic, technological and legislative arena with the potential to
undermine industry attractiveness and profitability have arisen that impact the
strategic options for firms in the industry. These include fraud and cybercrime
especially with the industry drive to integrate mobile services, commerce and
customer bank accounts; technology failures leading to delayed processing of
transactions; government directives and regulation on e.g. operator compliance and
consumer protections as enacted in the Kenya Information and Communications act
CAP 411A with respect to prices, tariffs and service quality, reductions in operator
licensing costs including for non-mobile firms- all have the potential to undermine
long term industry attractiveness.
1.2 Research Problem
Strategy is basically a roadmap intended to provide common understanding, direction
and action towards the achievement of organizational goals. Having a strategy
facilitates the allocation and optimization of scarce organizational resources to
achieve maximum effectiveness and efficiency. The need to continually evaluate and
modify strategy is necessary in order to manage the organizational risk profile,
optimize returns and manage other stakeholder expectations. Lastly strategy
development enables a firm to proactively address the overall strategic issues such as
competitive advantage and strategic fit. The typical external environmental influences
impacting strategy development include political, economic, social, technological,
environmental and legislative forces .Through continuous external environmental
monitoring and scanning of largely uncontrollable forces, early warning signals are
sounded which in turn enable a firm to develop, reinforce or modify strategy. It also
helps firms realign their internal structures to ensure there is no mismatch between
strategy, resources and the external environment.
7
With the rapid growth of the mobile money market in the last 5 years , several
challenges affecting 3 distinct interdependent stakeholders i.e. customers, mobile
firms and the government have arisen. These include transaction fraud; technology
failures; new market entrants; new government directives and regulations e.g. on tariff
reductions, monitoring of transactions, operator compliance and consumer protection;
and new substitute payment technologies etc. Jack and Suri (2011) noted that a huge
majority of customers valued mobile money even though there were inconclusive
findings as to the actual socio-economic impacts. Mbiti and Weil (2011) note that in
most instances, mobile money is perceived as a “money transfer” service rather than a
storage of value. Is this a reflection of socio economic forces? Another concern is that
the “success” of mobile money in Kenya has mostly been judged in the context of
studies on one dominant firm, Safaricom with its MPESA rather than from an industry
context. Other detrimental developments such as frequent fraud and technology
failures noted by Kimenyi, Mwangi & Ndungu (2009) that undermine the integrity,
reliability and credibility of mobile money services have arisen. Kimenyi, Mwangi
and Ndungu (2009) argue the case for opening of markets for a more competitive
operating environment.
Whilst the above studies and others have focused on the enabling external
environmental factors or an aspect of the key success factors in the mobile money
market in Kenya none of them has sought to establish the degree of turbulence of the
external environmental forces and the extent to which they impact the survival of
firms at the industry level; nor to establish the relationship between the turbulence
created by the external environmental forces and the timing of activities involved in
the strategy development process (i.e. strategic analysis, strategy choice and
implementation).Specifically the study will seek to answer the following questions;
what are the major external environmental forces that impact strategy development in
firms operating in the mobile money market in Kenya? What are the strategic
measures being taken by firms in the mobile money industry to counter the key macro
environmental forces impacting them?

8
1.3 Research Objectives
The objectives of the study are:
i. To determine the major external environmental forces that impact strategy
development in the firms operating in the mobile money market in Kenya
ii. To establish the measures taken to deal with the external environmental forces
that impact on the firms operating in the mobile money market
1.4 Value of the Study
The study will contribute to knowledge by reporting on previously un researched
studies on the impact of forces in the external environment, against the suitability,
sustainability and evolution of strategies by mobile money firms operating in the
industry in Kenya. The mobile firms stand to benefit from empirically evaluated
macro environmental forces and their potential impacts on long-term survival thus
enabling a timely review of strategy and or strategy development process.
The findings of the study will provide reference material and also help scholars
conduct further research in the area of strategy development in innovative technology
industries and also form a basis for comparative strategy development studies
between industries. The study will also indicate to government if an alternate
development policy framework or model for mobile money is necessary to ensure a
sustainable financial service in line with its national objectives like the Vision 2030
program.

9
CHAPTER TWO: LITERATURE REVIEW
2.1 Introduction
This chapter seeks to establish scholarly works and literature review on the concept of
strategy i.e. the definitions and various dimensions it assumes, strategy schools of
thought, strategy development tools and the strategy development process. This
chapter also analyzes external environmental forces i.e the definitions, categories,
environmental analysis tools and the rationale for studying them in relation to the
strategy development process.
2.2 Theoretical Foundation
Scholars generally agree on the perception of strategy as a link between an
organization and both its environment and uncertainty. Two broad schools of thought
emerge on the subject of strategy development i.e. those who view strategy
development as a rational planning process with a defined set of processes and
procedures; and those who view it as a complex emergent phenomenon. Other schools
of thought have emphasized the nurturing of strategic intent (intuitive approach) as
key to strategy development in high turbulence environments. Irrespective of the
schools of thought, a need to understand the environment has been emphasized by
strategy scholars to aid strategy development .As a rational planning process various
tools have been used in environmental analysis to aid the development of strategy e.g.
PESTEL, SWOT, Porters Five forces, BCG Matrix, and Ansoff Matrix while as an
emergent process, intrapreneurship, learning and intuitive approaches are being
deployed in firms.
2.3 Concept of Strategy
Practitioners and scholars of strategy do not have consensus on the concept of
„strategy‟ i.e. its definition, components or formulation process. For purposes of this
study Johnson, Scholes & Whittington (2008) define strategy as „the direction and
scope of an organization over the long term which achieves advantage for the
organization through its configuration of resources within a changing environment to
meet the needs of markets and to fulfill stakeholder expectations‟. However
Mintzberg (1994) adopts a multifaceted definition that strategy can assume i.e. as
either of; a plan; a pattern; a position; a perspective; or a ploy. Mintzberg et al (1998)
further distinguish 2 schools of thought i.e those that plan strategy (prescriptive) and
those where strategy emerges (descriptive).Whittingtons (2001) 4 schools of thought

10
summarize other scholars works and analyzes various strategy development criteria
i.e how strategy forms, objectives pursued, strategy style, strategy influences and
relevant era in history. A further distinction is made at the level at which strategy
exists in a business i.e corporate, business and operational level. Ansoff (1965) and
Porter (1980) narrow their view of strategy as focusing on gaining competitive market
position at industry level.
Various strategy theories by scholars exist to aid in strategy development. Whittington
(2001) grouped them into 4 strategy schools i.e; the classical approach which looks at
strategy making as a top down rational and analytical process, positing that good
internal planning was necessary to maximize profit from a largely stable environment.
The processual approach discounts long range planning citing imperfections both by
markets and managers and as such learning and compromise lead to the emergence of
a new strategy. This approach alluded to by Ansoff (1969) takes cognisance of
environmental adaptation and was largely associated with growing industries. The
evolutionary approach asserts that the future is too volatile, dynamic and
unpredictable to plan and hence the need to plan strategies for survival today. The
systemic approach adopts the view that the goals informing strategy making are
dependent on the social setting an organization finds itself. Regardless of the
approach adopted from the foregoing it is apparent strategy development lies on a
continuum between an intended and realized strategy.
Notwithstanding the different approaches, every strategy has to be planned for and
managed. To this end various strategic planning and strategic management
techniques and tools are available including situational or SWOT analysis,
environmental scans and analysis i.e PESTEl, strategic audits, stakeholder analysis,
and industry analysis tools like Porters 5 Force analysis. Most scholars and
practitioners of strategy agree the need to foster strategic thinking at all levels i.e
intutitive and innovative strategy deployment in light of todays‟ dynamic and rapidly
changing environmental forces.

11
2.4 Environmental Forces
By and large, there is consensus amongst scholars on the understanding of the
external environment, its subsystems and the forces within it. Minor variations in
classification exist with some preferring the categorizations of macro and micro
environment to distinguish between the remote environment and the
industry/operating/task environment .The other distinction is made in the
classification of the forces themselves with variations to the PESTEL (Political,
Economic, Social, Technological, Environmental, Legislative) components. This
review also delves into the link between the environment and strategy, environmental
analysis tools, and the reasons why it is necessary to study the impact of external
forces on strategy development.
Pearce & Robinson (2011) define the external environment as „the factors beyond the
control of the firm that influence its choice of direction and action, organizational
structure and internal processes‟ Capon (2008) simply defines the external
environment as “where the opportunities and threats arise to confront the
organization.”. Bourgeois (1980) classifies the external environment into two
categories i.e the general environment - being composed of elements that have an
indirect influence on the organization and the task environment- comprising of
elements directly influencing and creating most uncertainty for the firm
It is generally accepted that the various external forces have varied impacts on
organizations based on industry specific factors. Pearce and Robinson (2011) further
subcategorize the external environment into 3 interrelated segments i.e the remote
(macro) environment consisting of the political ,economic, social, technological,
environmental and legal (PESTEL) forces; the industry (micro) environment
basically consisting of companies providing similar products and services including
forces alluded to by Porter (1980) consisting of customers, suppliers, threat new
entrants, substitute products and rivalry between firms ; and the operating or task
environment consists of factors in the immediate competitive situation that affects a
firm‟s success, competitive position , creditors, ability to attract the best staff,
supplier reputation etc
Political factors are those related to the extent of government intervention or
facilitation in the economy, including political stability, laws relating to labor, trade

12
,environment, tax policy, tariffs, investment incentives and the provision of public
goods , infrastructure etc; Economic factors include per capita income, interest rates,
inflation, exchange rates; Social factors include those cultural aspects influencing
attitudes including population, population growth rate, age , income distribution,
education, trends , lifestyles, cultural practices and religion etc; Technological factors
include innovation culture, internet connectivity, digital and electronic media reach,
technology lifecycle, R&D etc; Environmental factors include topography, weather,
climate, climate change etc. Legislative factors include consumer laws, labor laws,
employment laws, safety laws, environmental laws, investment laws etc.
Various scholars (Miles & Snow, 1978) have linked performance to external
environmental adaptation by organizations and consequently attempted to define this
relationship in terms of the magnitude of external forces vis a vis strategic orientation
and response. Accordingly Milliken (1987) argues that environmental uncertainty
arises from an organizations inability to predict its environment while Venkatraman
and Prescot (1990) argue that empirically it has been proven that organizations that
align their strategies to the external environment demands outperform those that do
not.This concept of aligning a) environmental turbulence b) strategy and c)
organizational capability is mirrored in Ansoff & McDonnel‟s (1990) strategic
success hypothesis.
Various tools for external environmental analysis have been used, mostly the
PESTEL and SWOT analysis. Both these tools are strategic analysis tools with the
PESTEL analysis providing a more generic and broader view of the macro
environment while the SWOT synthesizes the PESTEL findings into specific micro
environment threats and opportunities ( matched against strengths and weaknesses )
for strategy development . According to Thompson et al (2007) the biggest strategy
influences emanate from the immediate industry/ competitive environment. For this,
Porter‟s (1979) 5 Forces tool analyses the impact of industry rivalry, suppliers,
customers, threat of new entrants and substitute products; Porters (1980) generic
strategies from a cost, differentiation and focus positioning .The Ansoff matrix
(Ansoff, 1957) from a market and product development; the BCG matrix (Henderson,
1970) from a business growth and market share view and the GE/ Mckinsey tool
(1971) from a market attractiveness and competitive strength perspective
13
The study of external environmental forces according to Duncan & Ginter (1990) is
meant to understand them; evaluate their likely impact and controllability .They
further identify 4 key activities of this analysis i.e monitoring current influences,
scanning future influences, forecasting and assessment ( evaluation of impact on
current and future external environmental factors). Stoffel (1994) posits that
environmental scanning provides early warning signals, and helps companies develop
and modify strategy, realign internal structures, adapt to change, advances learning
and enhances innovation. May et al (2000) advance that environmental scanning
enables managers establish important events and trends outside their organizations
thus enabling them chart a future course of action , a view mirrored by Aguilar(1967)
.Bourgeois(1980) posits that a study of these forces enables firms establish
opportunities for competitive advantage and threats detrimental to its survival.
2.5 Strategy Development
There is general agreement that an understanding of what business the company is in,
the environment it operates in, generation of alternative choices of action and
selection, allocation of resources and implementation are necessary components of
strategy development. These fundamental components answer the classic strategy
questions of „what business are we in?‟; „where do we want to be?‟ and „how do we
get there?‟
Even where consensus that strategy development is a process such as the 5 step
strategy-making, strategy-execution processes described by Thompson et al (2007) i.e
1) developing strategic vision 2) setting objectives 3) crafting the strategy 4)
executing strategy effectively and efficiently 5) evaluating performance and initiating
corrective action, it assumes a one dimensional (linear) closed loop approach; while
Johnson and Scholes (1997) see strategy development as an emergent, organic and
reflexive phenomena in a three step i.e. strategic analysis-strategic choice-strategic
implementation process.
Various strategy schools of thought exist to assist the strategy development process.
Whittington (2001) provides one of the best frameworks for this analysis by
classifying the various schools of thinking by various scholars into 4 categories i.e the
classical, processual, evolutionary and systemic schools. Whittington looks at both the
historical perspective and other strategy development criteria i.e objectives (whether a
14
single (e.g profit maximization) or pluralistic (multiple objectives); the process by
which strategy is formed i.e whether deliberate (planned) or emergent; strategy style
and period of influence
The classical school (Whittington, 2001) drawing from the economics discipline and
popular in the 1960‟s, argued that strategy formation is a formal rational planning
process i.e .deliberate with a unitary objective of profit maximization (as market
conditions were known in a stable environment) - a thinking associated with Ansoff
(1968) and Porter (1980) .Competitive advantage would arise from e.g applying the
scientific approach to management (Taylor,1947) and theories of mathematical
economists Neumann and Mogernstein (1944).The classical approach also
distinguishes the thinking (planning) of strategy from the implementation (strategic
action) implying a top down approach hence Chandlers (1962) assertion that
„structure follows strategy‟.
The processual school popular in the „70‟s (Whittington, 2001) and embracing the
psychology discipline followed the classical school .This school argues that strategy is
deterministic but the objectives pursued may be pluralistic. Supported by scholars
Cyert and March (1963) and Mintzberg (1978) it recognizes the limitations of both
human capabilities and market uncertainties thus questioning the rationale to
maximize profits .The processualists advocate for negotiation of competing political
interests and compromise i.e “bounded rationality‟ and satisficing rather than
maximization objectives. The processual school embodies the concept of
environmental adaptation where strategy becomes crafted rather than a formal
process.
The evolutionary approach drawing from economics and biology disciplines,
(Whittington, 2001) followed the Processual approach and predominated strategy
thinking in the 1980‟s .It propounded that strategy is emergent with the singular
objective of survival i.e “survival for the fittest” or environmental fit. The
organization is viewed as an organism that must fit in its environment rather than
managers shaping its destiny. The evolutionists argued that strategy focus should be
on efficiency in the short term, due to turbulence in the environment. Evolution
advocates Hannan and Freeman (1977, 1989) dismissed the concept of rational
15
planning and argued that market forces would ensure profit maximization and
survival for the fittest.
Whitingtons (2001) systemic school of thought, the fourth category subscribed to the
1990‟s era deems strategy as emergent, necessarily pursues multiple objectives
without focusing exclusively on profit and is contextual i.e embedded or dependent on
the social and cultural environment in which an organization finds itself .It draws
heavily from the discipline of Sociology and necessarily dependent on cultural rules,
norms, social interests and resources.
Mintzberg, Ahlstrand and Lampel (1998) propose 10 strategy schools of thought as a
basis for analysis, while White (2004) revisits Mintzberg et al (1998) to increase the
schools for strategy development analysis into 14 categories. In Mintzberg et al‟s
(1998) two common strategy characteristics are evident i.e the prescriptive schools
(Design, Planning and positioning) and the descriptive strategy (cognitive,
entrepreneurial, power, learning, cultural, environmental, configuration) schools. In
some instances, a hybrid of both schools is recognized.
A number of tools are used to assist in the development of strategy. Two of the more
commonly used environmental scanning and situational analysis tools are the
PESTEL (political, economic, social, technological, environmental and legal) and
SWOT (strengths, weaknesses, opportunities, threat) analysis. Even though PESTEL
still addresses itself to examining factors in the remote environment SWOT narrows
the analysis to focus more on the competitive industry environment.
At the competitive industry level other strategy development tools are available
including Porters (1980) Five Force analysis, a technique for identifying the key
forces affecting the level of competition in the industry. Porter (1980) identified 5
forces i.e the bargaining power of suppliers, the bargaining power of buyers, the threat
of substitutes, the threat of new entrants and the degree of rivalry amongst firms in the
industry. Porter (1980) argues that the issues to consider in developing strategy are
industry attractiveness and a firms competitive position. Porter envisaged competitive
advantage being obtained on the basis of cost leadership and differentiation with
further criteria i.e niche/focus and broad/mass market strategies.

16
Other established strategy development models include the category of „growth
models‟ like the Boston Consulting Group (BCG) growth matrix and the Ansoff
(1957, 1968) product- market Matrix. Both models are linked to the industry life cycle
as they provide a framework to develop strategies on the basis of a products
competitive position vis a vis its stage of market maturity within the industry/product
lifecycle. The strategic options available at each categorization stage of the growth
models are then considered. The BCG matrix determines the strategic importance of
each product in an organizations portfolio on the basis of its market share relative to
the leaders market share and relative to the market maturity stage.
Finally, strategy implementation concerns itself with deployment of organizational
resources which must always be judged against the criteria by Johnson, Scholes and
Whittington (2005).Firstly, feasibility; the recognition that resources are scarce and
hence a need to always optimize their allocation to realize the strategy; secondly,
acceptability, in terms of risks, returns and other stakeholder expectations; thirdly,
suitability, in terms of addressing the overall strategic issues such as competitive
advantage and strategic fit .
2.6 Linking Environmental Forces, Strategy and Strategy Development
Scholars and practitioners of strategy are in general agreement that strategy generally
concerns itself with bridging the relationship between a firm and its environment and
the environmental turbulence and uncertainty that it brings. Whether as a rational
planning process or emergent phenomena, strategy development manages the organic
relationship between an organization and its external environment of business to
ensure environmental fit. It is therefore incumbent upon organizations to have a
framework for analyzing forces in the external environment with a view to exploiting
emerging opportunities and or proactively mitigate threats that may impact negatively
on the business. This external environmental analysis informs the process of
evaluating the current strategy being pursued and if required modify or generate and
select new strategy choices.
The challenge in the strategy development process both for survival and competitive
positioning is to dynamically ensure the alignment of the firms strategy and by

17
extension its internal resource capabilities including culture, structure, processes and
resource allocation to demands of the external environmental forces. Most firms
seeking to understand forces in the external environment strive to predict change
(incremental or discontinuous) and degree of turbulence therein which in turn
informs how strategy develops, that is whether as a strategic plan, emergent strategy
or strategic intent.

18
CHAPTER THREE: RESEARCH METHODOLOGY
3.1 Introduction
The research methodology highlighted in this chapter provides an overview of how
the study was implemented to provide answers to the research question(s) governing
the study objectives. It specifically outlines the research design, target population of
study, sampling design, means by which data was collected and the process by which
data was analyzed to arrive at final conclusions.
3.2 Research Design
The study adopted a cross sectional survey design approach. This is a descriptive
research design used to obtain information concerning the current status of the
phenomena to describe what exists, with respect to variables or conditions in a
situation (Mugenda & Mugenda, 1999).The study therefore aimed to describe the
dimensions of strategy development by mobile money firms resulting from analyzing
the impact of various external environmental forces (variables)
The cross sectional survey descriptive survey approach was most appropriate for this
study as it enabled the quantitative description of opinions, attitudes and trends
captured (in the PESTEL/industry forces analysis, situational analysis and strategic
action areas) as at a given time period across the study population which enabled
easier analysis and observation of patterns. In addition, this research design enabled
the application of data gathering instruments like the questionnaire which gathered
large amounts of data.
3.3 Target Population
A target population is the total collection of elements about which one wishes to make
some inferences (Mugenda and Mugenda, 1999).The study population comprised all 6
firms providing mobile financial services in Kenya. Given the small population, data
was collected from all members of the population of study thereby necessitating a
census survey over a sample survey. Since every population element had a known
probability (100%) of being included in the study this was considered a probability
sampling census survey.
The study targeted four respondents per firm i.e the Mobile financial services business
unit head and three other functional heads responsible for technology, corporate&

19
regulatory affairs and finance making a total of 24 responses with 22 fully completed
questionnaires. The respondents were selected on the basis of having overall
responsibility and accountability for their functional and operational areas.
3.4 Data Collection
Data for the study was gathered through primary data collection methods using a self
administered semi structured questionnaire (see Appendix), with subsequent
clarifications sought through telephone calls. A study of empirical and theoretical
secondary data pertinent to the study was undertaken through a review of scholarly
books and journals, internet sources, professional journals and government
publications.
The questionnaire was divided into 4 sections, requiring responses to 16 dimensions
based on the Likert type scale for purposes of enabling easy rating /ranking of
answers, coding and data analysis; and a closing open ended section . The first section
A, consisted of a brief background regarding the demographic information of the
firms in industry which are the subjects of the study .The second section, B focused
on the impacts of various dimensions of eleven environmental forces comprising both
macro and industry forces on strategy development. The third section, C focused on
various aspects of 5 dimensions of strategy development and how they were impacted
by environmental forces. The fourth section, D was a semi structured section on
strategic measures ( 31 initiatives) adopted by firms to cope with the influence of
environmental forces.
The respondents were the business unit heads designated as General Managers who
are responsible for mobile financial services and also functional heads responsible for
Finance, Technical and corporate& regulatory affairs. The respondents were selected
because they have functional knowledge and overall responsibility for their
operational areas and would be intimately involved in developing strategy for
achieving competitive advantage. In addition validity was enhanced by having
different functional perspectives appraise the impact of external forces on the firms
strategy development

20
3.5 Data Analysis
The Statistical Package for Social Sciences (SPSS) computer package was mainly
used for quantitative data and file management, statistical analysis and reporting. The
reports were presented in tables, charts, frequency graphs and percentage calculations.
For data analysis both descriptive statistics analysis and inferential statistical tests
were performed.
Since the study captured several industry specific attributes, it lend itself to analysis of
measures of central tendency (i.e mean) and also measures of variability (specifically
standard deviation).For inferential test statistics, Pearson's product moment
correlation coefficient (r) was used to measure the relationship between (and also
amongst the variables themselves) the impacts of various environmental forces and
strategy development dimensions including business unit vision/mission; strategy
evaluation & strategy choice; strategy implementation and strategic measures taken.
Analysis of Variance (ANOVA) tests were used to compare differences between the
strategy development outcomes given a set of predictor variables (environmental
forces);while multiple regression analysis were used to establish a model determining
the degree of variability in the dependent variable that was accounted for by the
predictor variables

21
CHAPTER FOUR: DATA ANALYSIS, RESULTS AND DISCUSSION
4.1 Introduction
This chapter focuses on the presentation, data analysis and interpretation of findings
based on the research objectives. The study sought to determine the major external
environmental forces that impact strategy development in the firms operating in the
mobile money market in Kenya and to establish the measures taken to deal with the
external environmental forces that impact on the firms operating in the mobile money
market. The data was gathered through a self administered semi structured
questionnaire issued in advance to designated senior management team members in
charge of core functions specifically finance, legislative/compliance, technology and
business unit/strategy head. The study employed various statistical tools for analysis
and interpretation of data to arrive at conclusions and recommendations.
4.2 Background Information
This section concerns itself with outlining and presentation of the findings obtained
from the questionnaires distributed to the respondents. In order to get the background
information on the impact of external environmental forces on strategy development
by firms operating in the mobile money industry in Kenya the demographic data of
the firms in the study was investigated in the first section of the questionnaire. They
are presented in this section under mobile financial services firms, mobile financial
services, ownership structure of the mobile money firms, number of employees and
average annual turnover.A total of 24 respondents participated in the study with two
of them returning incomplete questionnaires even though attributes captured in the
complete sections were captured for the research.
4.2.1 Mobile Financial Services Firms
The study seeks to establish the impact of external environmental forces on strategy
development by firms operating in the mobile money industry in Kenya. There are a
total of six firms offering mobile financial services under various brands to an
estimated 18.9 million customers. From the study heads of departments in the six
participating firms availed themselves for this study. They were drawn from
Safaricom Kenya Ltd; Airtel Kenya, Telkom Orange, Essar Telecom, Mobile Pay Ltd
and Mobikash Ltd.

22
4.2.2 Mobile Financial Services
The study sought to ascertain the length of time that the mobile money firms have
been in operation in Kenya. In this regard the respondents were required to indicate
the year of incorporation of the firms in Kenya.
Table 4.1: Year of Incorporation of the Firms
Firm Year of Incorporation
Safaricom Kenya Ltd 1997
Airtel Kenya 2010
Telkom Orange 2008
Essar Telecom/Yu 2008
Mobile Pay Ltd 2006
Mobikash Ltd 2008
Source: Author, 2013
Airtel Kenya was incorporated in Kenya in 2010 having changed ownership and
acquired the assets of what was previously Zain Ltd (and earlier Kencell Ltd) which
.Telkom Orange was incorporated in 2008 after a merger between France‟s Orange
Telcom and what was previously Kenya‟s Telkom Ltd (incorporated in 1999).
The firms incorporated in Kenya provide mobile financial services under various
brand names. For instance, Safaricom Kenya Ltd offers its mobile financial services
under brand name of MPESA; Airtel Kenya with Airtel Money, Telkom Orange with
Orange money, Essar Telecom with YU Cash, Mobile Pay Ltd with its Tangaza brand
and Mobikash Ltd with its Mobikash brand.
The study thus sought to establish the length of time that the firms mobile financial
services had been in operation. The results are as depicted in Table 4.3.
Table 4.2: Year of Establishment of MFS
Firm Year of Establishment of MFS
Mpesa (Safaricom Kenya Ltd) 2007
Airtel Money (Airtel Kenya) 2009
Orange Money (Telkom Orange) 2010
Yu Cash (Essar Telecom/Yu) 2009
Tangaza (Mobile Pay Ltd) 2011
Mobikash (Mobikash Ltd) 2011
Source: Author, 2013

23
As seen from the table , Safaricom‟s MPESA is the oldest financial service with 6
years in operation while the rest of the firms have only operated their mobile money
brands for between 2-4 years.
4.2.3 Ownership Structure of the Mobile Money Firms
The study also sought to establish the ownership statuses of the firms in the mobile
money business in Kenya. The results are as depicted in Table 4.4.
Table 4.3: Ownership Structures of the Mobile Money Firms
Firm Ownership Status
Safaricom Kenya Ltd Joint private/public (foreign/local ownership)
Airtel Kenya Joint private (foreign/local ownership)
Telkom Orange Joint foreign private/Kenya Govt
Essar Telecom/Yu Private (foreign)
Mobile Pay Ltd Private (local)
Mobikash Ltd Private (local)
Source: Author, 2013
As can be seen from table 4.4, the majority of the firms in the mobile money business
in Kenya are of varied ownership structures
4.2.4 Number of Employees
The study required the respondents to indicate the number of direct employees
working in the firms involved in mobile financial services in Kenya. The results are as
shown in Table 4.5.
Table 4.4: Number of Employees Working in the MFS Firms
Firm Number of Employees
Safaricom Kenya Ltd 3,500
Airtel Kenya 300
Telkom Orange 2500
Essar Telecom/Yu 500
Mobile Pay Ltd 70
Mobikash Ltd 20
Source: Author, 2013
The study results indicate that Safaricom is the largest employer among the mobile
financial services providers in Kenya with about 3500 employees. Telkom Orange
comes second with an estimated 2500 employees countrywide while Essar Telecom

24
employs 500 staff, Mobile Pay Ltd (Tangaza) employs 70 staff and Mobikash Ltd
employing 20 staff members.
Figure 4.1: Number of Employees Working in the MFS Firms
Source: Author, 2013
4.2.5 Average Annual Turnover
Mobile Financial services contribute significantly to the revenue stream generated by
the firms total diversified services and product mix. As such the study sought to
establish (in billions of Kenya Shillings) the average contribution of the mobile
financial services (only) function to the firms annual turnover.
Table 4.5: Average Annual Turnover of the MFS Firms
Firm Average Annual Turnover (in Billions of KShs)
Safaricom Kenya Ltd Above 6bn
Airtel Kenya 3bn-4.5 bn
Telkom Orange Below 1.5 bn
Essar Telecom/Yu 1.5bn-3.0 bn
Mobile Pay Ltd Below 1.5 bn
Mobikash Ltd Below 1.5 bn
Source: Author, 2013
From the study, a majority of the firms (including Telkom Orange, Mobile Pay Ltd
and Mobikash Afrika Ltd) make an average annual turnover (see Table 4.6 and
Figure 4.2 )of less than KShs. 1.5 billion. Essar Telecom makes between KShs. 1.5bn-
KShs. 3.0 bn, Airtel Kenya makes average annual sales of between KShs. 3.0-4.5
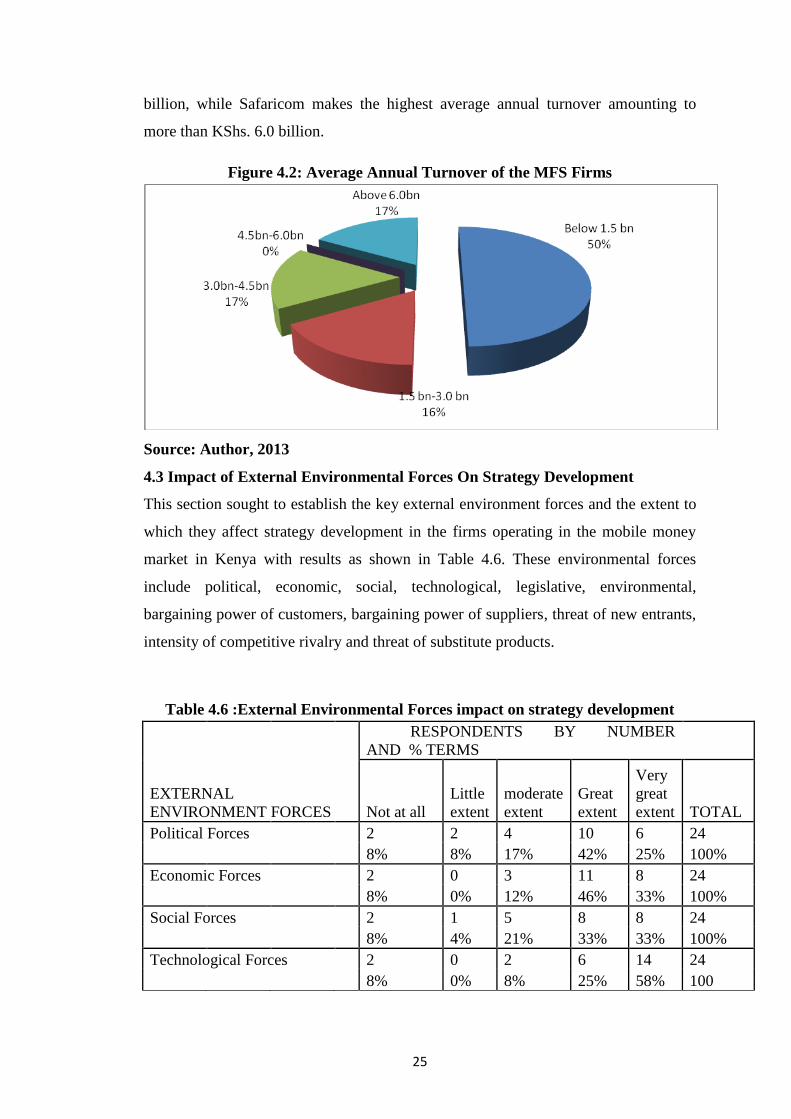
25
billion, while Safaricom makes the highest average annual turnover amounting to
more than KShs. 6.0 billion.
Figure 4.2: Average Annual Turnover of the MFS Firms
Source: Author, 2013
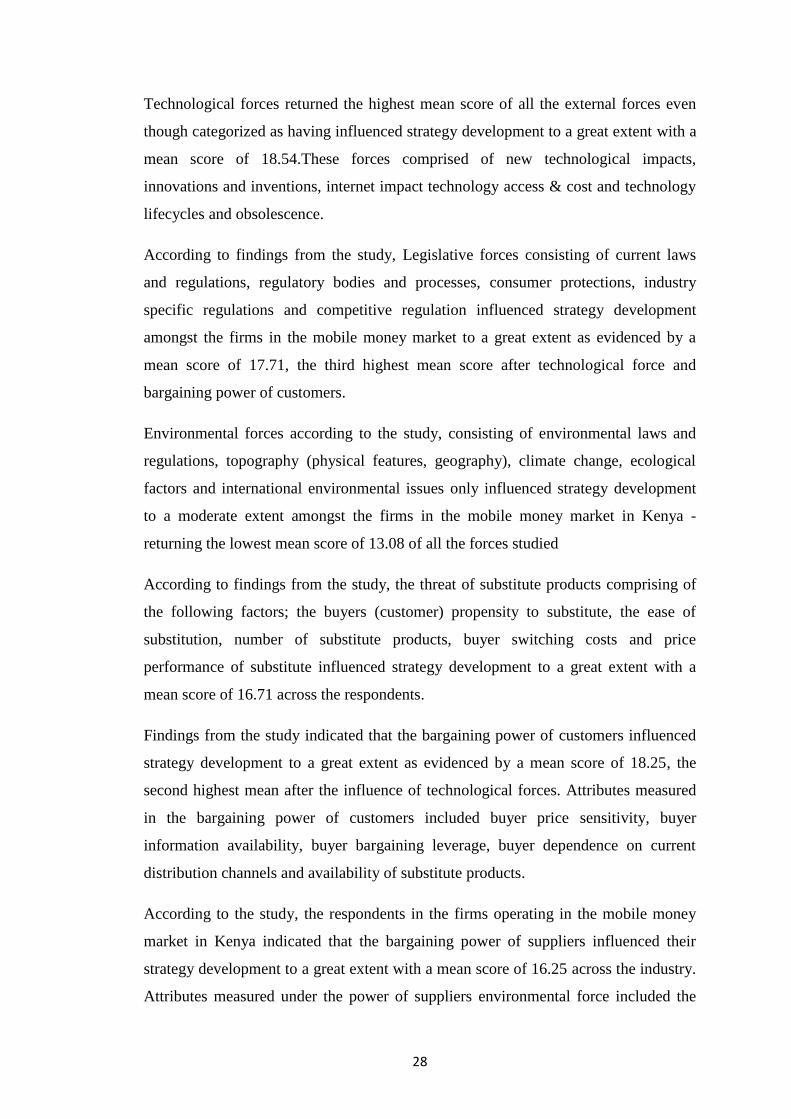
4.3 Impact of External Environmental Forces On Strategy Development
This section sought to establish the key external environment forces and the extent to
which they affect strategy development in the firms operating in the mobile money
market in Kenya with results as shown in Table 4.6. These environmental forces
include political, economic, social, technological, legislative, environmental,
bargaining power of customers, bargaining power of suppliers, threat of new entrants,
intensity of competitive rivalry and threat of substitute products.
Table 4.6 :External Environmental Forces impact on strategy development
RESPONDENTS BY NUMBER
AND % TERMS
EXTERNAL
ENVIRONMENT FORCES Not at all
Little
extent
moderate
extent
Great
extent
Very
great
extent TOTAL
Political Forces 2 2 4 10 6 24
8% 8% 17% 42% 25% 100%
Economic Forces
2 0 3 11 8 24
8% 0% 12% 46% 33% 100%
Social Forces 2 1 5 8 8 24
8% 4% 21% 33% 33% 100%
Technological Forces
2 0 2 6 14 24
8% 0% 8% 25% 58% 100

26
Environmental Forces 2 5 7 5 5 24
8% 21% 29% 21% 21% 100%
Legislative
Forces
2 0 2 8 12 24
8% 0% 8% 33% 50% 100%
Threat of substitute
products 2 0 7 5 10 24
8% 0% 29% 21% 42% 100%
Bargaining power of customers 2 0 1 9 12 24
8% 0% 4% 38% 50% 100%
Intensity of competitive rivalry 2 0 3 8 11 24
8% 0% 12% 33% 46% 100%
Threat of new entrants
2 0 5 7 10 24
8% 0% 21% 29% 42% 100%
Bargaining power of
suppliers 2 1 5 8 8 24
8% 4% 21% 33% 33% 100%
Source: Author, 2013
Accordingly, questions comprising categorical responses on a 5 point scale were
provided, where the extent of the external forces impact on strategy development was
to be measured on a likert type scale where , 1= not at all; 2= little extent; 3=
moderate extent; 4= great extent; 5=very great extent.
Each environmental force was further subcategorized with 5 different attributes each
to be responded to thereby creating a 25 point scale for which a single composite
score (ranging between 0 to 25) would be generated. The purpose for converting
ordinal scale data (categorical variables) responses into interval scale data (continuous
variables) was to enable more meaningful descriptive and inferential analysis. As a
consequence, the ordinal scale responses were recalibrated into interval scores based
on the respondent results where the extent of the impact of external forces would be
measured on a scale where , 0-5 = Not at all; > 5-10 = Little Extent; > 10 -15 =
Moderate extent ;> 15 -20= Great extent; and > 20-25 = V. great extent
The respondents mean scores and standard deviations were tabulated for each force
(Table 4.7)

27
Table 4.7: Respondent Scores On Impact of Environmental Forces
N Range Minimum Maximum Mean Std.
Deviation
Statistic Statistic Statistic Statistic Statistic Std.
Error
Statistic
Political forces 24 24 0 24 15.08 1.294 6.338
Economic forces 24 25 0 25 16.83 1.298 6.357
Social forces 24 24 0 24 15.67 1.298 6.357
Technological forces 24 25 0 25 18.54 1.417 6.941
Legislative forces 24 25 0 25 17.71 1.326 6.497
Environmental forces 24 24 0 24 13.08 1.437 7.040
Threat of substitute
products 24 25 0 25 16.71 1.395 6.836
Bargaining power of
customers 24 25 0 25 18.25 1.352 6.622
Bargaining power of
suppliers 24 25 0 25 16.25 1.342 6.576
Intensity of competitive
rivalry 24 25 0 25 17.38 1.336 6.546
Threat of new entrants 24 25 0 25 16.67 1.307 6.404
Valid N (list wise) 24
Source: Author, 2013
According to the study, the respondents indicated that political forces which included
political leadership and stability, investment incentives, infrastructure provision,
government systems and structures and international relations influenced strategy
development among mobile financial service firms to a great extent as evidenced by a
mean score of 15.08
Economic forces which included interest rates (and monetary policy), exchange rates,
inflation, tax regime (fiscal policy) and disposable income/employment levels
influenced strategy development to a great extent as evidenced by a mean score of
16.83 amongst the respondents.
According to results of the study, Social forces comprising demographics (sex,
gender, race etc), religious/ethnic/cultural factors, education levels, consumer
attitudes &opinions and trends, fads and lifestyles influenced strategy development
amongst the firms operating in the mobile money market in Kenya to a great extent as
evidenced with a mean score of 15.67.
28
Technological forces returned the highest mean score of all the external forces even
though categorized as having influenced strategy development to a great extent with a
mean score of 18.54.These forces comprised of new technological impacts,
innovations and inventions, internet impact technology access & cost and technology
lifecycles and obsolescence.
According to findings from the study, Legislative forces consisting of current laws
and regulations, regulatory bodies and processes, consumer protections, industry
specific regulations and competitive regulation influenced strategy development
amongst the firms in the mobile money market to a great extent as evidenced by a
mean score of 17.71, the third highest mean score after technological force and
bargaining power of customers.
Environmental forces according to the study, consisting of environmental laws and
regulations, topography (physical features, geography), climate change, ecological
factors and international environmental issues only influenced strategy development
to a moderate extent amongst the firms in the mobile money market in Kenya -
returning the lowest mean score of 13.08 of all the forces studied
According to findings from the study, the threat of substitute products comprising of
the following factors; the buyers (customer) propensity to substitute, the ease of
substitution, number of substitute products, buyer switching costs and price
performance of substitute influenced strategy development to a great extent with a
mean score of 16.71 across the respondents.
Findings from the study indicated that the bargaining power of customers influenced
strategy development to a great extent as evidenced by a mean score of 18.25, the
second highest mean after the influence of technological forces. Attributes measured
in the bargaining power of customers included buyer price sensitivity, buyer
information availability, buyer bargaining leverage, buyer dependence on current
distribution channels and availability of substitute products.
According to the study, the respondents in the firms operating in the mobile money
market in Kenya indicated that the bargaining power of suppliers influenced their
strategy development to a great extent with a mean score of 16.25 across the industry.
Attributes measured under the power of suppliers environmental force included the
29
availability(or lack of ) essential suppliers, threats to reduce quality of inputs, threats
to raise input prices, supplier switching costs to other industries and the presence of
substitute inputs
The intensity of competitive rivalry comprising of the following evaluated attributes;
the level of advertising, competition between mobile and non mobile telephony firms,
the degree of innovations amongst competitors, the flexibility of product/service
offerings and price competition amongst firms influenced strategy development to a
great extent with a mean score of 17.38 across the respondents.
According to findings from the study, the threat of new entrants influenced the
development of strategy to a great extent with a mean score of 16.67 across the
targeted respondents. The factors measured under the threat of new entrant industry
force included industry entry barriers, capital requirements, ability for new entrants to
access distribution outlets, expected retaliation by new entrants and government
policy on new entrants.
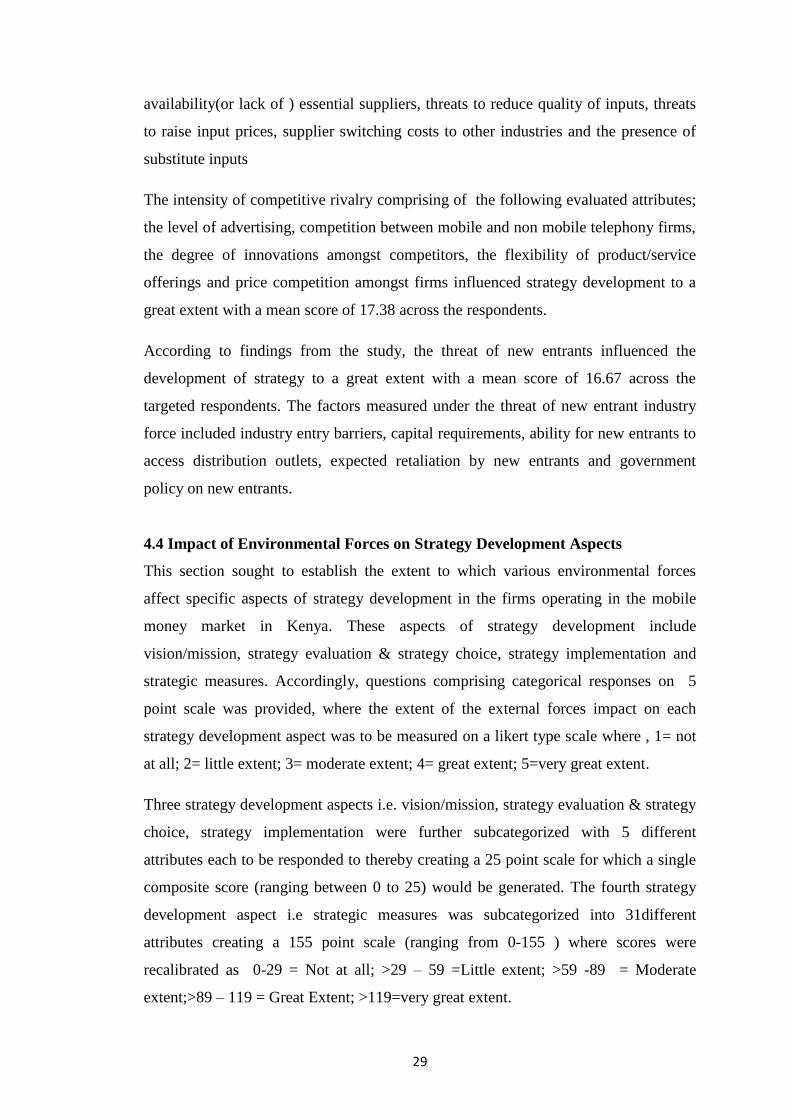
4.4 Impact of Environmental Forces on Strategy Development Aspects
This section sought to establish the extent to which various environmental forces
affect specific aspects of strategy development in the firms operating in the mobile
money market in Kenya. These aspects of strategy development include
vision/mission, strategy evaluation & strategy choice, strategy implementation and
strategic measures. Accordingly, questions comprising categorical responses on 5
point scale was provided, where the extent of the external forces impact on each
strategy development aspect was to be measured on a likert type scale where , 1= not
at all; 2= little extent; 3= moderate extent; 4= great extent; 5=very great extent.
Three strategy development aspects i.e. vision/mission, strategy evaluation & strategy
choice, strategy implementation were further subcategorized with 5 different
attributes each to be responded to thereby creating a 25 point scale for which a single
composite score (ranging between 0 to 25) would be generated. The fourth strategy
development aspect i.e strategic measures was subcategorized into 31different
attributes creating a 155 point scale (ranging from 0-155 ) where scores were
recalibrated as 0-29 = Not at all; >29 – 59 =Little extent; >59 -89 = Moderate
extent;>89 – 119 = Great Extent; >119=very great extent.
30
The descriptive results based on recalibration of scores are indicated in Table 4.8.
Table 4.8:Impact of environmental Forces on Strategy development Aspects
RESPONDENTS BY NUMBER
AND %
STRATEGY DEVELOPMENT
ASPECTS
Not at
all
Little
extent
moderate
extent
Great
extent
Very
great
extent TOTAL
Vision and
mission 2 1 5 9 7 24
8% 4% 21% 38% 29% 100%
Strategy evaluation & strategy
Choice 2 0 4 10 8 24
8% 0% 17% 42% 33% 100%
Strategy Implementation 2 0 5 8 9 24
8% 0% 21% 33% 38% 100%
Strategic
measures
2 0 1 11 10 24
8% 0% 4% 46% 42% 100%
Source: Author, 2013
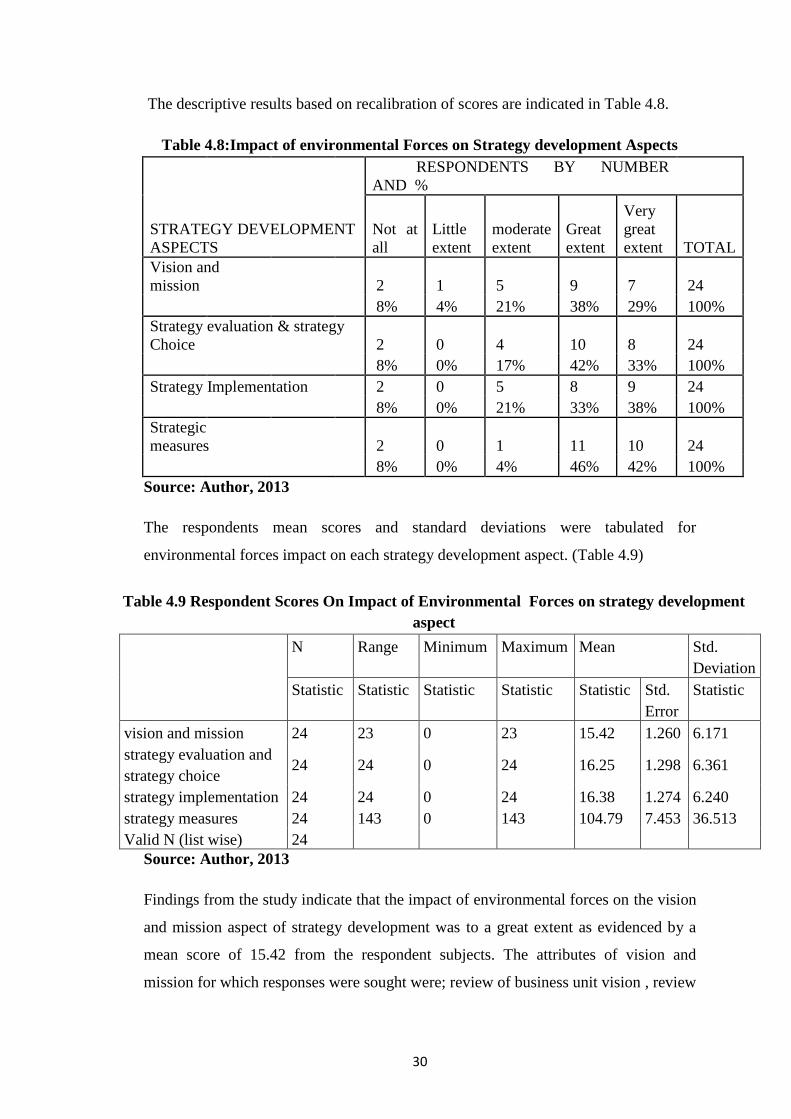
The respondents mean scores and standard deviations were tabulated for
environmental forces impact on each strategy development aspect. (Table 4.9)
Table 4.9 Respondent Scores On Impact of Environmental Forces on strategy development
aspect
N Range Minimum Maximum Mean Std.
Deviation
Statistic Statistic Statistic Statistic Statistic Std.
Error
Statistic
vision and mission 24 23 0 23 15.42 1.260 6.171
strategy evaluation and
strategy choice 24 24 0 24 16.25 1.298 6.361
strategy implementation 24 24 0 24 16.38 1.274 6.240
strategy measures 24 143 0 143 104.79 7.453 36.513
Valid N (list wise) 24
Source: Author, 2013
Findings from the study indicate that the impact of environmental forces on the vision
and mission aspect of strategy development was to a great extent as evidenced by a
mean score of 15.42 from the respondent subjects. The attributes of vision and
mission for which responses were sought were; review of business unit vision , review

31
of current purpose of the firm, review of values driving the firm, review of core
competences and review of market segments/product offerings
According to the study, the impact of environmental forces on the strategy evaluation
and strategy choice aspect of strategy development was to a great extent as evidenced
by a mean score of 16.26.The attributes measured under this aspect included; the
degree of macro environmental scanning, degree of micro (industry) level scanning,
degree of competitor analysis, degree of firm specific analysis (SWOT) and the
objective setting and strategy selection process
Findings from the study indicate that the impact of environmental forces on the
strategy implementation aspect of strategy development was to a great extent as
evidenced by a mean score of 16.38 across the respondents. The attributes measured
under strategy implementation were; organizational restructuring, resourcing of
human resources and capital, internal resource allocation, change management
activities and alignment of culture, structure, processes and communication.
According to the study, the respondents indicated that the impact of environmental
forces on strategic measures was to a great extent as evidenced by a mean score of
104.79 (maximum score possible is 155) .Unlike the other strategy development
aspects 31 attributes of strategic measures were evaluated. These were; enhanced
CSR/customer loyalty schemes, low cost pricing of service, differentiated our
product/service offering, expanded into new geographic region, alliance with data/I.T
firms, enhanced regulatory compliance, merged/acquired other firms, targeted niche
market/customer segments, diversified in other financial services, expanded agent
network, premium pricing of service, consolidated with other products/services,
injected further capital/human investment, invested further in secure technology,
implemented some cost cutting measures, differentiated service pricing, established
new distribution channels, partnered bank/EFT firm for M-Banking, lowered
transaction values, interoperability with competitors/others, invested further in
network improvement, outsourced some related services, integrated supply chain
ownership, enhanced coordination with regulators, increased transaction values,
enhanced customer knowledge/ information, increased advertising/awareness
campaigns and organizational restructuring/downsizing
32
4.5 Inferential Analysis
Inferential analysis is utilized in this study to determine if there is a relationship
between and amongst the independent (predictor) and dependent variables, as well as
the strength of those relationships. The inferential statistics used were; Pearsons
product moment correlation coefficient to measure the strength and direction of
relationships between the study variables; One way analysis of variance (ANOVA) to
compare differences between the outcomes (dependent variables) against a constant
set of predictor variables and a multiple regression analysis to establish the degree of
variability in the dependent variable that is accounted for by changes in one of the
independent variables. The independent variables in this study included the following
environmental forces; political, economic, social, technological, legislative,
environmental, bargaining power of customers, bargaining power of suppliers, threat
of new entrants, intensity of competitive rivalry and threat of substitute products. The
dependent variables include the following strategy development aspects; business unit
vision/mission, strategy evaluation & strategy choice, strategy implementation and
strategic measures.
4.5.1 Pearson's Product Moment Correlation Coefficient
To quantify the strength of the relationship between the variables, the researcher used
Karl Pearson‟s product moment correlation coefficient. The researcher used the Karl
Pearson‟s product moment correlation coefficient (r) to study the correlation between
the study variables and the findings were as in Table 4.10

33
Table 4.10 Correlation between Independent and dependent variables
poli
tica
l fo
rces
Eco
nom
ic f
orc
es
Soci
al f
orc
es
Tec
hnolo
gic
al f
orc
es
Leg
isla
tive
forc
es
Envir
onm
enta
l fo
rces
Inte
nsi
ty o
f co
mpet
itiv
e ri
val
ry
Thre
at o
f n
ew e
ntr
ants
Thre
at o
f su
bst
itute
pro
duct
s
Bar
gai
nin
g p
ow
er o
f cu
stom
ers
Bar
gai
nin
g p
ow
er o
f su
ppli
ers
pearson
correlation 0.727 0.778 0.832 0.808 0.744 0.585 0.749 0.717 0.812 0.836 0.805
Vision and mission
Sig.( 2 tailed) 0.000 0.000 0.000 0.000 0.000 0.003 0.000 0.000 0.000 0.000 0.000
pearson
correlation 0.553 0.758 0.729 0.741 0.716 0.507 0.835 0.853 0.759 0.873 0.817
strategy evaluation and strategy choice
Sig.( 2 tailed) 0.005 0.000 0.000 0.000 0.000 0.011 0.000 0.000 0.000 0.000 0.000
pearson
correlation 0.672 0.820 0.695 0.731 0.821 0.603 0.781 0.830 0.706 0.825 0.770
Strategy implementation
Sig.( 2 tailed) 0.000 0.000 0.000 0.000 0.000 0.002 0.000 0.000 0.000 0.000 0.000
pearson
correlation 0.660 0.852 0.809 0.864 0.844 0.619 0.881 0.869 0.777 0.872 0.808
Strategic measures
Sig.( 2 tailed) 0.000 0.000 0.000 0.000 0.000 0.001 0.000 0.000 0.000 0.000 0.000
a. Listwise N=24
correlation is significant at the 0.05 level ( 2 tailed)
Source: Author, 2013

34
From the findings, there was a positive correlation between political forces and all
dimensions of strategy development comprising vision and mission, strategy
evaluation and strategy choice, strategy implementation and strategic measures with
correlations coefficients (r) of 0.727, 0.553,0.672 and 0.660 respectively. Increases in
the impact of political forces were correlated with fairly significant increases in all
four dimensions of strategy development.
From the findings, there was a positive correlation between economic forces and all
dimensions of strategy development comprising vision and mission, strategy
evaluation and strategy choice, strategy implementation and strategic measures with
correlations coefficients (r) of 0.778, 0.758, 0.820 and 0.852 respectively. Increases
in the impact of economic forces were correlated with significant increases in all four
dimensions of strategy development.
From the findings, there was a positive correlation between social forces and all
dimensions of strategy development comprising vision and mission, strategy
evaluation and strategy choice, strategy implementation and strategic measures with
correlations coefficients (r) of 0.832, 0.729, 0.695 and 0.809 respectively. Increases
in the impact of social forces were correlated with significant increases in all four
dimensions of strategy development
From the findings, there was a positive correlation between technological forces and
all dimensions of strategy development comprising vision and mission, strategy
evaluation and strategy choice, strategy implementation and strategic measures with
correlations coefficients (r) of 0.808, 0.741, 0.731 and 0.864 respectively. Increases
in the impact of technological forces were correlated with significant increases in all
four dimensions of strategy development from the findings, there was a positive
correlation between legislative forces and all dimensions of strategy development
comprising vision and mission, strategy evaluation and strategy choice, strategy
implementation and strategic measures with correlations coefficients (r) of 0.744,
0.716, 0.821 and 0.844 respectively. Increases in the impact of legislative forces were
correlated with significant increases in all four dimensions of strategy development
From the findings, there was a positive correlation between environmental forces and
all dimensions of strategy development comprising vision and mission, strategy
35
evaluation and strategy choice, strategy implementation and strategic measures with
correlations coefficients (r) of 0.585, 0.507, 0.603 and 0.619 respectively. Increases
in the impact of environmental forces were correlated with fairly significant increases
in all four dimensions of strategy development
From the findings, there was a positive correlation between the intensity of
competitive rivalry forces and all dimensions of strategy development comprising
vision and mission, strategy evaluation and strategy choice, strategy implementation
and strategic measures with correlations coefficients (r) of 0.749, 0.835, 0.781 and
0.881 respectively. Increases in the impact of competitive rivalry forces were
correlated with significant increases in all four dimensions of strategy development
From the findings, there was a positive correlation between the threat of new entrants
and all dimensions of strategy development comprising vision and mission, strategy
evaluation and strategy choice, strategy implementation and strategic measures with
correlations coefficients (r) of 0.717, 0.853, 0.830 and 0.869 respectively. Increases
in the impact of the threat of new entrants were correlated with significant increases in
all four dimensions of strategy development
From the findings, there was a positive correlation between the threat of substitute
products and all dimensions of strategy development comprising vision and mission,
strategy evaluation and strategy choice, strategy implementation and strategic
measures with correlations coefficients (r) of 0.812, 0.759, 0.706 and 0.777
respectively. Increases in the impact of substitute products were correlated with
significant increases in all four dimensions of strategy development
From the findings, there was a positive correlation between the bargaining power of
customers and all dimensions of strategy development comprising vision and
mission, strategy evaluation and strategy choice, strategy implementation and
strategic measures with correlations coefficients (r) of 0.836, 0.873, 0.825 and 0.872
respectively. Increases in the impact of customers bargaining powers were correlated
with significant increases in all four dimensions of strategy development
From the findings, there was a positive correlation between the bargaining power of
suppliers and all dimensions of strategy development comprising vision and mission,
strategy evaluation and strategy choice, strategy implementation and strategic

36
measures with correlations coefficients (r) of 0.805, 0.817, 0.770 and 0.808
respectively. Increases in the impact of suppliers bargaining powers were correlated
with significant increases in all four dimensions of strategy development.
Overall, the relationships between the independent and dependent variables were
positive and met the researchers threshold for consideration as being significant
(p<0.01).Although the various predictor variables had varying impacts on the
outcomes (dependent variables), noticeably the environmental forces seemed to have
relatively lesser impact than the other forces.
4.5.2 Correlation Between Independent Variables
The study also sought to find out if there was a relationship between the independent
variables given grounded literature on the interdependence between subsystems in the
external environment and establish whether these may impact strategy and decision
making in the task environment of the firms operating in the mobile money market in
Kenya.
Below (Table 4.11) is a summary table derived from bivariate correlation analysis
between the independent variables carried out in the SPSS statistical package.

37
Table 4.11 Correlation between Independent variables
poli
tica
l fo
rces
Eco
nom
ic f
orc
es
Soci
al f
orc
es
Tec
hnolo
gic
al f
orc
es
Leg
isla
tive
forc
es
Envir
onm
enta
l fo
rces
Inte
nsi
ty o
f co
mpet
itiv
e
rival
ry
Thre
at o
f n
ew e
ntr
ants
Thre
at o
f su
bst
itute
pro
duct
s
Bar
gai
nin
g p
ow
er o
f
cust
om
ers
Bar
gai
nin
g p
ow
er o
f
suppli
ers
pearson
correlation 1
political forces
Sig.( 2 tailed)
pearson
correlation 0.802 1
Economic forces
Sig.( 2 tailed) 0.000
pearson
correlation 0.723 0.700 1
Social forces
Sig.( 2 tailed) 0.000 0.000
pearson
correlation 0.693 0.806 0.774 1
Technological Forces
Sig.( 2 tailed) 0.000 0.000 0.000
pearson
correlation 0.719 0.851 0.600 0.814 1
Legislative forces
Sig.( 2 tailed) 0.000 0.000 0.002 0.000

38
pearson
correlation 0.726 0.686 0.759 0.475 0.509 1
Environmental Forces
Sig.( 2 tailed) 0.000 0.000 0.000 0.019 0.011
pearson
correlation 0.637 0.820 0.606 0.869 0.907 0.408 1
Intensity of competitive
rivalry
Sig.( 2 tailed) 0.001 0.000 0.002 0.000 0.000 0.048
pearson
correlation 0.646 0.825 0.608 0.754 0.862 0.51 0.92 1
Threat of new entrants
Sig.( 2 tailed) 0.001 0.000 0.002 0.000 0.000 0.011 0.000
pearson
correlation 0.768 0.791 0.795 0.841 0.755 0.58 0.807 0.725 1
Threat of substitute products
Sig.( 2 tailed) 0.000 0.000 0.000 0.000 0.000 0.003 0.000 0.000
pearson
correlation 0.679 0.844 0.709 0.848 0.872 0.478 0.922 0.858 0.843 1
Bargaining power of customers
Sig.( 2 tailed) 0.000 0.000 0.000 0.000 0.000 0.018 0.000 0.000 0.000
pearson
correlation 0.561 0.755 0.647 0.737 0.777 0.575 0.789 0.801 0.675 0.885 1
Bargaining power of
suppliers
Sig.( 2 tailed) 0.004 0.000 0.000 0.000 0.000 0.003 0.000 0.000 0.000 0.000
N=24
correlation is significant at the 0.05 level ( 2 tailed)
Source: Author, 2013

39
Findings from the correlation analysis amongst independent variables indicate
positive correlations on all the bivariate comparisons. From the Table (4.11) out of
the 55 possible bivariate correlation analysis conducted, 50 correlations not only had
positive relationships , but also met the criterion set by the researcher to be of
statistical significance with p values <0.05.The balance of 5 correlations although
positively related did not meet the criterion for significance as they has p values
>0.05.
The strongest positive correlationships (r> 0.9) were between the intensity of
competitive rivalry & bargaining power of customers, threat of new entrants &
competitive rivalry and competitive rivalry & legislative forces with correlation
coefficients (r ) of 0.922,0.920 and 0.907 respectively . Out of the 10 bivariate
correlation comparisons for each force those having strong correlation coefficients
greater than 0.8 were, the bargaining power of customers force had with seven,
followed by the intensity of competitive rivalry and economic forces which had six
each, while legislative forces and the threat of new entrants had 5.
The five bivariate correlations that did not meet the criterion for significance even
though positively related but not strong were between environmental force &
technology, environmental force & legislative force, environmental force & threat of
new entrants , environmental force &bargaining power of customers , competitive
rivalry & environmental forces which had correlations coefficients of 0.475, 0.509
,0.51, 0.478 and 0.408 respectively. The impact of environmental force is weaker on
bivariate correlations between independent variables and closely reflected the same
when correlated against the dependent variables.
4.5.3 Correlation Between Dependent Variables
Even though dependent variables are outcomes or effects from predictor variables, the
study sought to establish the extent to which dependent variables correlate. From a
review of the literature related to this study, the nature of strategy development as a
process and emergent phenomena is noted and hence the need to establish the
interrelationships amongst the outcomes or dimensions of strategy development.

40
Table 4.12 Correlation between dependent variables
vision
and
mission
strategy
evaluation
and strategy
choice
strategy
implementation
strategic
measures
vision and mission
Pearson Correlation 1 .838**
.708**
.822**
Sig. (2-tailed) .000 .000 .000
N 24 24 24 24
strategy evaluation
and strategy choice
Pearson Correlation .838**
1 .795**
.856**
Sig. (2-tailed) .000 .000 .000
N 24 24 24 24
strategy
implementation
Pearson Correlation .708**
.795**
1 .799**
Sig. (2-tailed) .000 .000 .000
N 24 24 24 24
strategy measures
Pearson Correlation .822**
.856**
.799**
1
Sig. (2-tailed) .000 .000 .000
N 24 24 24 24
**. Correlation is significant at the 0.05 level (2-tailed).
Source: Author, 2013
From the analysis (see Table 4.12), there was a strong positive correlation between
vision & mission and strategy evaluation &strategy choice as evidenced by a
correlation coefficient of 0.838. Similarly, there was a positive correlation between
Vision & Mission and strategy implementation as evidenced by a correlation
coefficient of 0.708.A strong positive correlation was also noted between vision &
mission and strategic measures as evidenced by a correlation coefficient of 0.822.
From the analysis it was also apparent that there was a positive correlation between
strategy evaluation & strategy choice and strategy implementation with a correlation
coefficient of 0.795.There is also a strong positive relationship between strategy
evaluation & strategy choice and strategic measures as evidenced by a correlation
coefficient of 0.856. A positive correlation is also evidenced between strategic
measures and strategy implementation with a correlation coefficient of 0.799.The
relationships amongst the dependent variables are all positive and fairly strong and
also meet the criteria for being significant for purposes of the study.
4.5.4 Analysis of Variance (ANOVA)
The study sought to establish whether the various independent variables had an effect
on each of the dependent variables. This was to be done by analyzing and comparing

41
the variability of the scores (means) for the 11 predictor variables (external
environment forces) against each of the strategy development outcomes (dependent
variables) The null hypothesis would be that the means for all independent variables
would be equal while the alternate hypothesis is that the means are not equal . A one
way ANOVA test was used for analysis so that if the means were significantly
different, conclusions would be drawn that Independent Variables (environmental
forces)), had an effect on the dependent variable or ; if they were the same then the
outcomes were chance occurrences rather than effects from manipulation of the
independent variables .
Table 4.13 Dependent variable: Mission and Vision
Model Sum of Squares df Mean Square F Sig.
1
Regression 808.819 11 73.529 13.167 .000b
Residual 67.014 12 5.585
Total 875.833 23
b. Predictors: (Constant), Threat of new entrants, Environmental forces,
Technological forces, Political forces, Bargaining power of suppliers, Threat of
substitute products, Social forces, Legislative forces, Economic forces, Intensity of
competitive rivalry, Bargaining power of customers
Source: Author, 2013
From the ANOVA analysis (Table 4.13), the P-value is 0.000 which is less than the
0.05 (significance level of 5%) and therefore confirming statistically significant
differences between the means of the independent variables being compared. This
leads us to conclude that the dependent variable outcome (mission and vision) is not
attributable to chance but more probably caused by the impacts of environmental
forces (independent variables)

42
Table 4.14 Dependent Variable: strategy evaluation and
strategy choice
Model Sum of Squares df Mean Square F Sig.
1
Regression 835.487 11 75.953 9.593 .000b
Residual 95.013 12 7.918
Total 930.500 23
b. Predictors: (Constant), Threat of new entrants, Environmental forces,
Technological forces, Political forces, Bargaining power of suppliers, Threat of
substitute products, Social forces, Legislative forces, Economic forces, Intensity of
competitive rivalry, Bargaining power of customers
Source: Author, 2013
From the ANOVA analysis ( Table 4.14), the P-value is 0.000 which is less than the
0.05 (significance level of 5%) and therefore confirming statistically significant
differences between the means of the independent variables being compared. This
leads us to conclude that the dependent variable outcome (strategy evaluation and
strategy choice ) is not attributable to chance but more probably caused by the impacts
of environmental forces ( independent variables)
Table 4.15 :Dependent Variable: Strategy implementation
1
Regression 727.174 11 66.107 4.709 .006b
Residual 168.451 12 14.038
Total 895.625 23
b. Predictors: (Constant), Threat of new entrants, Environmental forces, Technological
forces, Political forces, Bargaining power of suppliers, Threat of substitute products,
Social forces, Legislative forces, Economic forces, Intensity of competitive rivalry,
Bargaining power of customers
Source: Author, 2013
From the ANOVA analysis (Table 4.15), the P-value is 0.006 which is less than the
0.05 (significance level of 5%) and therefore confirming statistically significant
differences between the means of the independent variables being compared. This

43
leads us to conclude that the dependent variable outcome (strategy implementation ) is
not attributable to chance but more probably caused by the impacts of environmental
forces ( independent variables)
Table 4.16 Dependent Variable: strategic measures
Model Sum of Squares df Mean Square F Sig.
1
Regression 28787.752 11 2617.068 16.738 .000b
Residual 1876.206 12 156.351
Total 30663.958 23
b. Predictors: (Constant), Threat of new entrants, Environmental forces,
Technological forces, Political forces, Bargaining power of suppliers, Threat of
substitute products, Social forces, Legislative forces, Economic forces, Intensity of
competitive rivalry, Bargaining power of customers
Source: Author, 2013
From the ANOVA analysis (Table 4.16), the P-value is 0.000 which is less than the
0.05 (significance level of 5%) and therefore confirming statistically significant
differences between the means of the independent variables being compared. This
leads us to conclude that the dependent variable outcome (strategic measures) is not
attributable to chance but more probably caused by the impacts of environmental
forces (independent variables)
4.5.5 Univariate ANOVA
The researcher also sought to establish the relationship between each of the
independent and dependent variables i.e linearity of two variables and extent to which
the variability in the dependent variable could be attributed to changes in the predictor
variable.
Table 4.17 Univariate ANOVA: Political Force
Dependent Variable: vision and mission
Source Type III Sum
of Squares
df Mean Square F Sig.
Model 6282.067a 5 1256.413 80.125 .000
political 6282.067 5 1256.413 80.125 .000
Error 297.933 19 15.681
Total 6580.000 24
a. R Squared = .955 (Adjusted R Squared = .943)

44
Dependent Variable: strategy evaluation and strategy choice
Source Type III Sum
of Squares
df Mean Square F Sig.
Model 6927.817a 5 1385.563 77.387 .000
Political 6927.817 5 1385.563 77.387 .000
Error 340.183 19 17.904
Total 7268.000 24
a. R Squared = .953 (Adjusted R Squared = .941)
Dependent Variable: strategy implementation
Source Type III Sum
of Squares
df Mean Square F Sig.
Model 7071.167a 5 1414.233 103.414 .000
political 7071.167 5 1414.233 103.414 .000
Error 259.833 19 13.675
Total 7331.000 24
a. R Squared = .965 (Adjusted R Squared = .955)
Dependent Variable: strategic measures
Source Type III Sum
of Squares
Df Mean Square F Sig.
Model 287737.567a 5 57547.513 168.802 .000
political 287737.567 5 57547.513 168.802 .000
Error 6477.433 19 340.918
Total 294215.000 24
a. R Squared = .978 (Adjusted R Squared = .972)
Source: Author, 2013
Results of the univariate ANOVA as seen from Table 4.17 between political forces
/Vision& Mission ;Political forces /Strategy evaluation & strategy choice; Political
forces / Strategy implementation and; Political forces /strategic measures variables
were all statistically significant as evidenced by P values of 0.000 both for the
regression models and the linear correlations( less than the significance level at P
=0.05) and with the following coefficient of determination statistics -adjusted R
Squared values of 0.943,0.953,0.941 and 0.972 respectively. This implies that 94.3%,
95.3%, 94.1% & 97.2% of the respective outcomes are attributable to the impacts of
the predictor variable (political forces). We conclude that the model is good (the
linear regression represents a good fit) and can be relied upon to explain the

45
relationship between variables as well as offer predictive value of the proportion of an
outcome attributable to a certain condition of the independent variable
Table 4.18 Univariate ANOVA: Economic Force
Dependent Variable: vision and mission
Source Type III Sum
of Squares
Df Mean Square F Sig.
Model 6270.424a 4 1567.606 101.274 .000
economic 6270.424 4 1567.606 101.274 .000
Error 309.576 20 15.479
Total 6580.000 24
a. R Squared = .953 (Adjusted R Squared = .944)
Dependent Variable: strategy evaluation and strategy choice
Source Type III Sum
of Squares
Df Mean Square F Sig.
Model 6954.788a 4 1738.697 111.024 .000
economic 6954.788 4 1738.697 111.024 .000
Error 313.212 20 15.661
Total 7268.000 24
a. R Squared = .957 (Adjusted R Squared = .948)
Dependent Variable: strategy implementation
Source Type III Sum
of Squares
Df Mean Square F Sig.
Model 7095.822a 4 1773.955 150.861 .000
economic 7095.822 4 1773.955 150.861 .000
Error 235.178 20 11.759
Total 7331.000 24
a. R Squared = .968 (Adjusted R Squared = .962)
Dependent Variable: strategy measures
Source Type III Sum
of Squares
Df Mean Square F Sig.
Model 289912.549a 4 72478.137 336.916 .000
Economic 289912.549 4 72478.137 336.916 .000
Error 4302.451 20 215.123
Total 294215.000 24
a. R Squared = .985 (Adjusted R Squared = .982)
Source: Author, 2013

46
The univariate ANOVA as seen from Table 4.18 between Economic forces /Vision&
Mission ;Economic forces /Strategy evaluation & strategy choice; Economic forces /
Strategy implementation and; Economic forces /strategic measures variables were all
statistically significant as evidenced by P values of 0.000 both for the regression
models and the linear correlations( less than the significance level at P =0.05) and
with the following coefficient of determination statistics -adjusted R Squared values
of 0.944,0.948,0.962 and 0.982 respectively. This implies that 94.4%, 94.8%, 96.2%
& 98.2% of the respective outcomes are attributable to the impacts of the predictor
variable( economic forces). We conclude that the model is good (the linear regression
represents a good fit) and can be relied upon to explain the relationship between
variables as well as offer predictive value of the proportion of an outcome attributable
to a certain condition of the independent variable
Table 4.19 Univariate ANOVA: Social Force
Dependent Variable: vision and mission
Source Type III Sum
of Squares
df Mean Square F Sig.
Model 6334.625a 5 1266.925 98.101 .000
social 6334.625 5 1266.925 98.101 .000
Error 245.375 19 12.914
Total 6580.000 24
a. R Squared = .963 (Adjusted R Squared = .953)
Dependent Variable: strategy evaluation and strategy choice
Source Type III Sum
of Squares
df Mean Square F Sig.
Model 6989.325a 5 1397.865 95.306 .000
social 6989.325 5 1397.865 95.306 .000
Error 278.675 19 14.667
Total 7268.000 24
a. R Squared = .962 (Adjusted R Squared = .952)

47
Dependent Variable: strategy implementation
Source Type III Sum
of Squares
df Mean Square F Sig.
Model 7092.325a 5 1418.465 112.919 .000
social 7092.325 5 1418.465 112.919 .000
Error 238.675 19 12.562
Total 7331.000 24
a. R Squared = .967 (Adjusted R Squared = .959)
Dependent Variable: strategy measures
Source Type III Sum
of Squares
df Mean Square F Sig.
Model 289439.450a 5 57887.890 230.313 .000
social 289439.450 5 57887.890 230.313 .000
Error 4775.550 19 251.345
Total 294215.000 24
a. R Squared = .984 (Adjusted R Squared = .979)
Source: Author, 2013
The univariate ANOVA as seen from Table 4.19 between Social forces /Vision&
Mission ;Social forces /Strategy evaluation & strategy choice; Social forces / Strategy
implementation and; Social forces /strategic measures variables were all statistically
significant as evidenced by P values of 0.000 both for the regression models and the
linear correlations( less than the significance level at P =0.05) and with the following
coefficient of determination statistics -adjusted R Squared values of
0.953,0.952,0.959,0.962 and 0.979 respectively. This implies that 95.3.%, 95.2%,
95.9% & 97.9% of the respective outcomes are attributable to the impacts of the
predictor variable ( social forces). We conclude that the model is good (the linear
regression represents a good fit) and can be relied upon to explain the relationship
between variables as well as offer predictive value of the proportion of an outcome
attributable to a certain condition of the independent variable
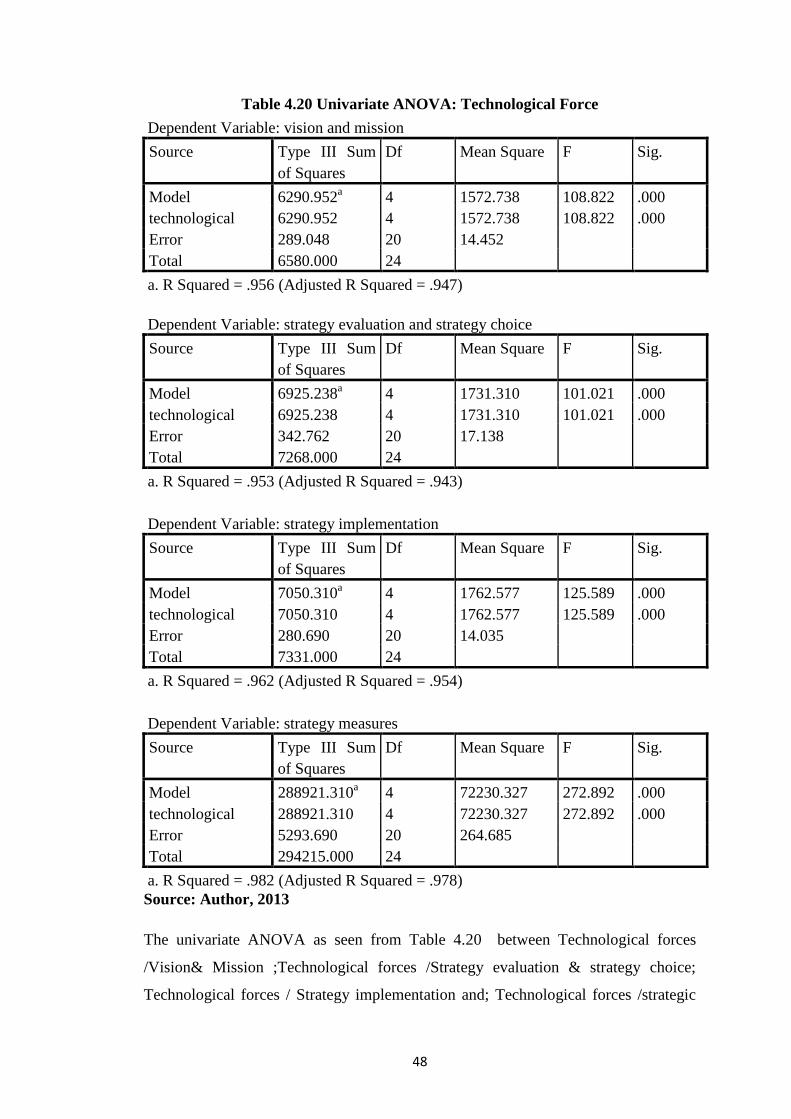
48
Table 4.20 Univariate ANOVA: Technological Force
Dependent Variable: vision and mission
Source Type III Sum
of Squares
Df Mean Square F Sig.
Model 6290.952a 4 1572.738 108.822 .000
technological 6290.952 4 1572.738 108.822 .000
Error 289.048 20 14.452
Total 6580.000 24
a. R Squared = .956 (Adjusted R Squared = .947)
Dependent Variable: strategy evaluation and strategy choice
Source Type III Sum
of Squares
Df Mean Square F Sig.
Model 6925.238a 4 1731.310 101.021 .000
technological 6925.238 4 1731.310 101.021 .000
Error 342.762 20 17.138
Total 7268.000 24
a. R Squared = .953 (Adjusted R Squared = .943)
Dependent Variable: strategy implementation
Source Type III Sum
of Squares
Df Mean Square F Sig.
Model 7050.310a 4 1762.577 125.589 .000
technological 7050.310 4 1762.577 125.589 .000
Error 280.690 20 14.035
Total 7331.000 24
a. R Squared = .962 (Adjusted R Squared = .954)
Dependent Variable: strategy measures
Source Type III Sum
of Squares
Df Mean Square F Sig.
Model 288921.310a 4 72230.327 272.892 .000
technological 288921.310 4 72230.327 272.892 .000
Error 5293.690 20 264.685
Total 294215.000 24
a. R Squared = .982 (Adjusted R Squared = .978)
Source: Author, 2013
The univariate ANOVA as seen from Table 4.20 between Technological forces
/Vision& Mission ;Technological forces /Strategy evaluation & strategy choice;
Technological forces / Strategy implementation and; Technological forces /strategic

49
measures variables were all statistically significant as evidenced by P values of 0.000
both for the regression models and the linear correlations( less than the significance
level at P =0.05) and with the following coefficient of determination statistics -
adjusted R Squared values of 0.947,0.943,0.954,0.962 and 0.978 respectively. This
implies that 94.7%, 94.3%, 95.4% & 97.8% of the respective outcomes are
attributable to the impacts of the predictor variable ( Technological forces). We
conclude that the model is good (the linear regression represents a good fit) and can
be relied upon to explain the relationship between variables as well as offer predictive
value of the proportion of an outcome attributable to a certain condition of the
independent variable
Table 4.21 Univariate ANOVA: Legislative Force
Dependent Variable: vision and mission
Source Type III Sum
of Squares
Df Mean Square F Sig.
Model 6245.958a 4 1561.490 93.491 .000
legislative 6245.958 4 1561.490 93.491 .000
Error 334.042 20 16.702
Total 6580.000 24
a. R Squared = .949 (Adjusted R Squared = .939)
Dependent Variable: strategy evaluation and strategy choice
Source Type III Sum
of Squares
Df Mean Square F Sig.
Model 6931.875a 4 1732.969 103.115 .000
legislative 6931.875 4 1732.969 103.115 .000
Error 336.125 20 16.806
Total 7268.000 24
a. R Squared = .954 (Adjusted R Squared = .945)
Dependent Variable: strategy implementation
Source Type III Sum
of Squares
Df Mean Square F Sig.
Model 7108.083a 4 1777.021 159.434 .000
legislative 7108.083 4 1777.021 159.434 .000
Error 222.917 20 11.146
Total 7331.000 24
a. R Squared = .970 (Adjusted R Squared = .964)
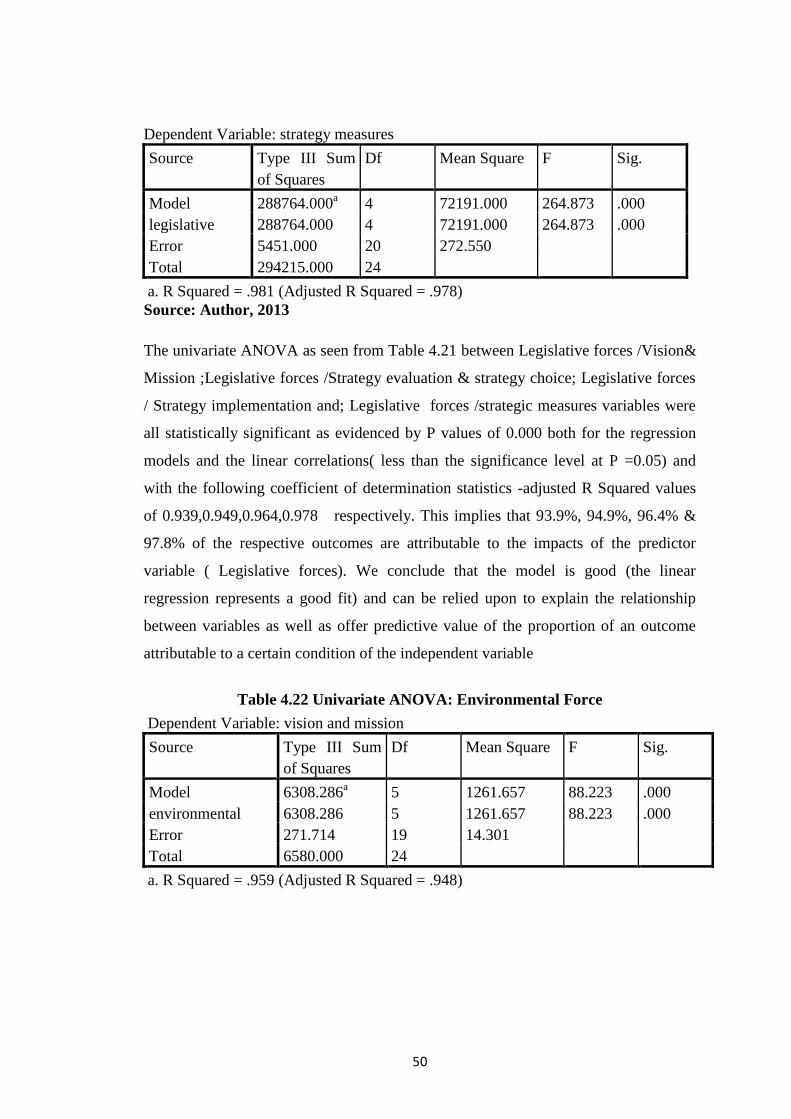
50
Dependent Variable: strategy measures
Source Type III Sum
of Squares
Df Mean Square F Sig.
Model 288764.000a 4 72191.000 264.873 .000
legislative 288764.000 4 72191.000 264.873 .000
Error 5451.000 20 272.550
Total 294215.000 24
a. R Squared = .981 (Adjusted R Squared = .978)
Source: Author, 2013
The univariate ANOVA as seen from Table 4.21 between Legislative forces /Vision&
Mission ;Legislative forces /Strategy evaluation & strategy choice; Legislative forces
/ Strategy implementation and; Legislative forces /strategic measures variables were
all statistically significant as evidenced by P values of 0.000 both for the regression
models and the linear correlations( less than the significance level at P =0.05) and
with the following coefficient of determination statistics -adjusted R Squared values
of 0.939,0.949,0.964,0.978 respectively. This implies that 93.9%, 94.9%, 96.4% &
97.8% of the respective outcomes are attributable to the impacts of the predictor
variable ( Legislative forces). We conclude that the model is good (the linear
regression represents a good fit) and can be relied upon to explain the relationship
between variables as well as offer predictive value of the proportion of an outcome
attributable to a certain condition of the independent variable
Table 4.22 Univariate ANOVA: Environmental Force
Dependent Variable: vision and mission
Source Type III Sum
of Squares
Df Mean Square F Sig.
Model 6308.286a 5 1261.657 88.223 .000
environmental 6308.286 5 1261.657 88.223 .000
Error 271.714 19 14.301
Total 6580.000 24
a. R Squared = .959 (Adjusted R Squared = .948)

51
Dependent Variable: strategy evaluation and strategy choice
Source Type III Sum
of Squares
Df Mean Square F Sig.
Model 6958.571a 5 1391.714 85.456 .000
environmental 6958.571 5 1391.714 85.456 .000
Error 309.429 19 16.286
Total 7268.000 24
a. R Squared = .957 (Adjusted R Squared = .946)
Dependent Variable: strategy implementation
Source Type III Sum
of Squares
Df Mean Square F Sig.
Model 7100.886a 5 1420.177 117.261 .000
environmental 7100.886 5 1420.177 117.261 .000
Error 230.114 19 12.111
Total 7331.000 24
a. R Squared = .969 (Adjusted R Squared = .960)
Dependent Variable: strategy measures
Source Type III Sum
of Squares
Df Mean Square F Sig.
Model 288627.800a 5 57725.560 196.303 .000
environmental 288627.800 5 57725.560 196.303 .000
Error 5587.200 19 294.063
Total 294215.000 24
a. R Squared = .981 (Adjusted R Squared = .976)
The univariate ANOVA as seen from Table 4.22 between Environmental forces
/Vision& Mission ;Environmental forces /Strategy evaluation & strategy choice;
Environmental forces / Strategy implementation and; Environmental forces /strategic
measures variables were all statistically significant as evidenced by P values of 0.000
both for the regression models and the linear correlations( less than the significance
level at P =0.05) and with the following coefficient of determination statistics -
adjusted R Squared values of 0.948,0.946,0.960,0.976 respectively. This implies that
94.8%, 94.6%, 96.0% & 97.6% of the respective outcomes are attributable to the
impacts of the predictor variable (Environmental forces). We conclude that the model
is good (the linear regression represents a good fit) and can be relied upon to explain

52
the relationship between variables as well as offer predictive value of the proportion
of an outcome attributable to a certain condition of the independent variable
Table 4.23 Univariate ANOVA: Threat of substitute products
Dependent Variable: vision and mission
Source Type III Sum
of Squares
Df Mean Square F Sig.
Model 6357.843a 4 1589.461 143.093 .000
Threat sub.prod 6357.843 4 1589.461 143.093 .000
Error 222.157 20 11.108
Total 6580.000 24
a. R Squared = .966 (Adjusted R Squared = .959)
Dependent Variable: strategy evaluation and strategy choice
Source Type III Sum
of Squares
Df Mean Square F Sig.
Model 6992.743a 4 1748.186 127.022 .000
Threat sub prod 6992.743 4 1748.186 127.022 .000
Error 275.257 20 13.763
Total 7268.000 24
a. R Squared = .962 (Adjusted R Squared = .955)
Dependent Variable: strategy implementation
Source Type III Sum
of Squares
Df Mean Square F Sig.
Model 7064.671a 4 1766.168 132.631 .000
Threat sub prod 7064.671 4 1766.168 132.631 .000
Error 266.329 20 13.316
Total 7331.000 24
a. R Squared = .964 (Adjusted R Squared = .956)
Dependent Variable: strategy measures
Source Type III Sum of
Squares
Df Mean Square F Sig.
Model 288515.871a 4 72128.968 253.123 .000
threatsubprod5cat 288515.871 4 72128.968 253.123 .000
Error 5699.129 20 284.956
Total 294215.000 24
a. R Squared = .981 (Adjusted R Squared = .977)
Dependent Variable: vision and mission
Source: Author, 2013
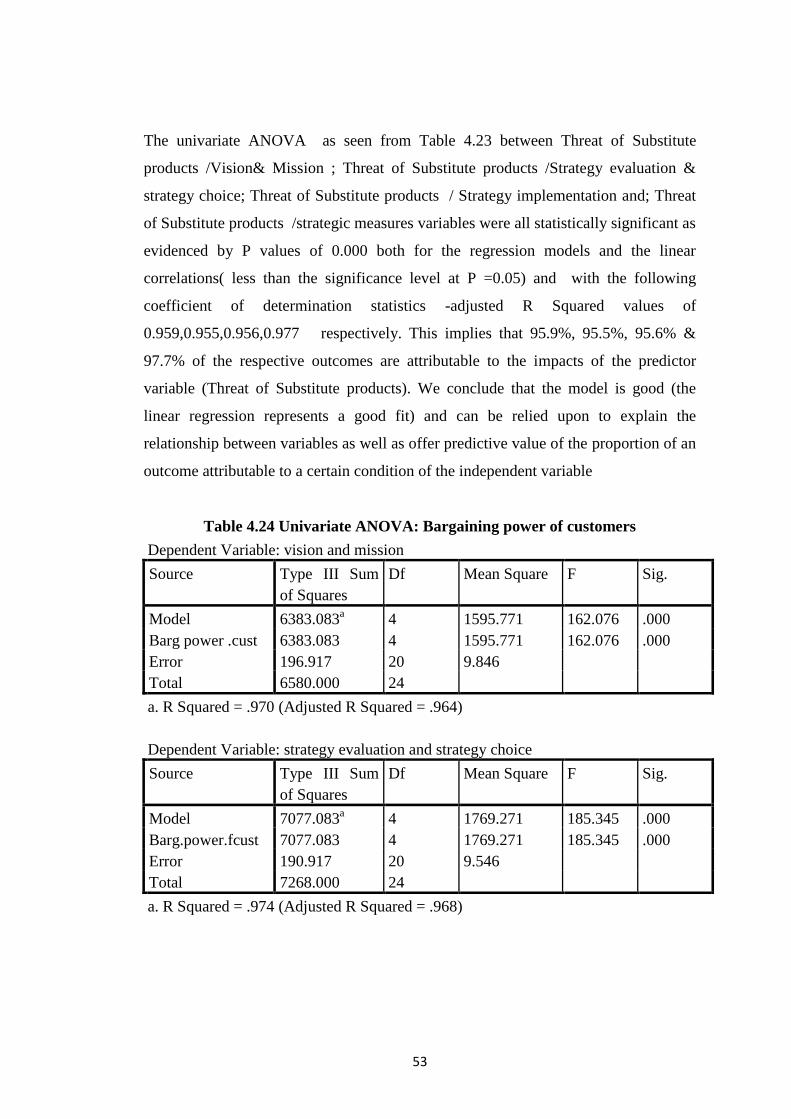
53
The univariate ANOVA as seen from Table 4.23 between Threat of Substitute
products /Vision& Mission ; Threat of Substitute products /Strategy evaluation &
strategy choice; Threat of Substitute products / Strategy implementation and; Threat
of Substitute products /strategic measures variables were all statistically significant as
evidenced by P values of 0.000 both for the regression models and the linear
correlations( less than the significance level at P =0.05) and with the following
coefficient of determination statistics -adjusted R Squared values of
0.959,0.955,0.956,0.977 respectively. This implies that 95.9%, 95.5%, 95.6% &
97.7% of the respective outcomes are attributable to the impacts of the predictor
variable (Threat of Substitute products). We conclude that the model is good (the
linear regression represents a good fit) and can be relied upon to explain the
relationship between variables as well as offer predictive value of the proportion of an
outcome attributable to a certain condition of the independent variable
Table 4.24 Univariate ANOVA: Bargaining power of customers
Dependent Variable: vision and mission
Source Type III Sum
of Squares
Df Mean Square F Sig.
Model 6383.083a 4 1595.771 162.076 .000
Barg power .cust 6383.083 4 1595.771 162.076 .000
Error 196.917 20 9.846
Total 6580.000 24
a. R Squared = .970 (Adjusted R Squared = .964)
Dependent Variable: strategy evaluation and strategy choice
Source Type III Sum
of Squares
Df Mean Square F Sig.
Model 7077.083a 4 1769.271 185.345 .000
Barg.power.fcust 7077.083 4 1769.271 185.345 .000
Error 190.917 20 9.546
Total 7268.000 24
a. R Squared = .974 (Adjusted R Squared = .968)

54
Dependent Variable: strategy implementation
Source Type III Sum
of Squares
Df Mean Square F Sig.
Model 7130.778a 4 1782.694 178.072 .000
Barg power cust 7130.778 4 1782.694 178.072 .000
Error 200.222 20 10.011
Total 7331.000 24
a. R Squared = .973 (Adjusted R Squared = .967)
Dependent Variable: strategy measures
Source Type III Sum
of Squares
Df Mean Square F Sig.
Model 289996.111a 4 72499.028 343.688 .000
Barg power cust 289996.111 4 72499.028 343.688 .000
Error 4218.889 20 210.944
Total 294215.000 24
a. R Squared = .986 (Adjusted R Squared = .983)
Source: Author, 2013
The univariate ANOVA as seen from Table 4.24 between Bargaining power of
customers/Vision& Mission ; Bargaining power of customers /Strategy evaluation &
strategy choice; Bargaining power of customers / Strategy implementation and;
Bargaining power of customers /strategic measures variables were all statistically
significant as evidenced by P values of 0.000 both for the regression models and the
linear correlations( less than the significance level at P =0.05) and with the following
coefficient of determination statistics -adjusted R Squared values of
0.964,0.968,0.967,0.983 respectively. This implies that 96.4%, 96.8%, 96.7% &
98.3% of the respective outcomes are attributable to the impacts of the predictor
variable (Bargaining power of customers). We conclude that the model is good (the
linear regression represents a good fit) and can be relied upon to explain the
relationship between variables as well as offer predictive value of the proportion of an
outcome attributable to a certain condition of the independent variable

55
Table 4.25 Univariate ANOVA: Bargaining Power of suppliers
Dependent Variable: vision and mission
Source Type III Sum
of Squares
df Mean Square F Sig.
Model 6348.800a 5 1269.760 104.349 .000
Barg.power.supp 6348.800 5 1269.760 104.349 .000
Error 231.200 19 12.168
Total 6580.000 24
a. R Squared = .965 (Adjusted R Squared = .956)
Dependent Variable: strategy evaluation and strategy choice
Source Type III Sum
of Squares
df Mean Square F Sig.
Model 7027.700a 5 1405.540 111.133 .000
Barg.power supp 7027.700 5 1405.540 111.133 .000
Error 240.300 19 12.647
Total 7268.000 24
a. R Squared = .967 (Adjusted R Squared = .958)
Dependent Variable: strategy implementation
Source Type III Sum
of Squares
df Mean Square F Sig.
Model 7045.800a 5 1409.160 93.878 .000
Barg.power.supp 7045.800 5 1409.160 93.878 .000
Error 285.200 19 15.011
Total 7331.000 24
a. R Squared = .961 (Adjusted R Squared = .951)
Dependent Variable: strategy measures
Source Type III Sum
of Squares
df Mean Square F Sig.
Model 289528.700a 5 57905.740 234.771 .000
bpowerofsup5cat 289528.700 5 57905.740 234.771 .000
Error 4686.300 19 246.647
Total 294215.000 24
a. R Squared = .984 (Adjusted R Squared = .980)
Dependent Variable: vision and mission
Source Type III Sum
of Squares
df Mean Square F Sig.
Model 6348.800a 5 1269.760 104.349 .000
bpowerofsup5cat 6348.800 5 1269.760 104.349 .000
Error 231.200 19 12.168
Total 6580.000 24
a. R Squared = .965 (Adjusted R Squared = .956)

56
Dependent Variable: strategy evaluation and strategy choice
Source Type III Sum
of Squares
df Mean Square F Sig.
Model 7027.700a 5 1405.540 111.133 .000
bpowerofsup5cat 7027.700 5 1405.540 111.133 .000
Error 240.300 19 12.647
Total 7268.000 24
a. R Squared = .967 (Adjusted R Squared = .958)
Dependent Variable: strategy implementation
Source Type III Sum
of Squares
df Mean Square F Sig.
Model 7045.800a 5 1409.160 93.878 .000
bpowerofsup5cat 7045.800 5 1409.160 93.878 .000
Error 285.200 19 15.011
Total 7331.000 24
a. R Squared = .961 (Adjusted R Squared = .951)
Dependent Variable: strategy measures
Source Type III Sum
of Squares
df Mean Square F Sig.
Model 289528.700a 5 57905.740 234.771 .000
bpowerofsup5cat 289528.700 5 57905.740 234.771 .000
Error 4686.300 19 246.647
Total 294215.000 24
a. R Squared = .984 (Adjusted R Squared = .980)
Source: Author, 2013
The univariate ANOVA as seen from Table 4.25 between Bargaining power of
suppliers/Vision& Mission ; Bargaining power of suppliers /Strategy evaluation &
strategy choice; Bargaining power of suppliers / Strategy implementation and; /
Bargaining power of suppliers /strategic measures variables were all statistically
significant as evidenced by P values of 0.000 both for the regression models and the
linear correlations( less than the significance level at P =0.05) and with the following
coefficient of determination statistics -adjusted R Squared values of
0.956,0.958,0.952,0.980 respectively. This implies that 95.6%, 95.8%, 95.2% &
98.0% of the respective outcomes are attributable to the impacts of the predictor
variable (Bargaining power of suppliers ). We conclude that the model is good (the
linear regression represents a good fit) and can be relied upon to explain the

57
relationship between variables as well as offer predictive value of the proportion of an
outcome attributable to a certain condition of the independent variable
Table 4.26 Univariate ANOVA: Intensity of competitive rivalry
Dependent Variable: vision and mission
Source Type III Sum
of Squares
df Mean Square F Sig.
Model 6354.277a 4 1588.569 140.754 .000
Int compt rivalry 6354.277 4 1588.569 140.754 .000
Error 225.723 20 11.286
Total 6580.000 24
a. R Squared = .966 (Adjusted R Squared = .959)
Dependent Variable: strategy evaluation and strategy choice
Source Type III Sum
of Squares
df Mean Square F Sig.
Model 7058.943a 4 1764.736 168.828 .000
Int compt rivalry 7058.943 4 1764.736 168.828 .000
Error 209.057 20 10.453
Total 7268.000 24
a. R Squared = .971 (Adjusted R Squared = .965)
Dependent Variable: strategy implementation
Source Type III Sum
of Squares
df Mean Square F Sig.
Model 7098.652a 4 1774.663 152.759 .000
Int compt rivalry 7098.652 4 1774.663 152.759 .000
Error 232.348 20 11.617
Total 7331.000 24
a. R Squared = .968 (Adjusted R Squared = .962)
Dependent Variable: strategy measures
Source Type III Sum
of Squares
df Mean Square F Sig.
Model 291417.943a 4 72854.486 520.937 .000
int compt rivalry 291417.943 4 72854.486 520.937 .000
Error 2797.057 20 139.853
Total 294215.000 24
a. R Squared = .990 (Adjusted R Squared = .989)
Source: Author, 2013
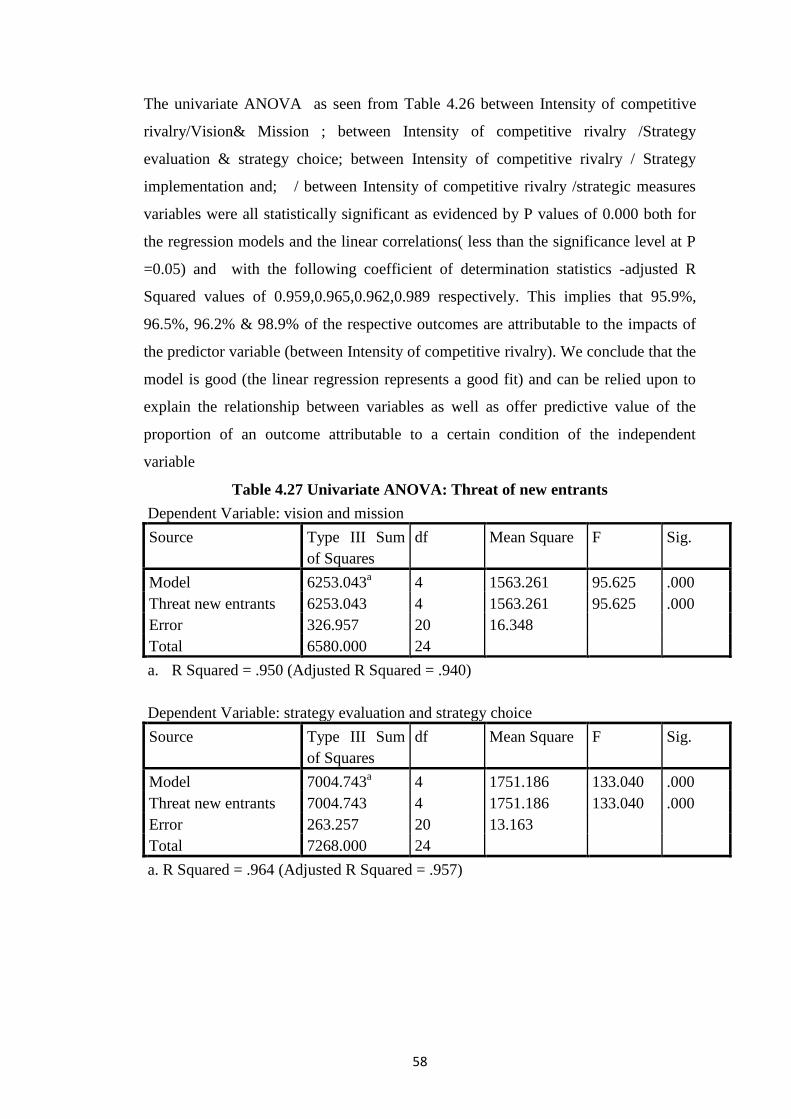
58
The univariate ANOVA as seen from Table 4.26 between Intensity of competitive
rivalry/Vision& Mission ; between Intensity of competitive rivalry /Strategy
evaluation & strategy choice; between Intensity of competitive rivalry / Strategy
implementation and; / between Intensity of competitive rivalry /strategic measures
variables were all statistically significant as evidenced by P values of 0.000 both for
the regression models and the linear correlations( less than the significance level at P
=0.05) and with the following coefficient of determination statistics -adjusted R
Squared values of 0.959,0.965,0.962,0.989 respectively. This implies that 95.9%,
96.5%, 96.2% & 98.9% of the respective outcomes are attributable to the impacts of
the predictor variable (between Intensity of competitive rivalry). We conclude that the
model is good (the linear regression represents a good fit) and can be relied upon to
explain the relationship between variables as well as offer predictive value of the
proportion of an outcome attributable to a certain condition of the independent
variable
Table 4.27 Univariate ANOVA: Threat of new entrants
Dependent Variable: vision and mission
Source Type III Sum
of Squares
df Mean Square F Sig.
Model 6253.043a 4 1563.261 95.625 .000
Threat new entrants 6253.043 4 1563.261 95.625 .000
Error 326.957 20 16.348
Total 6580.000 24
a. R Squared = .950 (Adjusted R Squared = .940)
Dependent Variable: strategy evaluation and strategy choice
Source Type III Sum
of Squares
df Mean Square F Sig.
Model 7004.743a 4 1751.186 133.040 .000
Threat new entrants 7004.743 4 1751.186 133.040 .000
Error 263.257 20 13.163
Total 7268.000 24
a. R Squared = .964 (Adjusted R Squared = .957)
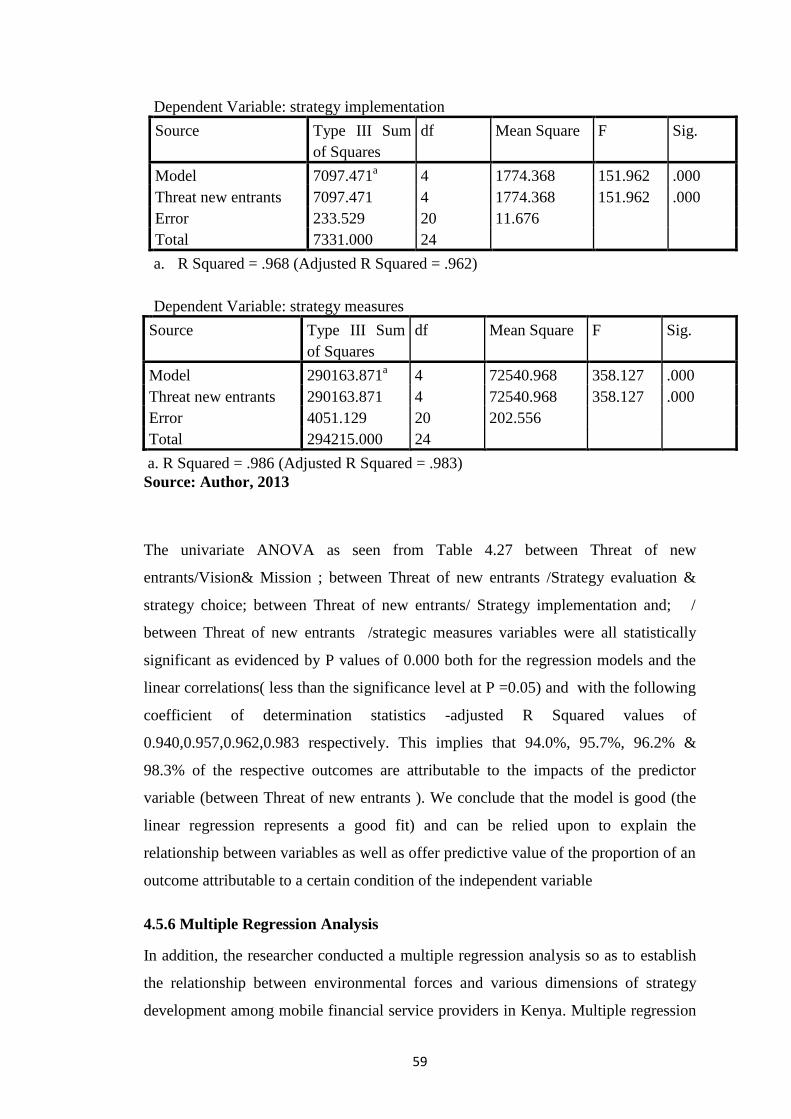
59
Dependent Variable: strategy implementation
Source Type III Sum
of Squares
df Mean Square F Sig.
Model 7097.471a 4 1774.368 151.962 .000
Threat new entrants 7097.471 4 1774.368 151.962 .000
Error 233.529 20 11.676
Total 7331.000 24
a. R Squared = .968 (Adjusted R Squared = .962)
Dependent Variable: strategy measures
Source Type III Sum
of Squares
df Mean Square F Sig.
Model 290163.871a 4 72540.968 358.127 .000
Threat new entrants 290163.871 4 72540.968 358.127 .000
Error 4051.129 20 202.556
Total 294215.000 24
a. R Squared = .986 (Adjusted R Squared = .983)
Source: Author, 2013
The univariate ANOVA as seen from Table 4.27 between Threat of new
entrants/Vision& Mission ; between Threat of new entrants /Strategy evaluation &
strategy choice; between Threat of new entrants/ Strategy implementation and; /
between Threat of new entrants /strategic measures variables were all statistically
significant as evidenced by P values of 0.000 both for the regression models and the
linear correlations( less than the significance level at P =0.05) and with the following
coefficient of determination statistics -adjusted R Squared values of
0.940,0.957,0.962,0.983 respectively. This implies that 94.0%, 95.7%, 96.2% &
98.3% of the respective outcomes are attributable to the impacts of the predictor
variable (between Threat of new entrants ). We conclude that the model is good (the
linear regression represents a good fit) and can be relied upon to explain the
relationship between variables as well as offer predictive value of the proportion of an
outcome attributable to a certain condition of the independent variable
4.5.6 Multiple Regression Analysis
In addition, the researcher conducted a multiple regression analysis so as to establish
the relationship between environmental forces and various dimensions of strategy
development among mobile financial service providers in Kenya. Multiple regression

60
is a statistical technique that allows us to predict a score of one variable on the basis
of their scores on several other variables. The main purpose of multiple regressions is
to learn more about the relationship between several independent or predictor
variables and a dependent or criterion variable
Table 4.28 Regression : vision and mission
Model Sum of
Squares
df Mean Square F Sig.
1
Regression 808.819 11 73.529 13.167 .000b
Residual 67.014 12 5.585
Total 875.833 23
a. Dependent Variable: vision and mission
b. Predictors: (Constant), environmental forces
Coefficientsa
Model Unstandardized
Coefficients
Standardized
Coefficients
t Sig.
B Std.
Error
Beta
1
(Constant) -.620 1.540 -.403 .694
Political forces .401 .178 .412 2.258 .043
Economic forces .625 .263 .644 2.372 .035
Social forces 1.163 .284 1.198 4.098 .001
Technological forces -.720 .297 -.810 -2.426 .032
Legislative forces .102 .218 .107 .467 .649
Environmental forces -.865 .243 -.987 -3.558 .004
Threat of substitute products .226 .192 .251 1.181 .260
Bargaining power of
customers -1.229 .475 -1.319 -2.588 .024
Bargaining power of
suppliers 1.099 .282 1.172 3.898 .002
Intensity of competitive
rivalry .771 .455 .818 1.693 .116
Threat of new entrants -.509 .280 -.528 -1.816 .094
Source: Author, 2013

61
The researcher conducted a multiple regression analysis so as to establish the
relationship between various dimensions of strategy development and the eleven
independent (external environment) variables.
The regression equation (Y = β0 + β1X1 + β2X2 + β3X3 + β4X4+ β5X5 + β6X6+ β7X7+
β8X8+ β9 X9+ β10X10+n β11X11 ) now becomes based on the coefficients derived in
Table 4.28:
(Y = -0.620+0.401X + 0.625X2 + 1.163X3 -0.720X4+ 0.102X5 -0.865X6+ 0.226X7-
1.229 X8+ 1.099 X9+ 0.771X10-0.509X11 )
(NB: Adjustments can be made for the Standard error to get relevant range)
Where
Y=Mission and Vision
X1 = political forces ;X2= economic forces; X3=social forces X4; =technological
forces;X5 = legislative forces; X6= environmental forces; X7=threat of substitute
products; X8=bargaining power of customers; X9 =bargaining power of suppliers
;X10= intensity of competitive rivalry; X11=threat of new entrants
According to the regression equation established, taking all independent variables
political forces, economic forces, social forces, technological force, legislative forces,
environmental forces, threat of substitute products, bargaining power of customers,
bargaining power of suppliers , intensity of competitive rivalry and threat of new
entrants constant at zero , the vision and mission outcomes would regress or be
negatively impacted by a magnitude of -0.620 among mobile financial service
providers in Kenya .The data findings also indicate that all the independent variables
with the exception of legislative, threat of substitute products and intensity of
competitive rivalry had a significant impact on the vision and mission variable given
they all had lower p values than the 0.05 significance level .From the study Social
forces (P value of 0.001)= had the biggest impact on vision mission where a unit
increase assuming all other forces constant led to a 1.226 increase in vision and
mission outcome .In terms of order of impact the other significant forces were
intensity of competitive rivalry, economic forces and political forces with
contributions to vision and mission outcomes of 0.771, 0.625 and 0.401respectively

62
for every unit increase. Interestingly for every unit increase in the bargaining power of
customers it had a significant negative impact on vision and mission outcomes with a
contribution of -1.229.
Table 4.29 Regression : strategy evaluation and strategy choice
Model Sum of
Squares
df Mean Square F Sig.
1
Regression 835.487 11 75.953 9.593 .000b
Residual 95.013 12 7.918
Total 930.500 23
a. Dependent Variable: strategy evaluation and strategy choice
b. Predictors: (Constant), environmental forces
Coefficientsa
Model Unstandardized
Coefficients
Standardized
Coefficients
t Sig.
B Std.
Error
Beta
1
(Constant) .486 1.834 .265 .796
Political forces -.147 .211 -.147 -.697 .499
Economic forces .328 .314 .328 1.047 .316
Social forces .633 .338 .633 1.875 .085
Technological forces -.467 .354 -.510 -1.321 .211
Legislative forces -.358 .259 -.365 -1.380 .193
Environmental forces -.244 .290 -.270 -.842 .416
Threat of substitute products .075 .228 .081 .329 .748
bargaining power of
customers -.037 .565 -.039 -.066 .949
Bargaining power of
suppliers .322 .336 .333 .958 .357
Intensity of competitive
rivalry .627 .542 .645 1.156 .270
Threat of new entrants .241 .334 .243 .724 .483
a. Dependent Variable: strategy evaluation and strategy choice
Source: Author, 2013

63
The regression equation (Y = β0 + β1X1 + β2X2 + β3X3 + β4X4+ β5X5 + β6X6+ β7X7+
β8X8+ β9 X9+ β10X10+n β11X11 ) now becomes based on coefficients derived in Table
4.29:
(Y = 0.486-0.147X + 0.328X2 + 0.633X3 -0.467X4-0.358X5 -0.244X6+ 0.075X7-0.037
X8+ 0.322 X9+ 0.627X10+0.241X11 )
(NB: Adjustments can be made for the Standard error to get relevant range)
Where
Y=Strategy evaluation and strategy choice
X1 = political forces; X2= economic forces; X3=social forces X4; =technological
forces;X5 = legislative forces; X6= environmental forces; X7=threat of substitute
products; X8=bargaining power of customers; X9 =bargaining power of suppliers
;X10= intensity of competitive rivalry; X11=threat of new entrants
From the regression equation , the findings indicate that all independent variables
being constant at zero, the level of strategy evaluation and strategy choice amongst
firms in the mobile money market would be at 0.486.Interestingly using the
significance level criterion at p=0.05, the findings are statistically insignificant as all
the P values are greater than 0.05.This implies that the contributions to strategy
evaluation and strategy choice are not necessarily attributable to the predictor
variables and the regression equation may not be a good predictor of strategy
evaluation and strategy choice outcomes.
Table 4.30 Regression : strategy implementation
Model Sum of
Squares
df Mean Square F Sig.
1
Regression 727.174 11 66.107 4.709 .006b
Residual 168.451 12 14.038
Total 895.625 23
a. Dependent Variable: strategy implementation
b. Predictors: (Constant), environmental forces

64
Coefficientsa
Model Unstandardized
Coefficients
Standardized
Coefficients
t Sig.
B Std.
Error
Beta
1
(Constant) .286 2.441 .117 .909
Political forces -.141 .282 -.143 -.501 .625
Economic forces .053 .418 .054 .127 .901
Social forces .061 .450 .062 .135 .895
Technological forces .158 .471 .176 .335 .743
Legislative forces .366 .345 .381 1.061 .309
Environmental forces .179 .386 .202 .463 .652
Threat of substitute
products -.125 .304 -.137 -.412 .688
Bargaining power of
customers .665 .753 .706 .884 .394
Bargaining power of
suppliers -.225 .447 -.237 -.502 .625
Intensity of competitive
rivalry -.662 .722 -.695 -.918 .377
Threat of new entrants .583 .444 .599 1.313 .214
a. Dependent Variable: strategy implementation
Source: Author, 2013
The regression equation (Y = β0 + β1X1 + β2X2 + β3X3 + β4X4+ β5X5 + β6X6+ β7X7+
β8X8+ β9 X9+ β10X10+n β11X11 ) now becomes based on coefficients from Table 4.30:
(Y = 0.286-0.141X + 0.328X2 + 0.53X3 +0.61X4+0.158X5 -0.366X6+ 0.179X7-0.125
X8+ 0.665 X9-0.225- 0.662X10+0.583X11)
(NB: Adjustments can be made for the Standard error to get relevant range)
Where
Y=Strategy implementation
X1 = political forces; X2= economic forces; X3=social forces X4; =technological
forces;X5 = legislative forces; X6= environmental forces; X7=threat of substitute
products; X8=bargaining power of customers; X9 =bargaining power of suppliers
;X10= intensity of competitive rivalry; X11=threat of new entrants

65
From the regression equation , the findings indicate that all independent variables
being constant at zero, the residual level of strategy implementation is 0.286
amongst firms in the mobile money market .Interestingly using the significance level
criterion at p=0.05, the findings are statistically insignificant for all the independent
variables as all the P values are greater than 0.05.This implies that the contributions to
strategy evaluation and strategy choice are not necessarily attributable to the predictor
variables. This leads us to conclude that the regression model may not be a good
predictor of the outcomes for the strategy implementation dimension.
Table 4.31 Regression: Strategic measures
Model Sum of
Squares
df Mean Square F Sig.
1
Regression 28787.752 11 2617.068 16.738 .000b
Residual 1876.206 12 156.351
Total 30663.958 23
a. Dependent Variable: strategy measures
b. Predictors: (Constant), environmental forces
Coefficientsa
Model Unstandardized
Coefficients
Standardized
Coefficients
t Sig.
B Std. Error Beta
1
(Constant) 3.535 8.148 .434 .672
Political forces -1.070 .940 -.186 -1.139 .277
Economic forces 1.643 1.394 .286 1.179 .261
Social forces 3.448 1.501 .600 2.297 .040
Technological forces -.220 1.571 -.042 -.140 .891
Legislative forces .632 1.152 .112 .548 .594
Environmental forces -.121 1.287 -.023 -.094 .926
Threat of substitute products -1.286 1.014 -.241 -1.268 .229
Bargaining power of
customers -.840 2.513 -.152 -.334 .744
Bargaining power of
suppliers .318 1.493 .057 .213 .835
Intensity of competitive
rivalry 3.191 2.409 .572 1.325 .210
Threat of new entrants .384 1.482 .067 .259 .800
a. Dependent Variable: strategy measures
Source: Author, 2013
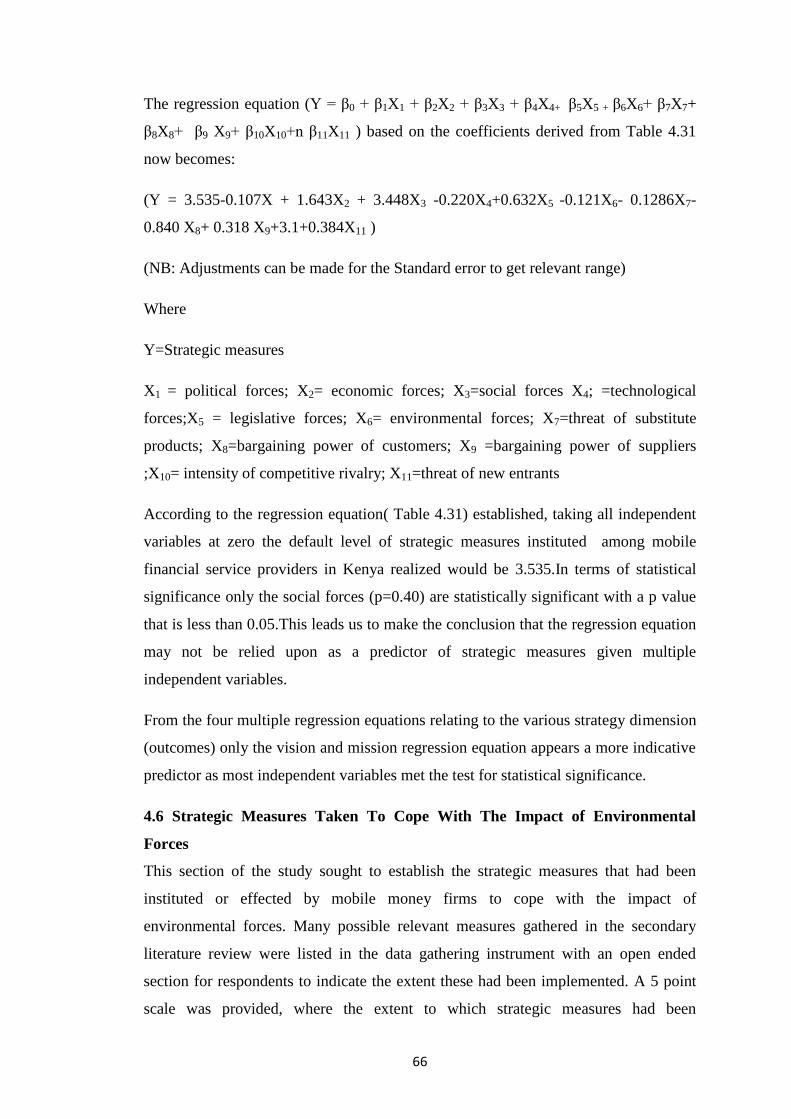
66
The regression equation (Y = β0 + β1X1 + β2X2 + β3X3 + β4X4+ β5X5 + β6X6+ β7X7+
β8X8+ β9 X9+ β10X10+n β11X11 ) based on the coefficients derived from Table 4.31
now becomes:
(Y = 3.535-0.107X + 1.643X2 + 3.448X3 -0.220X4+0.632X5 -0.121X6- 0.1286X7-
0.840 X8+ 0.318 X9+3.1+0.384X11 )
(NB: Adjustments can be made for the Standard error to get relevant range)
Where
Y=Strategic measures
X1 = political forces; X2= economic forces; X3=social forces X4; =technological
forces;X5 = legislative forces; X6= environmental forces; X7=threat of substitute
products; X8=bargaining power of customers; X9 =bargaining power of suppliers
;X10= intensity of competitive rivalry; X11=threat of new entrants
According to the regression equation( Table 4.31) established, taking all independent
variables at zero the default level of strategic measures instituted among mobile
financial service providers in Kenya realized would be 3.535.In terms of statistical
significance only the social forces (p=0.40) are statistically significant with a p value
that is less than 0.05.This leads us to make the conclusion that the regression equation
may not be relied upon as a predictor of strategic measures given multiple
independent variables.
From the four multiple regression equations relating to the various strategy dimension
(outcomes) only the vision and mission regression equation appears a more indicative
predictor as most independent variables met the test for statistical significance.
4.6 Strategic Measures Taken To Cope With The Impact of Environmental
Forces
This section of the study sought to establish the strategic measures that had been
instituted or effected by mobile money firms to cope with the impact of
environmental forces. Many possible relevant measures gathered in the secondary
literature review were listed in the data gathering instrument with an open ended
section for respondents to indicate the extent these had been implemented. A 5 point
scale was provided, where the extent to which strategic measures had been
67
implemented would be measured on a likert type scale where , 1= not at all; 2= little
extent; 3= moderate extent; 4= great extent; 5=very great extent. Strategic measures
were further subcategorized into 31different attributes creating a 155 point scale
(ranging from 0-155 ) where scores were recalibrated as 0-29 = Not at all; >29 – 59
=Little extent; >59 -89 = Moderate extent;>89 – 119 = Great Extent; >119=very great
extent
The attributes of strategic measures were; enhanced CSR/customer loyalty schemes,
low cost pricing of service, differentiated our product/service offering, expanded into
new geographic region, alliance with data/I.T firms, enhanced regulatory compliance,
merged/acquired other firms, targeted niche market/customer segments, diversified in
other financial services, expanded agent network, premium pricing of service,
consolidated with other products/services, injected further capital/human investment,
invested further in secure technology, implemented some cost cutting measures,
differentiated service pricing, established new distribution channels, partnered
bank/EFT firm for M-Banking, lowered transaction values, interoperability with
competitors/others, invested further in network improvement, outsourced some related
services, integrated supply chain ownership, enhanced coordination with regulators,
increased transaction values, enhanced customer knowledge information, increased
advertising/awareness campaigns and organizational restructuring/downsizing
Out of the total 24 respondents (see Table 4.32) 10 (42%) indicated that they had
implemented the outlined strategic measures to a very great extent; 11 (46%)
indicated they had implemented to a great extent; 1 respondent (4%) indicated to a
moderate extent; and 2 (8%) to a little extent. The mean score (refer to Table 4.9) for
the extent to which strategic measures had been implemented to cope with
environmental forces from the respondents was 104.79 (standard deviation of 7.453)
placing them in the category of “great extent”.

68
Table 4.32: Descriptives: Strategic Measures taken to cope with environmental
forces
Total strategy measures
Not at all Moderate
extent
Great extent Very Great
extent
Total 24 2 1 11 10
100% 8% 4% 46% 42%
Safaricom 4 0 1 3 0
17% 0% 4% 12% 0%
Airtelkenya 4 0 0 3 1
17% 0% 0% 12% 4%
Orange Kenya 4 1 0 2 1
17% 4% 0% 8% 4%
Yu Mobile 4 0 0 0 4
17% 0% 0% 0% 17%
Tangaza
Kenya
4 1 0 2 1
17% 4% 0% 8% 4%
Mobikash 4 0 0 1 3
17% 0% 0% 4% 12%
Source: Author, 2013
The respondents‟ breakdown by mobile financial services firm is also indicated in
Table 4.32. Clearly from the table most respondents within the firms indicated that
out of the 6 firms Safaricom and Airtel each had 3 out of 4 respondents indicating
they had implemented strategic measures to a great extent with Mobile Pay Ltd
(Tangaza) and Mobikash having 3 out of 4 respondents indicating to a very great
extent. Essar Telecom (Yu mobile) had all 4 respondents indicating they had
implemented strategic measures to a very great extent; while Telkom Orange had 2
respondents indicating to a great extent and 1 to a very great extent. These findings
serve to confirm the mean score indicating that the strategic measures have been
implemented to a great extent
Whether as a rational planning process or emergent property as the strategy
development schools of thought posit, several almost similar strategic measures have
been implemented to a great extent by mobile financial service firms. This affirms a
cognitive process of strategy analysis or recognition of need to modify strategy,
strategy evaluation and choice, strategy implementation and alignment of
organizational resources. From the large consensus on implementation of strategic
measures (greater than all the other strategy development dimensions) we conclude

69
that the analytical stage necessarily involves some sort of a process of environmental
and industry analysis by mobile money firms which when evaluated against firm
specific factors informs the strategy development process .The similarity of strategic
measures adopted could also be a pointer to discontinuous changes and higher levels
of environmental turbulence leading to tactical, copycat or reactive approaches to
strategy development for purposes of environmental fit. In general this confirms what
scholars deem the complex and multifaceted nature of strategy
4.7 Discussion
From results of the study, demographic information of the firms involved in provision
of mobile financial services was not sufficient to establish empirically that
organizations that align their strategies to external environmental demands outperform
those that don‟t as articulated by scholars Miles & snow and Venkatraman & Prescot.
It can be argued that Safaricoms mobile financial services being the pioneers in the
market with a two year head start over their nearest competitors may have developed
competencies and competitive advantage in their value chain over their rivals.
Similarly other parameters besides turnover, such as profitability, service quality,
impact of ownership changes etc would have to be incorporated to gauge overall
performance.
In gauging the effect of each of the environmental forces on strategy development in
general, there was largely consensus on the findings with all the external
environmental forces (with the exception of environmental forces) rated as impacting
to a great extent. These relationships between environmental forces and strategy
development are evidenced in the correlation and ANOVA analysis even though
multiple regression analysis were inconclusive .This indicates awareness on the part
of respondents and is consistent with the studies by Duncan & Ginter and also May et
al on the need to study external forces with a view to evaluate their likely impact and
controllability. This is supported by the similarity of strategic measures adopted by
the mobile financial service firms to cope with those external forces. The findings of
the study are also relatively consistent with the assertions of previous scholars like
Thompson et al that the biggest strategy influences emanate from the immediate
industry/ competitive environment hence the applicability and relevance of Porters
five force analysis tool. This is evidenced in the study by the relatively stronger
correlations shown between industry forces and the various strategy development

70
dimensions than between the remote environment forces and strategy development
dimensions. However, of great significance in this study was the impact of
technological, economic and social forces as key drivers of strategy with issues of
technology cost, technology lifecycle, disposable incomes, employment, customer
lifestyles, fads and tastes coming to the fore
From the study, there were not only high correlations between the external
environmental forces and strategy development dimensions, but also between the
strategy development dimensions themselves. This was captured in the correlation
analysis between strategy development dimensions lending support to a form of
rational planning process amongst the mobile financial service firms as posited by
Thompson et al .However given the impact of technology, social forces and huge
consensus on adoption of similar strategic measures as noted in this study, it is more
consistent with the sentiments noted by Bourgeois & Eisenhardt and also Drucker
about strategy development in an age of „discontinuity‟.These scholars were alluding
to high technology environments of rapid and discontinuous change in demand,
technology etc that renders information inaccurate or obsolete. The findings of this
study also lend support to Whittingtons evolutionary approach to strategy where some
of the firms seem to copy similar strategic measures for purposes of survival (as the
main objective) and environmental fit while others leaned towards crafting strategy
rather than formalizing it as Mintzberg and Whittingtons processual school advocate.
This study established the adoption of largely several similar strategic measures
amongst mobile financial service firms. This is not consistent with Porters generic
strategies of pursuing cost leadership or differentiation with a focus on niche or the
mass market as a basis for competitive advantage. Rather, all the firms while targeting
the mass market offered differentiated service/products and differentiated pricing as
well as implementing measures consistent with the growth models advanced by the
BCG matrix and Ansoff matrix models. The high priority on enhanced risk
management measures as indicated in the study findings is also a pointer to
recognition of turbulence in the external environment and need to manage it as well as
confirmation of the emergent, crafted or evolutionary lean to strategy development
amongst the mobile financial service firms.

71
CHAPTER FIVE: SUMMARY CONCLUSIONS AND
RECOMMENDATIONS
5.1 Introduction
This chapter outlines the summary of findings, discussions, conclusions, limitations
and recommendations for further research studies both for policy and application by
the firms in the mobile money market in Kenya. The objectives of the study were to
determine the major external environmental forces that impact strategy development
in the firms operating in the mobile money market in Kenya and to establish the
measures taken to cope with the external environmental forces that impact on the
firms operating in the mobile money market. The study attempted to answer the
questions: what are the major external environmental forces that impact strategy
development in firms operating in the mobile money market in Kenya? What are the
strategic measures being taken by firms in the mobile money industry to counter the
key macro environmental forces impacting them?
5.2 Summary of Findings
The study of environmental forces that is both external and industry forces has been
deemed crucial in the development of firm strategy given the interdependencies and
the symbiotic relationship between the external and internal environment of business.
For that purpose, various categories of environmental forces are distinguished as
well as the tools for environmental analysis .It is also accepted that strategy
development is a multifaceted process with varying concepts ,dimensions, schools of
thought and tools used to explain its development. The objective of this study was to
identify the key environmental forces and their impact on the strategy development
process as well as the strategic measures taken to cope with them.
The study established that all the respondents in the firms offering mobile financial
services in Kenya were conversant with the key external environmental forces and
were also able to categorize the impacts of those forces on strategy development from
their functional perspectives. These forces include political, economic, social,
technological, legislative, environmental, customer bargaining power, supplier
bargaining power, intensity of industry rivalry, threat of new entrants and threat of
substitute products. The respondents were also able to identify and evaluate the
impacts of the forces on the various strategy development dimensions including

72
vision & mission, strategy evaluation & strategy choice, strategy implementation and
strategic measures.
The firms provide mobile financial services under various brand names Safaricom
ltd with the MPESA brand; Airtel Money brand for Airtel Kenya Ltd , Orange money
brand for Telkom Orange, Essar Telecom with the YU Cash brand , Tangaza brand
for Mobile Pay Ltd and Mobikash Ltd with its Mobikash brand..The ownership
structures of the firms in the mobile money business in Kenya are varied with
Telkom Orange and Safaricom Kenya Ltd being joint private/public ventures
(including foreign shareholders),while Airtel Kenya, and Essar Telecom are privately
owned ventures largely by foreign entities; while Mobile Pay Ltd and Mobikash Ltd
are fully privately owned local firms.
It was established that collectively, political forces impacted the development of
strategy to a great extent among the mobile financial service providers in Kenya. The
key identified political forces included, state provided infrastructure government
systems/structures, investment incentives, international relations and political
stability/leadership. From the study, economic factors such as inflation, tax regime
(fiscal policy), disposable income/employment level ,exchange rates and interest rates
(and monetary policy) influencesd strategy development among the mobile financial
service providers in Kenya to a great extent.
The study also established that social forces such as trends, fads and lifestyles,
consumer attitudes/opinions and demographics (age, gender, race e.t.c) education
levels and religious/ethnic /cultural factors influences strategy development among
the mobile financial service providers in Kenya to a great extent. In addition
technological forces including, technology lifecycles & obsolescence, new technology
impacts, internet impact, technology access & cost and innovations & inventions
influence strategy development among the mobile financial service providers in
Kenya to a great extent. Technological forces were ranked highest in terms of impact
score on strategy development
Legislative forces like the current laws & regulations, consumer protection,
regulatory bodies & processes, competitive regulation and industry specific regulation
influence strategy development among the mobile financial service providers in
Kenya to a great extent while , environmental factors such as international

73
environmental issues, topography (physical features, geography etc), ecological
factors and climate change had the least impact on strategy development among the
mobile financial service providers in Kenya with its influence indicated as being
moderate.
The study further found that industry forces comprising of the threat of substitute
products, bargaining power of customers, bargaining power of suppliers, and intensity
of competitive rivalry and threat of new entrants influenced strategy development
among the mobile financial service providers in Kenya to a great extent. Under the
threat of substitute products, buyer switching costs,the number of substitute products,
the ease of substitution, buyer propensity to substitute and the price performance of
substitutes all served to influence strategy development among the mobile financial
service providers in Kenya to a great extent.
Under the power of buyers bargaining leverage the study established that collectively
buyer information availability, availability of substitute products, buyer dependence
on existing distribution channels and buyer price sensitivity all influenced strategy
development among the mobile financial service providers in Kenya to a great extent.
From the study, the power of the supplier bargaining power including; supplier
switching costs (to other industries), availability or lack of essential suppliers, threat
to reduce quality of inputs, threat to raise input prices and presence of substitute
inputs all influenced strategy to a great extent.
The study established that the intensity of competitive rivalry with the following
factors; price competition, level of advertising, flexibility of product/service offerings
and degree of innovation amongst competitors and competition between mobile &non
mobile telephony firms influences strategy development among the mobile financial
service providers in Kenya to a great extent. The threat of new entrants with the
following factors considered; entry barriers (or lack of), expected retaliation by new
entrants, government policy on new entrants and ability to access to distribution
outlets influenced strategy development among the mobile financial service providers
in Kenya to a great extent.
The study also sought to establish the impact of environmental forces on the identified
dimensions of strategy development which included; vision & mission, strategy
evaluation and strategy choice and strategy implementation. On the vision/mission

74
dimension, the study found that environmental forces affected a review of values
driving the firm, a review of current purpose of firm a review of market
segments/product ,a review of business unit vision and review of core competences to
a great extent
With regard to the strategy evaluation and strategy choice dimension, the study
established that environmental forces affects the degree of micro (industry level)
scanning, objective setting/strategy selection processes, degree of competitor analysis,
degree of macro environmental scanning and degree of firm specific analysis (SWOT)
to a great extent. The study also found that environmental forces affected strategy
implementation with the following factors considered; change management activities,
alignment of culture, structure, processes & communication, organizational
restructuring and resourcing of both human and capital to and internal resource
allocation to a great extent.
One of the study objectives of the study was to establish the strategic measures that
had been taken to cope with the impact of environmental forces affecting the firms in
the mobile money market in Kenya. The strategic measures considered were; low cost
pricing of service, premium pricing of service, differentiated service pricing, lowered
transaction values, increased transaction values, increased advertising/awareness
campaigns, enhanced CSR/customer loyalty schemes, differentiated the
product/service offering, targeted niche market/customer segments, diversified in
other financial services, consolidated with other products/services, expanded agent
network and established new distribution channels among others. Respondents to the
study indicated that the strategic measures identified had been implemented to a great
extent to cope with the impact of environmental forces.
Both descriptive and inferential analysis were utilized to describe and analyze the
data with a view to defining the relationships between the variables. Pearsons
Correlation analysis largely indicated strong positive linear relations between and
within the variables of interest with the exception of the environmental force which
had a lesser degree of association. The ANOVA was used to establish the statistical
significance of the correlationships and establish the extents to which outcomes could
be attributed to the predictor variables. From the findings there was a good fit on
almost all the relationships analyzed in ANOVA. Finally a multiple regressions

75
analysis between the independent(predictor) variables and the dependent variables
was conducted to establish a regression equation (model) that can be relied upon to
project or predict a strategy development outcome given a certain condition of the
environmental forces (independent).Three of the four regression equations ,(with the
exception of the vision/ mission regression) were inconclusive in their predictive
value as most showed statistically insignificant tests (on the basis of P values) and
seemingly random outcomes that could not be attributed to the predictor variables..
5.3 Conclusion
Generally the respondents were able to identify the environmental forces and their
distinct categorizations i.e external and industry forces as well as evaluate their
impact on strategy development within their firms. This may not be totally
unexpected as the respondents designated to respond to the questionnaire were
selected on the basis of being knowledgeable or involved in the process of strategy
development within their respective firms. It also worth noting that since four
respondents per firm from different functional areas i.e finance, legal, technology and
mobile financial service business unit head were selected to respond there would not
necessarily be consensus on assessing the various impacts of environmental forces.
On assessment of the impacts of environmental forces, the majority of the respondents
felt that political forces impacted their strategy development to a great extent. This
was reflected in the fact that that 75% of the respondents were of the opinion that
political forces impacted their strategy development either to a great or very great
extent. 17 % were of the opinion that it impacted them to a moderate extent while 4%
indicated that political forces impacted them to a little or no extent. The major
political forces having the biggest influence as indicated by respondents were
government structures and systems and infrastructure provision.
The magnitude of the impact of economic forces on strategy development according
to the majority of the respondents was slightly higher than that of political forces even
though they were rated as having affected strategy to a great extent. 79% of the
respondents were of the opinion that the impacts of economic forces were to a great
extent or very great extent with only 5% indicating their impact was of moderate
extent or less. The attributes considered most critical by respondents under economic

76
forces were disposable incomes/employment, inflation levels and the tax regime/fiscal
policy.
The impact of social forces was considered to affect strategy development to a
great extent by the respondents. In terms of score its impacts were felt to be slightly
more than those of political forces but below economic forces as 87% of respondents
indicated its impacts as being of moderate extent and higher, while only 12 %
indicated that its impacts were to a little or no extent. Under social forces the
attributes of signifance cited by respondents in the strategy development process were
consumer attitudes / opinions and trends /fads/ lifestyles.
Of the forces evaluated by the respondents, technological forces in terms of score
had the highest impact on strategy development within the firms even though its
influence was rated as being of great extent. 58% of the respondents indicated that
technological forces influenced strategy development to a very great extent while
cumulatively 91% of respondents rated technological impacts at moderate and
higher. This is understandable in light of the industry in which the firms operate as the
mobile financial services are heavily technology dependent. The respondents
indicated that he major technological attributes impacting on strategy were technology
lifecycle and technology access and cost.
Out of all the external environmental forces evaluated, respondents indicated that
environmental forces had the least impact on strategy development amongst the firms
operating in the mobile money market in Kenya. The impacts of environmental forces
were considered to be of moderate extent with only 42% of respondents indicating its
impacts were to a great extent or higher while 58% indicated impacts of moderate
extent or less on strategy development. The main aspects under environmental laws
influencing strategy cited by respondents were the current environmental laws and
climate change issues
Legislative forces had a significant impact on strategy development as evidenced by
the fact that 83% of respondents indicated their impacts were to a great extent or very
great extent with only 4% indicating moderate to lesser impacts. Of the five attributes
evaluated under the legislative forces, the two cited most by respondents as having
more influence on strategy development included the current laws and regulations
governing operations of the industry as well as competitive regulation presumably by
77
the regulatory bodies like the communications Communication of Kenya and the
Central Bank.
The respondents also evaluated the category of industry forces which based on
grounded strategy literature, have a greater impact on strategy development in firms
operating in an industry. This seems confirmed by findings from the study which
indicate slightly higher impact ratings for industry forces when compared against the
remote environmental forces. The threat of substitute products in general was rated as
influencing strategy development to a great extent . 63% of the respondents had a
rating of great extent or higher in evaluating the impact of threat of substitute products
on strategy while only 37% had a rating of moderate to lower extents. The major
aspects contributing to strategy under threat of substitute products indicated by
respondents were their price performance and number of substitute product.
The bargaining power of customers had the highest impact ratings of the industry
forces and only second to technological forces in terms of impact on strategy
development even though it was scored as having influence to a great extent on the
measurement scale.88% of the respondents felt the impacts of bargaining power of
customers on strategy were to a great extent or very great extent while only 12 %
indicated a rating of moderate and lesser. Respondents indicated that dependence on
current distribution outlets and buyer price sensitivity were the most significant
contributors to strategy development
The intensity of competitive rivalry was rated as having impacted strategy
development to a great extent (with 79% of respondents in the great extent or above),
while 12% indicated the influence of competitive rivalry at moderate .Of interest to
note, 8% of the respondents indicated that the intensity of competitive rivalry did not
influence strategy development. This may be attributed to the perception of market or
niche segments respondents felt were unaffected by this force. In terms of magnitude,
respondents ranked the influence of competitive rivalry as the fourth most impacting
force on strategy development after technological, bargaining power of customers and
legislative forces. In addition, respondents noted that the price performance of
substitutes and number of substitute products were the most critical factors under the
competitive rivalry force

78
On average, the threat of new entrants influenced the development of strategy to a
great extent a cumulative 79% of respondents scored great extent or higher) even
though the highest proportion of respondents 42% indicated that the impact was to a
very great extent). 21% of the respondents indicated that the influence of the threat of
new entrants to industry only influenced their strategy to a moderate extent. In terms
of significance of the attributes under the threat of new entrants force ,the expected
retaliation of new entrants ,their ability to access distribution outlets and the entry
barriers were major considerations in strategy development.
The respondents were also required to evaluate the impact of environmental forces on
specific aspects of strategy development i.e vision & mission, strategy evaluation &
strategy choice, strategy implementation and strategic measures. It is apparent that
most respondents recognized strategy development as a multifaceted concept or
process with distinct dimensions and were thus able to evaluate in a fairly consistent
manner across the various aspects. Respondents indicated that environmental forces
impacted the vision & mission dimension of strategy development to a great extent.
67% of the respondents indicated that environmental forces impacted this attribute to
a great or very great extent, while 21% noted the impacts at moderate with only 3%
giving a lower rating. The strategy evaluation and strategy choice dimension was on
average impacted by environmental forces to a great extent (higher than the
vision/mission aspect) as evidenced by respondent scores.29% of respondents
indicated that the impacts on strategy evaluation & strategy choice were to a very
great extent, 38% to a great extent, 21% to a moderate extent and 3% at little or not at
all. Respondents noted that the strategy implementation dimension was on average
impacted by environmental forces to a great extent. 38% of the respondents indicated
that environmental forces impacted strategy implementation to a very great, 33 to a
great extent and 21% to moderate extents.
The study identified several (31) strategic measures that had been implemented by
mobile money firms in the industry to cope with the impacts of environmental forces.
Respondents were required to indicate from their perspectives, the extent to which
these strategic measures had been implemented in their firms.88% of the respondents
indicated that environmental forces impacted the implementation of strategic
measures to a great or very great extent, while only 3% noted the impacts at moderate
or a lower rating. While not all the strategic measures can be discussed in this study,

79
the significant ones of interest implemented to a great extent or very great extent to
cope with environmental forces based on the scoring by respondents were: partnered
with Bank/EFT firm for M-banking (82%); enhanced coordination with regulators
(81%); differentiated service pricing (77%);Enhanced the risk management
framework (77%);Outsourcing of related services (73%); differentiated
products/service offering (72%);increased advertising/awareness campaigns
(68%);enhanced CSR/customer loyalty schemes (68%);investment in network
improvements (68%); partnering with I.T/data firm (68%);Enhanced customer
knowledge information (68%).Based on the large consensus of findings on strategic
measures is fair to conclude that greater emphasis is placed on implementation of
strategic measures compared to other strategy development dimensions thus
confirming earlier scholarly works on the increased emergence of strategy at the
expense of planning for strategy
The researcher added value to the study by establishing high correlations between the
independent variables themselves which implies that the interplay between
environmental forces inherently can impact strategy development positively or
negatively. This can also form the basis for future studies.
5.4 Recommendations
Although respondents were able to evaluate the impact of various environmental
forces on their firms strategy development it is crucial that a structured way of
evaluating those forces is put in place. The targeted respondents were largely
responsible for their functional areas and may have evaluated a wide range of cross
functional forces on the basis of their own experiences. It is recommended that a
formal but dynamic environmental analysis process that is integrated across all
departments and cadres of staff be established to enable the institutionalization of
environmental scanning and analysis tools . Although most respondents indicated that
enhanced risk management measures had been adopted it is not clear whether these
cascade down the lower staffing levels and which risk factors that are evaluated.
Given the dynamic and technology dependent nature of the mobile money market it is
crucial that the ability to conduct environmental analysis and scanning is inbuilt into
job descriptions.

80
Similarly, strategy development in most firms remains the preserve of top
management, or a strategy team .There is a need to relook at the process of how
strategy is developed, its various dimensions and how it is communicated. It is only
through an ongoing and interactive organization wide strategy awareness program that
staff will appreciate and counter the impact of any threats, risks or opportunities
presented by the external environment, more so in an industry that changes very
rapidly like the mobile money market. It is not apparent whether the respondents
utilized any known strategy development models such as Porter‟s 5 forces model,
BCG matrix or Ansoffs matrix in responding to the study, however it is imperative
that firms in the mobile money market proactively engage known and established
strategy development and evaluation tools.
The government is a major stakeholder in the mobile money sector through the taxes
it levies and also as a regulator through the Communication Commission of Kenya
(CCK) and Central Bank of Kenya .It has an obligation to provide incentives and
investments countrywide especially infrastructure like data connectivity lines and also
appropriate incentives to reduce technology and technology device costs. For this
reason I recommend that mobile money firms consider more private –public
partnership agreements with the government rather than engaging more private data,
I.T and other such like firms whose strategic interests come first while the
government stake is always more long term and focuses on the social component.
5.5 Limitations
This study was administered to senior management from four different functional
areas per firm (making a total of 4 responses per firm).In addition each respondent
was required to evaluate the impacts of external forces on strategy development from
other functional areas which had the likely danger of introducing subjectivity in the
interpretation of the questions hence affecting reliability of the study .Although
respondents were carefully selected in the belief that they were at least involved in
core functions of the company and hence had inputs in the strategy development
process it was assumed that they appreciated the various distinct and related
dimensions of strategy –which may not necessarily be the case.
The study involved all the six firms involved in the mobile money market in Kenya
and great care was taken to ensure all aspects relating to the study objectives were
81
captured in the questionnaire. It is worth noting however that two of those firms are
not mobile telephony firms per se i.e they do not offer traditional telecommunication
services like data , voice and mail services and only focus on mobile financial
services exclusively. This implies that some of the criteria or factors driving strategy
development may not be adequately captured in the data gathering instrument; and
even where captured may not adequately explain or answer the questions the study
sought to answer bringing into question the aspect of relevance and applicability.
Finally inferential tests were conducted to establish the relationship between the study
variables and arrive at an interpretation and conclusion of the findings. This is purely
a quantification of the study and does not involve an assessment of the qualitative
aspects that go into decision making on aspects related to strategy development. Soft
skills such as cognitive abilities of managers, managerial style, organization culture
and decision making are not taken into account yet these are as crucial as the
quantitative assessments.
5.6 Suggestions for Further Research
This study may be considered a baseline study that seeks to establish the key
environmental forces and their impact on strategy development; as well as establish
the strategic measures taken to cope with environmental forces in the mobile money
market in Kenya. From the inferential analysis conducted, specifically the multiple
regression analysis, it is inconclusive to establish the extent to which all the
independent variables (11 environmental forces) collectively contribute to the
development of strategy or extent to which the model can be relied on to predict the
magnitude of change in the strategy development dimensions. It may be prudent to
conduct a similar study with an increased number of respondents (from the current
24) and incorporate various cadres of management.
Similarly, this study has been commissioned with a focus on the external environment
variables of business in relation to the strategy development process. It may be more
realistic for a future study to incorporate variables from the internal or task
environment of business such as value chain processes, firm size, years in operation,
ownership structures, internal structures and decision making processes etc to get a
holistic appreciation of the interactions that collectively contribute to strategy
development.

82
REFERENCES
Aguilar,F.J.(1967). Scanning the business environment. New York, NY:
MacGraw-Hill.
Ansoff, I. (1965).Corporate strategy:An Analytic Approach to Business Policy for
Growth and Expansion: New York. McGraw- Hill
Ansoff, I. (1969).Business Strategy: Hammondsworth.UK. Penguin Books
Ansoff,I. & McDonnel (1990). Implanting Strategic Management 2nd
edition,NY:
Prentice Hall,pp38)
Ansoff,I. (1968).Corporate Strategy:New York.Penguin Books
Ansoff,I.( 1957). Strategies for diversification. Harvard Business Review.
Bourgeois, L.J. (1980). Strategy and environment: a conceptual
integration. Academy of Management Review, 5(1), 25-39.
Bourgeois,L. &Eisenhardt, K.(1988).Strategic decision processes in high velocity
environments: Four cases in the microcomputer industry. Management
science , 34.
Bowen,H. & Goldstein, P.(2010).The Mobile Money Revolution.Retrieved on 21st
May 2012 from Audience scapes website:
www.audiencescapes.org/sites/default/files/AScapes%20Briefs
Mobile%20Money%20Revolution.pdf
Capon, C. (2008).Understanding strategic management.(1sted).London: Financial
Times/Prentice Hall.
CCK sector statistic report Q3-2011/2012. Retrieved on July 30th
2012, from
Communication Commission of Kenya website:
Central Bank of Kenya Governor presentation in AbuDhabi. (Feb 2012).Mobile
Phone Financial Services: Integration and financial intermediation. Retrieved
on 30th
April, 2012, from Central Bank of Kenya website:
83
Chandler, A.D. (1962).Strategy and Structure:Chapters In The History of The
American Industrial Enterprise. Cambridge, MA: MIT Press
Cyert,R. & Marche,J (1963). A Behavioural Theory of the Firm. Englewood Cliffs,
New Jersey : Prentice Hall, Inc
Definition of mobile money . Retrieved April 30th
,2012, from International Finance
Corporation Web
site:www.ifc.org/ifcext/gfm.nsf/AttachmentsByTitle/Tool4.3CGAPTool-
MNOMobileMoneyMarketSizing/$FILE/Tool+4.3.+CGAP+Tool+MNO+Mo
bile+Money+Market+Sizing+(CONFIDENTIAL).pdf
Donovan, K.(2011).Mobile Money in the Developing World:The Impact of MPESA on
Development, Freedom and Domination.Retrieved on 30th
May 2012 from:
http://blurringborders.com/wp-content/uploads/2011/06/Donovan MPESA
Thesis Prepublication.pdf
Drucker, P. (1968).The age of discontinuity: Guidelines to our changing society. New
York: Harper and Row
Duncan, Peter,.M., & Ginter, W.J.( 1990).Macro-environmental analysis for strategic
management, Long range planning 23(6), December.
GE/MckinseyMatrix.(1971).Retrieved on 30th
April 2012 from Value based
Management Web site: www.valuebasedmanagement.net/methods
ge.mckinsey.html
Government of Kenya, (2008).Kenya Vision 2030:A Globally Competitive and
Prosperous Kenya. Nairobi, Kenya. Government Printer
Government of Kenya, (2011) .Communication Commission of Kenya 2010/2011
Annual Report annual report) : retrieved on April 30th
2012, from Communication
Commission of Kenya website: www.cck.go.ke/resc/publications/annual reports/CCK
annual Report 2011.pdf
Hamel ,G. & Prahalad, C.(1990) The core competence of the corporation. Harvard
Business Review, May- June

84
Hamel, G.(2000) Leading the revolution .Plume (Penguin Books): New York
Hannan, M. & Freeman, J.(1989).Organizational Ecology.Cambridge, Massachusetts
:Harvard University Press
Henderson ,B. (1970) The product portfolio. BCG Perspectives,January 1970
http://pesatalk.com/2012/03/battle-of-the-mobile-money-transfer-service-2/
Jack,W. & Suri,T.(2010, 2011).Economics of Mpesa. Study commissioned by Central
Bank of Kenya Retrieved May 5th
, 2012, from Massachusetts Institute of
Technology website:
Jack,W. & Suri,T.(2010, 2011).Economics of Mpesa. Study commissioned by Central
Bank of Kenya Retrieved May 5th
, 2012, from Massachusetts Institute of
Technology website:
Johnson, G .Scholes,K. & Whittington ,R.(2008).Exploring Corporate Strategy:Text
and Cases 8th
edn, Harlow: F T Prentice Hall
Johnson, Scholes , K. & Whittington, R. (2005).Exploring Corporate Strategy.(7th
ed.).London: Prentice Hall.
Johnson,G. & Scholes, K (1997).Exploring Corporate Strategy: Englewood, New
Jersey. Prentice Hall
Kaplan, R.S., & Norton, D.P. (1996).The balanced scorecard. Boston: Harvard
Business School Press.
Kimenyi, S., Mwangi, S &Ndungu,N.(2009).Expanding the financial services
frontier: Lessons from mobile banking in Kenya . Retrieved May 5th
, 2012,
from Brookings Institution website:www.brookings.edu/articles/2009/1016/
mobile phone kimenyi.aspx
Kimenyi, S., Mwangi, S &Ndungu,N.(2009).Expanding the financial services
frontier: Lessons from mobile banking in Kenya . Retrieved May 5th
, 2012,
from Brookings Institution website:www.brookings.edu/articles/2009/1016/
mobile phone kimenyi.aspx

85
Kinyoda (2012).Retrieved May 13th,2012 fromURL link:
Manica,L. & Vescovi,M. (2008).Mobile Telephony in Kenya:Is it making the life
better?Retrieved on June 18th
2012 from: www.it46.se/projects/UNITN
ICT4SD manica vescovi.pdf:
Manica,L. & Vescovi,M. (2008).Mobile Telephony in Kenya:Is it making the life
better?Retrieved on June 18th
2012 from: www.it46.se/projects/UNITN
ICT4SD manica vescovi.pdf:
May, R.C., Stewart, Jr. W.H. & Sweo, R.(2000). Environmental scanning behaviour
in a transitional economy: evidence from Russia. Academy of Management
Journal, 43(3), 403-427
Mbiti,I. & Weil,D.(2011).Mobile banking.The impact of mpesa in Kenya. NBER
working paper , no 17129. Retrieved May 5th
, 2012, from National Bureau of
Economic Research website:
Mbiti,I. & Weil,D.(2011).Mobile banking.The impact of mpesa in Kenya. NBER
working paper , no 17129. Retrieved May 5th
, 2012, from National Bureau of
Economic Research website:
Miles, R.E. & Snow, C.C. (1978). Organizational Strategy, Structure, and Processes.
New York, NY: McGraw-Hill.
Milliken, F.J. (1987). Three types of perceived uncertainty about environment: state,
effect, and response uncertainty. Academy of Management Review, 12(1), 133-
143.
Mintzberg , H., Quinn, J.B., & Ghoshal , S.(1999). The Strategy Process . London:
Prentice Hall.
Mintzberg, H. (1987).Five p‟s for strategy. California Management Review.(fall).
Mintzberg, H., Lampel,J., Quinn,J., & Ghoshal, S.(2003).The strategy process.
Concepts, Contexts and Cases.(4th
ed).Essex: Pearson Education.
86
Mugenda,O.&Mugenda, A.(1999).Research Methods: Quantitative and Qualitative
Approaches.Nairobi: African Center for Technology
Neumann, J.& Mogernstein,O. (1944).Theory of Games and Economic Behavior:
Princeton University press
Omwansa,T. (2009).MPESA : Progress and Prospects.Retrieved on June 8th
2012
from: www.strathmore.edu/pdf/innov-gsma-omwansa.pdf
Pearce, J.A., & Robinson, R.B.,(2011).Strategic Management. Formulation,
Implementation and Control.(12th
ed).New York: McGraw-Hill International.
Peters , T.J.,& Waterman, R.H.(1982).In Search of Excellence. New York: Harper&
Row
Porter , M.E. (1979).How competitive forces shape strategy. Harvard Business
Review, 57 (2), 137-145.
Porter, M.E. (1980).Competitive strategy: Techniques for analyzing industries and
competitors. (pp.35-40). New York: Free Press.
Stoffels,J.D. (1994).Strategic Issues management. A comprehensive guide to
environmental scanning. Oxford: The planning Forum
Taylor,F. (1947) .Scientific Management. New York.
Thompson , Strickland & Gamble.(2007).Crafting and executing strategy. (15th
ed.).New York: Mc Graw-Hill International.
Thompson, J.L. (2001).Strategic management. London: Thomson Learning.
Venkatraman, N. & Prescott, J.E. (1990). Environmental-strategy coalignment: An
empirical test of its performance implications. Strategic Management
Journal, 11(1), 1-23.
White,C. (2004) .Strategic Management. Basingstoke. Palgrave Macmillan
Whittington, R. (2001) .What is Strategy -and does it matter? (2nd
ed). London.
Thomson Learning

87
World Economic Forum &Boston Consulting Group, (2011) The Mobile Financial
Services Development report .Retrieved on April 30th
2012 from World
Economic Forum website: www.weforum.org/reports/mobile-financial-
services-development-report-2011
www.cck.go.ke/resc/downloads/SECTOR STATISTICS REPORT Q1 11-
12.pdf
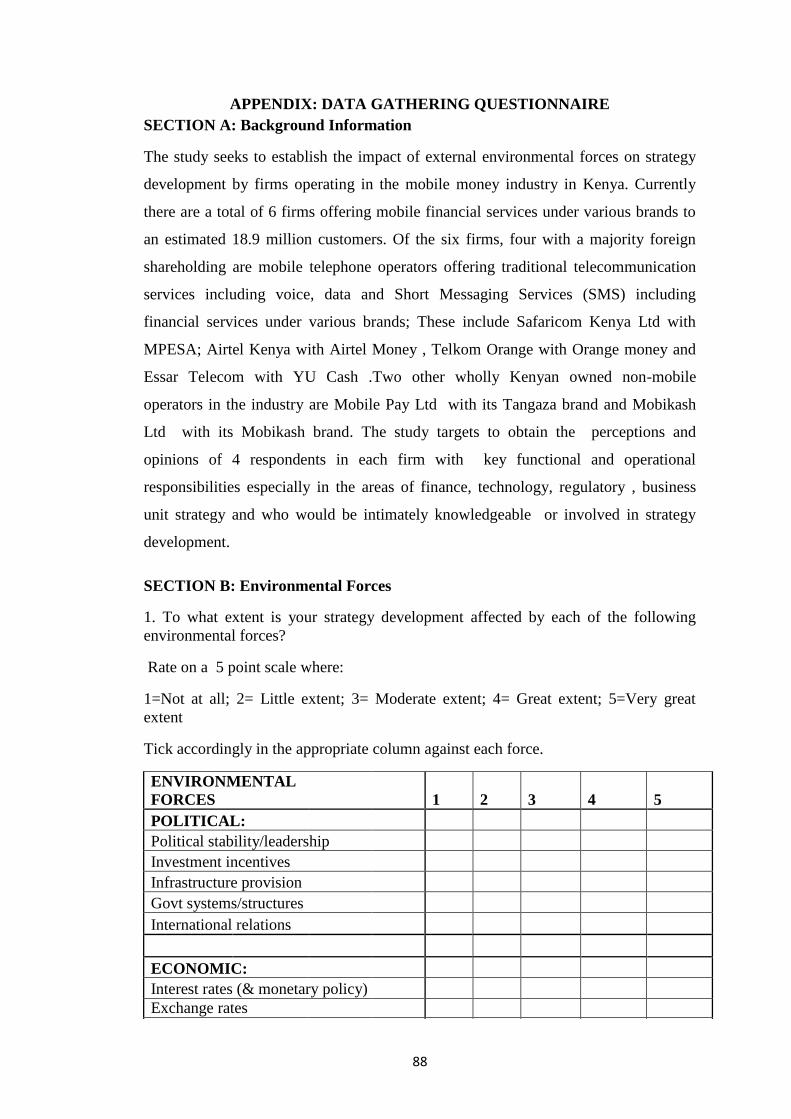
88
APPENDIX: DATA GATHERING QUESTIONNAIRE
SECTION A: Background Information
The study seeks to establish the impact of external environmental forces on strategy
development by firms operating in the mobile money industry in Kenya. Currently
there are a total of 6 firms offering mobile financial services under various brands to
an estimated 18.9 million customers. Of the six firms, four with a majority foreign
shareholding are mobile telephone operators offering traditional telecommunication
services including voice, data and Short Messaging Services (SMS) including
financial services under various brands; These include Safaricom Kenya Ltd with
MPESA; Airtel Kenya with Airtel Money , Telkom Orange with Orange money and
Essar Telecom with YU Cash .Two other wholly Kenyan owned non-mobile
operators in the industry are Mobile Pay Ltd with its Tangaza brand and Mobikash
Ltd with its Mobikash brand. The study targets to obtain the perceptions and
opinions of 4 respondents in each firm with key functional and operational
responsibilities especially in the areas of finance, technology, regulatory , business
unit strategy and who would be intimately knowledgeable or involved in strategy
development.
SECTION B: Environmental Forces
1. To what extent is your strategy development affected by each of the following
environmental forces?
Rate on a 5 point scale where:
1=Not at all; 2= Little extent; 3= Moderate extent; 4= Great extent; 5=Very great
extent
Tick accordingly in the appropriate column against each force.
ENVIRONMENTAL
FORCES
1 2 3 4 5
POLITICAL:
Political stability/leadership
Investment incentives
Infrastructure provision
Govt systems/structures
International relations
ECONOMIC:
Interest rates (& monetary policy)
Exchange rates

89
Inflation
Tax regime (fiscal policy)
Disposable income/employment level
SOCIAL:
Demographics (age, gender ,race etc)
Religious/ethnic /cultural factors
Education levels
Consumer attitudes/opinions
Trends, fads, lifestyles
TECHNOLOGICAL:
New technology impacts
Innovations & inventions
Internet impact
Technology access & cost
Technology lifecycles & obsolescence
ENVIRONMENTAL
FORCE
1 2 3 4 5
LEGISLATIVE:
Current laws & regulations
Regulatory bodies & processes
Consumer protection
Industry specific regulation
Competitive regulation
ENVIRONMENTAL:
Environmental laws/regulation
Topography (physical features,geography
etc)
Climate change
Ecological
International environmental issues
INDUSTRY
FORCES
THREAT OF SUBSTITUTE
PRODUCTS:
Buyer propensity to substitute
Ease of substitution
Number of substitute products
Buyer switching costs
Price performance of substitute

90
BARGAINING POWER OF
CUSTOMERS:
Buyer price sensitivity
Buyer information availability
Buyer bargaining leverage
Buyer dependence on existing distribution
channels
Availability of substitute products
ENVIRONMENTAL FORCE: 1 2 3 4 5
BARGAINING POWER OF SUPPLIERS:
Presence of substitute inputs
impact of inputs in costs
Degree of differentiation of inputs
Supplier switching costs
Supplier concentration (availability of many
suppliers)
INTENSITY OF COMPETITIVE RIVALRY:
Level of advertising
Competition between mobile &non mobile
telephony firms
degree of innovation amongst competitors
Flexibility of product/service offerings
Distinct/powerful strategy by competitor
THREAT OF NEW ENTRANTS:
Entry barriers (or lack of)
Capital requirements
Access to distribution outlets
Customer loyalty
Switching costs
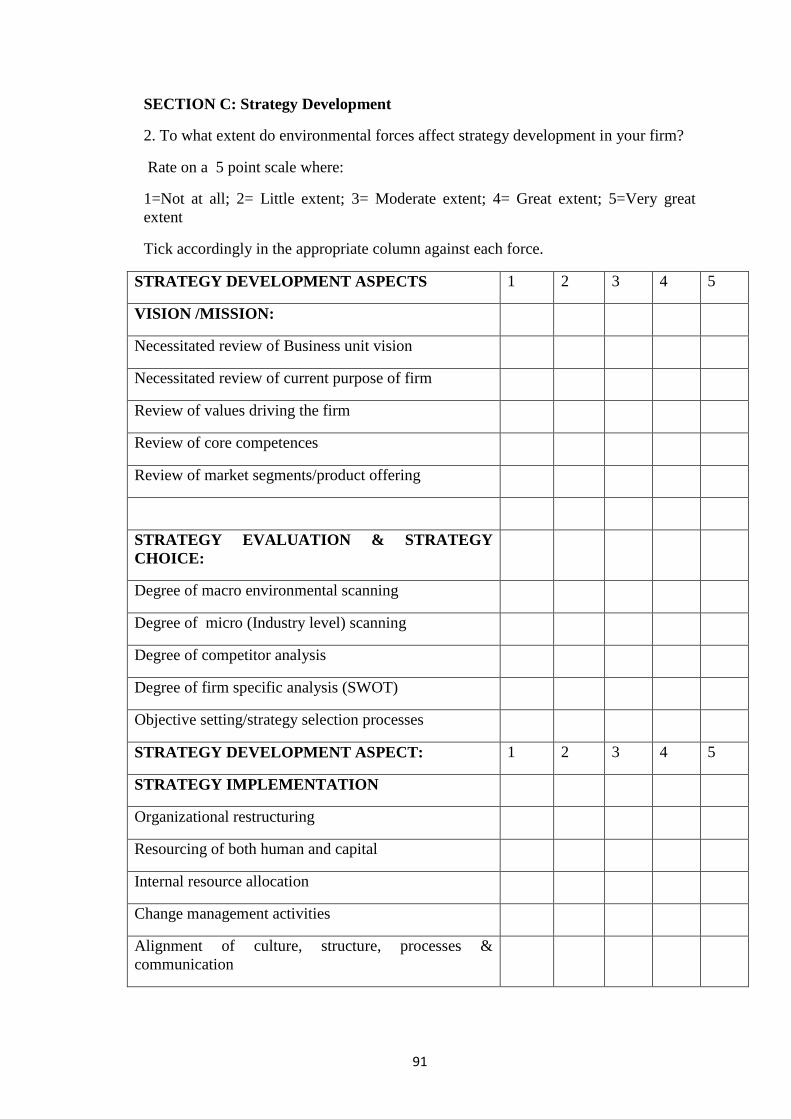
91
SECTION C: Strategy Development
2. To what extent do environmental forces affect strategy development in your firm?
Rate on a 5 point scale where:
1=Not at all; 2= Little extent; 3= Moderate extent; 4= Great extent; 5=Very great
extent
Tick accordingly in the appropriate column against each force.
STRATEGY DEVELOPMENT ASPECTS 1 2 3 4 5
VISION /MISSION:
Necessitated review of Business unit vision
Necessitated review of current purpose of firm
Review of values driving the firm
Review of core competences
Review of market segments/product offering
STRATEGY EVALUATION & STRATEGY
CHOICE:
Degree of macro environmental scanning
Degree of micro (Industry level) scanning
Degree of competitor analysis
Degree of firm specific analysis (SWOT)
Objective setting/strategy selection processes
STRATEGY DEVELOPMENT ASPECT: 1 2 3 4 5
STRATEGY IMPLEMENTATION
Organizational restructuring
Resourcing of both human and capital
Internal resource allocation
Change management activities
Alignment of culture, structure, processes &
communication

92
SECTION D: STRATEGIC MEASURES TAKEN
3. Outline the key measures taken to deal with environmental forces impacting on
your strategy development.
Tick as many as apply. Add any others not listed or elaborate further in the space
given .
STRATEGIC MEASURES TICK APPLICABLE/ELABORATE
Customer tariff reviews
Expansion of agent network
Alliance with technology/I.T. firms
Mergers/Acquisitions of other firms
Partnered with bank for M-banking
Differentiated our product/service offering
Differentiated customer segments/markets
Consolidated with other product/service
STRATEGIC MEASURES TICK APPLICABLE/ELABORATE
Interoperability with competitors/others
Infrastructure sharing with other parties
Further capital/human investment in firm
Invested further in secure technology
Organizational restructuring/downsizing
Divested business unit/ market segment
Outsourced some related services
Implemented some cost cutting measures
Enhanced regulatory compliance
Enhanced CSR/customer loyalty schemes


![Manufacturing Transformation Driven by External Forces [Infographic]](https://static.fdocuments.in/doc/165x107/5562f9a1d8b42a6f598b4975/manufacturing-transformation-driven-by-external-forces-infographic.jpg)