The Impact of European Settlement within French West Africa
50
HAL Id: hal-01023805 https://hal-sciencespo.archives-ouvertes.fr/hal-01023805 Submitted on 15 Jul 2014 HAL is a multi-disciplinary open access archive for the deposit and dissemination of sci- entific research documents, whether they are pub- lished or not. The documents may come from teaching and research institutions in France or abroad, or from public or private research centers. L’archive ouverte pluridisciplinaire HAL, est destinée au dépôt et à la diffusion de documents scientifiques de niveau recherche, publiés ou non, émanant des établissements d’enseignement et de recherche français ou étrangers, des laboratoires publics ou privés. The Impact of European Settlement within French West Africa Elise Huillery To cite this version: Elise Huillery. The Impact of European Settlement within French West Africa. Journal of African Economies, Oxford University Press (OUP), 2010, pp.1-49. hal-01023805
Transcript of The Impact of European Settlement within French West Africa

HAL Id: hal-01023805https://hal-sciencespo.archives-ouvertes.fr/hal-01023805
Submitted on 15 Jul 2014
HAL is a multi-disciplinary open accessarchive for the deposit and dissemination of sci-entific research documents, whether they are pub-lished or not. The documents may come fromteaching and research institutions in France orabroad, or from public or private research centers.
L’archive ouverte pluridisciplinaire HAL, estdestinée au dépôt et à la diffusion de documentsscientifiques de niveau recherche, publiés ou non,émanant des établissements d’enseignement et derecherche français ou étrangers, des laboratoirespublics ou privés.
The Impact of European Settlement within French WestAfrica
Elise Huillery
To cite this version:Elise Huillery. The Impact of European Settlement within French West Africa. Journal of AfricanEconomies, Oxford University Press (OUP), 2010, pp.1-49. �hal-01023805�

The Impact of European Settlementwithin French West Africa: Did Pre-colonial Prosperous Areas Fall Behind?
Elise Huillery*
Sciences-Po, Department of Economics, 28, rue des Saints-Peres, 75007 Paris, France
* Corresponding author: Elise Huillery. E-mail: [email protected]
Abstract
Did colonisation change the distribution of prosperity within French-speak-
ing West Africa? Using a new database on both pre-colonial and colonial
contexts, this paper gives evidence that Europeans tended to settle in
more prosperous pre-colonial areas and that the European settlement
had a strong positive impact on current outcomes, even in an extractive
colonial context, resulting in a positive relationship between pre- and
post-colonial performances. I argue that the African hostility towards colo-
nial power to colonisation provides a random variation in European settle-
ment since it damaged the profitability of colonial activities and dissuaded
Europeans from settling, but does not have a direct effect on current out-
comes. Rich and hostile areas received less European settlers than they
would have received had they not been so hostile, resulting in lower
current performances partly due to lower colonial investments. Despite
the absence of a ‘reversal of fortune’ within former French West Africa,
some of the most prosperous pre-colonial areas lost their advantage
because of their hostility: other areas caught up and became the new
leaders in the region.
JEL classification: N37, O11, P16
# The author 2010. Published by Oxford University Press on behalf of the Centre for the
Study of African Economies. All rights reserved. For permissions, please email:
Journal of African Economies, pp. 1–49
doi:10.1093/jae/ejq030
Journal of African Economies Advance Access published October 27, 2010 by guest on D
ecember 17, 2010
jae.oxfordjournals.orgD
ownloaded from
1. Introduction
At the worldwide level, the former colonies that were relatively rich in theyear 1500 are now relatively poor. This evidence has been documented byAcemoglu et al. (2002), who point out what they call a ‘reversal offortune’. They explain this reversal by two separate features. First,Europeans were more likely to settle in regions that were previously poorbecause poor regions were sparsely populated, enabling Europeans tosettle in large numbers. Second, the impact of these European settlementson former colonies’ development path has been positive through the intro-duction of institutions encouraging investments (Acemoglu et al., 2001). Inregions that were not suitable for heavy settlement, Europeans set up ‘extrac-tive states’ with little protection of private property and little checks and bal-ances against government expropriation. At the other extreme, in regionswhere many Europeans settled, the settlers replicated European institutionswith a strong emphasis on private property and checks against governmentpower. The positive impact of colonialism on current growth performancehas also been recently documented by Feyrer and Sacerdote (2009). Using anew database of islands throughout the Atlantic, Pacific and Indian Oceans,this paper finds a causal positive relationship between the number of yearsspent as a European colony and the current GDP per capita among islandsthat were colonised during the Age of Discovery. They argue that this posi-tive relationship is due in part to the quality of government and rise inhuman capital. Both of these papers therefore underline the positive roleof European settlement: the more settlers during colonial times, the bettereconomic performance today. Yet there is still a debate on where thisresult comes from. Acemoglu et al. (2001, 2002) focus on the positiveimpact of heavy settlement on formal institutions, whereas Feyrer andSacerdote (2009) also recognise the potential additional role of settlers onhuman capital through the introduction of formal schooling and thedirect importation of human capital in the form of the settlers themselves.Glaeser et al. (2004) revisit the debate over whether political institutionscause economic growth and document that human capital is a more basicsource of growth than are the institutions.The motivation of this paper is to examine whether European settlement
exhibited a positive impact and created a change in the distribution ofwealth among ‘extractive colonies’—where colonisers pursued a strategyof resources extraction. I focus on former French West Africa, a federationof ‘extractive’ colonies dominated by France from 1895 to 1960. As statedin Acemoglu et al. (2001, 2002), Europeans should have settled in more
2 | Elise Huillery
by guest on Decem
ber 17, 2010jae.oxfordjournals.org
Dow
nloaded from
prosperous pre-colonial areas, consistently with the extractive policy andthe search for large natural resources and labour supply. Besides, underthe institutional hypothesis, European settlement should have had a nega-tive impact on long-term development, since colonisers set up poorly func-tioning institutions in these colonies: relatively prosperous areas madeextractive institutions more profitable for the colonisers. For example,forcing the native population to work in mines or plantations limitedthe benefit of the rent to a small portion of the society. This led to a specificorganisation of society where there were poor incentives for investment,insecure property rights, poor administration of justice, etc. Under theinstitutional hypothesis, the global impact of European settlement oncurrent prosperity should therefore result in a reversal of fortune amongextractive colonies. But if the effect of European settlement runs throughmechanisms such as human capital, one may expect the regions wheremore Europeans settled within extractive colonies to outperform thosewhere few Europeans settled, resulting in a reinforcement of initial inequal-ities. This paper takes advantage of empirical evidence on former FrenchWest Africa to test these converse, though non-exclusive, hypotheses.The paper uses a first-hand district-level data set that matches direct and
precise historical datawith current data. Colonial and pre-colonial datawerecollected from historical archives in Paris and Dakar, whereas recent datacome from national household surveys from the current former coloniesgathered in 1995 (approximately). My main empirical issue though is selec-tion: why did Europeans settle intensely in certain areas? As Europeans weremore likely to settle in economically more developed districts, the naıve esti-mates of the effect of European settlement on economic development mightbe upwardly biased. I pursue two strategies to better document the causalrelationship between European settlement and current outcomes.First, I focus on a limited geographical area. To date, the macroeconomic
literature on institutions and development has largely relied on cross-country regression evidence. Faced with the statistical challenge of isolatingcausal pathways, the use of cross-country variables tends to derive instru-ments from persistent features of a country environment and limits theirusefulness for studying institutional change (Pande and Udry, 2005).Following Banerjee and Iyer (2005) and Iyer (2005), this paper uses vari-ations between infra-national districts, which is advantageous withregard to the identification of European settlement influence. FormerFrench West Africa is much more homogeneous with respect to its pre-colonial and colonial context than all other former colonies, in particularwith respect to geography, anthropology, pre-colonial history, the coloniser
The Impact of European Settlement within French West Africa | 3
by guest on Decem
ber 17, 2010jae.oxfordjournals.org
Dow
nloaded from
identity and the period and length of colonial times. The observed controlstherefore capture a much larger part of the variation between districts thanthey usually do between countries all over the world.Second, I pursue an instrumentation strategy to better understand the
causal relationship between European settlement and current performance.The instrument is the hostility towards colonial power expressed in the earlycolonial period after conquest (1906–20) measured by acts of protest likestrikes, riots or religious movements, refusal to apply colonial rules, topay taxes, to enrol in forced labour ormilitary recruitment, etc. Thesemani-festations of hostility were likely tomitigate most of the profitability of colo-nial activities and to dissuade Europeans from settling. However, one issue isthat hostility may reflect heterogeneity across districts directly correlatedwith current outcomes. As evidence shows, hostility actually tended to behigher in more prosperous and more socially and politically cohesiveareas. But the evidence on hostile areas strongly supports the fact that hos-tility was also largely accidental. Conditional on the observable character-istics that capture most of the endogenous part of hostility, I thereforeargue that hostility is a good instrument for European settlement.Furthermore, one may be reassured on the validity of my basic results bythe fact that this strategy is likely to produce downwardly biased estimatesof the effect of European settlement on current performance since there isclear evidence that the areas which tended to select into hostility towardscolonial power were the most able to advance economically to modern age.My central findings are, first, that the general European preference was to
settle in more prosperous pre-colonial areas, though political factors dis-turbed this general pattern: the preference towards prosperous areas wassometimes discouraged by the existing hostility towards colonial power.Indeed, when hostility was severe in a prosperous area, Europeans preferredto settle in a calmer neighbouring area, even if it was less prosperous.Second, European settlement had a positive influence on current perform-ances even among extractive colonies: colonised areas that received moreEuropean settlers have performed better than colonised areas that receivedless Europeans settlers. I strongly claim that these results do not mean thatcolonisation, per se, was a positive experience, since I do not compare colo-nised versus non-colonised areas.1 Results only show that in the case ofbeing colonised, the more settlers the better, even among extractive
1 It is worth noting that the positive impact of European settlement on current perform-
ance holds within colonial areas only. It is highly plausible that no colonisation whatso-
ever would have produced better current performance on the whole.
4 | Elise Huillery
by guest on Decem
ber 17, 2010jae.oxfordjournals.org
Dow
nloaded from
colonies. Additionally, these findings do not refute the ‘institutionalhypothesis’ per se but highlight the positive role of settlers on humanand physical capital: the negative impact of settlers on institutions waslocally overwhelmed by their positive impact on capital investment.As a consequence, the distribution of prosperity within former French
West Africa did not reverse. Among politically friendly areas, Europeancolonisation indeed reinforced pre-colonial inequalities by settling inmore prosperous areas. However, among West African areas that were rela-tively prosperous at the end of the nineteenth century, some are no longermore developed than the rest of the region today because they expressedmore hostility towards colonial power in early colonial times and dis-suaded Europeans from settling. As a result, these areas lost their relativeadvantage in the long run while other areas, less hostile towards colonialpower, became the new leaders in the region.With respect to the existing literature, this paper innovates in four ways.
First, it highlights the role of theAfrican attitude towards colonialism in colo-nisation features. Second, the paper extends the positive role of Europeansettlement within an ‘extractive strategy’ area. Third, it disentangles thetwo main channels of the positive effect of European settlement: institutionsand capital (human and physical). Fourth, the paper documents the evol-ution of prosperity distributionwithin former FrenchWest Africa since 1900.The paper is structured as follows. Section 1 provides a description
of the pre-colonial context. Section 2 analyses the determinants ofEuropean settlement during colonial times. Section 3 measures theimpact of European settlement on current performance. Section 4 exploressome explanations of the positive impact of European settlement oncurrent performance. Section 5 documents the change in prosperity distri-bution within former French West Africa. Section 6 concludes.
2. The European settlement in French West Africa
2.1 Historical introduction
The decade of the 1880s was a major turning point in African history. Itbrought most of the continent rapidly and brutally into the colonialperiod. But the colonial conquest was far more slow-acting than often pre-sented: the French military push began in 1854 from the Senegalese coaststo upper Senegal, driven by the famous General Faidherbe. The first mili-tary expansion went east from the Senegalese coast and arrived at the westside of current Mali (Kayes, Satadougou) in the late 1850s. Until 1880,
The Impact of European Settlement within French West Africa | 5
by guest on Decem
ber 17, 2010jae.oxfordjournals.org
Dow
nloaded from

colonial military campaigns had been limited to coastal incursions incurrent Senegal, Mauritania, Guinea and South Benin. The process ampli-fied in the 1880s with a west-to-east progress from Senegal to the northernGold Coast, joined by south-to-north incursions from coastal posts inCote-d’Ivoire (Ivory Coast). In the 1890s, a last military force progressedwest to east from the south-east side of current Mali as far as LakeTchad, joined by a column progressing south to north from current Benin.Paper annexation, however, was the only framework for French colonial
West Africa. The reality drew far more heavily on the actual process ofconquest. French West Africa was officially created in 1895 and abolishedin 1960. There were no drastic modifications for local people before1900–10 except in few coastal localities. Local chiefs’ prerogatives in par-ticular were still intact in general; their military obedience was embodiedby friendship treaties only.2 The physical occupation of the whole territorywas thus not yet effective when French West Africa, a federation of heightcolonies, was officially created in 1904. Colonial administrative reports giveevidence that the effective direct administration of the large and populousterritories began in the first decade of the twentieth century, as civil admin-istrators progressively replaced military forces. The colonial occupationwas therefore effectively in control of the major part of the territoryfrom approximately 1910 to 1960.
2.2 The West African context
West Africa is like a peninsula attached to the mass of Sub-Saharan Africaat the Cameroon mountains and stretching westward between the Gulf ofGuinea and the Sahara. It is characterised by typical longitudinal layers ofclimate. Beginning with the Sahara, the sequence is desert, savannah,forest. A physical explanation for differing natural vegetation is the differ-ence in annual rainfall.At the beginning of the twentieth century, French West Africa was a vast
territory of 4,800,000 km2, scarcely inhabited by a population of around12,000,000 people.3 Population density was therefore very low (2.5people per square kilometre). West Africa was mostly rural and towns
2 Yet hostile chiefs suffered from French military repression: French military forces defeated
and killed Lat Joor of Kajoor in 1886, pursued Mamadu Lamin to his death in 1887, exiled
Samori Ture to Gabon in 1898, where he died 2 years later, among others (Ki-Zerbo,
1978).3 I calculated the French West African population in 1910 using the censuses made by
French districts’ administrators between 1906 and 1912. These censuses are available at
6 | Elise Huillery
by guest on Decem
ber 17, 2010jae.oxfordjournals.org
Dow
nloaded from

were scarce and small. Colonial censuses of the 1900s report that the fivebiggest towns were Saint-Louis (about 24,000 people), Dakar (18,400),Rufisque (12,500), Conakry (8,200) and Cotonou (4,400). Most peoplein West Africa were farmers. As documented in Curtin et al. (1995),fishing along the coast and rivers was an intensive and specialised occu-pation. Dry-season hunting was a major source of meat in the savannahand forest alike. People mined rock salt in the Sahara and evaporated seasalt along the coast. Iron was found almost everywhere in West Africa,but some regions with the best ore became iron centres and sold theiriron to other regions that were less well endowed. Other regions concen-trated on cotton and cotton textiles or on sheep breeding and woollencloth.As a result, regular patterns of internal north–south trade helped in the
exchange of surplus from one region to another. Trade, in turn, encouragedthe growth of small towns, some near the desert-edge, to profit from thetrans-Saharan trade, like Timbuktu, Agadez, Gao and Oualata. Otherstowns, located well away from the desert, like Jenne, Bobo-Dioulasso,Kankan and Borgou, profited from the transit along commercial routesbetween the savannah and the forest. Curtin et al. (1995, p.325) writethat in the nineteenth century ‘internal trade was still far more importantthan trade with the world overseas, as it had been in the period of slavetrade’. Islam was the religion of commerce and was highly prevalent inethnic groups with strong commercial ties like the Juula. The WestAfrican political context changed before the colonial period because ofwhat Curtin calls a ‘religious revolution’. From 1780 to 1880, preachersand moral leaders often called for jihad, resulting in a substitution ofnew rulers for old and new large states for the former small states, and asubstantial spread of Islam (Sellier, 2003). Many West African states aretherefore officially related to Islam.How were politics organised? At one extreme, full-time rulers claimed
authority over every individual within a defined territory. These wereclearly states, also called kingdoms or empires. At the other, authoritywas so dispersed that no rulers could be identified. Stateless societiescould work in many different ways, but the key building block wasusually the lineage. That is why African anthropologists often call them‘lineage-based societies’, or ‘decentralised societies’, ‘segmentary societies’
the Archives Nationales, Paris, Fonds Afrique Occidentale Francaise, serie G,
sous-serie 22.
The Impact of European Settlement within French West Africa | 7
by guest on Decem
ber 17, 2010jae.oxfordjournals.org
Dow
nloaded from
and ‘autonomous local systems’ (Barrett, 1967; Murdock, 1967; Mitchelland Paden, 1989; Morrison et al., 1989). State and stateless societies haveexisted side by side for over nearly two millennia ‘without statelesspeople feeling a need to copy the institutions of their more organizedneighbours’ (Curtin et al., 1995). Between these two extremes cases,these African anthropologists identify a third category which correspondsto chiefdoms and city-states, which were smaller political units than king-doms. They also claim that political structure should not be associated withthe size of society: some African states were very small and some statelesssocieties were very large.
2.3 The allocation of European settlers over French West Africa
Overall, European settlers were not numerous in French West Africa com-pared with other settlement colonies like Algeria for France or Australia forthe UK. Curtin (1964) documents how early expectations for settlement inWest Africa were dashed by very high mortality among early settlers.Thereafter, colonial policy was driven in part by an element of superpowerrivalry and by economic motives. Davis and Huttenback (1987, p. 307)write that ‘the colonial Empire provides strong evidence for the beliefthat government was attuned to the interests of business and willing todivert resources to ends that the business community would have foundprofitable.’ Europeans settlers in French West Africa can be categorisedin two groups: the civil servants on the one hand, and workers in theprivate sector on the second hand. The French colonial budgets showthat few settlers were involved in the public sector: first French colonialgovernors, administrators, assistants and secretaries. In the educationand health sectors appear French teachers, school inspectors, doctorsand nurses. Finally, the public sector also counted French technical staffhelping inmise en valeur and state-led infrastructure development: agricul-tural engineers, civil engineers and construction engineers. On the privatesector side, Coquery-Vidrovitch (1973) and Marseille (1973), who bothstudy French private investments in colonial Africa, report that mostbusinesses in French West Africa were import–export companies. Mostof the European settlers working in the private sector were thereforetraders and employees of trade companies. According to the evidencebrought by these two historians, there were also some planters andmen working in the construction industry, and, though only few,manufacturers.
8 | Elise Huillery
by guest on Decem
ber 17, 2010jae.oxfordjournals.org
Dow
nloaded from

What explains the differences in European settlement over French WestAfrica? This is a key question since the paper aims to document the effect ofEuropean settlement on the distribution of wealth within the region. Wecould expect Europeans to prefer pre-colonial prosperous areas since theregion was under an extractive colonial strategy. Export crops likepeanuts or cocoa developed rapidly since the end of the nineteenthcentury. Infrastructures had to be built to move crops to the river portsor to the coast. Profitability of extraction was likely to be higher in prosper-ous areas because dense populations provided a supply of labour that couldproduce goods to trade with and also be forced to work in plantations andpublic works. Curtin et al. (1995, p. 447) write that ‘European capital wasinvested where exploitable resources promised the most extractive returns.’Planners were likely to pursue policies to capture production that couldbe channelled into exports in exchange of metropolitan products—system known as economie de traite and typical of French West Africa.Europeans were therefore expected to settle in densely populated areas aswell as in trading posts for trade activities.4
But initial prosperity was not the only factor influencing European settle-ment: politics were also key in making extraction profitable. On the onehand, well-structured societies could have attracted European settlers byproviding them an existing system of taxation, an administration and alsoa tribute to rely on. Following the results of Gennaioli and Rainer (2007),the profitability of European investments could be higher in states ratherthan in stateless societies by increasing the accountability of local chiefsand accelerating the implementation of colonial rule. Resistance couldalso be high in stateless societies: the French actually had to force the surren-der of each individual kinship segment. But on the other hand, existingAfrican authorities in politically well-organised societies were more likelyto interfere with colonial extraction. Despite European military superiority,Africans were however able to resist, especially in socially coherent and well-organised societies. Curtin et al. (1995, p. 514) say that ‘(primary resistance)was usually organized by the pre-colonial states.’ Acts of protest, like strikes,riots or religious movements, were likely to be stronger in societies that havegood characteristics for ‘collective action’, broadly political, cultural, ethnicor religious homogeneity. Curtin et al. (1995, p. 515) write, for instance, that
4 The situation of Equatorial Africa was a bit different because Europeans developed mining
activities in areas that could be sparsely developed, depending on mining resource discov-
ery. But colonial extraction in West Africa focused on agriculture (there was very little
mining extraction on the French part of West Africa) and was therefore likely to take
place in pre-colonial and densely populated areas.
The Impact of European Settlement within French West Africa | 9
by guest on Decem
ber 17, 2010jae.oxfordjournals.org
Dow
nloaded from
‘a common religion was one source of unity (. . .) colonial officials thereforepaid careful attention to Islam as a potentially unifying force.’ Even afterconquest and pacification were done, district administrators assigned animportant part of their annual reports to problems related to hostilitysince it had important consequences for the everyday life and managementof the districts: popular discontent, riots or opposition from the local chiefsprevented administrators to implement colonial authority and projects. Theparticipation of local people was necessary for many colonial publicor private activities like trade, agriculture or public works. Moreover,difficulties in collecting taxes or in recruiting civil servants directlyaffected the material resources of the colonial administration. Hostilitywas therefore a crucial issue for European settlers and for the colonialadministration.As a result, because they pursued an extractive strategy in the region,
Europeans were likely to prefer prosperous areas unless hostility lessensthe profitability of colonisation. That is why I expect hostility to beespecially important for settlement in prosperous areas—more than inpoor areas where Europeans would not have settled anyway.
3. Data and summary statistics
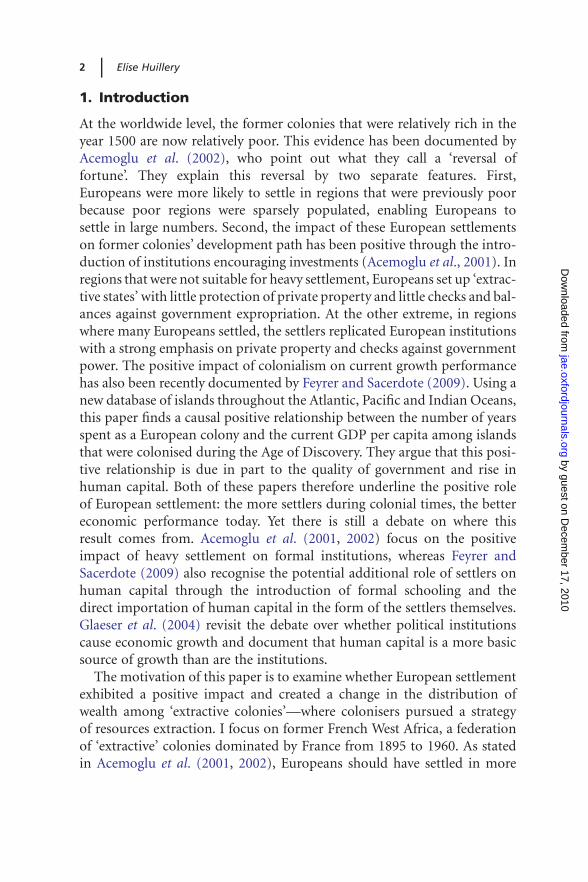
Lack of data for early times is even more problematic at the district than atthe national level. Historical data used in the paper are original. The totalnumber of districts is 110 (Figure 1).5
3.1 Data on district initial prosperity and political development
The main variable that I use to capture initial economic prosperity is thedensity of population. As documented by Malthus (1798) and Bairoch(1988), only prosperous areas could support high population densities.From a Malthusian point of view, more natural resources andagrarian prosperity are necessary to maintain a higher populationdensity. This measure is appropriate in the case of rural societies likelate-nineteenth-century West Africa (not in the case of modern industrial-ised societies). I collected data on local populations from colonialcensuses and land area from colonial maps at the district level, andcalculated population density by dividing total population by land
5 I exclude Dakar and Saint-Louis from the sample since there are no data on political
climate in these two particular districts.
10 | Elise Huillery
by guest on Decem
ber 17, 2010jae.oxfordjournals.org
Dow
nloaded from

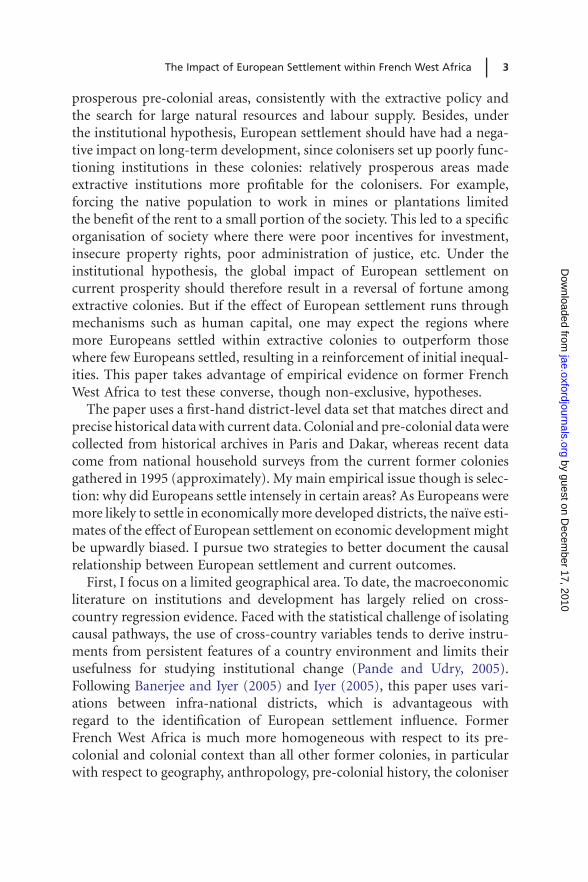
area.6 The earliest measure I can use is the population density in 1910, atthe beginning of the effective French colonial occupation. The year 1910 isearly enough to ensure that no massive population movements caused bythe colonial experience took place yet. Figure 2 reports the distribution ofpopulation density in 1910. The most densely populated areas were thesouthern region of what is currently Benin, the Mossi land in currentUpper Volta, the Wolof region in the western region of what is currentlySenegal and the Fuuta Jaalo in what is present-day, central-west Guinea.But unfortunately, population density imperfectly captures the level ofprosperity of the southern Saharan belt districts which are mainly com-posed of desert. Their area is therefore disproportionally huge comparedwith population, resulting in an almost nil population density: average1910 population density is 0.55 in desert-edge districts and 9.75 in otherdistricts (t-statistic of the hypothesis of mean equality: 2.1). However,
Figure 1: 1925 Territorial Organisation of the French West Africa: Colonies and Districts
6 It is more usual to divide total population by arable area but there are two reasons as to
why I do not use arable area: (i) a methodological reason that some districts are comple-
tely in the desert so their arable land is zero and (ii) a pragmatic reason that except for the
desert-edge districts, arable land and total land are equal: our measure of land area
excludes inland water and FAO data show that the remaining land is arable (the map is
available at http://www.fao.org/farmingsystems/FarmingMaps/SSA/12/AL/map/m10000.
html). Using total land or arable land therefore does not change anything except for
the desert-edge areas.
The Impact of European Settlement within French West Africa | 11
by guest on Decem
ber 17, 2010jae.oxfordjournals.org
Dow
nloaded from

some desert-edge cities prospered in the fifteenth and sixteenth centuriesfrom the dynamic trans-Saharan trade7. Even if the Fulani jihads of themid-nineteenth century and the civil wars that followed caused a seriousdecline of these desert-edge areas, the quasi-nil population density is nota good proximate of prosperity in these areas due to their specific geo-graphical characteristics. I therefore include a dummy for desert-edgeareas in my econometric framework in order to take into account thisspecificity regarding population density.Another issue is to measure initial political development. In this paper,
I follow African anthropologists and economists who have previouslyworked on this topic (Barrett, 1967; Murdock, 1967; Morrison et al.,1989; Englebert, 2000) and distinguish three pre-colonial political statuses:kingdoms or empires, chiefdoms and completely amorphous areas. I do notuse the index of state-like nature of pre-colonial systems used in Englebert(2000) because this index is at the national level. As I need more preciseinformation at the district level, I use evidence from African historians(Ki-Zerbo, 1978; Bouche, 1991; Coquery-Vidrovitch and Moniot, 1993).The time period in which political structure is observed is 1850–80.There is a strong consensus within these historical sources on the location
Figure 2: 1910 Population Density. Source: Author’s computations based on colonial cen-
suses, Archives Nationales, Paris.
7 For a comprehensive and detailed article on the trans-Saharan trade, refer to the historian
Pekka Masonen at http://www.hf-fak.uib.no/institutter/smi/paj/Masonen.html.
12 | Elise Huillery
by guest on Decem
ber 17, 2010jae.oxfordjournals.org
Dow
nloaded from
of pre-colonial kingdoms, chiefdoms and amorphous areas. Completelyamorphous areas,8 characterised by a total absence of political authority,were located in the forest regions of Guinea (Toma and Guerze), in thesouth-western Ivorian forest (Krou), in Casamance in south-westernSenegal and in Atakora in north-western Benin (Somba). Kingdoms corre-spond to large areas with political control concentrated in the hands of a fewpeople, with an ability to collect revenue and tribute. Appendix B shows dis-tricts affected to the kingdom category, the name of the kingdom and thehistorical sources that allowed me to construct these data. A district wasaffected to the ‘kingdom’ category as soon as a kingdom existed on themain part of the area over 1850–80, based on description and maps of pre-colonial kingdoms (Sellier, 2003). Approximately half of the districts werepart of kingdoms from before colonial rule, and 13 districts were part ofcompletely amorphous areas. Pre-colonial, well-structured kingdoms hadsignificantly higher population densities than the rest of the region:average 1910 population density is 11.1 over kingdom districts and 6 overthe other districts (t-statistic of the hypothesis of mean equality: 1.8). Inother words, political development and economic prosperity were positivelycorrelated, which is consistent with Stevenson’s view of higher populationdensities in traditional states in Sub-Saharan Africa and lower ones in thenon-state regions (Stevenson, 1968).9
Finally, initial differences in climate can be captured by differences inlatitude, longitude and rainfalls. In West Africa, it varies from 160 inchesin a few places along the coast to less than 15 inches at the edge of thedesert. Another factor explaining differences in natural circumstances isrivers. Certain north-flowing rivers like the Senegal and the Upper Nigerprovide a kind of safety valve. These rivers overflow their banks andcarry both silt and moisture to the surrounding fields. Crops are plantedon the wet fields as the water recedes and grown during the early dryseason. I therefore constructed a dummy for the presence of navigable
8 Amorphous areas are also called ‘lineage-based societies’ in Englebert (2000) or ‘segmen-
tary systems’ in Murdock (1967).9 This can be explained as stateless societies had several problems: warfare on a large scale
called for strong military command and permanent officials, traders needed a way to
protect goods for transit, there was a need for a system of law allowing aliens to come
and go in peace and there needed to be a system to facilitate borrowing and collection
of debts. These needs could only be offered by permanent officials and central direction.
A reverse causation is also plausible: densely populated areas were likely to coincide with a
higher division of labour which likely required a higher level of political organisation than
extensive labour organisation.
The Impact of European Settlement within French West Africa | 13
by guest on Decem
ber 17, 2010jae.oxfordjournals.org
Dow
nloaded from

rivers. Since altitude is also an important determinant of disease environ-ment, I include for each district the altitude of its main town. Finally, accessto the sea is a strong determinant of economic opportunities (exports, saltproduction, fishing along the coast). I therefore include a dummy forcoastal districts. Please refer to Appendix A for more detail on data sources.
3.2 Data on European settlement
District-level data on European settlers come from colonial censuses. Thenumber of European settlers was globally very low as in almost all extractivecolonies in Africa, India and Asia (Mc Evedy and Jones, 1975; Curtin et al.1995, p. 435). The African colonies where the proportion of Europeansexceeded 1% are Southern and South-Central Africa, Angola and theMaghreb (Acemoglu et al., 2001). In 1910, there were a total of 7,610Europeans living in French West Africa, which progressively increased to13,239 in 1925 and 53,087 in 1950,10 representing alternatively 0.6‰, 1‰and 3‰ of French West African population. At the district level, theaverage number of European settlers grew up from 68 in 1910 to 118 in1925 and 525 in 1950. But these figuresmask a huge heterogeneity across dis-tricts which can be appreciated by the gap between the average number ofEuropean settlers per district and the median one: half of the districts hadless than 16 settlers in 1910, 23 in 1925 and 86 in 1950.
3.3 Data on district hostility towards colonial power
I collected data on African attitudes towards French power and especiallyhostility at the district level. Data come from the political annualreports11 written by the district administrators of the governor. Thesereports aimed to inform the governor on the political climate in each dis-trict of the colony. The district administrators therefore chronicled everypolitical event that occurred in their district during the year: good/bad dis-position of the population, riots, opposition from the local chiefs, diffi-culty in collecting taxes or in recruiting civil servants, refusal to docoerced labour, etc. I12 read every report for years ending by ‘3’, ‘6’ and‘9’ from 1906 to 1956, and coded political events expressing hostility
10 Actually, this is not the exact number of Europeans in 1950 since I used censuses from
1947 to 1953 to calculate this total, depending on data availability at the colony level.11 Paris, National Archives, Fonds Afrique Occidentale Francaise, serie G, sous-serie 2.12 Angelique Roblin also provided excellent assistance in collecting these data.
14 | Elise Huillery
by guest on Decem
ber 17, 2010jae.oxfordjournals.org
Dow
nloaded from

towards colonial power. Among events expressing hostility, I distinguishedexpressions of severe importance when (1) it clearly showed the determi-nation to jeopardise the colonial power—clashes with a significant groupin the district, people running away to escape tax collection or the activismof religious movements, and (2) it necessitated a repressive interventionfrom the French administration: military repression, the destitution of alocal chief, the dispatching of policemen to force people to pay taxes orenrol in coerced labour, or intervention to punish some rebellious people.To construct a relevant measure of hostility, I focus on the period 1906–20.
Historians actually distinguish between three types of African resistance: (1)resistance to military conquest, before effective direct administration of thelarge and populous territories, which was therefore unlikely to influenceEuropean settlement; (2) resistance characterised by the refusal to obey, paytaxes, do coerced labour and to enrol in police forces, which directly affectedthe profitability of colonial activities and was therefore likely to influenceEuropean settlement; (3) ‘modern nationalism’, which was borrowed fromthe West by the local western-educated elite with the goal of taking over thecolonial state after WWII (Curtin et al., 1995, p. 514; Rioux, 2007, p. 668).What interests me is the hostility thatmight dissuade Europeans from settlingbeginning in 1906 because the arrival of European settlers began at the end ofthe military pacification, contemporaneously with the implantation of anadministrative structure. After 1920, the expressions of this type of hostilitydeclined until 1945, when French administrators faced the third type of hos-tility (‘modern nationalism’), which does not have much relevance in thispaper because it mostly took place in capitals and favoured areas withoutany influence on the location of European settlers.Let E(n) be the number of events expressing hostility in year n, S(n) the
number of severe events expressing hostility in year n [by constructionE(n) ≥ S(n)] and N the total number of years for which I observe hostility.I construct three indicators of hostility. The first indicator H1 is the occur-rence rate of events expressing hostility over 1906–19:
H1 =1
N
∑n1E(n). 0
The second indicator H2 equals the occurrence rate of only severe eventsexpressing hostility:
H2 =1
N
∑n1S(n). 0
The Impact of European Settlement within French West Africa | 15
by guest on Decem
ber 17, 2010jae.oxfordjournals.org
Dow
nloaded from

The third indicator H3 equals the average annual number of severe eventsexpressing hostility:
H3 =1
N
∑nS(n)
The difference between H1 and the two others is that the two others focuson severe events only.H2 andH3 are thus less dependent on the variation inthe narrative profusion of district administrators and how they discrimi-nate between minimally and severely hostile areas. The differencebetween H2 and H3 is that H3 discriminates between areas according tothe annual number of events expressing hostility in the same year.Hostility could actually be expressed not only once a year but also twiceor more. H3 thus takes into account the intensity of hostility in the sameyear as another dimension of severity.To make this completely clear, let me give an example. Take three dis-
tricts A, B and C and two years T and T + 1. The following table reportsthe number of events expressing hostility regarding their degree of impor-tance and the resulting values of H1, H2 and H3 over (T, T + 1).Measures of hostility: Examples
A B C
T
Minor or moderate 1 0 0
Severe 0 1 2
T + 1
Minor or moderate 0 1 0
Severe 0 0 3
H1 0.5 1 1
H2 0 0.5 1
H3 0 0.5 2.5
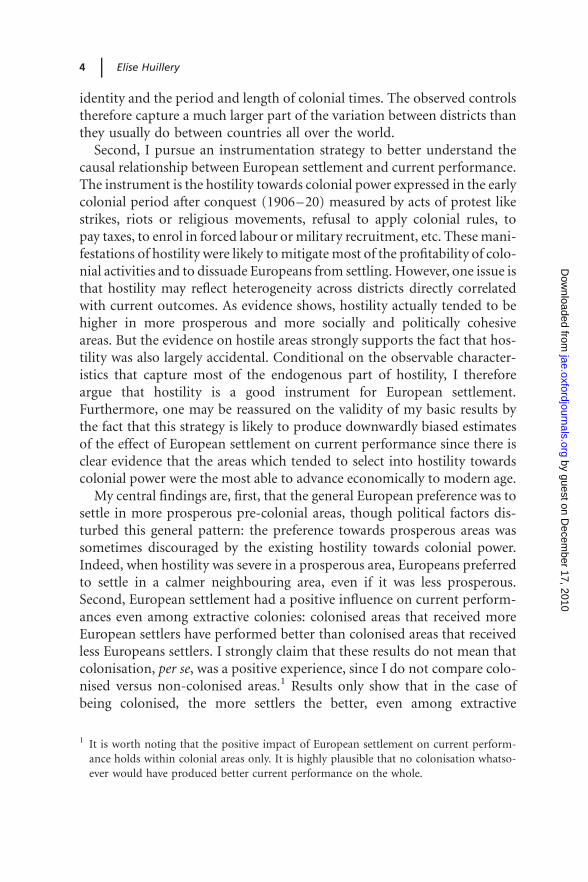
Empirically, the correlation between the three indicators is very large: 0.80between H1 and H3, 0.87 between H2 and H3 and 0.92 between H1 and H2.The results obtained do not actually depend on which indicator is used.Table 1 shows that hostility was a major issue according to the annual politi-cal reports: on average, the occurrence rate of events expressing hostility is0.49. The vast majority of these events were severe since the occurrencerate of severe events is 0.43. Finally, districts experienced on average 1.03severe events per year. The variations are large since some districts experi-enced no hostility at all, whereas others experienced hostility every yearwith on average more than four severe events per year. Figure 3 shows thedistribution of hostility within former French West Africa.
16 | Elise Huillery
by guest on Decem
ber 17, 2010jae.oxfordjournals.org
Dow
nloaded from

Table 1: Summary Statistics on Districts
Variable Mean Standard
deviation
Minimum Maximum Number of
observations
Current performancesa
Literacy rate (more
than 15 years old)
21.64 15.78 0.20 68.63 109
At least 1 year in
primary school
(.7 years old)
18.63 11.62 2.03 70.54 109
At least 1 year in sec-
ondary school (.12
years old)
8.05 6.82 0 41.21 109
Having access to private
water
11.72 15.88 0 92.92 109
Connected to electricity 13.66 17.86 0 87.51 109
Using a modern fuel 22.4 30.67 0 99.99 109
Proportion of people
having a house with a
solid roof
4.07 9.00 0 59.55 109
Proportion of people
having a house with
solid walls
22.31 22.47 0 84.11 109
Stunting rate (less than
5 years old children)
36.88 12.25 7.14 85.71 89
Colonial periodb
1910: number of
European settlers per
1,000 inhabitants
1.25 3.73 0 30.64 110
1925: number of
European settlers per
1,000 inhabitants
2.73 12.32 0.026 113.75 110
Occurrence rate of
events expressing
hostility (H1)
0.49 0.30 0 1 110
Occurrence rate of
severe events expres-
sing hostility (H2)
0.43 0.29 0 1 110
Average annual num-
ber of severe events
expressing hostility
(H3)
1.03 0.99 0 4.2 110
Teachers per 100,000
inhabitants over
1930–39
9.21 20.62 0 206.98 110
(continued on next page)
The Impact of European Settlement within French West Africa | 17
by guest on Decem
ber 17, 2010jae.oxfordjournals.org
Dow
nloaded from

3.4 Data on current development
Data on current performance come from national household survey inSenegal, Benin, Mali, Niger, Guinea, Mauritania, Upper Volta and IvoryCoast.13 I collected the geographical coordinates of household localitiesand matched these localities with their colonial district using colonialmaps from 1925 to compute statistics on districts’ current performances.14
The national household surveys are not designed to be representative at the
Table 1: Continued
Variable Mean Standard
deviation
Minimum Maximum Number of
observations
Doctors per 100,000
inhabitants over
1930–39
20.06 49.53 2.19 463.27 92
Public works per square
kilometre over
1930–39
69.93 480.68 0 5,000.27 110
Pre-colonial periodc
1910 population
density
8.50 15.20 0.01 132.49 110
Desert-edge area
dummy
0.14 0.34 0 1 110
Pre-colonial kingdom
dummy
0.49 0.50 0 1 110
Amorphous area
dummy
0.12 0.32 0 1 110
Geographical characteristicsc
Altitude (feet) 799.42 583.51 0 3,044 110
Latitude 11.83 3.73 4.77 20.97 110
Longitude 25.82 6.10 217.06 12.92 110
Annual rainfalls aver-
age over 1915–75
(mm)
1,063.67 683.63 17 3,248 110
Coastal dummy 0.19 0.39 0 1 110
River dummy 0.66 0.47 0 1 110
Statistics are all calculated at the district level.aNational Households Surveys around 1995 in former French West African colonies.bColonial censuses and colonial annual political reports, Archives Nationales, Paris, France.cAppendix A.
13 Please refer to Appendix A for more details about data sources.14 Districts contain on average 450 households, 620 children 7–12 years old and 370 less
than 5 years old.
18 | Elise Huillery
by guest on Decem
ber 17, 2010jae.oxfordjournals.org
Dow
nloaded from

district level, which is an unsolvable caveat for my analysis. I use only com-parable variables from these surveys and use country-fixed effects toaddress the issue of comparability due to the fact that these surveys spanalmost 10 years.I focus on indicators of permanent income rather than on income or
consumption because of their higher volatility. The idea is to examinethe long-term impact of European settlement on structural outcomesand therefore to avoid noise coming from recent shocks and poor dataquality. I focus on four dimensions of the welfare of the districts. First, edu-cational performance is captured by the literacy rate of people 15 years oldand above, the proportion of people 7 years old and above who haveattended primary school for at least 1 year and the proportion of people12 years old and above who have attended secondary school for at least1 year. Second, health performance is captured by the proportion of chil-dren less than 5 years old suffering from stunting15—the Mauritanian
Figure 3: Hostility towards Colonial Power as Measured by H3 (Average Annual Number of
Severe Events Expressing Hostility over 1906–20). Source: Author’s computations based on
colonial annual political reports over 1906–20.
15 I used international standards associated with each age (measured in months) to calcu-
late the rate of stunting children in each district. A child is said to suffer from stunting if
her height is less than 2 standard deviations under the median height.
The Impact of European Settlement within French West Africa | 19
by guest on Decem
ber 17, 2010jae.oxfordjournals.org
Dow
nloaded from

survey does not contain information about children’s height, soMauritanian districts are excluded from these statistics and all relatedregressions. Third, equipment performance is captured by the proportionof households connected to electricity, the proportion of householdshaving access to private water and the proportion of households using amodern fuel (gas or electricity) for cooking. Finally, the quality of thehousing is measured by the proportion of households living in a homewith solid walls (cement or hard brick) and the proportion of householdsliving in a home with a solid roof (cement or tiles).Summary statistics of these development indicators are presented in
Table 1. Correlation between these indicators is not very large (e.g., the cor-relation between literacy rate and the height of other indicators varies from0.14 to 0.57), which legitimates to run regressions on the indicators one byone rather than an index to check that our results are not driven by a par-ticular outcome.
4. The European settlement and long-run development
4.1 Evidence on the allocation of European settlers over French West
Africa
I test empirically the expected correlation between European settlement,economic prosperity and political development from before colonial ruleand hostility by running ordinary least squares (OLS) regressions of theform:
Ei = a + dHi + Pig + Hi ∗ Pin + Sim + Xil + 1i, (1)
where Ei is the share of Europeans in district i population in 1925, Hi themeasure of hostility in district i over 1906–20, Pi a set of proxies for econ-omic prosperity from before colonial rule in district i, Hi*Pi the product ofhostility with proxies for initial economic prosperity, Si a set of proxies forpolitical status from before colonial rule in district i and Xi a set of geo-graphical control variables. My coefficients of interest are d, g and n: d rep-resents the effect of hostility on European settlement when pre-colonialprosperity is zero, g represents the effect of initial economic prosperitywhen hostility is zero and n represents the supplemental effect of hostilitydepending on economic prosperity, since hostility is likely to be important
20 | Elise Huillery
by guest on Decem
ber 17, 2010jae.oxfordjournals.org
Dow
nloaded from

especially in prosperous areas (cf. Section 1). The number of observationsis 110.16
Table 2 shows that Europeans were attracted by initially prosperousareas. The dissuasive impact of hostility on European settlement was alsolarge and significant, though mainly driven by net effects controlling forinitial prosperity. One additional severe event expressing hostilityper year reduced the number of European per 1,000 inhabitants in1925 by 1, which is not a small effect since there were on average 2.7
Table 2: The Determinants of 1925 European Settlement
Independent variables (1) (2) (3) (4) (5)
1910 population density 0.10***
(0.037)
0.12***
(0.04)
0.07**
(0.037)
0.35***
(0.067)
Desert-edge area dummy 2.78*
(1.62)
4.81***
(1.76)
3.13
(2.06)
13.33***
(3.30)
Hostility (H3) 20.74
(0.57)
21.59***
(0.60)
1.36**
(0.68)
1.00
(0.74)
1910 population
density * hostility (H3)
20.14***
(0.03)
Desert-edge area
dummy * hostility (H3)
25.41***
(1.51)
Number of inhabitants 110 110 110 110 110
R2 0.08 0.02 0.14 0.31 0.47
Control variables
Initial political status No No No Yes Yes
Geographical
characteristics
No No No Yes Yes
Dependent variable is Europeans per 1,000 inhabitants in 1925; initial political status
variables are kingdom dummy and acephalous area dummy; geographical characteristic
variables are average annual precipitations over 1910–70, altitude, longitude, latitude,
navigable river dummy 1.
Standard error values are in parentheses. Each cell represents the coefficient from an OLS
regression of the dependent variable on the independent variable.
***Significant at the 1% level.
**Significant at the 5% level.
*Significant at the 10% level.
16 Note that Dakar and Saint-Louis are excluded from the sample because of the lack of data
on political climate in these two specific districts. Dakar was the capital of French West
Africa and Saint-Louis the capital of Senegal and Mauritania. These two cities had a par-
ticular legal status. Consequently, no annual political reports were written on Dakar and
Saint-Louis. The number of observations is thus 110.
The Impact of European Settlement within French West Africa | 21
by guest on Decem
ber 17, 2010jae.oxfordjournals.org
Dow
nloaded from

settlers.17 Table 2 also shows that the dissuasive effect of hostility was largerfor densely populated areas than for sparsely populated areas. Figure 4 rep-resents the differences in the dissuasive impact of hostility along the distri-bution of the population density. It shows that most hostile areas at the75th percentile of population density lost 2 European settlers per 1,000inhabitants, whereas most hostile areas at the 25th percentile of populationdensity lost only 0.5 European settlers per 1,000 inhabitants. These resultsthus confirm the previous predictions: Europeans were more attracted byprosperous areas but hostility disturbed this preference and created largedifferences in settlement within prosperous areas.One might be concerned that the negative relationship between
European settlement and hostility towards colonial power could reflect areverse causation. Results in Table 3 could actually be interpreted as thenegative impact of European settlement on hostility: the more Europeansin the districts, the less hostile. To address this reverse causation issue,I use a Granger causality type argument thanks to the evolution patternsof European settlement and hostility. I use European settlement in 1910and 1925 (Et and Et+1, respectively) and hostility over 1906–20 and1920–40 (Ht and Ht+1, respectively). The reverse causation issue can be
Figure 4: Effect of Hostility on European Settlement along Population Density Distribution
17 Note that this statistic is calculated without Dakar and Saint-Louis.
22 | Elise Huillery
by guest on Decem
ber 17, 2010jae.oxfordjournals.org
Dow
nloaded from

tested by running regressions of the form:
Et+1,i = a + dHt,i + bEt,i + Xil + 1i,
Ht+1,i = s + gHt,i + tEt,i + Xin + 1i,(2)
where Et,i is the number of Europeans per 1,000 inhabitants in time t indistrict i, Ht,i the level of hostility in time t in district i and Xi a set ofcontrol variables in district i. With this specification, coefficient d rep-resents the Granger causal impact of hostility on European settlementsince the potential effect of European settlement on hostility is capturedby Et,i, while coefficient g represents the Granger causal impact ofEuropean settlement on hostility since the potential effect of hostility onEuropean settlement is captured by Ht,i.Results are reported in Table 3. Hostility towards colonial power over
1920–40 clearly had a negative Granger causal impact on European settle-ment, while European settlement had no Granger causal impact on hosti-lity, which supports my interpretation that hostility disturbed Europeansettlement and created large differences in settlement within prosperous
Table 3: Granger Causality between Hostility and European Settlement
Independent variables Dependent variable
Europeans per 1,000 inhabitants
in 1925 (1)
Hostility (H3) over
1920–40 (2)
Europeans per 1,000 inhabi-
tants in 1910
2.08***
(0.11)
20.006
(0.02)
Hostility (H3) over 1906–20 20.69**
(0.33)
0.13***
(0.05)
Number of observations 110 110
R2 0.85 0.18
Control variables
1910 population density Yes Yes
Desert-edge area dummy Yes Yes
Initial political status Yes Yes
Geographical characteristics Yes Yes
Standard error values are in parentheses. Each cell represents the coefficient from an OLS
regression of the dependent variable on the independent variable. Initial political status
variables are kingdom dummy and acephalous area dummy; geographical characteristics
variables are average annual precipitations over 1910–70, altitude, longitude, latitude,
navigable river dummy.
***Significant at the 1% level.
**Significant at the 5% level.
*Significant at the 10% level.
The Impact of European Settlement within French West Africa | 23
by guest on Decem
ber 17, 2010jae.oxfordjournals.org
Dow
nloaded from

areas. Omitted variables can still be an issue in this specification, so resultscan only be interpreted as showing Granger causality and not causality inthe usual (randomised experiment) sense of the word.
4.2 OLS estimates of the impact of European settlement on current
performance
I compare the development performance of the districts according toEuropean settlement in 1925 by running OLS regressions of the form:
Yi = a + bEi + Pig + Sim + Xil + Cis + 1i, (3)
where Yi is an outcome variable in district i, Ei the number of Europeans indistrict i per 1,000 population in 1925, Pi a set of proxies for initial econ-omic prosperity in district i, Si a set of proxies for initial political status ofdistrict I, Xi a set of geographical control variables and Ci a set of country-fixed effects. My coefficient of interest is b, which represents the impact ofEuropean settlement net of its correlation with pre-colonial economic, pol-itical and geographical characteristics. I include country-fixed effects toaddress cross-country comparability issue.Table 4 gives evidence that European settlement is strongly positively
correlated with current performance. Coefficients on Europeans per1,000 inhabitants in 1925 in panel C show that for one additionalEuropean per 1,000 inhabitants in 1925, the current performance rategoes up by 0.50 to 1.6 percentage points in each dimension: education,equipment, quality of housing, except health (the coefficient is not signifi-cant). A 1 standard deviation increase in the number of Europeans per1,000 inhabitants would approximately produce a 1 standard deviationincrease in current performance rate (from 0.5 to 1.20 depending onwhich performance is considered). Panel A also shows that the variancein European settlement in 1925 explains a large part of the variance incurrent performances in most of cases. Note that P-values of the test ofjoint significance on control variables are reported in Panel C so thatone can see whether the controls explain a significant share in the variationof the outcomes. No regular pattern emerges from this, which leavesunclear the explanatory strength of geography versus initial economicand political development.Yet this strategy produces biased estimates if there are unobserved dis-
trict characteristics that are correlated with current performances. It isnot clear whether the bias would be upwards or downwards since such
24 | Elise Huillery
by guest on Decem
ber 17, 2010jae.oxfordjournals.org
Dow
nloaded from

Table 4: The Impact of European Settlement on Current Outcomes: OLS Estimates
Independent variables Dependent variable: district performance rate (in percentage points) with respect to
Literacy
(1)
Primary
school (2)
Secondary
school (3)
Water
(4)
Electricity
(5)
Modern
combustible
(6)
Wall
solidity
(7)
Roof
solidity
(8)
Stunting
(9)
Panel A: Main effects
Europeans per 1,000
inhabitants in 1925
1.10***
(0.23)
1.00***
(0.16)
0.69***
(0.08)
1.74***
(0.20)
2.03***
(0.21)
1.85***
(0.47)
1.48***
(0.34)
0.72***
(0.13)
21.49**
(0.66)
R2 0.17 0.26 0.36 0.42 0.45 0.13 0.15 0.22 0.06
Number of observations 109 109 109 109 109 109 109 109 89
Panel B: Main effects with country-fixed effects
Europeans per 1,000
inhabitants in 1925
0.92***
(0.14)
0.75***
(0.12)
0.63***
(0.08)
1.55***
(0.19)
1.88***
(0.18)
0.94***
(0.25)
1.35***
(0.26)
0.70***
(0.11)
20.88
(0.64)
R2 0.74 0.65 0.59 0.52 0.66 0.79 0.57 0.54 0.27
Number of observations 109 109 109 109 109 109 109 109 89
Panel C: Net effects controlling for initial characteristics
Europeans per 1,000
inhabitants in 1925
0.70***
(0.15)
0.65***
(0.12)
0.58***
(0.08)
1.27***
(0.21)
1.60***
(0.20)
0.57***
(0.27)
0.99***
(0.27)
0.50***
(0.11)
21.48**
(0.86)
R2 0.81 0.75 0.67 0.62 0.73 0.83 0.69 0.69 0.37
Number of observations 109 109 109 109 109 109 109 109 89
(continued on next page)
TheIm
pact
ofEuropeanSettle
mentwith
inFrench
West
Africa
|25
by guest on December 17, 2010 jae.oxfordjournals.org Downloaded from
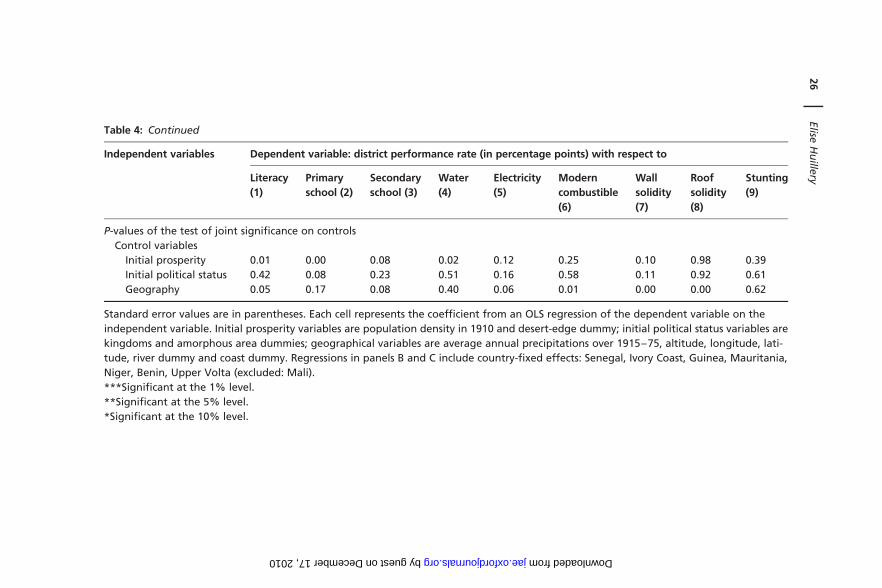
Table 4: Continued
Independent variables Dependent variable: district performance rate (in percentage points) with respect to
Literacy
(1)
Primary
school (2)
Secondary
school (3)
Water
(4)
Electricity
(5)
Modern
combustible
(6)
Wall
solidity
(7)
Roof
solidity
(8)
Stunting
(9)
P-values of the test of joint significance on controls
Control variables
Initial prosperity 0.01 0.00 0.08 0.02 0.12 0.25 0.10 0.98 0.39
Initial political status 0.42 0.08 0.23 0.51 0.16 0.58 0.11 0.92 0.61
Geography 0.05 0.17 0.08 0.40 0.06 0.01 0.00 0.00 0.62
Standard error values are in parentheses. Each cell represents the coefficient from an OLS regression of the dependent variable on the
independent variable. Initial prosperity variables are population density in 1910 and desert-edge dummy; initial political status variables are
kingdoms and amorphous area dummies; geographical variables are average annual precipitations over 1915–75, altitude, longitude, lati-
tude, river dummy and coast dummy. Regressions in panels B and C include country-fixed effects: Senegal, Ivory Coast, Guinea, Mauritania,
Niger, Benin, Upper Volta (excluded: Mali).
***Significant at the 1% level.
**Significant at the 5% level.
*Significant at the 10% level.
26|
Elise
Huille
ry
by guest on December 17, 2010 jae.oxfordjournals.org Downloaded from

unobserved characteristics that attracted settlers could have either a posi-tive or a negative influence on current performances.
4.3 IV estimates of the impact of European settlement
on current performance
A way of solving the problem of omitted variables is to instrument thenumber of European settlers. Some solutions to this problem have beenfound in the literature, especially in Acemoglu et al. (2001, 2002) andFeyrer and Sacerdote (2009). Feyrer and Sacerdote (2009) use windspeed as a random source of variation in the length of colonialism,which is obviously unemployable outside the context of islands.Acemoglu et al. (2001, 2002) use European settler mortality as an exogen-ous source of variation of European settlement but I cannot use this vari-able as an instrument for European settlement since this variable is veryimprecise and volatile due to very small numbers of Europeans per district(I refer to Appendix C for further evidence and discussion on this point).18
In this paper, I use hostility towards colonial power as an instrument forEuropean settlement. The underlying assumption is that hostilitytowards colonial power affected European settlement (as shown inSection 4.1) but did not directly affect the long-term development path.Since such an assumption is hard to acknowledge (as discussed in whatfollows), I will relax it and assume that conditionally on some observablecharacteristics affecting both hostility and current performances, hostilitytowards colonial power was something accidental that created exogenousvariation in European settlement.Hostility could violate the exclusion relation in two ways: first, if hostility
depended on pre-colonial district characteristics which influenced thelong-term development path (something that preceded colonial experi-ence, like initial prosperity and political development); second, if hostilitycreated particular conditions in the districts which influenced the long-term development paths independently from European settlement [some-thing that followed colonial experience, positively like greater collective
18 Some scholars might want to use instruments like distance to the nearest seaports since it
was negatively correlated with European settlement: all settlers from Europe arrived in
West Africa by boat and were therefore more likely to settle near the port from which
they entered. But this alternative instrument is far from convincing since distance to
the nearest seaport is highly correlated with distance to the coast, which, in turn, reflects
an intrinsic ability to advance economically in the modern age due to low transportation
costs for trade and greater ability to adopt Western technology, among others.
The Impact of European Settlement within French West Africa | 27
by guest on Decem
ber 17, 2010jae.oxfordjournals.org
Dow
nloaded from

action and social cohesion (Banerjee et al., 2008), or negatively like anar-chic indigenous politics and current conflicts]. To test the influence ofinitial economic prosperity and political status on hostility, I runregressions of the form:
Hi = a + Pig + Sim + Xil + 1i, (4)
whereHi is the measure of hostility in district i, Pi a set of proxies for initialeconomic prosperity in district i, Si a set of proxies for initial politicalstatus of district i and Xi a set of geographical control variables.Empirical results are reported in Table 5. They show that early hostilitywas significantly higher in more densely populated areas and in desert-edgeareas, meaning that economic prosperity encouraged resistance andhostility—probably because the prosperous areas had more to defendand fight for than poor areas. Initial political development also influencedhostility towards colonial power in a non-linear way: kingdoms and amor-phous areas were more hostile than the rest of the region—plenty and lackof social authority was both hard to control by the colonial power. It is alsoworth noting that the significantly positive coefficient on latitude probablyreflects a correlation between Islam and hostility, which is recurrently men-tioned in administrators’ annual reports.19 Hostility was thus evidentlycorrelated with intrinsic district characteristics that also potentially influ-enced their development path.Yet administrators’ annual reports also give evidence that district charac-
teristics did not completely explain the differences in levels of hostility.Hostility is often presented as a mismatch between a specific colonialadministrator and the African population, except after WWII when hosti-lity was almost driven by elite groups in biggest cities to obtain indepen-dence. A first accidental source of hostility, reported in Cohen (1974), isthe heterogeneity of French colonial administrators in regard to their edu-cational background and their vision of the role of colonialism. Some colo-nial administrators were diplomatic and succeeded in creating a favourablepolitical climate with the local people, whereas others were brutal and pro-voked aggressive reactions. Another accidental source of hostility could bethe emergence of a specific leader personally inclined to resistance towardscolonial authority, like Samori in eastern Guinea. Administrators reportedcases where chiefs accepted some indemnities, whereas others declined thesame offer because of their ‘personality’ and inclination towards
19 Islamic penetration came historically from North Africa and is therefore distributed
north-to-south.
28 | Elise Huillery
by guest on Decem
ber 17, 2010jae.oxfordjournals.org
Dow
nloaded from
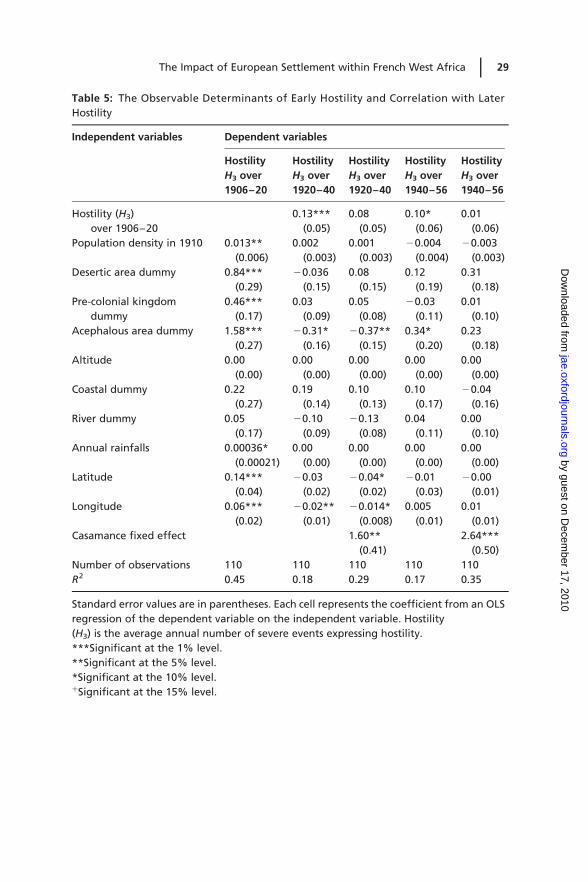
Table 5: The Observable Determinants of Early Hostility and Correlation with Later
Hostility
Independent variables Dependent variables
Hostility
H3 over
1906–20
Hostility
H3 over
1920–40
Hostility
H3 over
1920–40
Hostility
H3 over
1940–56
Hostility
H3 over
1940–56
Hostility (H3)
over 1906–20
0.13***
(0.05)
0.08
(0.05)
0.10*
(0.06)
0.01
(0.06)
Population density in 1910 0.013**
(0.006)
0.002
(0.003)
0.001
(0.003)
20.004
(0.004)
20.003
(0.003)
Desertic area dummy 0.84***
(0.29)
20.036
(0.15)
0.08
(0.15)
0.12
(0.19)
0.31
(0.18)
Pre-colonial kingdom
dummy
0.46***
(0.17)
0.03
(0.09)
0.05
(0.08)
20.03
(0.11)
0.01
(0.10)
Acephalous area dummy 1.58***
(0.27)
20.31*
(0.16)
20.37**
(0.15)
0.34*
(0.20)
0.23
(0.18)
Altitude 0.00
(0.00)
0.00
(0.00)
0.00
(0.00)
0.00
(0.00)
0.00
(0.00)
Coastal dummy 0.22
(0.27)
0.19
(0.14)
0.10
(0.13)
0.10
(0.17)
20.04
(0.16)
River dummy 0.05
(0.17)
20.10
(0.09)
20.13
(0.08)
0.04
(0.11)
0.00
(0.10)
Annual rainfalls 0.00036*
(0.00021)
0.00
(0.00)
0.00
(0.00)
0.00
(0.00)
0.00
(0.00)
Latitude 0.14***
(0.04)
20.03
(0.02)
20.04*
(0.02)
20.01
(0.03)
20.00
(0.01)
Longitude 0.06***
(0.02)
20.02**
(0.01)
20.014*
(0.008)
0.005
(0.01)
0.01
(0.01)
Casamance fixed effect 1.60**
(0.41)
2.64***
(0.50)
Number of observations 110 110 110 110 110
R2 0.45 0.18 0.29 0.17 0.35
Standard error values are in parentheses. Each cell represents the coefficient from an OLS
regression of the dependent variable on the independent variable. Hostility
(H3) is the average annual number of severe events expressing hostility.
***Significant at the 1% level.
**Significant at the 5% level.
*Significant at the 10% level.+Significant at the 15% level.
The Impact of European Settlement within French West Africa | 29
by guest on Decem
ber 17, 2010jae.oxfordjournals.org
Dow
nloaded from

opposition. An example that illustrates such variations can be found in thetwo neighbouring Bambara kingdoms, Kaarta and Segu: the FamaMademba of Segu accepted to collaborate and to receive an annual indem-nity from the colonial power, whereas the king of Kaarta, Koulibaly,declined. Consequently, the level of hostility in the corresponding districtsis much higher in former Kaarta than in former Segu. Another example isSine Saloum and Baol in Senegal: they are neighbouring districts, bothdensely populated, both under a pre-colonial kingdom, with very similaranthropological and geographical characteristics. Baol was significantlymore hostile than Sine Saloum: the average annual number of severeevents expressing hostility was 0.6 in Baol and 0.2 in Sine Saloum. Suchdiscontinuity between similar districts can be observed with Ouahigouyaand Dedougou in current Upper Volta, among many others.Moreover, Table 5 shows that early hostility was not correlated with later
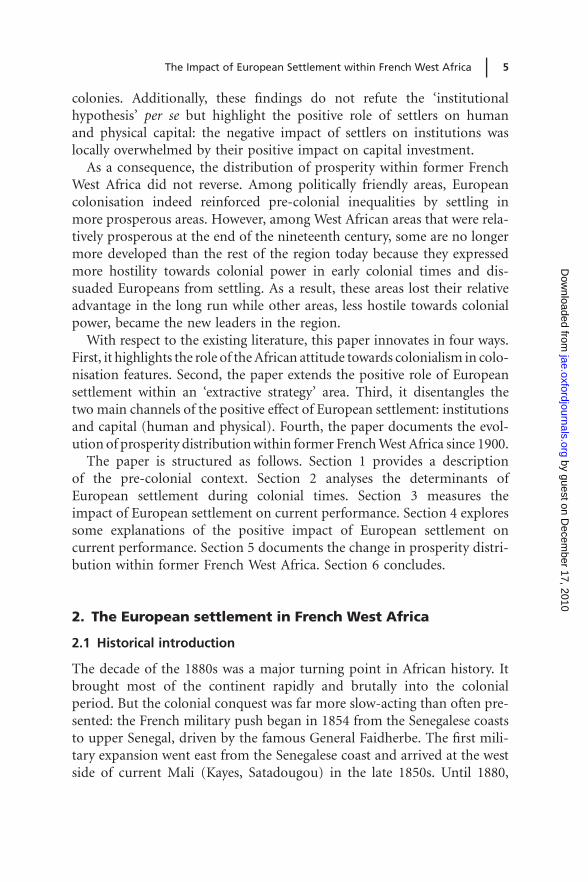
hostility: there is no significant correlation between 1906–20 hostility and1920–40/1940–56 hostility once Casamance is controlled for. Early hosti-lity is therefore unlikely to impact current outcomes (current conflicts,governance and indigenous politics) since it did not even impact hostilityin the consecutive periods. Figure 5 plots 1906–20, 1920–40 and 1940–56hostility to give evidence of the quasi-independence of hostility over time.Conditional to observable characteristics that capture main pre-colonialdifferences, early hostility towards colonial power seems somehow
Figure 5: Hostility over Three Consecutive Periods
30 | Elise Huillery
by guest on Decem
ber 17, 2010jae.oxfordjournals.org
Dow
nloaded from

accidental and constitutes an exogenous source of variation in Europeansettlement.First-stage estimates are presented in Table 2 column (5). The partial R2
associated with this instrumentation strategy is 0.28 (the F-statistic onexcluded instruments in the first-stage regression is 11.52), thus avoidingproblems caused by the use of weakly correlated instruments. Table 6reports IV estimates of the impact of European settlement on current per-formance. Table 6 also reports spatial autocorrelation index (Moran’s I) forpredicted residuals to check that the estimates obtained from IV estimatorare not overly precise.20 As a matter of fact, residuals are not spatially cor-related since Moran’s I are small and almost insignificant. Instrumentalvariable point estimates are of the same size but less significant thanOLS point estimates: out of nine outcomes, three are no longer signifi-cantly correlated with 1925 European settlement. But the general picturethat emerges from this analysis still holds: colonised areas that receivedmore European settlers have performed better historically than colonisedareas that received less Europeans settlers. For instance, for one additionalEuropean per 1,000 inhabitants in 1925, the current proportion of house-holds connected to electricity goes up by 1.4 (having access to private waterby 1.6) percentage points. These results do not mean that colonisation,per se, was a positive experience since I do not compare colonised versusnon-colonised areas, but colonised areas with many Europeans performedbetter in the long run than colonised areas with few Europeans.
4.4 An overall change in the distribution of prosperity over the twen-
tieth century?
The final question that I want to examine is whether the colonial experi-ence created a reversal of fortune within former French West Africa, asAcemoglu et al. (2002) observe at the worldwide level: most prosperouspre-colonial areas in 1500 became the least prosperous in 2000. To testthis reversal of fortune, I use the straightforward strategy used inAcemoglu et al. (2002): I compare district development performanceaccording to pre-colonial economic prosperity by running OLS regressionsof the form:
Yi = a + Pig + Sim + Xil + Cis + 1i, (5)
20 Spatial autocorrelation would overestimate precision because, since events tend to be
concentrated, there are actually fewer number of independent observations than are
being assumed.
The Impact of European Settlement within French West Africa | 31
by guest on Decem
ber 17, 2010jae.oxfordjournals.org
Dow
nloaded from

Table 6: The Impact of European Settlement on Current Outcomes: IV Estimates
Independent variablesa Dependent variable: district performance rate (in percentage points) with respect to
Literacy (1) Primary
school
(2)
Secondary
School
(3)
Water (4) Electricity
(5)
Modern
combustible
(6)
Wall
solidity (7)
Roof
solidity (8)
Stunting
(9)
Europeans per 1,000 inhabi-
tants in 1925
0.38+
(0.26)
0.15
(0.23)
0.40***
(0.15)
1.62***
(0.36)
1.38***
(0.34)
0.63
(0.46)
1.29***
(0.47)
0.41**
(0.19)
22.48
(2.67)
R2 0.80 0.71 0.66 0.61 0.73 0.83 0.68 0.69 0.35
Number of observations 109 109 109 109 109 109 109 109 89
Included instruments Initial economic prosperity: population density in 1910, desert-edge dummy
Initial political development: kingdom dummy, amorphous area dummy
Geography: average annual precipitations over 1915–75, altitude, latitude, longitude, river dummy and coast dummy
Excluded
instruments
Hostility (H3), H3* population density in 1910, H3
* desert-edge dummy
Test for spatial autocorrelation of residuals
Moran’s Ib (1) (2) (3) (4) (5) (6) (7) (8) (9)
Distance [0,1] 0.18
(0.16)
20.16
(0.28)
20.23
(0.12)
20.06
(0.73)
20.14
(0.36)
20.06
(0.71)
20.20
(0.18)
20.12
(0.43)
20.17
(0.33)
Distance [1,2] 0.003
(0.87)
20.02
(0.91)
0.06
(0.38)
0.08
(0.21)
0.16**
(0.03)
0.05
(0.48)
0.03
(0.62)
0.06
(0.36)
20.11
(0.20)
Distance [2,3] 20.12*
(0.1)
20.03
(0.77)
20.05
(0.50)
20.13**
(0.05)
20.11
(0.13)
20.03
(0.79)
20.00
(0.93)
20.13*
(0.06)
0.06
(0.26)
Distance [3,4] 20.06
(0.48)
20.12*
(0.07)
20.09
(0.18)
20.03
(0.78)
20.09
(0.18)
20.00
(0.90)
20.08
(0.23)
20.04
(0.62)
20.08
(0.32)
aStandard error values are in parentheses. ***Significant at the 1% level; **5% level; *10% level; +15% level.
Each cell represents the coefficient from a 2SLS regression of the dependent variable on the independent variable.
Instrumented variable is the number of Europeans per 1,000 inhabitants in 1925.bTwo-tailed P-values are based on the null hypothesis that Moran’s I is 0 in parentheses. ***Significant at the 1% level; **5% level; *10% level.
32|
Elise
Huille
ry
by guest on December 17, 2010 jae.oxfordjournals.org Downloaded from

where Yi is an outcome variable in district i, Pi a set of proxies for initialeconomic prosperity in district i, Si a set of proxies for initial politicalstatus of district i, Xi a set of geographical control variables and Ci a setof country-fixed effects. My coefficient of interest is g, which representsthe correlation between from before colonial rule and current economicperformance. Table 7 reports the results. Coefficients on initial economicprosperity are all positive or neutral. The relationship between pre-colonialand current economic performance is therefore positive but not verystrong. But the general pattern is not a reversal of fortune. The colonialexperience rather altered the distribution of prosperity within formerFrench West Africa than actually reverse it. This positive or neutralrelationship between pre-colonial and current economic performanceindeed reflects the fact that some of the richest pre-colonial areas are nolonger richer than the others, but they are not less rich. Other less prosper-ous areas before colonial times may have been favoured by colonial powerand therefore caught up with the most prosperous. This result is also con-sistent with the mechanism driving European settlement. As predicted byAcemoglu et al. (2002), Europeans preferred prosperous areas in WestAfrica because the profitability of extraction was higher in prosperousareas than in poor ones. With respect to this factor, Europeans thustended to reinforce pre-colonial inequalities by settling in prosperousareas. Yet on the other hand, hostility towards colonial power was moresevere in prosperous areas, which dissuaded Europeans from settling.These two mechanisms tended to compensate for one another and there-fore did not completely reverse the distribution of prosperity. One mightwant to think of pairs of districts that illustrate this specific long-termimpact of French colonisation in West Africa. The most spectacularexample is Porto-Novo versus Cotonou. From before colonial rule,Porto-Novo was a very prosperous area: one of the most densely populatedareas out of West Africa. A powerful kingdom was controlling the southernpart of current Benin (not a very expanded kingdom though). BecauseKing Behanzin was particularly hostile towards French colonisers (even ifhis predecessor Glele was much more docile and had signed friendshiptreaty), the French administration and private investors preferred thenearby district of Cotonou to settle. Cotonou grew rapidly and becamethe first economic place in Benin. Many other pairs of districts hadsimilar stories: Niamey overtook Dosso, Thies overtook Tivaouane,Abidjan overtook Assinie, Bamako overtook Mopti, Ouagadougou over-took Bobo-Dioulasso, etc.
The Impact of European Settlement within French West Africa | 33
by guest on Decem
ber 17, 2010jae.oxfordjournals.org
Dow
nloaded from
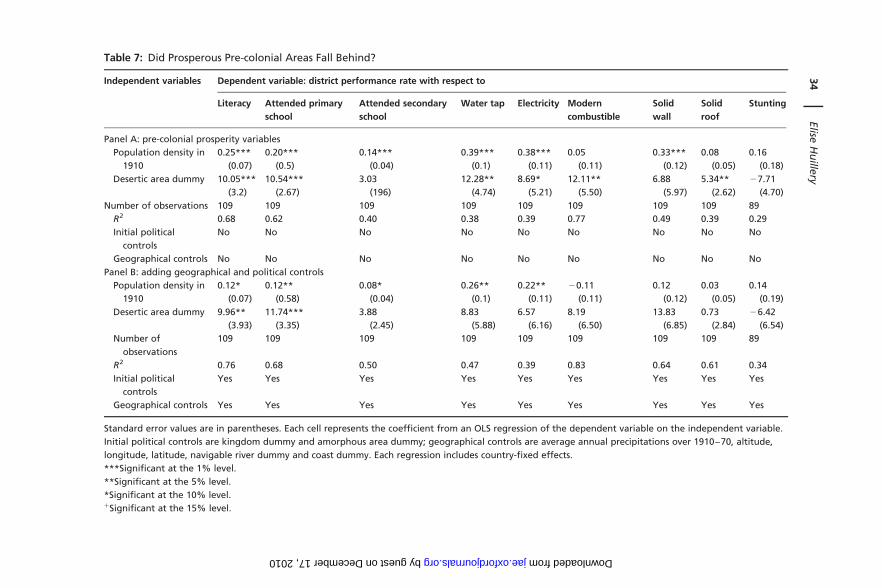
Table 7: Did Prosperous Pre-colonial Areas Fall Behind?
Independent variables Dependent variable: district performance rate with respect to
Literacy Attended primary
school
Attended secondary
school
Water tap Electricity Modern
combustible
Solid
wall
Solid
roof
Stunting
Panel A: pre-colonial prosperity variables
Population density in
1910
0.25***
(0.07)
0.20***
(0.5)
0.14***
(0.04)
0.39***
(0.1)
0.38***
(0.11)
0.05
(0.11)
0.33***
(0.12)
0.08
(0.05)
0.16
(0.18)
Desertic area dummy 10.05***
(3.2)
10.54***
(2.67)
3.03
(196)
12.28**
(4.74)
8.69*
(5.21)
12.11**
(5.50)
6.88
(5.97)
5.34**
(2.62)
27.71
(4.70)
Number of observations 109 109 109 109 109 109 109 109 89
R2 0.68 0.62 0.40 0.38 0.39 0.77 0.49 0.39 0.29
Initial political
controls
No No No No No No No No No
Geographical controls No No No No No No No No No
Panel B: adding geographical and political controls
Population density in
1910
0.12*
(0.07)
0.12**
(0.58)
0.08*
(0.04)
0.26**
(0.1)
0.22**
(0.11)
20.11
(0.11)
0.12
(0.12)
0.03
(0.05)
0.14
(0.19)
Desertic area dummy 9.96**
(3.93)
11.74***
(3.35)
3.88
(2.45)
8.83
(5.88)
6.57
(6.16)
8.19
(6.50)
13.83
(6.85)
0.73
(2.84)
26.42
(6.54)
Number of
observations
109 109 109 109 109 109 109 109 89
R2 0.76 0.68 0.50 0.47 0.39 0.83 0.64 0.61 0.34
Initial political
controls
Yes Yes Yes Yes Yes Yes Yes Yes Yes
Geographical controls Yes Yes Yes Yes Yes Yes Yes Yes Yes
Standard error values are in parentheses. Each cell represents the coefficient from an OLS regression of the dependent variable on the independent variable.
Initial political controls are kingdom dummy and amorphous area dummy; geographical controls are average annual precipitations over 1910–70, altitude,
longitude, latitude, navigable river dummy and coast dummy. Each regression includes country-fixed effects.
***Significant at the 1% level.
**Significant at the 5% level.
*Significant at the 10% level.+Significant at the 15% level.
34|
Elise
Huille
ry
by guest on December 17, 2010 jae.oxfordjournals.org Downloaded from
5. Why did European settlement play a positive role?
5.1 Potential institutional channels
The positive impact of European settlement in the former colonies hasalready been explored, especially in Acemoglu et al. (2001). In thispaper, the authors show that the relationship between European settlementand current performance works through the quality of the institutionsbrought by Europeans. Europeans adopted different colonisation policiesin different colonies with different associated institutions. At oneextreme, in places where the disease environment was not favourable toEuropean settlement, Europeans set up extractive institutions characterisedby little protection of private property or checks against government expro-priation. At the other extreme, in places where the disease environment wasfavourable to European settlement, Europeans migrated and created whatthe historian Alfred Crosby (1968) calls ‘neo-Europes’, primarily Australia,New Zealand, Canada and the USA. In these colonies, the settlers tried toreplicate European institutions with strong emphases on private propertyand checks against government expropriation. In regard to the way insti-tutions encourage productive activities, capital accumulation, skill acqui-sition and innovation, the extractive strategy was associated with ‘bad’institutions, whereas the settlement strategy was associated with ‘good’institutions. They use the protection against the risk of expropriationindex from Political Risk Services, and the constraint on executive indexand the democracy index from the Polity III data set as proxies for thequality of institutions.There exists no measure of the quality of institutions at the infra-
national district level. I therefore cannot test directly the validity of thispotential explanation within former French West Africa. The question isde facto slightly different within former French West Africa since theglobal colonisation policy (‘extraction’ versus ‘migration’) was hom-ogenous all over the region. In former French West Africa, Europeanspursued an extractive strategy only. Therefore, the potential variations inthe quality of institutions, if any, could not come from differences in colo-nial strategy. The question here is why European settlement had a positiveimpact on current development conditional to their extractive strategy.One might be surprised that the impact of European settlement was posi-tive given the poor nature of the institutions they implemented.Within former French West Africa, the risk of expropriation, constraint
on executives and political participation of local populations were formallydriven by the same set of rules since the legal system was uniform all over
The Impact of European Settlement within French West Africa | 35
by guest on Decem
ber 17, 2010jae.oxfordjournals.org
Dow
nloaded from

the region.21 Colonial regulations were defined by the General Governor ofthe whole French West Africa, if not by the Minister of the Colonies for thewhole French empire. The administrative organisation was remarkablyhomogenous, as were the economic and social rules. If differences inEuropean settlement created some differences in institutions, it shouldtherefore be related to the application of colonial rule, not to the colonialrules themselves. I adopt the definition of institutions as ‘sets of rules, com-pliance procedures and moral and ethical behavioural norms that constrainthe behaviour of individuals’ (North, 1981). With respect to this definition,de jure institutions within colonial French West Africa did not differ exceptfor a few exceptional towns in Senegal. But this does not prevent de factovariation. For instance, African people living close to many European set-tlers could take a greater advantage of the new legal code than people livingin sparsely settled areas, where customary law was more likely to competewith colonial rule. Aldashev et al. (2007) show examples of situationswhere formal and informal laws are seen as conflicting with each other.The general picture that emerges from the literature is that legal pluralismtends to produce neutral or negative effects. I consciously leave aside thisquestion because I cannot give any empirical evidence of such differences.I can only argue that the positive impact of European settlement withinformer French West Africa did not run through the quality of formal insti-tutions, and that the bad nature of institutions brought by colonisers giveslittle support to an institutional explanation of the positive role ofEuropean settlers on current outcomes.
5.2 The role of private and public investments
Another potential explanation on why European settlement had a positiveimpact on current performances is that Europeans increased investments inareas where they were lived, simply because Europeans were themselvesadministrators, businessmen or missionaries and had the capital formajor investments that African people lacked. The mechanism runningbehind the previous findings could therefore be far more direct than theone stressed by the broad literature on institutions: the key determinantof the positive impact of European settlement could be the investmentsthemselves rather than the ‘incentives’ to invest created by a more
21 Except the four ‘communes’ (Saint-Louis, Dakar, Rufisque and Goree), whose inhabi-
tants were French citizens. Some fiscal rules were also different in these cities. Three
of them are excluded from my empirical study (Goree, Dakar, Dakar and Saint-Louis).
36 | Elise Huillery
by guest on Decem
ber 17, 2010jae.oxfordjournals.org
Dow
nloaded from

favourable institutional environment. On the private side, Europeansinvested in resource extraction (peanuts, vegetable oils, wood, cotton,leather, cocoa, coffee, minerals). Private investors were likely to introducenew crops and new techniques to increase total yields that could be chan-nelled into exports. On the public side, Europeans invested in public goodssuch as education (building schools and paying teachers), health (buildinghospitals and dispensaries and paying doctors and nurses) and infrastruc-ture (roads, wells, bridges, harbours, railways, air transport). Note that allpublic expenses were financed by local tax revenue and not by Europeantaxpayers. These investments created new job opportunities for localpeople, some improvements in agricultural productivity and a greateraccess to human capital formation, which could be the key reason whyregions with numerous Europeans settlers grew faster than regions withfew settlers.Unfortunately, I have no district-level data on private investments,
neither during the colonial era nor today. The only empirical evidence Ican bring is on public investments: I collected district-level data on colonialpublic investments in education, health and infrastructures from annualcolonial budgets22 so I can test whether differences in European presencewithin French West Africa are correlated with differences in access topublic goods. For further details on data on colonial public investments,I refer to Huillery (2009). The question is whether European settlerstended to favour colonial public investments and whether this relationshipexplains the positive impact of European settlers on current performance.Figures 6 and 7 show the correlation between the number of European
settlers in 1925 per 1,000 inhabitants and colonial public investments inteachers and doctors23 over 1930–39. The correlation is significant andpositive, which could be interpreted as the fact that European settlersencouraged public investments. An alternative explanation that is just asplausible is that Europeans had incentives to settle in areas with high colo-nial public investment. This potential reverse causation is not a crucialissue for the purpose of this paper, which is to explain why areas with ahigher concentration of European settlers in 1925 are more developedtoday, all other things being equal. Since European settlement and colonialpublic investments largely worked together, I just point out that the posi-tive influence of European settlers on current performances may reflect the
22 The annual colonial budgets are in the Archives Nationales in Dakar, Senegal.23 I do show the graph with investments in public works, which is the exact same kind of
graph.
The Impact of European Settlement within French West Africa | 37
by guest on Decem
ber 17, 2010jae.oxfordjournals.org
Dow
nloaded from

positive influence of colonial public investment. But since my motivation israther to flesh out the channels of the effect of Europeans on moderndevelopment, I test whether the coefficient on 1925 (earlier) European
Figure 6: Education Public Investments and European Settlement
Figure 7: Health Public Investments and European Settlement
38 | Elise Huillery
by guest on Decem
ber 17, 2010jae.oxfordjournals.org
Dow
nloaded from

settlers changes when introducing 1930–39 (later) investments in specifi-cation (3).
Yi = a + bEi + pIi + Pig + Sim + Xil + Cis + 1i, (6)
where Yi is an outcome variable in district i, Ei the number of Europeans indistrict i per 1,000 population in 1925, Ii the 1930–39 colonial investmentcorresponding to Yi (teachers for education, doctors for health and publicworks for access to infrastructures), Pi a set of proxies for pre-colonialeconomic prosperity in district i, Si a set of proxies for pre-colonial politi-cal status of district i, Xi a set of geographical control variables and Ci a setof country-fixed effects. My coefficients of interest are b, which representsthe impact of European settlement, and p, which represents the impact ofcolonial public investment, net of both their mutual correlation and theircorrelation with pre-colonial economic prosperity, political status andgeography.Table 8 shows that colonial public investments partly explain the positive
relationship between European settlement and current performance, butthey do capture a maximum of half of the whole effect of European settle-ment. The size of most coefficients on European settlement decreases,showing that previous estimates of European settlement partly capturedthe effect of colonial public investment, but most of the positive effect ofEuropean settlers on current outcomes remains unexplained. A keyhypothesis that remains the most plausible is the private investmenthypothesis, on which I cannot give any evidence at this stage.
6. Conclusion
Many economists and social scientists believe that differences in colonialexperiences are at the root of large differences in current outcomesacross countries. This paper explores the impact of the colonial experiencewithin a more homogenous area so as to bring a better understanding ofunderlying mechanisms. The main results of this paper are as follows.(1) European settlers preferred prosperous areas within West Africa,which is consistent with the Acemoglu et al. (2002) premise since thegeneral colonial policy was ‘extraction’. Europeans thus tended to reinforcepre-colonial inequalities by settling in prosperous areas. (2) This preferencetowards prosperous areas was discouraged by hostility towards colonialpower. Hostility actually dissuaded Europeans from settling and the conse-quence is that areas which were both rich and hostile received lessEuropean settlers than rich and non-hostile areas. When hostility was
The Impact of European Settlement within French West Africa | 39
by guest on Decem
ber 17, 2010jae.oxfordjournals.org
Dow
nloaded from

Table 8: Do Colonial Public Investments Explain the Positive Influence of European Settlement?
Independent variables Dependent variable: district performance rate with respect to
Literacy
(1)
Primary
school
(2)
Secondary
school
(3)
Water
(4)
Electricity
(5)
Modern com-
bustible
(6)
Wall
solidity
(7)
Roof
solidity
(8)
Stunting
(9)
Teachers per 100,000
inhabitants over
1930–39
20.00
(0.06)
0.11**
(0.05)
0.07**
(0.03)
Doctors per 100,000
inhabitants over
1930–39
20.09
(0.21)
Public works per square
kilometre over 1930–
39
0.23***
(0.07)
0.04
(0.07)
20.09
(0.10)
0.16*
(0.09)
0.18***
(0.03)
Europeans per 1,000
inhabitants in 1925
0.71***
(0.22)
0.36**
(0.18)
0.39***
(0.12)
0.59**
(0.29)
1.46***
(0.29)
0.84**
(0.39)
0.51
(0.40)
1.02***
(0.30)
20.42
(1.83)
Number of observations 109 109 109 109 109 109 109 109 89
R2 0.81 0.77 0.69 0.66 0.73 0.84 0.69 0.76 0.31
Pre-colonial prosperity controls
Pre-colonial political
statuses
Yes Yes Yes Yes Yes Yes No Yes Yes
Geographical controls Yes Yes Yes Yes Yes Yes No Yes Yes
Standard error values are in parentheses. Each cell represents the coefficient from an OLS regression of the dependent variable on the
independent variable. Pre-colonial prosperity controls are population density in 1910, desert-edge dummy, former trade counter dummy;
pre-colonial political statuses are kingdoms and amorphous areas; geographical controls are average annual precipitations over 1910–70,
altitude, longitude, latitude, navigable river dummy and coast dummy. Each regression includes country-fixed effects.
***Significant at the 1% level.
**Significant at the 5% level.
*Significant at the 10% level.+Significant at the 15% level.
40|
Elise
Huille
ry
by guest on December 17, 2010 jae.oxfordjournals.org Downloaded from

severe in a prosperous area, Europeans preferred to settle in a calm neigh-bouring area even if it was less prosperous. (3) Colonised and highly settledareas had faster development paths than colonised and poorly settled areas.The impact of European settlement was thus positive even in an ‘extractive’colonisation context, working partly through colonial public investments:the more Europeans settlers, the more colonial investments in education,health and infrastructure. (4) The distribution of prosperity withinformer French West Africa did not reverse. Yet hostile and initially richareas lost part of their pre-colonial advantage. Some calmer areas caughtup with them and sometimes overtook them. Differences in hostilitytowards colonial power thus explain why certain changes in the prosperitydistribution occurred within former French West Africa. It sheds light onthe emergence of new dynamic areas like Cotonou, Niamey, Bassam,Abidjan, Dakar, Conakry, Port-Etienne, Bamako, Thies or Kaolack, andthe relative decline of some of the most dynamic, pre-colonial areas likePorto-Novo, Abomey, Fuuta-Djalo, Kankan, Agadez, Timbuktu,Casamance, Waalo, Fuuta Toro, Macina or Hausa land.
Acknowledgements
I am grateful to Denis Cogneau and Thomas Piketty for their valuable gui-dance. Alexander Moradi, Jose de Sousa and seminar participants at DIAL,Paris School of Economics, Nuffield College and the CSAE conference pro-vided very helpful comments. Historical data used in this paper have beencollected by the author within the research project ‘Long Term History andResources Distribution in Africa’ directed by Denis Cogneau (IRD, DIAL,Paris). Financial support from the French Ministery of Research is grate-fully acknowledged. Martine Lorenzo, Angelique Roblin, Xavier Midonand Angelina De Baecque have provided excellent research assistance forarchive extraction.
The Impact of European Settlement within French West Africa | 41
by guest on Decem
ber 17, 2010jae.oxfordjournals.org
Dow
nloaded from
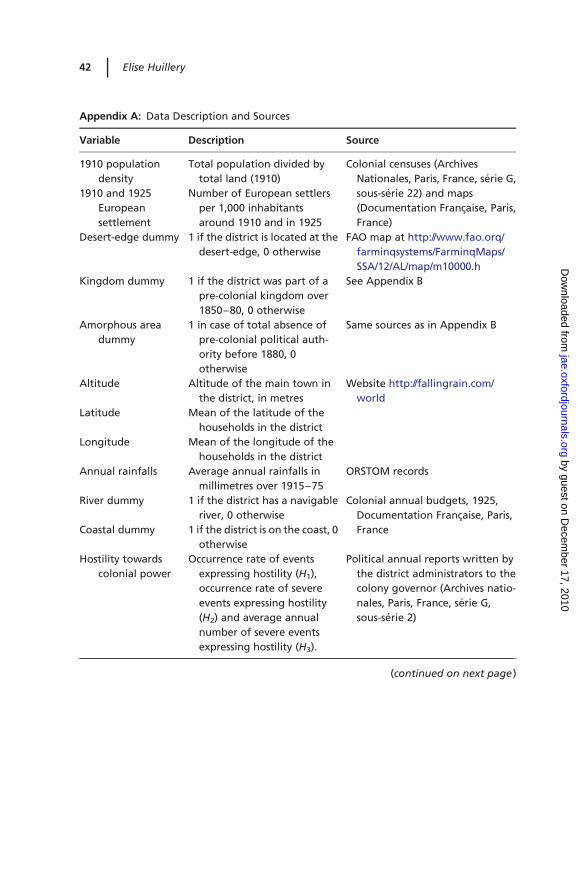
Appendix A: Data Description and Sources
Variable Description Source
1910 population
density
Total population divided by
total land (1910)
Colonial censuses (Archives
Nationales, Paris, France, serie G,
sous-serie 22) and maps
(Documentation Francaise, Paris,
France)
1910 and 1925
European
settlement
Number of European settlers
per 1,000 inhabitants
around 1910 and in 1925
Desert-edge dummy 1 if the district is located at the
desert-edge, 0 otherwise
FAO map at http://www.fao.orq/
farminqsystems/FarminqMaps/
SSA/12/AL/map/m10000.h
Kingdom dummy 1 if the district was part of a
pre-colonial kingdom over
1850–80, 0 otherwise
See Appendix B
Amorphous area
dummy
1 in case of total absence of
pre-colonial political auth-
ority before 1880, 0
otherwise
Same sources as in Appendix B
Altitude Altitude of the main town in
the district, in metres
Website http://fallingrain.com/
world
Latitude Mean of the latitude of the
households in the district
Longitude Mean of the longitude of the
households in the district
Annual rainfalls Average annual rainfalls in
millimetres over 1915–75
ORSTOM records
River dummy 1 if the district has a navigable
river, 0 otherwise
Colonial annual budgets, 1925,
Documentation Francaise, Paris,
FranceCoastal dummy 1 if the district is on the coast, 0
otherwise
Hostility towards
colonial power
Occurrence rate of events
expressing hostility (H1),
occurrence rate of severe
events expressing hostility
(H2) and average annual
number of severe events
expressing hostility (H3).
Political annual reports written by
the district administrators to the
colony governor (Archives natio-
nales, Paris, France, serie G,
sous-serie 2)
(continued on next page)
42 | Elise Huillery
by guest on Decem
ber 17, 2010jae.oxfordjournals.org
Dow
nloaded from

Appendix A: Continued
Variable Description Source
Colonial public
investments in
education
Average annual number of
teachers paid on public
budget over 1930–39
Colonial annual budgets, Archives
du Senegal, Fonds AOF
Colonial public
investments in
health
Average annual number of
doctors paid on public bud-
get over 1930–39
Colonial public
investments in
infrastructure
Average annual expenses in
public works paid on public
budget over 1930–39
Literacy rate Percentage of more than
15-year-old literate
individuals
EPCV (1998) for Upper Volta, ESAM
II (2000) for Senegal, EIBC (1994)
for Guinea, EPCES (1995) for
Niger, EMCES (1994) for Mali,
EPDS (1993) for Ivory Coast, EPCV
(1995) for Mauritania and QUIBB
(2002) for Benin
Primary school
attendance rate
Percentage of people 7 years
old and above who have
attended primary school for
at least 1 year
Secondary school
attendance rate
Percentage of people 13 years
old and above who have
attended secondary school
for at least 1 year
Access to a private
water tap
Percentage of households
having access to private
water
Connected to
electricity
Percentage of households
connected to electricity
Using a modern
combustible
Percentage of households
using a modern fuel (gas or
electricity)
Wall solidity Percentage of households liv-
ing in a house with solid
walls (cement or hard bricks)
Roof solidity Percentage of households liv-
ing in a house with a solid
roof (cement or tiles)
Stunting rate Percentage of children less
than 5 years old suffering
from stunting
The Impact of European Settlement within French West Africa | 43
by guest on Decem
ber 17, 2010jae.oxfordjournals.org
Dow
nloaded from

Appendix B: Data on Pre-colonial Kingdoms
District Related pre-colonial
kingdomDescription
Source
Bondoukou Abron Coquery-Vidrovitch and Moniot (1993);
Ki-Zerbo (1978)
Porto-Novo Adjatche Coquery-Vidrovitch and Moniot (1993);
Ki-Zerbo (1978); Curtin (1978)
Baol Bawol Coquery-Vidrovitch and Moniot (1993);
Ki-Zerbo (1978); Curtin (1978)
Thies Bawol Coquery-Vidrovitch and Moniot (1993);
Ki-Zerbo (1978); Curtin (1978)
Borgou Borgu Bouche (1991); Ki-Zerbo (1978); Curtin
(1978)
Hautegambie Bundu Coquery-Vidrovitch and Moniot (1993);
Curtin (1978)
Abomey Dahomey Bouche (1991); Coquery-Vidrovitch and
Moniot (1993); Ki-Zerbo (1978); Curtin
(1978)
Allada Dahomey Bouche (1991); Coquery-Vidrovitch and
Moniot (1993); Ki-Zerbo (1978); Curtin
(1978)
Ouidah Dahomey Bouche (1991); Coquery-Vidrovitch and
Moniot (1993); Ki-Zerbo (1978); Curtin
(1978)
Adrar Emirate of Adrar Coquery-Vidrovitch and Moniot (1993);
Ki-Zerbo (1978); Curtin (1978)
Brakna Emirate of Brakna Coquery-Vidrovitch and Moniot (1993);
Ki-Zerbo (1978); Curtin (1978)
Tagant Emirate of Tagant Coquery-Vidrovitch and Moniot (1993);
Ki-Zerbo (1978); Curtin (1978)
Trarza Emirate of Trarza Coquery-Vidrovitch and Moniot (1993);
Ki-Zerbo (1978); Curtin (1978)
Kindia Fuuta Jaalo Bouche (1991); Coquery-Vidrovitch and
Moniot (1993); Ki-Zerbo (1978); Curtin
(1978)
Koumbia Fuuta Jaalo Bouche (1991); Coquery-Vidrovitch and
Moniot (1993); Ki-Zerbo (1978); Curtin
(1978)
Labe Fuuta Jaalo Bouche (1991); Coquery-Vidrovitch and
Moniot (1993); Ki-Zerbo (1978); Curtin
(1978)
Mamou Fuuta Jaalo Bouche (1991); Coquery-Vidrovitch and
Moniot (1993); Ki-Zerbo (1978); Curtin
(1978)
(continued on next page)
44 | Elise Huillery
by guest on Decem
ber 17, 2010jae.oxfordjournals.org
Dow
nloaded from

Appendix B: Continued
District Related pre-colonial
kingdomDescription
Source
Pita Fuuta Jaalo Bouche (1991); Coquery-Vidrovitch and
Moniot (1993); Ki-Zerbo (1978); Curtin
(1978)
Matam Fuuta Toro Coquery-Vidrovitch and Moniot (1993);
Ki-Zerbo (1978); Curtin (1978)
Podor Fuuta Toro Coquery-Vidrovitch and Moniot (1993);
Ki-Zerbo (1978); Curtin (1978)
Bobodioulasso Gwiriko Ki-Zerbo (1978)
Louga Jolof Coquery-Vidrovitch and Moniot (1993);
Ki-Zerbo (1978); Curtin (1978)
Nara Kaarta Coquery-Vidrovitch and Moniot (1993);
Ki-Zerbo (1978); Curtin (1978)
Nioro Kaarta Coquery-Vidrovitch and Moniot (1993);
Ki-Zerbo (1978); Curtin (1978)
Tivaouane Kajoor Coquery-Vidrovitch and Moniot (1993);
Ki-Zerbo (1978); Curtin (1978)
Goure Kanem-Bornu Bouche (1991); Coquery-Vidrovitch and
Moniot (1993); Ki-Zerbo (1978); Curtin
(1978)
NGuigmi Kanem-Bornu Bouche (1991); Coquery-Vidrovitch and
Moniot (1993); Ki-Zerbo (1978); Curtin
(1978)
Sikasso Kenedugu Coquery-Vidrovitch and Moniot (1993);
Ki-Zerbo (1978)
Kong Kong Coquery-Vidrovitch and Moniot (1993);
Ki-Zerbo (1978); Curtin (1978)
Dori Liptako Ki-Zerbo (1978); Curtin (1978)
Fada Liptako Ki-Zerbo (1978); Curtin (1978)
Bandiagara Macina Coquery-Vidrovitch and Moniot (1993);
Ki-Zerbo (1978); Curtin (1978)
Gourma Macina Coquery-Vidrovitch and Moniot (1993);
Ki-Zerbo (1978); Curtin (1978)
Mopti Macina Coquery-Vidrovitch and Moniot (1993);
Ki-Zerbo (1978); Curtin (1978)
Kankan Samori Coquery-Vidrovitch and Moniot (1993);
Ki-Zerbo (1978); Curtin (1978)
Kissidougou Samori Coquery-Vidrovitch and Moniot (1993);
Ki-Zerbo (1978); Curtin (1978)
Kouroussa Samori Coquery-Vidrovitch and Moniot (1993);
Ki-Zerbo (1978); Curtin (1978)
Assinie Sanwi Ki-Zerbo (1978)
(continued on next page)
The Impact of European Settlement within French West Africa | 45
by guest on Decem
ber 17, 2010jae.oxfordjournals.org
Dow
nloaded from
Appendix B: Continued
District Related pre-colonial
kingdomDescription
Source
Macina Segu Coquery-Vidrovitch and Moniot (1993);
Ki-Zerbo (1978); Curtin (1978)
Segou Segu Coquery-Vidrovitch and Moniot (1993);
Ki-Zerbo (1978); Curtin (1978)
Sinesaloum Siin Salum Coquery-Vidrovitch and Moniot (1993);
Ki-Zerbo (1978); Curtin (1978)
Dosso Sokoto Bouche (1991); Coquery-Vidrovitch and
Moniot (1993); Ki-Zerbo (1978); Curtin
(1978)
Konny Sokoto Bouche (1991); Coquery-Vidrovitch and
Moniot (1993); Ki-Zerbo (1978); Curtin
(1978)
Tessaoua Sokoto Bouche (1991); Coquery-Vidrovitch and
Moniot (1993); Ki-Zerbo (1978); Curtin
(1978)
Zinder Sokoto Bouche (1991); Coquery-Vidrovitch and
Moniot (1993); Ki-Zerbo (1978); Curtin
(1978)
Tenkodogo Tenkodogo Coquery-Vidrovitch and Moniot (1993);
Ki-Zerbo (1978); Curtin (1978)
Dagana Waalo Coquery-Vidrovitch and Moniot (1993);
Ki-Zerbo (1978); Curtin (1978)
Kaya Wagadugu Bouche (1991); Coquery-Vidrovitch and
Moniot (1993); Ki-Zerbo (1978); Curtin
(1978)
Koudougou Wagadugu Bouche (1991); Coquery-Vidrovitch and
Moniot (1993); Ki-Zerbo (1978); Curtin
(1978)
Ouagadougou Wagadugu Bouche (1991); Coquery-Vidrovitch and
Moniot (1993); Ki-Zerbo (1978); Curtin
(1978)
Ouahigouya Yatenga Coquery-Vidrovitch and Moniot (1993);
Ki-Zerbo (1978); Curtin (1978)
Appendix C: Why Not Using Settlers’ Mortality as an
Instrument
Acemoglu et al. (2001, 2002) use European settler mortality as an exogen-ous source of variation of European settlement. To use the same instru-ment, I need settler mortality rates at the district level. I have therefore
46 | Elise Huillery
by guest on Decem
ber 17, 2010jae.oxfordjournals.org
Dow
nloaded from
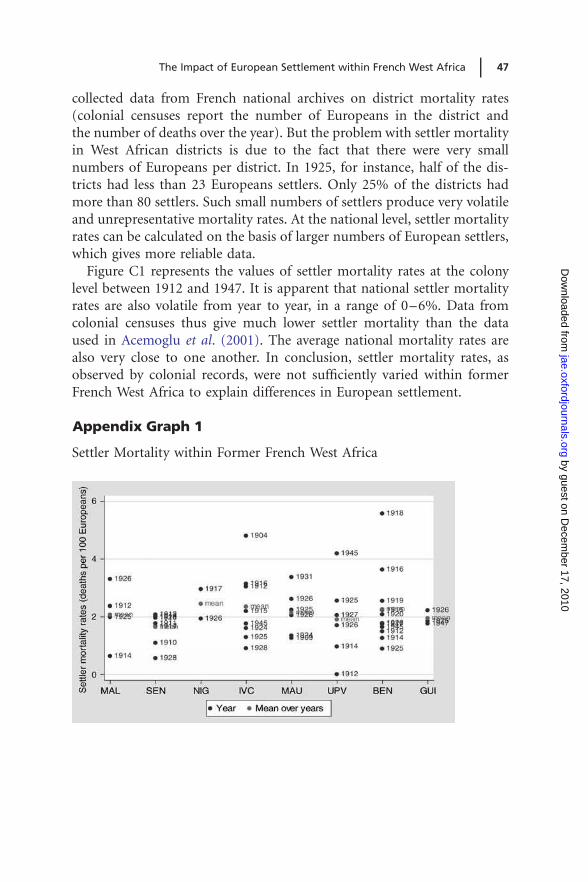
collected data from French national archives on district mortality rates(colonial censuses report the number of Europeans in the district andthe number of deaths over the year). But the problem with settler mortalityin West African districts is due to the fact that there were very smallnumbers of Europeans per district. In 1925, for instance, half of the dis-tricts had less than 23 Europeans settlers. Only 25% of the districts hadmore than 80 settlers. Such small numbers of settlers produce very volatileand unrepresentative mortality rates. At the national level, settler mortalityrates can be calculated on the basis of larger numbers of European settlers,which gives more reliable data.Figure C1 represents the values of settler mortality rates at the colony
level between 1912 and 1947. It is apparent that national settler mortalityrates are also volatile from year to year, in a range of 0–6%. Data fromcolonial censuses thus give much lower settler mortality than the dataused in Acemoglu et al. (2001). The average national mortality rates arealso very close to one another. In conclusion, settler mortality rates, asobserved by colonial records, were not sufficiently varied within formerFrench West Africa to explain differences in European settlement.
Appendix Graph 1
Settler Mortality within Former French West Africa
The Impact of European Settlement within French West Africa | 47
by guest on Decem
ber 17, 2010jae.oxfordjournals.org
Dow
nloaded from

References
Acemoglu, D., S. Johnson and J.A. Robinson (2001) ‘The Colonial Origins of
Comparative Development: An Empirical Investigation’, American Economic
Review, 91 (5): 1369–01.
Acemoglu, D., S. Johnson and J.A. Robinson (2002) ‘Reversal of Fortune:
Geography and Institutions in the Making of the Modern World Income
Distribution’, Quarterly Journal of Economics, 117: 1231–94.
Aldashev, G., I. Chaara, J.-P. Platteau and Z. Wahhaj (2007) The Custom in the
Shadow of the Formal Law: An Economic Analysis, Working Paper, CRED,
University of Namur.
Bairoch, P. (1988) ‘Cities and Economic Development: From the Dawn of History
to the Present’, Translated by Christopher Braider. Chicago: University of
Chicago Press.
Banerjee, A. and L. Iyer (2005) ‘History, Institutions and Economic Performance:
The Legacy of Colonial Tenure Systems in India’, American Economic Review, 95
(4): 1190–13.
Banerjee, A., L. Iyer and R. Somanathan (2008) ‘Public Action for Public Goods’,
Handbook of Development Economics, Elsevier.
Bouche, D. (1991) Histoire de la colonisation francaise. Paris: Fayard.
Cohen, W.B. (1974) Empereurs sans sceptre, histoire des administrateurs de la France
d’Outre-mer et de l’Ecole coloniale. Paris: Berger-Levrault.
Coquery-Vidrovitch, C. (1973) A propos des investissements francais outre-mer:
l’exemple de l’Ouest Africain, 1910–1965, Actes du IIe Congres des historiens
economistes francais, La position internationale de la France. Paris: EHESS,
p. 426.
Coquery-Vidrovitch, C. and H. Moniot (1993) L’Afrique Noire de 1800 a nos jours.
Paris: PUF.
Davis, L.E. and R.A. Huttenback (1987) Mammon and the Pursuit of Empire: The
Political Economy of British Imperialism, 1860–1912. Cambridge: Cambridge
University Press.
Englebert, P. (2000) ‘Pre-colonial Institutions, Post-colonial States and Economic
Development in Tropical Africa’, Political Research Quaterly, 53: 1–30.
Feyrer, J. and B. Sacerdote (2009) ‘Colonialism and Modern Income – Islands as
Natural Experiments’, Review of Economics and Statistics, 91 (2): 245–62.
Gennaioli, N. and I. Rainer (2007) ‘The Modern Impact of Precolonial
Centralization in Africa’, Journal of Economic Growth, 12 (3): 185–234.
Glaeser, E.L., R. La Porta, F. Lopez-de-Silane and A. Shleifer (2004) Do Institutions
Cause Growth?, NBER Working Paper No. 10568.
Huillery, E. (2009) ‘History Matters: The Long Term Impact of Colonial Public
Investments in French West Africa’, American Economic Journal: Applied
Economics, 1 (2): 176–215.
48 | Elise Huillery
by guest on Decem
ber 17, 2010jae.oxfordjournals.org
Dow
nloaded from
Iyer, L. (2005) The Long-term Impact of Colonial Rule: Evidence from India,Harvard Business School Working Paper No. 05–041, Harvard University.
Ki-Zerbo, J. (1978) Histoire de l’Afrique Noire, d’Hier a Demain. Paris: Hatier.
Malthus, T. (1798) An Essay on the Principle of Population, as It Affects the Future
Improvement of Society with Remarks on the Speculations of Mr. Godwin,
M. Condorcet, and Other Writers. London: J. Johnson.
Marseille, J. (1973) La politique metropolitaine d’investissements coloniaux dans
l’entre-deux guerres, Actes du IIe Congres des historiens economistes francais,
La position internationale de la France. Paris: EHESS.
McEvedy, C. and R. Jones (1975) Atlas of World Population History. New York:Facts on File.
Mitchell, R., D. Morrison and J. Paden (1989) Black Africa: A Comparative
Handbook. New York: Paragon House.Murdock, G. (1967) Ethnographic Atlas. Pittsburgh: University of Pittsburgh Press.
North, D.C. (1981) Structure and Change in Economic History. New York: W.W.
Norton.Nunn, N. (2008) ‘The Long Term Effects of Africa’s Slave Trades’, Quarterly Journal
of Economics, 23 (1): 139–176.
Rioux, J.-P. (2007) (sous la direction de) Dictionnaire de la France Coloniale. Paris:Flammarion.
Rohini, P. and C. Udry (2005) Institutions and Development: AView from Below.
The Proceedings of the 9th World Congress of the Econometric Society (R.Blundell and W. Newey and T. Persson eds). Cambridge: Cambridge
University Press.
Selllier, J. (2003) Atlas des Peuples d’Afrique. Paris: La Decouverte.Stevenson, R.F. (1968) Population and Political Systems in Tropical Africa. New York
and London: Columbia University Press.
The Impact of European Settlement within French West Africa | 49
by guest on Decem
ber 17, 2010jae.oxfordjournals.org
Dow
nloaded from