The impact of ethical ratings on Canadian security performance: Portfolio management and corporate...
15
The Quarterly Review of Economics and Finance 47 (2007) 40–54 The impact of ethical ratings on Canadian security performance: Portfolio management and corporate governance implications Klaus Fischer a , Nabil Khoury b,∗ a Laval University, Que., Canada b University of Quebec, Montreal, Que., Canada Received 20 January 2005; received in revised form 14 February 2006; accepted 23 February 2006 Available online 18 April 2006 Abstract One approach that is gaining in popularity among portfolio managers uses ethical ratings, published by specialized research organizations, to screen securities for portfolio selection. Portfolio managers can thus gain a better understanding of the phenomenon and adopt a better and more consistent approach to ethical investment. By the same token, board of directors can measure the impact of their ethical policies on the market performance of the stock of their company. This paper provides new evidence about the impact of ethical ratings published in Canada on the risk-adjusted returns of the securities concerned, within the framework of a multi-factor Capital Asset Pricing Model, and gives an interpretation of the results from the perspective of portfolio composition and of corporate governance. © 2006 Board of Trustees of the University of Illinois. All rights reserved. JEL classification: G11 Keywords: Ethical ratings; Security performance Ethical screening of securities for portfolio composition has received considerable attention in recent years, particularly from institutional investors and corporate managers. The major preoccupation of investors, in this regard, is their ability to achieve the same or even a better risk/return tradeoff from portfolios restricted to securities of socially responsible companies as from portfolios without such constraints. For corporate managers, the question is whether ethical ∗ Corresponding author at: 1637 Des Rocs Street, Sainte-Foy, Que., Canada G1W 3J7. Tel.: +1 514 987 3000; fax: +1 514 987 3060. E-mail address: [email protected] (N. Khoury). 1062-9769/$ – see front matter © 2006 Board of Trustees of the University of Illinois. All rights reserved. doi:10.1016/j.qref.2006.02.001
-
Upload
klaus-fischer -
Category
Documents
-
view
216 -
download
1
Transcript of The impact of ethical ratings on Canadian security performance: Portfolio management and corporate...

The Quarterly Review of Economics and Finance47 (2007) 40–54
The impact of ethical ratings on Canadian securityperformance: Portfolio management and corporate
governance implications
Klaus Fischer a, Nabil Khoury b,∗a Laval University, Que., Canada
b University of Quebec, Montreal, Que., Canada
Received 20 January 2005; received in revised form 14 February 2006; accepted 23 February 2006Available online 18 April 2006
Abstract
One approach that is gaining in popularity among portfolio managers uses ethical ratings, published byspecialized research organizations, to screen securities for portfolio selection. Portfolio managers can thusgain a better understanding of the phenomenon and adopt a better and more consistent approach to ethicalinvestment. By the same token, board of directors can measure the impact of their ethical policies on themarket performance of the stock of their company. This paper provides new evidence about the impactof ethical ratings published in Canada on the risk-adjusted returns of the securities concerned, within theframework of a multi-factor Capital Asset Pricing Model, and gives an interpretation of the results from theperspective of portfolio composition and of corporate governance.© 2006 Board of Trustees of the University of Illinois. All rights reserved.
JEL classification: G11
Keywords: Ethical ratings; Security performance
Ethical screening of securities for portfolio composition has received considerable attentionin recent years, particularly from institutional investors and corporate managers. The majorpreoccupation of investors, in this regard, is their ability to achieve the same or even a betterrisk/return tradeoff from portfolios restricted to securities of socially responsible companies asfrom portfolios without such constraints. For corporate managers, the question is whether ethical
∗ Corresponding author at: 1637 Des Rocs Street, Sainte-Foy, Que., Canada G1W 3J7. Tel.: +1 514 987 3000;fax: +1 514 987 3060.
E-mail address: [email protected] (N. Khoury).
1062-9769/$ – see front matter © 2006 Board of Trustees of the University of Illinois. All rights reserved.doi:10.1016/j.qref.2006.02.001

K. Fischer, N. Khoury / The Quarterly Review of Economics and Finance 47 (2007) 40–54 41
screening will affect the market evaluation of the securities of their companies. Either way, thisnew attention to the ethical behavior of companies can have an impact on business policiesand practices particularly as regards the choice of operating procedures, products mix, sectordiversification, and the relationship with stakeholders. It can also have an impact on the extent towhich investors may make ethical concerns a corporate governance issue in an effort to protectthe value of their investment.
Various approaches can be followed by investors in order to construct a universe of investmentopportunities on an ethical basis. One approach that is gaining in popularity among portfoliomanagers uses ethical ratings, published by specialized research organizations, to screen securitiesfor portfolio selection. These ratings are usually built around a number of criteria pertaining toethical behavior and lines of business. As more investors adopt this framework to define theiruniverse of eligible securities, it becomes important to clarify the range of criteria included inthese ratings, and to measure their impact on security risk-adjusted returns. By analyzing theinfluence of these criteria, portfolio managers can gain a better understanding of the phenomenonand adopt a better and more consistent approach to ethical investment. By the same token, boardsof directors can measure the impact of their ethical policies on the market performance of the stockof their company. As seen in this way, investors’ perceptions of ethical business behavior becomea corporate governance issue. Ignoring ethical concerns may result in discount on the price ofstock, as investors defect to firms that display higher ethical standards. While adopting strict ethicalstandards may increase operating costs, if they are priced by the market ignoring them could resultin a loss of wealth to shareholders that may exceed those costs. This could result in ethical issuesbecoming a concern for corporate governance that may be impossible to ignore by firm managersand directors without penalty, since investors concerned about their wealth are likely to increasethe pressure on directors to adopt sound ethical standards to avoid discount by the market.
So far, no study has addressed this issue in a market equilibrium framework. To be sure, anumber of event studies have examined the impact of specific ethical news or specific ethicalpolicies on security returns. For example, Gunthorpe (1997) examined whether the financial mar-kets penalize public corporations at the announcement of unethical business behavior. His studyuses a sample of 69 US corporations that were involved in some form of alleged illegal activityover the period 1988–1992. He uses the Market Model to estimate for each firm the averageand cumulative average abnormal return 5 days before and 5 days after the announcement of thealleged unethical event. His results show that public announcements of unethical behavior carrya statistically significant penalty for stock prices of the firms concerned of about 1.3% over a dayand 2.3% over a week. Klassen and McLaughlin (1996) also used the Market Model approachand found a significant relationship between positive and negative environmental event announce-ments affecting companies and abnormal returns for their stocks. Their study covers a sampleof 96 publicly traded US firms for which a positive public announcement was made in regard tostrong environmental performance, and 16 firms for which a negative public announcement wasmade thus signalling weak environmental performance over the period 1985–1991. They reporta positive cumulative average abnormal return of 0.82% following positive environmental eventsand a negative cumulative average abnormal return of 1.5% following negative environmentalevents. In the same vein, Feldman, Soyka, and Ameer (1997) using the CAPM methodologyfound that improving both the environmental management system and environmental perfor-mance can reduce firms’ perceived risk in the market place and increase their stock price by asmuch as 5%.
Other studies have also examined the impact of ethical constraints from the perspectiveof portfolio performance. Thus, Guerard (1997) compared the average monthly return of 950

42 K. Fischer, N. Khoury / The Quarterly Review of Economics and Finance 47 (2007) 40–54
stocks of companies designated as socially responsible with that of 1300 stocks of compa-nies not having that designation for the period 1987–1994. He also conducted a multi-factorregression analysis of the total return of each stock on a number of accounting variables, ona quarterly basis, in order to rank stocks in terms of their expected returns, and form portfo-lios on this basis. His results show that by and large no significant difference exists in averagemonthly returns between portfolios of socially screened and unscreened stocks. He also showsthat a composite model using both value and growth components produces no significant dif-ferences in stock selection modeling in screened and unscreened universes. In the wake ofthe divestment movement of South African equities in the 1970s, Rudd (1979) looked at theimpact of such exclusions on portfolio risk. He began by excluding from the S&P 500 Indexthe 116 companies listed by the Investor Responsibility Research Center as having links withSouth Africa. He then optimized the remaining securities to form a portfolio that matched theS&P 500 Index as closely as possible for September 1978. His results show that this optimalportfolio although very well diversified with an R2 of 0.989 has an annual residual standard devi-ation of 2.21% in comparison to a residual standard deviation of zero for a pure index fundand 1.5% for a typical marketed index fund. In the same vein, Wagner, Emkin, and Dixon(1984) examined the possibility of replacing 152 companies of the S&P 500 index operatingin South Africa with the largest “unrestricted” companies of their respective industries andcompared this modified portfolio with the original index from the first quarter of 1979 to thefirst quarter of 1984. They concluded that the modified portfolio, although very well diver-sified (R2 of 0.968), is riskier than the index (Beta of 1.08) and entails additional costs ofresearch, trading and administration. Kahn, Lekander, and Leimkuhler (1997) examined theinvestment implications of a forced divestiture of the tobacco holdings of pension funds forpassive as well as for active managers. By using the S&P 500 as benchmark for passive fundmanagers, the study shows that removing tobacco stocks from the index reduces its perfor-mance by 21 basis points per year, over the period 1987–1996, with a negligible effect on risk.As for active managers, the study indicates that the tobacco divestiture decision reduces theirpotential for outperformance by reducing the number of stocks in the opportunity set, and cre-ates measurement problems associated with imperfect benchmarks. The study also shows thata strategy of optimally weighting the tobacco-free portfolio to match the beta and other riskcharacteristics of the S&P 500 as closely as possible would result in higher transaction costsdue to higher turnover. On the other hand, Diltz (1995) looked at the impact of various ethi-cal screens on portfolio performance for the period 1989–1991 and concluded that 11 ethicalscreens and combinations of them had no significant effect on performance. He also found thatthe good environmental behavior screen and the nuclear and military exclusion screen had positiveimpacts on performance, whereas the provision of a family-related benefits screen had a negativeimpact.
Attempts were also made to study the relationship between ethical behavior and financialperformance at the company level. Thus, Waddock and Graves (2000) find that companies that suc-cessfully pass a social screen and those that do not perform about the same financially. Vreschoorand Murphy (2002), on the other hand, report that the 100 companies included in the S&P 500index which qualified for the “Business Ethics Best Citizen” title awarded by Business Week in2001 ranked higher by 10 percentile points on average than the mean ranking of the remainingcompanies in this index in terms of overall financial performance as measured by Business Weekon the basis of eight financial ratios. A range of studies, such as those by Hart and Ahuja (1996)and Russo and Fouts (1997) draw on the resource-based theory of the firm to evaluate the impact ofenvironmental policies and show that environmental performance and economic performance are
K. Fischer, N. Khoury / The Quarterly Review of Economics and Finance 47 (2007) 40–54 43
positively linked.1 In all cases, the results suggest a positive association between ethical behaviorand profitability although it should be noted that causality has not been demonstrated by these tests.
Given the growing interest in ethical investing around the world, rating agencies have pro-liferated in the major industrialized countries to provide social investment screens that allowinvestors to obtain information on the social and environmental performance of the corporationsof their countries. The most important of these agencies are the Domini 400 Social Index and theKLD Research & Analytics Inc. for US securities, the NPI Social Index for British securities, theEthos agency for Swiss securities, the Arese agency for European securities, the Avanzi agencyfor Italian securities, the Dow Jones Sustainability Group Indexes for international securities andMichael Jantzi Research Associates Inc. (MJRA) and EthicScan for Canadian securities. The largenumber of agencies involved in this activity has resulted in a diversity of approaches and conceptsused in rating the social and environmental record of corporations in each national market.
In this paper, we use the MJRA screening system as it is the most appropriate for the ethicalrating of Canadian securities. Indeed, MJRA was the major supplier of ethical ratings for Canadiansecurities during the period examined. In contrast to other rating agencies, MJRA uses a “best-of-sector” approach to social investing. In this approach, a company’s social record is measuredagainst the standard of best practices in its industry rather than against an absolute standard. Moreimportantly, the MJRA approach rates corporate activities in terms of strengths and concerns ratherthan only in terms of exclusions, thus allowing investors to evaluate the totality of a company’ssocial record. These aspects of the MJRA screening system will be examined in more detail inthe next section.
Using the MJRA screening system, this paper focuses on the impact of ethical ratings pub-lished in Canada on the risk-adjusted returns of the securities concerned, within the frameworkof a multi-factor Capital Asset Pricing Model, as well as from the perspective of portfoliocomposition and from that of corporate governance. The relevance of this study derives, in thefirst place, from the importance of the Canadian security markets for the US investors. Indeed,not only is the Canadian economy largely dependent on trade with the US, but also US companiesturn to Canada for investment and/or financing opportunities. By analyzing the impact of theethical environment on Canadian securities, individually and in a portfolio framework, this studyprovides new evidence that can prove useful to investors in both countries. Secondly, by virtueof the particular rating system of MJRA, which is based on strengths and concerns, and theappropriate methodology chosen, the study fills a gap in the literature by providing a refinedevidence as to the reaction of investors to this detailed information.
The remainder of the paper is organized as follows. The next section describes the data setand presents the methodology used. The third section discusses the statistical estimation proce-dures used in the tests and gives the empirical results and their interpretation. The fourth sectionconcludes the paper.
1. Data and methodology
The initial sample in this study includes 448 Canadian companies over the period 1997–2000.Ethical scoring of these companies comes from the Canadian Social Investment Database (CSID)published by MJRA. As mentioned earlier, MJRA was, to our knowledge, the major supplierof ethical ratings for the Canadian market during the period under study. Its screening process
1 Russo and Fouts (1997) also show that returns to environmental performance are higher in high-growth industries.Their tests cover a sample of 243 firms over a period of 2 years.
44 K. Fischer, N. Khoury / The Quarterly Review of Economics and Finance 47 (2007) 40–54
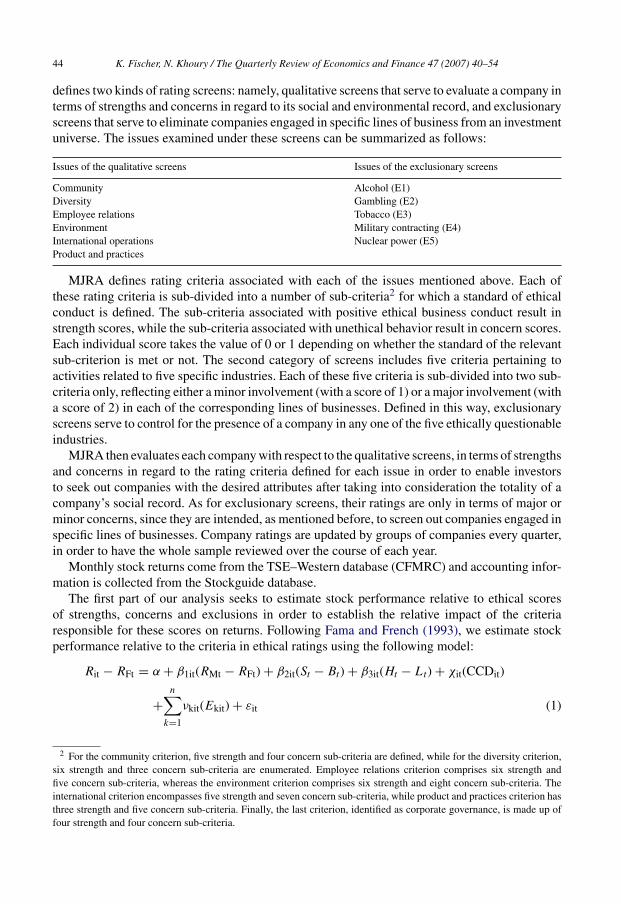
defines two kinds of rating screens: namely, qualitative screens that serve to evaluate a company interms of strengths and concerns in regard to its social and environmental record, and exclusionaryscreens that serve to eliminate companies engaged in specific lines of business from an investmentuniverse. The issues examined under these screens can be summarized as follows:
Issues of the qualitative screens Issues of the exclusionary screens
Community Alcohol (E1)Diversity Gambling (E2)Employee relations Tobacco (E3)Environment Military contracting (E4)International operations Nuclear power (E5)Product and practices
MJRA defines rating criteria associated with each of the issues mentioned above. Each ofthese rating criteria is sub-divided into a number of sub-criteria2 for which a standard of ethicalconduct is defined. The sub-criteria associated with positive ethical business conduct result instrength scores, while the sub-criteria associated with unethical behavior result in concern scores.Each individual score takes the value of 0 or 1 depending on whether the standard of the relevantsub-criterion is met or not. The second category of screens includes five criteria pertaining toactivities related to five specific industries. Each of these five criteria is sub-divided into two sub-criteria only, reflecting either a minor involvement (with a score of 1) or a major involvement (witha score of 2) in each of the corresponding lines of businesses. Defined in this way, exclusionaryscreens serve to control for the presence of a company in any one of the five ethically questionableindustries.
MJRA then evaluates each company with respect to the qualitative screens, in terms of strengthsand concerns in regard to the rating criteria defined for each issue in order to enable investorsto seek out companies with the desired attributes after taking into consideration the totality of acompany’s social record. As for exclusionary screens, their ratings are only in terms of major orminor concerns, since they are intended, as mentioned before, to screen out companies engaged inspecific lines of businesses. Company ratings are updated by groups of companies every quarter,in order to have the whole sample reviewed over the course of each year.
Monthly stock returns come from the TSE–Western database (CFMRC) and accounting infor-mation is collected from the Stockguide database.
The first part of our analysis seeks to estimate stock performance relative to ethical scoresof strengths, concerns and exclusions in order to establish the relative impact of the criteriaresponsible for these scores on returns. Following Fama and French (1993), we estimate stockperformance relative to the criteria in ethical ratings using the following model:
Rit − RFt = α + β1it(RMt − RFt) + β2it(St − Bt) + β3it(Ht − Lt) + χit(CCDit)
+n∑
k=1
νkit(Ekit) + εit (1)
2 For the community criterion, five strength and four concern sub-criteria are defined, while for the diversity criterion,six strength and three concern sub-criteria are enumerated. Employee relations criterion comprises six strength andfive concern sub-criteria, whereas the environment criterion comprises six strength and eight concern sub-criteria. Theinternational criterion encompasses five strength and seven concern sub-criteria, while product and practices criterion hasthree strength and five concern sub-criteria. Finally, the last criterion, identified as corporate governance, is made up offour strength and four concern sub-criteria.

K. Fischer, N. Khoury / The Quarterly Review of Economics and Finance 47 (2007) 40–54 45
where
(Rit − RFt) is the difference between the return on stock i and the return on a 90 day CanadianTreasury Bill for each year t.(RMt − RFt) is the difference between the return on the Toronto Stock Exchange 300 Index(capped)3 and that on a 90 day Canadian Treasury Bill for year t.(St − Bt) is the difference between the return on a portfolio of small capitalization stocks andthat on a portfolio of large capitalization stocks for year t.(Ht − Lt) is the difference between the return on a portfolio of stocks with a high ratio of BookValue/Market Value and that of a portfolio of stocks with a low such ratio for year t.4
CCDit is a dummy that takes the value of 1.0 when the summation of concern scores for thevarious sub-criteria (h) reported for stock i in year t with respect to the criteria of the qualitativescreens is larger than one. The expected sign of its coefficient is negative.Ekit are the scores for the various sub-criteria (k) reported for stock i in year t with respect tothe level of activity in any of the ethically questionable industries. The expected sign of thecorresponding coefficient is negative.
Model (1) can be extended to include a dummy SSDit that takes the value of 1.0 when thesummation of strength scores for the various sub-criteria (j) reported for stock i in year t withrespect to the criteria of the qualitative screens is larger than one. However, the absence ofsignificance for this dummy under various specifications of the model leads us to abandon thismodification.
Model (1) can also be extended to include four new dummies CCDit1, . . ., CCDit4 that takethe value of 1.0 if the firm presented 1, 2, 3 or 4 and more concerns, respectively. This extendedversion can be used to determine the importance of the number of concerns for investors, and toidentify the marginal effect of additional concerns. It will therefore be implemented.
Within the limits of the data available, the risk factors (St − Bt) and (Ht − Lt) were estimatedfrom six different portfolios comprising a total of 380 stocks in 1997, 377 stocks in 1998, 374stocks in 1999 and 387 stocks in 2000. The six portfolios were organized as in Fama and French(1993) with three portfolios of small capitalization stocks having a high (SH) an average (SM) anda low (SL) ratio of Book Value/Market Value, and three other portfolios of large capitalizationstocks with a high (BH) an average (BM) and a low (BL) ratio of Book Value/Market Value.The factor (St − Bt) represents the difference between the aggregate return of SH, SM and SLportfolios and that of BH, BM and BL portfolios for each month t, whereas the factor (Ht − Lt)represents the difference between the aggregate return of BH and SH portfolios and that of BLand SL portfolios. The correlation coefficient between these two factors for the period under studyis −0.0225 which indicates their orthogonality.5
3 This version of the Index imposes a limit of 10% on the weight of any security’s market value.4 A number of precautions must be taken in the formulation of the model since the summations of scores yield an ordinal
variable. Indeed, the addition of one concern from say CC = 2–3 does not necessarily have the same value as the additionof one concern from CC = 3–4. Hence, the summations of scores cannot be safely used in a standard regression procedure.We have therefore adopted an approach often suggested for these situations, namely that of substituting ordinal variablesby dummies.
5 We have also estimated a model in which strength and concerns entered into the regression equation individually. Theresults do not present any interest and are therefore not presented here.

46 K. Fischer, N. Khoury / The Quarterly Review of Economics and Finance 47 (2007) 40–54
The second part of our analysis seeks to determine the total number of concern scores beyondwhich portfolio performance is adversely affected. The analysis is limited to the number ofconcerns as it represents the decision variable in portfolio composition that determines the degreeto which a portfolio of non-excluded stocks can be ethical without sacrificing performance.6 Inthis regard, portfolio performance is estimated using the following model:
Rit − RFt = α + β1it (RMt − RFt) + β2it (St − Bt) + β3 it (Ht − Lt) + ω1it (D1)
+ ω2it (D2) + ω3it (D3) + εit (2)
where Rit − RFt is the difference between the return of portfolio i and that of a 90 day CanadianTreasury Bill for each month t. The other risk factors are as defined before, except that they arecalculated on a monthly basis.
Four different portfolios were composed for this test with stocks exhibiting either zero, one,two or three concerns. The dummy variables D1–D3 take on the value of 0 or 1 with respect tothese portfolios as follows:
D1 D2 D3
Portfolio of stocks with a score of zero concerns 0 0 0Portfolio of stocks with a score of one concern 1 0 0Portfolio of stocks with a score of two concerns 0 1 0Portfolio of stocks with a score of three and more concerns 0 0 1
The four portfolios in this test are equally weighted, and are rebalanced on a yearly basis inorder to keep their basic features7 constant.
Before testing, the data set was rearranged to accommodate each of the models to be estimated.For Model (1-a) the data set includes all the 448 companies for which complete ratings areavailable. To estimate this model, annual observations of excess returns, the three risk factors andthe annual scores with respect to strengths (Sjit), concerns (Chit) and exclusions (Ekit) are attributedto each company. For Model (1-b) a second very similar data set was created with returns and therisk factors still calculated on a yearly basis, but with strengths, concerns and exclusions scoresaggregated for each company in each year. To estimate Model (2), a data base was constitutedwith monthly observations of returns and risk factors, and with a binary variable D1–D3 attachedto each portfolio. The portfolio with zero concerns (D0) represents the intercept. As a result ofthis data organization, we end up with all data sets in panel format. For Models (1-a) and (1-b),the data set has i = 1, . . ., 448 “individuals” and t = 1, . . ., 4 giving a total of 1792 observations.However, because the rating agency has expanded its sample gradually over the period understudy, we end up with a total of 1420 usable observations. For Model (2), the data set consists ofi = 1, . . ., 4 and t = 1, . . ., 48, giving a total of 192 observations.
6 By definition, exclusion criteria are of a binary nature and affect a relatively small number of stocks.7 The portfolio of stocks with zero concerns is made up of 29 securities in 1997, 31 securities in 1998, 38 securities
in 1999 and 46 securities in 2000. The portfolio of stocks with one concern is made up of 55 securities in 1997, 55securities in 1998, 56 securities in 1999 and 60 securities in 2000. The portfolio of stocks with two concerns includes 49securities in 1997, 50 securities in 1998, 49 securities in 1999 and 41 securities in 2000. Finally, the portfolio of stockswith three concerns is made up of 24 securities in 1997, 23 securities in 1998, 19 securities in 1999 and 17 securities in2000. Although the focus of this test is on the number of concerns scores, it is worth mentioning that the distribution ofstrength scores within each of the four portfolios over the period under study is almost similar.

K. Fischer, N. Khoury / The Quarterly Review of Economics and Finance 47 (2007) 40–54 47
Table 1Summary statistics for stocks and ratings (annual data)
Series Mean S.E. Minimum Maximum
Rit − RFt 0.2656 2.4500 −1.0302 62.3798RMt − RFt 0.0769 0.2403 −0.2148 0.4246St − Bt −0.2397 0.2045 −0.3788 0.1132Ht − Lt −0.1921 0.4297 −0.8876 0.2303
S1: Community 0.2736 0.5117 0 2S2: Diversity 0.3325 0.6194 0 4S3: Employee relation 0.6109 0.7392 0 3S4: Environment 0.1961 0.4664 0 2S5: International operations 0.0185 0.1350 0 1S6: Product and business practices 0.1856 0.4150 0 2S7: Corporate governance 0.1937 0.4453 0 2
SS total 1.2536 1.7180 0 10
C1: Community 0.0153 0.1229 0 1C2: Diversity 0.3179 0.4676 0 2C3: Employee relation 0.0742 0.2683 0 2C4: Environment 0.2510 0.5216 0 2C5: International operations 0.0451 0.2154 0 2C6: Product and business practices 0.0532 0.2386 0 2C7: Corporate governance 0.5504 0.6497 0 3
CC total 0.9050 1.1199 0 6
E1: Alcohol 0.0161 0.1790 0 2E2: Gambling 0.0080 0.1060 0 2E3: Tobacco 0.0129 0.1551 0 2E4: Military contracting 0.0548 0.2902 0 2E5: Nuclear power 0.0347 0.2039 0 2
EE total 0.8771 0.3894 0 3
(Rit − RFt) is the difference between the return on stock i and the return on a 90 day Canadian Treasury Bill for each yeart; (RMt − RFt) is the difference between the return on the Toronto Stock Exchange 300 Index (capped) and that on a 90day Canadian Treasury Bill for year t; (St − Bt) is the difference between the return on a portfolio of small capitalizationstocks and that on a portfolio of large capitalization stocks for year t; (Ht − Lt) is the difference between the return on aportfolio of stocks with a high ratio of Book Value/Market Value and that of a portfolio of stocks with a low such ratio foryear t; Si represents strengths; Ci represents ethical concerns; Ei represents “exclusions” defined as involvement in anyof the ethically questionable industries.
It should be mentioned that the relatively small number of monthly observations and the factthat the data takes a panel format precludes the use of GARCH procedures. Instead, we willcontrol for heteroskedasticiy by other means suitable for panel data.
2. Empirical results
Summary statistics of the data used in Models (1-a) and (1-b) are presented in Table 1. Thetable reveals, among other things, the high variability of returns of individual stocks (expressedin decimals), compared to that of the market. As regards ratings, it is interesting to note first thatthe maximum observed strength scores vis-a-vis a criterion is 4, implying that for this particularcriterion (diversity) a company has exhibited strength on four related sub-criteria. The maximum

48 K. Fischer, N. Khoury / The Quarterly Review of Economics and Finance 47 (2007) 40–54
cumulative strength scores obtained by a company with respect to all criteria in this category ofscreens is 10. As regards concerns, the maximum observed scores obtained for a criterion is 2 andthe maximum total obtained by a company with respect to all criteria combined in this categoryof screens is 6. In the case of exclusions, the maximum number of concern scores obtained foreach sub-criterion is of course 2, signifying a major concern, and the maximum total of all scoresin regard of this category of screens is 3. It is interesting to note in this regard that the two lowestmean exclusionary scores in the table are those pertaining to the gambling and tobacco industries.This is due to the fact that only two companies in our sample had a major involvement with thegambling industry, only two companies had a major involvement with the tobacco industry andone company had a minor involvement with it. By contrast, the highest mean exclusionary scoreis that related to Military contracting, in which 10 companies have had consistent major or minorinvolvement over the period under study and a few additional companies have had occasionalinvolvement.
Given the panel nature of the data, precautions must be taken in the estimation procedure.More specifically, OLS can be a suitable estimation approach only under very specific condi-tions that are rarely found with this type of data. Thus, with respect to Model (1), we proceedfirst by estimating the models by means of OLS to recover the residuals. These residuals arethen subjected to an ANOVA that evaluates the potential presence of individual (firm) effectsand time effects. The presence of one or both of these effects could bias the covariance matrixof parameter estimates. This would be the case if unobservable individual effects, or if timeeffects are correlated to the explicitly stated variables (risk or rating), that is if either E[x|μi] �= 0or E[x|τt] �= 0, where μi and τt are individual or time unobservable effects, respectively. Thepresence of individual effects would mean that individual firms returns for all periods may beexplained by factors other than the risk factors and the scores. On the other hand, the presenceof time effects would mean that there are time-varying macro factors not accounted for explic-itly by the risk factors and the rating scores that explain variations of returns of all firms. TheANOVA on the residuals provides information on whether or not such effects are present in thedata.
The presence of either or both of the above mentioned effects requires an adaptation of theestimation methodology. We can choose between two relatively straightforward procedures: esti-mation via “fixed effects” (FE) or estimation via “random effects” (RE). We decided upon thechoice of the appropriate procedure by a Hausman specification test, in which the vectors ofcoefficients estimated by both procedures are compared.8 If the equality of vectors coefficientsis rejected, it would be a clear indication that the RE estimation procedure, while more efficient,yields biased parameters. In this instance, the use of an FE based estimation procedure becomesmandatory. However, if the equality of vector coefficients is not rejected, it would suggest thateither procedure will generate unbiased estimates, but RE would provide more efficient estimatesof the covariance matrix. Once we established the right estimation procedure, we go on to presentthe results of the tests, using either the FE or the RE procedure, and to perform a Wald test ofexclusion on the variables of interest. Given the somewhat different nature of the data set used toestimate Model 2, we will be forced to introduce some variations to the above procedure that willbe explained later in the paper.
8 The Hausman specification test is typically applied when two estimation procedures may be used, one efficient butpotentially biased and the other unbiased but inefficient. In our case RE is efficient but potentially biased, while FE isunbiased but inefficient. The Hausman test consists of computing the difference of the vector of coefficients and comparingit against the covariance matrix of the coefficients. The statistic is distributed Chi-squared (see Hausman, 1978).

K. Fischer, N. Khoury / The Quarterly Review of Economics and Finance 47 (2007) 40–54 49
Table 2ANOVA for OLS residuals of Model (1)
Source Sum of squares d.f. Mean square F-statistic Significance level
Individual 2717.83 405 6.7107 3.6387 0.00Time 22.22 3 7.4054 4.0154 0.0075Joint 2717.83 408 6.6613 3.6119 0.00Error 1335.24 724 1.8443
Total 4053.07 1132
ANOVA of the residuals of Model (1) estimated by OLS. Of interest is the control of the individual and time effects, toassess the validity of the OLS estimates.
The ANOVA performed on the residuals of Model (1) estimated by OLS (not reported here)yields highly significant individual and time effects (see Table 2) which emphasizes the need touse estimation techniques adapted to panel data. We note however from the OLS estimation thatthe Durbin Watson statistic which stands at 2.049 suggests the absence of autocorrelation. Also,the F-value of the Hausman test comparing the coefficient vector for FE and RE estimations isonly 1.205 with a significance level of 0.29 suggesting that RE estimation is a better choice. Theresult of that estimation is presented in Table 3.
In this regression, no particular risk factor stands out as significant in explaining stock returnswith the exception of the coefficient χ for the dummy corresponding to cumulative concernswhich is significant at the 1% level and has the expected sign. Presence in one of the five ethicallyquestionable industries does not have a significant impact and a Wald exclusion test on all industry
Table 3Estimation of Model (1) using random effects
Variable Coefficient T-statistics Significance
Constant 1.2724 1.726 0.084β1 −0.0447 −0.059 0.952β2 2.4401 1.123 0.261β3 1.0378 1.212 0.225χ −0.3367 −2.544 0.011ν1 −0.0798 −0.073 0.942ν2 −0.2596 −0.376 0.707ν3 −0.0646 −0.070 0.943ν4 −0.0773 −0.183 0.855ν5 −0.1153 −0.257 0.797
Adjusted R2 = 0.528, N = 448; T = 4.This table presents estimates of the following model:
Rit − RFt = α + β1it (RMt − RFt) + β2it (St − Bt) + β3it(Ht − Lt) + χit (CCDit) +n∑
k=1
νkit (Ekit) + εit. Of interest in
this regression are the coefficients χ and ν which correspond to the accumulated strengths, concerns and exclusions.In this table (Rit − RFt) is the difference between the return on stock i and the return on a 90 day Canadian Treasury Billfor each year t; (RMt − RFt) is the difference between the return on the Toronto Stock Exchange 300 Index (capped) andthat on a 90 day Canadian Treasury Bill for year t; (St − Bt) is the difference between the return on a portfolio of smallcapitalization stocks and that on a portfolio of large capitalization stocks for year t; (Ht − Lt) is the difference betweenthe return on a portfolio of stocks with a high ratio of Book Value/Market Value and that of a portfolio of stocks witha low such ratio for year t; CCDi represents a dummy for ethical concerns; and Ei represents “exclusions” defined asinvolvement in any of the ethically questionable industries.
50 K. Fischer, N. Khoury / The Quarterly Review of Economics and Finance 47 (2007) 40–54
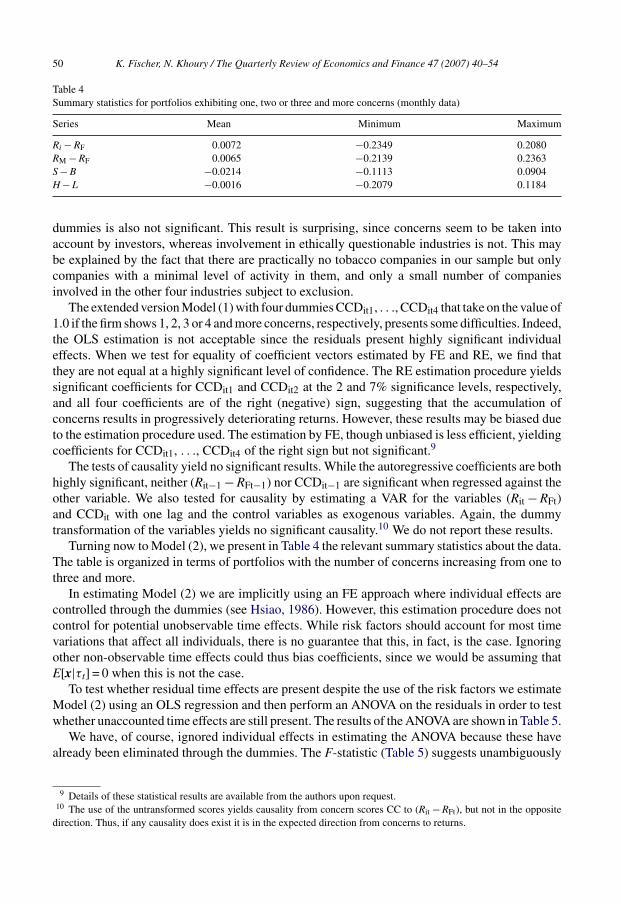
Table 4Summary statistics for portfolios exhibiting one, two or three and more concerns (monthly data)
Series Mean Minimum Maximum
Ri − RF 0.0072 −0.2349 0.2080RM − RF 0.0065 −0.2139 0.2363S − B −0.0214 −0.1113 0.0904H − L −0.0016 −0.2079 0.1184
dummies is also not significant. This result is surprising, since concerns seem to be taken intoaccount by investors, whereas involvement in ethically questionable industries is not. This maybe explained by the fact that there are practically no tobacco companies in our sample but onlycompanies with a minimal level of activity in them, and only a small number of companiesinvolved in the other four industries subject to exclusion.
The extended version Model (1) with four dummies CCDit1, . . ., CCDit4 that take on the value of1.0 if the firm shows 1, 2, 3 or 4 and more concerns, respectively, presents some difficulties. Indeed,the OLS estimation is not acceptable since the residuals present highly significant individualeffects. When we test for equality of coefficient vectors estimated by FE and RE, we find thatthey are not equal at a highly significant level of confidence. The RE estimation procedure yieldssignificant coefficients for CCDit1 and CCDit2 at the 2 and 7% significance levels, respectively,and all four coefficients are of the right (negative) sign, suggesting that the accumulation ofconcerns results in progressively deteriorating returns. However, these results may be biased dueto the estimation procedure used. The estimation by FE, though unbiased is less efficient, yieldingcoefficients for CCDit1, . . ., CCDit4 of the right sign but not significant.9
The tests of causality yield no significant results. While the autoregressive coefficients are bothhighly significant, neither (Rit−1 − RFt−1) nor CCDit−1 are significant when regressed against theother variable. We also tested for causality by estimating a VAR for the variables (Rit − RFt)and CCDit with one lag and the control variables as exogenous variables. Again, the dummytransformation of the variables yields no significant causality.10 We do not report these results.
Turning now to Model (2), we present in Table 4 the relevant summary statistics about the data.The table is organized in terms of portfolios with the number of concerns increasing from one tothree and more.
In estimating Model (2) we are implicitly using an FE approach where individual effects arecontrolled through the dummies (see Hsiao, 1986). However, this estimation procedure does notcontrol for potential unobservable time effects. While risk factors should account for most timevariations that affect all individuals, there is no guarantee that this, in fact, is the case. Ignoringother non-observable time effects could thus bias coefficients, since we would be assuming thatE[x|τt] = 0 when this is not the case.
To test whether residual time effects are present despite the use of the risk factors we estimateModel (2) using an OLS regression and then perform an ANOVA on the residuals in order to testwhether unaccounted time effects are still present. The results of the ANOVA are shown in Table 5.
We have, of course, ignored individual effects in estimating the ANOVA because these havealready been eliminated through the dummies. The F-statistic (Table 5) suggests unambiguously
9 Details of these statistical results are available from the authors upon request.10 The use of the untransformed scores yields causality from concern scores CC to (Rit − RFt), but not in the opposite
direction. Thus, if any causality does exist it is in the expected direction from concerns to returns.

K. Fischer, N. Khoury / The Quarterly Review of Economics and Finance 47 (2007) 40–54 51
Table 5Analysis of variance for the residuals of OLS estimate of Model (2)
Source Sum of squares d.f. Mean square F-statistic Significance level
Time 47.0 47.0 .00333 2.3277 0.0000699Error 0.2061678 144.0 .00143
Total 0.3628001 191.0
The ANOVA of the residuals of Model (2) estimated by OLS. Of interest is the control of the time effects, to assess thevalidity of the OLS estimates.
the presence of time effects not accounted for by the risk factors. The t-statistics obtained fromthe OLS estimates may thus be biased. We can only speculate about the source of this additionalvariation in the data. To correct for this bias, we must use an adapted estimation procedure.The two procedures used for Model (1) can also be applied here, namely the estimation by FEwith correction for time effects and the estimation by RE also with correction for time effects.However, as noted before when discussing the estimation procedure for Model (1), the choiceof the appropriate procedure depends upon the outcome of the Hausman test. When this test isperformed for Model (2) we obtain a trivially small value of 3.44 × 10⁻²⁸, which is obviouslynon-significant. This result is not surprising considering the fact that in this data set, in contrastto the one used to estimate Model (1), the value of T = 48 is much larger than that of N = 4. Thismeans that the RE estimation procedure is the correct one. Table 6 presents the results of theestimation of Model (2) using RE.
Several important observations can be made from this table. In the first place, as the relativelyhigh value of the adjusted R2 shows, over 70% of the total variation in returns is explained bythe model. Secondly, even though the risk factors and the concerns scores do not account for allthe variations in returns, they are all highly significant. Most importantly, the number of concernsseems to affect returns in an increasing fashion. To start with, the portfolio with zero concerns
Table 6Estimation of Model (2) using RE and controlling for time effects
Variable Coefficient T-statistics Significance
Constant 0.00002 0.0028 0.9977β1 0.93838 12.241 0.0000β2 −0.63430 −5.2913 0.0000β3 0.62211 −7.1473 0.00001 −0.01338 −1.7327 0.08312 −0.01200 −1.5537 0.12023 −0.02080 −2.6941 0.0070
Adjusted R2 = 0.722, N = 4; T = 48.The estimates of the following model are presented: Rit − RFt = α + β1it (RMt − RFt) + β2it (St − Bt) + β3it (Ht − Lt) +ω1it (D1) + ω2it (D2) + ω3it(D3) + εit. Of interest in this regression are the coefficients ω1, ω2 and ω3 which correspondto dummies for portfolios of stock with one, two or three and more concerns. (Rit − RFt) is the difference between thereturn on stock i and the return on a 90 day Canadian Treasury Bill for each year t; (RMt − RFt) is the difference betweenthe return on the Toronto Stock Exchange 300 Index (capped) and that on a 90 day Canadian Treasury Bill for year t;(St − Bt) is the difference between the return on a portfolio of small capitalization stocks and that on a portfolio of largecapitalization stocks for year t; (Ht − Lt) is the difference between the return on a portfolio of stocks with a high ratio ofBook Value/Market Value and that of a portfolio of stocks with a low such ratio for year t; Di are dummies for portfolios.The portfolio with no ethical concern is the intercept.

52 K. Fischer, N. Khoury / The Quarterly Review of Economics and Finance 47 (2007) 40–54
(portfolio D0) earns no abnormal return; its Jensen’s alpha is not different from zero. However,the three other portfolios which have increasing number of concerns are penalized quite heavily,roughly in proportion to the level of concerns. Thus, the portfolio with stocks exhibiting oneconcern yields a return that is lower than that of the portfolio with zero concerns by 1.3% permonth, at a confidence level of 8%. The portfolio of stocks with two concerns yields a monthlyreturn lower by 1.2% at a confidence level of 12%, than that of the portfolio with zero concerns.Finally, the portfolio with three and more concerns yields a full 2.0% per month less than theportfolio with zero concerns, at the 1% confidence level. Using an index of all securities listedon the Toronto Stock Exchange instead of the TSE 300 Index (capped) in this regression doesnot yield significantly different results. Furthermore, when we perform a Wald test of exclusionon the three dummies, we obtain a Chi-square of 7.466 with a significance level of 0.0584.It should be remembered, in this regard, that the average monthly return of the market duringthe period under study was 1.33% with a standard deviation of 5.39%. It should also be notedthat the correct interpretation of the coefficients for the dummies implies that the losses are notcumulative. It is also interesting to note that when Model (2) is estimated with an FE procedure,the coefficients obtained are numerically similar to those in Table 6 but at much lower significancelevels.
In other words, investors do not seem to follow a simplistic yes/no exclusion screen in defin-ing their universe of eligible securities. Rather, their decision process reflects personal choicesregarding the level of ethical behavior they wish to express in their portfolios. Their basic concern,therefore, does not lie with strength or exclusion scores, but with the overall level of concernsafflicting each company. More importantly, for the period under study, the portfolio of stockswith zero concerns outperformed the portfolios of stocks with either one, two or three or moreconcerns. This last observation can be of significance in the debate regarding the impact of ethicalscreens on portfolio performance.
The results obtained through the estimation of both models are thus consistent. On one hand,investors that ignore ethical concerns are likely to obtain statistically significant and sizable lowerreturns on their portfolios. On the other hand, company directors who ignore ethical issues in theirdecision making process are likely to inflict losses on their shareholders’ wealth. The financialviability of ethical screening of securities, illustrated in the findings of this paper, also suggestthat the issue of ethical rating is not likely to go away soon. In a market with these characteristics,corporations should pay attention to the level of aggregate ethical concerns that is signalled to themarket concerning their activities and to continually clarify their ethical policies and practices toinvestors.
3. Conclusion
Increasingly, investors are stressing the importance of the ethical posture of corporations inchoosing their universe of investment opportunities. The strategy that is gaining momentum inthis regard is to screen stocks on the basis of ethical ratings published by specialized researchorganizations. These ratings relate to various aspects of the business behavior of corporations asobserved and evaluated by the research organization with respect to an accepted standard.
The purpose of this study is to investigate the market response to the ethical business behaviorof Canadian publicly traded corporations, as signalled to the public through ratings of ethicalstrengths concerns and exclusions. By examining whether or not stock returns are correlated topositive ethical practices and policies insight might be gained into two related questions, namely:

K. Fischer, N. Khoury / The Quarterly Review of Economics and Finance 47 (2007) 40–54 53
(1) Should ethical screening scores be considered in portfolio composition?(2) Is there a financial incentive to incorporate ethics into business culture and decision making?
The findings of this research suggest that investors react to the level of concern scores signalledto them by the scoring agency, without regard to the particular aspect of unethical behavior coveredby each concern. The analysis also shows that a portfolio of stocks with zero concerns outperformsportfolios comprising securities with one, two and three or more concerns. Furthermore, thereis a significant decline in portfolio risk-adjusted returns as exposure to the number of concernsincreases.
From the investor’s point of view, our research indicates that there is good reason for relyingon the number of concern scores in screening securities for portfolio composition. The viabilityof this strategy in terms of portfolio performance indicates that such ethical screening is not aboutto go away soon.
From the point of view of corporate governance, the findings of this paper suggest that ignoringethical concerns may trigger a negative reaction from investors, as they defect to firms thatdisplay higher ethical standards. Thus, although the implementation of strict ethical standards canundoubtedly increase operating costs for corporations, and could decrease the quantity produced,ignoring them could result in loss of wealth to shareholders that may exceed those costs. Thesefindings also suggest that ethical issues may increasingly become a consideration in corporategovernance that cannot be overlooked by corporate directors without penalty to the market valueof their companies. Indeed, if the trend identified in this research persists, investors are likely toincrease the pressure on directors for the implementation of sound ethical standards and practicesin order to avoid the market penalties. Alternatively, corporate raiders may be able to extract rentby acquiring undervalued firms and devising ethical standards and policies for them. Corporationsshould therefore be proactive as regards the level of ethical concerns they wish to signal to themarket, and to conduct their business policy accordingly.
Acknowledgements
Financial support from the NATCAN and FCAR is gratefully acknowledged. Security screen-ing data were graciously provided by the Canadian Social Investment Database. The authors wishto thank Pierre-Marie Rousseau, Marie-Diane Deslauriers and Martin Desrochers for their ableassistance. They also thank G. Charest, B. M’Zali, J.-M. Gagnon, two anonymous referees andparticipants at the doctoral seminar at Laval University for their insightful comments.
References
Diltz, J. (1995). The private cost of socially responsible investing. Applied Financial Economics, 5.Fama, E. F., & French, K. R. (1993). Common risk factors in the returns on stocks and bonds. Journal of Financial
Economics, 33.Feldman, S. J., Soyka, P. A., & Ameer, P. G. (1997). Does improving a firm’s environmental management system and
environmental performance result in a higher stock price? Journal of Investing, 6(4).Guerard, J. B. (1997). Is there a cost to being socially responsible in investing. Journal of Investing, 6(2).Gunthorpe, D. L. (1997). A quantitative analysis of the impact of unethical behavior by publicly traded corporations.
Journal of Business Ethics, 16(5).Hart, S. L., & Ahuja, G. (1996). Does it pay to be green? An empirical examination of the relationship between emission
reduction and firm performance. Business Strategy and the Environment, 5(1).Hausman, J. A. (1978). Specification tests in econometrics. Econometrica, 46.Hsiao, C. (1986). Analysis of panel data. Cambridge: Cambridge University Press.

54 K. Fischer, N. Khoury / The Quarterly Review of Economics and Finance 47 (2007) 40–54
Kahn, R. N., Lekander, C., & Leimkuhler, T. (1997). Just say no? The investment implications of tobacco divestiture.Journal of Investing, 6(4).
Klassen, R. D., & McLaughlin, C. P. (1996). The impact of environmental management on firm performance. ManagementScience, 42(8).
Rudd, A. (1979). Divestment of South African equities: How risky? The Journal of Portfolio Management, 5(3).Russo, M. V., & Fouts, P. A. (1997). A resource-based perspective on corporate environmental performance and prof-
itability. Academy of Management Journal, 40(3).Vreschoor, C. C., & Murphy, E. A. (2002). Best corporate citizens have better financial performance. Strategic Finance
Magazine.Waddock, S., & Graves, S. B. (2000). Performance characteristics of social and traditional investments. Journal of
Investing, 9(2).Wagner, W. H., Emkin, A., & Dixon, R. L. (1984). South African divestment: The investment issues. Financial Analysts
Journal, 40(6).