The Impact of Diagnostic Feedback to Teachers on Student...
31
Published in the August 2010 issue of the Economic Journal The Impact of Diagnostic Feedback to Teachers on Student Learning: Experimental Evidence from India Karthik Muralidharan † Venkatesh Sundararaman ‡ 12 February, 2010 * Abstract: The use of high-stakes testing in education is increasingly common, but opponents argue that this leads to distortion of teacher activity towards the test and away from non-tested activities. An alternate use for tests is to provide teachers with low- stakes diagnostic feedback on how their students are performing. It is posited that providing this information can help improve teaching practices, teacher goal setting, and student learning outcomes (without the distortions induced by high-stakes testing). We present experimental evidence on the impact of a program that provided low-stakes diagnostic tests and feedback and low-stakes monitoring of classroom processes across a representative set of schools in the Indian state of Andhra Pradesh. We find teachers in treatment schools exerting more effort when observed in the classroom, but students in these schools do no better on independently-administered tests than students in schools that did not receive the program. This suggests that though teachers in the program schools worked harder while being observed, there was no impact of the feedback and monitoring on student learning outcomes. JEL Classification: I21, O15 Keywords: educational testing, diagnostic feedback, information, monitoring, education, intrinsic motivation, goal setting, Hawthorne effects, India † Department of Economics, University of California, San Diego; E-mail: [email protected] ‡ South Asia Human Development Unit, World Bank. E-mail: [email protected] * We are grateful to Caroline Hoxby, Michael Kremer, and Michelle Riboud for their support, advice, and encouragement at all stages of this project. We thank Julian Betts, Julie Cullen, Gordon Dahl, Dan Goldhaber, Nora Gordon, Richard Murnane and various seminar participants for useful comments and discussions. The project that this paper is based on was conducted by the Azim Premji Foundation on behalf of the Government of Andhra Pradesh with technical support from the World Bank and financial support from the UK Department for International Development (DFID) and the Government of Andhra Pradesh. We thank officials of the Department of School Education in Andhra Pradesh for their continuous support and long- term vision for this research. We are especially grateful to DD Karopady, M Srinivasa Rao, and staff of the Azim Premji Foundation for their meticulous work in implementing this project. Sridhar Rajagopalan and Vyjayanthi Sankar of Education Initiatives led the test design and preparation of diagnostic reports on learning. Vinayak Alladi provided outstanding research assistance. The findings, interpretations, and conclusions expressed in this paper are those of the authors and do not necessarily represent the views of the World Bank, its Executive Directors, or the governments they represent.
Transcript of The Impact of Diagnostic Feedback to Teachers on Student...
Published in the August 2010 issue of the Economic Journal
The Impact of Diagnostic Feedback to Teachers on Student Learning: Experimental Evidence from India
Karthik Muralidharan†
Venkatesh Sundararaman‡
12 February, 2010*
Abstract: The use of high-stakes testing in education is increasingly common, but opponents argue that this leads to distortion of teacher activity towards the test and away from non-tested activities. An alternate use for tests is to provide teachers with low-stakes diagnostic feedback on how their students are performing. It is posited that providing this information can help improve teaching practices, teacher goal setting, and student learning outcomes (without the distortions induced by high-stakes testing). We present experimental evidence on the impact of a program that provided low-stakes diagnostic tests and feedback and low-stakes monitoring of classroom processes across a representative set of schools in the Indian state of Andhra Pradesh. We find teachers in treatment schools exerting more effort when observed in the classroom, but students in these schools do no better on independently-administered tests than students in schools that did not receive the program. This suggests that though teachers in the program schools worked harder while being observed, there was no impact of the feedback and monitoring on student learning outcomes. JEL Classification: I21, O15 Keywords: educational testing, diagnostic feedback, information, monitoring, education, intrinsic motivation, goal setting, Hawthorne effects, India
† Department of Economics, University of California, San Diego; E-mail: [email protected] ‡ South Asia Human Development Unit, World Bank. E-mail: [email protected] * We are grateful to Caroline Hoxby, Michael Kremer, and Michelle Riboud for their support, advice, and encouragement at all stages of this project. We thank Julian Betts, Julie Cullen, Gordon Dahl, Dan Goldhaber, Nora Gordon, Richard Murnane and various seminar participants for useful comments and discussions. The project that this paper is based on was conducted by the Azim Premji Foundation on behalf of the Government of Andhra Pradesh with technical support from the World Bank and financial support from the UK Department for International Development (DFID) and the Government of Andhra Pradesh. We thank officials of the Department of School Education in Andhra Pradesh for their continuous support and long-term vision for this research. We are especially grateful to DD Karopady, M Srinivasa Rao, and staff of the Azim Premji Foundation for their meticulous work in implementing this project. Sridhar Rajagopalan and Vyjayanthi Sankar of Education Initiatives led the test design and preparation of diagnostic reports on learning. Vinayak Alladi provided outstanding research assistance. The findings, interpretations, and conclusions expressed in this paper are those of the authors and do not necessarily represent the views of the World Bank, its Executive Directors, or the governments they represent.

2
1. Introduction
Policy initiatives to improve the quality of education increasingly involve the use of
high-stakes tests to measure progress in student learning.1 While proponents of high-
stakes testing claim that they are a necessary (if imperfect) tool for measuring school and
teacher effectiveness, opponents argue that high-stakes tests induce distortions of teacher
activity such as teaching to the test that not only reduce the validity of the test scores (and
any inferences made on their basis), but also lead to negative outcomes.2
An alternate use that is suggested for tests that would preserve their usefulness, while
being less susceptible to distortion is to use tests in a low-stakes environment to provide
teachers and school administrators with detailed data on student performance as a
diagnostic tool to understand areas of student weakness and to better focus their teaching
efforts. The channels posited for the possible effectiveness of low-stakes tests include the
benefits of better information in improving teaching practice, and increases in teacher
intrinsic motivation by focusing attention on student learning levels and improving their
ability to set and work towards goals.
3
While the idea of such low-stakes testing is promising, there is very little rigorous
evidence on its effectiveness.
A useful way to distinguish these two approaches
is to think of high-stakes tests as “assessments of learning” and low-stakes tests as
“assessments for learning.”
4
1 The high-stakes for teachers and schools associated with student testing range from public provision of information on school performance to rewards and sanctions for school management and teachers on the basis of these tests. The best known example of high-stakes tests are those associated with school accountability laws such as No Child Left Behind.
Also, in practice, systems that provide feedback on
student performance to teachers are accompanied by varying degrees of training and
2 See Koretz (2008) for a discussion of the complexities of testing and the difficulty in interpreting test score gains. Holmstrom and Milgrom (1991) and Baker (1992) discuss the problem of multi-task moral hazard, with test-based incentives for teachers being a well known example of this problem. Examples of counter-productive teacher behavior in response to high-powered incentives include rote 'teaching to the test' and neglecting higher-order skills (Glewwe et al (2003)), manipulating performance by short-term strategies like boosting the caloric content of meals on the day of the test (Figlio and Winicki (2005)), excluding weak students from testing (Jacob (2005)), focusing only on some students in response to "threshold effects" embodied in the structure of the incentives (Neal and Schanzenbach, 2008) or even outright cheating (Jacob and Levitt, 2003). 3 See Boudet, City, and Murnane (2006) for a summary of this approach of using assessment data to improve teaching practices and learning outcomes. 4 Coe (1998) reviews the evidence on the effectiveness of feedback on performance in general and highlights the lack of evidence on the effectiveness of feedback systems in improving students’ academic performance.
3
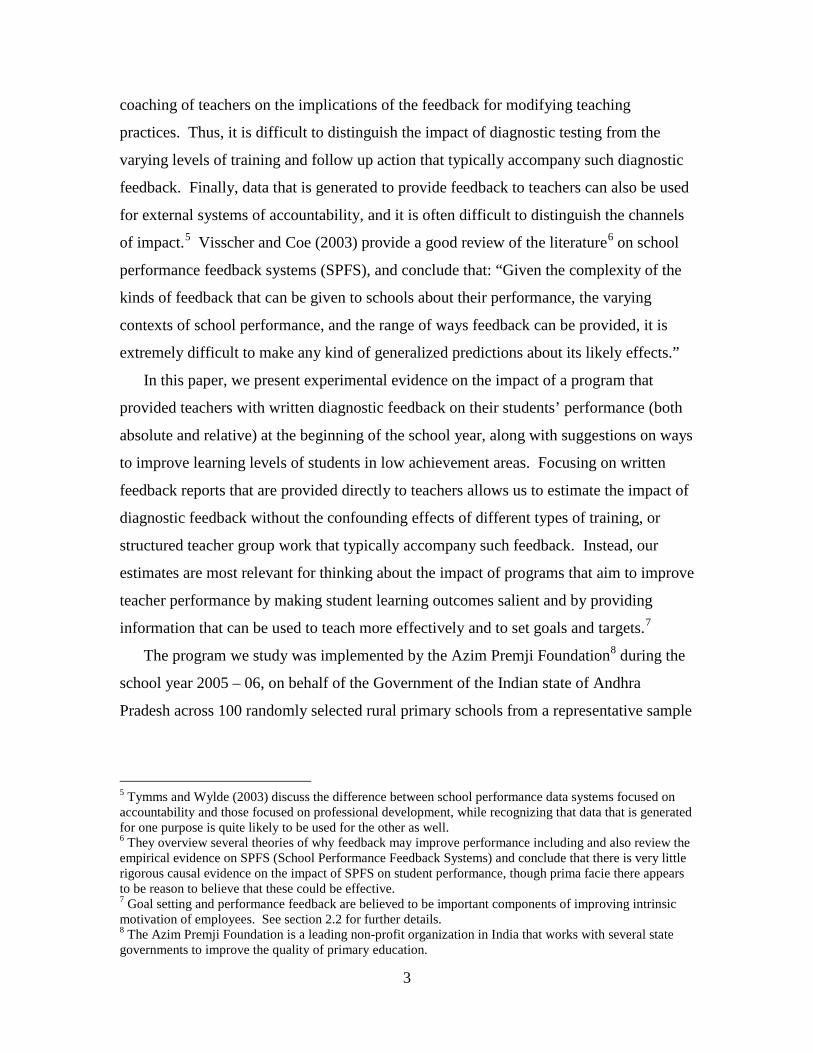
coaching of teachers on the implications of the feedback for modifying teaching
practices. Thus, it is difficult to distinguish the impact of diagnostic testing from the
varying levels of training and follow up action that typically accompany such diagnostic
feedback. Finally, data that is generated to provide feedback to teachers can also be used
for external systems of accountability, and it is often difficult to distinguish the channels
of impact.5 Visscher and Coe (2003) provide a good review of the literature6
In this paper, we present experimental evidence on the impact of a program that
provided teachers with written diagnostic feedback on their students’ performance (both
absolute and relative) at the beginning of the school year, along with suggestions on ways
to improve learning levels of students in low achievement areas. Focusing on written
feedback reports that are provided directly to teachers allows us to estimate the impact of
diagnostic feedback without the confounding effects of different types of training, or
structured teacher group work that typically accompany such feedback. Instead, our
estimates are most relevant for thinking about the impact of programs that aim to improve
teacher performance by making student learning outcomes salient and by providing
information that can be used to teach more effectively and to set goals and targets.
on school
performance feedback systems (SPFS), and conclude that: “Given the complexity of the
kinds of feedback that can be given to schools about their performance, the varying
contexts of school performance, and the range of ways feedback can be provided, it is
extremely difficult to make any kind of generalized predictions about its likely effects.”
7
The program we study was implemented by the Azim Premji Foundation
8
5 Tymms and Wylde (2003) discuss the difference between school performance data systems focused on accountability and those focused on professional development, while recognizing that data that is generated for one purpose is quite likely to be used for the other as well.
during the
school year 2005 – 06, on behalf of the Government of the Indian state of Andhra
Pradesh across 100 randomly selected rural primary schools from a representative sample
6 They overview several theories of why feedback may improve performance including and also review the empirical evidence on SPFS (School Performance Feedback Systems) and conclude that there is very little rigorous causal evidence on the impact of SPFS on student performance, though prima facie there appears to be reason to believe that these could be effective. 7 Goal setting and performance feedback are believed to be important components of improving intrinsic motivation of employees. See section 2.2 for further details. 8 The Azim Premji Foundation is a leading non-profit organization in India that works with several state governments to improve the quality of primary education.
4
of such schools in the state.9
We find at the end of one year of the program that teachers in the feedback schools
appear to perform better on measures of teaching activity when measured by classroom
observations compared to teachers in the control schools. However, there was no
difference in test scores between students in the feedback schools and the comparison
schools at the end of the year. This suggests that though teachers in the treatment schools
worked harder while being observed, there was no impact of the diagnostic feedback and
low-stakes monitoring on student learning outcomes.
The program received by the “feedback” schools consisted
of an independently administered baseline test at the start of the school year, a detailed
written diagnostic feedback report on the performance of students on the baseline test, a
note on how to read and use the performance reports and benchmarks, an announcement
that students would be tested again at the end of the year to monitor progress in student
performance, and low-stakes monitoring of classrooms during the school year to observe
teaching processes and activity. It was made clear to schools and teachers that no
individually attributable information would be made public, and that there were no
negative consequences whatsoever of poor performance on either the baseline or the end-
of-year tests. Thus, the program was designed to focus on the intrinsic motivation of
teachers to be better teachers, as opposed to any extrinsic incentives or pressure
(monetary or non-monetary).
In a parallel initiative, the Azim Premji Foundation provided teachers in another
randomly selected set of schools with the opportunity to obtain performance-linked
bonuses in addition to the same diagnostic feedback described above. We find that
though the diagnostic feedback on its own had no significant impact on student test
scores, the combination of feedback and teacher performance pay had a significant
positive effect on student test scores.10
9 This study was conducted as part of a larger project known as the Andhra Pradesh Randomized Evaluation Study (AP RESt). The AP RESt studies several interventions to improve education outcomes that provided diagnostic feedback in addition to other programs such as performance-linked pay for teachers, an extra contract teacher, and cash block grants to schools.
Teachers in both types of schools report similar
levels of usefulness of the reports. However, we find that teachers’ self-reported
usefulness of the feedback reports does not predict student test scores in the feedback
10 The details of the performance pay program are provided in a companion paper. See Muralidharan and Sundararaman (2009).
5
only schools, but does do so in the incentive schools. This suggests that the diagnostic
feedback did contain useful information, but that teachers were less likely to make
effective use of it in the absence of external incentives to do so. While our results do not
speak to the potential effectiveness of such feedback when combined with teacher
training and targeted follow up, it does suggest that diagnostic feedback to teachers by
itself may not be enough to improve student learning outcomes, especially in the absence
of improved incentives to make effective use of the additional inputs.
This paper presents the first experimental evaluation of a low-stakes diagnostic
testing and feedback intervention, and contributes to a small but emerging literature on
measuring the impact of low-stakes feedback on student learning. The closest related
study is Betts et al (2010) who use panel data to study the impact of California's
Mathematics Diagnostic Testing Project (MDTP) and find positive effects of mandated
use of MDTP but no effects of voluntary use by teachers. In a complementary paper,
Tyler (2010) studies the extent to which teachers in Cincinnati use data on student-level
performance, and finds "relatively low levels of teacher interaction with pages on the web
tool that contain student test information that could potentially inform practice."
The rest of this paper is organized as follows: section 2 describes the experimental
intervention and data collection, section 3 presents the main results of the paper, and
section 4 discusses policy implications and concludes.
2. Experimental Design
2.1. Context
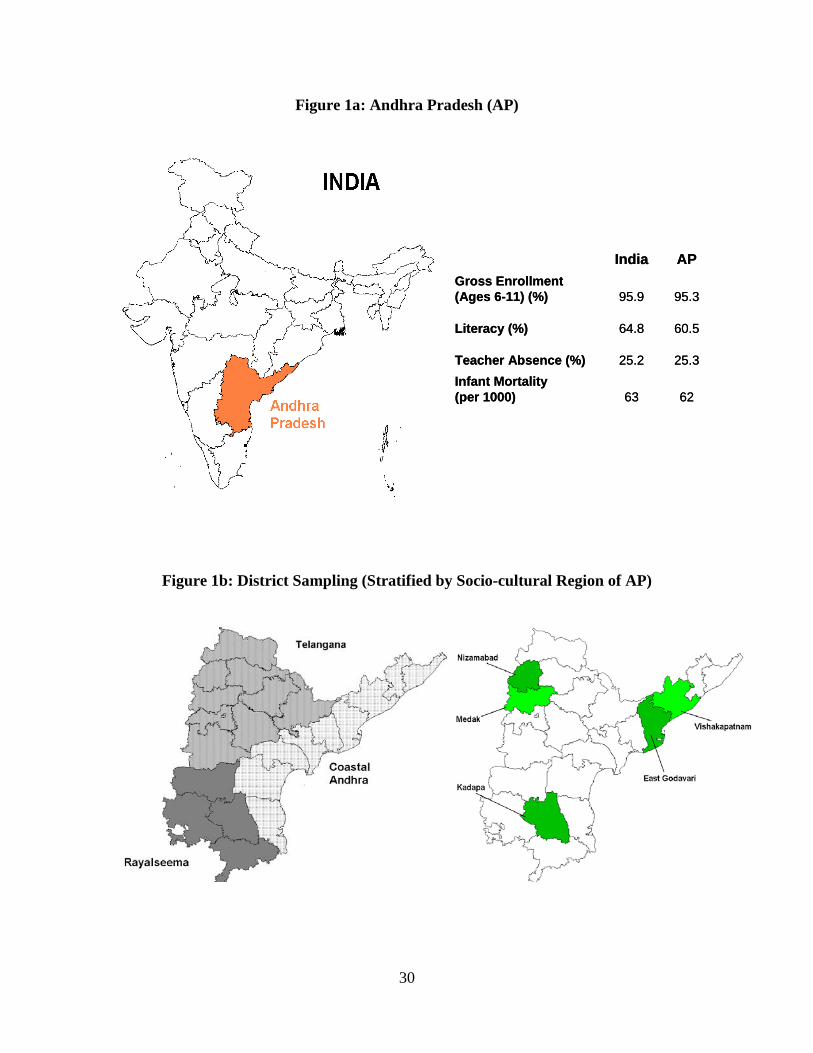
Andhra Pradesh (AP) is the 5th largest state in India, with a population of over 80
million, of whom around 70% live in rural areas. AP is close to the all-India average on
various measures of human development such as gross enrollment in primary school,
literacy, and infant mortality, as well as on measures of service delivery such as teacher
absence (Figure 1a). The state consists of three historically distinct socio-cultural regions
(Figure 1b) and a total of 23 districts. Each district is divided into three to five divisions,
and each division is composed of ten to fifteen mandals, which are the lowest
administrative tier of the government of AP. A typical mandal has around 25 villages
and 40 to 60 government primary schools. There are a total of over 60,000 such schools

6
in AP and around 80% of children in rural AP attend government-run schools (Pratham,
2008).
The average rural primary school is quite small, with total enrollment of around 80 to
100 students and an average of 3 teachers across grades one through five.11 One teacher
typically teaches all subjects for a given grade (and often teaches more than one grade
simultaneously). All regular teachers12 are employed by the state, are well qualified, and
are paid well (the average salary of regular teachers is over four times per capita income
in AP). However, incentives for teacher attendance and performance are weak, with
teacher absence rates of over 25% (Kremer et al (2005)). Teacher unions are strong and
disciplinary action for non-performance is rare.13
2.2 The Diagnostic Feedback Intervention
Regular government teachers are quite well qualified with around 85% of teachers in
our (representative) sample of teachers having a college degree and 98% having a formal
teacher training certificate or degree. However, student learning levels continue to be
very low with a recent all-India survey finding that over 58% of children aged 6 to 14 in
an all-India sample of over 300,000 rural households could not read at the second grade
level, though over 95% of them were enrolled in school (Pratham, 2008). Education
planners and policy makers often posit that an important reason for this is that teachers
(though qualified on paper) are not equipped to deal effectively with the classroom
situations that they face.14
One area of teacher preparedness that is believed to be lacking is detailed knowledge
of the learning levels of their students. For instance, teachers are believed to simply
teach from the textbooks without any mapping from the content in the textbook to
11 This is a consequence of the priority placed on providing all children with access to a primary school within a distance of 1 kilometer from their homes. 12 Regular civil-service teachers who are employed by the state government comprise the majority of teachers (around 90%) in government rural schools, with the rest comprising of contract teachers who are hired locally at the school level on annually renewable contracts. 13 Kremer et al (2005) find that on any given working day, 25% of teachers are absent from schools across India, but only 1 head teacher in their sample of 3000 government schools had ever fired a teacher for repeated absence. The teacher absence rate in AP is almost exactly equal to the all-India average. 14 Almost every strategy paper for education issued by the Ministry of Human Resource Development (MHRD) emphasizes the need for better teacher training. Examples of both review papers and strategy papers are available at the MHRD website at: http://www.education.nic.in
7
conceptual learning objectives. This in turn, would mean that the teacher is not able to
measure or judge the progress made by students against learning objectives. Another
limitation is that many of the children are first-generation learners with illiterate parents
and teachers have very low expectations of what such children can be expected to learn.15
Finally, there is no standardized testing across Indian schools till the completion of 10th
grade, which means that teachers have very limited information on the performance of
their students against either absolute measures of learning targets or against benchmarks
of relative performance across comparable schools.16
In response to this lack of information on student learning levels (which is believed to
be a problem in both public and private schools), private-sector providers of education
services have created products that provide detailed information on student learning
levels and customized feedback to teachers. The intervention studied in this paper was
developed by Educational Initiatives (one of India’s leading private sector providers of
assessment tools to schools) and consisted of low-stakes tests followed by reports to
teachers on the levels of learning of their students and suggestions on how to use these
reports to improve their teaching. These reports provide information about student
learning by grade-appropriate competence and include sub-district, district, and state
averages against which performance can be benchmarked. Based on their prior
experience with private schools that had sought out and paid for this “diagnostic
assessment” product, Education Initiatives had a strong prior belief that the program
would be able to improve student learning outcomes.
The provision of detailed diagnostic feedback is posited to improve teacher
effectiveness through two channels. The first channel is the provision of new information
and knowledge, which allows teachers to understand the relative strengths and
weaknesses in learning of their students and to realign their efforts to bridge the gaps in
student learning. This information can also be used to target their efforts more
15 It is well established in the education literature that the level of teacher’s expectation for their students is positively correlated with actual learning levels of students (see for example, Good (1987), and Ferguson (2003)) 16 The lack of credible testing till the 10th grade is partly attributable to the "no detention" policy in place in Indian government schools. Thus, while schools do conduct internal annual exams for students, promotion to higher grades is automatic, and there is no external record or benchmarking of the internal tests.

8
effectively (for instance, by grouping together students with similar areas of strengths and
weaknesses).
The second channel posited is that provision of feedback on student performance can
increase the intrinsic motivation (defined as an individual’s desire to do a task for its own
sake (Benabou and Tirole, 2003)) of teachers. Malone and Lepper (1987) integrate
several aspects of motivational theory to identify characteristics of tasks that make them
more desirable in and of themselves. Some of the factors they highlight include: setting
challenges that are neither too difficult nor too easy, being able to set meaningful goals,
receiving of performance feedback, and relating goals to self-esteem. Deci and Ryan
(1985) provide another overview of theories about intrinsic motivation and reach very
similar conclusions. They suggest that intrinsic motivation of employees is positively
linked to the extent of “goal orientation” in the task and the extent to which completion of
the task enhances professional "self perception."
Seen in this theoretical light, the components of the treatment studied in this paper
can be thought of as an attempt to increase the intrinsic motivation of teachers. Thus, if
the provision of performance reports to teachers can increase their “self perception” as
professionals who ought to be able to help their students achieve adequate learning
standards, then this would be a possible channel of positive impact. Similarly, if the
reports help teachers set goals and direct their efforts towards achieving these goals, the
provision of feedback reports could again increase intrinsic motivation through
improving “goal orientation.” Coe (1998) summarizes the literature on the effectiveness
of feedback on performance in general (not just in education) and concludes that
“feedback is found to enhance performance when it focuses attention on, or increases the
saliency of, desired outcomes, or when the information it conveys helps to diagnose
shortcomings in performance.” Both of these features are found in the intervention
studied in this paper.
The contents of the intervention comprised of a baseline test given at the start of the
school year, followed by detailed diagnostic feedback to schools and teachers that
provided each student’s test score by individual question and aggregated by
skill/competence, as well as performance benchmarks for the school, district, and state.
The communication to the schools emphasized that the first step to improving learning
9
outcomes was to have a good understanding of current levels of learning, and that the aim
of these feedback reports was to help teachers improve student learning outcomes.17
Thus, the components of the “feedback” treatment (that were not provided to
comparison schools) included a baseline test, written feedback on performance, the
announcement of an end-of-year test, and regular low-stakes classroom observations of
teaching processes. Since the treatment and control schools differed not only in the
receipt of feedback, but also in the extent of ongoing visits to collect process data, the
treatment effects described in this paper are the effects of “low-stakes feedback and
monitoring” as opposed to “feedback” alone, though we continue to refer to the treatment
schools as “feedback” schools for expositional ease. However, schools and teachers were
also told by the project coordinators from the Foundation that no individually-identifiable
information would be made public. Thus, the focus of the intervention was on targeting
the intrinsic motivation of teachers to be better teachers as opposed to external incentives
(monetary or non-monetary).
The
treatment schools were also told that there would be another external assessment of
learning conducted at the end of the school year to monitor the progress of students in the
school. Finally, enumerators from the Azim Premji Foundation also made six rounds of
unannounced tracking surveys to each of the program schools during September 2005 to
February 2006 (averaging one visit/month) to collect data on process variables including
student attendance, teacher attendance and activity, and classroom observation of
teaching processes.
2.3 Sampling, Randomization, and Data Collection
The school sample was drawn as follows: 5 districts were sampled across each of the
3 socio-cultural regions of AP in proportion to population (Figure 1b). One division was
sampled in each of the 5 districts, following which 10 mandals were randomly sampled in
the selected division. In each of the 50 mandals, 2 randomly selected schools were
17 Samples of communication letters to schools are provided in Appendix A, and samples of the class reports and the feedback reports are provided in Appendix B.
10
provided with the feedback intervention, making for a total of 100 treatment schools that
were a representative sample of rural primary schools in Andhra Pradesh.18
The school year in AP starts in the middle of June, and baseline tests were conducted
in these schools during late June and early July, 2005.
19
In each of the 50 mandals above, an additional six schools were randomly sampled
and these 300 schools served as the comparison schools for evaluation of the feedback
intervention. Since conducting of independent external assessments was a part of the
treatment, these 300 schools did not receive a baseline test and had no contact with
project staff during the school year except for a single unannounced visit to these 300
schools during the school year, during which enumerators collected similar data on
teacher attendance and classroom behavior as were collected in the 100 feedback schools.
After the tests were scored and
school and class reports generated (in July 2005), field coordinators from the Azim
Premji Foundation (APF) personally went to each of the 100 schools selected for the
feedback intervention in the first week of August 2005 to provide them with student,
class, and school performance reports, and with oral and written communication that the
Foundation was providing the schools with feedback and reports to help them improve
learning outcomes, and that the Foundation would be conducting another assessment at
the end of the year to track the progress of students.
At the end of the school year 2005 – 06, 100 out of these 300 schools (2 in each
mandal) were randomly selected to be given the same end-of-year learning assessments
that were given to the 100 feedback schools. These 100 schools were given only a
week's notice before being tested (whereas the 100 feedback schools knew about the tests
from the beginning of the year and were reminded of it by the repeated tracking surveys).
18 As mentioned earlier, this study was conducted in the context of a larger study that evaluated several policy options to improve the quality of primary education in Andhra Pradesh including group and individual teacher performance pay, the use of contract teachers, and the provision of cash block grants to school in addition to the provision of diagnostic feedback to schools. The total study was conducted across 500 schools which were made up of 10 randomly sampled schools in each of 50 randomly sampled mandals. In each mandal, 2 schools were randomly allocated to each of five treatments – one of which was the diagnostic feedback intervention. 19 The selected schools were informed by the government that an external assessment of learning would take place in this period, but there was no communication to any school about any potential intervention at this stage.
11
The tests were conducted in math and language and consisted of two rounds of tests
conducted around two weeks apart.20
Thus, the measures of teacher classroom behavior in the treatment schools are
constructed from six observations over 100 schools over the course of the school year,
while the same measures for the control schools are constructed from one observation
over 300 schools during the school year. While each individual visit is unannounced,
schools in the feedback treatment knew that they were in a study (having received the
communications in Appendix A), while the single such visit among the 300 control
schools was likely to have been a surprise. Measures of student learning outcomes are
obtained from the end-of-year assessments conducted in the 100 feedback schools and in
100 of the 300 control schools. So the comparison schools are as close to “business as
usual” schools as possible, since they comprise a representative set of schools that were
not formally aware of being part of the study during the course of the school year.
3. Results
3.1. Impact of Feedback and Monitoring on Observed Teacher Behavior
The data on teacher behavior is collected from classroom observations conducted by
enumerators, where they sat in classrooms for 20-30 minutes and coded if various
indicators of effective and engaged teaching took place during the time they observed the
classroom. Table 1 (Panel A) compares the feedback schools with the comparison
schools on these measures of teacher behavior, and we find that the feedback schools
(that were also subject to repeated observation) show significantly higher levels of effort
on several measures of effective and engaged teaching, and don’t do significantly worse
on any of these measures. Teachers in the feedback schools were found to be
significantly more likely to be actively teaching, to be reading from a textbook, to be
making students read from their textbook, to address questions to students, and to be
actively using the blackboard. They were also more likely to assign homework, and to
provide guidance on homework to students in the classroom. 20 The first test covered competencies up to that of the previous school year, while the second test (conducted two weeks later) tested skills from the current school year's syllabus. Doing two rounds of testing at the end of each year allowed the testing of more materials, improved power by allowing the smoothing of measurement errors specific to the day of testing, and helped to reduce the extent of sample attrition due to student absence on the day of the test.
12
Since the treatment schools were observed six times during the school year and the
control schools were observed only once, the differences in observed teacher behavior
could partly be due to being in the treatment group and partly due to the repeated nature
of the observations, which might have led teachers to improve their observed
performance over time. We distinguish between these possibilities by running a
regression of an index of teacher activity21 on treatment status and the survey round.22
These superior measures of observed teaching activity in treatment schools could be
reflecting either a genuine increase in teaching activity throughout the school year in
response to the treatment, or a temporary increase in teaching activity when under
observation by enumerators due to teachers’ knowledge that they were in a study
(Hawthorne effects). One way of distinguishing between the two possibilities is to study
the impact of the program on student learning outcomes.
We find that teachers in treatment schools show a 0.11 standard deviation higher level of
activity, and that the impact of the survey round is not significant (Table 2 – Column 1).
Since the first (and only) round of visits in the 300 control schools took place around the
same time as the last three visits in the treatment schools (December 2005 to February
2006), we also restrict the analysis to only the last three survey rounds to ensure
comparability of the time of the year. The results don’t change much, but now the survey
round is significant at the 10% level suggesting that teacher behavior was affected both
by the treatment and by the repeated observation (Table 2 – Column 2).
3.2. Impact of Feedback and Monitoring on Student Test Scores
To study the impact of the low-stakes diagnostic feedback and monitoring on student
learning outcomes, we estimate the equation:
ijkjkkmijkm ZFeedbackT εεεβδα +++⋅+⋅+=
21 The index is an average of the 15 measures of teacher activity coded from the classroom observation conducted by enumerators (these are all the measures in Table 1 except teacher absence and activity, which were measured by scanning the teachers and were not based on the classroom observation instrument). Each individual activity is normalized to have a mean of zero and a standard deviation of one in the control schools, and the index is the mean of the 15 normalized individual activities. 22 Coded from 1 to 6 for the treatment schools and coded 1 for the control schools (since each school was only visited once).

13
The main dependent variable of interest is ijkmT which is the normalized student test
score on math and language tests (at the end of the school year 2005 – 06), where i, j, k,
m denote the student, grade, school, and mandal respectively. All regressions include a
set of mandal-level dummies (Zm) and the standard errors are clustered at the school level.
Since the randomization is stratified and balanced by mandal, including mandal fixed
effects increases the efficiency of the estimate.
The 'Feedback' variable is a dummy at the school level indicating if it was in the
incentive treatment, and the parameter of interest is δ, which is the effect on the
normalized test scores of being in an incentive school. The random assignment of
treatment ensures that the 'Feedback' variable in the equation above is not correlated with
the error term, and the estimate is therefore unbiased.23
The main result we find is that there is no significant effect of the diagnostic feedback
and monitoring on student test scores (Table 2). Not only is the effect insignificant, but
the magnitude of the effect is very close to zero in both math and language tests. The
large sample size and multiple rounds of tests meant that the experiment had adequate
power to detect an effect as low as 0.075 standard deviations at the 10% level and 0.09
standard deviations at the 5% level.
24
It is possible that there were heterogeneous treatment effects among students even
though there was no mean program effect (for instance, teachers may have used the
feedback reports to focus on lower performing students). Figure 2 plots the quantile
treatment effects of the feedback program on student test scores (defined for each
quantile
Thus, the non-effect is quite precisely estimated.
τ as: )()()( 11 τττδ −− −= mn FG where nG and mF represent the empirical
distributions of the treatment and control distributions with n and m observations
respectively), with bootstrapped 95% confidence intervals, and we see that the treatment
effect is close to zero at every percentile of final test scores. Thus, not only did the
program have no impact on average, but it also had no significant impact on any part of
23 Since the conducting of external tests and the salience of the test score was a part of the treatment, it was important that the control schools did not get a baseline test. However, the random assignment also means that a baseline test is not needed for this analysis. 24 Experiments in education typically lack power to identify effects below 0.10 SD (for instance, the treatment effects estimated in the education experiments surveyed in Glewwe, Holla and Kremer (2008) mostly have standard errors above 0.07, and would not have adequate power to detect an effect below 0.10 SD).

14
the student achievement distribution.25
The lack of any impact of the treatment on student test scores (at any point in the
achievement distribution) suggests that the superior measures of teacher effort found
during the classroom observations are likely to have been a temporary response to the
presence of enumerators in the classroom on a repeated basis and the knowledge that the
schools were part of a study (confirming the presence of a Hawthorne effect). Field
reports from enumerators anecdotally confirm that teachers typically became more
attentive when the enumerators entered the school, and also suggest that most teachers in
the feedback schools briefly glanced at the reports at the beginning of the school year, but
did not actively use them in their teaching.
We also test for differential effects by student
gender and caste and find no evidence of any such differences.
3.3. Comparing the Effect of Feedback with and without External Incentives
As mentioned earlier, the evaluation of low-stakes diagnostic feedback and
monitoring was carried out in the context of a larger randomized evaluation of several
policy interventions to improve the quality of primary education in Andhra Pradesh (AP).
Two of these policies consisted of the provision of performance-linked bonuses26
We compare teacher behavior in incentive and feedback schools and find that there
was no difference in teacher behavior as measured by classroom observations across the
two types of schools (Table 1 – Panel B). However, we find that student test scores are
to
teachers in randomly selected schools in addition to the feedback and regular low-stakes
monitoring that was provided to the “feedback” school. These schools received
everything that the feedback schools did, but were also eligible to receive performance-
linked bonus payments to teachers, and are referred to hereafter as “incentive” schools.
The incentive schools received exactly the same amount of measurement, feedback, and
monitoring as the feedback schools and only differ from the feedback schools in that they
are also eligible for performance-linked bonuses.
25 The lack of baseline scores and limited data on student characteristics in the control schools means that we can look at quantile treatment effects in terms of the end-of-year scores, but cannot compute heterogeneous effects by initial scores. However, given the almost identical distributions of test scores in treatment and control schools and the random allocation of schools to treatment and control categories, it is highly unlikely that there would have been differential effects by baseline score. 26 One treatment provided the opportunity to receive performance-based bonuses at the school-level (group incentives), while the other provided the opportunity at the teacher-level (individual incentives)

15
significantly higher in the incentive schools compared to the feedback schools27
The most likely explanation for this apparent paradox is that teachers were able to
change their behavior under observation and that they were particularly likely to do so
under repeated observation by (usually) the same enumerator over the course of the year.
If behavior is affected by being part of a study and by being observed repeatedly (as
suggested by Table 2), it would explain why we find no difference in teacher behavior
between the incentive and feedback schools (where each school was observed six times
over the course of the school year, and where all schools knew they were in a study),
while we do find a difference between these schools and the control schools (which were
observed only once during the year and were never revisited for classroom observations).
. These
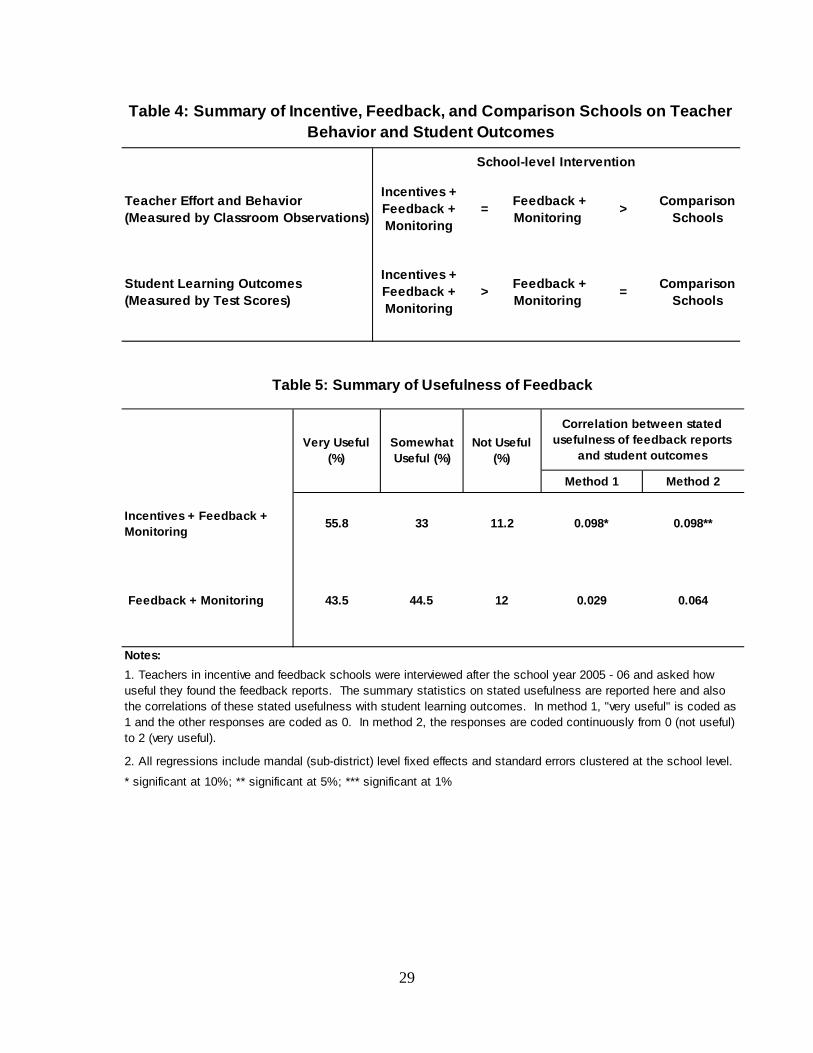
apparently paradoxical results are summarized in Table 4, where we see that evaluating
school performance based on observed teacher behavior would suggest that the incentives
had no impact at all, but that the feedback program had a large positive effect on teacher
behavior. However, if we were to evaluate school performance on the basis of student
learning outcomes, the conclusion would be reversed since it is the incentive schools that
do much better than the feedback schools, while the feedback schools don’t score any
better than the comparison schools that did not receive the baseline test, diagnostic tests
and regular monitoring.
This interpretation is supported by the fact that there is no difference between
feedback and comparison schools in teacher absence, or classroom cleanliness (measures
which cannot be affected after the enumerator arrives in the school), but there is a
significant difference in actions that a teacher is likely to believe constitute good teaching
and which can be modified in the presence of an observer (such as using the blackboard,
reading from the textbook, making children read from the textbook, and assigning
homework). However, the fact that there is no effect of feedback and monitoring on test
scores suggests that while the teachers in the feedback schools worked harder while
27 The details of the results of the performance-pay interventions are presented in a companion paper (Muralidharan and Sundararaman, 2009), but the summary result is discussed here to enable the comparison between feedback with and without incentives.

16
under observation, the low-stakes feedback and monitoring did not induce enough change
in teacher effort over the entire year to influence student learning outcomes.28
The lack of impact of the feedback on test scores raises the question of whether the
diagnostic feedback itself was of any use at all to the teachers. Table 5 shows teachers’
self-reports on how useful they found the diagnostic feedback reports (this was reported
before they knew how well they had performed and is therefore not biased by actual
performance). The same fraction of teachers (around 88%) in both feedback and
incentive schools mention finding the feedback reports to be either somewhat or very
useful.
29
This does not mean that the reports caused the better performance in incentive
schools, but rather suggests that there was useful content in the written diagnostic
feedback reports that the teachers perceived to be useful, which they could have used
effectively if they had wanted to. However, the stated usefulness of the reports positively
predicts test scores only in the incentive schools. This suggests that the teachers in the
feedback schools could have used the reports effectively if they had wanted to, but only
the teachers in the incentive schools seem to have done so. This is consistent with the
finding in our companion paper that the interaction between inputs and incentives is
positive and that the presence of incentives can increase the effectiveness of school inputs
(including pedagogical materials such as diagnostic feedback reports).
But, correlating the self-reports of teachers’ stated usefulness of the reports
with the learning outcomes of their students (Table 5 – columns 4 and 5) shows that the
stated usefulness of the reports was a significant predictor of student test scores only in
the incentive schools and not in the feedback schools.
4. Conclusion
Critics of high-stakes testing in schools point to the potential distortions in teacher
behavior induced by such testing and suggest that low-stakes tests that provide teachers
with feedback on the performance of their students can be more effective in improving
student learning. Such low-stakes diagnostic tests and school performance feedback are 28 Teachers in the incentive schools appear to have increased efforts on dimensions that were not well captured by the classroom observations such as conducting extra classes beyond regular hours (see Muralidharan and Sundararaman, 2009). 29 Though, a significantly larger fraction of teachers in incentive schools report finding the reports “very useful” (56% vs. 44%)
17
key components of several school improvement initiatives, but the empirical evidence to
date on their effectiveness is very limited. A limitation in the literature to date is the
varying degrees to which feedback is combined with coaching and training of teachers,
which makes it difficult to isolate the impact of feedback alone. A second limitation is
the lack of rigorous evidence on the causal impact of such diagnostic feedback.
We present experimental evidence of the impact of a program that provided 100
randomly selected rural primary schools in the Indian state of Andhra Pradesh with a
“feedback” intervention that consisted of an externally administered baseline test,
detailed score reports of students and diagnostic feedback on student performance, an
announcement that the schools would be tested again at the end of the year, and ongoing
low-stakes monitoring through the school year.
There are three main results in this paper. First, the feedback reports had no impact
on student test scores at any percentile of the achievement distribution. Second,
evaluating the impact of the program based on observed classroom behavior would be
biased since we find strong evidence for Hawthorne effects. Third, the feedback reports
had useful content, but were used more effectively by teachers when combined with
performance-linked bonuses for teachers, which provided an incentive for improving
student learning.
Our results do not imply that diagnostic feedback on school and student performance
cannot be useful in improving learning outcomes. Both the self reports of the teachers
regarding the usefulness of the reports and the positive correlations between these reports
and student outcomes in the incentive schools suggest that there was useful content in the
reports. Similarly, the experience of Education Initiatives (the firm that designed the
tests and diagnostic feedback) suggests that schools that demanded and paid for the
diagnostic reports benefited from them (and continued to pay for the reports in
subsequent years). However, our results do suggest that simply following a supply-sided
policy of providing such feedback reports may not be enough to improve student learning
outcomes in the absence of reforms that increase the demand for such tools from teachers
followed by changes in teaching practice that use these tools effectively.
The experiment studied here focused on the use of performance measurement and
feedback as a way of improving teachers’ intrinsic motivation, and was careful to not
18
confound this effect with the extrinsic incentives that may have arisen from making such
assessment information public. However, the results presented in this paper combined
with those in our companion paper on teacher performance pay suggest that modifying
the incentive structures under which teachers operate may induce them to better utilize
educational inputs such as diagnostic feedback reports on student learning. Studying the
relative effectiveness of monetary and non-monetary incentives (such as those created by
publicizing school performance data, or a strong group or peer driven coaching program
to respond to such data) in inducing teachers to make more effective use of inputs such as
diagnostic feedback reports is an open question for future research.
19
References:
Baker, G. (1992). Incentive Contracts and Performance Measurement. Journal of Political Economy 100, 598-614.
Benabou, R. and Tirole, J. (2003). Intrinsic and Extrinsic Motivation. Review of Economic Studies 70, 489-520.
Betts, J., Hahn, Y. and Zau, A. (2010). The Effect of Diagnostic Testing in Math on Student Outcomes. University of California, San Diego.
Boudett, K. P., City, E. and Murnane, R. (2005). Data Wise: A Step-by-Step Guide to Using Assessment Results to Improve Teaching and Learning Harvard Education Press.
Coe, R. (1998). Feedback, Value Added and Teachers’ Attitudes: Models, Theories and Experiments. In Education, Vol. PhD. Durham: University of Durham, 366.
Deci, E. L. and Ryan, R. M. (1985). Intrinsic motivation and self-determination in human behavior. New York: Plenum.
Ferguson, R. F. (2003). Teachers' Perceptions and Expectations and the Black-White Test Score Gap. Urban Education 38, 460 - 507.
Figlio, D. N. and Winicki, J. (2005). Food for Thought: The Effects of School Accountability Plans on School Nutrition. Journal of Public Economics 89, 381-94.
Glewwe, P., Ilias, N. and Kremer, M. (2003). Teacher Incentives. In NBER working paper series; working paper 9671. Cambridge, MA: National Bureau of Economic Research.
Good, T. L. (1987). Two Decades of Research on Teacher Expectations: Findings and Future Directions. Journal of Teacher Education 38, 32 - 47.
Holmstrom, B. and Milgrom, P. (1991). Multitask Principal-Agent Analyses: Incentive Contracts, Asset Ownership, and Job Design. Journal of Law, Economics, and Organization 7, 24-52.
Jacob, B. A. (2005). Accountability, Incentives and Behavior: The Impact of High-Stakes Testing in the Chicago Public Schools. Journal of Public Economics 89, 761-96.
Jacob, B. A. and Levitt, S. D. (2003). Rotten Apples: An Investigation of the Prevalence and Predictors of Teacher Cheating. Quarterly Journal of Economics 118, 843-77.
Koretz, D. M. (2008). Measuring Up: What Educational Testing Really Tells Us. Harvard University Press.
Kremer, M., Muralidharan, K., Chaudhury, N., Rogers, F. H. and Hammer, J. (2005). Teacher Absence in India: A Snapshot. Journal of the European Economic Association 3, 658-67.
Malone, T. W. and Lepper, M. R. (1987). Making Learning Fun: A Taxonomy of Intrinsic Motivations for Learning. In Aptitude, Learning, and Instruction(Eds, Snow, R. E. and Farr, M. J.). Hillsdale, NJ: Lawrence Earlbaum Associates, Inc.
Muralidharan, K. and Sundararaman, V. (2009). Teacher Performance Pay: Experimental Evidence from India. National Bureau of Economic Research Working Paper 15323.
Neal, D. and Schanzenbach, D. (2007). Left Behind by Design: Proficiency Counts and Test-Based Accountability National Bureau of Economic Research Working Paper 13293.
20
Tyler, J. (2010). Evidence Based Teaching? Using Student Test Data to Improve Classroom Instruction. Brown University.
Tymms, P. and Wylde, M. (2003). Baseline Assessments and Monitoring in Primary Schools. In Symposium on Connectable Processes in Elementary and Primary Section. Bamberg, Germany.
Visscher, A. J. and Coe, R. (2003). School Performance Feedback Systems: Conceptualization, Analysis, and Reflection. School Effectiveness and School Improvement 14, 321-349.

21
Appendix A: Details of Communication Letter to Schools
August 2005 To The School Committee/School Headmaster/Teachers XXX Primary School Address As you are aware, your school has been randomly selected for a study on improving learning outcomes in primary schools in Andhra Pradesh. This study is being conducted by the Azim Premji Foundation with the support of the Department of School Education, Government of Andhra Pradesh. The Azim Premji Foundation (APF) is a not-for-profit organization based in Bangalore and works with many state governments in India running various schemes to improve primary education. The first step in improving learning outcomes is to identify the level of student learning in various competencies and to understand their strengths and weaknesses. This was the objective of the tests conducted a few weeks ago in your school. These tests were developed after careful analysis of the competencies that children should have at various stages of educational development and were designed to provide an accurate picture of learning-levels. A key feature of these tests is that they are administered independently by the Foundation with a view to providing detailed feedback on how to improve learning levels in government primary schools. We have analyzed the data from the performance of the children in your school and are now in a position to provide the following information to you:
1. Each child’s original answer paper, with the assessment code assigned by the evaluator to each question.
2. A test scorecard that shows the evaluation criteria for each question, the meaning of each code, and the marks assigned to each code.
3. A detailed question by question summary report of the performance of each child in each class for both subjects (Telugu and Maths).
4. This question summary report is organized by skill, and the questions corresponding to each skill are shown along with each child’s summary performance in each skill.
5. We also provide a descriptive summary of the areas of relative strength and weakness of children in your school
6. In addition to data on the performance of the children in your school, you are also provided with data on the average performance of the children in your district and in the state.
A short note on how these results can be used is attached along with the
assessment reports. The note also includes some tips and suggestions with regard to how

22
to improve the skill levels of children in your school and on how to develop teaching plans for different children in your school.
We hope that this assessment and report will help you in improving the learning
outcomes of children in your school. We will conduct another similar test at the end of the school year (in March/April 2006) to track the progress of the various students and expect that all enrolled students will take the test. If you have any questions regarding the test, the assessments, or the reports, you may contact either the Mandal Education Officer of the Government of Andhra Pradesh or the Mandal Coordinator of the Azim Premji Foundation.
We wish you all the best for your teaching activities over the school year.
XXX XXX District Education Officer Project Manager Government of Andhra Pradesh Azim Premji Foundation
23
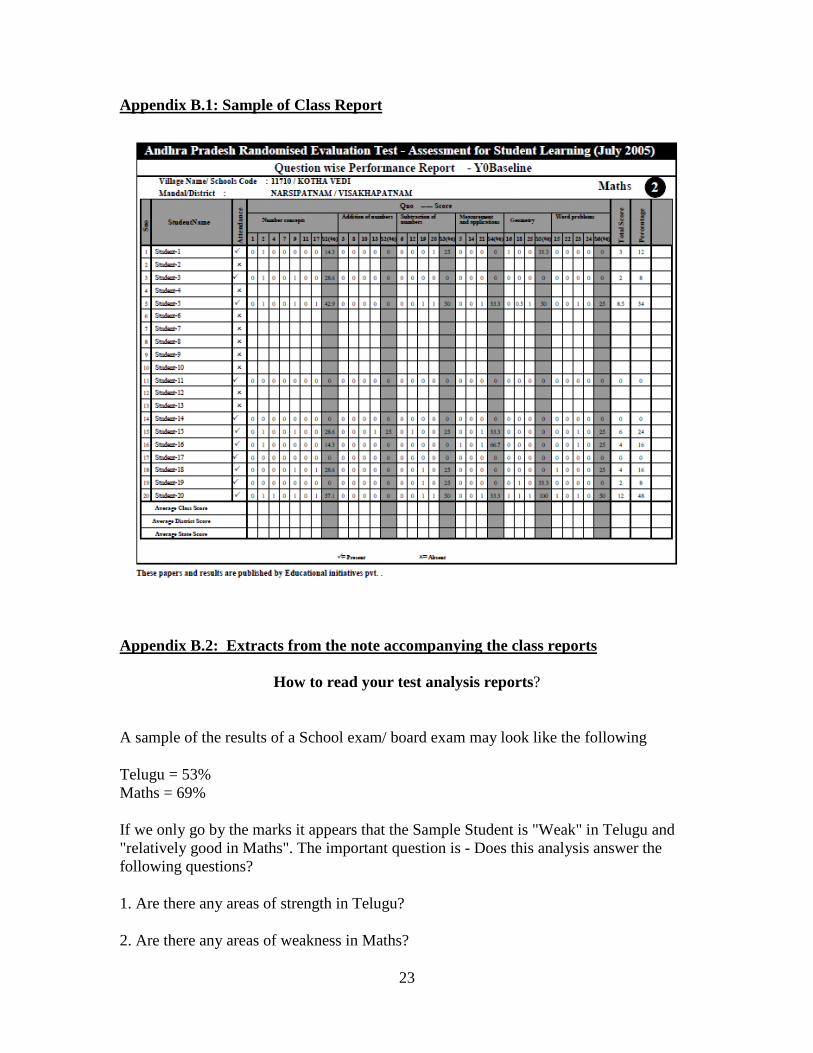
Appendix B.1: Sample of Class Report
Appendix B.2: Extracts from the note accompanying the class reports
How to read your test analysis reports?
A sample of the results of a School exam/ board exam may look like the following
Telugu = 53% Maths = 69%
If we only go by the marks it appears that the Sample Student is "Weak" in Telugu and "relatively good in Maths". The important question is - Does this analysis answer the following questions?
1. Are there any areas of strength in Telugu?
2. Are there any areas of weakness in Maths?

24
3. Is 69% good when compared to other students across the whole state?
4. Which are the concepts that the student has not understood in the portion covered and which are the concepts the student has understood and internalized?
5. Why is the Sample Student making the mistakes s/he is making?
6. What are the skills in which all the students in the class are doing well and what are the areas/skills they still need to improve?
The answers to all these above questions are given in the reports given to you. By using these reports, as a teacher you will be able to
• Develop appropriate expectations for your students. • Recognize the strengths and weaknesses of your students, and • Understand the degrees of difficulty students have with different concepts
Appendix B.3: Template for Diagnostic Feedback Letters
Andhra Pradesh Randomized Evaluation Test - Assessment for Student Learning (July 2005)
Village Name (xxx)/School Code (yyy)
This letter provides feedback on the performance of children and entails some recommendations that can help students in your school improve their learning. MATHEMATICS Maths Class 2 The strongest skill in Class 2 was found to be ‘Number Concepts’. This means that children in your school are good at identifying, counting and comparing numbers. The weakest skill in Class 2 was found to be ‘Measurement and Application’. This means that children in your school have not understood the meaning of different attributes like heavy/light, tall/short etc. To correct this we recommend the following: 1. Make use of teaching aids like Calendar, Rhymes which teach weekdays, months etc. 2. Show children currency notes and coins in the classroom. 3. Try using visual clues like pictures, or use nearby surroundings in the school premise. Maths Class 3 The strongest skill in Class 3 was found to be ‘Number Concepts’. This means that children in your children are strong in identifying/ naming numbers up to 1000 and have a good understanding of ordering, place value, number patterns etc compared to the rest of the state. The weakest skill in Class 3 was found to be ‘Geometry, Shapes and

25
Pattern’. This means that the students have a weak understanding of space and shape, and are weak in identifying basic plane shapes, geometrical patterns etc. compared to the rest of the state. To correct this we recommend the following: 1. Make use of objects in the school, shape cut outs, drawings etc. to familiarize with shapes. 2. Encourage playing with tiles of different shapes, building blocks etc. 3. Make use of the names of shapes as much as possible in day-to-day conversations. Maths Class 4 The strongest skill in Class 4 was found to be ‘Addition and Subtraction’. This means that the students are strong in computation problems based on addition/ subtraction of numbers up to 3 digits - both without and with regrouping compared to the rest of the state. The weakest skill in Class 4 was found to be ‘Word Problems’. This means that the students are weak in solving basic word problems involving all four operations, ordering etc. and lack the ability to apply mathematics to real life problems compared to the rest of the state. To correct this we recommend the following: 1. Expose students to situations and problems they can identify with. 2. Encourage students to make up realistic problems for a given fact. 3. Encourage students to read more to improve language. Maths Class 5 The strongest skill in Class 5 was found to be ‘Operations on Whole numbers’. This means that the students have a good understanding of all four basic operations and the relation between them and are strong in computations involving one or more operations compared to the rest of the state. The weakest skill in Class 5 was found to be ‘Fraction Concepts’. This means that the students have a weak understanding of the basic concepts of fractions. To correct this we recommend the following: 1. Reinforce the concept of fractions through a variety of real-life situations like dividing fruits, paper folding and shading, etc. 2. Use paper folding to explain concepts like equivalent fractions, etc. Telugu: Telugu Class 2 The strongest skill in Class 2 was found to be ‘Follows simple instructions’ [ ]. This means that children in your school are able to follow simple commands and instructions (listening skill). The weakest skill in Class 2 was found to be ‘Writes simple words either in response to dictations or simple questions’ [ ]. This means that children in your school are weak in constructing words. They may be familiar with the letters, but face difficulty in writing simple 2-3 letter words. To correct this we recommend the following: 1. Stress on Phonics. 2. Use teaching aids such as flash cards, flip charts etc. to teach simple words. 3. Use worksheets

26
Telugu Class 3 The strongest skill in Class 3 was found to be ‘Recognises and writes letters, knows starting sound and alphabetical sequence’. This means that are strong at recognising and writing letters as per their sound and alphabetical sequence compared to rest of the state. The weakest skill in Class 3 was found to be ‘Understands simple story narrations and answers questions’. This means that the students are weak at understanding the meaning of words/sentences in simple stories that are read out and are weak in answering related questions compared to rest of the state. To correct this we recommend the following: 1. Narrate simple stories with pictures once a week. 2. Narrate simple stories with actions and ask oral questions. 3. Narrate simple stories with intonation and use worksheets for comprehension exercises. Telugu Class 4 The strongest skill in Class 4 was found to be ‘Reading/Writing of words’. This means that the students are strong at recognising and writing names of common objects, feelings and actions compared to rest of the state. The weakest skill in Class 4 was found to be ‘Constructs more complex sentences independently’. This means that they are weak at constructing complex sentences using conjunctions independently compared to rest of the state. To correct this we recommend the following: 1. Use sentence jumbles for practice. 2. Ask children to make 2 sentences with names of things in the room and then join them into one sentence. 3. Use 'Gap filling'/'Jumbled sentence' exercises in worksheets. Telugu Class 5 The strongest skill in Class 5 was found to be ‘Knows alphabetical sequence in any form’. This means that the students are strong at sequencing letters/ words alphabetically compared to rest of the state. The weakest skill in Class 5 was found to be ‘Comprehension. This means that the students are weak at reading and understanding stories/passages and reproducing statements from the passages compared to rest of the state. To correct this we recommend the following: 1. Use direct questions on short texts of 4-5 sentences on wild life, nature, places. 2. Ask direct questions on translations of Panchatantra. 3. Use simple questions on short passages in worksheet. We hope that the above will help you and your students to achieve better results. With warm regards,

27
Process Variable (Activities performed by Teachers unless recorded otherwise)
Feedback Schools
Comparison Schools
p-Value (H0: Diff = 0)
"Feedback and
Incentive" Schools
Feedback Schools
p-Value (H0: Diff = 0)
Teacher Absence 22.5 20.6 0.342 24.9 22.5 0.21
Actively Teaching 49.9 40.9 0.012** 47.5 49.9 0.46
Clean & Orderly Classroom 59.5 53.5 0.124 60.5 59.5 0.772
Giving a Test 26.6 27.6 0.790 26.6 26.6 0.993
Calls Students by Name 78.1 78.6 0.865 78.5 78.1 0.878
Addresses Questions to Students 63.2 58.1 0.087* 62.8 63.2 0.871
Provides Individual/Group Help 35.7 31.9 0.263 37.1 35.7 0.625
Encourages Participation 37.0 37.0 0.996 37.6 37.0 0.835
Reads from Textbook 56.1 41.9 0.000*** 52.8 56.1 0.299
Makes Children Read From Textbook 60.0 45.6 0.000*** 57.8 60.0 0.43
Active Blackboard Usage 49.1 40.9 0.014** 50.0 49.1 0.764
Assigned Homework 37.2 29.2 0.034** 39.5 37.2 0.518
Provided Homework Guidance 32.9 18.0 0.000*** 33.6 32.9 0.849
Provided Feedback on Homework 27.0 13.1 0.000*** 24.7 27.0 0.478
Children were Using a Textbook 67.4 60.8 0.026** 66.0 67.4 0.559
Children Asked Questions in Class 37.0 42.6 0.069* 37.1 37.0 0.958
Teacher Was in Control of the Class 52.4 51.2 0.706 51.2 52.4 0.694
1. The feedback and "feedback plus incentive" schools were each visited by a project coordinator around once a month for a total of 6 visits between September 05 and March 06, and the measures of teacher behavior reported here were recorded during classroom observations conducted during these visits. To construct the teacher behavior variables for "business as usual" comparison schools, 300 extra schools were randomly sampled (6 in each mandal) and the same surveys were conducted to measure processes in a 'typical' school. Each of these schools was visited only once (at an unannounced date) during the entire year.
2. Each round of classroom observation is treated as one observation and the standard errors for the t-tests are clustered at the school level (i.e. correlations across visits and classrooms are accounted for in the standard errors)
* significant at 10%; ** significant at 5%; *** significant at 1%
Table 1: Process Variables (Based on Classroom Observation)
Panel A Panel B
Feedback Schools Versus Comparison Schools (All figures in %)
Feedback Schools Versus "Feedback and Incentives" Schools (All figures in %)
Notes:

28
All Rounds Last 3 Rounds only
[1] [2]
Feedback Schools 0.107 0.104(0.053)** (0.044)**
Rounds 0.013 0.04(0.010) (0.022)*
Observations 4132 2758R-squared 0.02 0.02Notes:
Table 2: Differences in Class Room Observation Process Variables Between Feedback and Control Schools
2. The reason for the distinction between "All Rounds" and the "Last 3 Rounds Only" is that the timing of data collection in the control schools corresponded to the last 3 rounds of data collection in the treatment schools. Thus column 2 represents data collected in a comparable time of the year in both treatment and control schools.
1. The dependent variable is the normalised index of classroom process variables. The index is the mean of fifteen normalized process variables from class room observation in Table 1 (all except the first two, which are measured differently). The normalisation of the index is with respect to the distribution in the control schools during the first visit.
3. All regressions include standard errors clustered at the school level.* significant at 10%; ** significant at 5%; *** significant at 1%
Dependent Variable = Normalized Index of Class Room Activity
Combined Math Telugu (Language)
[1] [2] [3]
Feedback Schools 0.002 -0.018 0.022(0.045) (0.048) (0.044)
Observations 48791 24386 24405R-squared 0.108 0.112 0.111Notes:
2. All regressions include mandal (sub-district) level fixed effects and standard errors clustered at the school level.* significant at 10%; ** significant at 5%; *** significant at 1%
Table 3: Impact of Diagnostic Feedback and Low-Stakes Monitoring on Student Test Score Performance
Dependent Variable = Normalized End of Year Student Test Scores
1. The sample includes the feedback schools and the 100 comparison schools that also received the same test as the feedback schools at the end of the school year 2005 - 06. The former had a baseline test, diagnostic feedback on the baseline test, regular low-stakes monitoring to measure classroom processes, and advance notice about the end of year assessments. The comparison schools had none of these.
29
Teacher Effort and Behavior (Measured by Classroom Observations)
Incentives + Feedback + Monitoring
= Feedback + Monitoring > Comparison
Schools
Student Learning Outcomes (Measured by Test Scores)
Incentives + Feedback + Monitoring
> Feedback + Monitoring = Comparison
Schools
Table 4: Summary of Incentive, Feedback, and Comparison Schools on Teacher Behavior and Student Outcomes
School-level Intervention
Method 1 Method 2
Incentives + Feedback + Monitoring 55.8 33 11.2 0.098* 0.098**
Feedback + Monitoring 43.5 44.5 12 0.029 0.064
Notes:
* significant at 10%; ** significant at 5%; *** significant at 1%
2. All regressions include mandal (sub-district) level fixed effects and standard errors clustered at the school level.
Very Useful (%)
Somewhat Useful (%)
Not Useful (%)
Correlation between stated usefulness of feedback reports
and student outcomes
Table 5: Summary of Usefulness of Feedback
1. Teachers in incentive and feedback schools were interviewed after the school year 2005 - 06 and asked how useful they found the feedback reports. The summary statistics on stated usefulness are reported here and also the correlations of these stated usefulness with student learning outcomes. In method 1, "very useful" is coded as 1 and the other responses are coded as 0. In method 2, the responses are coded continuously from 0 (not useful) to 2 (very useful).
30
Figure 1a: Andhra Pradesh (AP)
Figure 1b: District Sampling (Stratified by Socio-cultural Region of AP)
6263Infant Mortality (per 1000)
25.325.2Teacher Absence (%)
60.564.8Literacy (%)
95.395.9Gross Enrollment (Ages 6-11) (%)
APIndia
6263Infant Mortality (per 1000)
25.325.2Teacher Absence (%)
60.564.8Literacy (%)
95.395.9Gross Enrollment (Ages 6-11) (%)
APIndia

31
Figure 2: Quantile (Percentile) Treatment Effects
-2-1
01
2N
orm
aliz
ed T
est S
core
0 .2 .4 .6 .8 1Percentile of Endline Score
Control Schools Treatment Schools95% Confidence Interval Difference