The impact of coniferous afforestation and deforestation ... · Acknowledgements With thanks to...
55
The impact of coniferous afforestation and deforestation on the chemical properties of soil BSc Geography Emma Verey 200463461 Word count: 9828
Transcript of The impact of coniferous afforestation and deforestation ... · Acknowledgements With thanks to...

The impact of coniferous afforestation and deforestation
on the chemical properties of soil
BSc Geography
Emma Verey
200463461
Word count: 9828

Acknowledgements
With thanks to Gareth Browning of the Forestry Commission, and Judith and Andy
Weston, tenant farmers of the National Trust land adjacent to Ennerdale forest, for
granting me permission to collect soil samples. Many thanks to all laboratory staff for
their help and advice when analysing the soil. Thanks also to my dissertation tutor, Pippa
Chapman for all her valuable help and support, my DSG, and my parents for helping me
collect all 50 soil samples!
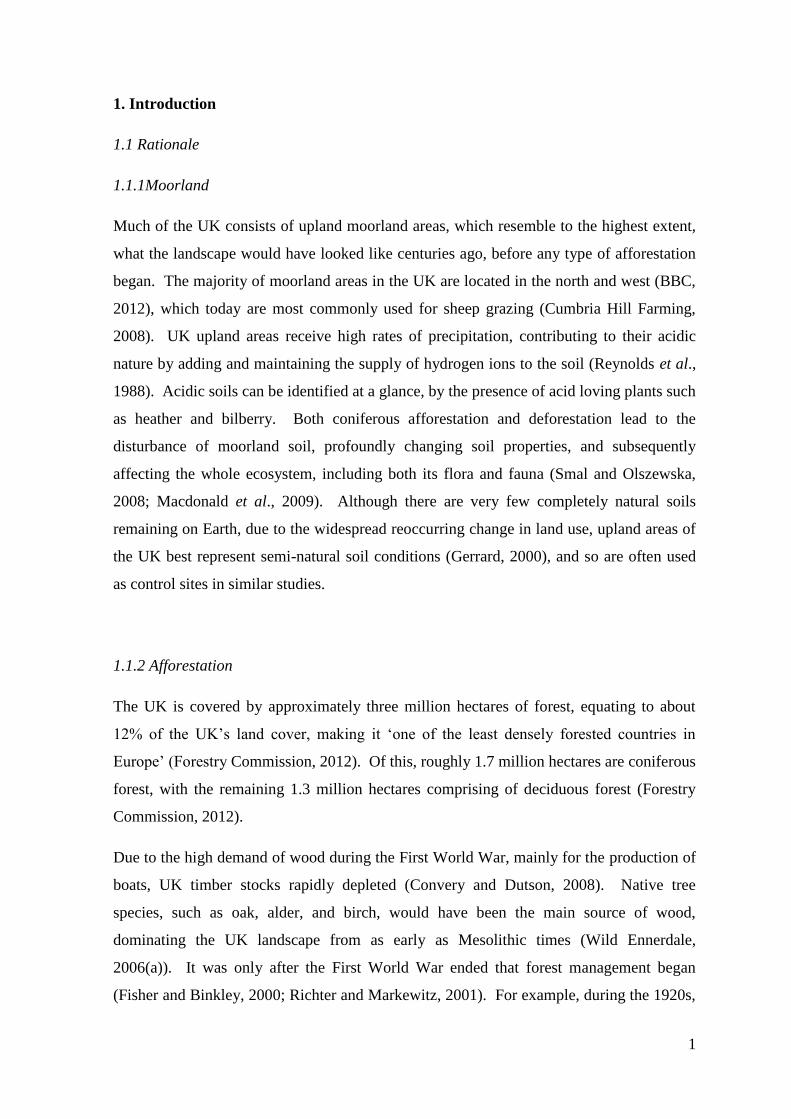
Abstract
This study was undertaken in Ennerdale, Cumbria, in the west of the Lake District, UK.
The rewilding scheme ‘Wild Ennerdale’ ultimately aims to return previously coniferous
afforested land back to its semi-natural wild origins, which in turn should improve
deteriorated soil quality. Much of the UK upland moorlands were afforested with fast
growing, high yielding exotic coniferous tree species, such as Sitka spruce, to meet the
high demand for timber during the First World War. This led to a significant reduction in
native, slower growing deciduous tree species. To establish whether an improvement in
the chemical properties of soil is gained during the initial stages of ‘Wild Ennerdale’, the
effects of both coniferous afforestation and deforestation are to be examined, with a
moorland site in Ennerdale acting as a control site. Soil acidity, comprising of soil pH and
exchangeable acidity; exchangeable base cations calcium, magnesium, potassium, and
sodium; and available nitrogen, are the soil chemical properties specifically examined. All
chemical properties (bar exchangeable magnesium and sodium), were found to decrease
from their initial state after coniferous afforestation. Coniferous deforestation was then
found to exacerbate these poor soil conditions, despite an overall increase in soil pH.
Overall, it could be established that after a period of approximately ten years, coniferous
deforestation in Ennerdale actually led to the deterioration of soil quality. Coniferous
deforestation is only the first phase of ‘Wild Ennerdale’, however, so the effect the
reforestation of native, broadleaf deciduous species has on soil chemical properties should
be examined in the future. This would truly establish whether ‘Wild Ennerdale’ is in fact
improving soil quality in terms of its soil chemical properties. This knowledge would be
essential in providing reasoning for the initiation of similar schemes to take place in the
future.

Contents Page
Page
number
1. Introduction 1
1.1 Rationale 1
1.1.1 Moorland 1
1.1.2 Afforestation 1
1.1.2.1 The effect of coniferous afforestation on .
.. the chemical properties of soil
2
1.1.3 Deforestation 4
1.1.3.1 The effect of coniferous deforestation on ..
... the chemical properties of soil
5
1.1.4 Summary 6
1.2 Aim 6
1.3 Objectives 6
2. Methodology 7
2.1 Study area 7
2.2 Study sites 9
2.3 Soil collection 12
2.4 Lab analysis 12
2.4.1 Analysis using field moist soil 12
2.4.2 Analysis using dry soil 13
2.5 Statistical analysis 13
3. Results
3.1 Basic soil characteristics and LOI 16
3.2 Soil pH variations between sites 17
3.3 Exchangeable acidity variations between sites 18
3.4 Exchangeable base cation variations between sites 19
3.5 Base saturation variations between sites 21
3.6 Available nitrogen variations between sites 21
3.7 Correlation between pH and exchangeable base cations 23
4. Discussion
4.1 Soil acidity; soil pH and exchangeable acidity 25
4.1.1 Moorland 25
4.1.2 Forest 25
4.1.3 Deforested 27
4.2 Exchangeable base cations 27
4.2.1 Soil texture 27
4.2.2 Cation exchange capacity and base saturation 28
4.2.3 Moorland 29
4.2.4 Forest 29
4.2.5 Deforested 30
4.3 Correlation between soil pH and exchangeable base cations 31
4.4 Available nitrogen 32
4.1.1 Moorland 32

4.1.2 Forest 33
4.1.3 Deforested 33
4.5 Limitations 34
5. Conclusion 36
6. References 39
7. Appendix 43
Appendix 1 Soil texture ‘feel’ test 43
Appendix 2 Sampling selection grids 44
Moorland 44
Forest 45
Deforested 46
Appendix 3 Raw data 47
Moorland 47
Forest 48
Deforested 49

Lists of figures and tables
Figures
Figure 2.1 View of Ennerdale, including Ennerdale Water.
Figure 2.2 (a) Location of Ennerdale within Cumbria, (b) location of Cumbria within
the UK.
Figure 2.3 Map from Gareth Browning of the Forestry Commission, to show deforested
areas within Ennerdale. Additional coloured squares represent the three
sites used.
Figure 2.4 Photographs of each site; (a) moorland, (b) forest, and (c) deforested.
Figure 3.1 Average loss on ignition at the three study sites.
Figure 3.2 Box plot to show range, interquartile range and median for soil pH at the
three study sites.
Figure 3.3 Average exchangeable acidity components at the three study sites.
Figure 3.4 Average exchangeable base cations calcium and magnesium at the three
study sites.
Figure 3.5 Average exchangeable base cations potassium and sodium at the three study
sites.
Figure 3.6 Ammonium concentration at the three study sites.
Figure 3.7 Nitrate concentration at the three study sites.
Figure 3.8 Correlation between soil pH and exchangeable base cations calcium and
magnesium.
Figure 3.9 Correlation between soil pH and exchangeable base cations potassium and
sodium.
Figure 3.10 Correlation between soil pH and base saturation.
Figure 4.1 Diagram taken from Brady and Weil, (2008) to show the relationship
between soil pH and exchangeable cations held on to the cation exchange
sites within a soil.
Tables
Table 2.1 Site descriptions and classification.
Table 2.2 Summary statistical test table to determine the correct statistical test to be
used depending on data normality.
Table 3.1 Basic soil characteristics.
Table 3.2 Base saturation at all three study sites.
1
1. Introduction
1.1 Rationale
1.1.1Moorland
Much of the UK consists of upland moorland areas, which resemble to the highest extent,
what the landscape would have looked like centuries ago, before any type of afforestation
began. The majority of moorland areas in the UK are located in the north and west (BBC,
2012), which today are most commonly used for sheep grazing (Cumbria Hill Farming,
2008). UK upland areas receive high rates of precipitation, contributing to their acidic
nature by adding and maintaining the supply of hydrogen ions to the soil (Reynolds et al.,
1988). Acidic soils can be identified at a glance, by the presence of acid loving plants such
as heather and bilberry. Both coniferous afforestation and deforestation lead to the
disturbance of moorland soil, profoundly changing soil properties, and subsequently
affecting the whole ecosystem, including both its flora and fauna (Smal and Olszewska,
2008; Macdonald et al., 2009). Although there are very few completely natural soils
remaining on Earth, due to the widespread reoccurring change in land use, upland areas of
the UK best represent semi-natural soil conditions (Gerrard, 2000), and so are often used
as control sites in similar studies.
1.1.2 Afforestation
The UK is covered by approximately three million hectares of forest, equating to about
12% of the UK’s land cover, making it ‘one of the least densely forested countries in
Europe’ (Forestry Commission, 2012). Of this, roughly 1.7 million hectares are coniferous
forest, with the remaining 1.3 million hectares comprising of deciduous forest (Forestry
Commission, 2012).
Due to the high demand of wood during the First World War, mainly for the production of
boats, UK timber stocks rapidly depleted (Convery and Dutson, 2008). Native tree
species, such as oak, alder, and birch, would have been the main source of wood,
dominating the UK landscape from as early as Mesolithic times (Wild Ennerdale,
2006(a)). It was only after the First World War ended that forest management began
(Fisher and Binkley, 2000; Richter and Markewitz, 2001). For example, during the 1920s,
2
due to the resulting widespread clearance of deciduous forest, the newly established
Forestry Commission, rapidly acquired and managed previous upland grassland sites
across the UK as coniferous plantation forests (Neal et al., 1992; Wild Ennerdale, 2006(a);
Convery and Dutson, 2008; Berthrong et al., 2009). This rapid increase in coniferous
afforestation was dominated by the plantation of the faster growing, high yielding, exotic
coniferous tree species such as Sitka spruce, which would have quickly become dominant
(Neal et al., 1992; Convery and Dutson, 2008). By the mid 1990s, there had been a
dramatic increase in coniferous forest cover not only in the UK, but throughout the world
(Fisher and Binkley, 2000; Macdonald et al., 2009). Despite the Forestry Commission’s
aim to substantially increase timber production and sustain yields for the future, coniferous
afforestation has consequently led to significant changes in soil chemistry across an
ecosystem level (Reynolds et al., 1988; Oxbrough et al., 2006; Convery and Dutson,
2008).
1.1.2.1 The effect of coniferous afforestation on the chemical properties of soil
Soil acidity; soil pH and exchangeable acidity
Land use change leads to extensive alterations in the chemical properties of soil,
particularly soil acidity (Strobel et al., 2001; Olszewska and Smal, 2008; Macdonald et al.,
2009). Although much of the UK upland environment is already acid sensitive, acute
changes in vegetation cover have been found to significantly increase soil acidity (Neal et
al., 1992; Grieve, 2001). In turn, this acidification has affected numerous soil chemical
properties, such as the regulation and subsequent availability of essential elements, directly
influencing plant growth (Cresser et al., 1993; Ashman and Puri, 2002; Brady and Weil,
2008).
The presence of a coniferous tree canopy has lead to considerable acidification and long
term changes in soil chemistry, due to the capture of atmospheric pollutants (Neal et al.,
1992; Forest Authority, 1998; Grieve, 2001; Richter and Markewitz, 2001; Berthrong et
al., 2009). The scavenging of acidic pollutants leads to their absorption by trees, and
storage in soil, where they might subsequently be leached into the groundwater, resulting
in significant implications for water quality too (Forest Authority, 1998; Ashman and Puri,
2002; Brown et al., 2010). The widespread input of highly acidic pine needles onto the
forest floor creates an extremely acidic litter, aiding soil acidification (Neal et al., 1992;
Fisher and Binkley, 2000; Gerrard, 2000). The weathering of minerals can also contribute

3
to soil acidity (Strobel et al., 2001). The more acidic the soil, the higher the concentration
of hydrogen ions, which in turn causes the release of aluminium ions, highly toxic to both
plants and animals (Goulding and Stevens, 1988; Rowell, 1994; Brady and Weil, 2008).
Soil acidity is strongly related to other soil chemical properties, predominantly the regular
leaching of soil minerals (Cresser et al., 1993).
Exchangeable base cations
Coniferous afforestation often takes place on poor, particularly wet soil such as peat or
gley, whereas better soil is used for agricultural crop production (Forest Authority, 1998;
Fisher and Binkley, 2000). As such, forest soils often contain many stones, which
although act as a major primary source of nutrients when weathered, also increase drainage
due to the formation of large pore spaces (White, 1997; Fisher and Binkley, 2000; Gerrard,
2000; Richter and Markewitz, 2001). The weathering of rock provides by far the largest
source of base cations to the soil, however, the presence of a tree canopy again leads to the
capture of atmospheric cations which also contribute to base cation reserves in the soil,
accumulating over time (Johnson and Lindberg, in Adriano and Havas, 1989; Richter and
Markewitz, 2001; Berthrong et al., 2009). The often steep slopes on which afforestation
may take place can also influence drainage rates, leading to the leaching of base cations
out of a soil, enhanced by soil acidity which ultimately dominates soil chemistry and the
processes occurring within the soil (Reynolds et al., 1988; Cresser et al., 1993; Fisher and
Binkley, 2000).
Nutrient cycling processes give soil under forests unique characteristics compared to other
soils (Fisher and Binkley, 2000). Deep tree roots are important for nutrient uptake,
transporting and recycling nutrients to upper soil horizons, where a high demand for base
cations is essential for tree growth and survival (Forest Authority, 1998; Fisher and
Binkley, 2000; Grieve, 2001; Berthrong et al., 2009). Tree roots can also be beneficial in
stabilising the soil by providing physical support, and combined with the accumulation of
leaf litter and consequent production of organic matter, tend to prevent the erosion of soil,
in turn conserving base cations (Forest Authority, 1998; Fisher and Binkley, 2000).
Available nitrogen
The main source of nitrogen to the soil is from atmosphere, where firstly it has to be
‘fixed’ into a form available to plants (White, 1997; Gerrard, 2000). Mineralisation is the

4
process by which nitrogen is converted from its organic form, to inorganic forms that can
be readily taken up by plants (Bardgett, 2005; Chapman, in Holden, 2008). Plants
therefore take up nitrogen in the forms of ammonium and nitrate, however, nitrite is toxic
to plants even at small concentrations (Brady and Weil, 2008). The process of nitrification
(converting ammonium (NH4+) to nitrite (NO2
-) and finally to nitrate (NO3
-)), has been
found to lead to the acidification of soil, via the production of hydrogen ions (Richter and
Markewitz, 2001; Bardgett, 2005; Brady and Weil, 2008). Usually the more acidic the
soil, the lower the supply of macronutrients (Cresser et al., 1993; Chapman, in Holden,
2008). The rate at which nitrification occurs, is controlled by important soil characteristics
such as aeration and pH. Nitrogen is an essential macronutrient required in large quantities
by plants, which is why coniferous afforestation is known for the depletion of available
nitrogen reserves within the soil (Rowell, 1994; Richter and Markewitz, 2001; Brady and
Weil, 2008).
1.1.3 Deforestation
In tropical areas, deforestation of any forest type is very much recognised as having
negative impacts on the environment, especially the soil, and significantly contributing to
the increase in atmospheric carbon dioxide, and therefore global warming (Saikh et al.,
1998; Malhi et al., 2002). Although overall decreasing since the beginning of the century,
deforestation rates of the Amazon rainforest for example, still resulted in a loss of around
6,000 square kilometres of forest between 2000 and 2006 (Butler, 2010). Despite
deforestation contributing largely to global warming in the tropics, this study considers
solely the effects of UK coniferous deforestation on the chemical properties of soil.
In the UK, coniferous deforestation has substantially increased in recent decades. With a
reduction in the demand for UK timber supplies, due to the high production from European
countries, there is less pressure to produce timber, so fast growing coniferous species need
not dominate UK forests (Wild Ennerdale, 2006(a)). This has allowed rewilding schemes
such as ‘Wild Ennerdale’ to take place, reintroducing more natural, native deciduous
species to the UK landscape in an attempt to return it to its original ‘wild’ roots, and in
turn improve soil conditions (Wild Ennerdale, 2006(a)).

5
Coniferous deforestation is likely to increase further over the next decade, particularly in
areas such as mid Wales and Scotland, as coniferous afforestation plantations which took
place post Second World War are reaching peak maturity (Anderson et al., 1990; Neal et
al., 1992). An increase in the desire for recreational activities within forests has also
prompted the change in forest type composition, from the uniform coniferous plantations,
to the more natural, slow growing picturesque deciduous forests (Wild Ennerdale,
2006(a)).
1.1.3.1 The effect of coniferous deforestation on the chemical properties of soil
Soil acidity; soil pH and exchangeable acidity
The removal of trees has been recognised to decrease soil acidity, due in large, to the
dramatic reduction in the capture of acidic atmospheric pollutants, and organic matter
content (Neal et al., 1992; Cresser et al., 1993; Smal and Olszewska 2008). This increase
in soil pH should subsequently reduce the amount of aluminium ions in the soil, and
technically lead to an increase in exchangeable base cations, because aluminium will no
longer dominate cation exchange sites (Rowell, 1994). However, other more dominant
processes occurring in the soil often lead to differing results.
Exchangeable base cations
Despite coniferous deforestation leading to a reduction in soil acidity, and so increasing
the potential for more exchangeable base cations, other factors such as leaching play a
huge role in the loss of exchangeable base cations in the soil (Gerrard, 2000). As
deforestation leaves the soil exposed, precipitation leads to significant amounts of
leaching, which combined with a reduction in leaf litter, and therefore organic matter
content, result in the loss of exchangeable base cations from a soil (Gerrard, 2000; Ashman
and Puri, 2002). The harvesting of trees has the most significant effect on exchangeable
base cation reserves in the soil, as a significant amount are stored in the wood of trees, so
are removed when the tree is (Reynolds and Stevens, 1998).
Available nitrogen
Again, uptake by plants and leaching play a huge role in the loss of available nitrogen from
the soil. Despite the ability of positively charged ammonium ions (NH4+) being held on
cation exchange sites in the soil, the negatively charged nitrate (NO3-) and nitrite (NO2
-)
6
ions are not, making them highly susceptible to leaching (Cresser et al., 1993; Rowell,
1994; Bardgett, 2005; Brady and Weil, 2008).
1.1.4 Summary
In recent decades, the realisation that coniferous afforestation leads to a deterioration in
soil quality has been widely recognised. The initiation of rewilding schemes such as ‘Wild
Ennerdale’, ultimately aim to undo the effects of coniferous afforestation, by firstly
deforesting coniferous plantations, and eventually reforesting these areas with natural,
native deciduous species, in an attempt amongst others to improve soil quality. This study
primarily aims to analyse whether the initial stages of ‘Wild Ennerdale’ are working, by
accessing the effects coniferous deforestation has on the chemical properties of soil. This
is imperative in recognising the success of this rewilding scheme, and possible existence of
schemes like this in the future. Previous studies have rarely examined the effects of both
coniferous afforestation and deforestation within the same area, which also makes this
study somewhat unique.
1.2 Aim
To determine the impact coniferous afforestation and deforestation has on the chemical
properties of soil.
1.3 Objectives
To evaluate the effects of coniferous afforestation and deforestation on soil acidity;
soil pH and exchangeable acidity.
To examine the effects of coniferous afforestation and deforestation on
exchangeable base cations; calcium, magnesium, potassium, and sodium.
To determine the effects of coniferous afforestation and deforestation on available
nitrogen.
7
2. Methodology
2.1 Study area
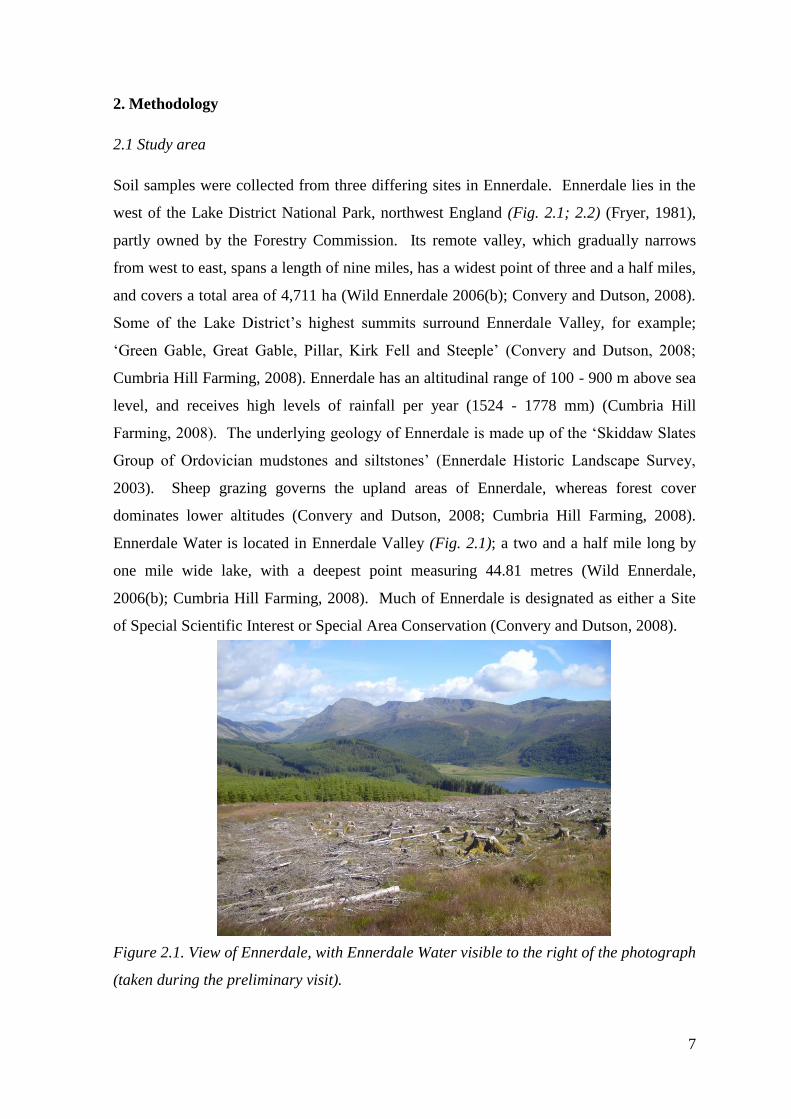
Soil samples were collected from three differing sites in Ennerdale. Ennerdale lies in the
west of the Lake District National Park, northwest England (Fig. 2.1; 2.2) (Fryer, 1981),
partly owned by the Forestry Commission. Its remote valley, which gradually narrows
from west to east, spans a length of nine miles, has a widest point of three and a half miles,
and covers a total area of 4,711 ha (Wild Ennerdale 2006(b); Convery and Dutson, 2008).
Some of the Lake District’s highest summits surround Ennerdale Valley, for example;
‘Green Gable, Great Gable, Pillar, Kirk Fell and Steeple’ (Convery and Dutson, 2008;
Cumbria Hill Farming, 2008). Ennerdale has an altitudinal range of 100 - 900 m above sea
level, and receives high levels of rainfall per year (1524 - 1778 mm) (Cumbria Hill
Farming, 2008). The underlying geology of Ennerdale is made up of the ‘Skiddaw Slates
Group of Ordovician mudstones and siltstones’ (Ennerdale Historic Landscape Survey,
2003). Sheep grazing governs the upland areas of Ennerdale, whereas forest cover
dominates lower altitudes (Convery and Dutson, 2008; Cumbria Hill Farming, 2008).
Ennerdale Water is located in Ennerdale Valley (Fig. 2.1); a two and a half mile long by
one mile wide lake, with a deepest point measuring 44.81 metres (Wild Ennerdale,
2006(b); Cumbria Hill Farming, 2008). Much of Ennerdale is designated as either a Site
of Special Scientific Interest or Special Area Conservation (Convery and Dutson, 2008).
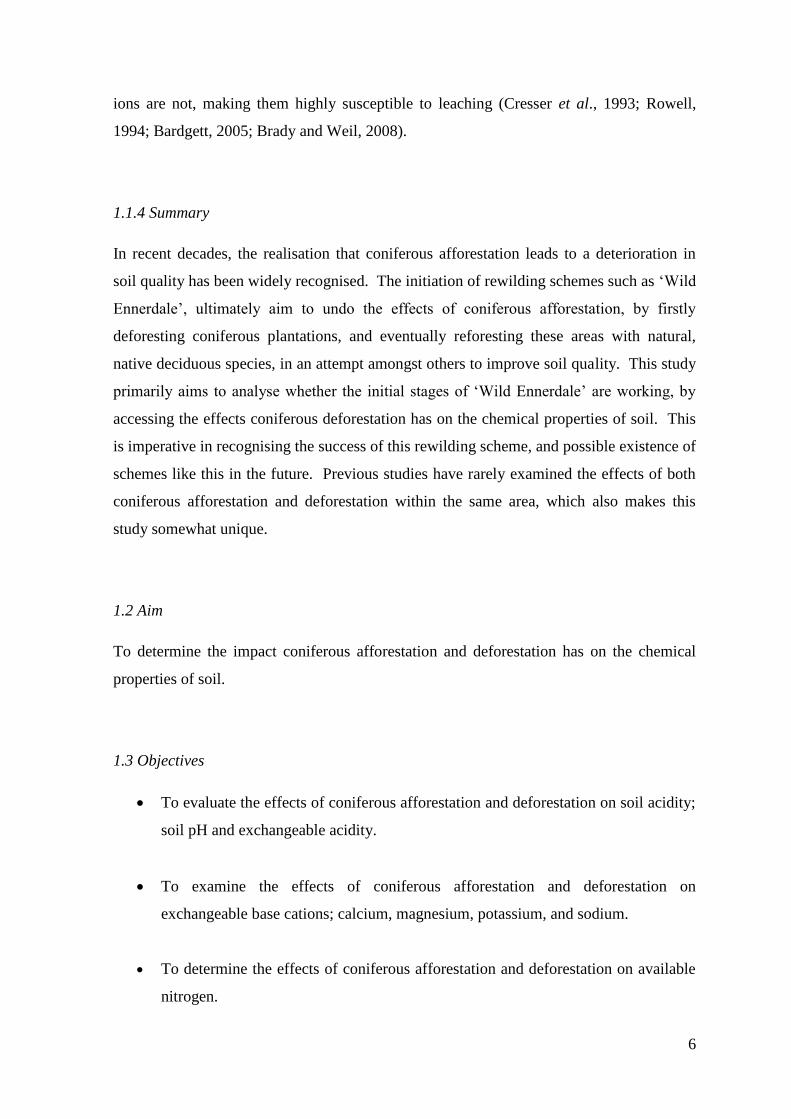
Figure 2.1. View of Ennerdale, with Ennerdale Water visible to the right of the photograph
(taken during the preliminary visit).
8
Figure 2.2. (a) Map to show location of Ennerdale within Cumbria, (b) location map to
show Cumbria within the UK (Wordsworth Country, 2012).
Coniferous afforestation of Ennerdale began in 1925 rapidly increasing in subsequent
decades, and in turn significantly deteriorating soil quality (Wild Ennerdale, 2006(a);
Convery and Dutson, 2008). Since the Forestry Commission became partners with the
National Trust and United Utilities, focus has been placed on the rewilding initiative ‘Wild
Ennerdale’, set up in 2002 with a primary aim to produce ‘a more naturally evolving
landscape’ (Convery and Dutson, 2008). ‘Wild Ennerdale’ ultimately intends to, in the
long run, reforest previously coniferous afforested areas with native deciduous species that
(a)
(b)
Ennerdale

9
would have once dominated the area, in an attempt amongst others to improve soil quality,
the aesthetic landscape, and water quality, as forested systems are tightly coupled with
river ecosystems (Convery and Dutson, 2008). This has led to a shift in forest type
dominance within Ennerdale, from numerous highly managed coniferous forested areas, to
increasing areas of natural native broadleaf forests (Wild Ennerdale, 2006(a)). Not only
does ‘Wild Ennerdale’ seek to rewild the landscape, but also to ‘provide socio-economic
benefits for the local community’ (Convery and Dutson, 2008).
2.2 Study sites
To determine the impact coniferous afforestation and deforestation has on the chemical
properties of soil, three differing sites within Ennerdale were used; a moorland, a forest,
and a deforested area. Sites were selected after a preliminary visit was undertaken, and
after correspondence from Gareth Browning of the Forestry Commission. The moorland
site, located next to Ennerdale forest (Fig. 2.3; 2.4(a)), acted as a control site representing
initial soil conditions before coniferous afforestation took place (owned by the National
Trust, tenanted by farmers Judith and Andy Weston). The forested site (Fig. 2.3; 2.4(b))
was used to identify the effects coniferous afforestation has had on the soil, and finally, the
deforested site (Fig. 2.3; 2.4(c)) was used to identify the effects coniferous deforestation
has had on the soil (both latter sites owned by the Forestry Commission). Site descriptions
and abbreviations are classified in Table 2.1.
Table 2.1. Site descriptions and classification.
Site
abbreviation
Site type Site description
S1
Moorland
Predominantly grassland, with the presence of billberry,
and some heather (Fig. 2.4(a)).
S2 Forest
Coniferous spruce forest made up of predominantly
Sitka spruce (Fig. 2.4(b)).
S3 Deforested Deforested coniferous spruce forest. Felling took place
in approximately 2000 (Fig. 2.3). Tree stumps and
branches were still present, left to decompose in situ
(Fig. 2.4(c)).
10
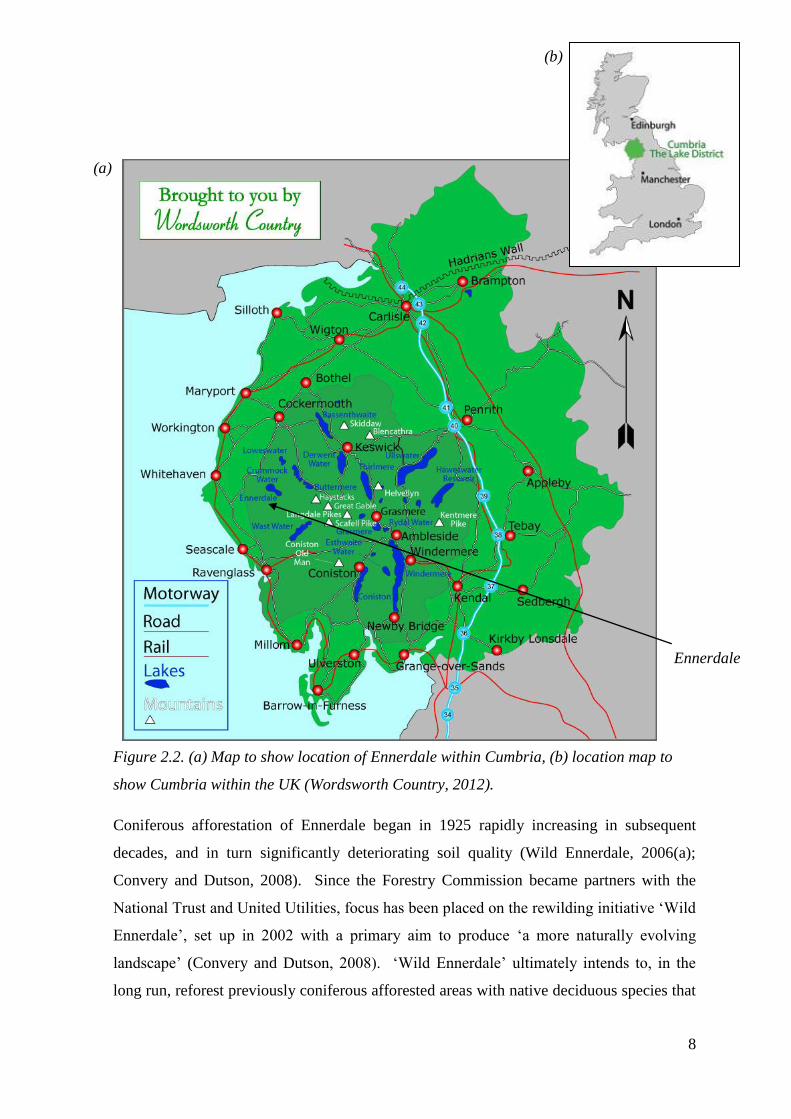
Figure 2.3. Map from Gareth Browning of the Forestry Commission, to show deforested areas within Ennerdale. Additional coloured
squares represent the three sites; Moorland Forest Deforested (not to scale).
After a preliminary visit, it could
be established that this scheduled
replanting had yet to be
undertaken.

11
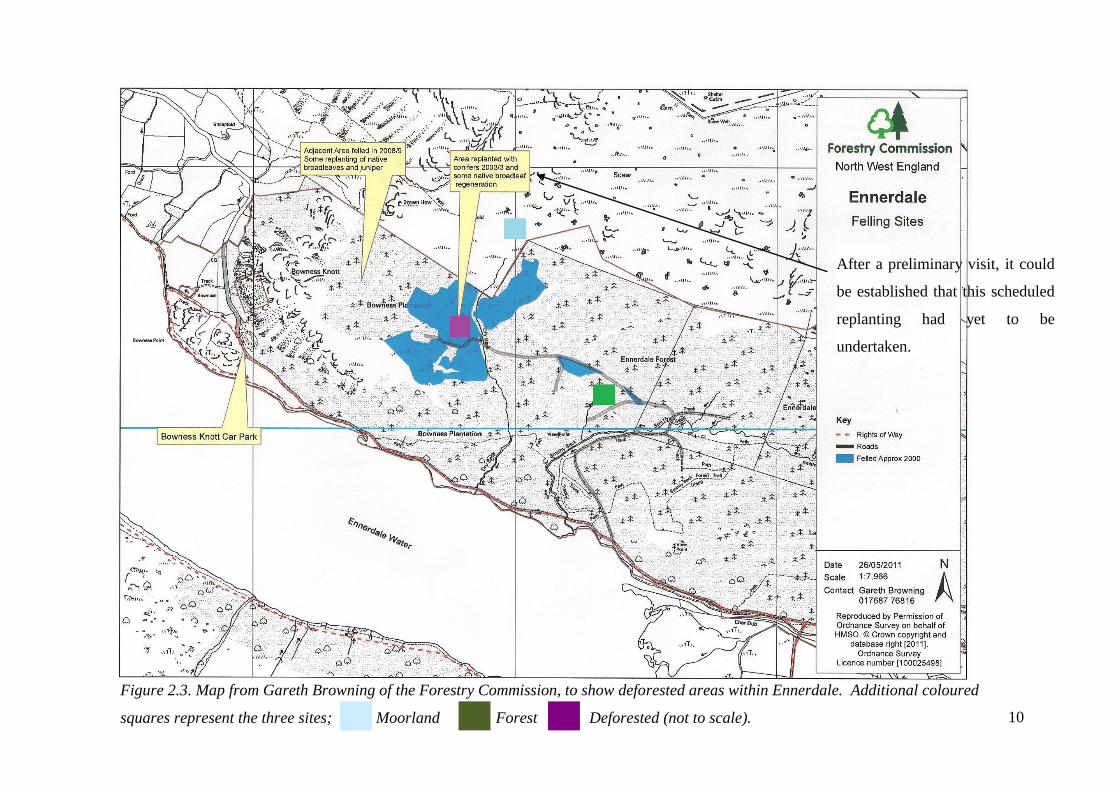
Figure 2.4. Photographs of each site (taken during the preliminary visit when weather
conditions were better);(a) moorland (centre of photograph), (b) forest, and (c) deforested.
(a)
(b)
(c)

12
2.3 Soil collection
After a preliminary visit to Ennerdale was undertaken, soil sampling was carried out on
September 11th
2011. At each site, fifteen soil samples were collected at a depth of
approximately 0.1 m (which encompassed both the organic and mineral horizons), using a
bulb planter. Prior to soil collection, a sampling strategy was developed to include a
representative area of each site (Macdonald et al., 2009). A fifteen metre by fifteen metre
sampling grid was drawn for each site; dividing the sampling area into 225 individual one
metre by one metre squares, each square numbered chronologically (see Appendix 2).
Before collection, twenty five random numbers (between one and 225) were generated for
each site using Microsoft Excel. The first fifteen numbers were to be used as the squares
at which a soil sample would be collected; with an extra ten numbers to be used in case
soil collection could not be taken at a square due to obstruction (i.e. the presence of a tree
or large rock) (see Appendix 2). For consistency, soil samples were taken from the bottom
left hand corner of each selected square. Once collected, individual soil samples were
stored in airtight bags and kept in a refrigerator whilst awaiting further analysis.
2.4 Lab analysis
Each soil sample was divided roughly into three; one third kept refrigerated (for analysis
that required field moist soil), and two thirds dried (as the majority of analysis was
undertaken on dry soil). Soil samples were dried at 40oC in the oven for about ten days,
(due to soil being extremely wet when collected). Each sample was then ground and
passed through a two millimetre sieve. Soil texture was determined using the ‘feel
method’ (Chapman, in Holden, 2008) (see Appendix 1 for details).
2.4.1 Analysis using field moist soil
Available nitrogen (ammonium (NH4), nitrate (NO3) and nitrite (NO2)), was determined
using field moist soil, with 1 M KCl used for extraction, at a ratio of 1:5 moist
soil:solution (Rowell, 1994). An AAS (atomic absorption spectrometry) machine was
used for analysis, recording NH4, NO3 and NO2. Results were then converted to mg/kg-1
of soil.
13
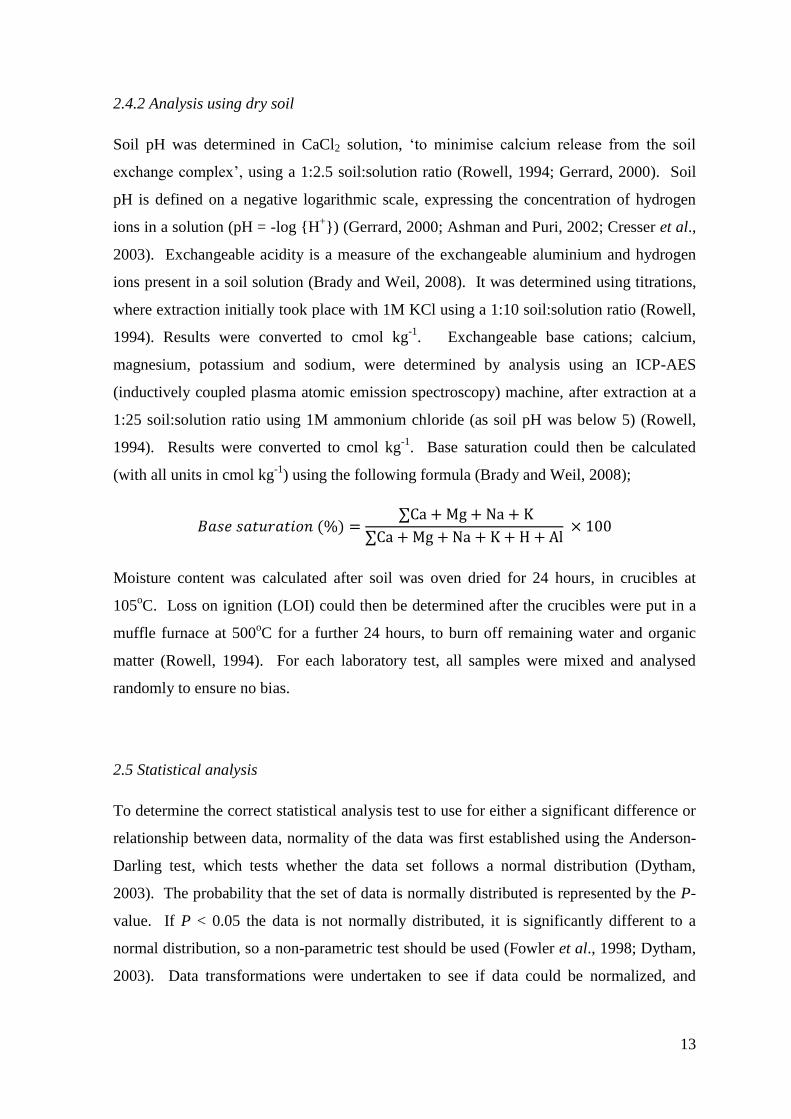
2.4.2 Analysis using dry soil
Soil pH was determined in CaCl2 solution, ‘to minimise calcium release from the soil
exchange complex’, using a 1:2.5 soil:solution ratio (Rowell, 1994; Gerrard, 2000). Soil
pH is defined on a negative logarithmic scale, expressing the concentration of hydrogen
ions in a solution (pH = -log {H+}) (Gerrard, 2000; Ashman and Puri, 2002; Cresser et al.,
2003). Exchangeable acidity is a measure of the exchangeable aluminium and hydrogen
ions present in a soil solution (Brady and Weil, 2008). It was determined using titrations,
where extraction initially took place with 1M KCl using a 1:10 soil:solution ratio (Rowell,
1994). Results were converted to cmol kg-1
. Exchangeable base cations; calcium,
magnesium, potassium and sodium, were determined by analysis using an ICP-AES
(inductively coupled plasma atomic emission spectroscopy) machine, after extraction at a
1:25 soil:solution ratio using 1M ammonium chloride (as soil pH was below 5) (Rowell,
1994). Results were converted to cmol kg-1
. Base saturation could then be calculated
(with all units in cmol kg-1
) using the following formula (Brady and Weil, 2008);
Moisture content was calculated after soil was oven dried for 24 hours, in crucibles at
105oC. Loss on ignition (LOI) could then be determined after the crucibles were put in a
muffle furnace at 500oC for a further 24 hours, to burn off remaining water and organic
matter (Rowell, 1994). For each laboratory test, all samples were mixed and analysed
randomly to ensure no bias.
2.5 Statistical analysis
To determine the correct statistical analysis test to use for either a significant difference or
relationship between data, normality of the data was first established using the Anderson-
Darling test, which tests whether the data set follows a normal distribution (Dytham,
2003). The probability that the set of data is normally distributed is represented by the P-
value. If P < 0.05 the data is not normally distributed, it is significantly different to a
normal distribution, so a non-parametric test should be used (Fowler et al., 1998; Dytham,
2003). Data transformations were undertaken to see if data could be normalized, and
14
therefore allow for a parametric, more accurate test to be used (Fowler et al., 1998). This
was not observed however, so original data was used in all statistical testing.
In testing for a significant difference between data sets at the three sites, either a
parametric one-way ANOVA test (normally distributed data), or a non-parametric
Kruskal-Wallis test (not normally distributed data) was used. A one-way ANOVA
(analysis of variance) tests if the means of 3 categorical groups, in this case the three
sites, are significantly different from each other (Dytham, 2003; Ennos, 2007). A
significant result (P < 0.05), at a 95% confidence level, indicates that at least one pair of
groups has significantly different means, however, it is not stated which groups this is, so a
post hoc test may then be undertaken (Dytham, 2003; Ennos, 2007). Fisher’s pairwise
comparison post hoc test identifies the pairs of sites at which a significant difference
between means is observed (Dytham, 2003). The non-parametric equivalent of a one-way
ANOVA test is the Kruskal-Wallis test, which instead compares the medians of 3
categorical ranked groups (Fowler et al., 1998; Dytham, 2003). A P-value < 0.05 again
indicates a significant difference between at least one pair of groups, however, it is not
identified which pair. As there is no post hoc test available for Kruskal-Wallis, a pairwise
Mann-Whitney U test was used, which compares the medians of two ranked groups only
(Dytham, 2003; Ennos, 2007). In this case, Site 1 was paired with Site 2, Site 2 with Site
3, and Site 3 with Site 1 (see Table 2.1 for site classification). A significant difference
between group medians is indicated by a P-value < 0.05.
In testing for a significant correlation between continuous variables, either a parametric
Pearson’s Product Moment Correlation (normally distributed data), or a non-parametric
Spearman’s Rank test (not normally distributed data) was used. Pearson’s Product
Moment Correlation is used to test for a correlation between two variables, the statistic r
result ranging from -1 to 1, perfect negative correlation to perfect positive correlation,
respectively (Dytham, 2003), where P < 0.05 indicates a significant correlation.
Spearman’s Rank was used if data were not normally distributed, where data sets were first
ranked and then Pearson’s Product Moment Correlation undertaken (Dytham, 2003).
Again a P-value < 0.05 indicates a significant correlation, with an r value determining
correlation strength. Statistical tests are summarised in Table 2.2. Although replicates for
individual soil samples were taken (two per site), they were not used in statistical testing as
replicate results proved not to differ greatly from original results. Relevant graphs were
produced from statistical analysis.

15
Table 2.2. Summary statistical test table.
Normally distributed
data
Not normally distributed
data
To test for a significant difference
between all three sites.
ANOVA Kruskal-Wallis
Post hoc test/equivalent, to identify
which sites are significantly
different from each other.
Fisher’s F Mann Whitney U test
To test for a significant correlation
between variables.
Pearson’s Product
Moment Correlation
Spearman’s Rank
16
3. Results
3.1 Basic soil characteristics and LOI
Site classification and basic soil characteristics are presented in Table 3.1. Soil texture is
of extreme importance as it has a great influence on the chemical properties of soil, so
should be considered when interpreting results (Ashman and Puri, 2002; Brady and Weil,
2008).
Table 3.1 Basic soil characteristics.
Site Site number Texture pH LOI
Moorland Site 1 (S1) Clay loam 3.41 74.18
Forest Site 2 (S2) Clay 3.23 80.61
Deforested Site 3 (S3) Sandy clay loam 3.34 21.28
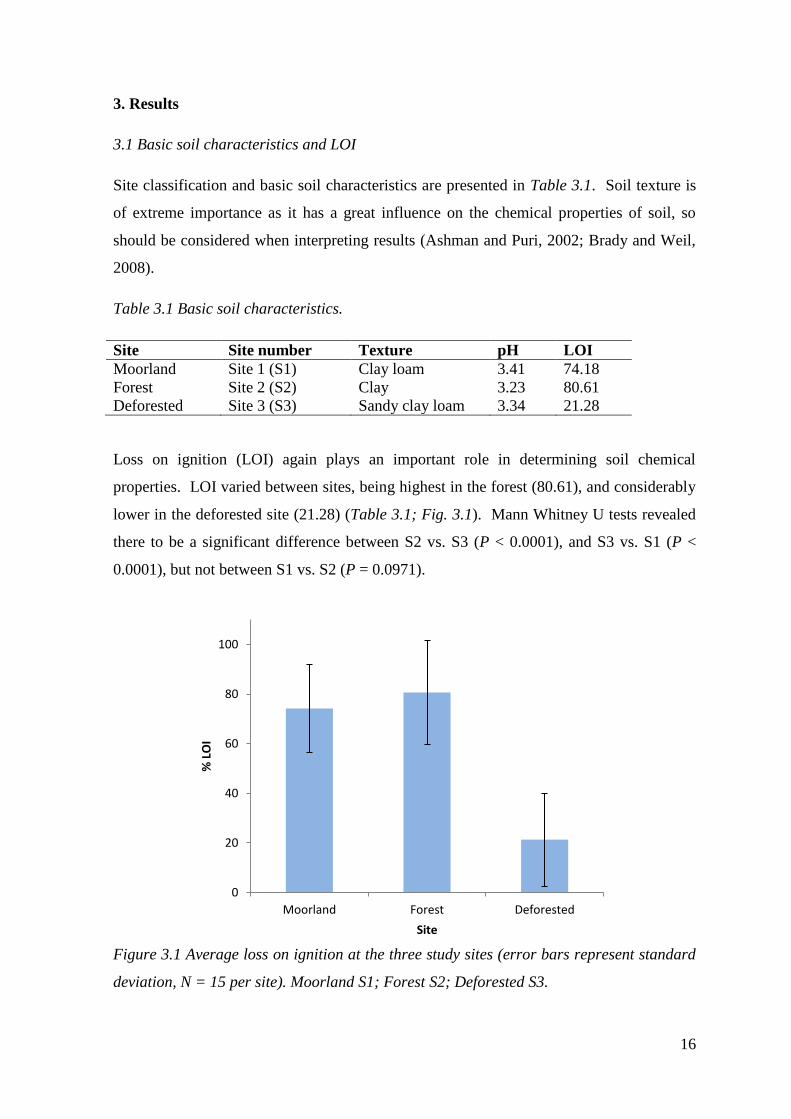
Loss on ignition (LOI) again plays an important role in determining soil chemical
properties. LOI varied between sites, being highest in the forest (80.61), and considerably
lower in the deforested site (21.28) (Table 3.1; Fig. 3.1). Mann Whitney U tests revealed
there to be a significant difference between S2 vs. S3 (P < 0.0001), and S3 vs. S1 (P <
0.0001), but not between S1 vs. S2 (P = 0.0971).
Figure 3.1 Average loss on ignition at the three study sites (error bars represent standard
deviation, N = 15 per site). Moorland S1; Forest S2; Deforested S3.
0
20
40
60
80
100
Moorland Forest Deforested
% L
OI
Site
17
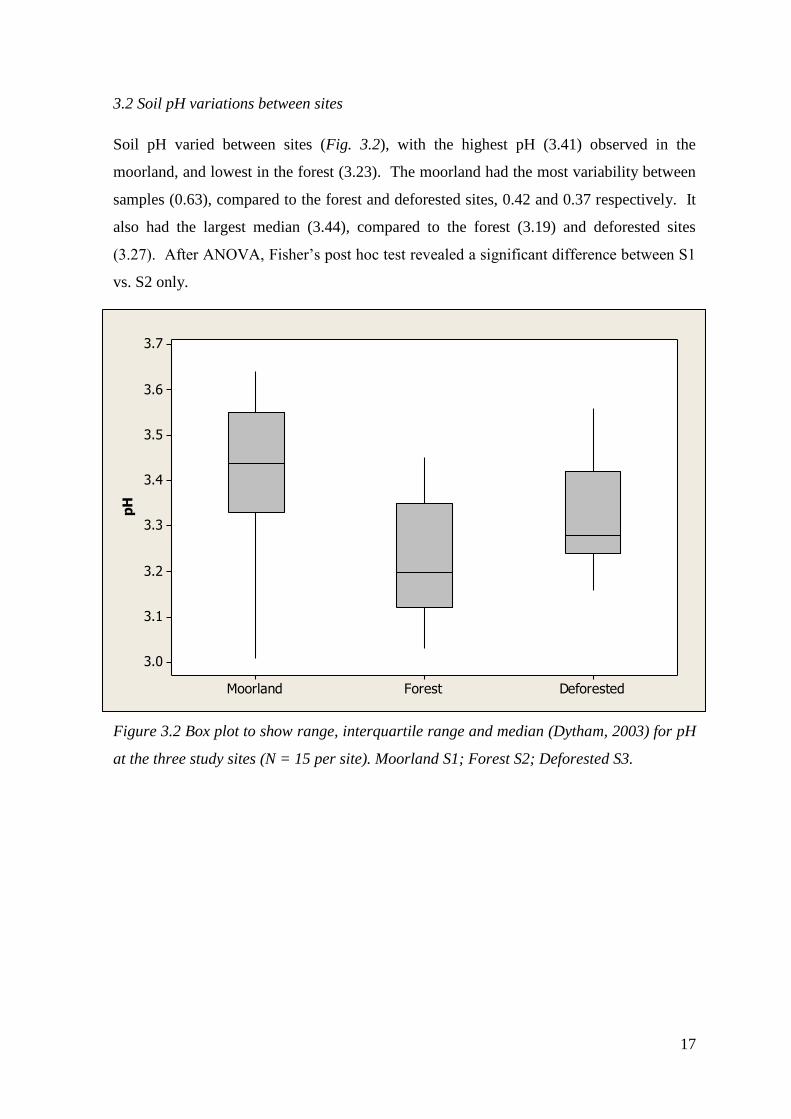
3.2 Soil pH variations between sites
Soil pH varied between sites (Fig. 3.2), with the highest pH (3.41) observed in the
moorland, and lowest in the forest (3.23). The moorland had the most variability between
samples (0.63), compared to the forest and deforested sites, 0.42 and 0.37 respectively. It
also had the largest median (3.44), compared to the forest (3.19) and deforested sites
(3.27). After ANOVA, Fisher’s post hoc test revealed a significant difference between S1
vs. S2 only.
Figure 3.2 Box plot to show range, interquartile range and median (Dytham, 2003) for pH
at the three study sites (N = 15 per site). Moorland S1; Forest S2; Deforested S3.
DeforestedForestMoorland
3.7
3.6
3.5
3.4
3.3
3.2
3.1
3.0
pH
18
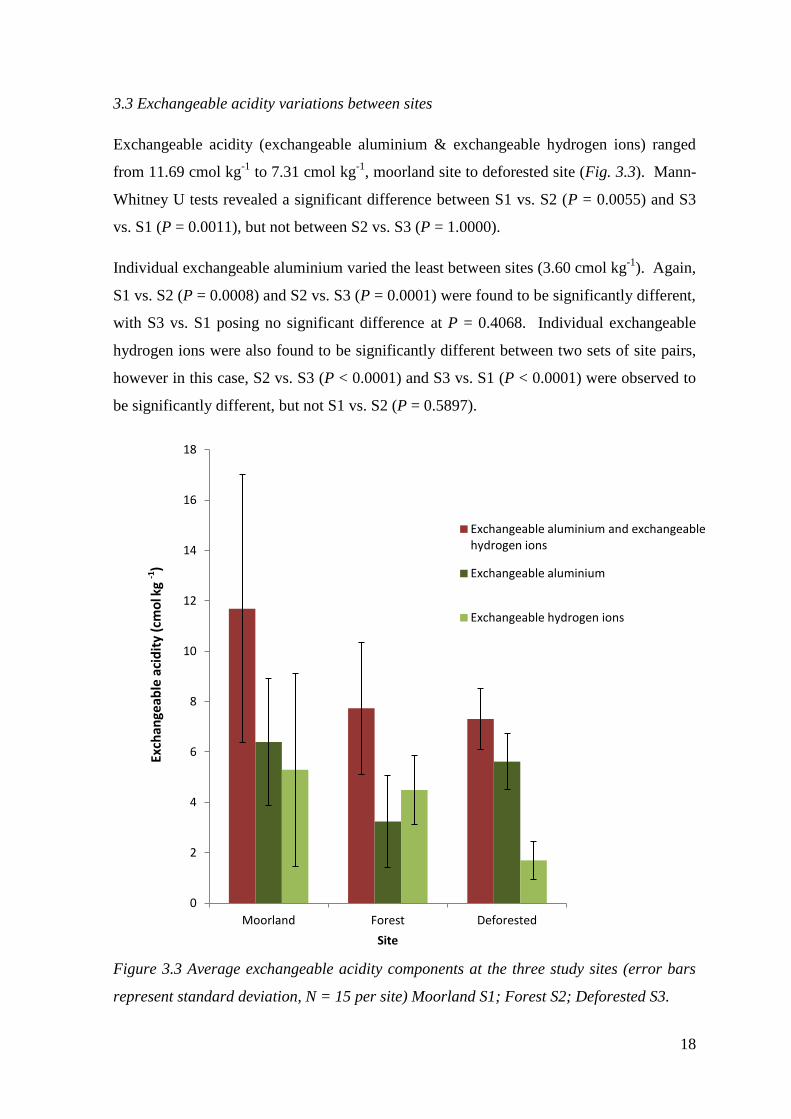
3.3 Exchangeable acidity variations between sites
Exchangeable acidity (exchangeable aluminium & exchangeable hydrogen ions) ranged
from 11.69 cmol kg-1
to 7.31 cmol kg-1
, moorland site to deforested site (Fig. 3.3). Mann-
Whitney U tests revealed a significant difference between S1 vs. S2 (P = 0.0055) and S3
vs. S1 (P = 0.0011), but not between S2 vs. S3 (P = 1.0000).
Individual exchangeable aluminium varied the least between sites (3.60 cmol kg-1
). Again,
S1 vs. S2 (P = 0.0008) and S2 vs. S3 (P = 0.0001) were found to be significantly different,
with S3 vs. S1 posing no significant difference at P = 0.4068. Individual exchangeable
hydrogen ions were also found to be significantly different between two sets of site pairs,
however in this case, S2 vs. S3 (P < 0.0001) and S3 vs. S1 (P < 0.0001) were observed to
be significantly different, but not S1 vs. S2 (P = 0.5897).
Figure 3.3 Average exchangeable acidity components at the three study sites (error bars
represent standard deviation, N = 15 per site) Moorland S1; Forest S2; Deforested S3.
0
2
4
6
8
10
12
14
16
18
Moorland Forest Deforested
Site
Exchangeable aluminium and exchangeable hydrogen ions
Exchangeable aluminium
Exchangeable hydrogen ions
Exch
ange
able
aci
dit
y (c
mo
l kg
-1)
19
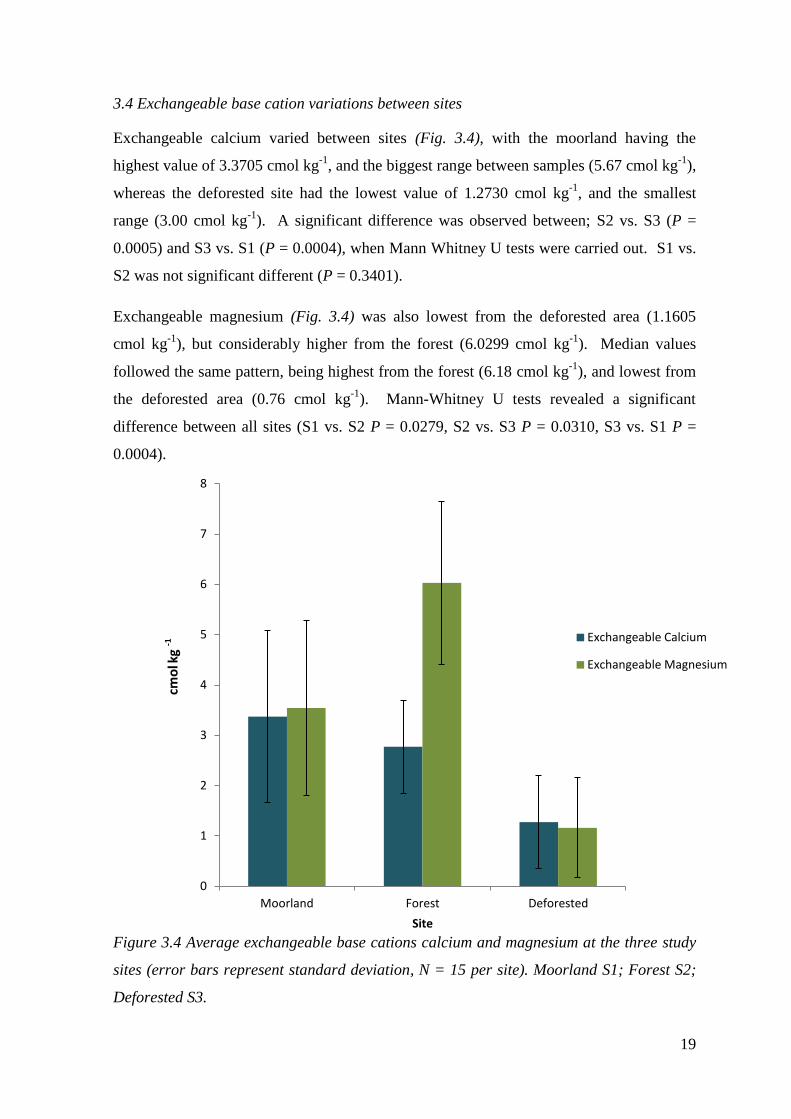
3.4 Exchangeable base cation variations between sites
Exchangeable calcium varied between sites (Fig. 3.4), with the moorland having the
highest value of 3.3705 cmol kg-1
, and the biggest range between samples (5.67 cmol kg-1
),
whereas the deforested site had the lowest value of 1.2730 cmol kg-1
, and the smallest
range (3.00 cmol kg-1
). A significant difference was observed between; S2 vs. S3 (P =
0.0005) and S3 vs. S1 (P = 0.0004), when Mann Whitney U tests were carried out. S1 vs.
S2 was not significant different (P = 0.3401).
Exchangeable magnesium (Fig. 3.4) was also lowest from the deforested area (1.1605
cmol kg-1
), but considerably higher from the forest (6.0299 cmol kg-1
). Median values
followed the same pattern, being highest from the forest (6.18 cmol kg-1
), and lowest from
the deforested area (0.76 cmol kg-1
). Mann-Whitney U tests revealed a significant
difference between all sites (S1 vs. S2 P = 0.0279, S2 vs. S3 P = 0.0310, S3 vs. S1 P =
0.0004).
Figure 3.4 Average exchangeable base cations calcium and magnesium at the three study
sites (error bars represent standard deviation, N = 15 per site). Moorland S1; Forest S2;
Deforested S3.
0
1
2
3
4
5
6
7
8
Moorland Forest Deforested
Site
Exchangeable Calcium
Exchangeable Magnesium
cmo
l kg
-1

20
Exchangeable potassium varied between sites (Fig. 3.5), with the moorland soils
containing the highest concentration, whereas soils from the deforested site had the lowest
concentration (1.1011 cmol kg-1
and 0.5811 cmol kg-1
respectively). Mann-Whitney U
tests revealed a significant difference between all sites (S1 vs. S2 P = 0.0279, S2 vs. S3 P
= 0.0310, S3 vs. S1 P = 0.0028), the paired deforested and moorland sites having the most
difference.
Exchangeable sodium was highest from the forest (1.8975 cmol kg-1
), and lowest from the
deforested site (0.7390 cmol kg-1
) (Fig. 3.5), with the forest having the most variability
between samples, and the deforested site having the least (0.3711 cmol kg-1
and 0.2197
cmol kg-1
respectively). After ANOVA, Fisher’s pot hoc test revealed all sites to be
significantly different from each other.
Figure 3.5 Average exchangeable base cations potassium and sodium at the three study
sites (error bars represent standard deviation, N = 15 per site). Moorland S1; Forest S2;
Deforested S3.
-0.5
0.0
0.5
1.0
1.5
2.0
2.5
Moorland Forest Deforested
Site
Exchangeable Potassium
Exchangeable Sodium
cmo
l kg
-1

21
3.5 Base saturation variations between sites
Base saturation was found to be highest in soils collected from the forest, and lowest in
soils collected from the deforested site (Table 3.2).
Table 3.2 Base saturation at all three study sites.
Site Site number Base saturation (%)
Moorland Site 1 (S1) 44
Forest Site 2 (S2) 60
Deforested Site 3 (S3) 34
3.6 Available nitrogen variations between sites
Ammonium concentration showed lots of variability between individual samples at each
site; the highest being 20.60 mg kg-1
in the deforested site, 16.44 mg kg-1
in the moorland,
and 12.56 mg kg-1
in the forest. Ammonium concentration varied between sites (Fig. 3.6),
with Fisher’s post hoc test revealing a significant difference between S1 vs. S2, and S3 vs.
S1 after an initial ANOVA test.
Figure 3.6 Ammonium concentration at the three study sites (error bars represent
standard deviation, N = 15 per site). Moorland S1; Forest S2; Deforested S3.
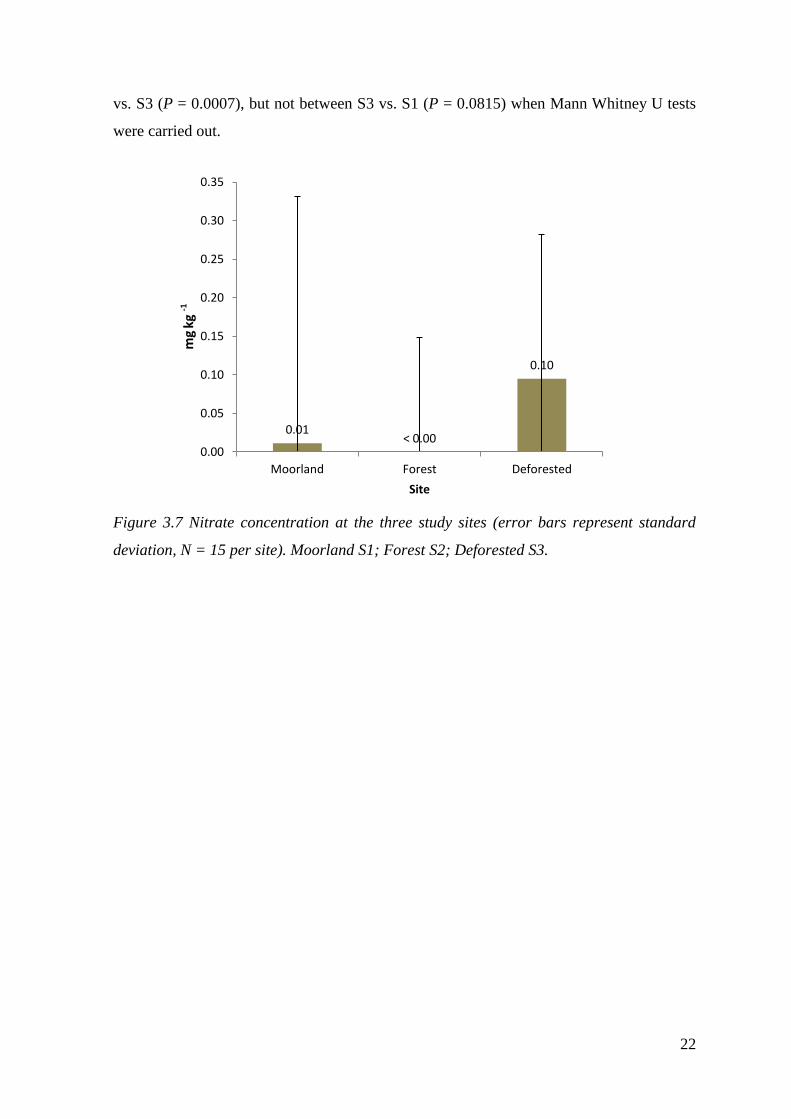
Nitrate concentration was by far the lowest in the forest, compared to the other two sites
(Fig. 3.7). A significant difference was observed between S1 vs. S2 (P =0.0225), and S2
18.29
11.21 9.30
0
5
10
15
20
25
Moorland Forest Deforested
Site
mg
kg -1
22
vs. S3 (P = 0.0007), but not between S3 vs. S1 (P = 0.0815) when Mann Whitney U tests
were carried out.
Figure 3.7 Nitrate concentration at the three study sites (error bars represent standard
deviation, N = 15 per site). Moorland S1; Forest S2; Deforested S3.
mg
kg -1
0.01 < 0.00
0.10
0.00
0.05
0.10
0.15
0.20
0.25
0.30
0.35
Moorland Forest Deforested
Site
23
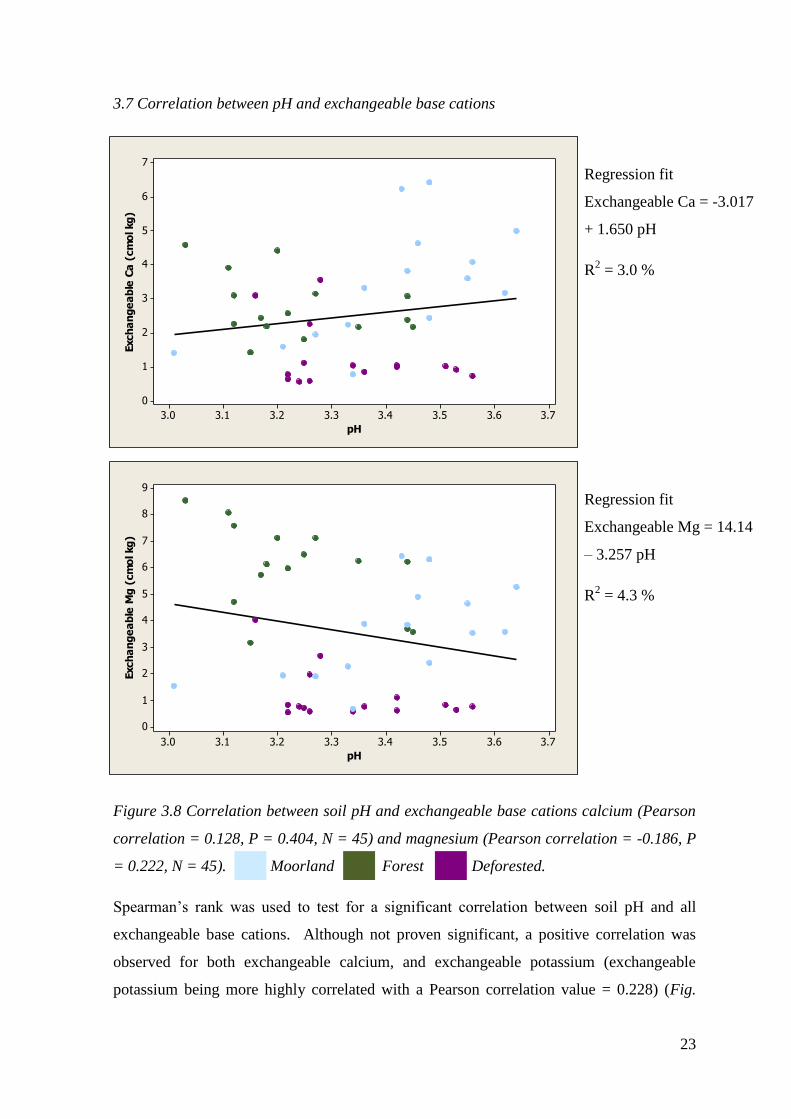
3.7 Correlation between pH and exchangeable base cations
Figure 3.8 Correlation between soil pH and exchangeable base cations calcium (Pearson
correlation = 0.128, P = 0.404, N = 45) and magnesium (Pearson correlation = -0.186, P
= 0.222, N = 45). Moorland Forest Deforested.
Spearman’s rank was used to test for a significant correlation between soil pH and all
exchangeable base cations. Although not proven significant, a positive correlation was
observed for both exchangeable calcium, and exchangeable potassium (exchangeable
potassium being more highly correlated with a Pearson correlation value = 0.228) (Fig.
3.73.63.53.43.33.23.13.0
7
6
5
4
3
2
1
0
pH
Exch
an
ge
ab
le C
a (
cm
ol kg
)
3.73.63.53.43.33.23.13.0
9
8
7
6
5
4
3
2
1
0
pH
Exch
an
ge
ab
le M
g (
cm
ol kg
)
Regression fit
Exchangeable Ca = -3.017
+ 1.650 pH
R2 = 3.0 %
Regression fit
Exchangeable Mg = 14.14
– 3.257 pH
R2 = 4.3 %
24
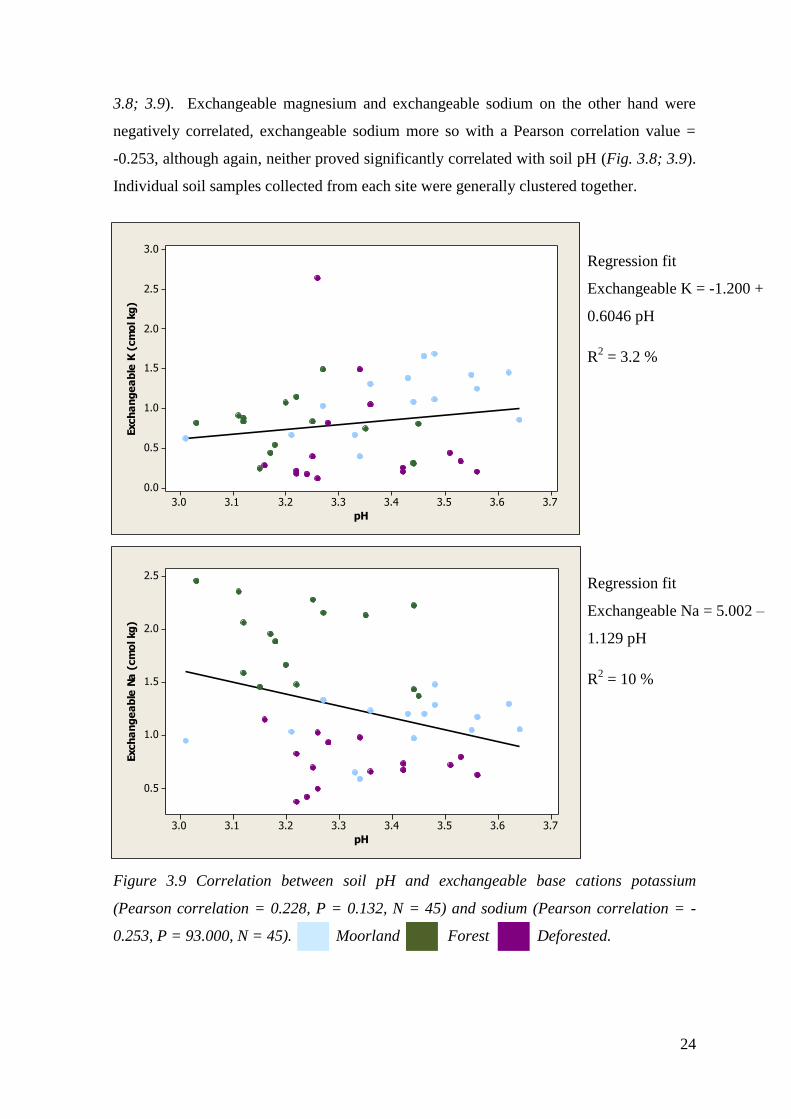
3.8; 3.9). Exchangeable magnesium and exchangeable sodium on the other hand were
negatively correlated, exchangeable sodium more so with a Pearson correlation value =
-0.253, although again, neither proved significantly correlated with soil pH (Fig. 3.8; 3.9).
Individual soil samples collected from each site were generally clustered together.
Figure 3.9 Correlation between soil pH and exchangeable base cations potassium
(Pearson correlation = 0.228, P = 0.132, N = 45) and sodium (Pearson correlation = -
0.253, P = 93.000, N = 45). Moorland Forest Deforested.
3.73.63.53.43.33.23.13.0
3.0
2.5
2.0
1.5
1.0
0.5
0.0
pH
Exch
an
ge
ab
le K
(cm
ol kg
)
3.73.63.53.43.33.23.13.0
2.5
2.0
1.5
1.0
0.5
pH
Exch
an
ge
ab
le N
a (
cm
ol kg
)
Regression fit
Exchangeable K = -1.200 +
0.6046 pH
R2 = 3.2 %
Regression fit
Exchangeable Na = 5.002 –
1.129 pH
R2 = 10 %

25
4. Discussion
4.1 Soil acidity; soil pH and exchangeable acidity
4.1.1 Moorland
UK upland moorland soils, such as those at Ennerdale, are typically acidic due to the high
amounts of rainfall they receive annually (in the case of Ennerdale, 1524 – 1778 mm), and
the preceding rate at which chemical weathering reactions occur (Likens et al., 1977;
Reynolds et al., 1988; Cumbria Hill Farming, 2008). It could therefore be expected that in
Ennerdale, the moorland control site would already be of an acidic nature, due to the high
input of hydrogen ions to the soil, (indicated by the presence of bilberry and heather). This
was demonstrated by the highest concentration of exchangeable hydrogen ions observed in
the moorland soil (Fig. 3.3), and a low pH of 3.41, emphasising the soils acidity. The
weathering of minerals in the soil also proves to be an influential factor controlling soil pH
(Strobel et al., 2001), very much dependant on rates of rainfall.
Soil acidity encompasses both soil pH and exchangeable acidity; the two being intricately
linked (Brady and Weil, 2008). Despite the moorland soil having the highest soil pH, it
unexpectedly had the highest concentration of exchangeable hydrogen ions. This was
surprising as pH is a measure of hydrogen ions on a negative logarithmic scale, so it could
be expected that the soil with the lowest pH, would hence have the highest concentration
of exchangeable hydrogen ions (Rowell, 1994; Brady and Weil, 2008). The high
concentration of exchangeable hydrogen ions could, however, explain the highest
concentration of exchangeable aluminium, owing to hydrogen ions causing the release of
the highly toxic aluminium ions (Rowell, 1994). Aluminium is particularly harmful to
plants and animals, specifically freshwater organisms, because of its toxicity (Grieve,
2001). It is deemed to be most responsible for inhibiting the extension of particularly
sensitive plant roots, leading to a somewhat expected deficiency in the supply of essential
nutrients to a plant (Cresser et al., 1993; Rowell, 1994; Gerrard, 2000; Ashman and Puri,
2002).
4.1.2 Forest
Coniferous afforestation of moorland soils has been shown to expectedly exacerbate soil
acidity (Barton et al., 1999; Gerrard, 2000; Smal and Olszewska, 2008). As could be
assumed, soil collected from the forest in Ennerdale resulted in the lowest, most acidic pH
26
of 3.23 (Fig. 3.2), proving to be significantly different to that of the moorland soil. Studies
by both Berthrong et al., (2009), and Smal and Olszewska (2008) found too, that
afforestation led to more acidic soil. The presence of a coniferous tree canopy plays a vital
role in aiding soil acidification compared to the short, sparse vegetation, such as bilberry,
present on moorland (Barton et al., 1999). A coniferous tree canopy also leads to greater
soil acidification compared to that of a deciduous tree canopy, because of the larger
surface area and height coniferous trees comprise (Reynolds et al., 1988; Neal et al., 1992;
Barton et al., 1999). This enables the capture, and absorption of industrially produced
acidic atmospheric pollutants, such as nitrous oxides and sulphur dioxide, which are
released into the soil via stemflow and throughfall, producing nitric and sulphuric acids
(Reynolds et al., 1988; Neal et al., 1992; Gerrard, 2000; Grieve, 2001; Smal and
Olszewska, 2008). Even in areas of low pollution, such as Ennerdale, these pollutants
accumulate gradually over time, eventually leading to the enhancement of soil acidity
(Barton et al., 1999). Johnson and Lidberg (in Adriano and Havas, 1989) also found the
effect of atmospheric deposition to be a significant factor in soil acidification.
Soil acidity not only arises from humanly produced pollutants, but also various natural
processes such as organic matter breakdown, and the widespread input of acidic pine
needles onto the forest floor (Neal et al., 1992; Rowell, 1994; Fisher and Binkley, 2000;
Gerrard, 2000; Ashman and Puri, 2002), which has inevitably occurred in Ennerdale. The
production of carbonic acid by microbial respiration, also leads to the intensification of
soil acidity (Gerrard, 2000). Differing tree species produce unique litter comprising of
different chemical composition (Strobel et al., 2001). It was expected that a reduction in
soil pH would lead to an increase in exchangeable acidity (Rowell, 1994), however, this
was not evident, as overall exchangeable acidity decreased (Fig. 3.3). The clay texture of
the forest soil is also thought to have been a significant factor in decreasing pH, with
Oxbrough et al., (2006) concluding that peatlands were most sensitive to afforestation.
Soil acidity itself determines numerous soil characteristics, most notably nutrient
availability. Exchangeable aluminium interferes greatly with the movement and transfer
of exchangeable base cations in a soil, causing a variety of problems (Rowell, 1994;
Ashman and Puri, 2002). Soil acidity has been shown in the past to contrast strongly
between sites of different land use (Richter and Markewitz, 2001), also proving to be
highly related to the regular leaching of soil minerals (Cresser et al., 1993; Rowell, 1994).

27
4.1.3 Deforested
Soil pH increased from forest soil to soil collected from the deforested site (Fig. 3.2), even
though a significant difference was not obtained. This does, however, very much indicate
that the removal of trees has been an influential factor in reducing soil acidity. Neal et al.,
(1992) also observed that tree canopy removal in mid Wales led to a decrease in soil pH,
which they suggested was due to a dramatic reduction in the capture of acidic pollutants.
The loss of organic matter due to deforestation reduces the amount of carbonic acid
produced in the soil (as organic matter contains a high carbon content), and therefore
acidity. This was found to be true in the study by Smal and Olszewska (2008), where soil
pH increased as organic matter content decreased. The lowest concentration of
exchangeable acidity was observed in soil collected from the deforested site (Fig. 3.3)
even though soil pH was not the highest at this site, which again was unexpected as it does
not follow past literature.
4.2 Exchangeable base cations
4.2.1 Soil texture
Soil texture plays a huge role in determining the majority of chemical soil properties,
namely the movement and retention of exchangeable base cations (Cresser et al., 1993;
Ashman and Puri, 2002). Compared to clay particles (< 0.002 mm), sand particles (0.02 –
2 mm) within a soil consequently create large pore spaces, resulting in little capability to
retain water or nutrients (Brady and Weil, 2008; Chapman, in Holden, 2008).
Exchangeable base cations are therefore often easily leached out of a soil, contributing to
the low nutrient content of sandy soils (Gerrard, 2000; Brady and Weil, 2008). This is
evident at Ennerdale, with soil collected from the deforested site, consisting of a sandy
clay loam texture, having the lowest concentration of exchangeable base cations (Fig. 3.4;
3.5). Sandy, well drained and aerated soil is often also prone to erosion (Gerrard, 2000).
Clay particles, on the other hand, are much more compactable than sand particles, due to
their small size, and so create considerably smaller pore spaces, which pose poor drainage
(Gerrard, 2000; Brady and Weil, 2008). This, combined with their large surface area and
electrical charge, makes clay particles particularly good at absorbing water, and nutrients,

28
which accounts for clay dominated soils being nutrient rich (Gerrard, 2000; Brady and
Weil, 2008). This was observed at Ennerdale, with clay dominated soil from both the
moorland and forest, comprising high concentrations of exchangeable base cations (Fig.
3.4; 3.5). This does mean, however, that waterlogging of clay and peatland soil is
extremely common, with different tree species tolerating waterlogging better than others
(Paterson and Mason, 1999; Gerrard, 2000; Brown et al., 2010). For example, the roots of
Sitka spruce are particularly sensitive to waterlogging (Paterson and Mason, 1999).
4.2.2 Cation exchange capacity and base saturation
The cation exchange capacity (CEC) of a soil refers to the total amount of exchangeable
cations that it can absorb (Brady and Weil, 2008). The CEC of soil is expected to change
as vegetation does (Saikh et al., 1998), although this sometimes may not be evident until
several decades after afforestation (Olszewska and Smal, 2008). CEC is highly influential
upon soil texture, specifically the presence of negatively charged colloidal material,
namely clay particles (Chapman, in Holden, 2008). Soils dominated by clay particles, and
those which contain high organic matter content (moorland and forest soil in Ennerdale),
therefore have a higher CEC compared to sandier soils (those collected from the deforested
site in Ennerdale), which comprise of little negatively charged colloidal material (Cresser
et al., 1993; Brady and Weil, 2008; Chapman, in Holden, 2008). This could explain the
significantly higher concentration of exchangeable base cations observed at the moorland
and forested sites, compared to the deforested site (Fig. 3.4; 3.5).
Base saturation is highly related to the CEC of a soil, indicating the ‘proportion of
exchange sites occupied by base cations’, where a higher base saturation represents a more
fertile soil (Gerrard, 2000; Chapman, in Holden, 2008). Soil collected from the deforested
site in Ennerdale had a significantly lower LOI (an indication of organic matter, and
therefore negatively charged colloidal material) than soil collected from the other two sites
(Table 3.1; Fig. 3.1). This is similar to Clark et al., (2011), who also found peaty soil to
have higher LOI values. This probably explains the low base saturation level, and hence
concentration of exchangeable cations obtained from the deforested site (Table 3.2; Fig.
3.4; 3.5).
The CEC of a soil, and base saturation are somewhat influenced by soil acidity (Gerrard,
2000). The more acidic a soil is the higher the concentration of exchangeable aluminium
ions, which in turn dominate cation exchange sites because of their high ionic composition

29
(Goulding and Stevens, 1988). This decreases the absorption of exchangeable base
cations, most noticeably exchangeable calcium and exchangeable magnesium (Rowell,
1994; Ashman and Puri, 2002; Chapman, in Holden, 2008). As the CEC and base
saturation of a soil increases, it can therefore be expected that soil pH will increase too
(Brady and Weil, 2008). This was found by Olszewska and Smal (2008), where a decrease
in base saturation was observed after afforestation. In this study, however, this expected
relationship was not observed, as the soil from the forest had the highest base saturation of
60%, but the lowest soil pH.
4.2.3 Moorland
The main source of exchangeable base cations to moorland soil is by the direct weathering
of rock (Likens et al., 1977; Cresser et al., 1993). This was found particularly true of
potassium by Goulding and Stevens (1988). The high rates of rainfall Ennerdale receives,
will therefore rapidly weather the underlying ‘Ordovician mudstones and siltstones’
(Ennerdale Historic Landscape Survey, 2003), readily releasing base cations into the soil.
This is likely to explain the high concentrations of exchangeable calcium and
exchangeable potassium in the moorland soil, compared to lower concentrations of the
same base cations at the other sites (Fig. 3.4; 3.5).
4.2.4 Forest
The capture and accumulation of atmospheric cations by coniferous trees, over time
contributes to an increase in exchangeable base cation supply in the soil (Johnson and
Lindberg, in Adriano and Havas, 1989; Richter and Markewitz, 2001; Berthrong et al.,
2009). Atmospheric cation inputs reach the soil via precipitation, and absorption by the
trees, originating from various sources, including terrestrial dust, volcanic emissions and
oceanic spray (Likens et al., 1977; Gerrard, 2000). The presence of a tree canopy could
perhaps explain the significant increase in concentrations of exchangeable magnesium and
sodium in soils collected from the forest, compared to the moorland site (Fig. 3.4; 3.5).
This increase in exchangeable sodium could also be present because sodium is the base
cation which is the least preferred to be absorbed by cation exchange sites, as it is ‘not
essential to plant biochemistry’ (Cresser et al., 1993; Berthrong et al., 2009).
Exchangeable magnesium results obtained in this study differed to those found by
Berthrong et al., (2009), where afforestation was not proved to have a significant effect on
increasing soil magnesium concentration. The clay texture of forest soil could also suggest
30
the retention and increase of exchangeable base cations magnesium and sodium (Ashman
and Puri, 2002).
Plants rely on macronutrients present in the soil for growth and survival (Ashman and
Puri, 2002). Coniferous afforestation leads to a reduction in base cations from the soil as
they are readily taken up by trees, where they are stored in leaf litter and plant biomass
(Barton et al., 1999; Gerrard, 2000; Grieve, 2001; Olszewska and Smal, 2008; Berthrong
et al., 2009). Exchangeable calcium and potassium concentrations in the soil decreased
after coniferous afforestation (Fig. 3.4; 3.5), suggesting their rapid uptake by coniferous
trees. A decrease in calcium, magnesium, and potassium were found after afforestation in
studies by Johnson and Lindberg, in Adriano and Havas, (1989), Olszewska and Smal,
(2008), and Berthrong et al., (2009) under the afforestation of Pinus species. The decrease
in exchangeable calcium and potassium could also be explained by the increase in soil
acidity. Exchangeable base cation concentrations would decrease, as exchangeable
aluminium and exchangeable hydrogen ions would likely dominate cation exchange sites
(Fig. 4.1) (Gerrard, 2000; Brady and Weil, 2008). This was also found to be true by
Johnson and Lindberg, in Adriano and Havas, (1989) who concluded that a decrease in
exchangeable base cations was due to an increase in soil acidity, via acid deposition.
4.2.5 Deforested
Nutrients in a soil become depleted when their removal is higher than their addition
(Gerrard, 2001). Coniferous deforestation in Ennerdale led to the significant decrease in
all exchangeable base cations, from that of the forested site. Saikh et al., (1998) also
concluded that forest clearance was responsible for the significant decrease in
exchangeable base cations in the soil, whereas Johnson, (1992) stated that ‘most studies
show no significant change with harvesting’, contrasting to results from this study. The
uptake and storage of exchangeable base cations by coniferous trees undoubtedly played a
huge role in their reduction from the soil, removed when trees were harvested (Goulding
and Stevens, 1988). After all, there is a strong relationship between the recycling of
elements in soil and plants (Richter and Markewitz, 2001).
Leaching is the process most responsible for the loss of exchangeable base cations from a
soil, with ‘cations with the least affinity for exchange sites’ being lost most easily
(Gerrard, 2000). Precipitation levels play a significant role in the leaching of a soil
(Ashman and Puri, 2000), and with no forest canopy to intercept precipitation,
31
exchangeable base cations would be frequently washed out. This could create distinct
nutrient rich horizons lower down in the soil profile (Ashman and Puri, 2002). As well as
leaching, soil erosion can reduce exchangeable base cation concentrations, predominantly
in the topsoil where a high majority of exchangeable base cations are concentrated
(Ashman and Puri, 2002).
As previously established, soil texture plays a huge role in the loss of exchangeable base
cations from a soil. Soil collected from the deforested site, consisting of a sandy clay
loam, would pose larger pore spaces than that of the other two clay dominated sites, thus
allowing rapid water movement through the soil, and permitting dissolved exchangeable
base cations to be easily lost (Paterson and Mason, 1999; Gerrard, 2000; Ashman and Puri,
2002; Brady and Weil, 2008). The often poor quality, stony soils where afforestation takes
place is particularly poor in retaining nutrients, and so would likely enhance leaching
(Fisher and Binkley, 2000; Gerrard, 2000).
Leaching is known to aid the acidification of soil (Cresser et al., 1993; Olszewska and
Smal, 2008). Again, like in the forest soil, a reduction in exchangeable base cations would
suggest an increase in soil acidification, exchangeable aluminium and exchangeable
hydrogen ions dominating the exchange complex (Gerrard, 2000; Richter and Markewitz,
2001), however, this was not observed at Ennerdale.
4.3 Correlation between soil pH and exchangeable base cations
In this study, despite no significant correlations being observed between soil pH and
exchangeable base cations, slight trends were evident (Fig. 3.8; 3.9). As soil pH
increased, so too did the concentration of exchangeable calcium and potassium, although
only very slightly. An increase in exchangeable base cations as soil pH increases would be
expected, as the higher the soil pH, the less exchangeable aluminium and hydrogen ions
present in the soil. This would enable a higher potential for base cations to be held onto
the exchange sites of negatively charged colloidal material, as demonstrated in Fig. 4.1
(Brady and Weil, 2008; Chapman in Holden, 2008).
Exchangeable magnesium and sodium on the other hand decreased as soil pH increased
(Fig. 3.8; 3.9). This was not expected as these results do not fit in with previous literature
(Brady and Weil, 2008; Chapman, in Holden, 2008). Again, soil texture and LOI, thus

32
base saturation could perhaps partly explain these surprising correlations, as they account
for the low amount of negatively charged colloidal material present in the deforested soil,
limiting cation exchange sites. This, however, should be investigated further in the future.
It was evident that individual soil samples collected at each site were closely grouped
together, displaying trends of their own. Soil collected from the moorland site displayed
the most expected trends, exchangeable base cations increasing with soil pH, although
these may still not be proved significant if tested on their own.
Figure 4.1. Diagram taken from Brady and Weil, 2008 to show the relationship between
soil pH and exchangeable cations held on to cation exchange sites within a soil.
4.4 Available nitrogen
4.4.1 Moorland
Nitrogen is an essential macronutrient for plants, taken up in the forms of ammonium and
nitrate, but with nitrite being toxic to plants (Cresser et al., 1993; White, 1997; Brady and
Weil, 2008). As nitrogen ‘does not occur to any useful extent in primary minerals’
(Cresser et al., 1993), its input to the soil via fixation from the atmosphere is essential.
Nitrogen in the soil is capable of varying substantially over decades (Richter and
33
Markewitz, 2001). Soil collected from the moorland site had a significantly higher
concentration of ammonium compared to the other two sites (Fig. 3.6). Nitrate
concentration did not follow this pattern, however (Fig. 3.7).
4.4.2 Forest
Concentrations of both ammonium and nitrate decreased significantly from the moorland
site to the forested site. This could be expected since because nitrogen is a macronutrient
essential for the growth and survival of plants, afforestation hence leads to a significant
decrease in both available forms of nitrogen in forest soil (Rowell, 1994). Richter and
Markewitz (2001), stated that pine forests are known for the high concentrations of
available nitrogen they uptake, with Berthrong et al., (2009) also finding that along with
soil carbon, soil nitrogen decreased after afforestation when compared to soil collected
from native grasslands. They concluded that this was probably due to plant uptake. A
decline in soil nitrogen was also observed by Smal and Olszewska (2008), again, thought
to be due to the rapid uptake by fast growing coniferous tree species. A decline in nitrate
concentration from the mineral horizon was observed by Stevens and Hornung (1988),
proved true of this study also, as nitrate concentration in forest soil was extremely low at
< 0.00 mg/kg-1
.
Soil acidity can play a significant role in the amount of available nitrogen present in a soil.
Usually the more acidic a soil, the lower the macronutrient supply (Cresser et al., 1993;
Chapman, in Holden, 2008). Again, the more acidic the soil the more hydrogen ions
expected to be present, thus leading to an increase in exchangeable aluminium ions likely
dominating cation exchange sites (although this was not found to be true of this study). In
theory though, this would lead to a decrease in the positively charged ammonium ions
(NH4+) that can be held on cation exchange sites (as they will be taken up by exchangeable
aluminium) and so they could be readily leached from a soil. Nitrification rates can also
influence soil acidity (Richter and Markewitz, 2001), due to the production of hydrogen
ions in ammonium (Brady and Weil, 2008).
4.4.3 Deforested
Ammonium concentration was lowest in soil collected from the deforested site (Fig. 3.6).
This could be expected due to its uptake and retention by coniferous trees, accumulating in
the wood and bark, and therefore being lost during deforestation (Stevens and Hornung,

34
1988; Richter and Markewitz, 2001; Smal and Olszewska, 2008). Nitrate concentration,
however, was surprisingly highest in soil collected from the deforested site (Fig. 3.7),
increasing from that of the forested site. Stevens and Hornung (1988) also found nitrate
concentration to increase after deforestation, although reasons for this are unknown.
Nitrate too is extremely susceptible to leaching. Positively charged ammonium ions
(NH4+) can be held on cation exchange sites, but negatively charged nitrate (NO3
-) and
nitrite (NO2-) ions cannot, leading to them being easily leached from the soil (Cresser et
al., 1993; Rowell, 1994; Brady and Weil, 2008). Due to the soil collected from the
deforested site being of a sandy clay loam texture, leaching rates would have been high.
As soil carbon and soil nitrogen are indicators of soil acidity, a decrease in their
concentrations suggest an overall decrease in soil fertility (Berthrong et al., 2009). This
appears to be true of this study, as when a decrease in ammonium was observed in soil
collected from the deforested site, a decrease in all exchangeable base cations was also
observed (Fig. 3.4; 3.5; 3.6).
4.5 Limitations
There are several limitations which, if this study were to be conducted again, should be
considered. Firstly, there was probably not enough soil samples collected from each site to
truly represent their area, given their relative size. Number of soil samples permitted to
analyse in the laboratory was restricted, however, along with time. Individual soil samples
collected at each site sometimes showed much variability, with Cresser et al., (1993)
stating that even over small distances, soil pH can vary by up to two units. The more
samples used in analysis would therefore reduce this variability. It would also have been
interesting to examine the effects of coniferous afforestation and deforestation on the
physical properties of soil as well. Individual soil samples were comprised of both organic
and mineral soil horizons, this combination of different horizons could inevitably have
lead to a misinterpretation of the true soil conditions that are in fact present for individual
horizons, so in the future should be analysed separately.
Insufficient time had elapsed after the coniferous forest was deforested to truly examine
the effects coniferous deforestation has had on the chemical properties of soil. This study
was conducted to provide only an indication of results, however. In terms of significantly

35
changing soil properties, ten years is not considered a long time. Smal and Olszewska,
(2008) suggested that significant changes in soil properties may not be observed until
several decades are afforestation.

36
5. Conclusion
Overall, it can be concluded that both coniferous afforestation and deforestation led to
substantial changes in the chemical properties of soil. With the moorland site in Ennerdale
acting as a control site, it could be established that coniferous afforestation led to a
reduction in soil pH, making the forested site in Ennerdale the most acidic of the three
examined. Coniferous deforestation could then be recognised to increase soil pH, reducing
its acidity, due to the loss of the coniferous tree canopy. Exchangeable acidity results,
however, were not as expected and so did not interlink with soil pH results. Despite
coniferous afforestation leading to the lowest soil pH, exchangeable acidity was not the
highest. This would have been predicted with decreasing soil pH, due to the increasing
exchangeable hydrogen ions, and in turn exchangeable aluminium ions. Coniferous
deforestation in fact surprisingly led to the overall lowest exchangeable acidity
(exchangeable aluminium and exchangeable hydrogen ions combined).
Compared to the moorland control site, coniferous afforestation led to varying
concentrations of exchangeable base cations. Exchangeable magnesium and sodium
increased, probably due to their capture from the atmosphere and thus accumulation by the
coniferous tree canopy. Exchangeable calcium and potassium on the other hand
decreased, which was undoubtedly due to their considerable increase in uptake by the
coniferous trees for growth and survival. Despite coniferous afforestation leading to a
variety of both increases and decreases in individual exchangeable base cations, coniferous
deforestation led to the significant reduction in all exchangeable base cation
concentrations. It could be predicted, however, that differing soil texture between sites,
namely the sandier deforested soil, played a huge role in this. No significant relationships
were observed between soil pH and exchangeable base cation concentrations, which did
not coincide with past literature.
Ammonium and nitrate results differed in their concentration pattern, making it difficult to
establish a true pattern for overall available nitrogen. Coniferous afforestation led to a
decrease in both forms of nitrogen compared to the moorland control site, suggesting tree
uptake was a dominant factor in reducing this macronutrient. This was accompanied by
the highest LOI, representative of organic matter. Coniferous deforestation, however,
proved to be much more variable, leading to a decrease in ammonium concentration, but

37
an increase in nitrate concentration. The lowest LOI was observed at the deforested site,
though its sandy clay loam soil texture should be considered.
Taking everything into account, it can be established that coniferous afforestation led to an
overall decrease in soil quality, as almost every chemical property measured (bar
exchangeable magnesium and sodium) decreased from that of the moorland site.
Coniferous deforestation, however, seems to have exacerbated these poor conditions,
despite an overall increase in soil pH. Soil pH is nevertheless such an influential factor for
numerous chemical soil properties that despite a lack of significant increases in
exchangeable base cations and available nitrogen, this increasing soil pH result is
somewhat encouraging.
The realisation of the negative effects coniferous afforestation has on soil chemical
properties, has, and will continue to grow with the help of influential organisations such as
the Forestry Commission, National Trust, and United Utilities. Despite coniferous
deforestation only leading to a positive increase in soil pH, it should be remembered that
coniferous deforestation is only the first step in improving soil conditions at Ennerdale
under the ‘Wild Ennerdale’ rewilding initiative. Reforestation of native broadleaf
deciduous species is the next stage of ‘Wild Ennerdale’, attempting to return the landscape
back to its once semi-natural state, and so analysis of reforested areas such as these should,
in due course be analysed too. Hopefully, this will see the eventual desired return of
exchangeable base cations and available nitrogen to the soil, aiding soil improvement in
the future. Therefore, as a continuation of this study, the effect of deciduous reforestation
on the chemical properties of soil within Ennerdale should be examined, to see if there is
an improvement in soil quality, preserving this fundamental resource.
To further this study, long term monitoring of soil from the same coniferous deforested site
within Ennerdale could be undertaken, say every decade, to establish a real pattern in the
changing chemical properties of soil, until reforestation of the site commences. The lack
of significant results suggests that it takes longer than a ten year period for soil chemical
properties to actually improve, which can be expected seeing as soil takes hundreds, if not
thousands of years to form. The effect both coniferous afforestation and deforestation
have on other environmental factors could also be considered, to widen our knowledge of
the ecosystem as a whole. The tightly coupled integrated river ecosystem, for example,
could be taken into account, specifically water quality and macroinvertebrate community

38
composition. Many studies have considered the effect coniferous afforestation has on river
ecosystems, but the effects of coniferous deforestation are lacking, especially studies
which combine the two. Whole ecosystems should benefit from improved soil conditions,
enabling a greater number of species, both florally and faunally, to be supported.
Although not specifically looked at within this study, soil is particularly important as a
store of carbon, which if frequently released could contribute significantly to global
warming (Chapman, in Holden, 2008). This is another aspect of soil chemistry that could
be investigated, to further our knowledge and understanding of potential future climate
change, enabling us to recognise just how influential coniferous deforestation is on soil
carbon reserves.

39
6. References
ADRIANO, D.C. & M. HAVAS., 1989. Acidic Precipitation Volume 1: Case Studies.
Springer-Verlag: New York.
ANDERSON, A.R., D.G. PYATT. & J.P. STANNARD., 1990. The Effects of Clearfelling
a Sitka Spruce Stand on the Water Balance of a Peaty Gley Soil at Kershope Forest,
Cumbria. Forestry 63: 51-71.
ASHMAN, M.R. & G. PURI., 2002. Essential Soil Science. Blackwell Science: Oxford.
BARDGETT, R., 2005. The Biology of Soil: A community and ecosystem approach.
Oxford University Press: Oxford.
BARTON, D., S.M. GAMMACK, M.F. BILLETT. & M.S. CRESSER., 1999. Sulphate
adsorption and acidification of Calluna heathland and Scots pine forest podzol soils in
north-east Scotland. Forest Ecology and Management 114: 151-164.
BBC., 2012. Nature; Wildlife; Moorland [online]. [02/03/2012]. Available from:
www.bbc.co.uk/nature/habitats/Moorland.
BERTHRONG, S.T., E.G. JOBBAGY. & R.B. JACKSON., 2009. A global meta-analysis
of soil exchangeable cations, pH, carbon, and nitrogen with afforestation. Ecological
Applications 19: 2228-2241.
BRADY, N.C. & R.R. WEIL., 2008. The Nature and Properties of Soils. Pearson: New
Jersey.
BROWN, L.E., L. COOPER., J. HOLDEN. & S.J. RAMCHUNDER., 2010. A comparison
of stream water temperature regimes from open and afforested moorland, Yorkshire Dales,
northern England. Hydrological Processes 24: 3206-3218.
BUTLER, R.A., 2010. Deforestation in the Amazon [online]. [25/02/2012]. Available
from: www.mongabay.com/brazil.html.
CLARK, J.M., G.M.F. van der HEIJDEN, S.M. PALMER, P.J. CHAPMAN. & S.H.
BOTTRELL. 2011. Variation in the sensitivity of DOC release between different organic
soils following H2SO4 and sea-salt additions. European Journal of Soil Science 67: 267-
284.
40
CONVERY, I. & T. DUTSON., 2008. Rural Communities and Landscape Change: A Case
Study of Wild Ennerdale. Journal of Rural and Community Development 3: 104-118.
CRESSER, M., K. KILLHAM. & T. EDWARDS., 1993. Soil chemistry and its
applications. Cambridge University Press: Cambridge.
CUMBRIA HILL FARMING., 2008. Ennerdale Valley [online]. [17/02/2012]. Available
from: www.cumbriahillfarming.org.uk/valleys/ennerdale.html.
DYTHAM, C., 2003. Choosing and Using Statistics: A Biologist’s Guide. Blackwell
Publishing: Oxford.
ENNERDALE HISTORIC LANDSCAPE SURVEY., 2003. Ennerdale, West Cumbria;
Historic Landscape Survey [online]. [24/02/2012]. Available from:
www.wildennerdale.co.uk/images/library/Historic%20Landscape%20Survey%202003.pdf.
ENNOS, R., 2007. Statistical and Data Handling Skills in Biology. Pearson Education:
Harlow.
FISHER, R.F. & D. BINKLEY., 2000. Ecology and management of forest soils. Wiley:
New York.
FOREST AUTHORITY., 1998. Forest and soil conservation guidelines. Forestry
Commission: Great Britain.
FORESTRY COMMISSION., 2012. Forestry Statistics 2011 – International Forestry
[online]. [11/11/2011]. Available from:
www.forestry.gov.uk/website/forstats2011.nsf/0/4B2ADD432342111280257361003D32C
5.
FOWLER, J., L. COHEN. & P. JARVIS., 1998. Practical Statistics for Field Biology.
Wiley: Chichester.
FRYER, G., 1981. The copepod Salmincola edwardsii as a parasite of Salvelinus alpines
in Britain, and a consideration of the so-called relict fauna of Ennerdale Water. Journal of
Zoology 193: 253-268.
GERRARD, J., 2000. Fundamentals of soils. Routledge: London.

41
GOULDING, K.W.T. & P.A. STEVENS., 1988. Potassium reserves in a forested, acid
upland soil and the effect on them of clear-felling versus whole-tree harvesting. Soil Use
and Management 4: 45-51.
GRIEVE, I.C., 2001. Human impacts on soil properties and their implications for the
sensitivity of soil systems in Scotland. Catena 42: 361-374.
HOLDEN, J., 2008. An Introduction to Physical Geography and the Environment.
Pearson: Harlow.
LIKENS, G.E., F. H. BORMANN., R.S. PIERCE., J.S., EATON. & N.M. JOHNSON.,
1977. Bio- Geo- Chemistry of a Forested Ecosystem. Springer-Verlag: New York.
MACDONALD, C.A., N. THOMAS., L. ROBINSON, K.R. TATE, D.J. ROSS, J.
DANDO. & B.K. SINGH., 2009. Physiological, biochemical and molecular responses of
the soil microbial community after afforestation of pastures with Pinus radiata. Soil
Biology and Biochemistry 41: 1642-1651.
MALHI, Y., P. MEIR. & S. BROWN., 2002. Forests, carbon and global climate.
Philosophical Transactions of the Royal Society A 360: 1567-1591.
NEAL, C., B. REYNOLDS, C.J. SMITH, S. HILL, M. NEAL, T. CONWAY, G.P.
RYLAND, H. JEFFREY, A.J. ROBSON. & R. FISHER., 1992. The impact of conifer
harvesting on stream water pH, alkalinity and aluminium concentrations for the British
uplands: an example for an acidic and acid sensitive catchment in mid-Wales. The Science
of the Total Environment 126: 75-87.
OLSZEWSKA, M. & H. SMAL., 2008. The effect of afforestation with Scots pine (Pinus
silvestris L.) of sandy post-arable soils on their selected properties. I. Physical and sorptive
properties. Plant and Soil 305: 157-169.
OXBROUGH, A.G., T. GITTINGS, J. O’HALLORAN, P.S. GILLER. & T.C. KELLY.,
2006. The initial effects of afforestation on the ground-dwelling spider fauna of Irish
peatlands and grasslands. Forest Ecology and Management 237: 478-491.
PATERSON, D.B. & W.L. MASON., 1999. Cultivation of Soils for Forestry (Forestry
Commission Bulletin 119). Crown Copyright: Norwich.

42
REYNOLDS, B., C. NEAL, M. HORNUNG, S. HUGES. & P.A. STEVENS., 1988.
Impact of afforestation on the soil solution chemistry of stagnopodzols in mid-Wales.
Water, Air, and Soil Pollution 38: 55-70.
RICHTER, D.D (Jr). & D. MARKEWITZ., 2001. Understanding Soil Change: Soil
Sustainability over Millennia, Centuries, and Decades. Cambridge University Press:
Cambridge.
ROWELL, D.L., 1994. Soil Science: Methods and Applications. Longman: Harlow.
SAIKH, H., C. VARADACHARI. & K. GHOSH., 1998. Effects of deforestation and
cultivation on soil CEC and contents of exchangeable bases: A case study in Simlipal
National Park, India. Plant and Soil 204: 175-181.
SMAL, H. & M. OLSZEWSKA., 2008. The effect of afforestation with Scots pine (Pinus
silvestris L.) of sandy post-arable soils on their selected properties. II. Reaction, carbon,
nitrogen and phosphorus. Plant and Soil 305: 171-187.
STEVENS, P.A. & M. HORNUNG., 1988. Nitrate leaching from a felled Sitka spruce
plantation in Beddgelert Forest, North Wales. Soil Use and Management 4: 3-9.
STROBEL, B.W., H.C.B. HANSEN, O.K. BORGGAARD, M.K. ANDERSEN. & K.
RAULUND-RASMUSSEN., 2001. Composition and reactivity of DOC in forested floor
soil solutions in relation to tree species and soil type. Biogeochemistry 56: 1-26.
WHITE, R.E., 1997. Principles and Practice of Soil Science: The Soil as a Natural
Resource. Blackwell Science Limited: Oxford.
WILD ENNERDALE., 2006(a). Wild Ennerdale Stewardship Plan: 16.iii. Forestry
[online]. [31/01/2012]. Available from:
www.wildennerdale.co.uk/stplan/text/16.iii%20forestry.pdf.
WILD ENNERDALE., 2006(b). Wild Ennerdale Stewardship Plan: 3. Ennerdale – The
Place [online]. [31/01/2012]. Available from:
www.wildennerdale.co.uk/stplan/text/3%20The%20Place.pdf.
WORDSWORTH COUNTRY., 2012. Maps of Cumbria and the Lake District [online].
[24/02/2012]. Available from: www.wordsworthcountry.com/maps.htm.
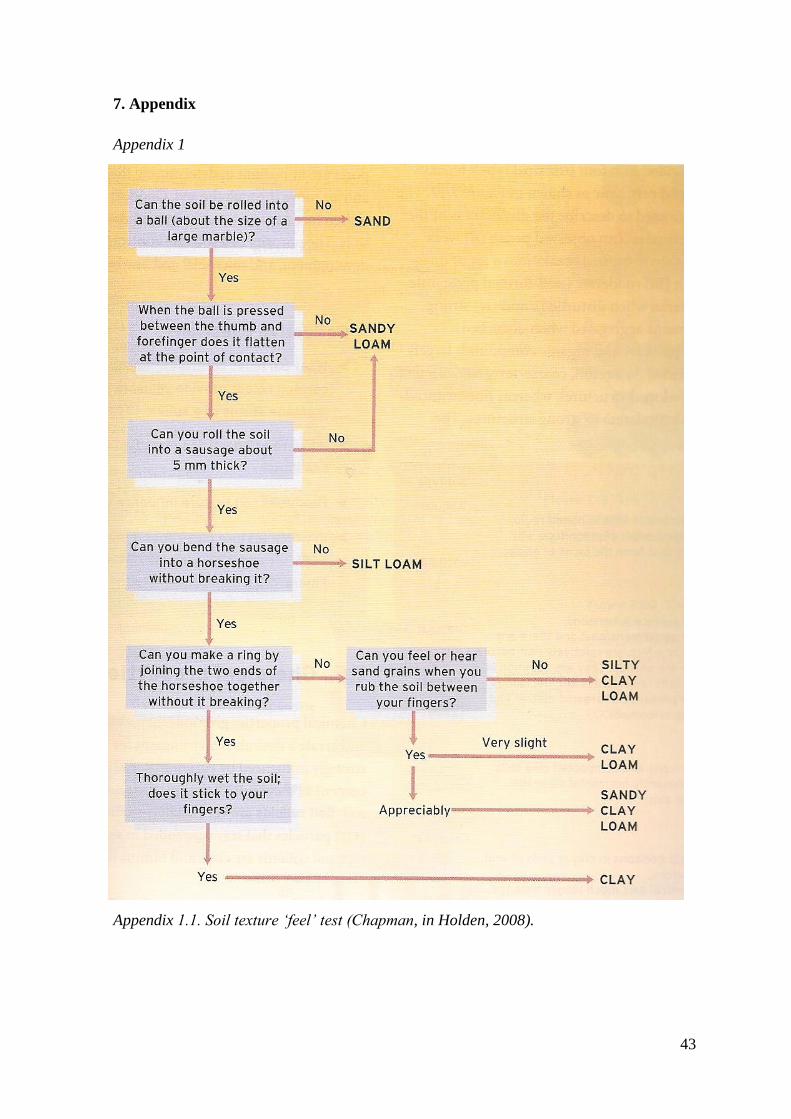
43
7. Appendix
Appendix 1
Appendix 1.1. Soil texture ‘feel’ test (Chapman, in Holden, 2008).

44
Appendix 2
Sampling selection grids
Appendix 2.1 Soil sampling grid selection for the moorland site.
Extra random numbers generated: 119, 90, 98, 33, 46, 101, 199, 46, 78, 26, 112, 8, 179,
186, and 60.
211 212 213 214 215 216 217 218 219 220 221 222 223 224 225
196 197 198 199 200 201 202 203 204 205 206 207 208 209 210
181 182 183 184 185 186 187 188 189 190 191 192 193 194 195
166 167 168 169 170 171 172 173 174 175 176 177 178 179 180
151 152 153 154 155 156 157 158 159 160 161 162 163 164 165
136 137 138 139 140 141 142 143 144 145 146 147 148 149 150
121 122 123 124 125 126 127 128 129 130 131 132 133 134 135
106 107 108 109 110 111 112 113 114 115 116 117 118 119 120
91 92 93 94 95 96 97 98 99 100 101 102 103 104 105
76 77 78 79 80 81 82 83 84 85 86 87 88 89 90
61 62 63 64 65 66 67 68 69 70 71 72 73 74 75
46 47 48 49 50 51 52 53 54 55 56 57 58 59 60
31 32 33 34 35 36 37 38 39 40 41 42 43 44 45
16 17 18 19 20 21 22 23 24 25 26 27 28 29 30
1 2 3 4 5 6 7 8 9 10 11 12 13 14 15

45
Appendix 2.2 Soil sampling grid selection for the coniferous afforested site.
Extra random numbers generated: 8, 17, 23, 194, 54, 1, 170, 201, 15, 186, 117, 182, 141,
158, and 23.
211 212 213 214 215 216 217 218 219 220 221 222 223 224 225
196 197 198 199 200 201 202 203 204 205 206 207 208 209 210
181 182 183 184 185 186 187 188 189 190 191 192 193 194 195
166 167 168 169 170 171 172 173 174 175 176 177 178 179 180
151 152 153 154 155 156 157 158 159 160 161 162 163 164 165
136 137 138 139 140 141 142 143 144 145 146 147 148 149 150
121 122 123 124 125 126 127 128 129 130 131 132 133 134 135
106 107 108 109 110 111 112 113 114 115 116 117 118 119 120
91 92 93 94 95 96 97 98 99 100 101 102 103 104 105
76 77 78 79 80 81 82 83 84 85 86 87 88 89 90
61 62 63 64 65 66 67 68 69 70 71 72 73 74 75
46 47 48 49 50 51 52 53 54 55 56 57 58 59 60
31 32 33 34 35 36 37 38 39 40 41 42 43 44 45
16 17 18 19 20 21 22 23 24 25 26 27 28 29 30
1 2 3 4 5 6 7 8 9 10 11 12 13 14 15

46
Appendix 2.3 Soil sampling grid selection for the coniferous deforested site.
Extra random numbers generated: 178, 68, 11, 98, 74, 124, 61, 112, 151, 191, 189, 59,
222, 76, and 207.
211 212 213 214 215 216 217 218 219 220 221 222 223 224 225
196 197 198 199 200 201 202 203 204 205 206 207 208 209 210
181 182 183 184 185 186 187 188 189 190 191 192 193 194 195
166 167 168 169 170 171 172 173 174 175 176 177 178 179 180
151 152 153 154 155 156 157 158 159 160 161 162 163 164 165
136 137 138 139 140 141 142 143 144 145 146 147 148 149 150
121 122 123 124 125 126 127 128 129 130 131 132 133 134 135
106 107 108 109 110 111 112 113 114 115 116 117 118 119 120
91 92 93 94 95 96 97 98 99 100 101 102 103 104 105
76 77 78 79 80 81 82 83 84 85 86 87 88 89 90
61 62 63 64 65 66 67 68 69 70 71 72 73 74 75
46 47 48 49 50 51 52 53 54 55 56 57 58 59 60
31 32 33 34 35 36 37 38 39 40 41 42 43 44 45
16 17 18 19 20 21 22 23 24 25 26 27 28 29 30
1 2 3 4 5 6 7 8 9 10 11 12 13 14 15

47
Appendix 3
Appendix 3.1 Raw data from soil collected at the moorland site.
Exchangeable Acidity
Exchangeable Base Cations
Available Nitrogen
Sampling
pH
H+ +
Al3+
Al3+
H+
Ca K Mg Na
Ammonium
NH4
Nitrate
NO3
Nitrite
NO2
% LOI
Square
CaCl2
cmol
kg-1
cmol
kg-1
cmol
kg-1
cmol
kg-1
cmol
kg-1
cmol
kg-1
cmol
kg-1
mg kg-1
mg kg-1
mg kg-1
5
3.01
23.8422 10.6488 13.1934
1.3862 0.6160 1.5523 0.9478
11.6125 0.1197 0.0150
60.5008
17
3.56
10.0576 5.8115 4.2460
4.0650 1.2425 3.5486 1.1705
11.9698 -0.0299 0.0199
75.6807
30
3.44
8.6355 5.4855 3.1499
3.8114 1.0752 3.8388 0.9730
21.3344 0.9082 0.0149
72.8403
34
3.48
11.9957 5.0982 6.8975
2.4138 1.1088 2.3939 1.2884
18.5041 -0.3140 0.0199
69.4133
35
3.62
13.8557 6.9169 6.9388
3.1639 1.4482 3.5601 1.2893
25.3981 -0.3544 0.0250
90.2517
43
3.21
23.3381 8.5780 14.7601
1.5831 0.6631 1.9419 1.0281
21.0403 -0.2596 0.0200
58.8691
45
3.33
9.9444 7.3920 2.5524
2.2200 0.6595 2.2654 0.6500
18.0833 -0.0499 0.0199
64.0490
48
3.36
9.3591 5.7661 3.5930
3.3145 1.3078 3.8751 1.2309
18.6790 0.4587 0.0199
77.5367
66
3.43
5.0357 2.5398 2.4960
6.2363 1.3779 6.4444 1.2037
17.9490 -0.0199 0.0347
94.7467
100
3.48
6.6081 2.5820 4.0261
6.4338 1.6836 6.3218 1.4778
23.9839 0.0549 0.0100
93.1052
103
3.55
10.5288 6.5750 3.9538
3.5901 1.4199 4.6582 1.0473
14.9848 0.0150 0.0200
89.4132
125
3.46
10.2532 5.3326 4.9205
4.6368 1.6507 4.8914 1.1985
20.9935 0.0000 0.0198
88.8961
127
3.64
7.9005 3.5847 4.3158
4.9828 0.8483 5.2569 1.0506
24.5818 -0.0100 0.0548
88.5354
155
3.27
12.2457 9.8430 2.4028
1.9538 1.0278 1.9059 1.3273
16.2887 -0.0497 0.0249
56.8150
194
3.34
11.7303 9.7860 1.9442
0.7656 0.3878 0.6634 0.5834
8.9624 -0.2973 0.0198
32.0442
Average
3.41
11.6887 6.3960 5.2927
3.3705 1.1011 3.5412 1.0978
18.2910 0.0115 0.0226
74.1798
Replicates
45
3.26
10.6663 7.1670 3.4994
2.3546 0.4697 2.2838 0.8533
27.5318 0.0149 0.0645
64.6035
194
3.38
12.4379 10.1608 2.2771
1.0076 0.8307 0.7707 0.8834
11.9382 -0.2339 0.0149
31.5515
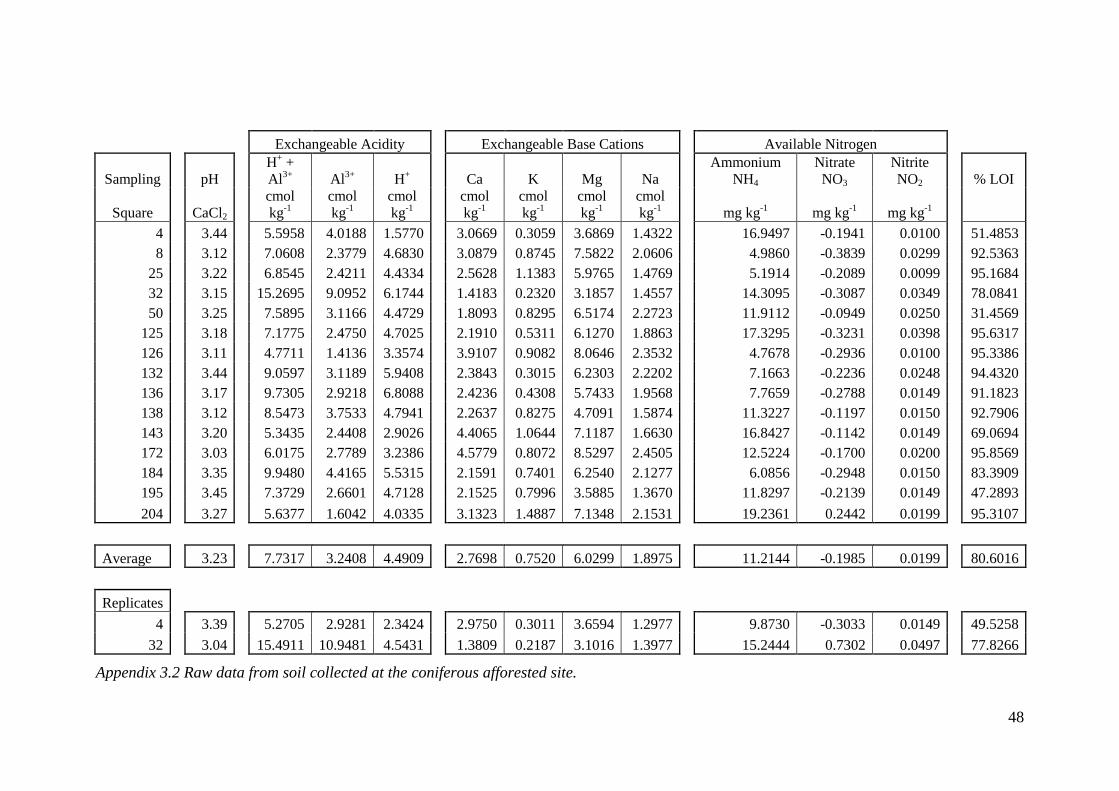
48
Appendix 3.2 Raw data from soil collected at the coniferous afforested site.
Exchangeable Acidity
Exchangeable Base Cations
Available Nitrogen
Sampling
pH
H+ +
Al3+
Al3+
H+
Ca K Mg Na
Ammonium
NH4
Nitrate
NO3
Nitrite
NO2
% LOI
Square
CaCl2
cmol
kg-1
cmol
kg-1
cmol
kg-1
cmol
kg-1
cmol
kg-1
cmol
kg-1
cmol
kg-1
mg kg-1
mg kg-1
mg kg-1
4
3.44
5.5958 4.0188 1.5770
3.0669 0.3059 3.6869 1.4322
16.9497 -0.1941 0.0100
51.4853
8
3.12
7.0608 2.3779 4.6830
3.0879 0.8745 7.5822 2.0606
4.9860 -0.3839 0.0299
92.5363
25
3.22
6.8545 2.4211 4.4334
2.5628 1.1383 5.9765 1.4769
5.1914 -0.2089 0.0099
95.1684
32
3.15
15.2695 9.0952 6.1744
1.4183 0.2320 3.1857 1.4557
14.3095 -0.3087 0.0349
78.0841
50
3.25
7.5895 3.1166 4.4729
1.8093 0.8295 6.5174 2.2723
11.9112 -0.0949 0.0250
31.4569
125
3.18
7.1775 2.4750 4.7025
2.1910 0.5311 6.1270 1.8863
17.3295 -0.3231 0.0398
95.6317
126
3.11
4.7711 1.4136 3.3574
3.9107 0.9082 8.0646 2.3532
4.7678 -0.2936 0.0100
95.3386
132
3.44
9.0597 3.1189 5.9408
2.3843 0.3015 6.2303 2.2202
7.1663 -0.2236 0.0248
94.4320
136
3.17
9.7305 2.9218 6.8088
2.4236 0.4308 5.7433 1.9568
7.7659 -0.2788 0.0149
91.1823
138
3.12
8.5473 3.7533 4.7941
2.2637 0.8275 4.7091 1.5874
11.3227 -0.1197 0.0150
92.7906
143
3.20
5.3435 2.4408 2.9026
4.4065 1.0644 7.1187 1.6630
16.8427 -0.1142 0.0149
69.0694
172
3.03
6.0175 2.7789 3.2386
4.5779 0.8072 8.5297 2.4505
12.5224 -0.1700 0.0200
95.8569
184
3.35
9.9480 4.4165 5.5315
2.1591 0.7401 6.2540 2.1277
6.0856 -0.2948 0.0150
83.3909
195
3.45
7.3729 2.6601 4.7128
2.1525 0.7996 3.5885 1.3670
11.8297 -0.2139 0.0149
47.2893
204
3.27
5.6377 1.6042 4.0335
3.1323 1.4887 7.1348 2.1531
19.2361 0.2442 0.0199
95.3107
Average
3.23
7.7317 3.2408 4.4909
2.7698 0.7520 6.0299 1.8975
11.2144 -0.1985 0.0199
80.6016
Replicates
4
3.39
5.2705 2.9281 2.3424
2.9750 0.3011 3.6594 1.2977
9.8730 -0.3033 0.0149
49.5258
32
3.04
15.4911 10.9481 4.5431
1.3809 0.2187 3.1016 1.3977
15.2444 0.7302 0.0497
77.8266

49
Appendix 3.3 Raw data from soil collected at the coniferous deforested site.
Exchangeable Acidity
Exchangeable Base Cations
Available Nitrogen
Sampling
pH
H+ +
Al3+
Al3+
H+
Ca K Mg Na
Ammonium
NH4
Nitrate
NO3
Nitrite
NO2
% LOI
Square
CaCl2
cmol
kg-1
cmol
kg-1
cmol
kg-1
cmol
kg-1
cmol
kg-1
cmol
kg-1
cmol
kg-1
mg kg-1
mg kg-1
mg kg-1
2
3.34
8.3515 4.9090 3.4424
1.0230 1.4872 0.5918 0.9788
3.0722 -0.1743 0.0100
14.4893
3
3.25
7.4749 5.1467 2.3282
1.1159 0.3928 0.7147 0.6956
5.9220 0.1494 0.0149
16.8994
7
3.26
5.5702 4.0964 1.4738
2.2463 2.6377 1.9776 1.0220
11.9625 0.0894 0.0199
21.2247
9
3.28
5.5305 3.3447 2.1859
3.5587 0.8171 2.6738 0.9304
15.5983 0.2630 0.0347
46.4243
12
3.16
8.5508 6.0553 2.4955
3.0895 0.2781 4.0483 1.1467
22.8431 0.1589 0.0248
81.3111
17
3.22
8.0815 6.4734 1.6082
0.7608 0.2071 0.5540 0.8272
5.1951 0.1245 0.0100
14.1217
33
3.53
7.7092 6.2610 1.4481
0.9205 0.3329 0.6380 0.7968
8.7871 0.0843 0.0298
11.6403
68
3.42
6.6791 5.2494 1.4297
0.9928 0.1932 0.6138 0.7353
2.2471 0.2183 0.0149
10.3826
76
3.36
8.0816 6.7869 1.2947
0.8365 1.0459 0.7581 0.6541
11.8440 0.2739 0.0398
14.6607
99
3.42
7.6784 5.9101 1.7684
1.0279 0.2452 1.1079 0.6731
9.9746 0.2678 0.0198
21.0709
107
3.26
8.1333 6.0897 2.0435
0.5795 0.1185 0.5714 0.4930
11.8689 0.3491 0.0150
11.1716
138
3.24
9.1854 7.3567 1.8288
0.5629 0.1684 0.7610 0.4195
5.5332 0.1293 0.0199
14.4659
156
3.22
5.0318 4.2750 0.7568
0.6336 0.1729 0.8210 0.3726
17.6209 -0.1344 0.0249
11.2710
178
3.51
6.6168 5.7249 0.8919
1.0159 0.4287 0.8129 0.7175
4.0731 -0.0644 0.0248
15.0785
219
3.56
6.9618 6.5254 0.4364
0.7319 0.1910 0.7639 0.6221
2.9664 -0.3096 0.0250
15.0410
Average
3.34
7.3091 5.6136 1.6955
1.2730 0.5811 1.1605 0.7390
9.3006 0.0950 0.0219
21.2835
Replicates
76
3.38
18.5811 5.8916 12.6896
0.8321 0.2884 0.7745 0.6142
3.2845 -0.2396 0.0449
14.4345
99
3.62
8.2752 5.9381 2.3371
1.0300 0.3334 1.1174 0.6358
8.8090 0.2384 0.0199
24.0505