The Impact of Community Masking on COVID-19: A Cluster ...
94
The Impact of Community Masking on COVID-19: A Cluster-Randomized Trial in Bangladesh Jason Abaluck †,‡,1 , Laura H Kwong †,2,3 , Ashley Styczynski †,4 Ashraful Haque 5 , Md. Alamgir Kabir 5 , Ellen Bates-Jeffries 6 Emily Crawford 1 , Jade Benjamin-Chung 7 , Shabib Raihan 5 Shadman Rahman 5 , Salim Benhachmi 8 , Neeti Zaman 5 Peter J. Winch 9 , Maqsud Hossain 10 , Hasan Mahmud Reza 11 , Abdullah All Jaber 10 , Shawkee Gulshan Momen 10 , Faika Laz Bani 10 , Aura Rahman 10 , Tahrima Saiha Huq 10 , Stephen P. Luby §,2,4 , Ahmed Mushfiq Mobarak §,1,12 * August 31, 2021 Summary: A randomized-trial of community-level mask promotion in rural Bangladesh during COVID-19 shows that the intervention tripled mask usage and reduced symptomatic SARS-CoV-2 infections, demonstrating that promoting community mask-wearing can improve public health. * ‡ Address correspondence to [email protected] and [email protected]. † denotes co-first author, § denotes co-last author. Author affiliations: 1. Yale School of Management, Yale University, New Haven, CT, USA; 2. Woods Institute for the Environment, Stanford University, Stanford, CA, USA; 3. Division of Environ- mental Health Sciences, University of California Berkeley, Berkeley, CA, USA; 4. Division of Infectious Diseases and Geographic Medicine, Stanford University, Stanford, CA, USA; 5. Innovations for Poverty Action Bangladesh, Dhaka, Bangladesh; 6. Innovations for Poverty Action, Evanston, IL, USA; 7. Department of Epidemiology and Public Health, Stanford University, Stanford, CA, USA; 8. Yale Research Initiative on Innovation and Scale, Yale University, New Haven, CT, USA; 9. Social and Behavioral Interventions Program, Johns Hopkins Bloomberg School of Public Health, Baltimore, MD, USA; 10. NGRI, North South University, Dhaka, Bangladesh; 11. Department of Pharmaceutical Sciences, North South University, Dhaka, Bangladesh; 12. Deakin University, Melbourne, Australia. 1
Transcript of The Impact of Community Masking on COVID-19: A Cluster ...

The Impact of Community Masking on COVID-19:
A Cluster-Randomized Trial in Bangladesh
Jason Abaluck†,‡,1, Laura H Kwong†,2,3, Ashley Styczynski†,4
Ashraful Haque5, Md. Alamgir Kabir5, Ellen Bates-Jeffries6
Emily Crawford1, Jade Benjamin-Chung7, Shabib Raihan5
Shadman Rahman5, Salim Benhachmi8, Neeti Zaman5
Peter J. Winch9, Maqsud Hossain10, Hasan Mahmud Reza11,
Abdullah All Jaber10, Shawkee Gulshan Momen10,
Faika Laz Bani10, Aura Rahman10, Tahrima Saiha Huq10,
Stephen P. Luby §,2,4, Ahmed Mushfiq Mobarak §,1,12 *
August 31, 2021
Summary: A randomized-trial of community-level mask promotion in rural Bangladesh during
COVID-19 shows that the intervention tripled mask usage and reduced symptomatic SARS-CoV-2
infections, demonstrating that promoting community mask-wearing can improve public health.
*‡ Address correspondence to [email protected] and [email protected]. † denotes co-first author,§ denotes co-last author. Author affiliations: 1. Yale School of Management, Yale University, New Haven, CT,USA; 2. Woods Institute for the Environment, Stanford University, Stanford, CA, USA; 3. Division of Environ-mental Health Sciences, University of California Berkeley, Berkeley, CA, USA; 4. Division of Infectious Diseasesand Geographic Medicine, Stanford University, Stanford, CA, USA; 5. Innovations for Poverty Action Bangladesh,Dhaka, Bangladesh; 6. Innovations for Poverty Action, Evanston, IL, USA; 7. Department of Epidemiology andPublic Health, Stanford University, Stanford, CA, USA; 8. Yale Research Initiative on Innovation and Scale, YaleUniversity, New Haven, CT, USA; 9. Social and Behavioral Interventions Program, Johns Hopkins Bloomberg Schoolof Public Health, Baltimore, MD, USA; 10. NGRI, North South University, Dhaka, Bangladesh; 11. Department ofPharmaceutical Sciences, North South University, Dhaka, Bangladesh; 12. Deakin University, Melbourne, Australia.
1

Abstract
Background: Mask usage remains low across many parts of the world during the COVID-
19 pandemic, and strategies to increase mask-wearing remain untested. Our objectives were
to identify strategies that can persistently increase mask-wearing and assess the impact of
increasing mask-wearing on symptomatic SARS-CoV-2 infections.
Methods: We conducted a cluster-randomized trial of community-level mask promotion in
rural Bangladesh from November 2020 to April 2021 (N=600 villages, N=342,126 adults).
We cross-randomized mask promotion strategies at the village and household level, including
cloth vs. surgical masks. All intervention arms received free masks, information on the impor-
tance of masking, role modeling by community leaders, and in-person reminders for 8 weeks.
The control group did not receive any interventions. Neither participants nor field staff were
blinded to intervention assignment. Outcomes included symptomatic SARS-CoV-2 seropreva-
lence (primary) and prevalence of proper mask-wearing, physical distancing, and symptoms
consistent with COVID-19 (secondary). Mask-wearing and physical distancing were assessed
through direct observation at least weekly at mosques, markets, the main entrance roads to
villages, and tea stalls. At 5 and 9 weeks follow-up, we surveyed all reachable participants
about COVID-related symptoms. Blood samples collected at 10-12 weeks of follow-up for
symptomatic individuals were analyzed for SARS-CoV-2 IgG antibodies.
Results: There were 178,288 individuals in the intervention group and 163,838 individuals
in the control group. The intervention increased proper mask-wearing from 13.3% in control
villages (N=806,547 observations) to 42.3% in treatment villages (N=797,715 observations)
(adjusted percentage point difference = 0.29 [0.27, 0.31]). This tripling of mask usage was sus-
tained during the intervention period and two weeks after. Physical distancing increased from
24.1% in control villages to 29.2% in treatment villages (adjusted percentage point difference
= 0.05 [0.04, 0.06]). After 5 months, the impact of the intervention faded, but mask-wearing
remained 10 percentage points higher in the intervention group.
The proportion of individuals with COVID-like symptoms was 7.62% (N=13,273) in the
intervention arm and 8.62% (N=13,893) in the control arm. Blood samples were collected
from N=10,952 consenting, symptomatic individuals. Adjusting for baseline covariates, the
2

intervention reduced symptomatic seroprevalence by 9.3% (adjusted prevalence ratio (aPR) =
0.91 [0.82, 1.00]; control prevalence 0.76%; treatment prevalence 0.68%). In villages random-
ized to surgical masks (n = 200), the relative reduction was 11.2% overall (aPR = 0.89 [0.78,
1.00]) and 34.7% among individuals 60+ (aPR = 0.65 [0.46, 0.85]). No adverse events were
reported.
Conclusions: Our intervention demonstrates a scalable and effective method to promote mask
adoption and reduce symptomatic SARS-CoV-2 infections.
Trial registration: ClinicalTrials.gov Identifier: NCT04630054
Funding: GiveWell.org
3

1 Introduction
As of July 2021, the COVID-19 pandemic has taken the lives of more than 4.2 million people.
Inspired by the growing body of scientific evidence that face masks can slow the spread of the
disease and save lives [1, 2, 3, 4, 5, 6, 7, 8], we conducted a cluster-randomized controlled trial
covering 342,126 adults in 600 villages in rural Bangladesh with the dual goals of (a) identifying
strategies to encourage community-wide mask-wearing, and (b) tracking changes in symptomatic
SARS-CoV-2 infections as a result of our intervention. While vaccines may constrain the spread
of SARS-CoV-2 in the long-term, it is unlikely that a substantial fraction of the population in low-
and middle-income countries will have access to vaccines before the end of 2021 [9]. Uncovering
scalable and effective means of combating COVID-19 is thus of first-order policy importance.
Over 40% of the world’s population live in countries that mandated mask-wearing in public
areas during the COVID-19 pandemic, and another 40% live in countries where universal mask
norms prevailed absent a legal mandate [10]. However, increasing mask-wearing, either through
mask promotion or mandates, has proven difficult, especially in low- and middle-income countries
and in remote, rural areas. In Bangladesh, a quarter of those observed in public areas in June 2020
wore masks, and only a fifth wore masks properly (covering both the nose and mouth), despite
a nationwide mask mandate in effect at the time. This raises questions about how to increase
mask-wearing in community settings: is it sufficient to increase access to masks, or does this need
to be supplemented by providing information about the benefits of mask-wearing, role modeling
mask-wearing, informal social sanctions, or mask mandates with legal enforcement?
We conducted a randomized controlled trial to identify the most effective mask promotion
strategies for low-resource, rural settings and determine whether mask distribution and promotion
is an effective tool to combat COVID-19. The World Health Organization declined to recommend
mask adoption until June 2020, citing the lack of evidence from community-based randomized-
controlled trials, as well as concerns that mask-wearing would create a false sense of security [11].
Critics argued that those who wore masks would engage in compensating behaviors, such as failing
to physically distance from others, resulting in a net increase in transmission [12]. We designed
4

our trial to directly test this hypothesis by measuring physical distancing, as well as to evaluate the
bottom-line impact on COVID-19.
Since a substantial share of coronavirus transmission stems from asymptomatic or pre-symptomatic
individuals [13], we designed our trial to encourage universal mask-wearing at the community
level, rather than mask-wearing among only those with symptoms.
After an iterative research process with multiple rounds of piloting, we settled on a core inter-
vention package that combined household mask distribution with communication about the value
of mask-wearing, mask promotion and reminders at mosques, markets, and other public places, and
role-modeling by public officials and community leaders. We also tested several other strategies
using additional experimental arms in sub-samples, such as text message reminders, asking people
to make a verbal commitment, creating opportunities for social signaling, and providing village-
level incentives to increase mask-wearing. The selection of strategies to test was informed by both
our pilot results and research in public health, psychology [14, 15, 16], economics [17, 18, 19],
marketing [20, 21, 22], and other social sciences [23] on product promotion and dissemination
strategies. We tested many different strategies because it was difficult to predict in advance which
ones would lead to persistent increases in mask-wearing. Prediction studies we conducted with
policymakers and public health experts at the World Health Organization, India’s National Council
of Applied Economic Research, and the World Bank suggest that even these experts with influence
over policy design could not easily predict our trial results.
We powered our intervention around the primary outcome of symptomatic seroprevalence.
During our intervention, we collected survey data on the prevalence of WHO-defined COVID-19
symptoms from all available study participants, and then collected blood samples at endline from
those who reported symptoms anytime during the 8-week study duration. Our trial is therefore
designed to track the fraction of individuals who are both symptomatic and seropositive. We chose
this as our primary outcome for two reasons: first, the goal of public health policy is ultimately
to prevent symptomatic infections (even if preventing asymptomatic infections is instrumentally
important in achieving that goal). Second, because symptomatic individuals are far more likely
5

to be seropositive, powering for this outcome required conducting an order of magnitude fewer
costly blood tests. As a secondary outcome, we also report the effects of our intervention on
WHO-defined symptoms for probable COVID-19.
2 Background and Context
Bangladesh is a densely populated country with 165 million inhabitants. A serosurvey conducted
in March-April 2021 found 68% of residents in Dhaka and Chattogram had antibodies against
SARS-CoV-2; this revealed there were two orders of magnitude more infections than reported
cases [24, 25, 26]. This is in line with estimates from India, where seroprevalence studies reveal
similarly low case detection rates [27], and up to an order of magnitude more deaths than reported
[28]. The number of daily reported cases in Bangladesh surged fifteen-fold between February and
July 2021 to reach 15,000 per day, but even these numbers are also likely to be underestimates.1
Reducing spread of SARS-CoV-2 in this setting is thus of vital importance.
Between April and June 2020, our team and others conducted several surveys in Bangladesh to
quantify mask-wearing behavior. The evolution of mask use over time in Bangladesh is discussed
in greater detail in [29]. In Bangladesh, the government strongly recommended mask use from
early April 2020. In a telephone survey of respondents at the end of April 2020, over 80% self-
reported wearing a mask and 97% self-reported owning a mask. The Bangladeshi government
formally mandated mask use in late May 2020 and threatened to fine those who did not comply,
although enforcement was weak to non-existent, especially in rural areas. Anecdotally, mask-
wearing was substantially lower than indicated by our self-reported surveys. To investigate, we
conducted surveillance studies throughout public areas in Bangladesh in two waves. The first
wave of surveillance took place between May 21-25, 2020 in 1,441 places in 52 districts. About
51% out of more than 152,000 individuals we observed were wearing a mask. The second wave of
surveillance was conducted between June 19-22, 2020 in the same 1,441 locations, and we found1http://dashboard.dghs.gov.bd/webportal/pages/covid19.php
6

that mask-wearing dropped to 26%, with 20% wearing masks that covered their mouth and nose.
An August 2020 phone survey in rural Kenya finds that while 88% of respondents claim to wear
masks in public, direct observation revealed that only 10% actually did [30]. These observations
suggest that mask promotion interventions could be useful in rural areas of low- and middle-income
countries (LMIC), home to several billion people at risk for COVID-19.
3 Interventions and Data Collection
3.1 Sampling frame and timeline
To develop the sample frame, Innovations for Poverty Action (IPA) Bangladesh selected 1,000 rural
and peri-urban unions out of 4,500 unions in Bangladesh. We excluded Dhaka district, because of
high initial seroprevalence, and three hill districts, because of the logistical difficulties in accessing
the region. We also dropped remote coastal districts where population density is low. The final
sampling frame of 1000 unions were located in 40 different districts (zillas) (out of 64) and 144
sub-districts (upazilas) (out of 485).
We used a pairwise randomization to select 300 intervention and 300 control unions within
the same sub-districts. This randomization procedure, described in detail in Appendix B, was
designed to pair unions that were similar in terms of (limited) COVID-19 case data, population
size, and population density. Each union consists of roughly 80,000 people, or around 80 villages.
In each union, we selected a single village to minimize spillovers. To do so, we identified the
largest market and the village within which the market is located and demarcated this territory as
the intervention unit (during this scoping process, surveyors were blinded to whether the union was
an intervention or control union). Within each village, adults from every household were eligible
to participate in the study. Some unions are very small so to avoid spillover effects, we did not
select multiple villages from the same union and we ensured that selected villages were at least 2
km away from each other. Treatment and control unions were scattered throughout the country, as
shown visually in Figure A1.
7

The clustered village-level randomization was important for three reasons. First, unlike tech-
nologies with primarily private benefits, mask adoption is likely to yield especially large benefits
at the community-level. Second, mask adoption by some may influence mask adoption by others
because mask-wearing is immediately visible to other members of the community [31]. Third, this
design allows us to properly assess the full impact of masks on infections, including preventing
transmission of the virus to others. Individual-level randomization would identify only whether
masks protect wearers.
Our intervention was designed to last 8 weeks in each village. The intervention started in
different villages at different times, rolling out over a 6-week period in 7 waves. There were
between 14 and 59 village-pairs grouped in each wave based on geographic proximity and paired
control and treatment villages were always included in the same wave. The first wave was rolled
out on 17-18 November 2020 and the last wave was rolled out on 5-6 January 2021.
IPA staff travelled to many villages that had low mask uptake in the first five weeks of the study
and found that in these villages local leaders were not very engaged in supporting mask promotion.
Hence, we retrained mask promotion staff part-way through the intervention to work more closely
with local leaders and set specific milestones for that partnership.2
The intervention protocol, pre-specified analysis plan, and CONSORT checklist are available
at https://osf.io/vzdh6/.
3.2 Outcomes
Our primary outcome was symptomatic seroprevalence for SARS-CoV-2. Our secondary out-
comes were prevalence of proper mask-wearing, physical distancing, and symptoms consistent
with COVID-19. For COVID-19 symptoms, we used the symptoms that correspond to the WHO
case definition of probable COVID-19 given epidemiological risk factors: (a) fever and cough;
(b) three or more of the following symptoms (fever, cough, general weakness/fatigue, headache,
2The need for continued monitoring and retraining is a core part of our scalable intervention protocol, availablehere (in the online version of this article).
8

myalgia, sore throat, coryza, dyspnea, anorexia/nausea/vomiting, diarrhea, altered mental status);
or (c) loss of taste or smell. Seropositivity was defined by having detectable IgG antibodies against
SARS-CoV-2.
3.3 Intervention Materials and Activities
Our entire intervention was designed to be easily adopted by other NGOs or government agencies
and required minimal monitoring. We have made the materials public in multiple languages to ease
widespread adoption and replication by other implementers (http://tinyurl.com/maskprotocol).
In focus groups conducted prior to the study, participants said they preferred cloth over surgical
masks because they perceived surgical masks to be single-use only and cloth masks to be more
durable. Focus group participants also provided feedback on different cloth masks designs and
sizes. Both types of masks were manufactured in Bangladesh. The cloth mask had an exterior layer
of 100% non-woven polypropylene (70 grams/square meter [gsm]), two interior layers of 60%
cotton / 40% polyester interlocking knit (190 gsm), an elastic loop that goes around the head above
and below the ears, and a nose bridge. The surgical mask had three layers of 100% non-woven
polypropylene (the exterior and interiors were spunbond and the middle layer was meltblown),
elastic ear loops, and a nose bridge. The filtration efficiency was 37% (standard deviation [SD] =
6%) for the cloth masks, and 95% (SD = 1%) for the surgical masks (manuscript forthcoming).3
The filtration efficiency of the surgical masks after washing them 10 times with bar soap and water
was 76% (manuscript forthcoming). Surgical masks were outfitted with a sticker that had a logo of
a mask with an outline of the Bangladeshi flag and a phrase in Bengali that noted the mask could
be washed and reused. The project cloth masks were produced by Bangladeshi garment factories
within 6 weeks after ordering. The relatively large scale of our bulk order allowed us to negotiate
3The filtration efficiency test was conducted using a Fluke 985 particle counter that has a volumetric samplingrate of 2.83 liters per minute. The measurement was taken of particles 0.3–0.5 µm in diameter flowing through thematerial with a face velocity of 8.5 cm/s. In our internal testing, we found that cloth masks with an external layer madeof Pellon 931 polyester fusible interface ironed onto interlocking knit with a middle layer of interlocking knit couldachieve a 60% filtration efficiency. Upon discussions with the manufacturers, we learned that those materials couldnot be procured. Using materials that were available, the highest filtration efficiency possible was 37%.
9

mask prices of $0.50 per cloth mask and $0.13 per surgical mask ($0.06 of which was the cost of a
sticker reminding people they could wash and reuse the surgical mask). While surgical masks can
break down into microplastics that can enter the environment if disposed of improperly, analysis
of waste generated in Bangladesh’s first lockdown finds that the mass of surgical mask waste
was one-third that of polyethylene bags, which also break down into macro- and micro-plastics
[32, 33, 34].
To emphasize the importance of mask-wearing, we prepared a brief video of notable public
figures discussing why, how, and when to wear a mask. The video was shown to each house-
hold during the mask distribution visit and featured the Honorable Prime Minister of Bangladesh
Sheikh Hasina, the head of the Imam Training Academy, and the national cricket star Shakib Al
Hasan. During the distribution visit, households also received a brochure based on WHO materials
depicting proper mask-wearing.
We implemented a basic set of interventions in all treatment villages, and cross-randomize
additional intervention elements in randomly chosen subsets of treatment villages to investigate
whether those have any additional impact on mask-wearing. The basic intervention package con-
sists of five main elements:
1. One-time mask distribution and promotion at households.
2. Mask distribution in markets on 3-6 days per week.
3. Mask distribution at mosques on three Fridays during the first four weeks of the intervention.
4. Mask promotion in public spaces and markets where non-mask wearers were encouraged to
wear masks (weekly or biweekly).
5. Role-modeling and advocacy by local leaders, including imams discussing the importance
of mask-wearing at Friday prayers using a scripted speech provided by the research team.
Participants, mask promoters, and mask surveillance staff were not blinded as intervention
materials were clearly visible. The pre-specified analyses and sample exclusions were made by
10

analysts blinded to the treatment assignment.4
3.4 Cross-randomization of behavior change communication and incentives
Village-level Cross-randomizations Within the intervention arm, we cross-randomized villages
to four village-level and four household-level treatments to test the impact of a range of social
and behavior change communication strategies on mask-wearing. All intervention villages were
assigned to either the treatment or the control group of each of these four randomizations. These
village-level randomizations were:
1. Randomization of treated villages to either cloth or surgical masks. The material used to
make surgical masks has a higher filtration efficiency than the types of cloth typically used to
make cloth masks, but cloth masks can be sewn without specialized equipment and can have
less leakage because they fit the face more closely. However, surgical masks are substantially
less expensive.
2. Randomization of treated villages to no incentive, non-monetary incentive, or monetary in-
centive of 190 USD given to the village leader for a project benefitting the public. We
announced that the monetary reward or the certificate would be awarded if village-level
mask-wearing among adults exceeded 75% 8-weeks after the intervention started.
3. Randomization of treated villages to public commitment (providing households signage and
asking them to place signage on doors that declares they are a mask-wearing household),
or not. The signage was meant to encourage formation of social norms through public sig-
nalling.
4. Randomization of treated villages to 0% or 100% of households receiving twice-weekly text
message reminders about the importance of mask-wearing.4In all villages, we also randomized the color of the masks distributed to households. This can be considered a part
of our core intervention, since it is part of how household distribution was implemented.
11

Household-level Cross-randomizations We had three household-level cross-randomizations.
In any single village, only one of these household randomizations was operative. As our data
collection protocols relied on passive observation at the village-level, we could not record the
mask-wearing behavior of individual households. To infer the effect of the household-level treat-
ments we therefore varied the color of the masks distributed to the household based on its cross-
randomization status and had surveillance staff record the mask color of observed individuals. In
surgical mask villages, a household received blue or green and promoters distributed and equal
number of blue and green masks in public settings. In cloth mask villages, households received
violet or red masks and promoters distributed blue masks in public settings. To avoid conflating
the effect of the household-specific treatment with the effect of the mask color, we randomized
which color corresponded to which treatment status across villages (this way a specific color was
not fully coincident with a specific treatment). The household-level randomizations, described in
further detail in Appendix C and visualized in A2, were:
1. Households were randomized to receive messages emphasizing either altruism or self-protection.
2. Households were randomized to receive twice-weekly text reminders or not. As mentioned
above, the text message saturation was randomly varied to 0%, 50%, or 100% of all villagers
receiving texts, and in the 50% villages, the specific households that received the texts was
also random.
3. Households were randomized to making a verbal commitment to be a mask-wearing house-
hold (all adults in the household promise to wear a mask when they are outside and around
other people) or not. This experiment was conducted in a third set of villages where there
was no public signage commitment.
Conceptual Basis for Tested Social and Behavior Change Communication We selected in-
tervention elements that had a reasonable chance of persuading rural Bangladeshis to wear masks
by consulting literature in public health, development and behavioral economics, and marketing to
12

identify some of the most promising strategies. An extensive literature identifies price and access
as key deterrents to the adoption of welfare-improving products, and especially of technologies that
produce positive health externalities, such as face-masks [35, 17]. Household distribution of free
face-masks therefore formed the core part of our strategy. Inspired by large literature in marketing
and economics on the role of opinion leaders in new product diffusion, we additionally emphasized
a partnership with community leaders in mask distribution [21, 36].
The additional village- and household-level treatment we experimented with were also moti-
vated by insights from marketing, public health, development, and behavioral economics. For ex-
ample, masks are a visible good where social norms are expected to be important, so we consulted
the literature documenting peer effects in product adoption [37, 38, 39, 40]. We experimented
with incentives because it is unclear whether extrinsic rewards crowd out intrinsic motivation
[41, 42, 43]. We test whether soft commitment devices encourage targets to follow through with
actual behaviour change [44, 45], whether public displays can promote social norms [23], whether
an altruistic framing inspires people more or less than self-interest [46], whether social image con-
cerns and signaling can lead to higher compliance [47, 18], and whether regular reminders are a
useful tool to ensure adoption [19].
3.5 Surveillance Strategies
Mask-wearing was assessed through direct observation in public locations including mosques,
markets, the main entrance roads to villages, and tea stalls. Surveillance staff noted whether adults
were wearing any mask or face covering, whether the mask was one distributed by our project
(and if so, the color), and whether the mask was worn over both the mouth and nose. The mask
distribution and promotion was conducted by the Bangladeshi NGO GreenVoice, a grassroots orga-
nization with a network of volunteers across the country. Household surveys and surveillance were
performed independently by Innovations for Poverty Action (IPA). To minimize the likelihood that
village residents would perceive that their mask-wearing behavior was being observed, surveil-
lance staff were separate from mask promoters and wore no identifying apparel while passively
13

observing mask-wearing and physical distancing practices in the communities. The Bangladesh
Directorate General of Health Services under the Ministry of Health, North-South University in
Dhaka, and Aspire to Innovate (a2i), an information and data-focused organization within the
Bangladesh government, partnered in the study design and discussions and reviewed protocols.
Mask-wearing and physical distancing were measured through direct observation. Surveillance
staff were distinct from intervention implementation staff and conducted surveillance in paired in-
tervention and control villages. They recorded the mask-wearing behavior of all of the adults they
were able to observe during surveillance periods; observations were not limited to adults from
enrolled households.5 We defined proper mask-wearing as wearing either a project mask or an
alternative face-covering over the mouth and nose. Surveillance staff observed a single individual
and recorded that person as practicing physical distancing if s/he was at least one arm’s length away
from all other people. This is consistent with the WHO guideline that defines physical distancing
as one meter of separation.6 Surveillance was conducted using a standard protocol that instructed
staff to spend one hour at each of the following high-traffic locations in the village: market, restau-
rant entrances, main road, tea stalls, and mosque, changing the location and timing to record the
mask-wearing and physical distancing practices of as many individuals as possible. While SARS-
CoV-2 transmission is more likely in indoor locations with limited ventilation than outside, rural
Bangladeshi villages have few non-residential spaces where people gather, so observations were
conducted outside except at the mosque, where surveillance was conducted inside.
The same staff member conducted surveillance at paired intervention and control villages at
baseline and then once per week on weeks 1, 2, 4, 6, 8, and 10 after the intervention. The 10-week
observation was conducted two weeks after all intervention activities had ceased. We also collected
longer-term data on mask-wearing behavior 20-27 weeks after the launch of interventions. Each
5After 5 weeks of surveillance in wave 1, it was clarified that surveillance staff should only record mask-wearingbehavior of people who appear to be 18 years or older. Prior to this, some surveyors included children (especiallyolder children) in their counts. Since the same staff member conducted surveillance in paired intervention and controlvillages, this change affected the treatment and control groups equally.
6https://www.who.int/westernpacific/emergencies/covid-19/information/physical-distancing. Accessed January,30 2021. Note that compliance with WHO guidelines does not require zero physical distancing; for example, membersof the same household need not remain physically distant (and presumably would not change their distancing behavioras a result of our intervention).
14

village was observed on two alternating days of the week. Across all villages, observations took
place on all seven days of the week, with observation in 150 villages occurring on Friday to over-
sample days when mosques were most crowded. Observations generally took place from 9 am to
7 pm. In 10 unions we conducted audits to assess the validity of surveillance data by pairing one
monitoring officer with surveillance staff; in all cases the difference in their results was <10%, our
pre-determined threshold.
3.6 Symptomatic SARS-CoV-2 Testing
Symptom reporting The owner of the household’s primary phone completed surveys by phone
or in-person at weeks 5 and 9 after the start of the intervention. They were asked to report symp-
toms experienced by any household member that occurred in the previous week and over the pre-
vious month. COVID-like symptoms were defined by whether they were consistent with the WHO
COVID-19 case definition for suspected or probable cases with an epidemiological link [48].
Blood sample collection We collected capillary blood samples from participants who reported
COVID-like symptoms during the study period. For the purposes of blood collection, endline
was defined as 10-12 weeks from the start of the intervention. Blood samples were obtained by
puncture with a 20-Gauge safety lancet to the third or fourth digit. 500 microliters of blood were
collected into Microtainer® capillary blood collection serum separator tubes (BD, Franklin Lakes,
NJ). Blood samples were transported on ice and stored at -20°C until testing.
SARS-CoV-2 testing Blood samples were tested for the presence of IgG antibodies against
SARS-CoV-2 using the SCoV-2 Detect™ IgG ELISA kit (InBios, Seattle, Washington). This
assay detects IgG antibodies against the spike protein subunit (S1) of SARS-CoV-2. The assays
were performed according to the manufacturer’s instructions. Briefly, serum samples were diluted
1:100 with sample dilution buffer. 50 microliters of diluted specimens were added to the SCoV-2
antigen-coated microtiter strip plates. After one hour of incubation at 37°C, the plate was washed
15

six times with wash buffer, and conjugate solution was added to each well. The plate was incu-
bated for another 30 minutes at 37°C and washed six times with wash buffer. 75 microliters of
liquid TMB substrate were added to all wells followed by 20 minutes of incubation in the dark
at room temperature before the reaction was stopped. The absorbance was read on a microplate
reader at 450nm (GloMax® Microplate Reader, Promega Corporation, Madison, WI). After cali-
bration according to positive, negative, and cut-off controls, the immunological status ratio (ISR)
was calculated as the ratio of optical density divided by the cut-off value. Samples were considered
positive if the ISR value was determined to be at least 1.1. Samples with an ISR value 0.9 or be-
low were considered negative. Samples with equivocal ISR values were retested in duplicate, and
resulting ISR values were averaged. Individuals were coded as symptomatic seropositive if they
reported symptoms consistent with the WHO COVID-19 case definition, their blood was collected,
and the antibody test was positive.
3.7 Piloting Interventions
IPA implemented two pilots: Pilot 1 from July 22-31 and Pilot 2 from August 13-26, 2020. The
objective of the pilots was to mimic some of the major aspects of the main experiment to identify
implementation challenges. Each pilot was conducted in 10 unions that were not part of the main
study area. We used the difference between the pilots to better understand which elements of
our full intervention were essential. We also conducted focus group discussions and in-depth
interviews with village residents, community leaders, religious leaders, and political leaders to
elicit opinions on how to maximize the effectiveness of the intervention.
4 Results
Our analysis followed our preregistered analysis plan (https://osf.io/vzdh6/) except where indi-
cated. Our primary outcome is symptomatic seroprevalence for SARS-CoV-2. We also analyzed
the impact of our intervention on mask-wearing, physical distancing, and COVID-like symptoms.
16

No adverse events were reported during the study period.
4.1 Sample Selection
Table A1 summarizes sample selection for our analysis. We began with 342,126 individuals at
baseline. We were able to collect follow-up symptom data (whether symptomatic or not) from
335,382 (98%). Of these, 27,166 (7.9%) reported COVID-like symptoms during the 8-weeks
intervention in their village. We attempted to collect blood samples from all symptomatic individ-
uals. Of these, 10,952 (40.3%) consented to have blood collected, including 40.8% in the treatment
group and 39.9% in the control group (the difference in consent rates is not statistically significant,
p = 0.24). We show in Table A2 that consent rates are about 40% across all demographic groups
in both treatment and control villages.
As such, the sample for which we have symptom data is much larger than the sample for whom
we have serology data. We tested 9,977 (91.1%) of the collected blood samples to determine
seroprevalence for SARS-CoV-2 IgG antibodies. Untested blood either lacked sufficient quantity
for our test or could not be matched to individuals from our sample because of a barcode scanning
error. In our primary outcome analysis, we drop individuals for whom we are missing symptom
data or who did not consent to blood spot collection. For the analyses where symptomatic status
is the outcome, we report results using both this smaller sample, as well as the larger sample of all
individuals for whom we collected symptom data.
4.2 Balance
While our stratification procedure should have achieved balance with respect to variables observed
at the time of randomization, given the many possible opportunities for errors in implementation,
we nonetheless confirm that our control and treatment villages resemble each other at baseline
with respect to key variables of interest. This assessment was not preregistered. For each charac-
teristic, we report the results of a t-test comparing the two groups. This t-test parallels our main
specifications.
17

In Table A3 we present balance test results for our mask-wearing specification. In our main
specification, this is a regression of mask-wearing on a constant, an intervention indicator, and
indicators for each control-intervention pair with analytic weights proportional to the number of
adults recorded in the baseline household survey as well as heteroskedasticity robust standard
errors. For the balance tests, we replace the dependent variable with several variables measured at
baseline, including the number of households, baseline mask-wearing (assessed via observation),
and baseline COVID-like symptoms. Of the four variables we tested, only one was significantly
different between the control and intervention groups at the 10% level and the F-test failed to reject
balance.
In Table 1, we report results from analogous balance tests based on the specification used for
our primary biological outcome. We replace the dependent variable (symptomatic seroprevalence)
with baseline covariates of interest to assess balance. We also report a bottom-line F-test which
again fails to reject balance. In Appendix E, we discuss a few small imbalances we uncovered with
respect to other attributes, such as household size. These are extremely small in magnitude (e.g.
households are 0.02 members larger in the treatment group) but unlikely to have arisen because
of chance. In the Appendix, we discuss likely mechanisms (such as households being more likely
to report teenagers as over 18 in order to receive masks) and we report further robustness checks,
such as dropping individuals under 30.
4.3 Primary Analyses
Mask-Wearing The first column in the top panel of Table 2 reports coefficients from a regression
of mask-wearing on a constant, an intervention indicator (based on the assigned groups), baseline
mask-wearing, the baseline symptom rate, and indicators for each control-intervention pair. More
details of our statistical methods and standard error construction are available in Appendix D.
Mask-wearing was 13.3% in control villages and 42.3% in treatment villages. Our regression
adjusted estimate is an increase of 28.8 percentage points (95% CI: 0.27, 0.31). If we omit all
covariates (except fixed effects for the strata within which we randomized), our point-estimate is
18

Table 1: Balance Tests (Individual-Level)
BaselineSymptomatic
Seroprevalence
BaselineWHO-Defined
COVID-19Symptoms
BaselineMask-Wearing Rate
Summary Statistics
Intervention Rate 0.00002 0.0247 0.1186
Control Rate 0.00003 0.0234 0.1200
Balance Tests
Intervention Coefficient -0.00000 0.0009 0.0010(0.00001) (0.0011) (0.0039)
N individuals 307,106 307,106 307,106N villages 572 572 572
F 0.80Joint-Test Prob > F 0.8492
Standard errors are in parentheses.*** Significant at the 1 percent level. ** Significant at the 5 percent level. * Significant at the 10 percent level.The baseline symptomatic seroprevalence is defined using 20 percent random sample of all the baseline blood draws.All individuals without a baseline blood sample have a symptomatic seroprevalence value of 0.We classify a WHO-defined COVID-19 symptoms as any of the following(a) fever and cough;(b) three or more of the following symptoms (fever, cough, general weakness/fatigue, headache, myalgia, sore throat,coryza, dyspnea, anorexia/nausea/vomiting, diarrhea, altered mental status);(c) loss of taste or smell.The baseline rate of mask-wearing was measured through observation over a 1-week period, defined as the rate ofthose observed who wear a mask or face covering that covers the nose and mouth.The sample excludes 4 villages because of lack of government cooperation to perform the intervention. The analysisexcludes 11 villages and their village-pairs in the full sample because we did not observe them in the baseline periodprior to the intervention, and 1 village and its pair for lack of observational data throughout the intervention period.The analysis includes all people surveyed in the baseline household visits, excluding individuals that we did notcollect midline or endline symptoms for, symptomatic individuals that we did not collect blood from, and individualsthat we drew blood from but did not test their blood.
19

identical (Table A4). Considering only surveillance conducted when no mask distribution was
taking place, mask-wearing increased 27.9 percentage points, from 13.4% in control villages to
41.3% in intervention villages (regression adjusted estimate: 0.28, 95% CI: 0.26, 0.30). We also
run our analysis separately in mosques, markets, and other locations such as tea stalls, the entrance
of restaurants, and the main road in the village. The increase in mask-wearing was largest in
mosques (37.0 percentage points), while in all other locations it was 25-29 percentage points.
Physical Distancing Contrary to concerns that mask-wearing would promote risk compensation,
we did not find evidence that our intervention decreases distancing behavior. In the second panel
of Table A4, we report identical specifications to the first panel, but with physical distancing as the
dependent variable. In control villages 24.1% of observed individuals practiced physical distanc-
ing compared to 29.2% in intervention villages, an increase of 5.1% (a regression adjusted esti-
mate of 0.05 [95% CI: 0.04,0.06]) Evidently, protective behaviors like mask-wearing and physical-
distancing are complements rather than substitutes: endorsing mask-wearing and informing people
about its importance encouraged rural Bangladeshis to take the pandemic more seriously and en-
gage in another form of self-protection. The increases in physical distancing were similar in cloth
and surgical mask villages.
While we find increases in physical distancing of 5.1 percentage points pooling across all
locations, there was substantial heterogeneity across locations. In markets, individuals become
substantially more likely to physically distance (7.4 percentage points). There was no physical
distancing practiced in any mosque, in either treatment or control villages, probably as a result of
the strong religious norm of standing shoulder-to-shoulder when praying.
It is possible that physical distancing increases because our intervention results in fewer total
people being present in public spaces. If socializing increased in the intervention group, but only
among risk-conscious people, then we might see physical distancing increase despite people en-
gaging in overall riskier behavior. To assess this, we consider as an alternative outcome the total
number of people observed at public locations. While surveillance staff were not able to count
20
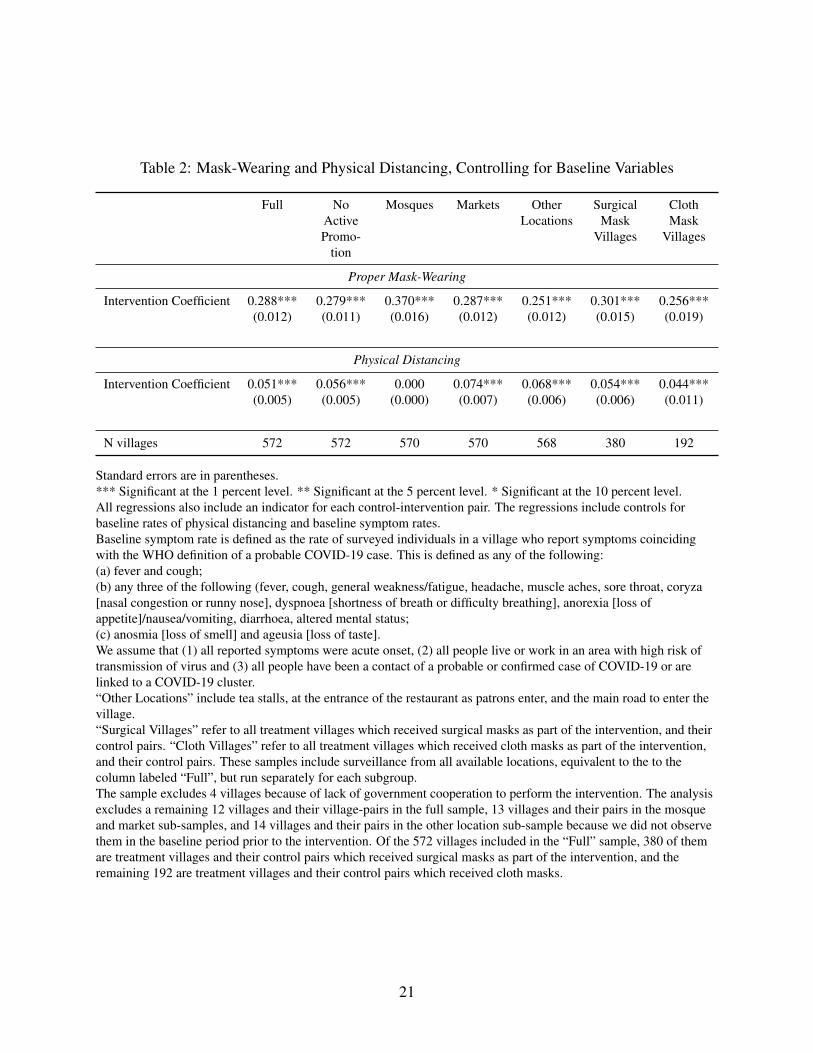
Table 2: Mask-Wearing and Physical Distancing, Controlling for Baseline Variables
Full NoActivePromo-
tion
Mosques Markets OtherLocations
SurgicalMask
Villages
ClothMask
Villages
Proper Mask-Wearing
Intervention Coefficient 0.288*** 0.279*** 0.370*** 0.287*** 0.251*** 0.301*** 0.256***(0.012) (0.011) (0.016) (0.012) (0.012) (0.015) (0.019)
Physical Distancing
Intervention Coefficient 0.051*** 0.056*** 0.000 0.074*** 0.068*** 0.054*** 0.044***(0.005) (0.005) (0.000) (0.007) (0.006) (0.006) (0.011)
N villages 572 572 570 570 568 380 192
Standard errors are in parentheses.*** Significant at the 1 percent level. ** Significant at the 5 percent level. * Significant at the 10 percent level.All regressions also include an indicator for each control-intervention pair. The regressions include controls forbaseline rates of physical distancing and baseline symptom rates.Baseline symptom rate is defined as the rate of surveyed individuals in a village who report symptoms coincidingwith the WHO definition of a probable COVID-19 case. This is defined as any of the following:(a) fever and cough;(b) any three of the following (fever, cough, general weakness/fatigue, headache, muscle aches, sore throat, coryza[nasal congestion or runny nose], dyspnoea [shortness of breath or difficulty breathing], anorexia [loss ofappetite]/nausea/vomiting, diarrhoea, altered mental status;(c) anosmia [loss of smell] and ageusia [loss of taste].We assume that (1) all reported symptoms were acute onset, (2) all people live or work in an area with high risk oftransmission of virus and (3) all people have been a contact of a probable or confirmed case of COVID-19 or arelinked to a COVID-19 cluster.“Other Locations” include tea stalls, at the entrance of the restaurant as patrons enter, and the main road to enter thevillage.“Surgical Villages” refer to all treatment villages which received surgical masks as part of the intervention, and theircontrol pairs. “Cloth Villages” refer to all treatment villages which received cloth masks as part of the intervention,and their control pairs. These samples include surveillance from all available locations, equivalent to the to thecolumn labeled “Full”, but run separately for each subgroup.The sample excludes 4 villages because of lack of government cooperation to perform the intervention. The analysisexcludes a remaining 12 villages and their village-pairs in the full sample, 13 villages and their pairs in the mosqueand market sub-samples, and 14 villages and their pairs in the other location sub-sample because we did not observethem in the baseline period prior to the intervention. Of the 572 villages included in the “Full” sample, 380 of themare treatment villages and their control pairs which received surgical masks as part of the intervention, and theremaining 192 are treatment villages and their control pairs which received cloth masks.
21

everyone in busy public areas, the total number of people they were able to observe gives some
indication of the crowd size. We find no difference in the number of people observed in public
areas between the treatment and control groups (Table A5).
Symptomatic Seroprevalence Among the 335,382 participants who completed symptom sur-
veys, 27,166 (8.1%) reported experiencing COVID-like illnesses during the study period. More
participants in the control villages reported incident COVID-like illnesses (n=13,893, 8.6%) com-
pared with participants in the intervention villages (n=13,273, 7.6%). Over one-third (40.3%) of
symptomatic participants agreed to blood collection. Omitting symptomatic participants who did
not consent to blood collection, symptomatic seroprevalence was 0.76% in control villages and
0.68% in the intervention villages. Because these numbers omit non-consenters, it is likely that
the true rates of symptomatic seroprevalence are substantially higher (perhaps by 2.5 times, if
non-consenters have similar seroprevalence to consenters).
In Figure 1 (and Tables A6 and A7), we report results from a regression of symptomatic sero-
prevalence on a treatment indicator, clustering at the village level and controlling for fixed effects
for each pair of control-treatment villages. In the tables, we report results with and without addi-
tional controls for baseline symptoms and mask-wearing rates. In Table A6, we report results from
our pre-specified linear model and in Table A7 we report results from a generalized linear model
with a Poisson family and log-link function. In the text, we discuss the latter results (which are in
units of relative risk); the linear model implies results of an almost identical magnitude.
The results in all specifications are the same: we estimate a roughly 10% decline in symp-
tomatic seroprevalence in the treatment group (adjusted prevalence ratio (aPR) = 0.91 [0.82, 1.00])
for a 29 percentage point increase in mask wearing over 8 weeks.7 In the second panel of Figure
1, we split our results by mask type (surgical vs. cloth). We find clear evidence that surgical masks
lead to a relative reduction in symptomatic seroprevalence of 11.2% (aPR = 0.89 [0.78,1.00]; con-7To check robustness to the type of clustering, in panels A3a and A3b of Figure A3, we show the histogram of
effect sizes arising from “randomization inference” if we randomly reassign treatment within each pair of villagesand then estimate our primary specification. When doing so, we find that our estimated effect size is smaller than8.1% of the simulated estimates with controls and 8.4% of the simulated estimates without controls (these are thecorresponding p-values of the randomization inference t-test).
22

trol prevalence = 0.80%; treatment prevalence = 0.71%). For cloth masks, we find an imprecise
zero, although the confidence interval includes the point estimate for surgical masks (aPR = 0.95
[0.79,1.11]; control prevalence 0.67%; treatment prevalence 0.62%).
Not all symptomatic seroprevalence is necessarily a result of infections occurring during our
intervention; individuals may have pre-existing infections and then become symptomatic (perhaps
caused by an infection other than SARS-CoV-2). In Appendix F, we show that if either: a) masks
have the same proportional impact on COVID and non-COVID symptoms or b) all symptomatic
seropositivity is caused by infections during our intervention, then the percentage decline in symp-
tomatic seroprevalence will exactly equal the decline in symptomatic seroconversions. More gen-
erally, the relationship between the two quantities depends on whether masks have a greater impact
on COVID or non-COVID symptoms, as well as the proportion of symptomatic seropositivity that
is a result of infections pre-existing at baseline.
Figure 1: Intervention Effect on Symptomatic Seroprevalence
(a) Intervention Effect on Symptomatic Seroprevalence
(b) Intervention Effect on Symptomatic Seroprevalence by Mask Type
23

WHO COVID-19 Symptoms In Figure 2 and Tables A9 and A8, we report results from the
same specifications with WHO-defined COVID-19 symptomatic status as the outcome.
We find clear evidence that the intervention reduced symptoms: we estimate a reduction of
11.9% (adjusted prevalence ratio 0.88 [0.83,0.93]; control group prevalence = 8.59%; treatment
group prevalence = 7.60%). Additionally, when we look separately by cloth and surgical masks,
we find that the intervention led to a reduction in COVID-like symptoms under either mask type
(p = 0.000 for surgical, p = 0.048 for cloth), but the effect size in surgical mask villages was
30-80% larger depending on the specification. In Table A10, we run the same specifications using
the smaller sample used in our symptomatic seroprevalence regression (i.e. those who consented
to give blood). In this sample we continue to find an effect overall and an effect for surgical masks,
but see no effect for cloth masks.
Figure 2: Intervention Effect on WHO-Defined COVID-19 Symptoms
(a) Intervention Effect on WHO-Defined COVID-19 Symptoms
(b) Intervention Effect on WHO-Defined COVID-19 Symptoms by Mask Type
4.4 Mechanisms for Increasing Mask-Wearing
Our intervention combined multiple distinct elements: we provided people with free masks; we
provided information about why mask-wearing is important; we had mask promoters reinforce
the importance of mask-wearing by stopping individuals in public places who were not wearing
24

masks, reminding them about the importance of mask-wearing, and giving them a mask if they
did not have one; we partnered with local leaders to encourage mask-wearing at mosques and
markets; and in some villages we provided a variety of reminders and commitment devices as well
as incentives for village leaders. In Appendix G, we attempt to disentangle the role played by these
different elements in encouraging mask use.
We find no evidence that any of our village-level or household-level treatments, other than mask
color, impacted mask-wearing. For mask-color, we see marginally significant differences, small
in magnitude. Green and blue masks were distributed in equal numbers in surgical mask villages,
but blue masks were observed for 17.3% of observations in those villages while green masks were
observed for 15.6% (adjusted percentage point difference = 0.03, [-0.00,0.06]); likewise, purple
and red masks were distributed in equal numbers in cloth masks villages, but purple masks were
observed for 6.0% of observations and red masks for 6.8% (adjusted percentage point difference =
-0.02, [-0.04,-0.00]).8 Text message reminders, incentives for village-leaders, or explicit commit-
ment signals explain little of the observed increase in mask-wearing. Compared to self-protection
messaging alone, altruistic messaging had no greater impact on mask-wearing, and twice-weekly
text messages and a verbal commitment had no significant effects. We saw no significant difference
in mask-wearing in the village-level randomization of surgical vs. cloth masks.
We do find non-experimental evidence that in-person mask promotion and reinforcement is a
crucial part of our intervention. Our first pilot contained all elements of our intervention except in-
person reinforcement. Our second pilot (one week later) and the full intervention (several months
later) added in-person reinforcement. Under the assumption that treatment effects would otherwise
be constant over time, we find that mask promotion accounts for 19.2 percentage points of our
effect (regression adjusted estimate 0.19 [-0.33,-0.05]), or 65% of the total effect size. In Table
A11, we show that this difference is statistically significant whether or not we include baseline
controls. This was not a pre-specified analysis.
8The proportion of colored masks observed is calculated over all observed individuals.
25

4.5 Persistence of Effects over Time
In Table A12, we report estimates of our primary specification separately by week of surveillance.
Week 10 is especially interesting, as it was two weeks after intervention activities ceased. This
analysis was not preregistered.
We find no evidence that the impact of the intervention attenuates over the 10 weeks. In the
414 villages for which we have 10 weeks of surveillance, the point estimates are slightly smaller
in week 10 (a 23.3 percentage point increase) than week 1 (30.4 percentage points), although this
difference is not statistically significant. This is consistent with social norms around mask-wearing
taking hold, where adoption by some in the community has a demonstration effect that encourages
subsequent adoption by others. If mask-wearing was driven by a “novelty factor” associated with
our mask promotion campaign, we would have instead expected some attenuation over the course
of the 8 weeks of intervention. The point estimates of the impact of intervention by week for the
panel of 414 villages for which we have data in all weeks are plotted in Figure A4.
We additionally conducted a follow-up surveillance 5 months after the start of the intervention
(20-27 weeks, depending on the wave). Mask-wearing had declined to 14.1% in the control group
and 22.4% in the intervention group (a regression adjusted difference of 0.10 [0.08,0.13]).
4.6 Subgroup Analyses
We also considered how the impact of our intervention differed between subgroups.
Mask-Wearing by Age and Gender In Table A13, we analyze the impact of our intervention
on mask-wearing and physical distancing separately by gender, as well as by whether baseline
mask-wearing was above or below the median. Gender was recorded in 65% of observations;
age was not recorded and thus we do not conduct an age-stratified assessment. In the gender
results, we drop surveillance observations for mosques because in Bangladesh it is rare for women
to attend mosque (hence the lower average increases reported in this table). We found that the
intervention increased mask-wearing by 27.1 percentage points for men ([0.25,0.30]) and 22.5
26

percentage points for women ([0.20,0.25]). Although we do not have the variation to test this, the
gendered difference in effect size may be because our mask promoters were predominantly men.
We intentionally hired predominantly men because most of the interactions that our staff would
have in pubic places would be men. Men constituted 88.2% of all observed adults.
We also found a larger increase in mask-wearing in villages with below-median baseline mask-
wearing (where mask-wearing increased from 8.7% to 42.2% at endline) than those with above-
median baseline mask-wearing (where the increase was from 17.5% to 42.4%).
Symptomatic Seroprevalence by Age In Figure 3 (and in Tables A14, A15, and A16), we report
results from our primary specification separately by age for villages with surgical masks. Table
A14 reports our preregistered specification, a linear model run separately for each decade of age,
pooling cloth and surgical villages. Table A15 synthesizes these results, collapsing by categories
of <40, 40-50, 50-60 and 60+, and Table A16 reports the same results as a relative risk reduction,
separately for cloth and surgical masks. We find that the impact of the intervention on symptomatic
seroprevalence is concentrated among individuals over age 50, especially in villages randomized to
surgical masks, which appear to more effectively prevent COVID-19. In surgical mask villages, we
observe a 23.0% decline in symptomatic seroprevalence among individuals aged 50-60 (adjusted
prevalence ratio of 0.77 [0.59,0.95]) and a 34.7% decline among individuals aged 60+ (p = 0.001)
(adjusted prevalence ratio of 0.65 [0.46, 0.85]).
WHO COVID-19 Symptoms by Age In Tables A17 and A18 (the latter our preregistered speci-
fication), we perform the same analysis using the larger sample of individuals who reported symp-
tom information. In this sample, we continue to find larger effects at older ages, although the
differences are not as stark as for the symptomatic seroprevalence outcome. In Table A19, we
show that the age gradient is steeper for surgical masks.
Additional Preregistered Specifications In Appendix H, we discuss additional preregistered
specifications not reported in the text, either because they were severely underpowered given the
27

Figure 3: Effect on Symptomatic Seroprevalence by Age Groups, Surgical Masks Only
(a) Above 60 Years Old
(b) 50-60 Years Old
(c) 40-50 Years Old
(d) Younger than 40 Years Old
available data or because data on required variables was unavailable.
4.7 Intervention Cost and Benefit Estimates
In Appendix I, we assess the costs of implementing our intervention relative to the health benefits,
specifically focusing on our ongoing efforts to implement the intervention at scale in Bangladesh.
We consider a range of possible estimates for excess deaths from COVID-19 from May 1, 2021 -
September 1, 2021, and we assume that our age-specific impacts on symptomatic seroprevalence
will lead to proportional to reductions in mortality. We estimate that a scaled version of our in-
tervention being implemented in Bangladesh will cost about $1.50 per person, and between $10K
and $52K per life saved, depending which estimate we use for excess deaths.
4.8 Polling and Policy-Maker Priors
To assess how our findings compared to the priors of relevant policy makers, we polled participants
during presentations to the World Health Organization, the World Bank, and the National Council
28

of Applied Economic Research in Delhi, India. In total, more than 100 audience members with
expertise and specific interest in public health and mask-wearing were surveyed and asked to make
predictions about the impact of our various interventions on mask-wearing and physical distanc-
ing, just before we showed them our empirical results (at the time, our biological outcomes were
unavailable).
There are three main takeaways from this polling exercise: first, only a tiny fraction of policy-
makers correctly predicted the impact of our core intervention on mask-wearing and physical dis-
tancing. Second, policy maker predictions varied widely, both for effects of the intervention on
mask-wearing and physical distancing. Third, policy-makers systematically underestimated the
overall impact of our intervention and especially the impact of in-person reinforcement on mask-
wearing.
When asked if they thought the intervention would increase mask-wearing by 5, 10, 20, 30, or
40 percentage points, only 21% of respondents correctly predicted that the intervention increased
mask-wearing by 30 percentage points (about what we would expect if they guessed randomly).
The expected value of the predicted increase in mask-wearing was 22 percentage points whether
we described the intervention with or without mask promotion included. The difference in mask-
wearing observed in our two pilot studies suggests that in-person reinforcement increased mask-
wearing by 18 percentage points. In other words, policy-makers makers believed that in-person
reinforcement would have no additional impact, despite our piloting suggesting it is the single most
important element of our intervention. With regard to behavioral adjustments, 64% of respondents
predicted that physical distancing would either decrease or remain unchanged as a result of the
mask-promotion interventions, when in fact, it increased.
Policy-makers consistently believed that our cross-randomizations would increase mask-wearing,
when in fact, we find that none of them had a significant effect (often with fairly precise zeros).
68% of respondents believed that text messages would help (they didn’t), 62% of respondents
believed that incentives for village-leaders would help (they didn’t), and 77% of respondents be-
lieved that verbal commitments or commitments made using signs on one’s door would increase
29
mask-wearing (they didn’t). More details from our polling exercise are provided in Appendix J.
5 Discussion
We present results from a cluster-randomized controlled trial of a scalable intervention designed to
increase mask-wearing and reduce cases of COVID-19. Our estimates suggest that mask-wearing
increased by 28.8 percentage points, corresponding to an estimated 51,347 additional adults wear-
ing masks in intervention villages, and this effect was persistent even after active mask promotion
was discontinued. The intervention led to a 9.3% reduction in symptomatic SARS-CoV-2 sero-
prevalence (which corresponds to a 103 fewer symptomatic seropositives) and an 11.9% reduction
in the prevalence of COVID-like symptoms, corresponding to 1,587 fewer people reporting these
symptoms.9 The effects were substantially larger (and more precisely estimated) in communities
where we distributed surgical masks, consistent with their greater filtration efficiency measured
in the laboratory (manuscript forthcoming). In villages randomized to receive surgical masks, the
relative reduction in symptomatic seroprevalence was 11% overall, 23% among individuals aged
50-60, and 35% among those over 60.
We found clear evidence that surgical masks are effective in reducing symptomatic seropreva-
lence of SARS-CoV-2; while cloth masks clearly reduce symptoms, we cannot reject that they have
zero or only a small impact on symptomatic SARS-CoV-2 infections (perhaps reducing symptoms
of other respiratory diseases). Additionally, we found evidence that surgical masks were no less
likely to be adopted than cloth masks (perhaps slightly more likely). Thus, surgical masks have
higher filtration efficiency, are cheaper, are consistently worn, and are better supported by our
evidence as tools to reduce COVID-19.
Our results should not be taken to imply that masks can prevent only 10% of COVID-19 cases,
let alone 10% of COVID-19 mortality. Our intervention induced 29 more people out of every
100 to wear masks, with 42% of people wearing masks in total. The total impact with near-
9If we assume that non-consenting symptomatic individuals were seropositive at the same rate as consenting symp-tomatic individuals, the total estimated symptomatic seropositives prevented would be 258.
30

universal masking–perhaps achievable with alternative strategies or stricter enforcement–may be
several times larger than our 10% estimate. Additionally, the intervention reduced symptomatic
seroprevalence more when surgical masks were used, and even more for the highest-risk individu-
als in our sample (23% for ages 50-60 and 35% for ages 60+). These numbers likely give a better
sense of the impact of our intervention on severe morbidity and mortality, since most of the disease
burden is borne by the elderly. Where achievable, universal mask adoption is likely to have still
larger impacts.
We identified a combination of core intervention elements that were effective in increasing
mask-wearing in rural Bangladesh: mask distribution and role-modeling, combined with mask
promotion, leads to large and sustained increases in mask use. Results from our pilots suggest
that combining mask distribution, role-modeling, and active mask promotion – rather than mask
distribution and role-modeling alone – seems critical to achieving the full effect. Our trial results
also highlight many factors that appear inessential: we find no evidence that public commitments,
village-level incentives, text messages, altruistic messaging, or verbal commitments change mask-
wearing behavior. The null results on our cross-randomizations do not necessarily imply that these
approaches are not worth trying in other contexts, but they teach us that large increases in mask-
wearing are possible without these elements.
Our intervention design is immediately relevant for Bangladesh’s plans for larger-scale distri-
bution of masks across all rural areas. The Bangladesh Directorate-General of health has assigned
the study team and the NGO BRAC the responsibility to scale up the strategies that were proven
most effective in this trial to reach 81 million people [49]. At the time of writing, we are imple-
menting this program in the 37 districts prioritized by the government based on SARS-CoV-2 test
positivity rates. Our results are also relevant for mask dissemination and promotion campaigns
planned in other countries and settings which face similar challenges in ensuring mask usage as
a result of limited reach and enforcement capacity. The mask promotion model described in this
paper was subsequently adopted by governments and other implementers in Pakistan [50], India
[51], and Nepal [52]. The intervention package would be feasible to implement in a similar fashion
31
in other world regions as well. Beyond face masks, the conceptual underpinning of our strategies
could be applied to encourage the adoption of other health behaviors and technologies, in particu-
lar those easily observable by others outside the household, such as purchase and consumption of
food, alcohol, and tobacco products in stores, restaurants, or other public spaces [53], hand wash-
ing and infection control in healthcare facilities [54, 55, 56], hygiene interventions in childcare and
school settings [57, 58], improved sanitation [31, 59], or vaccination drives [60].
Policymakers and public health experts at the World Health Organization and the World Bank
were polled prior to presentations of the study results regarding mask-wearing. The majority of poll
respondents anticipated that text messages, verbal commitments, and incentives would increase
mask-wearing, when in reality, we estimated fairly precise null effects, and poll respondents be-
lieved that in-person mask promotion would have no additional effect, whereas the evidence from
our pilots suggests it is essential.
While critics of mask mandates suggest that individuals who wear masks are more likely to
engage in high risk behaviors, we found no evidence of risk compensation as a result of increased
mask-wearing. In fact, we found that our intervention increased the likelihood of physical distanc-
ing, presumably because individuals participating in the intervention took the threat of COVID-19
more seriously. These findings should be interpreted with caution, as these behavioral responses
may be especially context-dependent.
The intervention may have influenced rates of COVID-19 by increasing mask use and/or phys-
ical distancing and/or other risk prevention behaviors. Three factors suggest that the direct impact
of masks is the most likely explanation for our documented health impacts. First, while we find
similar impacts of cloth and surgical masks on physical distancing, we find consistently larger im-
pacts of surgical masks on symptomatic seroprevalence, consistent with the evidence that surgical
masks have better filtration efficiency [61]. Second, we see no change in physical distancing in the
highest risk environment in our study, typically crowded indoor mosques. The physical distancing
impacts we do measure were confined to outdoor environments. Third, our study complements
a large body of laboratory and quasi-experimental evidence that masks have a direct effect on
32

SARS-CoV-2 transmission [1].
Our study has several limitations. The distinct appearance of project-associated masks and ele-
vated mask-wearing in intervention villages made it impossible to blind surveillance staff to study
arm assignment (although the staff were not informed of the exact purpose of the study). Even
though surveillance staff were plain-clothed and were instructed to remain discreet, community
members could have recognized that they were being observed and changed their behavior. Addi-
tionally, survey respondents could have changed their likelihood of reporting symptoms in places
where mask-wearing was more widespread. We might expect this to bias us towards higher symp-
tomatic rates in treatment areas. While we confirm that blood consent rates are not significantly
different in the treatment and control group and are comparable across all demographic groups,
we cannot rule out that the composition of consenters differed between the treatment and control
groups. The slightly higher point estimate for consent in the treatment group again biases us away
from finding an effect, since it raises symptomatic seroprevalence in the treatment group. Although
control villages were at least 2 km from intervention villages, adults from control villages may have
come to intervention villages to receive masks, reducing the apparent impact of the intervention.
While we did not directly assess harms in this study, there could be costs resulting from discomfort
with increased mask-wearing, adverse health effects such as dermatitis or headaches, or impaired
communication.
Because the study was powered to detect differences in symptomatic seroprevalence, we cannot
distinguish whether masks work by making symptoms less severe (through a reduced viral load at
transmission) or by reducing new infections. We selected the WHO case definition of COVID-19
for its sensitivity, though its limited specificity may imply that the impact of masks on symp-
toms comes partly from non-SARS-CoV-2 respiratory infections. If masks reduce COVID-19 by
reducing symptoms (for a given number of infections), they could help ease the morbidity and
mortality resulting from a given number of SARS-CoV-2 infections. If masks reduce infections,
they may reduce the total number of infections over the long-term by buying more time to increase
the fraction of the population vaccinated. At the time of the study, the predominant circulating
33
SARS-CoV-2 strain was B.1.1.7 (alpha)[62]. The impacts of the delta variant on the number of
infections prevented by a given mask-wearer are uncertain; the population-wide consequences of
infections prevented by a given mask-wearer may be larger given a higher reproduction number.
We estimate that a scaled version of our intervention being implemented in Bangladesh will
cost between $10K and $52K per life saved, depending on what fraction of excess deaths are at-
tributable to COVID-19. This is considerably lower than the value of a statistical life in Bangladesh
($205,000, [63]) and under severe outbreaks, is comparable to the most cost-efficient humanitarian
programs at scale (e.g. distributing insecticide nets to prevent malaria costs $9,200 per life saved
[64]). This estimate includes only mortality impacts but not morbidity, and greater cost-efficiency
is possible if our intervention can be streamlined to further isolate the essential components. The
vast majority of our costs were the personnel costs for mask-promoters: if we consider only the
costs of mask production, these numbers would be 20x lower. Thus, the overall cost to save a life
in countries where mask-mandates can be enforced at minimal cost with existing infrastructure
may be substantially lower than our estimates above.
In summary, we found that mask distribution, role modeling, and promotion in a LMIC setting
increased mask-wearing and physical distancing, leading to lower illness, particularly in older
adults. We find stronger support for the use of surgical masks than cloth masks to prevent COVID-
19. Whether people with respiratory symptoms should generally wear masks to prevent respiratory
virus transmission—including for viruses other than SARS-CoV-2—is an important area for future
research. Our findings suggest that such a policy may benefit public health.
34

References
[1] J. Howard, et al., Proceedings of the National Academy of Sciences 118, e2014564118
(2021).
[2] N. H. Leung, et al., Nature Medicine 26, 676 (2020).
[3] C. R. MacIntyre, A. A. Chughtai, The bmj 350, h694 (2015).
[4] H. Bundgaard, et al., Annals of Internal Medicine 174, 335 (2021).
[5] C. T. Leffler, et al., American Journal of Tropical Medicine and Hygiene 103, 2400 (2020).
[6] W. Lyu, G. L. Wehby, Health Affairs 39, 1419 (2020).
[7] V. Chernozhukov, H. Kasaha, P. Schrimpf, Journal of Econometrics 220, 23 (2021).
[8] J. Abaluck, et al., SSRN (2020).
[9] A. Mullard, Nature (2020).
[10] Masks4All, What countries require masks in public or recommend masks?,
https://masks4all.co/what-countries-require-masks-in-public/ (2020). Accessed on 4
Jan 2021.
[11] T. A. Ghebreyesus, WHO Director-General’s opening remarks at the media briefing on
COVID-19 - 5 June 2020 (2020). Publisher: WHO.
[12] L. M. Brosseau, M. Sietsema, CIDRAP: Center for Infectious. Available at:
https://publichealth. uic. edu/news-stories/commentarymasks-for-all-for-covid-19-not-
based-on-sound-data (2020).
[13] M. A. Johansson, et al., JAMA Network Open 4, e2035057 (2021).
[14] D. Kahneman, D. T. Miller, Psychological review 93, 136 (1986).
35

[15] J. Jordan, E. Yoeli, D. Rand, PsyArXiv (2020).
[16] R. B. Cialdini, N. J. Goldstein, Annu. Rev. Psychol. 55, 591 (2004).
[17] Abdul Latif Jameel Poverty Action Lab (J-PAL), The price is wrong: Charging small fees
dramatically reduces access to important products for the poor (2011).
[18] A. Karing, University of California, Berkeley 2 (2018).
[19] D. Karlan, M. McConnell, S. Mullainathan, J. Zinman, Management Science 62, 3393 (2016).
[20] N. J. Goldstein, R. B. Cialdini, V. Griskevicius, Journal of consumer Research 35, 472 (2008).
[21] G. Miller, A. M. Mobarak, Marketing Science 34 (2014).
[22] P. Manchanda, Y. Xie, N. Youn, Marketing Science 27, 961 (2008).
[23] C. Bicchieri, Norms in the wild: How to diagnose, measure, and change social norms (Oxford
University Press, 2016).
[24] T. R. Bhuiyan, et al., medRxiv (2021).
[25] Higher covid-19 seropositivity observed among residents in Dhaka and Chattogram (2021).
Publisher: icddr,b. Accessed on 16 Aug 2021.
[26] Coronavirus COVID-19 dashboard, 2020 (2021). Accessed on 16 Aug 2021.
[27] M. V. Murhekar, et al., International Journal of Infectious Diseases 108, 145–155 (2021).
[28] A. Anand, J. Sandefur, A. Subramanian, CGD Working Paper 589 (2021).
[29] J. Abaluck, A. M. Mobarak, Getting all Bangladeshis to wear masks (2020). Publisher:
WhiteBoard Magazine.
[30] A. Jakubowski, et al., MedRxiv (2021).
[31] R. Guiteras, J. Levinsohn, A. M. Mobarak, Science 348, 903 (2015).
36

[32] O. O. Fadare, E. D. Okoffo, The Science of the total environment 737, 140279 (2020).
[33] Environment and Social Development Organization (EDSO) (Bangladesh), Covid-19 pan-
demic pushes single use plastic waste outbreak: No management, no protection: High health
and environmental risk unveil (2020).
[34] I. M. Steensgaard, et al., Environmental Pollution 224, 289 (2017).
[35] M. Kremer, E. Miguel, Quarterly Journal of Economics 122, 1007 (2007).
[36] P. S. Van Eck, W. Jager, P. S. Leeflang, Journal of Product Innovation Management 28, 187
(2011).
[37] E. Oster, R. Thornton, Journal of the European Economic Association 10, 1263 (2012).
[38] H. Allcott, Journal of public Economics 95, 1082 (2011).
[39] R. Guiteras, J. Levinsohn, A. M. Mobarak (2019).
[40] L. Beaman, A. BenYishay, J. Magruder, A. M. Mobarak, American Economic Review 111,
1918 (2021).
[41] N. Ashraf, O. Bandiera, K. Jack, Journal of Public Economics 120, 1 (2014).
[42] R. Chetty, E. Saez, L. Sandor, Journal of Economic Perspectives 28, 169 (2014).
[43] D. Ariely, A. Bracha, S. Meier, American Economic Review 99, 544 (2009).
[44] G. Bryan, D. Karlan, S. Nelson, Annual Review of Economics 2, 671 (2010).
[45] J. Luoto, D. Levine, J. Albert, S. Luby, Journal of Development Economics 110, 13 (2014).
[46] N. Ashraf, O. Bandiera, E. Davenport, S. S. Lee, American Economic Review 110, 1355
(2020).
[47] L. Bursztyn, R. Jensen, Annual Review of Economics 9, 131 (2017).
37

[48] World Health Organization, Who covid-19 case definition. Accessed on 15 October 2020.
[49] K. K. Tithila, Brac’s efforts to mask up bangladesh could be game-changer (2021). Publisher:
Dhaka Tribune, Bangladesh.
[50] S. Riaz, Punjab authorities kick off ’norm’ campaign to increase mask-wearing (2021). Pub-
lisher: Arab News, Pakistan.
[51] S. Bhattacharjee, Covid-19 crisis: India draws lessons from bangladesh’s mask study (2021).
Publisher: The Business Standard, India.
[52] Republica, Nepal mask campaign launches with the slogan ’let’s wear masks, let’s save each
other’s lives’ (2021). Publisher: Nagarik Network, Nepal.
[53] G. J. Hollands, et al., Cochrane Database of Systematic Reviews (2019).
[54] S. Naikoba, A. Hayward, Journal of hospital infection 47, 173 (2001).
[55] C. Houghton, et al., Cochrane Database of Systematic Reviews (2020).
[56] H. Seo, et al., Journal of Hospital Infection 102, 394 (2019).
[57] D. Biswas, et al., The American journal of tropical medicine and hygiene 101, 1446 (2019).
[58] S. L. McGuinness, et al., Tropical Medicine & International Health 23, 816 (2018).
[59] S. R. Patil, et al., PLOS Medicine 11, e1001709 (2014).
[60] J. S. Solís Arce, S. S. Warren, N. F. Meriggi, et al., Nature Medicine 27 (2021).
[61] L. H. Kwong, et al., ACS nano 15, 5904 (2021).
[62] J. Hadfield, et al., Bioinformatics 34, 4121 (2018).
[63] W. K. Viscusi, C. J. Masterman, Journal of Benefit-Cost Analysis 8, 226 (2017).
[64] GiveWell, 2021 GiveWell cost-effectiveness analysis — version 1. Accessed on 4 Jan 2021.
38

[65] COVID-19 Projections - Bangladesh (2021).
[66] Morbidity and Mortality Weekly Update (COVID-19) (2021).
39

6 Conflict of Interest
The funder had no role in the study design, interpretation of results, or decision to publish.
7 Research Ethics Approvals
Our study protocols were reviewed and approved by the Yale University Institutional Review Board
(Protocol ID: 2000028482), and by the Bangladesh Medical Research Council National Research
Ethics Committee (IRB registration number: 330 26 08 2020). We also received separate admin-
istrative approval from the Bangladesh Ministry of Health and Family Welfare. Study protocols
and plans were also discussed with public health experts at the International Centre for Diarrhoeal
Disease Research, Bangladesh (icddr,b) and a2i, an innovation agency within the Bangladesh gov-
ernment (https://a2i.gov.bd/), prior to implementation. We provide ethical justification for our
decisions in our online ethics appendix.
8 Funding
This research was financially supported by a grant from GiveWell.org to Innovations for Poverty
Action.
9 Acknowledgements
Thanks to Dr. Sabrina Flora, additional director general of the Directorate General of Health
Services in Bangladesh, James Snowden and Karen Levy for ongoing support and encouragement.
Thanks to WHO Chief Scientist Soumya Swaminathan for her encouragement to conduct this
trial. Thanks to Anir Chowdhury, policy advisor to the Bangladesh government, and Dr. Shams El
Arifeen of icddr,b for establishing connections with the Bangladesh Directorate General of Health
Services in the Ministry of Health and Family Welfare. Thanks to Asif Saleh, Executive Director
40

of BRAC, Dr. Morseda Chowdhury, Tanjila Mazumder Drishti, Imran Ahmed Chowdhury, and
hundreds of BRAC staff for help with implementation, especially in the scale-up phase of this
project in Bangladesh. Similarly, Reema Nanavaty, Sahil Hebbar, and other staff of SEWA India,
and Captain Usman and his team at the Lahore Commissioners office, the Nepal Rapid Action
Taskforce (RAT), Senator Carmen Sanguinetti, Mario Sanchez and Florencia Lopez Boo (IADB)
played crucial roles in replication and scale-ups in India, Pakistan, Nepal and Uruguay.
Thanks also to Judy Chevalier, Bhavani Prathap Kasina and Stacey Daves-Ohlin for their ad-
vice and assistance, Tom Schmidt for help in shipping, Peter Hull for econometrics consulting,
Arnab Bhattacharya of the Tata Institute of Fundamental Research and Shailabh Kumar of Stan-
ford University for conducting filtration efficiency testing of the study masks and evaluation of the
impact of washing on surgical mask performance, Yasser Choudhury from Katex for assistance
with the surgical masks, Anisur Rahman from Standard Group for assistance with the cloth masks,
GreenVoice, and many employees at IPA Bangladesh for assistance throughout this project.
Most importantly, our continued engagement in and scaling up of mask promotion would not
be possible without the tireless efforts of the Mask-NORM team, including Neela Saldanha, Heidi
McAnnally-Linz, Maha Rehman, Gautam Patel, Jose Pinilla, Janani Rajashekar, Preeti Adhikary,
Sharon Barnhardt, Mehrab Ali, Urvashi Wattal, Islamul Haque, Ana Tamayo, Laura Burke, Jeffrey
Mosenkis, and many other staff of Yale University and of Innovations for Poverty Action.
41

A List of Supplementary Materials
Appendix Figures and Tables
Fig. A1. Map of 600 Treatment and Control Unions
Fig. A2. Schematic of Cross-Randomizations
Fig. A3. Randomization Inference on Symptomatic Seroprevalence and Symptoms
Fig. A4. Persistence of Mask-Wearing
Table A1. Endline Blood Sample Collection
Table A2. Endline Blood Collection Consent Rates by Demographic Characteristics
Table A3. Balance Tests (Village-Level)
Table A4. Mask-Wearing and Physical Distancing, without Controlling for Baseline Variables
Table A5. Number of People Observed
Table A6. Symptomatic Seroprevalence
Table A7. Symptomatic Seroprevalence, Expressed in Prevalence Ratios
Table A8. WHO-Defined COVID-19 Symptoms, Expressed in Prevalence Ratios
Table A9. WHO-defined COVID-19 Symptoms
Table A10. WHO-defined COVID-19 Symptoms (Robustness Check)
Table A11. Pilot Analyses of Mask-Wearing
Table A12. Persistence of Mask-Wearing
Table A13. Subgroup Analyses of Mask-Wearing
Table A14. Symptomatic-Seroprevalence by 10-Year Age Groups
Table A15. Symptomatic Seroprevalence by Age Groups
Table A16. Symptomatic Seroprevalence by Age Groups, Expressed in Prevalence Ratios
Table A17. WHO-Defined COVID-19 Symptoms by Age Groups
Table A18. WHO-Defined COVID-19 Symptoms by 10-Year Age Groups
Table A19. WHO-Defined COVID-19 Symptoms by Age Groups, Expressed in Prevalence Ratios
42

Appendices
A. List of Supplementary Materials
B. Pairwise Randomization Procedure
C. Cross-Randomization Procedure
D. Statistical Analyses
E. Additional Balance Tests
F. Impact of Masks on Symptoms, Seropositivity, and Seroconversions
G. Mechanisms
H. Additional Preregistered Specifications
I. Intervention Cost and Benefit Estimates
J. Polling Policy Makers
Tables and Figures Referenced in Appendices
Fig. S1. Village-Level Cross Randomizations
Fig. S2. Household-Level Cross Randomizations
Table S1. Additional Balance Tests (Individual-Level)
Table S2. Additional Balance Tests (Individual-Level, After Sample Selection)
Table S3. Symptomatic Seroprevalence (With Controls and Additional Sample Selection)
Table S4. Village-Level Cross Randomizations
Table S5. Household-Level Cross-Randomizations
Table S6. IV Regressions
Table S7. Calculation of Number Needed to Treat and Cost per Life Saved
Table S8. What do you think was the increase in mask-wearing as a result of household mask
distribution and mask promotion in the community?
Table S9. What do you think was the additional effect of mask promoters reminding people to
wear masks?
Table S10. Do you think text message reminders to wear masks further increased mask-wearing?
43

Table S11. How do you think mask distribution and promotion affected physical distancing?
Table S12. Do you think incentive payments to village leaders further increased mask-wearing?
Table S13. Do you think verbal commitments and signage to wearing masks further increased
mask-wearing?
44

Figure A1: Map of 600 Treatment and Control Unions
Madhupur
Ramu
Sakhipur
Paba
Biral
Tala
Atrai
Boda
Patiya
KalaiSapahar
Chakaria
Debhata
Porsha
Puthia
Kalia
Godagari
Ulipur
Niamatpur
Bholahat
Ukhia
Manda
Kulaura
Shalikha
Ghatail
Panchbibi
Hathazari
Shibpur
Kotwali
Haripur
Kapasia
Raninagar
Patnitala
Kaliganj
Tanore
Lohagara
Kamalganj
Rajbari Sadar
Khetlal
Rajnagar
Kaunia
Kashiani
Sreepur
Ullah Para
Mirpur
Pirgachha
Mahadebpur
Shailkupa
Baliadangi
Madhabpur
Rajarhat
Agailjhara
Dhamoirhat
Sirajganj Sadar
Maheshpur
Roypura
Belkuchi
Chirirbandar
Badalgachhi
Jiban Nagar
Taraganj
Narail Sadar
Mitha Pukur
Kotchandpur
Gopalpur
Belabo
Tazumuddin
Homna
Gazipur Sadar
Magura Sadar
Gangachara
TitasHarinakunda
Bagher Para
Kalaroa
Panchagarh Sadar
Manirampur
Mohanpur
Rangpur SadarDinajpur Sadar
Singair
Mohammadpur
Kumarkhali
Muksudpur
Muradnagar
Jhenaidah Sadar
Satkhira Sadar
Kurigram Sadar
Cox's Bazar Sadar
Khoksa
Faridpur SadarBrahman Para
Balia Kandi
Joypurhat Sadar
Kushtia Sadar
Dhanbari
Chauddagram
Barura
Keraniganj
Nageshwari
Mymensingh Sadar
Narsingdi Sadar
Lalmonirhat Sadar
Chaugachha
Banchharampur
Chandina
Naogaon Sadar
Sunamganj Sadar
Gaibandha Sadar
Alamdanga
HalishaharChandgaonPahartali
Comilla Adarsha Sadar
Boalia
0 25 50 75 10012.5Miles
LegendTreatment unionsControl unionsUpazila BoundaryDistrict Name (Label)Divisional Boundary
600 Selected Unions for the Mask RCT Project±
The figure shows the location of the 600 treatment and control unions in the study.
45

Figu
reA
2:Sc
hem
atic
ofC
ross
-Ran
dom
izat
ions
Ran
dom
izat
ions
V1
Clo
thS
urgi
cal
1 vi
llage
V2
Sig
nage
No
sign
age
Col
ors
Hou
seho
ld-le
vel r
ando
miz
atio
n co
lor a
ssig
nmen
tsV
3N
o in
cent
ive
Mon
etar
y in
cent
ive
Cer
tific
ate
Def
ault
Trea
tmen
tE
xtra
mas
ks h
ande
d ou
tV
40%
text
s10
0% te
xts
Clo
th m
asks
Vill
age
1V
illag
e 2
H1
Altr
uism
H2
0% te
xts
50%
text
s10
0% te
xts
Sur
igca
l mas
ksV
illag
e 3
50%
of e
ach
colo
rH
3V
erba
l com
mitm
ent
Vill
age
450
% o
f eac
h co
lor
Villa
ge-le
vel R
ando
miz
atio
n - M
ask
Type
Clo
th: 0
.33
(100
Vill
ages
)
Villa
ge-le
vel R
ando
miz
atio
n - P
ublic
Com
mitm
ent
Sig
nage
: 0.5
(50
V)
No
sign
age:
0.5
(50
V)
Villa
ge-le
vel R
ando
miz
atio
n - I
ncen
tive
No
ince
ntiv
e 0.
25M
onet
ary
ince
ntiv
e 0.
25 C
ertif
icat
e: 0
.5N
o in
cent
ive:
0.2
5M
onet
ary
ince
ntiv
e 0.
25C
ertif
icat
e: 0
.5(1
3 V
)(1
2 V
)(2
5 V
)(1
3 V
)(1
2 V
)(2
5 V
)
Villa
ge-le
vel R
ando
miz
atio
n - T
exts
0% te
xts:
0.3
3 10
0% te
xts:
0.6
60%
text
s: 0
.33
100%
text
s: 0
.66
(8V
)0%
text
s: 0
.33
100%
text
s: 0
.66
(4V)
(9V)
(4V)
(8V
)(8
V)
(17V
)N
AH
ouse
hold
-leve
l Ran
dom
izat
ion
(3V
)(2
V)
(5V
)(3
V)
(3V
)(2
V)
(5V
)(2
V)
(8V
)(4
V)
(7V
)(5
V)
(1V
)(3
v)(2
V)
(7V
)(2
V)
(2V
)(1
V)
(7V
)(3
V)
(5V
)(6
V)
(11V
)
Villa
ge-le
vel R
ando
miz
atio
n - M
ask
Type
Sur
gica
l (10
0 V
)
Villa
ge-le
vel R
ando
miz
atio
n - P
ublic
Com
mitm
ent
Sig
nage
: 0.5
(100
V)
Villa
ge-le
vel R
ando
miz
atio
n - I
ncen
tive
No
ince
ntiv
e: 0
.25
(25
V)
Mon
etar
y in
cent
ive:
0.2
5 (2
5 V
)C
ertif
icat
e: 0
.5 (5
0 V
)
Villa
ge-le
vel R
ando
miz
atio
n - T
exts
NA
Hou
seho
ld-le
vel R
ando
miz
atio
n(1
0V)
(2V
)(1
1V)
(2V
)(8
V)
(4V
)(7
V)
(5V
)(1
8V)
(10V
)(1
3V)
(8V
)
Villa
ge-le
vel R
ando
miz
atio
n - M
ask
Type
Sur
gica
l (10
0 V
)
Villa
ge-le
vel R
ando
miz
atio
n - P
ublic
Com
mitm
ent
No
sign
age:
0.5
(100
V)
Villa
ge-le
vel R
ando
miz
atio
n - I
ncen
tive
No
ince
ntiv
e: 0
.25
(25
V)
Mon
etar
y in
cent
ive:
0.2
5 (2
5 V
)C
ertif
icat
e: 0
.5 (5
0 V
)
Villa
ge-le
vel R
ando
miz
atio
n - T
exts
0% te
xts:
0.3
310
0% te
xts:
0.6
60%
text
s: 0
.33
100%
text
s: 0
.66
0% te
xts:
0.3
310
0% te
xts:
0.6
6(8
V)
(17V
)(8
V)
(17V
)(1
7V)
(33V
)
Hou
seho
ld-le
vel R
ando
miz
atio
n(5
V)
(3V
)(5
V)
(12V
)(4
V)
(4V
)(4
V)
(13V
)(7
V)
(10V
)(1
0V)
(23V
)
Not
es:
Eac
hbo
xre
pres
ents
one
villa
gean
dea
chco
lorr
epre
sent
sa
villa
ge-l
evel
orho
useh
old-
leve
lran
dom
izat
ion.
Diff
eren
tton
esof
the
sam
ehu
ere
pres
ent
diff
eren
tpos
sibl
ere
aliz
atio
nsfo
reac
hra
ndom
izat
ion.
The
"Col
ors"
box
inth
eup
perr
ight
exem
plifi
esth
eco
loro
fmas
ksus
edto
deno
teho
useh
olds
that
rece
ived
the
defa
ulto
rint
erve
ntio
nco
nditi
onof
the
hous
ehol
d-le
velr
ando
miz
atio
n.
46

Table A1: Endline Blood Sample Collection
TreatmentVillages
ControlVillages
Total
Number of People Identified 178,288 163,838 342,126in Baseline Household Visits
Number of People Reached for Symptom Collection 174,171 161,211 335,382on in the Midline and Endline Visits
Number of People with WHO-defined 13,273 13,893 27,166COVID-19 Symptoms
Number of Symptomatic Endline 5,414 5,538 10,952Blood Samples Collected
Number of Symptomatic Endline 5,006 4,971 9,977Blood Samples Tested
All counts provided are at the individual level.WHO-defined COVID-19 symptoms is defined as any of the following:(a) fever and cough;(b) any three of the following (fever, cough, general weakness/fatigue, headache, muscle aches, sore throat, coryza[nasal congestion or runny nose], dyspnoea [shortness of breath or difficulty breathing], anorexia [loss ofappetite]/nausea/vomiting, diarrhoea, altered mental status;(c) anosmia [loss of smell] and ageusia [loss of taste].
47

Table A2: Endline Blood Collection Consent Rates by Demographic Characteristics
Treatment Control Total
Total 40.8% 39.9% 40.3%
By Sex
Female 41.0% 39.7% 40.4%Male 40.5% 40.0% 40.3%
By Age Group
≤ 40 Y.O. 41.0% 39.2% 40.1%Between 40-50 Y.O. 40.7% 40.5% 40.6%Between 50-60 Y.O. 41.8% 40.8% 41.3%≥ 60 Y.O. 39.4% 40.0% 39.7%
Consent rates are defined as the ratio of the number of individuals we successfully drew blood from to the number ofeligible symptomatic individuals.
48

Table A3: Balance Tests (Village-Level)
BaselineSymptomatic
Seroprevalence Rate
WHO-DefinedCOVID-19Symptoms
BaselineMask-Wearing Rate
Summary Statistics
Intervention Rate 0.00002 0.027 0.123
Control Rate 0.00003 0.025 0.125
Balance Tests
Intervention Coefficient -0.00000 0.001 0.001(0.00002) (0.002) (0.005)
N villages 572 572 572
F 0.12Joint-Test Prob > F 0.9471
Standard errors are in parentheses.*** Significant at the 1 percent level. ** Significant at the 5 percent level. * Significant at the 10 percent level.The baseline symptomatic seroprevalence is defined using 20 percent random sample of all the baseline blood draws.All individuals without a baseline blood sample have a symptomatic seroprevalence value of 0.We classify a WHO-Defined COVID-19 symptoms as any of the following(a) fever and cough;(b) three or more of the following symptoms (fever, cough, general weakness/fatigue, headache, myalgia, sore throat,coryza, dyspnea, anorexia/nausea/vomiting, diarrhea, altered mental status);(c) loss of taste or smell.The baseline rate of mask-wearing was measured through observation over a 1 week period, defined as the rate ofthose observed who wear a mask or face covering that covers the nose and mouth.The sample excludes 4 villages because of lack of government cooperation to perform the intervention. The analysisexcludes 11 villages and their village-pairs in the full sample because we did not observe them in the baseline periodprior to the intervention, and 1 village and its pair for lack of observational data throughout the intervention period.
49

Table A4: Mask-Wearing and Physical Distancing, without Controlling for Baseline Variables
Full NoActivePromo-
tion
Mosques Markets OtherLoca-tions
SurgicalMask
Villages
ClothMask
Villages
Proper Mask-Wearing
Intervention Coefficient 0.288*** 0.279*** 0.371*** 0.288*** 0.252*** 0.302*** 0.258***(0.012) (0.012) (0.016) (0.012) (0.012) (0.014) (0.020)
Average Mask-Wearing Rate 0.133 0.134 0.123 0.120 0.146 0.129 0.143in Paired Control Villages§
Social Distancing
Intervention Coefficient 0.050*** 0.056*** 0.000 0.073*** 0.067*** 0.053*** 0.044***(0.005) (0.005) (0.000) (0.007) (0.007) (0.006) (0.011)
Average Distancing Rate 0.241 0.253 0.000 0.291 0.311 0.229 0.268in Paired Control Villages§
N villages 572 572 570 570 568 380 192
Standard errors are in parentheses.*** Significant at the 1 percent level. ** Significant at the 5 percent level. * Significant at the 10 percent level.All regressions also include an indicator for each control-intervention pair.§We report the mean rate of proper mask-wearing among the control villages after the baseline observation. This isnot equivalent to the coefficient on the constant due to the inclusion of the pair indicators as controls.”Other Locations” include tea stalls, at the entrance of the restaurant as patrons enter, and the main road to enter thevillage.“Surgical Villages” refer to all treatment villages which received surgical masks as part of the intervention, and theircontrol pairs. “Cloth Villages” refer to all treatment villages which received cloth masks as part of the intervention,and their control pairs. These samples include surveillance from all available locations, equivalent to the to thecolumn labeled “Full”, but run separately for each subgroup.The sample excludes 4 villages because of lack of government cooperation to perform the intervention. The analysisexcludes a remaining 12 villages and their village-pairs in the full sample, 13 villages and their pairs in the mosqueand market sub-samples, and 14 villages and their pairs in the other location sub-sample because we did not observethem in the baseline period prior to the intervention. Of the 572 villages included in the “Full” sample, 380 of themare treatment villages and their control pairs which received surgical masks as part of the intervention, and theremaining 192 are treatment villages and their control pairs which received cloth masks.
50

Table A5: Number of People Observed
Full NoActivePromo-
tion
Mosques Markets OtherLoca-tions
SurgicalMask
Villages
ClothMask
Villages
No Baseline Control
Intervention Coefficient -31 -53 35 -20 -46** -9 -75(51) (45) (24) (17) (23) (63) (85)
Avg. Number People Observed 2820 2682 580 882 1358 2914 2635in Paired Control Villages§
With Baseline Control
Intervention Coefficient -43 -64 23 -18 -53** -37 -45(45) (40) (20) (15) (21) (58) (76)
N villages 572 572 570 570 568 380 192
Standard errors are in parentheses.*** Significant at the 1 percent level. ** Significant at the 5 percent level. * Significant at the 10 percent level.All regressions also include an indicator for each control-intervention pair. The regressions ”with baseline control”include controls for the number of people observed in the baseline visit.§We report the average number of people observed among the control villages after the baseline observation. This isnot equivalent to the coefficient on the constant due to the inclusion of the pair indicators as controls.”Other Locations” include tea stalls, at the entrance of the restaurant as patrons enter, and the main road to enter thevillage.“Surgical Villages” refer to all treatment villages which received surgical masks as part of the intervention, and theircontrol pairs. “Cloth Villages” refer to all treatment villages which received cloth masks as part of the intervention,and their control pairs. These samples include surveillance from all available locations, equivalent to the to thecolumn labeled “Full”, but run separately for each subgroup.The sample excludes 4 villages because of lack of government cooperation to perform the intervention. The analysisexcludes a remaining 12 villages and their village-pairs in the full sample, 13 villages and their pairs in the mosqueand market sub-samples, and 14 villages and their pairs in the other location sub-sample because we did not observethem in the baseline period prior to the intervention. Of the 572 villages included in the “Full” sample, 380 of themare treatment villages and their control pairs which received surgical masks as part of the intervention, and theremaining 192 are treatment villages and their control pairs which received cloth masks.
51

Table A6: Symptomatic Seroprevalence
Intervention Effect Intervention Effect byMask Type
No Baseline Controls
Intervention Coefficient -0.0007**(0.0003)
Intervention Coefficient -0.0008*for Surgical Mask Villages (0.0004)
Intervention Coefficient -0.0004for Cloth Mask Villages (0.0005)
Average Symptomatic Seroprevalence 0.0076 0.0076Rate in Paired Control Villages§
With Baseline Controls
Intervention Coefficient -0.0007**(0.0003)
Intervention Coefficient -0.0009**for Surgical Mask Villages (0.0004)
Intervention Coefficient -0.0002for Cloth Mask Villages (0.0005)
N individuals 307,106 307,106N villages 572 572
Standard errors are in parentheses.*** Significant at the 1 percent level. ** Significant at the 5 percent level. * Significant at the 10 percent level.All regressions also include an indicator for each control-intervention pair. The regressions ”with baseline controls”include controls for baseline rates of social distancing and baseline symptom rates.Baseline Symptom Rate is defined as the rate of surveyed individuals in a village who report symptoms coincidingwith the WHO definition of a probable COVID-19 case. This is defined as any of the following:(a) fever and cough;(b) any three of the following (fever, cough, general weakness/fatigue, headache, muscle aches, sore throat, coryza[nasal congestion or runny nose], dyspnoea [shortness of breath or difficulty breathing], anorexia [loss ofappetite]/nausea/vomiting, diarrhoea, altered mental status;(c) anosmia [loss of smell] and ageusia [loss of taste].§We report the mean symptomatic seroprevalence at endline. This is not equivalent to the coefficient on the constantdue to the inclusion of the pair indicators as controls.The sample excludes 4 villages because of lack of government cooperation to perform the intervention. The analysisexcludes 11 villages and their village-pairs in the full sample because we did not observe them in the baseline periodprior to the intervention, and 1 village and its pair for lack of observational data throughout the intervention period.The analysis includes all people surveyed in the baseline household visits, excluding individuals that we did notcollect midline or endline symptoms for, symptomatic individuals that we did not collect blood from, and individualsthat we drew blood from but did not test their blood.
52

Table A7: Symptomatic Seroprevalence, Expressed in Prevalence Ratios
Intervention Effect Intervention Effect byMask Type
No Baseline Controls
Intervention Prevalence Ratio 0.906**[0.814, 0.997]
Intervention Prevalence Ratio 0.894*for Surgical Mask Villages [0.782,1.006]
Intervention Prevalence Ratio 0.933for Cloth Mask Villages [0.776,1.089]
Average Symptomatic-Seroprevalence 0.0076 0.0076Rate in Paired Control Villages§
With Baseline Controls
Intervention Prevalence Ratio 0.907**[0.817, 0.997]
Intervention Prevalence Ratio 0.888**for Surgical Mask Villages [0.780,0.997]
Intervention Prevalence Ratio 0.950for Cloth Mask Villages [0.791,1.109]
N individuals 288,612 288,612N villages 536 536
Confidence Intervals are in brackets.*** Significant at the 1 percent level. ** Significant at the 5 percent level. * Significant at the 10 percent level.All regressions also include an indicator for each control-intervention pair. The regressions ”with baseline controls”include controls for baseline rates of social distancing and baseline symptom rates.Baseline Symptom Rate is defined as the rate of surveyed individuals in a village who report symptoms coincidingwith the WHO definition of a probable COVID-19 case. This is defined as any of the following:(a) fever and cough;(b) any three of the following (fever, cough, general weakness/fatigue, headache, muscle aches, sore throat, coryza[nasal congestion or runny nose], dyspnoea [shortness of breath or difficulty breathing], anorexia [loss ofappetite]/nausea/vomiting, diarrhoea, altered mental status;(c) anosmia [loss of smell] and ageusia [loss of taste].§We report the mean symptomatic seroprevalence at endline. This is not equivalent to the coefficient on the constantdue to the inclusion of the pair indicators as controls.The sample excludes 4 villages because of lack of government cooperation to perform the intervention. The analysisexcludes 11 villages and their village-pairs in the full sample because we did not observe them in the baseline periodprior to the intervention, and 1 village and its pair for lack of observational data throughout the intervention period.The analysis includes all people surveyed in the baseline household visits, excluding individuals that we did notcollect midline or endline symptoms for, symptomatic individuals that we did not collect blood from, and individualsthat we drew blood from but did not test their blood.The regressions exclude 18,494 individuals in 36 villages because there are 0 people who aresymptomatic-seropositive in their village pairs.
53

Table A8: WHO-Defined COVID-19 Symptoms, Expressed in Prevalence Ratios
Intervention Effect Intervention Effect byMask Type
No Baseline Controls
Intervention Prevalence Ratio 0.881***[0.831,0.931]
Intervention Prevalence Ratio 0.871***for Surgical Mask Villages [0.807,0.936]
Intervention Prevalence Ratio 0.901**for Cloth Mask Villages [0.816,0.986]
Average Symptomatic-Seroprevalence 0.0859 0.0859Rate in Paired Control Villages§
With Baseline Controls
Intervention Prevalence Ratio 0.881***[0.830,0.933]
Intervention Prevalence Ratio 0.864***for Surgical Mask Villages [0.801,0.926]
Intervention Prevalence Ratio 0.915**for Cloth Mask Villages [0.831,0.999]
N individuals 323,596 323,596N villages 572 572
Confidence Intervals are in brackets.*** Significant at the 1 percent level. ** Significant at the 5 percent level. * Significant at the 10 percent level.All regressions also include an indicator for each control-intervention pair. The regressions ”with baseline controls”include controls for baseline rates of social distancing and baseline symptom rates.Baseline Symptom Rate is defined as the rate of surveyed individuals in a village who report symptoms coincidingwith the WHO definition of a probable COVID-19 case. This is defined as any of the following:(a) fever and cough;(b) any three of the following (fever, cough, general weakness/fatigue, headache, muscle aches, sore throat, coryza[nasal congestion or runny nose], dyspnoea [shortness of breath or difficulty breathing], anorexia [loss ofappetite]/nausea/vomiting, diarrhoea, altered mental status;(c) anosmia [loss of smell] and ageusia [loss of taste].§We report the mean rate of symptomatic status at endline. This is not equivalent to the coefficient on the constantdue to the inclusion of the pair indicators as controls.The sample excludes 4 villages because of lack of government cooperation to perform the intervention. The analysisexcludes 11 villages and their village-pairs in the full sample because we did not observe them in the baseline periodprior to the intervention, and 1 village and its pair for lack of observational data throughout the intervention period.The analysis in the first column includes all people surveyed in the baseline household visits, excluding individualsthat we did not collect midline or endline symptoms for, symptomatic individuals that we did not collect blood from,and individuals that we drew blood from but did not test their blood.The analysis includes all people surveyed in the baseline household visits, excluding individuals that we did notcollect midline or endline symptoms for.
54

Figure A3: Randomization Inference on Symptomatic Seroprevalence and Symptoms
(a) Symptomatic Seroprevalence(b) Symptomatic Seroprevalence, Without Base-line Controls
(c) Symptoms (d) Symptoms, Without Baseline Controls
The histograms are generated by plotting the frequency the coefficient on the intervention under 1,000 imputations ofrandomly assigning the treatment/control status within each village-pair. The regressions used to generate theintervention coefficient in panel (a) and (b) are equivalent to those in Table A6, top and bottom panel, respectively.The regressions used in panel (c) and (d) are equivalent to those in Table A9, top and bottom panel, respectively.The one-sided p-values for each panel is as follows:(a) 0.081(b) 0.084(c) 0.002(d) 0.001
55

Table A9: WHO-defined COVID-19 Symptoms
Intervention Effect Intervention Effect by MaskType
No Baseline Controls
Intervention Coefficient -0.0096***(0.0022)
Intervention Coefficient -0.0105***for Surgical Mask Villages (0.0028)
Intervention Coefficient -0.0079**for Cloth Mask Villages (0.0035)
Average Symptomatic Rate 0.0859 0.0859in Paired Control Villages§
With Baseline Controls
Intervention Coefficient -0.0095***(0.0021)
Intervention Coefficient -0.0112***for Surgical Mask Villages (0.0028)
Intervention Coefficient -0.0063*for Cloth Mask Villages (0.0035)
N individuals 323,596 323,596N villages 572 572
Standard errors are in parentheses.*** Significant at the 1 percent level. ** Significant at the 5 percent level. * Significant at the 10 percent level.All regressions also include an indicator for each control-intervention pair. The regressions ”with baseline controls”include controls for baseline rates of social distancing and baseline symptom rates.Baseline Symptom Rate is defined as the rate of surveyed individuals in a village who report symptoms coincidingwith the WHO definition of a probable COVID-19 case. This is defined as any of the following:(a) fever and cough;(b) any three of the following (fever, cough, general weakness/fatigue, headache, muscle aches, sore throat, coryza[nasal congestion or runny nose], dyspnoea [shortness of breath or difficulty breathing], anorexia [loss ofappetite]/nausea/vomiting, diarrhoea, altered mental status;(c) anosmia [loss of smell] and ageusia [loss of taste].§We report the mean rate of WHO-defined COVID-19 symptomatic status at endline. This is not equivalent to thecoefficient on the constant due to the inclusion of the pair indicators as controls.The sample excludes 4 villages because of lack of government cooperation to perform the intervention. The analysisexcludes 11 villages and their village-pairs in the full sample because we did not observe them in the baseline periodprior to the intervention, and 1 village and its pair for lack of observational data throughout the intervention period.The analysis includes all people surveyed in the baseline household visits, excluding individuals that we did notcollect midline or endline symptoms for.
56

Table A10: WHO-defined COVID-19 Symptoms (Robustness Check)
Intervention Effect Intervention Effect by MaskType
No Baseline Controls
Intervention Coefficient -0.0031***(0.0011)
Intervention Coefficient -0.0047***for Surgical Mask Villages (0.0015)
Intervention Coefficient 0.0001for Cloth Mask Villages (0.0017)
Average Symptomatic Rate 0.0330 0.0330in Paired Control Villages§
With Baseline Controls
Intervention Coefficient -0.0030***(0.0011)
Intervention Coefficient -0.0050***for Surgical Mask Villages (0.0015)
Intervention Coefficient 0.0009for Cloth Mask Villages (0.0017)
N individuals 307,106 307,106N villages 572 572
Standard errors are in parentheses.*** Significant at the 1 percent level. ** Significant at the 5 percent level. * Significant at the 10 percent level.All regressions also include an indicator for each control-intervention pair. The regressions ”with baseline controls”include controls for baseline rates of social distancing and baseline symptom rates.Baseline Symptom Rate is defined as the rate of surveyed individuals in a village who report symptoms coincidingwith the WHO definition of a probable COVID-19 case. This is defined as any of the following:(a) fever and cough;(b) any three of the following (fever, cough, general weakness/fatigue, headache, muscle aches, sore throat, coryza[nasal congestion or runny nose], dyspnoea [shortness of breath or difficulty breathing], anorexia [loss ofappetite]/nausea/vomiting, diarrhoea, altered mental status;(c) anosmia [loss of smell] and ageusia [loss of taste].§We report the mean rate of WHO-defined COVID symptomatic status at endline. This is not equivalent to thecoefficient on the constant due to the inclusion of the pair indicators as controls.The sample excludes 4 villages because of lack of government cooperation to perform the intervention. The analysisexcludes 11 villages and their village-pairs in the full sample because we did not observe them in the baseline periodprior to the intervention, and 1 village and its pair for lack of observational data throughout the intervention period.The analysis includes all people surveyed in the baseline household visits, excluding individuals that we did notcollect midline or endline symptoms for, symptomatic individuals that we did not collect blood from, and individualsthat we drew blood from but did not test their blood.
57

Table A11: Pilot Analyses of Mask Wearing
MainIntervention
Pilot 1 Pilot 2 Pilot 1 Pilot 2
No Baseline Controls
Intervention Coefficient 0.288*** 0.109 0.284(0.012) [-0.161, 0.320] [0.081, 0.408]
Difference from Main -0.189*** 0.022Intervention (0.073) (0.053)
Average Control Mask 0.1339 0.129 0.095Wearing Rate§
With Baseline Controls
Intervention Effect 0.288*** 0.096 0.341(0.012) [-0.126, 0.315] [0.135, 0.509]
Difference from Main -0.181** -0.005Intervention (.092) (.058)
N villages 572 10 10 592 592
Standard errors are in parentheses. Confidence intervals are in brackets, computed using wild bootstrap.*** Significant at the 1 percent level. ** Significant at the 5 percent level. * Significant at the 10 percent level.The regressions ”with baseline controls” include controls for baseline rates of mask-wearing.The first column reports the results of our main intervention; equivalent to the results in Table ??, using fullsurveillance data.§We report the mean rate of mask-wearing among the control villages after the baseline observation. This is notequivalent to the coefficient on the constant due to the inclusion of the pair indicators as controls.
58
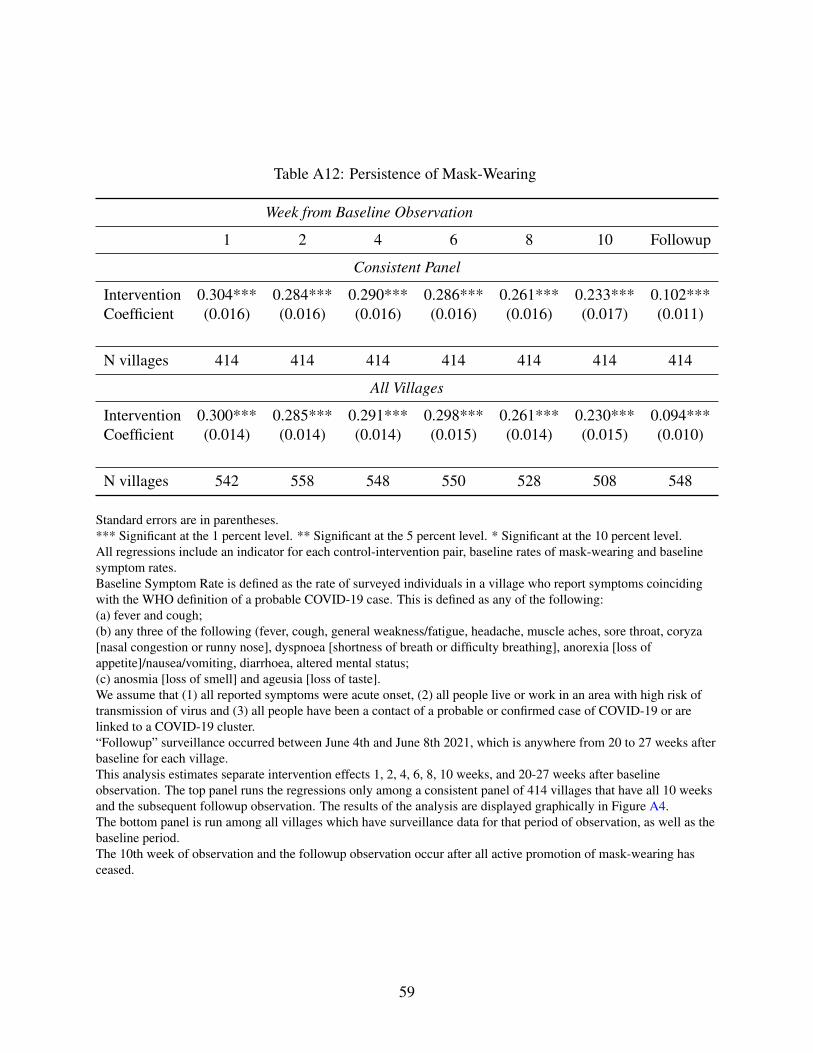
Table A12: Persistence of Mask-Wearing
Week from Baseline Observation
1 2 4 6 8 10 Followup
Consistent Panel
Intervention 0.304*** 0.284*** 0.290*** 0.286*** 0.261*** 0.233*** 0.102***Coefficient (0.016) (0.016) (0.016) (0.016) (0.016) (0.017) (0.011)
N villages 414 414 414 414 414 414 414
All Villages
Intervention 0.300*** 0.285*** 0.291*** 0.298*** 0.261*** 0.230*** 0.094***Coefficient (0.014) (0.014) (0.014) (0.015) (0.014) (0.015) (0.010)
N villages 542 558 548 550 528 508 548
Standard errors are in parentheses.*** Significant at the 1 percent level. ** Significant at the 5 percent level. * Significant at the 10 percent level.All regressions include an indicator for each control-intervention pair, baseline rates of mask-wearing and baselinesymptom rates.Baseline Symptom Rate is defined as the rate of surveyed individuals in a village who report symptoms coincidingwith the WHO definition of a probable COVID-19 case. This is defined as any of the following:(a) fever and cough;(b) any three of the following (fever, cough, general weakness/fatigue, headache, muscle aches, sore throat, coryza[nasal congestion or runny nose], dyspnoea [shortness of breath or difficulty breathing], anorexia [loss ofappetite]/nausea/vomiting, diarrhoea, altered mental status;(c) anosmia [loss of smell] and ageusia [loss of taste].We assume that (1) all reported symptoms were acute onset, (2) all people live or work in an area with high risk oftransmission of virus and (3) all people have been a contact of a probable or confirmed case of COVID-19 or arelinked to a COVID-19 cluster.“Followup” surveillance occurred between June 4th and June 8th 2021, which is anywhere from 20 to 27 weeks afterbaseline for each village.This analysis estimates separate intervention effects 1, 2, 4, 6, 8, 10 weeks, and 20-27 weeks after baselineobservation. The top panel runs the regressions only among a consistent panel of 414 villages that have all 10 weeksand the subsequent followup observation. The results of the analysis are displayed graphically in Figure A4.The bottom panel is run among all villages which have surveillance data for that period of observation, as well as thebaseline period.The 10th week of observation and the followup observation occur after all active promotion of mask-wearing hasceased.
59
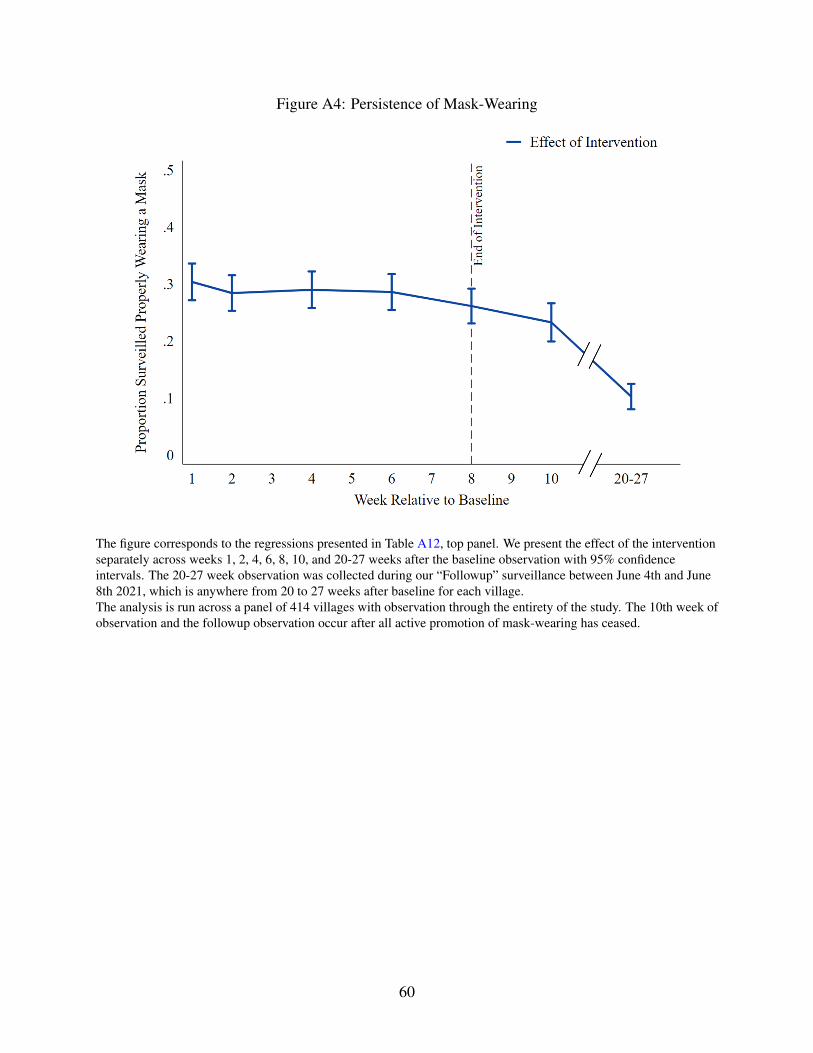
Figure A4: Persistence of Mask-Wearing
The figure corresponds to the regressions presented in Table A12, top panel. We present the effect of the interventionseparately across weeks 1, 2, 4, 6, 8, 10, and 20-27 weeks after the baseline observation with 95% confidenceintervals. The 20-27 week observation was collected during our “Followup” surveillance between June 4th and June8th 2021, which is anywhere from 20 to 27 weeks after baseline for each village.The analysis is run across a panel of 414 villages with observation through the entirety of the study. The 10th week ofobservation and the followup observation occur after all active promotion of mask-wearing has ceased.
60

Table A13: Subgroup Analyses of Mask-Wearing
Female Only Male Only Above Median Below Median
No Baseline Controls
Intervention Coefficient 0.225*** 0.271*** 0.247*** 0.350***(0.013) (0.013) (0.018) (0.022)
Average Control Mask- 0.312 0.116 0.175 0.087Wearing Rate§
With Baseline Controls
Intervention Coefficient 0.225*** 0.271*** 0.247*** 0.354***(0.013) (0.013) (0.019) (0.022)
N villages 566 566 200 202
Standard errors are in parentheses.*** Significant at the 1 percent level. ** Significant at the 5 percent level. * Significant at the 10 percent level.All regressions also include an indicator for each control-intervention pair. The baseline control regressions includecontrols for baseline rates of mask-wearing and baseline symptom rates. For the gender subgroup analyses, thebaseline symptom rate and baseline mask-wearing rate was defined across all individuals, not just those amongfemales and males, respectively.Baseline Symptom Rate is defined as the rate of surveyed individuals in a village who report symptoms coincidingwith the WHO definition of a probable COVID-19 case. This is defined as any of the following:(a) fever and cough;(b) any three of the following (fever, cough, general weakness/fatigue, headache, muscle aches, sore throat, coryza[nasal congestion or runny nose], dyspnoea [shortness of breath or difficulty breathing], anorexia [loss ofappetite]/nausea/vomiting, diarrhoea, altered mental status;(c) anosmia [loss of smell] and ageusia [loss of taste].We assume that (1) all reported symptoms were acute onset, (2) all people live or work in an area with high risk oftransmission of virus and (3) all people have been a contact of a probable or confirmed case of COVID-19 or arelinked to a COVID-19 cluster.The sex-specific subgroup is run on all locations except mosques because no females were observed at mosques. Thesex-specific samples excludes 6 villages because of lack of data. The above-median and below-median samplesincludes 85 singleton observations which were dropped.
61

Table A14: Symptomatic Seroprevalence by 10-Year Age Groups
All 18-30 Y.O. 30-40 Y.O. 40-50 Y.O. 50-60 Y.O. 60-70 Y.O. ≥ 70 Y.O.
No Baseline Controls
Intervention Coefficient -0.0007** -0.0004 0.0007 -0.0008 -0.0022*** -0.0019* -0.0016(0.0003) (0.0003) (0.0005) (0.0007) (0.0008) (0.0010) (0.0012)
Avg. Symptomatic Seroprevalence 0.0076 0.0045 0.0069 0.0095 0.0108 0.0104 0.0101in Paired Control Vill.§
With Baseline Controls
Intervention Coefficient -0.0007** -0.0004 0.0007 -0.0009 -0.0021*** -0.0019* -0.0016(0.0003) (0.0003) (0.0005) (0.0007) (0.0008) (0.0010) (0.0012)
N Individuals 307,106 101,939 70,285 52,161 39,307 27,792 15,622N Villages 572 572 572 572 572 572 572
Standard errors are in parentheses.*** Significant at the 1 percent level. ** Significant at the 5 percent level. * Significant at the 10 percent level.All regressions also include an indicator for each control-intervention pair. The regressions “with baseline controls”include controls for baseline rates of mask-wearing and baseline symptom rates.Baseline Symptom Rate is defined as the rate of surveyed individuals in a village who report symptoms coincidingwith the WHO definition of a probable COVID-19 case. This is defined as any of the following:(a) fever and cough;(b) any three of the following (fever, cough, general weakness/fatigue, headache, muscle aches, sore throat, coryza[nasal congestion or runny nose], dyspnoea [shortness of breath or difficulty breathing], anorexia [loss ofappetite]/nausea/vomiting, diarrhoea, altered mental status;(c) anosmia [loss of smell] and ageusia [loss of taste].§We report the mean symptomatic-seroprevalence at endline. This is not equivalent to the coefficient on the constantdue to the inclusion of the pair indicators as controls.The sample excludes 4 villages because of lack of government cooperation to perform the intervention. The analysisexcludes 11 villages and their village-pairs in the full sample because we did not observe them in the baseline periodprior to the intervention, and 1 village and its pair for lack of observational data throughout the intervention period.The analysis includes all people surveyed in the baseline household visits, excluding individuals that we did notcollect midline or endline symptoms for, symptomatic individuals that we did not collect blood from, and individualsthat we drew blood from but did not test their blood.
62

Table A15: Symptomatic Seroprevalence by Age Groups
All ≤ 40 Y.O. Between40-50 Y.O.
Between50-60 Y.O.
≥ 60 Y.O.
No Baseline Controls
Intervention Coefficient -0.0008* -0.0001 0.0000 -0.0024*** -0.0032***for Surgical Mask Villages (0.0004) (0.0004) (0.0009) (0.0009) (0.0010)
Average Symptomatic Seroprevalence 0.0076 0.0055 0.0095 0.0108 0.0103in Paired Control Villages§
With Baseline Controls
Intervention Coefficient -0.0009** -0.0003 -0.0001 -0.0025*** -0.0034***for Surgical Mask Villages (0.0004) (0.0004) (0.0008) (0.0009) (0.0010)
N Individuals 307,106 172,224 52,161 39,307 43,414N Villages 572 572 572 572 572
Standard errors are in parentheses.*** Significant at the 1 percent level. ** Significant at the 5 percent level. * Significant at the 10 percent level.All regressions also include an indicator for each control-intervention pair. The regressions “with baseline controls”include controls for baseline rates of mask-wearing and baseline symptom rates.Baseline Symptom Rate is defined as the rate of surveyed individuals in a village who report symptoms coincidingwith the WHO definition of a probable COVID-19 case. This is defined as any of the following:(a) fever and cough;(b) any three of the following (fever, cough, general weakness/fatigue, headache, muscle aches, sore throat, coryza[nasal congestion or runny nose], dyspnoea [shortness of breath or difficulty breathing], anorexia [loss ofappetite]/nausea/vomiting, diarrhoea, altered mental status;(c) anosmia [loss of smell] and ageusia [loss of taste].§We report the mean symptomatic seroprevalence at endline. This is not equivalent to the coefficient on the constantdue to the inclusion of the pair indicators as controls.The sample excludes 4 villages because of lack of government cooperation to perform the intervention. The analysisexcludes 11 villages and their village-pairs in the full sample because we did not observe them in the baseline periodprior to the intervention, and 1 village and its pair for lack of observational data throughout the intervention period.The analysis includes all people surveyed in the baseline household visits, excluding individuals that we did notcollect midline or endline symptoms for, symptomatic individuals that we did not collect blood from, and individualsthat we drew blood from but did not test their blood.
63
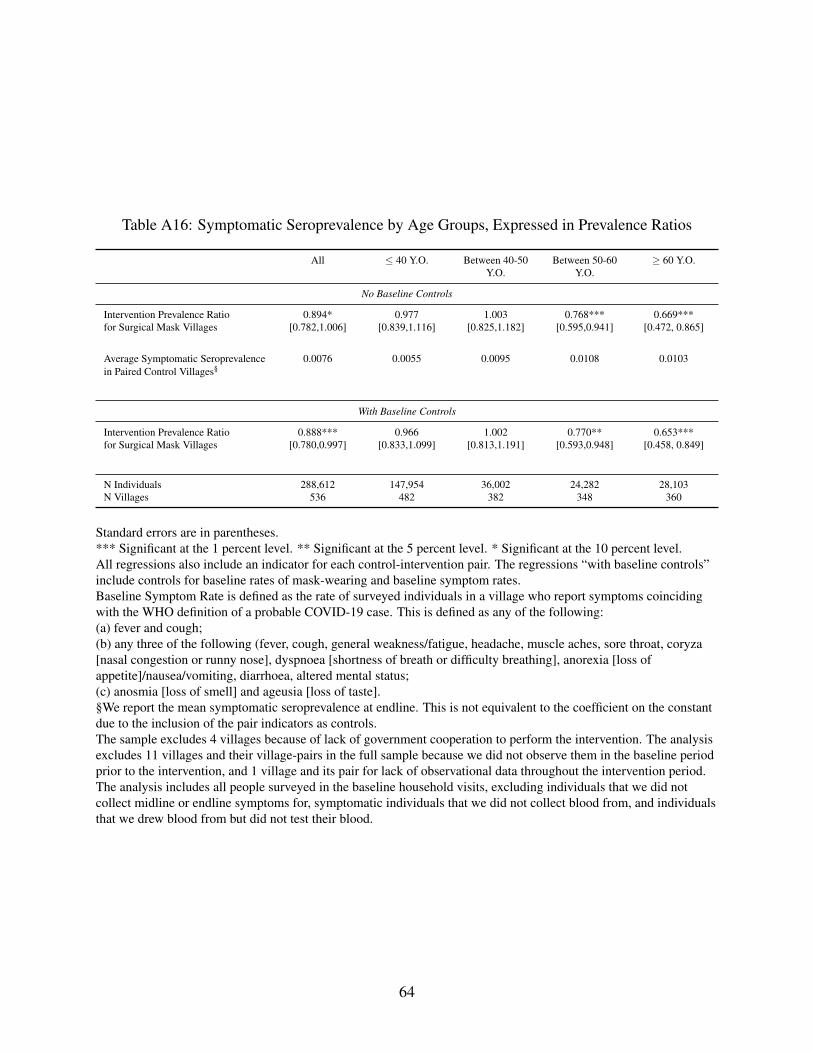
Table A16: Symptomatic Seroprevalence by Age Groups, Expressed in Prevalence Ratios
All ≤ 40 Y.O. Between 40-50Y.O.
Between 50-60Y.O.
≥ 60 Y.O.
No Baseline Controls
Intervention Prevalence Ratio 0.894* 0.977 1.003 0.768*** 0.669***for Surgical Mask Villages [0.782,1.006] [0.839,1.116] [0.825,1.182] [0.595,0.941] [0.472, 0.865]
Average Symptomatic Seroprevalence 0.0076 0.0055 0.0095 0.0108 0.0103in Paired Control Villages§
With Baseline Controls
Intervention Prevalence Ratio 0.888*** 0.966 1.002 0.770** 0.653***for Surgical Mask Villages [0.780,0.997] [0.833,1.099] [0.813,1.191] [0.593,0.948] [0.458, 0.849]
N Individuals 288,612 147,954 36,002 24,282 28,103N Villages 536 482 382 348 360
Standard errors are in parentheses.*** Significant at the 1 percent level. ** Significant at the 5 percent level. * Significant at the 10 percent level.All regressions also include an indicator for each control-intervention pair. The regressions “with baseline controls”include controls for baseline rates of mask-wearing and baseline symptom rates.Baseline Symptom Rate is defined as the rate of surveyed individuals in a village who report symptoms coincidingwith the WHO definition of a probable COVID-19 case. This is defined as any of the following:(a) fever and cough;(b) any three of the following (fever, cough, general weakness/fatigue, headache, muscle aches, sore throat, coryza[nasal congestion or runny nose], dyspnoea [shortness of breath or difficulty breathing], anorexia [loss ofappetite]/nausea/vomiting, diarrhoea, altered mental status;(c) anosmia [loss of smell] and ageusia [loss of taste].§We report the mean symptomatic seroprevalence at endline. This is not equivalent to the coefficient on the constantdue to the inclusion of the pair indicators as controls.The sample excludes 4 villages because of lack of government cooperation to perform the intervention. The analysisexcludes 11 villages and their village-pairs in the full sample because we did not observe them in the baseline periodprior to the intervention, and 1 village and its pair for lack of observational data throughout the intervention period.The analysis includes all people surveyed in the baseline household visits, excluding individuals that we did notcollect midline or endline symptoms for, symptomatic individuals that we did not collect blood from, and individualsthat we drew blood from but did not test their blood.
64
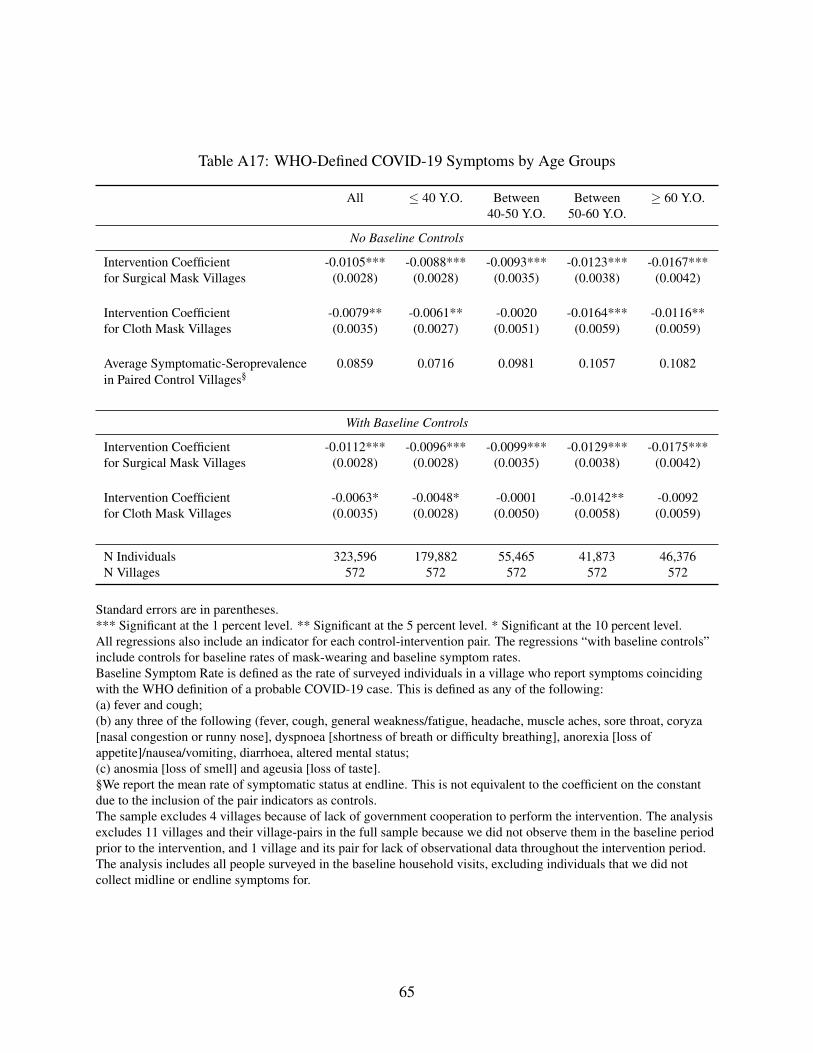
Table A17: WHO-Defined COVID-19 Symptoms by Age Groups
All ≤ 40 Y.O. Between40-50 Y.O.
Between50-60 Y.O.
≥ 60 Y.O.
No Baseline Controls
Intervention Coefficient -0.0105*** -0.0088*** -0.0093*** -0.0123*** -0.0167***for Surgical Mask Villages (0.0028) (0.0028) (0.0035) (0.0038) (0.0042)
Intervention Coefficient -0.0079** -0.0061** -0.0020 -0.0164*** -0.0116**for Cloth Mask Villages (0.0035) (0.0027) (0.0051) (0.0059) (0.0059)
Average Symptomatic-Seroprevalence 0.0859 0.0716 0.0981 0.1057 0.1082in Paired Control Villages§
With Baseline Controls
Intervention Coefficient -0.0112*** -0.0096*** -0.0099*** -0.0129*** -0.0175***for Surgical Mask Villages (0.0028) (0.0028) (0.0035) (0.0038) (0.0042)
Intervention Coefficient -0.0063* -0.0048* -0.0001 -0.0142** -0.0092for Cloth Mask Villages (0.0035) (0.0028) (0.0050) (0.0058) (0.0059)
N Individuals 323,596 179,882 55,465 41,873 46,376N Villages 572 572 572 572 572
Standard errors are in parentheses.*** Significant at the 1 percent level. ** Significant at the 5 percent level. * Significant at the 10 percent level.All regressions also include an indicator for each control-intervention pair. The regressions “with baseline controls”include controls for baseline rates of mask-wearing and baseline symptom rates.Baseline Symptom Rate is defined as the rate of surveyed individuals in a village who report symptoms coincidingwith the WHO definition of a probable COVID-19 case. This is defined as any of the following:(a) fever and cough;(b) any three of the following (fever, cough, general weakness/fatigue, headache, muscle aches, sore throat, coryza[nasal congestion or runny nose], dyspnoea [shortness of breath or difficulty breathing], anorexia [loss ofappetite]/nausea/vomiting, diarrhoea, altered mental status;(c) anosmia [loss of smell] and ageusia [loss of taste].§We report the mean rate of symptomatic status at endline. This is not equivalent to the coefficient on the constantdue to the inclusion of the pair indicators as controls.The sample excludes 4 villages because of lack of government cooperation to perform the intervention. The analysisexcludes 11 villages and their village-pairs in the full sample because we did not observe them in the baseline periodprior to the intervention, and 1 village and its pair for lack of observational data throughout the intervention period.The analysis includes all people surveyed in the baseline household visits, excluding individuals that we did notcollect midline or endline symptoms for.
65

Table A18: WHO-Defined COVID-19 Symptoms by 10-Year Age Groups
All 18-30 Y.O. 30-40 Y.O. 40-50 Y.O. 50-60 Y.O. 60-70 Y.O. ≥ 70 Y.O.
No Baseline Controls
Intervention Coefficient -0.0096*** -0.0081*** -0.0072*** -0.0068** -0.0137*** -0.0121*** -0.0189***(0.0022) (0.0020) (0.0027) (0.0029) (0.0032) (0.0037) (0.0045)
Avg Symptomatic Rate 0.0859 0.0605 0.0872 0.0981 0.1057 0.1080 0.1085in Paired Control Vill.§
With Baseline Controls
Intervention Coefficient -0.0095*** -0.0082*** -0.0072*** -0.0066** -0.0133*** -0.0119*** -0.0185***(0.0021) (0.0020) (0.0026) (0.0028) (0.0032) (0.0036) (0.0045)
N Individuals 323,596 105,778 74,104 55,465 41,873 29,721 16,655N Villages 572 572 572 572 572 572 572
Standard errors are in parentheses.*** Significant at the 1 percent level. ** Significant at the 5 percent level. * Significant at the 10 percent level.All regressions also include an indicator for each control-intervention pair. The regressions “with baseline controls”include controls for baseline rates of mask-wearing and baseline symptom rates.Baseline Symptom Rate is defined as the rate of surveyed individuals in a village who report symptoms coincidingwith the WHO definition of a probable COVID-19 case. This is defined as any of the following:(a) fever and cough;(b) any three of the following (fever, cough, general weakness/fatigue, headache, muscle aches, sore throat, coryza[nasal congestion or runny nose], dyspnoea [shortness of breath or difficulty breathing], anorexia [loss ofappetite]/nausea/vomiting, diarrhoea, altered mental status;(c) anosmia [loss of smell] and ageusia [loss of taste].§We report the mean rate of symptomatic status at endline. This is not equivalent to the coefficient on the constantdue to the inclusion of the pair indicators as controls.The sample excludes 4 villages because of lack of government cooperation to perform the intervention. The analysisexcludes 11 villages and their village-pairs in the full sample because we did not observe them in the baseline periodprior to the intervention, and 1 village and its pair for lack of observational data throughout the intervention period.The analysis includes all people surveyed in the baseline household visits, excluding individuals that we did notcollect midline or endline symptoms for.
66

Table A19: WHO-Defined COVID-19 Symptoms by Age Groups, Expressed in Prevalence Ratios
All ≤ 40 Y.O. Between 40-50Y.O.
Between 50-60Y.O.
≥ 60 Y.O.
No Baseline Controls
Intervention Coefficient 0.871*** 0.871*** 0.901*** 0.877*** 0.834***for Surgical Mask Villages [0.807,0.936] [0.794,0.948] [0.829,0.972] [0.803,0.951] [0.755,0.912]
Intervention Coefficient 0.901** 0.907** 0.979 0.828*** 0.884**for Cloth Mask Villages [0.816,0.986] [0.828,0.987] [0.873,1.084] [0.709,0.947] [0.770,0.998]
Average Symptomatic-Seroprevalence 0.0859 0.0716 0.0981 0.1057 0.1082in Paired Control Villages§
With Baseline Controls
Intervention Coefficient 0.864*** 0.861*** 0.896*** 0.868*** 0.828***for Surgical Mask Villages [0.801,0.926] [0.786,0.936] [0.826,0.965] [0.795,0.940] [0.753,0.904]
Intervention Coefficient 0.915** 0.916** 0.996 0.849** 0.903*for Cloth Mask Villages [0.831,0.999] [0.836,0.996] [0.893,1.099] [0.732,0.966] [0.790, 1.016]
N Individuals 323,596 179,882 55,465 41,759 46,245N Villages 572 572 572 570 570
Confidence Intervals are in brackets.*** Significant at the 1 percent level. ** Significant at the 5 percent level. * Significant at the 10 percent level.All regressions also include an indicator for each control-intervention pair. The regressions “with baseline controls”include controls for baseline rates of mask-wearing and baseline symptom rates.Baseline Symptom Rate is defined as the rate of surveyed individuals in a village who report symptoms coincidingwith the WHO definition of a probable COVID-19 case. This is defined as any of the following:(a) fever and cough;(b) any three of the following (fever, cough, general weakness/fatigue, headache, muscle aches, sore throat, coryza[nasal congestion or runny nose], dyspnoea [shortness of breath or difficulty breathing], anorexia [loss ofappetite]/nausea/vomiting, diarrhoea, altered mental status;(c) anosmia [loss of smell] and ageusia [loss of taste].§We report the mean rate of symptomatic status at endline. This is not equivalent to the coefficient on the constantdue to the inclusion of the pair indicators as controls.The sample excludes 4 villages because of lack of government cooperation to perform the intervention. The analysisexcludes 11 villages and their village-pairs in the full sample because we did not observe them in the baseline periodprior to the intervention, and 1 village and its pair for lack of observational data throughout the intervention period.The analysis includes all people surveyed in the baseline household visits, excluding individuals that we did notcollect midline or endline symptoms for.
67

B Pairwise Randomization Procedure
Villages were assigned to strata as follows:
1. We began with 1,000 villages in 1,000 separate unions to ensure sufficient geographic dis-
tance to prevent spillovers (Bangladesh is divided into 4,562 unions).
2. We collected these unions into “Units”, defined as the intersection of upazila x (above/below)
median population x case trajectory, where above/below median population was a 0-1 indi-
cator for whether the union had above-median population for that upazila and case trajectory
takes the values -1, 0, 1 depending on whether the cases per 1,000 are decreasing, flat or
increasing. We assessed cases per person using data provided to us from the Bangladeshi
government for the periods June 27th-July 10th and July 11th-July 24th, 2020.
3. If a unit contained an odd number of unions, we randomly dropped one union.
4. We then sort unions by “cases per person” based on the July 11th-July 24th data, and create
pairs of unions. We randomly kept 300 such pairs.
5. We randomly assigned one union in each pair to be the intervention union.
6. We then tested for balance with respect to cases, cases per population, and density.
7. Finally, we repeated this entire procedure 50 times, selecting the seed that minimized the
maximum of the absolute value of the t-stat of the balance tests with respect to case trajectory
and cases per person.
C Cross-Randomization Procedure
Villages were assigned to village-level cross-randomizations as follows:
1. We began with the 300 union-pairs (600 villages total) identified in the pairwise randomiza-
tion procedure, and limited to only the villages in the intervention group.
68

2. Using a random number generator, we ordered the villages, and assigned the first 1/3 of the
intervention villages to be distributed cloth masks and 2/3 to be distributed surgical masks.
3. Within the mask-type randomization, we randomly reordered the unions, then assigned the
first 1/2 of villages to hang signage on their door as a visual commitment to mask-wearing,
and 1/2 of villages to not have signage on their door.
4. Within the previous two randomizations, we randomly assigned 1/4 of villages to receive no
incentive, 1/4 to receive a monetary award, and 1/2 to receive a certificate incentive. If there
was an odd-number of villages within this randomization, then we broke the difference by
rounding the number of villages in the randomization to the nearest whole number.
5. In villages without signage, we randomly ordered the villages and assigned the first 2/3 to
receive texts encouraging mask-wearing, and the remaining 1/3 receive no such messages. If
the number of villages was not divisible by thirds, then we broke the difference by rounding
the number of villages to the nearest whole number.
Unions were assigned to household-level cross-randomizations using the following procedure.
Note that each village may have only one household-level randomization.
1. In villages with the signage randomization, we assigned 2/3 of villages to receive messages
emphasizing the self-protection benefits of masks, and the remaining 1/3 to receive altruistic
messages about the benefits of mask-wearing in addition to the self-protection messages. If
the number of villages was not divisible by thirds, we broke the difference by rounding to
the nearest whole number.
2. In villages with the signage randomization and no household-level altruism randomization
(and by definition, no village-level text message randomization), we assigned 1/4 of villages
to receive no household-level text-message randomization, 1/2 of villages to have 50% of
their households receive text-message reminders, and the remaining 1/4 of villages to have
100% of their households receive texts.
69

3. In villages without the signage randomization, we assigned 2/3 of villages to receive mes-
sages emphasizing the self-protection benefits of masks, and the remaining 1/3 to receive
messages emphasizing the altruistic reasons to wear masks in addition to the self-protection
messages.
4. In the villages without the signage randomization and no household-level altruism random-
ization, we asked households to make a verbal commitment to be a mask-wearing household.
D Statistical Analysis
This section describes details of our statistical analyses.
Mask-Wearing We created a data set with an observation for each village j. We defined proper
mask use as anyone wearing either a project mask or an alternative face-covering that covered their
mouth and nose. We considered two definitions of the proportion of observed individuals wearing
masks (p j). In our primary specification, we defined p j using all observed adults. In a secondary
specification, we considered adults observed only in locations where we there was not simultaneous
mask distribution. The purpose of this second specification was to investigate separately whether
the intervention increased mask-wearing in places where we did not have promoters on site.
Our goal was to estimate the impact of the intervention on the probability of mask-wearing, de-
fined as ψ1 = Ex[E(p j|Tj = 1,x j)−E(p j|Tj = 0,x j)] where Tj is an indicator for whether a village
was treated and x j is a vector of the village-level covariates, including the prevalence of baseline
mask-wearing in each village (constructed analogously to p j), baseline respiratory symptom rates,
and indicators for each pair of villages from our pairwise stratification method.
We estimated this equation at the village-level with an ordinary least squares regression, us-
ing analytic weights proportional to the number of observed individuals (the denominator of p j)
and heteroskedastic-robust standard errors. In this specification, the dependent variable is p j, the
independent variable of interest was Tj, and controls were included for the x j covariates.
70

Physical Distancing Using analogous methods, we estimated the impact of the intervention on
the probability that wearing a mask influenced physical distancing (being within one arm’s length
of any other person at the time of observation).
D.1 Estimating Effects of Village-level Cross-randomizations
We analyze all four village level cross-randomizations jointly via a linear regression:
E(p j|Tj,x j,Dk) = βTj +∑k
Dkδk + x jγ (1)
where Dk = 1 if the village has been assigned to the intervention group of the village-level cross-
randomization denoted by letter k, and 0 otherwise. This specification is otherwise identical to our
estimating equation for the impact of intervention on mask-wearing, with the addition of the Dk
terms.
D.2 Estimating Effects of Household-level Cross-randomizations
To evaluate the effect of household-level cross-randomizations, we constructed a regression with an
observation for each village where we ask whether masks of the color representing the treatment
were more commonplace than masks of the color representing the control. In each village, we
computed ∆ j, the difference in the fraction of individuals wearing treatment mask colors vs. control
mask colors. We alternated across villages which color corresponds to intervention, so we can
control directly for whether specific colors are more popular (denote these by d jc; d jc = 1 if treated
masks in village j are color c). We index the various household randomizations by m. Our estimate
for each household randomization will be α0m, given by:
E(∆ j|d jc) = α0m +∑c
αcd jc + surgical j (2)
71

α0m tells us how much more likely individuals are to wear masks of the treated color than masks
of the control color. surgical j is, as its name implies, a dummy for whether surgical masks were
distributed in village j. We estimate this equation at the village-level by ordinary least squares,
using analytic weights proportional to the number of observed individuals (the denominator of ∆ j)
and heteroskedasticity-robust standard errors.
E Additional Balance Tests
In the text, we show that we have balance at baseline with respect to our main outcome variables.
We also ran balance tests with respect to several other covariates and detected a few balance fail-
ures. While small in magnitude, we investigate these further in order to understand whether the
severity of the underlying problem.
Table S1 highlights these balance failures. Specifically, we find imbalances with respect to
household count, age and household size. On average, treatment villages have 16 more households,
beneficiaries in the treatment group are younger by 0.16 years, and treatment households have 0.02
more members. While small in magnitude, these imbalances are unlikely to have arisen by chance
given the size of our sample. Table S1 also reports balance with respect to household size assessed
in our initial scoping visit (before masks were distributed). In this case, we find that treatment and
control villages were exactly the same size.
We believe the imbalances with respect to age and household size likely arose households in the
treatment group were more likely to report teenagers as being over 18 in order to receive additional
masks. We believe the imbalance with respect to the number of households likely occurred for a
similar reason, with implementers in the treatment group including more “borderline” households
as part of the village in order to distribute masks to those households.
To check for these mechanisms, we drop from the sample individuals under 30 and villages
with over 350 households – the latter only very coarsely targets “extra” households that lie on
the border of villages. After imposing these restrictions, we find in Table S2 that the imbalances
72

Table S1: Additional Balance Tests (Individual-Level)
HouseholdCount (viaScoping)
HouseholdCount
ProportionFemale
Age AverageHousehold
Size
Summary Statistics
Intervention Rate 245 237 0.5127 38.7046 2.7565
Control Rate 241 220 0.5113 38.9145 2.7302
Balance Tests
Intervention Coefficient 3 16*** 0.0019* -0.1577** 0.0239***(3) (3) (0.0011) (0.0708) (0.0089)
N individuals 307,106 307,106 307,106 307,106 307,106N villages 572 572 572 572 572
F 106.49Joint-Test Prob > F 0.0000
Standard errors are in parentheses.*** Significant at the 1 percent level. ** Significant at the 5 percent level. * Significant at the 10 percent level.“Household count (via scoping)” was assessed in a scoping visit prior to the intervention.“Household count” was assessed in the baseline household visits of the intervention.The sample excludes 4 villages because of lack of government cooperation to perform the intervention. The analysisexcludes 11 villages and their village-pairs in the full sample because we did not observe them in the baseline periodprior to the intervention, and 1 village and its pair for lack of observational data throughout the intervention period.
with respect to age and household size disappear entirely (this also occurs with the age restriction
alone), and the imbalance with respect to household count shrinks by 25% but remains significant.
We have collected exact GPS coordinates for each household, and in future drafts, we will check
whether the household count imbalance disappears if we remove households most distant from the
village center. In Table S3, we repeat our primary specification in this restricted sample with better
balance and find that our results are qualitatively unchanged.
73

Table S2: Additional Balance Tests (Individual-Level, After Sample Selection)
HouseholdCount (viaScoping)
HouseholdCount
ProportionFemale
Age AverageHousehold
Size
Removing All People Below 30 & All Villages With More than 350 Households
Intervention Coefficient -0 12*** 0.0036*** 0.0305 0.0069(2) (3) (0.0014) (0.0661) (0.0052)
N individuals 175,646 175,646 175,646 175,646 175,646N villages 552 552 552 552 552
F 81.71Joint-Test Prob > F 0.000
Standard errors are in parentheses.*** Significant at the 1 percent level. ** Significant at the 5 percent level. * Significant at the 10 percent level.“Household count (via scoping)” was assessed in a scoping visit prior to the intervention.“Household count” was assessed in the baseline household visits of the intervention.The sample excludes 4 villages because of lack of government cooperation to perform the intervention. The analysisexcludes 11 villages and their village-pairs in the full sample because we did not observe them in the baseline periodprior to the intervention, and 1 village and its pair for lack of observational data throughout the intervention period.The sample excludes an additional 122,048 individuals up to the age of 30, and 20 villages that have more than 350households.
74

Table S3: Symptomatic Seroprevalence (With Controls and Additional Sample Selection)
Intervention Effect Intervention Effect byMask Type
Controlling for Number of Households and Sex
Intervention Coefficient -0.0006*(0.0003)
Intervention Coefficient -0.0008*for Surgical Mask Villages (0.0004)
Intervention Coefficient -0.0001for Cloth Mask Villages (0.0005)
Average Symptomatic Seroprevalence 0.0076 0.0076Rate in Paired Control Villages§
N individuals 307,106 307,106N villages 572 572
After Additional Sample Selection
Intervention Coefficient -0.0010**(0.0005)
Intervention Coefficient -0.0014**for Surgical Mask Villages (0.0006)
Intervention Coefficient -0.0001for Cloth Mask Villages (0.0008)
Average Symptomatic-Seroprevalence 0.0095 0.0095Rate in Paired Control Villages§
N individuals 175,646 175,646N villages 552 552
Standard errors are in parentheses.*** Significant at the 1 percent level. ** Significant at the 5 percent level. * Significant at the 10 percent level.All regressions include an indicator for each control-intervention pair.The regression in the top panel includes controls for baseline rates of mask wearing, baseline symptom rates, number of households in a village,and sex.The regression in the bottom panel controls for baseline rates of mask wearing and baseline symptom rates.Baseline Symptom Rate is defined as the rate of surveyed individuals in a village who report symptoms coinciding with the WHO definition of aprobable COVID-19 case. This is defined as any of the following:(a) fever and cough;(b) any three of the following (fever, cough, general weakness/fatigue, headache, muscle aches, sore throat, coryza [nasal congestion or runnynose], dyspnoea [shortness of breath or difficulty breathing], anorexia [loss of appetite]/nausea/vomiting, diarrhoea, altered mental status;(c) anosmia [loss of smell] and ageusia [loss of taste].§We report the mean symptomatic-seroprevalence at endline. This is not equivalent to the coefficient on the constant due to the inclusion of thepair indicators as controls.The sample excludes 4 villages because of lack of government cooperation to perform the intervention. The analysis excludes 11 villages and theirvillage-pairs in the full sample because we did not observe them in the baseline period prior to the intervention, and 1 village and its pair for lackof observational data throughout the intervention period.The analysis includes all people surveyed in the baseline household visits, excluding individuals that we did not collect midline or endlinesymptoms for, symptomatic individuals that we did not collect blood from, and individuals that we drew blood from but did not test their blood.The bottom panel runs sample excludes an additional 122,048 individuals up to the age of 30, and 20 villages that have more than 350 households.
75

F Impact of Masks on Symptoms, Seroprevalence, and Sero-
conversions
Our primary outcome measures symptomatic seroprevalence: this is the fraction of individuals
who are symptomatic during our intervention period and seropositive at endline. Some of these
individuals may have antibodies from infections occurring prior to our intervention. If so, the im-
pact of our intervention on symptomatic seroprevalence may understate the impact on symptomatic
seroconversions occurring during our intervention (i.e. the fraction of symptomatic infections pre-
vented by masks). In this section, we discuss the relationship between these two quantities.
Let SC, the symptomatic seroconversion rate, denote the probability that an individual is SARS-
CoV-2 antibody-positive during our intervention and symptomatic. Then the symptomatic sero-
prevalence is SS = SC+Pprior, where Pprior denotes the probability that an individual was infected
prior to our intervention and is symptomatic during our intervention for some non-COVID reason.
The change in seroconversions between the treatment and control group is given by ∆SC =
SC(1)− SC(0) where the notation SC(Ti) denotes the potential outcome of seroconversions as a
function of treatment status. Our goal is to estimate ∆SC/SC(0), the percentage change in sero-
conversions as a result of our intervention.
We observe ∆SS = ∆SC+∆Pprior. Additionally, we observe SS(0) = SC(0)+Pprior(0). Sup-
pose that masks prevent a fraction α of non-COVID symptoms. Then, Pprior(1) = (1−α)Pprior(0)
and ∆Pprior =−αPprior(0). Then we have:
∆SSSS(0)
=∆SC−αPprior(0)SC(0)+Pprior(0)
(3)
Rearranging (and substituting SC(0) = SS(0)−Pprior(0)), we obtain:
∆SCSC(0)
=∆SS
SS(0)+
Pprior(0)(α + ∆SSSS(0))
SS(0)−Pprior(0)(4)
Note that if we assume that symptomatic seroconversions fall by exactly the same fraction as
76

other symptomatic conditions, then we also have SC(1) = (1−α)SC(0), and solving equation 4
gives ∆SSSS(0) = −α = ∆SC
SC(0) . In other words, the percentage change in seroconversions equals the
percentage change in seroprevalence provided either that Pprior = 0 or if the intervention works
only by alleviating symptoms (and does so equally for COVID-19 and non-COVID diseases).
More generally, if the intervention both alleviates symptoms and reduces infections, then the
relative impact on symptomatic seroconversions and symptomatic seroprevalence will depend on
whether masks are more effective at preventing COVID-19 or other respiratory diseases (with a
larger proportional reduction in symptomatic seroconversions in the former case). The magnitude
of the difference between symptomatic seroconversions and symptomatic seropositives will depend
on the fraction of symptomatic seropositives which are pre-existing at baseline.
G Mechanisms
Our intervention combines multiple distinct elements: we provide people with free masks; we
provide information about why mask-wearing is important; we conduct mask promotion in the
form of monitors encouraging people to wear masks and stopping non-mask-wearing individuals
on roads and public places to remind them about the importance of masks; we partner with local
public officials to encourage mask-wearing at mosques and markets; and in some villages, we
provide a variety of reminders and commitment devices as well as incentives for village leaders.
In this section, we attempt to decompose which elements were most critical to increase mask
use. We first report results from several cross-randomizations, and then we report non-randomized
evidence based on changes over time as our intervention details changed between the rounds of
piloting, launch of the full project, and thereafter.
G.1 Village-level Cross-randomizations
Results from the same regression specification as our primary analysis, adding indicators for each
village-level cross-randomization are reported in Figure S1 and Table S4. None of the village-level
77
cross-randomizations had any statistically significant impact on mask-wearing behavior, beyond
our basic intervention package. These null effects are fairly precise (with standard errors ranging
from 2.6-3.5 percentage points). Text message reminders, incentives for village-leaders, or explicit
commitment signals explain little of the mask increase we document.
78

Figure S1: Village-Level Cross Randomizations
The figures corresponds to the regressions in S4, upper panel, among the full surveillance data.Villages were assigned to the treatment or control arms of one of the following four village-level randomizations:Texts: 0% or 100% of households in a village receive text reminders on the importance of mask-wearing;Incentives: Villages either received no incentive, a certificate, or a monetary reward for meeting a mask-wearingthreshold,Public Signage: All or none of the households in a village are asked to publicly declare they are a mask-wearinghouseholds;Mask Type: Villages receive either a cloth or surgical mask.For a more detailed description of the village-level cross randomizations, see Section 3.4.
79

G.2 Household-level Cross-randomizations
We analyzed the effects of household-specific randomized treatments (e.g., verbal commitments
or not) by regressing the probability of wearing a mask color corresponding to the treatment on
indicators for each household-level randomization, as well as controls for color and surgical masks
(recall that the mask-color corresponding to treatment varied across villages).
Results of the household-level cross-randomizations are reported in Figure S2 and Table S5.
The coefficients indicate the impact of each cross-randomization relative to the core intervention
(identified since some villages had no household randomization other than mask color). Once
again, we saw no significant effects of any of the household-level cross-randomizations: compared
to self-protection messaging alone, altruistic messaging had no greater impact on mask-wearing,
and twice-weekly text messages and a verbal commitment had no significant effects.
We did see an impact of mask color on mask adoption. In villages where surgical masks were
distributed, blue surgical masks were 2.7 percentage points more likely than green surgical masks
to be observed. In villages where cloth masks were distributed, purple masks were 2.2 percentage
points less likely than red masks to be observed.
80

Table S4: Village-Level Cross Randomizations
Coefficient Full No ActivePromotion
Mosques Markets OtherLocations
No Baseline Controls
Mask Type (Surgical) 0.027 0.027 0.063* 0.017 0.019(0.025) (0.025) (0.035) (0.026) (0.025)
Commitment w/ Signage –0.010 –0.007 –0.018 –0.008 –0.008(0.026) (0.026) (0.034) (0.027) (0.026)
Incentive TypeMonetary –0.023 –0.026 0.011 –0.035 –0.028
(0.034) (0.034) (0.045) (0.034) (0.035)Certificate 0.001 –0.002 0.019 0.003 –0.010
(0.031) (0.031) (0.039) (0.031) (0.032)100% Text –0.027 –0.023 –0.042 –0.024 –0.017
(0.026) (0.025) (0.033) (0.026) (0.026)
With Baseline Controls
Mask Type (Surgical) 0.029 0.029 0.063* 0.018 0.021(0.025) (0.025) (0.034) (0.026) (0.025)
Commitment w/ Signage –0.007 –0.003 –0.021 –0.004 –0.005(0.026) (0.025) (0.033) (0.026) (0.026)
Incentive TypeMonetary –0.021 –0.024 0.013 –0.031 –0.027
(0.033) (0.033) (0.043) (0.033) (0.035)Certificate 0.006 0.003 0.026 0.008 –0.006
(0.031) (0.030) (0.039) (0.030) (0.031)100% Text –0.026 –0.022 –0.037 –0.024 –0.017
(0.025) (0.025) (0.033) (0.026) (0.026)
N villages 286 286 285 285 284
Standard errors are in parentheses.*** Significant at the 1 percent level. ** Significant at the 5 percent level. * Significant at the 10 percent level.The baseline control regressions include controls for baseline rates of mask-wearing and baseline symptom rates.Baseline Symptom Rate is defined as the rate of surveyed individuals in a village who report symptoms coincidingwith the WHO definition of a probable COVID-19 case. This is defined as any of the following:(a) fever and cough;(b) any three of the following (fever, cough, general weakness/fatigue, headache, muscle aches, sore throat, coryza[nasal congestion or runny nose], dyspnoea [shortness of breath or difficulty breathing], anorexia [loss ofappetite]/nausea/vomiting, diarrhoea, altered mental status;(c) anosmia [loss of smell] and ageusia [loss of taste].We assume that (1) all reported symptoms were acute onset, (2) all people live or work in an area with high risk oftransmission of virus and (3) all people have been a contact of a probable or confirmed case of COVID-19 or arelinked to a COVID-19 cluster.”Other Locations” include the Tea Stall, at the entrance of the restaurant as patrons enter, and the main road to enterthe village.The sample excludes 4 villages because of lack of government cooperation to perform the intervention. The analysisexcludes a remaining 12 villages and their village-pairs in the full sample, 13 villages and their pairs in the mosqueand market sub-samples, and 14 villages and their pairs in the other location sub-sample because we did not observethem in the baseline period prior to the intervention.
81

Figure S2: Household-Level Cross Randomizations
The figure corresponds to the regression presented in Table S5.Villages were assigned to the treatment or control arms of one of the following four village-level randomizations:Texts: 0%, 50% of 100% of households in a village receieve text reminders on the importance of mask-wearing;Messaging: Households receive messaging emphasizing the altruistic or self-protective benefits of mask-wearing;Verbal Commitment: Households were asked to verbally commit to mask-wearing;Mask Colors: Surgical masks distributed to households were blue or green. Cloth masks distributed to householdswere purple or red.For a more detailed description of the household-level cross-randomizations, see Section 3.4.
82

G.3 Mask Promotion
As noted above, we ran two pilots prior to launching the full project. Both pilots were conducted
in Naogaon and Joypurhat districts, but in different unions. While the unions were not selected at
random, there was no systematic difference in the selection process between the two pilots. In both
cases, unions were selected based on convenience and proximity to existing Greenvoice personnel.
Both pilots included elements 1, 2, 3, and 5 enumerated in Section 3.3: masks were distributed
at households, markets, and mosques, and there was role-modeling and advocacy by local leaders,
including Imams. The second pilot added to these elements explicit mask promotion: mask pro-
moters patrolled public areas a few times a week and asked those not wearing masks to put on a
mask. The full intervention also included mask promotion.
The comparison between the two pilots is thus instructive about the impact of active mask
promotion. This comparison is shown in Table A11. The difference is striking. The first pilot
increased mask-use by 10.9 percentage points (insignificantly different from zero). The second
pilot, which included mask promotion, increased mask-use by 28.4 percentage points, comparable
to the 29.0 percentage points we see several months later in our full intervention. The presence of
mask promotion appears to be crucial for the success of our intervention.
83

Table S5: Household-Level Cross-Randomizations
Coefficient Full
Household-Level Text Randomization50% of Households in Village –0.032
(0.031)
100% of Households in Village –0.028(0.026)
Altruistic Messages –0.030(0.026)
Verbal Commitment –0.024(0.025)
Mask ColorBlue vs Green 0.027*
(0.016)
Purple vs Red –0.022**(0.011)
N villages 286
Standard errors are in parentheses.*** Significant at the 1 percent level. ** Significant at the 5 percent level. * Significant at the 10 percent level.The regression includes a control for the mask type to separate the effect of mask colors.Surgical masks distributed to households were blue or green. Cloth masks distributed to households were purple orred.The sample excludes 4 villages because of lack of government cooperation to perform the intervention. The analysisexcludes 11 villages because we did not observe them in the baseline period prior to the intervention, and 1 villagefor lack of observational data throughout the intervention period.
84

H Additional Preregistered Specifications
In this section, we discuss additional preregistered specifications not reported in the text. For
reference, our pre-analysis plan is available at: https://osf.io/vzdh6/.
Our pre-registration document suggests that we can compute the impact of our intervention
on seroconversions by comparing our effect size to the difference between endline and baseline
seropositives among individuals symptomatic during our intervention. As the analysis in Appendix
F makes clear, this is not quite correct. If Pprior, the fraction of symptomatic seropositives due
to infections prior to baseline, is zero, then the estimated impact on symptomatic seropositives
equals the impact on symptomatic seroconversions and no further adjustment is needed. More
generally, the impact on symptomatic seropositives incorporates both seroconversions, as well as
reductions in symptomatic seroconversions due to non-COVID respiratory diseases. We cannot
determine the impact on seroconversions without knowing both Pprior(0) and the relative impact
of masks on COVID-19 and non-COVID respiratory diseases. If the latter two quantities are equal
in proportion, the impact on symptomatic seropositives again equals the impact on symptomatic
seroconversions with no further adjustment needed.
Given that we find no evidence of an impact of any of the cross-randomizations, we did not
estimate the specification flexibly interacting them.
We did not proceed with the “individual intervention” described in the pre-registration docu-
ment because initial results suggested that we were able to entice only a small number of market
vendors to wear masks.
In Table S6, we report our pre-specified instrumental variable regressions. If we assume that
the entire impact of our intervention is via proper mask-wearing, then we estimate that going
from zero percent to one hundred percent of villagers wearing masks would reduce symptomatic
seroprevalence by -0.0024, a 32% reduction. Essentially, this specification scales our “intent-to-
treat” estimates by a factor of 3.33, the reciprocal of the first stage.
85

We have not yet run regressions with seroconversions as the outcome because we are still
completing testing of our baseline samples. We will report these regressions when we finish that
testing.
We did not collect the intended pharmacy data to use as an auxiliary outcome, and hospitaliza-
tion and mortality data was not available. We also do not yet have data on distance to nearby city
or estimated average village-wealth.
86

Table S6: IV Regressions
SymptomaticSeroprevalence
WHO-Defined COVID-19Symptoms
No Baseline Controls
Proper Mask-Wearing Coefficient -0.0024** -0.0336***(0.0012) (0.0076)
With Baseline Controls
Proper Mask-Wearing Coefficient -0.0024** -0.0334***(0.0012) (0.0075)
N Individuals 307,106 323,596N Villages 572 572
Standard errors are in parentheses.*** Significant at the 1 percent level. ** Significant at the 5 percent level. * Significant at the 10 percent level.All regressions also include an indicator for each control-intervention pair. The regressions “with baseline controls”include controls for baseline rates of mask-wearing and baseline symptom rates.Baseline Symptom Rate is defined as the rate of surveyed individuals in a village who report symptoms coincidingwith the WHO definition of a probable COVID-19 case. This is defined as any of the following:(a) fever and cough;(b) any three of the following (fever, cough, general weakness/fatigue, headache, muscle aches, sore throat, coryza[nasal congestion or runny nose], dyspnoea [shortness of breath or difficulty breathing], anorexia [loss ofappetite]/nausea/vomiting, diarrhoea, altered mental status;(c) anosmia [loss of smell] and ageusia [loss of taste].§We report the mean rate of symptomatic status at endline. This is not equivalent to the coefficient on the constantdue to the inclusion of the pair indicators as controls.The sample excludes 4 villages because of lack of government cooperation to perform the intervention. The analysisexcludes 11 villages and their village-pairs in the full sample because we did not observe them in the baseline periodprior to the intervention, and 1 village and its pair for lack of observational data throughout the intervention period.The analysis includes all people surveyed in the baseline household visits, excluding individuals that we did notcollect midline or endline symptoms for.Proper Mask-Wearing is defined as the village-level rate of individuals observed properly wearing mask during theintervention period. The instrument is the treatment status of the village.
87

I Intervention Cost and Benefit Estimates
The average person-day of staff time in our intervention cost $20 of wages plus $0.50 of communi-
cation costs. All management salaries, benefits, support, internal monitoring, and equipment costs
$71,696. We exclude these from the below calculation as they will vary from setting to setting. As
reported in the main text, we estimate that we induced 51,660 people to regularly wear masks, or
173 people per intervention village.
Costs per village The main fixed costs of the intervention (as opposed to costs that vary over
days):
• Masks for initial household distribution (3 masks per household), ($0.13 per surgical mask
and $0.50 per cloth masks), 68,775 cloth masks, and 136,770 surgical masks
• Staffing for initial household distribution (4 person-days per village)
• 1 person-day of training per village
• PPE for staff: $70 per village
• Media costs: $100 per village
• Other transportation and materials costs: $30 per village
This amounts to fixed costs of: $302.50 per village for non-mask materials, $347.35 worth of cloth
masks per village, and $89.35 of surgical masks per village. We estimate that we induced 598
x 29% = 173 people per village to wear masks, which amounts to fixed costs of $3.75 per adult
induced to wear a mask in cloth mask villages, and $2.26 per adult in surgical mask villages.
Costs per village-day of intervention The main costs paid per day of the intervention:
• 1,089,947 masks distributed through promotion over an average of 29 days per village. Of
these, there were 301,868 cloth masks distributed (105 cloth masks per day per village) and
788,079 surgical masks distributed (160 surgical masks per day per village).
88

• 14 person-days per week per village in week 1, 8 person-days per week per village in week
2, 6 person-days per village in weeks 3, 4 and 5, and 4 person-days per week per village
thereafter.
Over the first four weeks of our intervention, this amounts to mask supply costs of $52.57 per
village-day for cloth masks and $17.75 per village-day for surgical masks. The promotion costs
were $24 per village-day. Dividing by the number of people induced to wear masks per village
(173), we obtain costs of $0.44 per person-day in cloth mask villages and $0.24 per person-day in
surgical mask villages. Using these figures, we calculated that after subtracting surveillance costs,
our intervention cost $17.00 for each person induced to regularly wear a cloth mask and $9.49 for
each person to regularly wear a surgical mask.
Cost-effectiveness To determine the impact of the intervention using surgical masks in reduc-
ing mortality from COVID-19 in Bangladesh, we used estimates of current and projected deaths
from COVID-19, including excess deaths that occurred over the same time period (May 1, 2021-
September 1, 2021)[65]. The lower bound includes only COVID-19 reported deaths. The mid-
range estimates include 50% of excess deaths as being directly attributable to COVID-19. The
upper bound includes all excess deaths that occurred over the same time period as being directly
attributable to COVID-19. We projected the impact of the intervention using surgical masks on
deaths over four months following one month of intervention. We calculated the absolute risk re-
duction as the difference in death rate over the intervening period with and without the surgical
mask intervention. We applied a 35% reduction of deaths among those 60 and older and a 23%
reduction of deaths among those aged 50-60 based on the study findings and age-adjusted COVID-
19 mortality rates for Bangladesh [66]. We assumed no change in deaths for those under age 50.
We determined the number needed to treat by taking the inverse of the absolute risk reduction.
As shown in Table S7, for one month of the intervention, the number needed to treat to prevent
one death ranges from 6,682 to 35,001. Our estimates above suggest that the total cost of our
intervention per person induced to wear a mask for a month was: $3.75 + $0.44 x 30 = $17.00
89
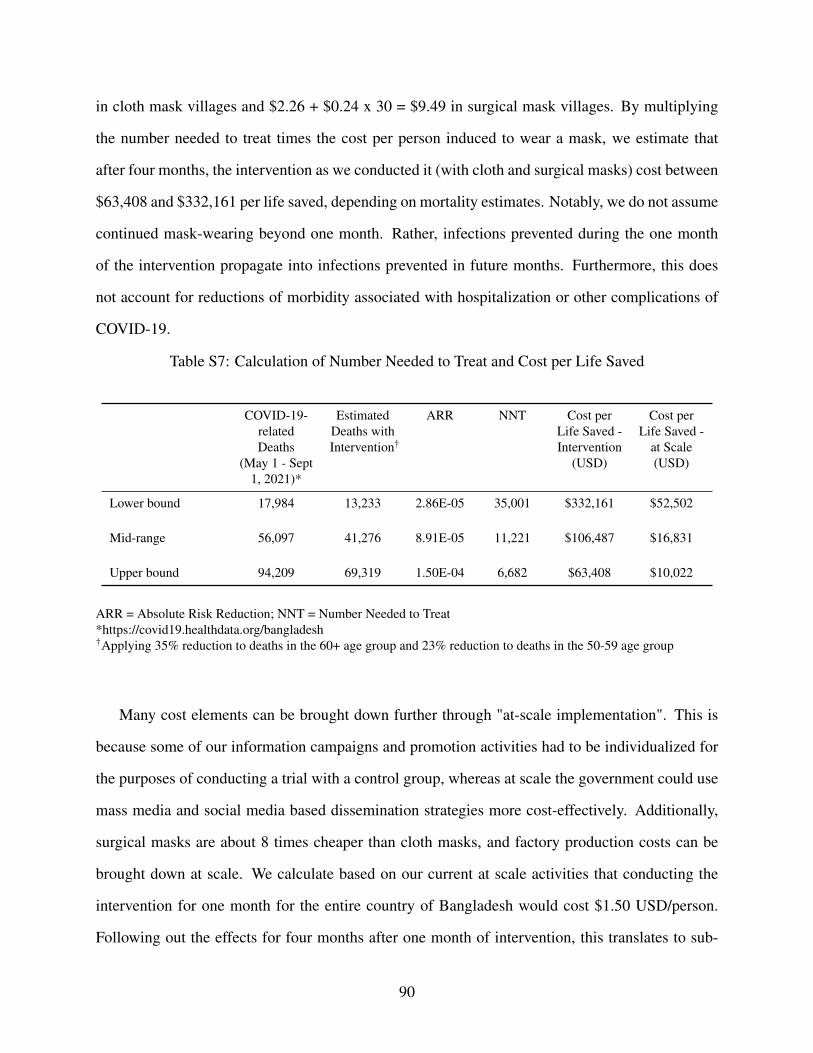
in cloth mask villages and $2.26 + $0.24 x 30 = $9.49 in surgical mask villages. By multiplying
the number needed to treat times the cost per person induced to wear a mask, we estimate that
after four months, the intervention as we conducted it (with cloth and surgical masks) cost between
$63,408 and $332,161 per life saved, depending on mortality estimates. Notably, we do not assume
continued mask-wearing beyond one month. Rather, infections prevented during the one month
of the intervention propagate into infections prevented in future months. Furthermore, this does
not account for reductions of morbidity associated with hospitalization or other complications of
COVID-19.
Table S7: Calculation of Number Needed to Treat and Cost per Life Saved
COVID-19-relatedDeaths
(May 1 - Sept1, 2021)*
EstimatedDeaths withIntervention†
ARR NNT Cost perLife Saved -Intervention
(USD)
Cost perLife Saved -
at Scale(USD)
Lower bound 17,984 13,233 2.86E-05 35,001 $332,161 $52,502
Mid-range 56,097 41,276 8.91E-05 11,221 $106,487 $16,831
Upper bound 94,209 69,319 1.50E-04 6,682 $63,408 $10,022
ARR = Absolute Risk Reduction; NNT = Number Needed to Treat*https://covid19.healthdata.org/bangladesh†Applying 35% reduction to deaths in the 60+ age group and 23% reduction to deaths in the 50-59 age group
Many cost elements can be brought down further through "at-scale implementation". This is
because some of our information campaigns and promotion activities had to be individualized for
the purposes of conducting a trial with a control group, whereas at scale the government could use
mass media and social media based dissemination strategies more cost-effectively. Additionally,
surgical masks are about 8 times cheaper than cloth masks, and factory production costs can be
brought down at scale. We calculate based on our current at scale activities that conducting the
intervention for one month for the entire country of Bangladesh would cost $1.50 USD/person.
Following out the effects for four months after one month of intervention, this translates to sub-
90

stantially lower costs per life saved: $10,022-$52,502 (Table S7).
For context, [63] estimate that the value of a statistical life is $205,000 in Bangladesh, implying
that our intervention at scale is 4-20 times more cost-effective than what the typical Bangladeshi
would be willing to pay to reduce mortality risk, and therefore a "very good buy" for policymakers.
This cost-effectiveness analysis was not pre-specified.
91

J Polling Policy Makers
Table S8: What do you think was the increase in mask-wearing as a result of household maskdistribution and mask promotion in the community?
WHO NCAER WorldBank
Frequency Percent
No change 0 1 3 4 3%Increased by 5 percentage points 5 10 8 23 20%Increased by 10 percentage points 4 12 8 24 21%Increased by 20 percentage points 4 19 9 32 28%Increased by 30 percentage points 4 7 11 22 19%Increased by 40 percentage points 2 6 3 11 9%
Total 19 55 42 116 100%
These are polls taken in response to the prompt: “We provided free masks to all households and promotedmask-wearing in mosques and markets with community leaders and imams. What do you think happened tomask-wearing relative to the 13% proper mask usage rate in the control villages without any interventions?”The results were collected from audience participants during live presentations to the World Health Organization(WHO), the National Council of Applied Economic Research (NCAER) in Delhi, and the World Bank.
92

Table S9: What do you think was the additional effect of mask promoters reminding people towear masks?
WHO NCAER WorldBank
Frequency Percent
No change 0 1 4 5 4%Increased by 5 percentage points 2 4 5 11 9%Increased by 10 percentage points 6 20 5 31 26%Increased by 20 percentage points 2 10 14 26 22%Increased by 30 percentage points 4 10 11 25 21%Increased by 40 percentage points 5 10 7 22 18%
Total 19 55 46 120 100%
These are polls taken in response to the prompt: “ In addition to the mask distribution and promotion activitiesdescribed previously, we had mask promoters periodically monitor passers-by and remind them to wear masks. Whatdo you think happened to mask-wearing relative to the 13% proper mask usage rate in the control villages withoutany interventions?”The results were collected from audience participants during live presentations to the World Health Organization(WHO), the National Council of Applied Economic Research (NCAER) in Delhi, and the World Bank.
Table S10: Do you think text message reminders to wear masks further increased mask-wearing?
WHO NCAER World Bank Frequency Percent
Yes 0 33 32 65 68%No 0 19 11 30 32%
Total 0 52 43 95 100%
These are polls taken in response to the prompt: “We sent text reminders to wear masks. Do you think this increasedmask-wearing further?”The results were collected from audience participants during live presentations to the World Health Organization(WHO), the National Council of Applied Economic Research (NCAER) in Delhi, and the World Bank.
93

Table S11: How do you think mask distribution and promotion affected physical distancing?
WHO NCAER WorldBank
Frequency Percent
Physical distancing decreased 5 0 8 13 22%Physical distancing was unchanged 9 0 16 25 42%Physical distancing increased 5 0 17 22 37%
Total 19 0 41 60 100%
These are polls taken in response to the prompt: “How did mask distribution and promotion affect individuals’physical distancing?”The results were collected from audience participants during live presentations to the World Health Organization(WHO), the National Council of Applied Economic Research (NCAER) in Delhi, and the World Bank.
Table S12: Do you think incentive payments to village leaders further increased mask-wearing?
WHO NCAER World Bank Frequency Percent
Yes 0 32 0 32 62%No 0 20 0 20 38%
Total 0 52 0 52 100%
These are polls taken in response to the prompt: “We promised the village and leaders an incentive payment if wesaw increases in mask-wearing. Do you think this increased mask-wearing further?”The results were collected from audience participants during live presentations to the World Health Organization(WHO), the National Council of Applied Economic Research (NCAER) in Delhi, and the World Bank.
Table S13: Do you think verbal commitments and signage to wearing masks further increasedmask-wearing?
WHO NCAER World Bank Frequency Percent
Yes 0 40 0 40 77%No 0 12 0 12 23%
Total 0 52 0 52 100%
These are polls taken in response to the prompt: “We had households verbally committing to wear masks and puttingup signs to display to others that they were a mask-wearing household. Do you think this increased mask-wearingfurther?”The results were collected from audience participants during live presentations to the World Health Organization(WHO), the National Council of Applied Economic Research (NCAER) in Delhi, and the World Bank.
94