The Impact of Colonialism on African Development:...
25
The Impact of Colonialism on African Development: Evidence from the Ethnographic Atlas Morgan Henderson Graduate Student [email protected] Warren C. Whatley Professor [email protected] Department of Economics University of Michigan Ann Arbor, Michigan 48109 This version: August 1, 2013 First Draft. Do not quote without permission. Abstract In this paper, we exploit the previously-unutilized timing of the date of observation in Murdock’s Ethnographic Atlas to document the marginal effects of colonial tenure on a variety of economic and political group characteristics. We find that an additional decade of colonial tenure leads to a 3% higher incidence of monogamy, and 4.6% higher incidence of absolutism. Additionally, colonial tenure appears to significantly affect inheritance patters. Effects of colonial tenure are heterogeneous by the identity of the colonizer.
Transcript of The Impact of Colonialism on African Development:...
The Impact of Colonialism on African Development: Evidence from the Ethnographic Atlas
Morgan Henderson Graduate Student
Warren C. Whatley Professor
Department of Economics University of Michigan
Ann Arbor, Michigan 48109
This version: August 1, 2013
First Draft. Do not quote without permission.
Abstract
In this paper, we exploit the previously-unutilized timing of the date of observation in Murdock’s Ethnographic Atlas to document the marginal effects of colonial tenure on a variety of economic and political group characteristics. We find that an additional decade of colonial tenure leads to a 3% higher incidence of monogamy, and 4.6% higher incidence of absolutism. Additionally, colonial tenure appears to significantly affect inheritance patters. Effects of colonial tenure are heterogeneous by the identity of the colonizer.
Section 1: Introduction There is a tendency in the contemporary history and development literature to consider George Murdock’s Ethnographic Atlas (1967) as a snapshot of “pre-colonial” Africa: the state of the continent as it was before the establishment of colonial governments. This is notable in recent work on the relationship between pre-colonial institutions and contemporary economic development (Michalopolous and Papaioannou 2012; Michalopolous and Papaioannou 2010; Englebert 2000; Gennaioli and Ranier 2007); factor endowment and institutional development (Fenske forthcoming); the effects of the trans-Atlantic slave trade on current levels of trust (Nunn and Wantchekon 2011); and the effects of the trans-Atlantic slave trade on ethnic institutions (Whatley 2012). We feel that this is problematic in several regards. First, the data as collected do not represent a snapshot: of the 530 observations for ethnic groups in Africa, the “approximate time level to which the ethnographic data pertains” ranges from 1830 to 1960 (Murdock 1967). It is neither panel, nor cross-sectional, but the trend has been to ignore this temporal heterogeneity despite the fact that it is possible that a group observed in, for example, 1870 will systematically differ in certain ways from a group observed in, for example, 1930. This heterogeneity, however is not a bug – it is a feature. In this paper, we exploit this temporal variation to assess the effect of tenure of colonial administration on the intensive margin of a variety of economic, social, and political group-level characteristics for ethnic groups in Africa in the early 20th century. We construct our measure of colonial tenure as the difference between the date of observation in the Ethnographic Atlas and the date of country-level systematic colonial administration. Using within-decade variation in colonial tenure, we find that groups with longer exposure to colonial administration tend to exhibit greater absolutism in selection of local leaders; greater levels of monogamy, and less of polygamy; more reliance on primogeniture as a mode of inheritance; and a higher incidence of patriliny, and less matriliny, in inheritance distribution of both land and moveable property. In particular, an additional decade of colonial tenure leads to a 3% increase in the incidence of monogamy, 4.6% increase in the incidence of absolutism, and an 11% increase in the rate of patriliny in property inheritance. We also find significant heterogeneity in these effects by identity of colonizer. Our results are robust to coding choices of “date of colonial occupation”, and while it is possible our results are subject to selection bias, the direction of the bias is not a priori unambiguous. We also present initial first-stage regressions for a potential instrumental variable for colonial tenure, but conclude that it, in its current incarnation, is not sufficiently relevant for use in this analysis. The Ethnographic Atlas data is an extremely valuable resource for researchers of turn-of-the-century Africa, with wide-ranging applications. It is our hope that this paper offers not only a new perspective on how the data can be used, but also contributes to the ongoing literature on the effects of colonialism in Africa. Section 2 presents background on the Ethnographic Atlas. Section 3 elaborates on data construction and presents OLS
results. Section 4 discusses robustness checks and potential endogeneity. Section 5 concludes. Section 2 – EA and Murdock Map The Ethnographic Atlas was initially published in Ethnology in 29 installments, from January, 1962 to July, 1980 by George P. Murdock. Its intention, at the outset, was comprehensive: “The editors of this journal feel that ethnological science has long stood in need of some coordinated means by which the vast accumulation of ethnographic knowledge can be... classified.” The first issue introduced variables relating to social organization for 100 societies “representing a fairly even distribution throughout the world”, and each subsequent issue added both variables and groups, culminating in a summary volume in 1967 listing over 60 variables – ranging from “Marital Residence” to “Jurisdictional Hierarchy” to “Ground Plan of Dwelling” - for 862 societies. Issues after this summary increased the number of societies to 1267, and the complete Ethnographic Atlas was digitized and published in 1999 by J. Patrick Gray. The Ethnographic Atlas covers all continents (except Antarctica), but is, by Murdock’s own admission, more complete for some areas than others. Murdock surveyed “practically the entire ethnographic literature” for Africa, North America, and South America, and claimed “comparable completeness” for North Africa, as well. Murdock admitted that his coverage of Europe was especially weak – “the author acknowledges no special competence in this area” – but claimed confidence in his coverage of Africa: “the author has reason to believe that a completely exhaustive survey of the literature would reveal... in Africa a few new societies but probably no additional clusters.” (Murdock 1967) Murdock used both primary sources –ethnographic and anthropological studies based on direct fieldwork – and secondary sources, which were themselves based on “the archives of missionary societies, as well as field notes and special communications by anthropologists and others.” (Forde v) Murdock intended for his atlas to be the basis for the use of statistical analysis in ethnographic studies; specifically, he envisaged researchers drawing random samples from each of the 412 world clusters in order to perform cross-cultural studies in which “probability statistics” are employed “to validate discovered associations.” Economists have tended to use the data, since its publication in electronic form in 1999, more as a turn-of-the-century census of Africa than a source of cross-country samples. As a cross-section, the data of the Ethnographic Atlas is revealing. Most societies relied very little on gathering, hunting, or fishing, and instead used animal husbandry and agriculture as sources of subsistence: the average groups relied on animal husbandry for about 30%, and agriculture for 60%, of their food needs. The average group practiced fairly low-intensity agriculture (“extensive or shifting… new fields cleared annually”), and the “mean size of local communities” for the average group was approximately 400. Groups were, for the most part, organized into petty chiefdoms rather than large states (notable exceptions being Bubi, Kafa, Moroccans, and Tunisians), and, within the local
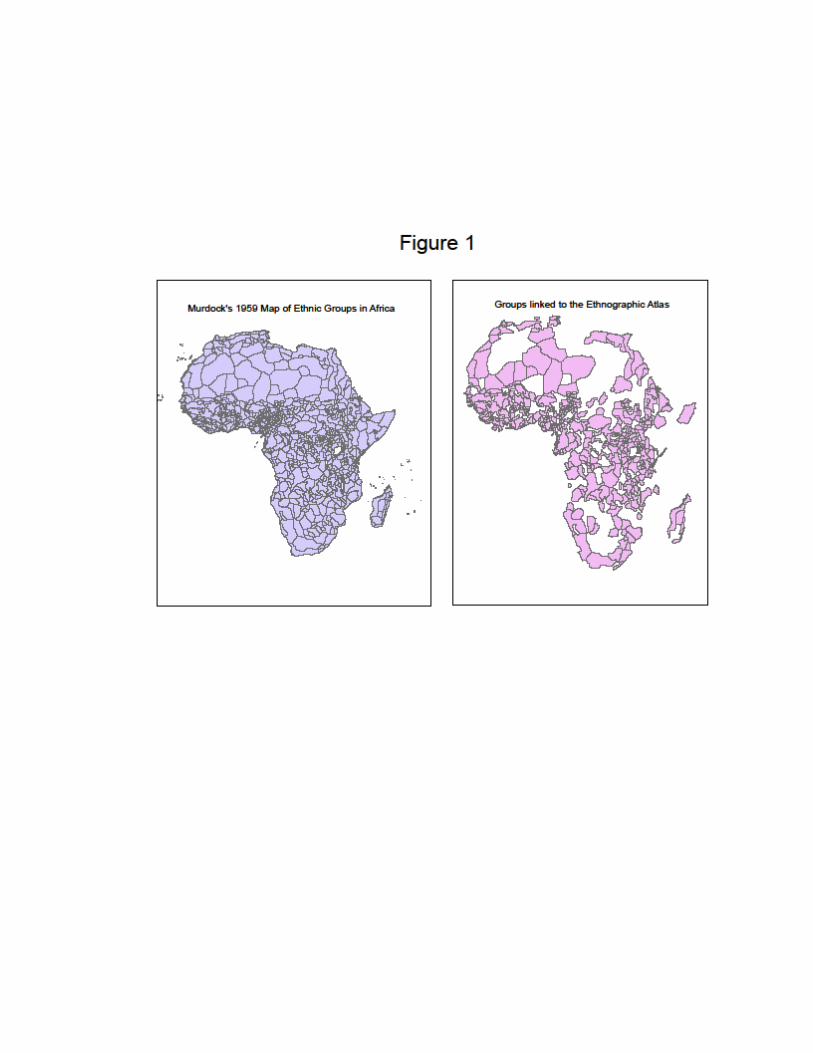
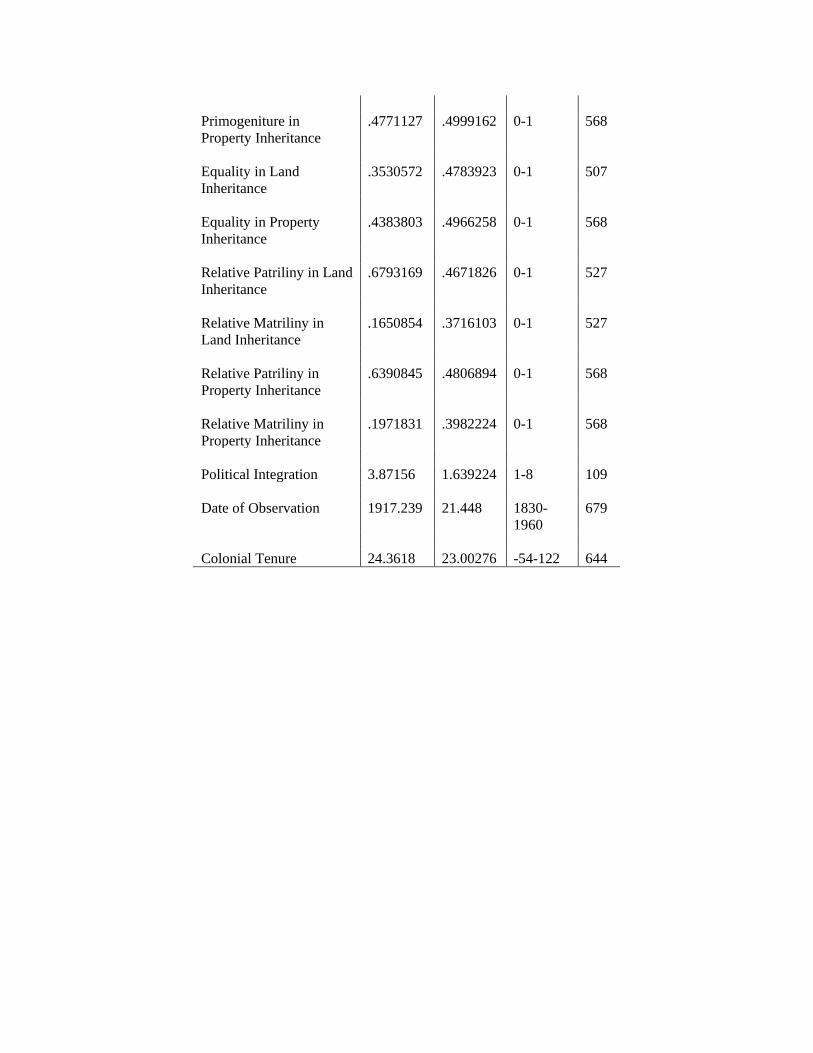
community, there were generally three levels of jurisdictional hierarchy: nuclear family, extended family, and clan-barrio (Murdock 1962). Class stratifications existed and were fairly well developed, with wealth distinctions for the average group, although this is subject to wide variability. Polygamy was far more prevalent than monogamy, and this remains true when the coding used a different underlying variable (results not included). Slavery was present in approximately 84% of groups, but, curiously, it had also been formerly present and subsequently abolished in 48% of our sample. Succession to the office of local headman was far more determined by an “absolutist” process rather than “liberal” or “democratic”, and primogeniture in both land and property inheritance was more prevalent than equality of inheritance distribution, although not by a wide margin. Approximately 65% of the groups disbursed inheritable goods to patrilineal heirs, and 15% to matrilineal heirs. The average group was observed in 1917, with 24 years of colonial tenure. When restricted to only groups with non-negative colonial tenure, average tenure is 30 years. See appendix 1 for a full data description, and appendix 2 for a description of the variables used in this paper. However, the EA is not a cross-section. It very distinctly contains variation across time, and we exploit that variation in this analysis. In order to have approximate locations for the EA data, we follow the convention and link the EA to the “Murdock Map”, a 1959 map, also by George Murdock, portraying the geographic boundaries of traditional ethnic homelands (Murdock 1959). Of the 530 observations listed for Africa in the original Ethnographic Atlas, our dataset contains observations for 441 linked groups, and 684 group-countries across 48 modern-day states. Some variables in the EA are more complete than others – ranging from no missing observations, to almost 2/3 missing – and we restrict our analysis to the more-complete variables. See Figure 1 for a map of the complete Murdock Map, as well as a map of the groups that are linked to the Ethnographic Atlas. Section 3 – Data and OLS estimates
A. Trends in date of observation
As a baseline, we begin by running the following specification on the entire sample of country-groups: Yi,c,r = B0 + B1*h(Ti,c,r) + ѲXi,c,r + nc + gr + ui,c,r (1) Where yi,c,r is characteristic of group i in colonizer c in region r, as recorded in the Ethnographic Atlas (EA); h(Ti,c,r) is a quadratic in the date of observation of group i, as recorded in the EA; and Xi,c,r is a vector of geographic controls for group i. The non-linear specification is intended to allow for non-linearities in the effect of “date of observation”: e.g., the effects of changes in colonial policy, or reactions to exogenous events such as World War I. Given that our outcomes are a range of economic, social, and political group characteristics, we attempt to control for factors which might both influence date of observation, and development of those group characteristics. Our
primary motivation for these controls is to proxy for ease of inter-group trade: the degree of contact with outsiders via trade very plausibly influenced the development of group characteristics, and also directly maps into ease of observation for ethnographers (a group that is used to dealing with outsiders, and which is physically reachable, would be both a prime trading partner and an easy candidate for observation). Therefore, this vector is comprised of the distance from the centroid of group i to the coastline; the distance from the centroid of group i to the nearest major river; a dummy indicating that the group is located within 50 kilometers of the coastline; measures of ethnic density within 50 and 100 kilometer radii of the centroid of group i1; mean elevation in group i; a measure of water area in group i; and an index of malaria suitability in group i.2 We control for region fixed effects in order to account for potential differences due to fixed, large-scale variation such as climate, and colonizer fixed effects in order to allow for differing selection into colonization. The need for colonizer fixed effects is non-trivial. It is well-documented that the European powers had differing agendas for their colonial conquests in Africa – a north-south route, and the deterrence of the slave trade, for the UK; new markets for the French; political clout for the Germans – and, to the extent that these agendas influences territory choice, which in turn influenced group societal characteristics, we need to use intra-colonizer variation for our estimates (Sanderson 1985). In order to account for possible spatial correlation in the dependent variable – i.e., how knowing Yi,c,r imparts some information about the value of neighbor Yj,c,r, and so each observation does not contain as much information as if they were completely independent – and the repeated observations, we follow Michalopolous and Papaionnou (2012) and use Cameron, Gelbach, and Miller (2011) standard errors, and double-cluster at the country-level and the ethnic language-family level. There are three possible methods for encoding the colonizer variables: colonizer at time of colonization; colonizer at time of observation; and major colonizer (that is, the colonizer with the longer occupation of group i). The three are not equivalent because of the re-assignment of colonial possessions following World War I. In 1919, the League of Nations issued a mandate stripping Germany of its colonial possessions, and transferring their ownership to other European countries. In particular, Germany was divested of Burundi (Belgium), Cameroon (UK and France, mostly France), Rwanda (Belgium), Tanzania (UK), and Togo (UK and France, roughly equal portions), Namibia (South Africa, and, by connection, UK). We follow the lead of Bertocchi and Canova (2002) and assign as colonizer the country with the longer colonial tenure: for example, the Luguru of Tanzania were observed in 1930, and Tanzania began its existence as German East Africa in 1885, and ended in 1919; therefore, the Luguru received 34 years of German
1 We use all groups from the entire “Murdock Map” for our measures of ethnic density, not just the linked groups 2 Thanks to Stelios Michalopolous and Elias Papaioannou for use of their data. https://sites.google.com/site/steliosecon/research
colonial rule “treatment”, and 11 years of British colonial rule “treatment:” - therefore, we code it as German.3 See table 1 for results of specification 1. There does, indeed, appear to be systematic variation in certain group characteristics according to the date of observation. In particular, later groups were less reliant on hunting and animal husbandry for subsistence and more reliant on agriculture, which are all consistent with a modernizing economy. There also appears to have been group-level institutional changes: note that “Jurisdictional Hierarchy of Local Community” is systematically higher for groups that were observed later, and that there is a significantly higher incidence of abolition of slavery for later groups.4,5 There is evidence of significant changes in the modes of intergenerational transmission of both land and property (less incidence of primogeniture, more incidence of equality in inheritance), and, finally, although the variable is very incomplete for the sample, we report that groups observed later demonstrated significantly lower levels of political integration than those observed earlier. There does not appear to be much evidence of temporal non-linearities in these variables. We also report standardized coefficients, to facilitate interpretation. Since the Ethnographic Atlas codes variables according to different scales (some are 0-9; some 0-5; some 0-3; some 0-1), direct comparisons of coefficients are not especially informative. Standardized coefficients, however, have the advantage of being interpretable as a change in the standard deviations of the dependent variable given a one standard deviation increase in the date of observation. The primogeniture in inheritance variables appear to be experiencing the most rapid change.
B. Trends in colonial tenure While the previous estimates reveal systematic variation in economic and political characteristics of groups by date of observation, they do not necessarily reveal much about the effects of colonial tenure. Common knowledge has it that the colonization was a “scramble” with, as of the late 1870s much of Africa being “still mysterious”, and then, as of the Berlin Conference of 1885, the continent divided and parceled according to nearly-current country borders (Pakenham 1991). In reality, part of Africa had had European contact and colonization for hundreds of year, and other parts still functioned, largely untouched by European influence, well into the 20th century (Hargreaves 1985). Thus, “date of observation” does not correlate one-for-one with colonial tenure (as it would if, for example, there was a uniform date of colonization for all countries).
3 Results are largely invariant to which set of colonizer dummies is used: initial, colonizer at observation, or major 4 Jurisdictional Hierarchy at the Local Level is defined as group organization in which there is “original and definitive jurisdiction over some sphere of social life in which the organization has the legitimate right to make decisions having a significant effect on its members.” (Murdock 1962) 5 We interpret “former presence of slavery” as representative of the rate of abolition of slavery: a “1” indicates a change in the status of slavery as a social institution; a “0” indicates no change
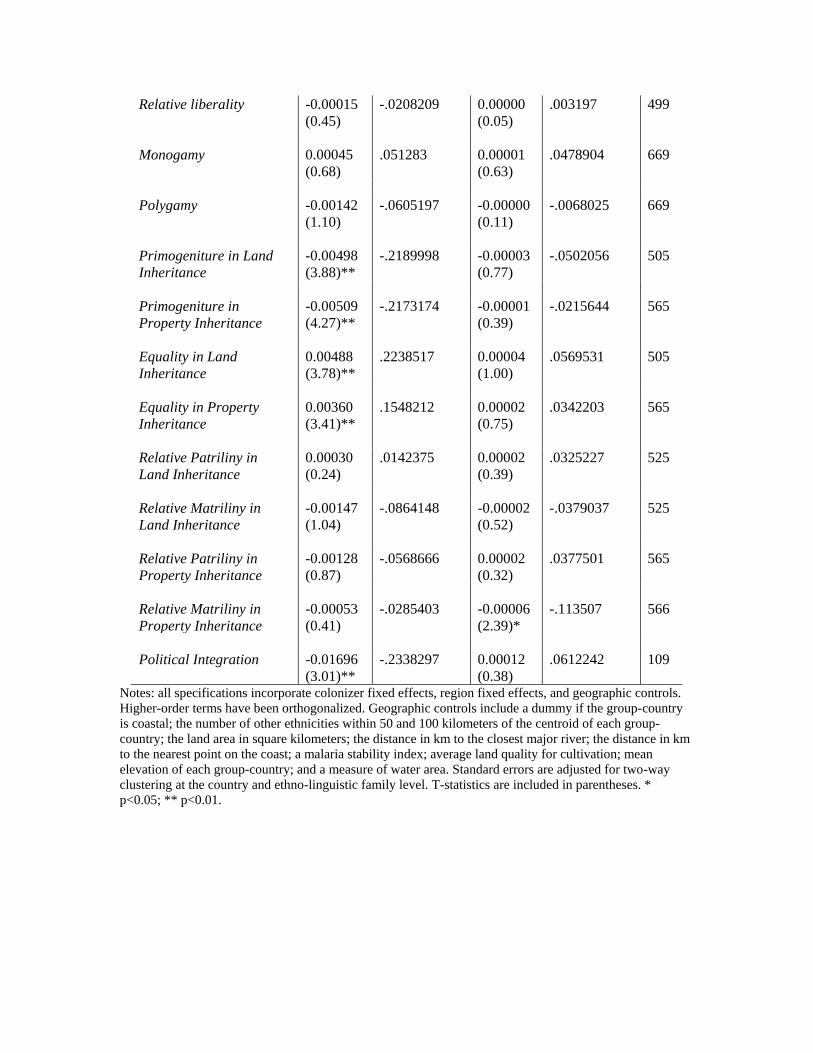
Coding the timing of colonial acquisitions is not a straight-forward exercise. Consider, for example, Nigeria: when was it colonized by the British? The Oil Rivers Protectorate was formed in Southern Nigeria in 1884, renamed the Niger Coast Protectorate in 1893, and then merged in 1900 with territory purchased from the Royal Niger Company to form the Southern Nigeria Protectorate. Southern Nigeria was merged with the existing Northern Nigeria Protectorate (established in 1900) in 1914 to form the Colony and Protectorate of Nigeria. The modern boundaries of Nigeria were established in 1960 when Northern Cameroons, which had initially been a part of German Kamerun, but which had been ceded to Great Britain in 1919 by a League of Nations Mandate following World War 1, was incorporated into colonial Nigeria. The question is, then, ought Nigeria be counted as established in 1884, 1900, or 1914, or 1919? Perhaps, when Lagos was incorporated into the Southern Nigeria Protectorate, in 1906? The answer is that the coding ought to depend on the meaning of the desired parameter. Given the results of Acemoglu et al (2001) and La Porta et al (1997, 2008), it seems reasonable that the salient time period is the duration of systematic colonization, with the concurrent importing of laws, institutions, and customs from the “mother” countries. To that end, we seek the marginal effect of systematic colonial administration of the land, rather than something like an “outside contact” effect. We therefore use as estimates of “colonial occupation”, the dates that the area was officially recognized by other nations as the legitimate colony or protectorate of some European colonial power. To continue the Nigeria example, since both the Southern and Northern protectorates were created in 1900, and formed, together, the vast majority of the eventual country, we code the official occupation of Nigeria as 1900. Dates and locations are from Packenham (1991) and the Cambridge History of Africa, Vol. 6 (1985). We explore sensitivity to coding choices and measurement error in section 4. Using, our measure of “colonial tenure” instead of “date of observation”, we re-run specification (1), but now restricting the sample only to those groups observed after the imposition of colonial administration (omitting, also, groups in Liberia and Ethiopia, which were not officially colonized by European countries). See column 1 of table 2 for results. The sign pattern is similar to that from table 1: groups that experienced greater colonial tenure relied less on fishing and animal husbandry as modes of subsistence, saw a higher incidences of abolition of slavery, and again, saw increased equality, and reduced primogenitures, in inheritance patterns. Interesting non-linearities emerge, as well, implying a later increase in reliance on animal husbandry, as well as an eventual slowing of the incidence of abolition of slavery. Note that standardized coefficients are reported in table 2 to facilitate cross-outcome comparisons, so inference of “turning points” are not possible given the results we present.6 We hesitate to label these “colonial effects”, however, because they are not distinguished from large-scale time trends: after all, as colonial tenure increases, time also passes. It is 6 However, using the original estimates we calculate an inflection point for abolition of slavery at 22 years of tenure; for primogeniture in property inheritance at 16.8 years; and for equality in land inheritance at 18.1 years.
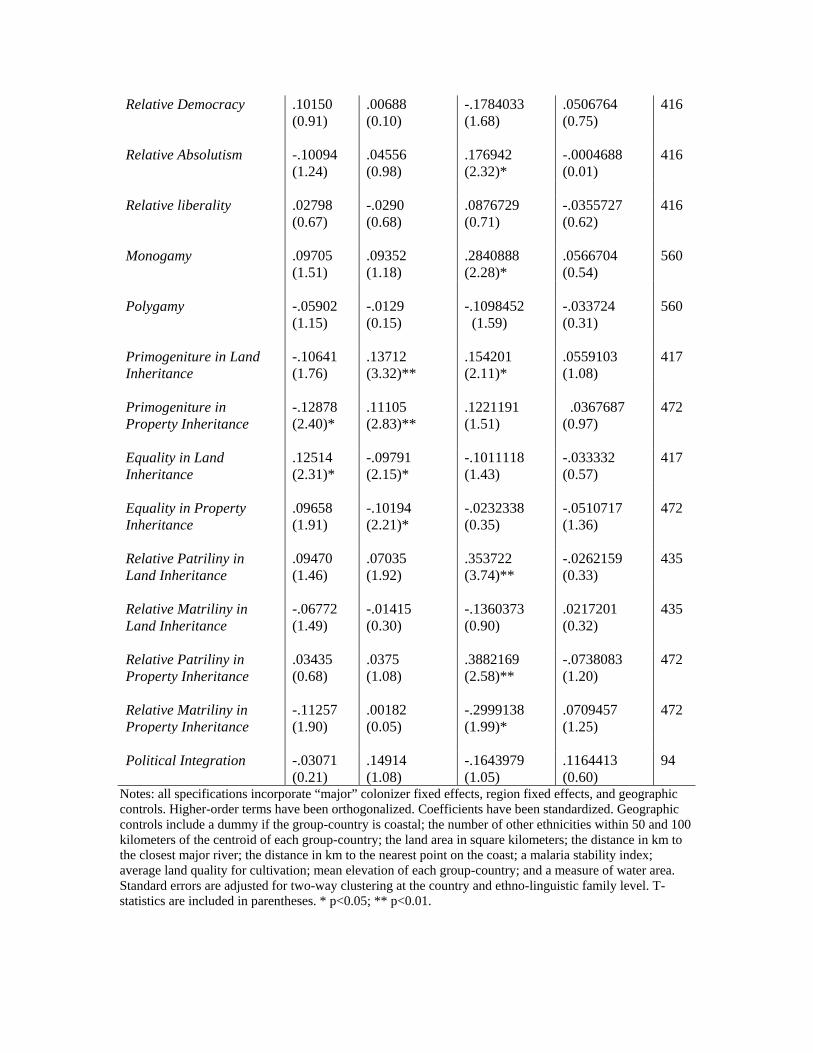
possible that, concurrent with colonial tenure growing, group characteristics might have changed for exogenous reasons: for example, more developed markets; cheaper market goods; or improved agricultural technologies. In order to differentiate from these macro trends, we augment specification (1) by including decade indicators, by date of observation. By allowing the levels of the outcome variables to change over time, we can estimate the effect of colonial tenure keeping decade constant, and these are our preferred estimates for the effect of an additional year of colonial tenure. These results are in column 2 of table 2. The results are surprising. We find a continued shift away from animal husbandry and fishing as modes of subsistence, as before, but now some evidence for an aggregate reduction in class stratification for groups with greater levels of colonial tenure. We find strong evidence for an increase in the incidence of “relative absolutism” with colonial tenure, as well as some evidence for a reduction in “relative democracy”. There is also strong evidence of incidence of monogamy increasing with tenure, as well as some evidence of a shift toward primogeniture, and away from equality, in inheritance patterns. Additionally, we document patrilineal inheritance increasing, and matrilineal inheritance decreasing, in colonial tenure. Notable, also, is the absence of significant increases in abolition of slavery – if anything, greater colonial tenure was associated with less abolition. Note that these are not the “effects of colonialism”, but rather, the effects of one more year of systematic colonial tenure, conditional on having been colonized. Given that the Ethnographic Atlas uses varying ordinal measures for its variables, the magnitudes of the standardized regression coefficients are generally interpretable only in comparison with one another. However, for binary outcome variables, we can interpret the original, non-standardized regression coefficients (not reported for ease of reading) as marginal probabilities. The non-standardized effect of tenure on on “monogamy” is .003: therefore, ten more years of colonial tenure induces 3% more monogamy. An additional decade of colonial tenure increases the rate of absolutism by 4.6%, and the incidence of patriliny in property inheritance by nearly 11%. The immediate question is – what is causing these significantly different results? The coefficients on the decade dummies tell the story. The level of “relative absolutism” has a negative trend over the decades, thus obscuring, in the raw data, the upward trend with colonial tenure. For “monogamy”, there appears to have been a general upward trend in levels, over the decades, that obscured the sharper within-decade colonial tenure effect; for “Patriliny in Property Inheritance”, the coefficient pattern on decade dummies shows a strong negative trend over time, which served to obscure the positive tenure effect. Given the prevalence of polygamy as documented in the EA, it seems possible that the influence of Christian missionaries might have been driving the overall upward trend in incidence of monogamy. Moreover, it also seems conceivable that something like the lingering effects of the slave trade drove the decline of patriliny and increase in matriliny (if the reduction in prime-aged men because of the slave trade caused a general early shift to matrilineal succession), and then perhaps the imposition of Western values via
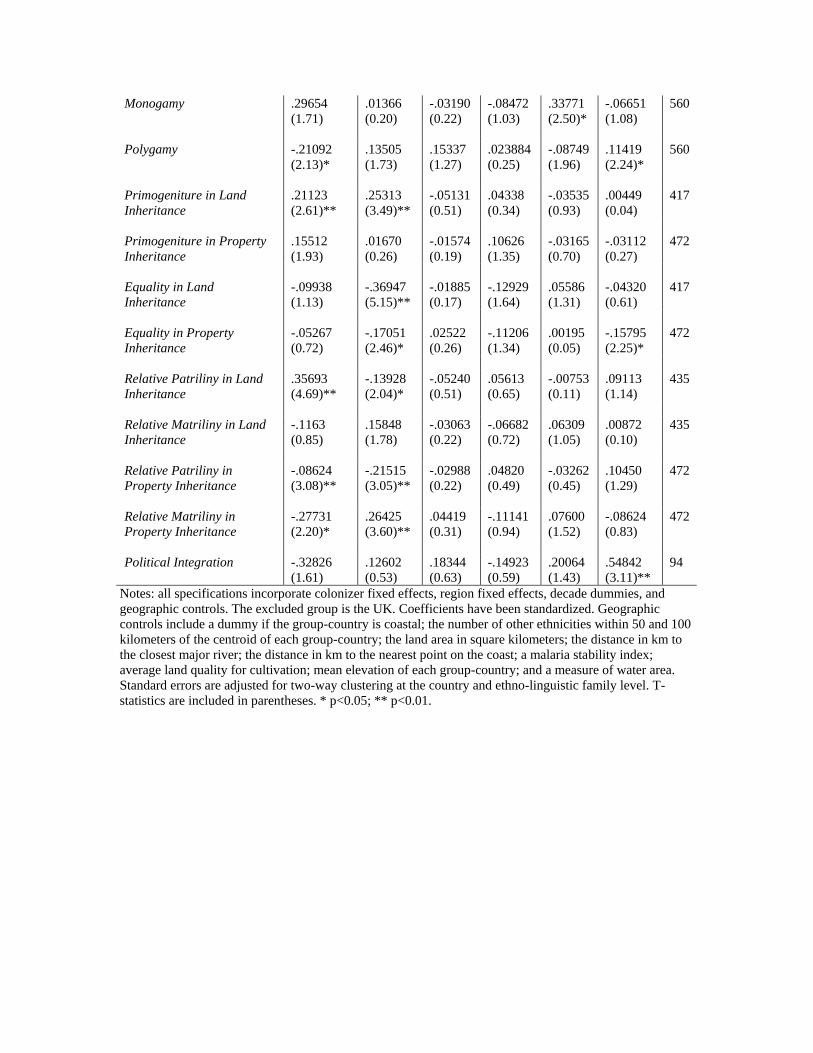
colonialism caused the shift back, within-decade, to patriliny. However, this is purely speculation, and investigation of these hypotheses is beyond the scope of this work. 7 We further augment our specification by allowing the effects of tenure to vary across colonizers (but restrict the effects to be linear, for ease of reporting; results do not significantly change when higher-order terms are included). We report these in table 3. We exclude as a group the UK, so all the coefficient on “tenure” applies to British colonies, and the coefficients on the other country-tenure coefficients should all be interpreted relative to the British. Several interesting results emerge. First is the general salience of colonizer identity: for eighteen of the twenty-eight group characteristics in our study, we can reject the hypothesis at the 5% level that all tenure coefficients are equal to zero (and for eleven at the 1% level).8 Furthermore, there is significant heterogeneity in the colonial tenure trends: the aggregate increase in the incidence absolutism seems to be driven by Portuguese colonies, whereas the increase in monogamy seems to be been driven primarily by British and Italian colonies. British colonies experienced a reduction in polygamy, as well as a reduction in the incidence of slavery being present. Belgian and British colonies experienced significant shifts in the mode of inheritance – British colonies tending toward more primogeniture and patriliny, and Belgian colonies experiencing more primogeniture and matriliny. French group characteristics seem almost uniquely unaffected by the duration of colonial tenure. German groups alone experienced a significant increase of “Jurisdictional Hierarchy at the Local Level”. Section 4 –Potential Endogeneity Issues
A. Selection into the Ethnographic Atlas The Ethnographic Atlas, as linked to the Murdock Map, is only 59% complete (that is, the groups for which we have data cover only 59% of the land mass of Africa). This is an overstatement of its incompleteness – a sizable portion of those “missing” groups are in the Sahara, where there is little, or no, habitation – but the fact remains that there could have been selection into the Ethnographic Atlas that might bias the effects of colonial tenure. While we control for many of the factors that determine physical access to group i, it is certainly possible that there are unobserved group characteristics that influence the probability of observation, and that would also influence the development of the characteristics we measure: for example, barbarism or hostility toward outsiders. There is some cause for concern; however, we believe that this could results in both an upward and downward bias, with no a priori reason to believe either direction dominates.
7 We omit the coefficients on the decade dummies for brevity’s sake. They are available upon request. 8 Variables for which this is not true at the 5% level are “Matriliny in Land Inheritance”, “Primogeniture in Property Inheritance”, “Liberal”, “Former presence of slavery”, “Animals and Plow Cultivation”, “Jurisdictional Hierarchy Beyond the Local Level”, “Mean size of Local Settlements”, “Intensity of Agriculture”, “Reliance on Agriculture”, and “Reliance on Gathering”
Suppose that group i is not observed by the anthropologists, ethnographers, and missionaries whose reports comprise the primary sources for the Ethnographic Atlas because of that group’s hostility toward outsiders. Assuming that that hostility deters, at least in part, the extent of colonial activity in that group’s territory, then, the true measure of the impact of colonial tenure for that group, ti*, would be close to zero, and so its exclusion from the EA results in aggregate estimates of colonial tenure that are an upper bound to the true effects of colonial tenure. However, if that hostile group i is eventually observed, but its hostility causes it to be observed later than it otherwise would have, then it will have an artificially long “colonial tenure” but, still assuming that its hostility deters colonial intervention, a low true effect of colonial tenure. The group’s inclusion, then, would add long tenure and minimal colonial impact to the data, biasing estimates toward zero. Even though the selection biases might cancel each other out, we created a potential instrumental variable intended to capture a portion of the variation in the probability of being observed that is orthogonal to the determinants of group characteristics: the distance from the centroid of group i to the closest colonial headquarters of the colonizing country. For example: the Luimbe of Angola were observed in 1930. At that time, Angola was a Portuguese colony, and the capitals of the various Portuguese colonies in Africa at the time were Maputo, Luanda, and Bissau; the closest was Luanda, 563 kilometers from the centroid of the Luimbe territory. It is possible that this instrument fails the exclusion restriction; i.e., that it “belongs” in the outcome equation, as a measure of intensity of colonial oversight. However, a quick check reveals that the coefficient on this potential IV is significant only in one of our twenty eight regressions (it takes a negative coefficient “Mean Size of Local Settlements”). This, of course, is not evidence that the exclusion restriction is satisfied for the other twenty-seven group characteristics in our study; however, it is suggestive that the IV does not account for observed variation in the outcome variables except for, perhaps, the potentially-endogenous measure of colonial tenure. We present preliminary first-stage in Table 4. The potential IV appears to be reasonably relevant for specifications 1, 3, and 4, but is not satisfactorily relevant to our preferred specification (which includes decade indicators). We hope to refine this instrument in future versions of this work.
B. Measurement Error Our construction of the measure of colonial tenure entailed some choices as to the date of the systemic importation of laws, customs, and institutions from the colonizing countries. While classical measurement error will result in attenuated coefficient estimates, systematic over-estimates, or under-estimates, of data of colonization will result in under-estimates or over-estimates, respectively, of the duration of colonial tenure, which could serve to bias the estimated results upward or downward, depending on the nature of the underlying relationship between group characteristics and tenure. We made every attempt
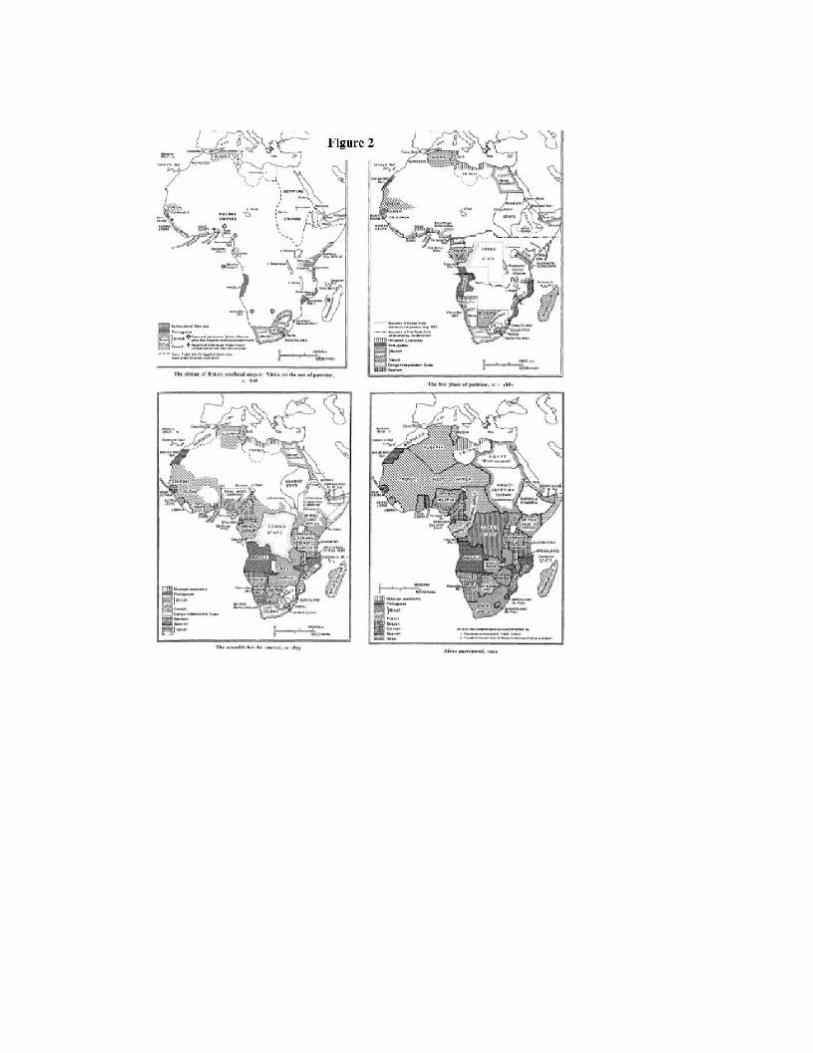
to correctly code the date of colonization, but in this sub-section explore the sensitivity of our results to coding choices. Upon the signing of the Makoko Treaty in 1883, Pierre de Brazza claimed the French Congo for France, which encompasses the territory currently known as Gabon, the Republic of the Congo, and the Central African Republic (Pakenham 1991). We coded all three of those countries as being colonized in 1883 in the original specification, but now re-code the Central African Republic to 1902, according to Figure 2 (maps from the Cambridge History of Africa, Vol. 6). Similarly, we had coded Mali as colonized in 1893 with the capture of Timbuktu, but adjust it to 1902. We re-perform our preferred specification for the impact of colonial tenure, and find the results largely invariant to the re-coding. Tables available from authors upon request. Section 5: Conclusion Contrary to its current use, Murdock’s Ethnographic Atlas is not a cross-sectional snapshot of Africa: it captures different groups in different locations at different points in time, and we exploit this variation to explore the marginal impact of colonial tenure on group characteristics in Africa. We find that the EA does reveal systematic relationships in the magnitudes of economic and political group characteristics and the duration of colonial tenure: using within-decade variation in colonial tenure, we find that there is evidence that colonial influence altered economic and political characteristics at the group-level in Africa. In particular, we find the incidence of absolutism in succession to local leadership increased by .17 standard deviations with every one-standard deviation increase in colonial tenure (equivalent to 4.6% for an additional decade of tenure), and the prevalence of monogamy increased by .28 standard deviations with every one-standard deviation increase in colonial tenure (equivalent to 3% for an additional decade of tenure). We also find significant heterogeneity in colonial tenure effects by colonizer identity, and can strongly reject the hypothesis that there is no effect of tenure by colonizer for the majority of characteristics in our study. However, for all that the Ethnographic Atlas can tell us about the contours of colonialism in early 20th century Africa, it raises more questions than it answers. It reveals very little about the counterfactual – how would these groups have developed in the absence of colonialism? The Murdock Map, on which our geographic controls are based, is itself subject to question: how confident was Murdock, who had spent less than a month in Africa, in his ethnic cartography? Finally, our methodology is also open to improvement: why, exactly, were the unobserved groups not observed, and what effect does that have on our estimates? It is our hope that these findings stimulate further research into the impact of colonialism in Africa in the 20th century, a particularly relevant topic given recent interest in the search for the historical roots of current development in Africa.
Works Cited Acemoglu D, Johnson S, Robinson JA. 2001. The colonial origins of comparative development: an empirical investigation. Am. Econ. Rev. 91:1369–401 Bertocchi G, Canova F. 2002. Did colonization matter for growth? An empirical exploration into the historical causes of Africa’s underdevelopment. Eur. Econ. Rev. 46:1851–71 Camerson C, Gelbach J, Miller D. 2011. Robust Inference with Multi-Way Clustering. J. Business and Econ. Stat. 28(2):238-249 Englebert P. 2000. Pre-colonial institutions, post-colonial states, and economic development in tropical Africa. Polit. Res. Q. 53:7–36 Fenske J. Forthcoming. Does land abundance explain African institutions? Economic Journal Forde, D (editor). 1954. People of Central Cameroons. Ethnographic Survey of Africa. Part IX. Gennaioli N, Rainer I. 2007. The modern impact of precolonial centralization in Africa. J. Econ. Growth 12:185–234 Hargreaves JD. 1985. Western Africa, 1886-1905. Cambridge History of Africa. Vol. 6. La Porta R, Lopez-de-Silanes F, Shleifer A, Vishny R. 1997. Legal determinants of external finance. J. Financ. 52:1131–50 La Porta R, Lopez-de-Silanes F, Shleifer A. 2008. The economic consequences of legal origins. J. Econ. Lit. 46:285–332 Michaolopolous S, Papaioannou E. 2012. Pre-colonial Ethnic Institutions and Contemporary African Development. Econometrica 81(1):113-152 Michaolopolous S, Papaioannou E. 2011. The Long Run Effects of the Scramble for Africa. NBER WP 17620 Murdock, G. 1959. Africa: Its Peoples and their Culture History. New York: McGraw-Hill Book Company Murdock, G. 1967. Ethnographic Atlas: A summary. Ethnology 6(2): 109-236 Murdock, G. 1962. Ethnographic Atlas. Ethnology 1(2):265-286
Nunn N, Wantchekon L. 2011. The slave trade and the origins of mistrust in Africa. Am. Econ. Rev. 101(7): 3221-3252 Pakenham, T. 1991. The Scramble for Africa: The White Man’s Conquest of the Dark Continent from 1876-1912. New York: Random House Sanderson, G.N. 1985. The European Partition of Africa. Cambridge History of Africa. Vol. 6. Whatley, W. 2012. The Transatlantic Slave Trade and the Evolution of Political Authority in West Africa. Mimeograph, University of Michigan.
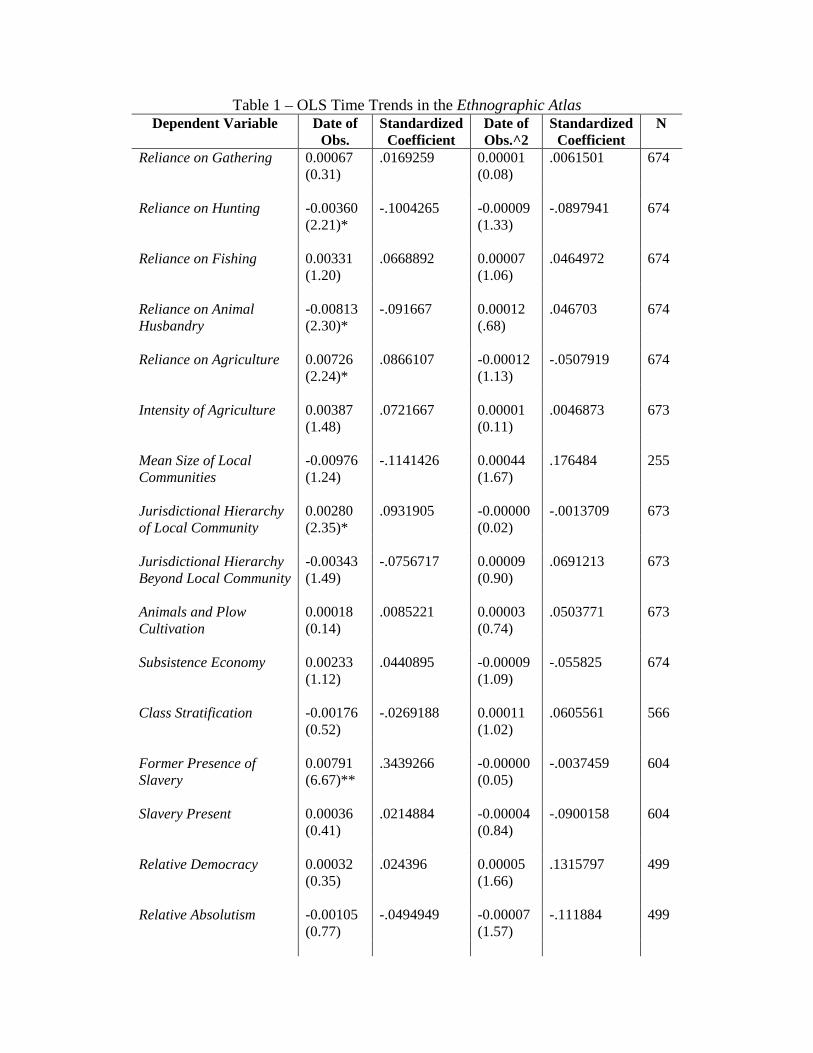
Table 1 – OLS Time Trends in the Ethnographic Atlas Dependent Variable Date of
Obs. Standardized
Coefficient Date of Obs.^2
Standardized Coefficient
N
Reliance on Gathering 0.00067 (0.31)
.0169259 0.00001 (0.08)
.0061501 674
Reliance on Hunting -0.00360
(2.21)* -.1004265 -0.00009
(1.33) -.0897941 674
Reliance on Fishing 0.00331
(1.20) .0668892 0.00007
(1.06) .0464972 674
Reliance on Animal Husbandry
-0.00813 (2.30)*
-.091667 0.00012 (.68)
.046703 674
Reliance on Agriculture 0.00726
(2.24)* .0866107 -0.00012
(1.13) -.0507919 674
Intensity of Agriculture 0.00387
(1.48) .0721667 0.00001
(0.11) .0046873 673
Mean Size of Local Communities
-0.00976 (1.24)
-.1141426 0.00044 (1.67)
.176484 255
Jurisdictional Hierarchy of Local Community
0.00280 (2.35)*
.0931905 -0.00000 (0.02)
-.0013709 673
Jurisdictional Hierarchy Beyond Local Community
-0.00343 (1.49)
-.0756717 0.00009 (0.90)
.0691213 673
Animals and Plow Cultivation
0.00018 (0.14)
.0085221 0.00003 (0.74)
.0503771 673
Subsistence Economy 0.00233
(1.12) .0440895 -0.00009
(1.09) -.055825 674
Class Stratification -0.00176
(0.52) -.0269188 0.00011
(1.02) .0605561 566
Former Presence of Slavery
0.00791 (6.67)**
.3439266 -0.00000 (0.05)
-.0037459 604
Slavery Present 0.00036
(0.41) .0214884 -0.00004
(0.84) -.0900158 604
Relative Democracy 0.00032
(0.35) .024396 0.00005
(1.66) .1315797 499
Relative Absolutism -0.00105
(0.77) -.0494949 -0.00007
(1.57) -.111884 499
Relative liberality -0.00015 (0.45)
-.0208209 0.00000 (0.05)
.003197 499
Monogamy 0.00045
(0.68) .051283 0.00001
(0.63) .0478904 669
Polygamy -0.00142
(1.10) -.0605197 -0.00000
(0.11) -.0068025 669
Primogeniture in Land Inheritance
-0.00498 (3.88)**
-.2189998 -0.00003 (0.77)
-.0502056 505
Primogeniture in Property Inheritance
-0.00509 (4.27)**
-.2173174 -0.00001 (0.39)
-.0215644 565
Equality in Land Inheritance
0.00488 (3.78)**
.2238517 0.00004 (1.00)
.0569531 505
Equality in Property Inheritance
0.00360 (3.41)**
.1548212 0.00002 (0.75)
.0342203 565
Relative Patriliny in Land Inheritance
0.00030 (0.24)
.0142375 0.00002 (0.39)
.0325227 525
Relative Matriliny in Land Inheritance
-0.00147 (1.04)
-.0864148 -0.00002 (0.52)
-.0379037 525
Relative Patriliny in Property Inheritance
-0.00128 (0.87)
-.0568666 0.00002 (0.32)
.0377501 565
Relative Matriliny in Property Inheritance
-0.00053 (0.41)
-.0285403 -0.00006 (2.39)*
-.113507 566
Political Integration -0.01696
(3.01)** -.2338297 0.00012
(0.38) .0612242 109
Notes: all specifications incorporate colonizer fixed effects, region fixed effects, and geographic controls. Higher-order terms have been orthogonalized. Geographic controls include a dummy if the group-country is coastal; the number of other ethnicities within 50 and 100 kilometers of the centroid of each group-country; the land area in square kilometers; the distance in km to the closest major river; the distance in km to the nearest point on the coast; a malaria stability index; average land quality for cultivation; mean elevation of each group-country; and a measure of water area. Standard errors are adjusted for two-way clustering at the country and ethno-linguistic family level. T-statistics are included in parentheses. * p<0.05; ** p<0.01.
Table 2 – OLS Tenure Trends in the Ethnographic Atlas
Dependent Variable Without Decade Dummies
(1)
With Decade Dummies (2)
N
Date of Obs.
Date of Obs.^2
Date of Obs. Date of Obs.^2
Reliance on Gathering .0591563 (0.85)
-.00782 (0.16)
.242515 (1.16)
-.0707107 (0.68)
562
Reliance on Hunting -.109186
(2.27)* -.07816 (0.99)
.1130116 (1.30)
-.0975414 (1.51)
562
Reliance on Fishing .0715631
(1.29) -.08067 (1.47)
.0560591 (0.77)
-.1145556 (2.04)*
562
Reliance on Animal Husbandry
-.044993 (1.14)
.12074 (2.30)*
-.1224478 (2.00)*
.1570497 (3.01)*
562
Reliance on Agriculture .015380
(0.34) -.03465 (0.88)
-.0812031 (1.11)
-.008456 (0.11)
562
Intensity of Agriculture .031025
(0.55) .06469 (1.12)
-.1224388 (1.16)
.1073278 (1.16)
561
Mean Size of Local Communities
.06818 (0.79)
.04318 (0.61)
-.049145 (0.43)
.0492651 (0.44)
208
Jurisdictional Hierarchy of Local Community
.06117 (1.26)
-.01516 (0.30)
-.0533067 (0.85)
-.0081568 (0.12)
561
Jurisdictional Hierarchy Beyond Local Community
.00956 (0.18)
.05358 (1.26)
-.1030542 (0.86)
.0698229 (1.20)
561
Animals and Plow Cultivation
.04257 (0.51)
-.00017 (0.00)
-.1755747 (0.89)
.0564198 (0.53)
561
Subsistence Economy -.02568
(0.43) .05671 (0.71)
-.1422099 (1.23)
.0794878 (0.98)
562
Class Stratification .02059
(0.43) .02997 (0.63)
-.1712636 (1.83)
.0716211 (1.70)
478
Former Presence of Slavery
.17927 (3.09)**
-.11539 (2.71)**
-.1283869 (1.09)
-.025608 (0.51)
506
Slavery Present -.08299
(1.02) .01334 (0.32)
-.1771099 (1.17)
-.0047839 (0.09)
506
Relative Democracy .10150 (0.91)
.00688 (0.10)
-.1784033 (1.68)
.0506764 (0.75)
416
Relative Absolutism -.10094
(1.24) .04556 (0.98)
.176942 (2.32)*
-.0004688 (0.01)
416
Relative liberality .02798
(0.67) -.0290 (0.68)
.0876729 (0.71)
-.0355727 (0.62)
416
Monogamy .09705
(1.51) .09352 (1.18)
.2840888 (2.28)*
.0566704 (0.54)
560
Polygamy -.05902
(1.15) -.0129 (0.15)
-.1098452 (1.59)
-.033724 (0.31)
560
Primogeniture in Land Inheritance
-.10641 (1.76)
.13712 (3.32)**
.154201 (2.11)*
.0559103 (1.08)
417
Primogeniture in Property Inheritance
-.12878 (2.40)*
.11105 (2.83)**
.1221191 (1.51)
.0367687 (0.97)
472
Equality in Land Inheritance
.12514 (2.31)*
-.09791 (2.15)*
-.1011118 (1.43)
-.033332 (0.57)
417
Equality in Property Inheritance
.09658 (1.91)
-.10194 (2.21)*
-.0232338 (0.35)
-.0510717 (1.36)
472
Relative Patriliny in Land Inheritance
.09470 (1.46)
.07035 (1.92)
.353722 (3.74)**
-.0262159 (0.33)
435
Relative Matriliny in Land Inheritance
-.06772 (1.49)
-.01415 (0.30)
-.1360373 (0.90)
.0217201 (0.32)
435
Relative Patriliny in Property Inheritance
.03435 (0.68)
.0375 (1.08)
.3882169 (2.58)**
-.0738083 (1.20)
472
Relative Matriliny in Property Inheritance
-.11257 (1.90)
.00182 (0.05)
-.2999138 (1.99)*
.0709457 (1.25)
472
Political Integration -.03071
(0.21) .14914 (1.08)
-.1643979 (1.05)
.1164413 (0.60)
94
Notes: all specifications incorporate “major” colonizer fixed effects, region fixed effects, and geographic controls. Higher-order terms have been orthogonalized. Coefficients have been standardized. Geographic controls include a dummy if the group-country is coastal; the number of other ethnicities within 50 and 100 kilometers of the centroid of each group-country; the land area in square kilometers; the distance in km to the closest major river; the distance in km to the nearest point on the coast; a malaria stability index; average land quality for cultivation; mean elevation of each group-country; and a measure of water area. Standard errors are adjusted for two-way clustering at the country and ethno-linguistic family level. T-statistics are included in parentheses. * p<0.05; ** p<0.01.
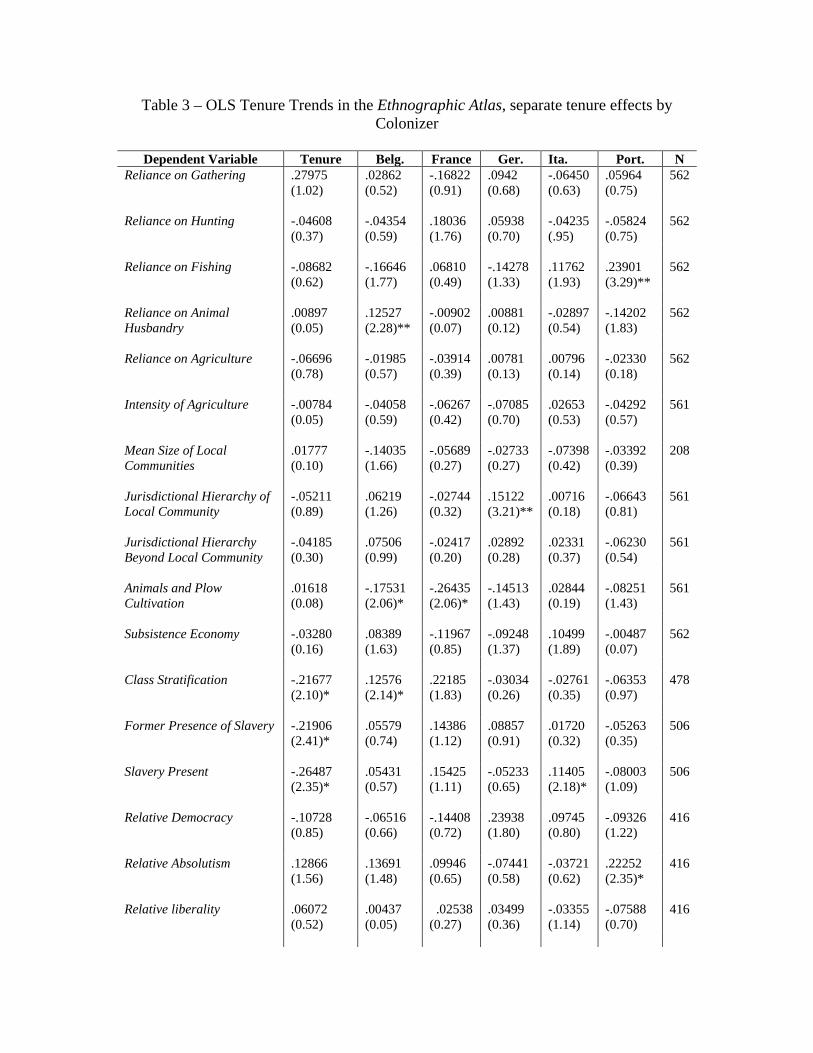
Table 3 – OLS Tenure Trends in the Ethnographic Atlas, separate tenure effects by Colonizer
Dependent Variable Tenure Belg. France Ger. Ita. Port. N
Reliance on Gathering .27975 (1.02)
.02862 (0.52)
-.16822 (0.91)
.0942 (0.68)
-.06450 (0.63)
.05964 (0.75)
562
Reliance on Hunting -.04608
(0.37) -.04354 (0.59)
.18036 (1.76)
.05938 (0.70)
-.04235 (.95)
-.05824 (0.75)
562
Reliance on Fishing -.08682
(0.62) -.16646 (1.77)
.06810 (0.49)
-.14278 (1.33)
.11762 (1.93)
.23901 (3.29)**
562
Reliance on Animal Husbandry
.00897 (0.05)
.12527 (2.28)**
-.00902 (0.07)
.00881 (0.12)
-.02897 (0.54)
-.14202 (1.83)
562
Reliance on Agriculture -.06696
(0.78) -.01985 (0.57)
-.03914 (0.39)
.00781 (0.13)
.00796 (0.14)
-.02330 (0.18)
562
Intensity of Agriculture -.00784
(0.05) -.04058 (0.59)
-.06267 (0.42)
-.07085 (0.70)
.02653 (0.53)
-.04292 (0.57)
561
Mean Size of Local Communities
.01777 (0.10)
-.14035 (1.66)
-.05689 (0.27)
-.02733 (0.27)
-.07398 (0.42)
-.03392 (0.39)
208
Jurisdictional Hierarchy of Local Community
-.05211 (0.89)
.06219 (1.26)
-.02744 (0.32)
.15122 (3.21)**
.00716 (0.18)
-.06643 (0.81)
561
Jurisdictional Hierarchy Beyond Local Community
-.04185 (0.30)
.07506 (0.99)
-.02417 (0.20)
.02892 (0.28)
.02331 (0.37)
-.06230 (0.54)
561
Animals and Plow Cultivation
.01618 (0.08)
-.17531 (2.06)*
-.26435 (2.06)*
-.14513 (1.43)
.02844 (0.19)
-.08251 (1.43)
561
Subsistence Economy -.03280
(0.16) .08389 (1.63)
-.11967 (0.85)
-.09248 (1.37)
.10499 (1.89)
-.00487 (0.07)
562
Class Stratification -.21677
(2.10)* .12576 (2.14)*
.22185 (1.83)
-.03034 (0.26)
-.02761 (0.35)
-.06353 (0.97)
478
Former Presence of Slavery -.21906
(2.41)* .05579 (0.74)
.14386 (1.12)
.08857 (0.91)
.01720 (0.32)
-.05263 (0.35)
506
Slavery Present -.26487
(2.35)* .05431 (0.57)
.15425 (1.11)
-.05233 (0.65)
.11405 (2.18)*
-.08003 (1.09)
506
Relative Democracy -.10728
(0.85) -.06516 (0.66)
-.14408 (0.72)
.23938 (1.80)
.09745 (0.80)
-.09326 (1.22)
416
Relative Absolutism .12866
(1.56) .13691 (1.48)
.09946 (0.65)
-.07441 (0.58)
-.03721 (0.62)
.22252 (2.35)*
416
Relative liberality .06072
(0.52) .00437 (0.05)
.02538 (0.27)
.03499 (0.36)
-.03355 (1.14)
-.07588 (0.70)
416
Monogamy .29654 (1.71)
.01366 (0.20)
-.03190 (0.22)
-.08472 (1.03)
.33771 (2.50)*
-.06651 (1.08)
560
Polygamy -.21092
(2.13)* .13505 (1.73)
.15337 (1.27)
.023884 (0.25)
-.08749 (1.96)
.11419 (2.24)*
560
Primogeniture in Land Inheritance
.21123 (2.61)**
.25313 (3.49)**
-.05131 (0.51)
.04338 (0.34)
-.03535 (0.93)
.00449 (0.04)
417
Primogeniture in Property Inheritance
.15512 (1.93)
.01670 (0.26)
-.01574 (0.19)
.10626 (1.35)
-.03165 (0.70)
-.03112 (0.27)
472
Equality in Land Inheritance
-.09938 (1.13)
-.36947 (5.15)**
-.01885 (0.17)
-.12929 (1.64)
.05586 (1.31)
-.04320 (0.61)
417
Equality in Property Inheritance
-.05267 (0.72)
-.17051 (2.46)*
.02522 (0.26)
-.11206 (1.34)
.00195 (0.05)
-.15795 (2.25)*
472
Relative Patriliny in Land Inheritance
.35693 (4.69)**
-.13928 (2.04)*
-.05240 (0.51)
.05613 (0.65)
-.00753 (0.11)
.09113 (1.14)
435
Relative Matriliny in Land Inheritance
-.1163 (0.85)
.15848 (1.78)
-.03063 (0.22)
-.06682 (0.72)
.06309 (1.05)
.00872 (0.10)
435
Relative Patriliny in Property Inheritance
-.08624 (3.08)**
-.21515 (3.05)**
-.02988 (0.22)
.04820 (0.49)
-.03262 (0.45)
.10450 (1.29)
472
Relative Matriliny in Property Inheritance
-.27731 (2.20)*
.26425 (3.60)**
.04419 (0.31)
-.11141 (0.94)
.07600 (1.52)
-.08624 (0.83)
472
Political Integration -.32826
(1.61) .12602 (0.53)
.18344 (0.63)
-.14923 (0.59)
.20064 (1.43)
.54842 (3.11)**
94
Notes: all specifications incorporate colonizer fixed effects, region fixed effects, decade dummies, and geographic controls. The excluded group is the UK. Coefficients have been standardized. Geographic controls include a dummy if the group-country is coastal; the number of other ethnicities within 50 and 100 kilometers of the centroid of each group-country; the land area in square kilometers; the distance in km to the closest major river; the distance in km to the nearest point on the coast; a malaria stability index; average land quality for cultivation; mean elevation of each group-country; and a measure of water area. Standard errors are adjusted for two-way clustering at the country and ethno-linguistic family level. T-statistics are included in parentheses. * p<0.05; ** p<0.01.
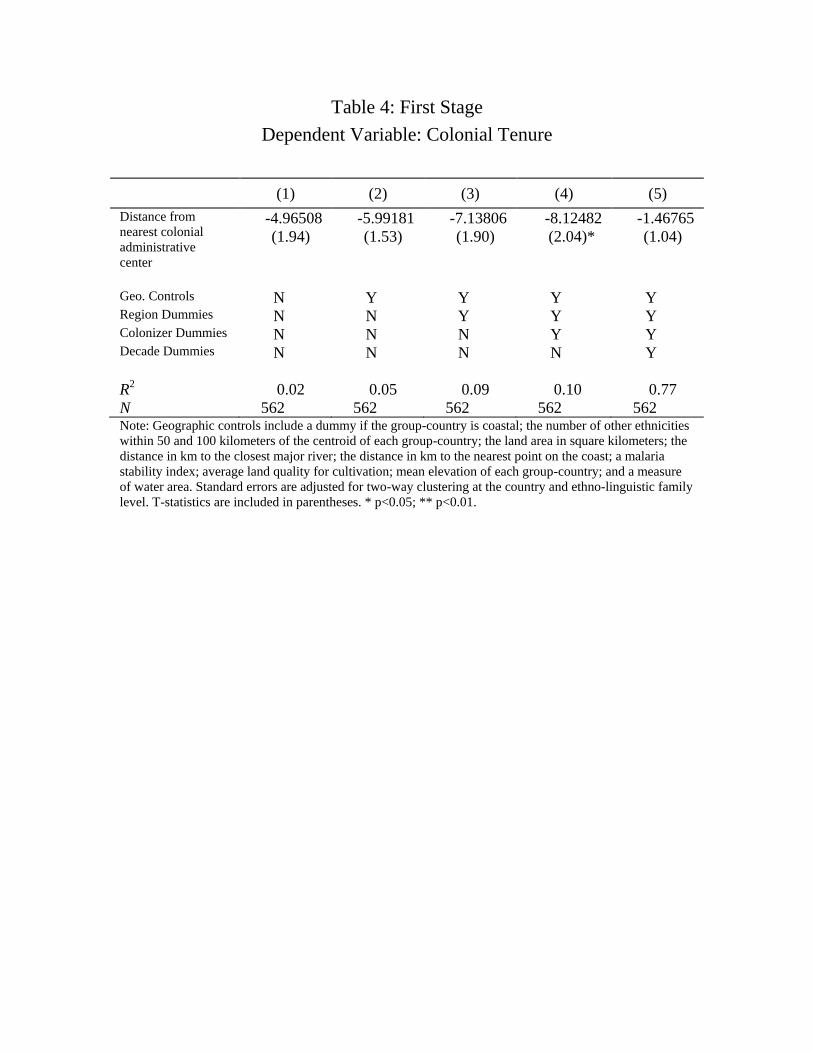
Table 4: First Stage Dependent Variable: Colonial Tenure
(1) (2) (3) (4) (5) Distance from nearest colonial administrative center
-4.96508 (1.94)
-5.99181 (1.53)
-7.13806 (1.90)
-8.12482 (2.04)*
-1.46765 (1.04)
Geo. Controls N Y Y Y Y Region Dummies N N Y Y Y Colonizer Dummies N N N Y Y Decade Dummies N N N N Y R2 0.02 0.05 0.09 0.10 0.77 N 562 562 562 562 562 Note: Geographic controls include a dummy if the group-country is coastal; the number of other ethnicities within 50 and 100 kilometers of the centroid of each group-country; the land area in square kilometers; the distance in km to the closest major river; the distance in km to the nearest point on the coast; a malaria stability index; average land quality for cultivation; mean elevation of each group-country; and a measure of water area. Standard errors are adjusted for two-way clustering at the country and ethno-linguistic family level. T-statistics are included in parentheses. * p<0.05; ** p<0.01.
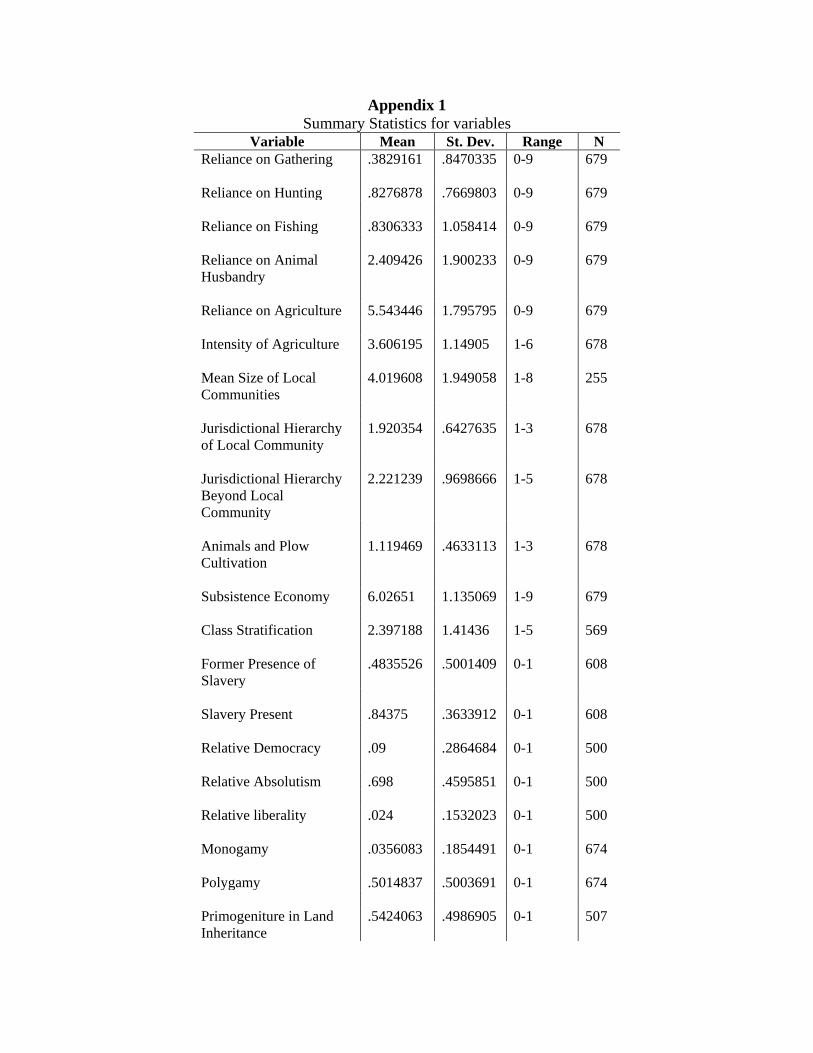
Appendix 1 Summary Statistics for variables
Variable Mean St. Dev. Range N Reliance on Gathering .3829161 .8470335 0-9 679 Reliance on Hunting .8276878 .7669803 0-9 679 Reliance on Fishing .8306333 1.058414 0-9 679 Reliance on Animal Husbandry
2.409426 1.900233 0-9 679
Reliance on Agriculture 5.543446 1.795795 0-9 679 Intensity of Agriculture 3.606195 1.14905 1-6 678 Mean Size of Local Communities
4.019608 1.949058 1-8 255
Jurisdictional Hierarchy of Local Community
1.920354 .6427635 1-3 678
Jurisdictional Hierarchy Beyond Local Community
2.221239 .9698666 1-5 678
Animals and Plow Cultivation
1.119469 .4633113 1-3 678
Subsistence Economy 6.02651 1.135069 1-9 679 Class Stratification 2.397188 1.41436 1-5 569 Former Presence of Slavery
.4835526 .5001409 0-1 608
Slavery Present .84375 .3633912 0-1 608 Relative Democracy .09 .2864684 0-1 500 Relative Absolutism .698 .4595851 0-1 500 Relative liberality .024 .1532023 0-1 500 Monogamy .0356083 .1854491 0-1 674 Polygamy .5014837 .5003691 0-1 674 Primogeniture in Land Inheritance
.5424063 .4986905 0-1 507
Primogeniture in Property Inheritance
.4771127 .4999162 0-1 568
Equality in Land Inheritance
.3530572 .4783923 0-1 507
Equality in Property Inheritance
.4383803 .4966258 0-1 568
Relative Patriliny in Land Inheritance
.6793169 .4671826 0-1 527
Relative Matriliny in Land Inheritance
.1650854 .3716103 0-1 527
Relative Patriliny in Property Inheritance
.6390845 .4806894 0-1 568
Relative Matriliny in Property Inheritance
.1971831 .3982224 0-1 568
Political Integration 3.87156 1.639224 1-8 109 Date of Observation 1917.239 21.448 1830-
1960 679
Colonial Tenure 24.3618 23.00276 -54-122 644
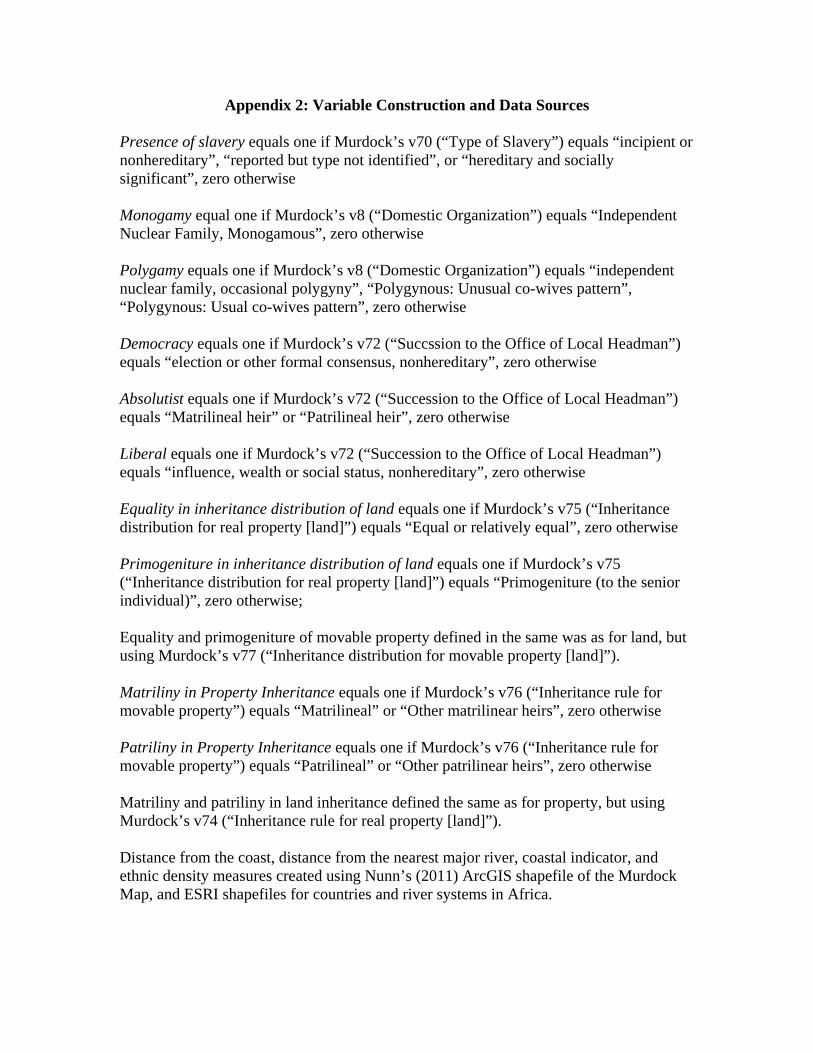
Appendix 2: Variable Construction and Data Sources Presence of slavery equals one if Murdock’s v70 (“Type of Slavery”) equals “incipient or nonhereditary”, “reported but type not identified”, or “hereditary and socially significant”, zero otherwise Monogamy equal one if Murdock’s v8 (“Domestic Organization”) equals “Independent Nuclear Family, Monogamous”, zero otherwise Polygamy equals one if Murdock’s v8 (“Domestic Organization”) equals “independent nuclear family, occasional polygyny”, “Polygynous: Unusual co-wives pattern”, “Polygynous: Usual co-wives pattern”, zero otherwise Democracy equals one if Murdock’s v72 (“Succssion to the Office of Local Headman”) equals “election or other formal consensus, nonhereditary”, zero otherwise Absolutist equals one if Murdock’s v72 (“Succession to the Office of Local Headman”) equals “Matrilineal heir” or “Patrilineal heir”, zero otherwise Liberal equals one if Murdock’s v72 (“Succession to the Office of Local Headman”) equals “influence, wealth or social status, nonhereditary”, zero otherwise Equality in inheritance distribution of land equals one if Murdock’s v75 (“Inheritance distribution for real property [land]”) equals “Equal or relatively equal”, zero otherwise Primogeniture in inheritance distribution of land equals one if Murdock’s v75 (“Inheritance distribution for real property [land]”) equals “Primogeniture (to the senior individual)”, zero otherwise; Equality and primogeniture of movable property defined in the same was as for land, but using Murdock’s v77 (“Inheritance distribution for movable property [land]”). Matriliny in Property Inheritance equals one if Murdock’s v76 (“Inheritance rule for movable property”) equals “Matrilineal” or “Other matrilinear heirs”, zero otherwise Patriliny in Property Inheritance equals one if Murdock’s v76 (“Inheritance rule for movable property”) equals “Patrilineal” or “Other patrilinear heirs”, zero otherwise Matriliny and patriliny in land inheritance defined the same as for property, but using Murdock’s v74 (“Inheritance rule for real property [land]”). Distance from the coast, distance from the nearest major river, coastal indicator, and ethnic density measures created using Nunn’s (2011) ArcGIS shapefile of the Murdock Map, and ESRI shapefiles for countries and river systems in Africa.