The Impact of Learning Time on Academic Achievement Learning Time on Academic Achievement
Upload
nguyenthuyCategory
view
214download
0
The impact of climate change on the achievement of the post-2015 sustainable development goals
May 2015

Front cover photo: Daily activity on the road, Uganda.

The impact of climate change on the achievement of the post-2015 sustainable development goals
Alberto Ansuategi, University of the Basque CountryPatxi Greño, Metroeconomica Valerie Houlden, HR WallingfordAnil Markandya, MetroeconomicaLaura Onofri, MetroeconomicaHelen Picot, CDKNGeorgia-Marina Tsarouchi, HR WallingfordNigel Walmsley, HR Wallingford
May 2015

About the authorsThis research has been carried out by a team of researchers at HR Wallingford and Metroeconomica with additional substantive contributions from CDKN.
HR Wallingford is an independent, non-profit organisation with a 60-year track record of applied research and specialist consultancy. It has a unique mix of know-how, facilities and expert staff with world-renowned skills and experience in water security and climate resilient development. HR Wallingford has a long record of working on international water and development issues, specialising in the provision of expert climate change impacts and adaptation, development of frameworks and decision support tools. An extensive programme of ongoing strategic research underpins the company’s technology base and ensures its staff remain at the forefront of knowledge and have access to innovative techniques that are generally not yet used by others in the industry.
Metroeconomica is an independent consultancy group specialising in economic and policy analysis of environmental, resource use and sustainable development issues. It offers expert services to a wide range of clients from national, regional and local governments and international donor organisations, to private sector companies and non-governmental organisations. Metroeconomica’s participation in major international projects in many countries worldwide is based on its reputation as one of Europe’s leading institutions in the economic and policy assessment of key local, regional and global environmental issues. Metroeconomica worked on the Sustainable Development Goals (SDGs) for the Commonwealth Secretariat and for the UNDP World We Want 2015 programme, moderating the discussion on growth and sustainability.
AcknowledgementsThe authors thank the project steering group and development experts from the case study countries and regions for their valuable insights and advice in carrying out this research. This report has benefitted from their review and feedback, for which the authors are grateful. They include: Sam Bickersteth, Simon Maxwell, Hammad Raza, Kiran Sura, Joyce Thomas Peters and Revocatus Twinohuomangi (CDKN), Lit Ping Low (PriceWaterhouse Coopers) and Andrew Scott (Overseas Development Institute).

ContentsSummary 1
Acronyms and abbreviations 5
1. Introduction 71.1 Climate change and the post-2015 development agenda 7
1.2 Approach and purpose of this report 8
2. What is an ambitious climate agreement? 92.1 Storylines for the scenarios used in the study 9
2.2 Cost-effective decarbonisation pathways 11
3. Socioeconomic trends 133.1 Links between national decarbonisation and policy 13
3.2 The importance of the COP21 Paris climate agreement 13
4. Global and regional trends 154.1 Overview 15
4.2 Global and regional implications for the SDGs 15
4.3 What does this mean at the national level? 23
5. Case study: Caribbean countries 255.1 Development context and key challenges 25
5.2 Current mitigation and adaptation policies 26
5.3 Implications of a climate agreement for national development policies and trajectories 27
5.4 Implications for the achievement of the SDGs: analysis and findings 28
5.5 A comparative review between country-level and regional analysis 34
6. Case study: Pakistan 366.1 Development context and key challenges 36
6.2 Current mitigation and adaptation policies 36
6.3 Implications of a climate agreement for national development policies and trajectories 37
6.4 Implications for the achievement of the SDGs: analysis and findings 37
6.5 A comparative review between country-level and regional analysis 41
7. Case study: Uganda 437.1 Development context and key development challenges 43
7.2 Current mitigation and adaptation policies 43
7.3 Implications of a climate agreement for national development policies and trajectories 45
7.4 Implications for the achievement of the SDGs: analysis and findings 45
7.5 A comparative review between country-level and regional analysis 50
Conclusions 52

The impact of climate change on the achievement of the post-2015 SDGsiv
Background reading 56
The draft SDGs and targets 57
Annex: Analytical methods used and models deployed 67
A.1 Calculations of poverty changes with growth 67
A.2 SDG 7 and the use of GCAM 67
A.3 Metrics used in the risk of failure tables 69
Endnotes 71

The impact of climate change on the achievement of the post-2015 SDGs 1
Summ
ary
SummaryThis work explores the implications of a potential international climate agreement on achieving the Sustainable Development Goals (SDGs) by 2030.1 Governments are due to negotiate a climate agreement at the 21st Conference of the Parties of the United Nations Framework Convention on Climate Change (UNFCCC COP21) in Paris, France at the end of 2015. The impact of the climate agreement on global development by 2030 will be significant and, although it is unlikely to significantly impact global warming or the frequency and severity of weather-related disasters in the period up to 2030, it will play a major role thereafter. A high-ambition agreement that provides a clear policy framework for action on climate change, incentivises international cooperation, and mobilises additional resources for mitigation and adaptation activities is essential to give us the best chance of achieving the SDGs by 2030. Likewise, strong SDGs will help to lay the policy groundwork for achieving and implementing a more ambitious climate agreement.
Key messages
� A high-ambition climate agreement in 2015 is key to achieving the SDGs by 2030.
� A strong set of SDGs needs to be agreed in 2015 in order to achieve and implement a high-ambition climate agreement that limits global warming to 2°C by 2100.
This research considers impacts on development over the next 15 years, including economic impacts, under two scenarios for the 2015 climate change agreement: a high-ambition agreement and a low-ambition agreement, with associated policies and levels of investment in mitigation and adaptation. The high-ambition scenario used is based on the UNFCCC aim to limit global warming to a 2°C increase on pre-industrial temperatures. We have associated this higher ambition scenario with the nearest RCP, RCP 4.5, which would see average global temperature rise by 1.1 to 2.6°C by 2100, on a 1986–2005 baseline (the temperature rise on pre-industrial levels would be higher, please see Figure 2). Meanwhile the low-ambition climate agreement is represented by RCP 8.5, which would see temperatures rise by 2.6 to 4.8°C on a 1986–2005 baseline. The research aims to provide decision-makers and negotiators at the Conference of the Parties (COP) with a better understanding, and quantitative evidence where possible, of the implications of the outcome of the climate agreement decisions on the SDGs. In addition, it aims to influence the SDG negotiations2 as, although the goals are likely fixed, the indicators and targets are still being adjusted. Moreover, country Financing for Development (FFD) commitments are as yet undetermined as countries are still negotiating their financial commitments to implement the post-2015 development agenda. It is intended that this report will be useful for negotiators and the development community to advocate a stronger climate deal and to ensure that the SDGs deliver climate compatible development in the poorest and most climate vulnerable countries.
At the global and regional levels, this research suggests that a high-ambition climate agreement is most crucial to achieving the proposed SDGs relating to poverty (SDG 1), inequality (SDG 10), climate change (SDG 13) and global partnerships for sustainable development (SDG 17). For example, under the low-ambition agreement, poverty levels in 2030 are projected to be 80–140% higher for Asia and sub-Saharan Africa and 25% higher for Latin America and the Caribbean (LAC) compared to the high-ambition scenario.

The impact of climate change on the achievement of the post-2015 SDGs2
Sum
mar
y
Table 1. Risk of failure to achieve the SDGs by 2030 (see explanation of key in Annex)
Sustainable Development Goals Risk Confidence High-ambition Low-ambition
SDG 1 Poverty
SDG 5 Gender equality
SDG 6 Water and sanitation
SDG 7 Energy
SDG 1 Poverty
SDG 5 Gender equality
SDG 6 Water and sanitation
SDG 7 Energy
SDG 1 Poverty
SDG 5 Gender equality
SDG 6 Water and sanitation
SDG 7 Energy
SDG 1 Poverty
SDG 5 Gender equality
SDG 6 Water and sanitation
SDG 7 Energy
SDG 1 Poverty
SDG 5 Gender equality
SDG 6 Water and sanitation
SDG 7 Energy
U
gand
a Pa
kist
an
Jam
aica
D
omin
ica
Coun
try
leve
lG
loba
l lev
el
Selected country case studies show that, at the national level, the nature of the links between the climate agreement and the achievement of SDGs varies from country to country. In the Caribbean states of Dominica and Jamaica, the SDG relating to poverty (SDG 1) is the most sensitive to the differences in the climate ambition, while in Pakistan and Uganda the SDGs relating to poverty and energy (SDGs 1 and 7, respectively) are the most sensitive to the level of climate ambition.
Table 1 summarises the influence of the level of ambition of the climate agreement on the risk of failure to achieve the SDGs that were examined at the country level, compared to the estimated outcomes at the global level. The table gives the level of confidence in the estimate of the magnitude of risk. For all four of the case study countries, the level of ambition in the climate agreement will influence the achievement of the SDGs considered in the study. The difference between the high- and low-ambition agreements at the country level is most marked for achievement of the SDGs on poverty and energy. The high-ambition agreement is estimated to have the greatest impact in changing the outcome for the achievement of the SDG on poverty for Dominica and Pakistan.
The research highlights that it is important for decision-makers and negotiators at COP21 to recognise that the outcome of the climate agreement in 2015 has the potential to strongly influence the level of achievement of the SDGs by 2030. The country and regional analysis

The impact of climate change on the achievement of the post-2015 SDGs 3Summary
Summ
ary
indicates that this is crucial for developing countries’ sustainable development pathways: they will be affected in the shorter term as well as being disproportionately vulnerable to physical climate impacts in the longer term. It is also important for negotiators involved in finalising the SDG framework to recognise that the outcome of the SDG agenda will influence the achievement of the climate agreement. We contribute to the evidence base in support of both a robust SDG agenda and ambitious flows of FFD. Negotiators and the development community need to advocate for strong SDG targets and strong FFD commitments to ensure that development pathways support the delivery of decarbonisation pathways, i.e. the timing and approaches applied for reducing carbon emissions, that limit global warming to 2°C by 2100.
‘Risk of failure to achieve a SDG’ combines the likelihood of failing to achieve a SDG with the magnitude of departure from the SDG for a given climate agreement scenario.
Very high risk of failure to achieve the SDG – Very likely that the SDG will not be achieved and potential for substantial departure from the SDG. Very unlikely to achieve the SDG.
High risk of failure to achieve the SDG – Likely that the SDG will not be achieved and potential for moderate to substantial departure from the SDG. Unlikely to achieve the SDG.
Medium risk of failure to achieve the SDG – About as likely as not that the SDG will not be achieved and potential for moderate departure from the SDG. About as likely as not to achieve the SDG.
Low risk of failure to achieve the SDG – Unlikely that the SDG will not be achieved and potential for small departure from the SDG. Likely to achieve the SDG.
Very low risk of failure to achieve the SDG – Very unlikely that the SDG will not be achieved and potential for negligible departure from the SDG. Very likely to achieve the SDG.
‘Confidence’ is the degree to which the findings of the assessment are considered valid, based on the type, amount, quality, and consistency of evidence, as well as the degree of agreement on the evidence.
High confidence – Reliable analysis and methods, with a strong theoretical basis. This includes modelling or analytical methods that have made use of climate or SSP projections.
Medium confidence – Estimation of potential implications for SDGs based on reliable information, e.g. evidence of causal links or analytical estimation methods based on historical information and projected data.
Low confidence – Expert view of potential implications for SDGs based on limited information, e.g. anecdotal evidence, or very simplistic estimation methods based on historical information.
SDG Method for assessing risk of failure to achieve the SDG
SDG 1 Poverty
An integrated assessment model was used to estimate changes in the number of people below the poverty line under the two climate agreement scenarios.
SDG 5 Gender equality
Estimated based on recent observed trends available in the literature, progress towards achieving the Millennium Development Goals (MDGs), and the authors’ understanding of how a potential climate agreement might influence gender equality.
SDG 6 Water and sanitation
Estimated based on recent observed trends available in the literature, progress towards achieving the MDGs, and the authors’ understanding of how a potential climate agreement might influence access to safe drinking water and improved sanitation facilities.
SDG 7 Energy
An integrated assessment model is used to estimate changes in the non-fossil energy shares under the two climate agreement scenarios.
Table 1 (continued). Risk of failure to achieve the SDGs by 2030

The impact of climate change on the achievement of the post-2015 SDGs4
Sum
mar
y
Key findings
� Achievement of the SDGs requires an ambitious climate agreement.
- The decisions that were taken at UNFCCC COP20 in Lima and those that will be taken at COP21 in Paris will have a significant impact on global development by 2030, even before the resulting impacts on the climate are felt.
- A high-ambition agreement that aims to limit global warming to 2°C by 2100 is essential to have the best chance of achieving the SDGs by 2030.
- The climate agreement is unlikely to impact global warming or the frequency and severity of weather-related disasters in the period up to 2030; it will, however, play a significant role thereafter.
- A high-ambition climate agreement can provide a clear policy framework and the legal basis for action on climate change, incentivise international cooperation, and mobilise additional finance and resources for mitigation and adaptation activities that support climate compatible development. Both the policy reforms and the additional finance play complementary roles in supporting such development.
- This can potentially have a significant impact on the state of the economy and social well-being in the poorest and most climate vulnerable countries before 2030, improving the likelihood that they will achieve the SDGs. Likewise a low-ambition agreement puts their sustainable development trajectories at risk.
� An ambitious climate agreement requires ambitious SDGs.
- The decisions taken in finalising the SDG framework of goals, targets and indicators, and FFD commitments to 2030 will have a significant influence on climate change impacts to 2100.
- Strong SDG targets and strong FFD commitments are essential to have the best chance of achieving a high-ambition climate agreement that limits global warming to 2°C by 2100. Ambitious SDGs will promote national policies that will underpin the delivery of decarbonisation pathways to achieve a high-ambition climate agreement.
Finally, we identify a knowledge gap around the impacts of climate policy in the medium term on the development agenda to 2030. This indicative study shows the value of Integrated Assessment Modelling (IAM) in this area, and we propose future focal areas for research.

The impact of climate change on the achievement of the post-2015 SDGs 5
Acronym
s and abbreviations
Acronyms and abbreviations AR5 Fifth Assessment Report (of IPCC)CARICOM Caribbean Community CCCCC Caribbean Community Climate Change Centre CMIP5 Coupled Model Intercomparison Project Phase 5CO2 carbon dioxide COP Conference of the Parties FFD financing for development GCAM Global Change Assessment ModelGDP gross domestic product GNI gross national incomeGPI Gender Parity Index IAM integrated assessment modelling IAMC Integrated Assessment Modelling Consortium IAV impacts, adaptation and vulnerability IIASA International Institute for Applied Systems Analysis ILO International Labour Organization INDCs Intended Nationally Determined Contributions IPCC Intergovernmental Panel on Climate ChangeLAC Latin America and the CaribbeanLDC least developed country LPG liquefied petroleum gasLULUCF land use, land use change and forestry MDG Millennium Development GoalMTOE million tonnes of oil equivalentNCCP National Climate Change Policy NGO non-governmental organisation NPL national poverty lineOECD Organisation for Economic Co-operation and Development OWG Open Working Group PPP GDP gross domestic product at purchasing power parityRCP Representative Concentration Pathway REDD Reducing Emissions from Deforestation and forest DegradationSDG Sustainable Development Goal SIDS Small Island Developing StatesSSP Shared Socioeconomic PathwayUNEP United Nations Environment Programme UNFCCC United Nations Framework Convention on Climate ChangeUNWTO United Nations World Tourism OrganizationWDI World Development Indicators


7
Chapter 1
1. Introduction
1.1 Climate change and the post-2015 development agenda
Climate change is one of the most pressing challenges the world faces today. It affects all aspects of the development agenda, from poverty eradication to health care, and from economic growth to disaster risk reduction. The poorest and most vulnerable people globally are likely to be most affected, unless significant efforts are made to create models of development that can mitigate and adapt to the impacts of climate change.
An international post-Kyoto agreement on climate change is currently being negotiated and is set to be finalised at the UNFCCC COP21 in Paris at the end of 2015. On a related track, the Rio+20 Conference on Sustainable Development in 2012 initiated a UN process to create the post-2015 SDGs, which replace the MDGs, and which will shape the international and national development priorities for all countries until at least 2030. While the MDGs target developing countries, the SDGs are aimed at all countries, including industrialised ones. The draft SDGs and their targets, which are proposed by the Open Working Group (OWG) of the UN General Assembly are detailed from page 57.
In 2015, therefore, negotiations are expected to be completed on both a new global climate change agreement and the final targets and indicators for the SDGs. Despite the concurrent work on both the climate agreement and the SDG targets, largely unconnected parallel processes are being followed for each.
A climate agreement that neglects emerging evidence on the critical links between climate change and development could put many of the most vulnerable nations at risk of failing to achieve the SDG targets by 2030. Likewise, the development of SDGs that do not adequately address the causes of climate change or the need for climate resilience could mean that achieving the SDGs would not ensure long-term climate compatible development. There are therefore strong links between these two processes: strong SDGs both require, and will help in promoting and implementing, a more ambitious climate agreement; and an ambitious climate agreement will help to achieve the SDGs.
A climate agreement at the end of 2015 will provide the basis for global action to address climate change from 2020 onwards. This agreement has the potential to deliver real transformational change, by putting societies on a path to green growth and low-carbon development; however, this is dependent on the level of ambition.
A high-ambition climate agreement can provide a clear policy framework and the legal basis for action on climate change, incentivise international cooperation, and mobilise additional finance and resources for mitigation and adaptation activities that support climate compatible development. These resources, in conjunction with the policy reforms that underlie the high-ambition agreement, can in turn have a substantial effect on the development pathways of climate vulnerable countries and therefore the SDGs.
This research makes clear that if governments show their support for sustainable development trajectories by ratifying ambitious SDGs and targets of the kind already tabled by the OWG, consistency would require them to also push for a high-ambition agreement at COP21 in Paris in December. It is likely that a low-ambition agreement would put at risk the ability to achieve the SDGs.

The impact of climate change on the achievement of the post-2015 SDGs8
Chap
ter 1
1.2 Approach and purpose of this report
This research considers impacts on development, including economic impacts, under two scenarios for the 2015 climate change agreement: a high-ambition agreement (to minimise global warming to 2°C by 2100) and a low-ambition agreement (to limit global warming to 3–5°C by 2100), with associated policies and levels of investment in mitigation and adaptation. These scenarios are referred to in this report as the ‘high’ or ‘strong’ ambition scenario and the ‘low’ or ‘weak’ ambition scenario.
This report aims to provide decision-makers and negotiators at COP with a better understanding, and quantitative evidence where possible, of the implications of the outcome of the climate agreement decisions on the SDGs. It also emphasises to SDG negotiators that ambitious SDGs require an ambitious climate deal and that an ambitious climate deal requires ambitious SDGs. It is intended that the messages from this report can be used by negotiators and the development community to advocate a stronger climate deal and to ensure that the SDGs deliver climate compatible development in the poorest and most climate vulnerable countries.
The spatial–temporal scales of climate impacts and development pathways are different. It may be possible to change development pathways within a shorter time period than to change climate impact pathways. We suggest that the methods indicated in this study be built on in further research into this area, where there is currently a knowledge gap.

The impact of climate change on the achievement of the post-2015 SDGs 9
Chapter 2
2. What is an ambitious climate agreement?
2.1 Storylines for the scenarios used in the study
It is challenging to determine what impacts a climate agreement will have in terms of national-level social, economic and policy responses. This research approaches this challenge by applying two contrasting ‘what if ’ alternatives, pairing two greenhouse gas emissions scenarios with two socioeconomic development scenarios. The rationale behind this pairing is that a high-ambition agreement goes hand-in-hand with robust, climate compatible decisions and national policies, and therefore a more sustainable and equitable socioeconomic pathway. Conversely, a low-ambition agreement provides less impetus for climate compatible development policies and consequently is more likely to lead to a less sustainable socioeconomic pathway and to worsening global inequality.3 The influence of the climate agreement on the SDGs will be strongly dependent on national policy decisions and actions to implement the agreement.
The scenarios of future concentrations of greenhouse gases are referred to as the ‘Representative Concentration Pathways’ (RCPs)4 and future developments in economic growth and development are referred to as the ‘Shared Socioeconomic Pathways’ (SSPs).5
The SSPs are designed to be used in conjunction with the RCPs to develop a matrix of different scenarios ready to be used by the scientific community. In this matrix (Figure 1), one axis represents different socioeconomic trajectories (SSP dependent) and the other axis represents uncertainty in climate outcomes (RCP dependent).6 It is therefore possible to analyse the implications of different combinations of RCPs and SSPs and to understand the feedbacks between climate change and socioeconomic pathways. Various pairings have been studied by other researchers.7, 8, 9 This study considers two RCP–SSP combinations:
y High-ambition climate agreement scenario: To describe the high-ambition climate agreement, the study considers a combination of RCP4.5 and SSP1 (further information in Boxes 1 and 2). RCP4.5 assumes that actions are taken to reduce emissions sufficiently
Figure 1. Scenario matrix, each cell of which combines an SSP and RCP scenario
RCP
For
cing
Lev
el (W
/m²)
8.5
6.0
4.5
2.6
SSP1 SSP2 SSP3 SSP4 SSP5
Source: Adapted from van Vuuren et al (2013).10

The impact of climate change on the achievement of the post-2015 SDGs10
Chap
ter 2
and keep the planet broadly on course for a 2°C temperature increase by 2100 (above 1985–2005 levels). This is paired with SSP1, where it is assumed that policies are in place for relatively rapid income growth and substantially reduced reliance on natural resources.
y Low-ambition climate agreement scenario: To describe the low-ambition climate agreement, the study considers a combination of RCP8.5 and SSP3 (further information in Boxes 1 and 2). RCP8.5 assumes increasing greenhouse gas emissions over time with a projected temperature increase of between 3°C and 5°C by 2100. SSP3 assumes that economic growth is slower due to lack of international cooperation, slow technological progress and low education levels.
It is not possible to be certain that SSP1 and RCP4.5 naturally go together, or that SSP3 will be the result of a climate policy that follows RCP8.5. For both high- and low-ambition climate agreements, there is a continuum of possible outcomes in terms of the regional and national responses to the agreement and the specific social, economic and climate-related policies that are put in place. Current research indicates, however, that a high-ambition scenario combined
Box 1. Description of Representative Concentration Pathways (RCPs)
RCPs are greenhouse gas concentration pathways used to drive climate model simulations as part of the CMIP5 (Coupled Model Intercomparison Project Phase 5) modelling experiment, in support of the Fifth Assessment Report of the Intergovernmental Panel on Climate Change (IPCC AR5). Figure 2 shows the trajectories of the four RCPs in terms of global temperature change over time. The radiative forcing level associated with each RCP scenario is measured in watts per square metre (of the Earth’s surface) at the top of the atmosphere. RCP4.5 and RCP8.5 are named according to the radiative forcing level in year 2100 (+4.5 W/m2 and +8.5 W/m2, respectively), relative to pre-industrial values.13 Radiative forcing (i.e. difference between energy absorbed by the Earth and energy radiated back to space) is a measure of the Earth’s energy budget balance: positive forcing corresponds to a warmer system, as there is more incoming than outgoing energy.
RCP4.5
RCP4.5 is a stabilisation scenario in which total radiative forcing is stabilised at +4.5 W/m2 in 2100. According to this scenario, climate policies are invoked to limit greenhouse gas emissions and “all nations of the world undertake emissions mitigation simultaneously and effectively”. Mean temperature projections for year 2100 are at around 1.8°C above 1986–2005 levels with CO2 equivalent concentrations reaching 650 ppm. Figure 2, above, shows the range of projected temperature rise on both pre-industrial (1850–1900) and more recent (1986–2005) baselines.
RCP8.5
In RCP8.5, the emissions continue to rise throughout the 21st century leading to a radiative forcing of +8.5 W/m2 in 2100.14 This scenario “combines assumptions about high population and relatively slow income growth with modest rates of technological change and energy intensity improvements, leading in the long term to high energy demand and greenhouse gas emissions in absence of climate change policies”.15 Mean temperature projections for year 2100 are around 3.7°C above 1986–2005 levels with CO2 equivalent concentrations reaching 1370 ppm.
19501900 2000Year
2050 2100
HistoricalRCP8.5 (a high-emissions scenario)
RCP2.6 (a low-emissions scenario)
RCP6.0
RCP4.5
0
°C
1
2
3
4
5
Glo
bal m
ean
tem
pera
ture
cha
nge
(C re
lativ
e to
198
6–20
05)
Glo
bal m
ean
tem
pera
ture
cha
nge
(C re
lativ
e to
18
50–1
900,
as
an a
ppro
xim
atio
n of
pre
-indu
stria
l lev
els)
°C
5
4
3
2
1
0
Figure 2. The IPCC RCP scenarios
Source: IPPC (2013); Knutti, R. and Sedláček, J. (2013).12

The impact of climate change on the achievement of the post-2015 SDGs 112. What is an ambitious climate agreement?
Chapter 2
with the right policies to achieve low-carbon growth is indeed likely to result in SSP1 and RCP4.5 being realised. This has been convincingly demonstrated in a recent report by the Global Commission on the Economy and Climate,11 which shows that a package of measures – including reduced fossil fuel subsidies, the pricing of carbon throughout the economy, innovative finance for low-carbon investments, increased subsidies for research and development in low-carbon energy and policies to ensure compact city development – will result in sustained green growth of the kind that is characterised by SSP1. At the same time, the report argues (as have a number of others) that RCP8.5 will result in lower growth and greater inequality in the medium to long term.
2.2 Cost-effective decarbonisation pathways
Early action on decarbonisation is the most cost-effective pathway to implementing the climate agreement. In practice, this means implementation of mitigation policies and low-carbon technology investments to aim for a peak in global emissions around 2020, noting that the IPCC recognises that peak emissions dates differ by region. The latest evidence suggests that delaying the emissions peak to 2030 would increase the costs and risks of achieving the 2°C target.16
Delayed actions in terms of applying mitigation policies would lead to slower decarbonisation rates, which would be associated with increased mitigation costs. It is likely that negative emissions technologies would be required to meet the high-ambition climate agreement. In addition, invested capital locked-in to high-carbon technologies and existing energy systems incompatible with emission targets would increase with delayed action. This would create costly stranded assets, distressed political-economic affairs and an overall increase of mitigation costs.17
Box 2. The Shared Socioeconomic Pathways (SSPs)
Shared Socioeconomic Pathway 1 (SSP1)
SSP1 is a world making relatively good progress towards sustainability, with sustained efforts to achieve development goals, while reducing resource intensity and fossil fuel dependency. Elements that contribute to this include a rapid development of low-income countries, a reduction of inequality, rapid technology development, and a high level of awareness regarding environmental degradation. Rapid economic growth in low-income countries reduces the number of people below the poverty line. The world is characterised by an open, globalised economy, with relatively rapid technological change directed toward environmentally friendly processes, including clean energy technologies and yield-enhancing technologies for land, as well as investments in education. Changes in tax systems such as phasing out of subsidies on fossil fuels along with investments in environmental technologies, lead to higher resource efficiency, restraining energy use over the longer term. Renewables become more attractive as investments increase, taxes are being reduced, and perceptions/policies change.
Shared Socioeconomic Pathway 3 (SSP3)
In SSP3, the world is separated into regions characterised by poverty, pockets of moderate wealth and a bulk of countries that struggle to maintain living standards for a growing population. There is little progress in reducing resource intensity, fossil fuel dependency, or addressing local environmental concerns. International trade, including in energy resource and agricultural markets, is severely restricted. There is little international cooperation and low investment in technology development leads to a slowing of economic growth in all regions. Unmitigated emissions are relatively high, driven by use of high-carbon local energy resources and slow technological change in the energy sector. Governance and institutions show weakness and a lack of cooperation; effective leadership and capacities for problem-solving are also lacking. Investments in human capital are low and inequality is high. Policies are oriented towards security, including barriers to trade.
The impact of climate change on the achievement of the post-2015 SDGs12
Chap
ter 2
The decarbonisation pathway that each country takes therefore influences the overall cost of achieving its mitigation targets. A high-ambition agreement increases the imperative for early action on mitigation simply in terms of it being technologically possible, and politically favourable, to achieve the mitigation target. Taking early action to mitigate in order to implement a high-ambition agreement may, in the long term, cost less in mitigation costs alone, regardless of the lower costs of impacts and adaptation, than postponed action on mitigation for implementing a low-ambition agreement. A high-ambition agreement is therefore more likely to support a faster decarbonisation pathway, promoting a shift away from a business-as-usual pathway. This will influence policy responses at the global, regional and national levels. In turn, policy responses will influence the outcomes for socioeconomic pathways and the resulting outcomes for achieving the SDGs by 2030. These links are represented in Figure 3. Development choices influence regional- and national-level capability to apply mitigation and adaptation strategies in response to climate change. Further, mitigation and adaptation policies can be more efficient when they form part of broader strategies that aim to increase the sustainability of development pathways.
Economically sustainable energy strategies require policies to be implemented for reduced energy demand and increased investments in low‐carbon electricity. This shifts energy investment flows from conventional fossil fuel technologies towards renewables. The consequence of this is decreased levels of greenhouse gas emissions, leading to faster decarbonisation rates and reduced exposure of communities to climate change in the long term, through reduced risk of more severe climate change impacts. Development pathways that follow slower decarbonisation rates could lead to rising levels of greenhouse gas emissions in the short to medium term, leading to severe climate change impacts on the environment in the medium to long term. The later the choices with respect to decarbonisation are made, the lower the chances will be to change development pathways and the higher the cost of making such changes.
Climate change poses challenges that can be tackled by bringing together adaptation, mitigation and development strategies in a way that will enhance opportunities for low carbon and climate-resilient development.
Figure 3. Decarbonisation pathways influence the overall achievement of SDGs through policy responses
Outcomes for SDGs
SDG 2: Hunger
SDG 3: Health
SDG 1: PovertyClimate ambition
High / Low
SDG 17: Global partnership for sustainable development
Outcomes for socioeconomic pathways
Economic
Social
Environmental
Policy responsesGlobal, regional, national
Climate policies
Development policies
Financing
Decarbonisationpathways
Decarbonisation targets

The impact of climate change on the achievement of the post-2015 SDGs 13
Chapter 3
3. Socioeconomic trends
3.1 Links between national decarbonisation and policy
A country’s decarbonisation pathway and its achievement of socioeconomic development and prosperity are strongly interconnected. Pursuing decarbonisation requires profound alterations in all economic sectors along with rapid technological development, and can be achieved through policies that form part of a country’s sustainable development. In order to achieve decarbonisation within the timescales required for a high-ambition agreement, adequate national policies need to be adopted to allow for the redirection of financial investments from high- to low-carbon technologies and development pathways.
However, there are concerns that allocation of international finance flows could be skewed by decarbonisation initiatives at the expense of poverty elimination initiatives.18 Trade-offs could emerge, so that rather than allocating financial resources to developing countries and regions on the basis of climate and economic vulnerability, funders and investors may decide to allocate the resources to countries and regions with the highest potential to reduce their emissions. It is therefore important to take measures that will tackle the climate change and development challenges together, making sure that conflicting objectives are incorporated efficiently into the efforts for reducing emissions,19 and seeking synergies and co-benefits wherever possible.
3.2 The importance of the COP21 Paris climate agreement
The Paris agreement is expected to commit countries to reducing emissions, ideally by setting clear decarbonisation targets and dates for their achievement. By COP21 many countries will have delivered their Intended Nationally Determined Contributions (INDCs), which may include mitigation and adaptation elements. For a strong agreement, the aggregated contributions from countries have to be such that global reductions in emissions are on track to reach at least 60% below 2010 levels by 2050,20 in order to limit global warming to 2°C. Furthermore, the long-term targets need to be backed up by ambitious national plans for action from 2020 onwards, and an interim package of pre-2020 actions. A successful Paris agreement would make provisions for scaling up finance to support adaptation and mitigation action, especially in developing countries. The current commitment to reach a level of climate finance (public and private) of US$100 billion per year for adaptation and mitigation in developing countries from 2020 onwards has to be translated into firm pledges that ensure that the funds are available in a timely manner.
A fair and ambitious Paris agreement will deliver the message to policy-makers that sustainable development has to be strongly linked with a low-carbon transition. It will also help mobilise private sector finance for investment in developing countries in a way that is consistent with low-carbon development.
By committing countries to low-carbon targets, a successful agreement will also necessitate reforms in domestic economic policies that are necessary for these targets to be realised in an effective manner. These include minimising public support for high-carbon activities, introducing carbon taxes that will contribute to climate finance and supporting investment in clean technologies.
By all these means, a strong Paris agreement is expected to drive economies towards development pathways supported by low-carbon technologies. However, a weak agreement or
The impact of climate change on the achievement of the post-2015 SDGs14
Chap
ter 3
no agreement at all would put the 2°C target21 in jeopardy and, because it would also result in a failure to implement the sustainable green growth policies that go with the agreement, it would risk taking the world to the SSP3 scenario that was described above.

The impact of climate change on the achievement of the post-2015 SDGs 15
Chapter 4
4. Global and regional trends
4.1 Overview
This section presents the findings from the analysis and review (see Annex) carried out to consider the implications of the high- and low-ambition climate agreement scenarios on achievement of the SDGs at the global and regional scales.
There has been a lot of work by the scientific community to quantify the RCPs and SSPs in terms of climate and economic impacts. Detailed projections from the Organisation for Economic Co-operation and Development (OECD), International Institute for Applied Systems Analysis (IIASA) and others are available and have been used in this study to derive links between different climate scenarios and the SDGs. The initial analysis has been conducted at the global scale with some regional specificity, using the 17 draft SDGs proposed in the OWG outcome document (19 July 2014).22 A description of the analytical work involved in making the links between different climate agreement scenarios and the SDGs is provided in the Annex.
The findings from the global review suggest that a high-ambition climate agreement is most crucial to achieving the draft SDGs relating to poverty (SDG 1), inequality (SDG 10), climate change (SDG 13) and global partnerships for sustainable development (SDG 17). Table 2 provides an overview of the risk of not achieving each SDG associated with the low-ambition and the high-ambition agreements.
4.2 Global and regional implications for the SDGs
SDG1: End poverty in all its forms everywhereSDG 1 is to eradicate extreme poverty for all people everywhere, currently measured as people living on less than US$1.25 a day. The pathway from a high-ambition agreement to poverty reduction we have considered here is through a higher level of growth in gross domestic product (GDP) per capita, which results in a greater reduction in poverty. Estimates have been made of this relationship. As a rule, the impacts of growth on poverty depend on how pro-poor the growth is. If growth policies exacerbate inequality, the growth may not reduce poverty by much, or at all. Some studies based on World Bank data show that, while the poverty ‘elasticity’ of growth is two on average, and four in countries with an income Gini coefficient of 0.3 and lower, it is zero in countries with a Gini coefficient of 0.6 and higher.23, 24 Estimates in this study of the impacts of different climate agreement scenarios on poverty are based on this relationship to estimate the change in poverty by 2030 for East Asia, South Asia, sub-Saharan Africa and Latin America and the Caribbean (LAC). This involved calculating the Gini coefficient for each region and applying the relationship between the Gini coefficient and poverty elasticity of growth.25
Levels and rates of growth of GDP per capita over the period 2010 to 2030 are slightly higher for the RCP4.5/SSP1 combination (hereafter referred to as the high-ambition agreement scenario) than for the RCP8.5/SSP3 combination (hereafter referred to as the low-ambition agreement scenario).
The resulting estimates of the impacts of different climate agreement scenarios in poverty change, for East Asia, South Asia, sub-Saharan Africa and LAC, by 2030, are given in Table 3. Poverty reductions are greater under the high-ambition agreement. Under the low-ambition

The impact of climate change on the achievement of the post-2015 SDGs16
Chap
ter 4
agreement, poverty levels in 2030 are 80–140% higher for Asia and sub-Saharan Africa and 25% higher for LAC than they are for the high-ambition scenario.
SDG2: End hunger, achieve food security and improved nutrition, and promote sustainable agricultureThe hunger goal includes targets for ending all forms of malnutrition, ensuring sustainable food production and doubling the agricultural productivity of small-scale producers.
Under a changing climate, food insecurity due to increased risk of crop failure and declining agricultural yields associated with drought-related water shortage are expected to severely impact countries and communities highly dependent on agriculture.
Table 2. Risk of failure to achieve the SDGs by 2030, globally (see explanation of key in Annex)
Sustainable Development Goals Risk Con�denceHigh-ambition Low-ambition
Poverty
Hunger
Health
Education
Gender equality
Water and sanitation
Energy
Economic growth
Resilient infrastructure
Inequality
Sustainable cities
Consumption and production
Combatting climate change
Marine resources
Terrestrial ecosystems
Peaceful and inclusive societies
Global partnership for sustainable development
SDG 1
SDG 2
SDG 3
SDG 4
SDG 5
SDG 6
SDG 7
SDG 8
SDG 9
SDG 10
SDG 11
SDG 12
SDG 13
SDG 14
SDG 15
SDG 16
SDG 17
Very high risk of failure to achieve the SDG
High risk of failure to achieve the SDG
Medium risk of failure to achieve the SDG
Low risk of failure to achieve the SDG
Very low risk of failure to achieve the SDG
High con�dence
Medium con�dence
Low con�dence

The impact of climate change on the achievement of the post-2015 SDGs 174. Global and regional trends
Chapter 4
Table 3. Number of people in poverty in 2010 and projected numbers for 2030 under a high- and low-ambition climate agreement
Region Number of people in poverty (millions)
2010 High-ambition 2030
Low-ambition 2030
East Asia 208.0 8.0 15.0
South Asia 473.0 11.0 27.0
Sub-Saharan Africa 386.0 69.0 119.0
LAC 28.0 12.0 15.0
Source: Poverty data are from World Development Indicators (www.worldbank.org) and measured at US$1.25 per day. GDP growth projections are from OECD (www.oecd.org). Note that in both the high- and low-ambition agreement scenarios there is projected to be a substantial decline in the number of people in poverty, with greatest reductions for the high-ambition agreement scenario. Scenarios from SSP Database, 2012–2015. https://tntcat.iiasa.ac.at/SspDb
Under a low-ambition scenario, access to sufficient food is not guaranteed and targets on eliminating malnutrition might not be met. One factor is that low growth and limited employment opportunities in SSP3 will result in protectionist tendencies that may be reflected in further restrictions to international trade (in a de-globalised world), including agricultural markets. Policies oriented towards national security, including barriers to trade, would not ensure the proper functioning of food commodity markets. This, combined with lower investment in improved technologies, is expected to obstruct increases in agricultural productivity. In contrast, a high-ambition scenario associated with rapid technology development and enhanced agricultural research is expected to increase agricultural productive capacity in developing countries and raise the incomes of small-scale food producers. Yield-enhancing technologies for land and resilient agricultural practices could increase food security. Higher investments and policies that secure the proper functioning of agricultural markets could ensure access to sufficient food for all poor and vulnerable people. Adaptation investment can also make a difference to reducing loss of crops from increased climate extremes such as floods and storms and to support more sustainable, climate smart, agricultural practices.
SDG3: Ensure healthy lives and promote well-being for all at all agesThe health goal includes, among others, targets for the reduction of the global maternal mortality ratio to less than 70 maternal deaths per 100,000 live births, for ending epidemics such as HIV/AIDS, tuberculosis and malaria, and for halving global deaths and injuries from road traffic accidents (by 2020).
The health-related impacts of climate change by 2030 are not expected to vary much between the scenarios leading to a 2°C and a 3–5°C temperature rise by 2100. This is because the physical impacts of climate change diverge more significantly after 2030 for the two scenarios.26 Health impacts include increased cases of malnutrition, diarrheal disease and malaria. In addition, extreme weather events could cause more flood-related deaths and injuries, whilst heat-related mortality and declining work productivity (e.g. due to dehydration) are expected to rise.27 Groups that are particularly at risk include: agricultural and construction workers, as well as children, homeless people, the elderly, and women, who have to walk long hours to collect water and firewood.
A low-ambition scenario linked with low investments in technology development and a slowdown of economic growth could lead to unmet targets for reduced mortality and

The impact of climate change on the achievement of the post-2015 SDGs18
Chap
ter 4
elimination of epidemic diseases. Reduced health financing associated with reduced access to affordable essential medicines and vaccines, along with lack of early warning systems in developing countries, could cause increased risk of injury and disease-related losses. A high-ambition scenario followed by higher levels of income and GDP per capita along with higher health spending per capita and changes in perceptions and policies, would be likely to increase life expectancy at birth. Further, providing access to modern energy services, which is a key element of mitigation finance, and associated improvements in air quality due to decarbonisation, will also contribute to achieving the health SDG by reducing indoor and outdoor air pollution in homes and communities that use traditional biomass. Rapid technological change and increased health financing are expected to reduce the number of deaths from illnesses by supporting research and development of vaccines. For the more vulnerable countries, an ambitious climate commitment would support prioritisation of national adaptation measures, including development of early warning systems that would minimise loss of life from weather-related disasters.
SDG4: Ensure inclusive and equitable quality education and promote life-long learning opportunities for allThe goal for education includes targets to ensure access to free, equitable and quality primary and secondary education for all girls and boys, ensure all students develop skills needed to promote sustainable development, and ensure that x% (yet to be defined) of adults achieve literacy and numeracy.
Physical impacts of climate change, such as more frequent flooding events and other natural disasters, could cause damages in school and transportation infrastructure, while leading to an increase in forced family displacement.
Higher levels of poverty associated with a low-ambition scenario put extra pressure on children, especially in developing countries, to pull out of school and engage in paid employment. The number of skilled people for employment would not increase substantially due to a lack of investment in mitigation technologies, the underpinning research and development and the education system. Without education one is less likely to escape from the poverty cycle. Conversely, a high-ambition scenario with greater investment in education would ensure development of skills for employment and reduced levels of illiteracy. This would subsequently increase the earning potential, and contribute to future GDP growth. Furthermore, education is associated with decreased fertility across populations, paving the way to gender equality. Rapid economic growth in low-income countries is associated with fewer people living below the poverty line.28 This, along with greater availability of food and water (see SDGs 2 and 6), reduced infrastructure damages and less forced migration due to investment in adaptation could increase the number of children able to attend school. Finally, mitigation resources that focus on achieving low greenhouse gas emissions trajectories are expected to provide energy access for the poor and help to build the environment needed to achieve the education SDG; for example, by bringing lighting to more homes to enable children to read and do their homework.
SDG5: Achieve gender equality and empower all women and girlsThe goal for gender equality includes targets on elimination of all forms of discrimination and violence against women and ensuring their participation in leadership and decision-making positions.
Women and children are 14 times more likely to die than men during disasters,29 and women in developing countries are especially vulnerable. The ratio of women affected or killed by climate-related disasters is already higher in some developing countries than in developed

The impact of climate change on the achievement of the post-2015 SDGs 194. Global and regional trends
Chapter 4
countries.30 Disasters exacerbate existing vulnerabilities and gender inequalities; for instance women are subject to increased violence while displaced31 as a result of disrupted protection from their families and society.
Under a low-ambition scenario, slow economic growth and high poverty levels could reduce women’s chances of equality and empowerment. Weak social protection policies associated with this scenario are not expected to ensure equal rights and access to economic resources for women. There is already evidence in the literature32 showing that as countries get richer, their societies become more gender equal. A high-ambition scenario with rapid economic growth and more investments in high levels of education could lead to reduced gender inequalities. Investment in mitigation could create greater gender balance in employment opportunities compared to traditional male dominated employment associated with fossil fuel extraction.
Several other SDGs have gendered impacts. For example, reduced gender disparities in education could give women the opportunity to seek employment, become independent and participate in leadership and decision-making in all aspects of life. In addition, an increased level of education in the female population is associated with women’s increased decision-making agency in family planning.33 The associated decline in average fertility slows the rate of population growth and therefore pressure on resources.34 Water and sanitation also comprises some highly gendered development issues, such as water collection, access to latrines and clean water, closely linked to female livelihoods, health, girls’ schooling and violence against women and girls.35
SDG6: Ensure availability and sustainable management of water and sanitation for allThe water and sanitation goal includes targets to provide access to safe drinking water for all, adequate sanitation for all, increased water quality and improved water-use efficiency.
Water stress is a function of water availability, demand and water quality. Overall water availability to 2030 under the two scenarios is unlikely to be significantly different but policy responses under the high-ambition scenario are more likely to improve water governance than those for the low-ambition scenario. Improved water governance, due to policies favouring adaptation and long-term thinking, could lead to better management of catchments, improved water quality and enhanced ecosystems services to protect against climate variability and extremes. Improved water technologies and greater investment (domestic, overseas development aid and private) under the high-ambition scenario could reduce demand and improve water efficiency and sanitation technologies. Annual global climate change adaptation costs for providing sufficient water to meet future demand for public water supply and industrial demand by 2050 are expected to be US$12 billion, with 83–90% of those allocated in developing countries. The highest costs are in sub-Saharan Africa (16% of the global total). Increased adaptation finance under the high-ambition scenario can help to meet the financing gap to 2030. Mitigation actions may influence the water footprint of energy generation and the development of new technologies to meet mitigation needs brings opportunities to reduce water demand in the energy sector and in industrial processes.
SDG7: Ensure access to affordable, reliable, sustainable and modern energy for allThe target for energy is multi-dimensional, including a substantial increase in the share of renewable energy in the global energy mix by 2030, a doubling in the global rate of improvement in energy efficiency by 2030 and universal access to affordable, reliable and modern energy services. The aspect linked most closely to the climate agreement is the share of renewable energy, which is considered further below.

The impact of climate change on the achievement of the post-2015 SDGs20
Chap
ter 4
An Integrated Assessment Model (the Global Change Assessment Model, GCAM36) was run to compare relative percentages of non-fossil energy shares under the two agreement scenarios. Under the low-ambition scenario, little progress is made in reducing fossil fuel dependency, which results in virtually no increase in the share of non-fossil energy by 2030. Local environmental concerns are not addressed, whilst the usage of local energy resources and slow technological change in the energy sector keep emissions at relatively high levels. Countries focus on achieving energy goals within their own region, which means that international trade, including trade in energy resource markets, is severely restricted. The high-ambition scenario, associated with rapid technology development, investment in non-fossil energy and reduction in perverse subsidies, and a high level of awareness regarding environmental degradation, leads to increased share of non-fossil energy from 13% to around 21% by 2030, which is expected to meet the SDG target of increasing “substantially the share of renewable energy in the global energy mix by 2030”. Technological change directed towards environmentally friendly processes, including clean energy technologies, leads to improved energy efficiency and increased shares of renewable energy. Enhanced global trade between regions would potentially supply developing countries with modern and sustainable energy services for all. Higher energy investments promote new infrastructure along with clean energy research and technologies.
An important consideration related to energy shifts is the regional distribution of cost. This distribution of costs will depend on the way in which mitigation programmes are financed and in particular how much support is given to developing countries to make the shift to low-carbon technologies.
SDG8: Promote sustained, inclusive and sustainable economic growth, full and productive employment and decent work for all SDG10: Reduce inequality within and among countriesThe goals for sustained economic growth and inequality reduction include targets for the achievement of higher levels of productivity, the provision of decent work for all, the protection of labour rights, the strengthening of domestic financial institutions, the achievement of income growth of the bottom 40% of the population at a rate higher than the national average, and the enhanced representation of developing countries in decision-making in global international institutions.
SDGs 8 and 10 are closely linked to the level of ambition of the climate agreement and a high-ambition agreement is more likely to support their achievement. Under the high-ambition agreement, not only do the selected regions have higher growth, they also demonstrate a closing of the gap with the developed regions such as Europe and the USA, compared to the low-ambition agreement. Note, however, this may not imply a closing of the gap for all countries in the region. In addition, the high climate ambition policies that underlie green growth can be designed to be pro-poor and thus ensure that at the very least they do not exacerbate inequality.
The United Nations Environment Programme (UNEP) Green Economy report37 showed the potential for pro-poor job creation as a significant co-benefit of the transition to the green economy in sub-Saharan Africa. Thus decarbonisation of the economy both promotes decent work opportunities in an equitable manner, also contributing to poverty eradication.38
Table 4 shows the per-capita GDP of three regions (developing Asia, LAC, and the Middle East and Africa) relative to the OECD 90 countries. Compared to 2010, both scenarios envisage some closing of the gap with the OECD for these regions, but the closure is higher under the high-ambition scenario. The difference is greatest for developing Asia, followed by LAC and last

The impact of climate change on the achievement of the post-2015 SDGs 214. Global and regional trends
Chapter 4
is the Middle East and Africa. The high-ambition agreement, associated with rapid economic growth in low-income countries and an open, globalised economy, supports greater investments in technology development, higher levels of international trade and cooperation, points towards reduced inequalities and promotes sustainable economic growth.
SDG9: Build resilient infrastructure, promote inclusive and sustainable industrialisation and foster innovation SDG11: Make cities and human settlements inclusive, safe, resilient and sustainableThese two goals include targets for the development of reliable and resilient infrastructure, the promotion of sustainable industrialisation, the enhancement of scientific research and the provision of sustainable transport systems and green and public spaces for all.
There is evidence of links between SDG 9 (resilient infrastructure, inclusive and sustainable industrialisation and innovation) and SDG 11 (inclusive, safe, resilient and sustainable cities and settlements) and the climate agreement. Relevant sources of information include the detailed descriptions of SSP1 and SSP3, the data and discussion in the New Climate Economy Report39 and the Green Investment Report40 on cities and infrastructure. Both reports, and especially the former, make the case that the development path consistent with SSP1 requires major new investments in infrastructure (around US$90 trillion in the next 15 years) to support urbanisation, improve agricultural productivity and meet the energy needs of a growing world economy. If this investment can be accompanied by the right policies, then at least half the reductions in emissions of greenhouse gases for a 2°C track will come at no additional cost. That figure could rise to over 90% with “strong and broad implementation, rapid learning and sharing of best practice” in the main policy areas.41 Thus, one can argue that: (a) SDG 9 is strongly tied to sound climate policies and there are strong synergies between the two; and (b) the direct costs of low-carbon development are small and outweighed by the indirect benefits of green growth.
SDG12: Ensure sustainable consumption and production patternsThe sustainable consumption and production goal includes targets for the sustainable management and usage of natural resources, for halving per capita global food waste, and for the substantial reduction of waste generation.
The high-ambition agreement is associated with low material growth, less energy-intensive consumption and more sustainable production, in part due to reductions in resource intensity to meet decarbonisation targets. Natural resource management is therefore likely to be more efficient under the high-ambition than the low-ambition scenario. The high-ambition agreement is likely to foster policies for rationalising inefficient fossil fuel subsidies that encourage wasteful consumption, whereas there is little incentive to restructure taxation
Table 4. GDP per capita in different regions as a percentage of that of the OECD
Region 2010 2030
High-ambition Low-ambition
Asia (excluding Japan) (%) 15.0 35.0 29.0
LAC (%) 30.0 40.0 36.0
Middle East and Africa (%) 13.0 18.0 15.0
Source: Table developed for this document; data sources as Table 3, above.

The impact of climate change on the achievement of the post-2015 SDGs22
Chap
ter 4
of phase out subsidies under the low-ambition agreement. The high-ambition agreement is likely to lead to technology innovations for moving towards more sustainable patterns of consumption and production.
SDG13: Take urgent action to combat climate change and its impactsThis goal includes targets for the strengthening of resilience to climate-related disasters, for integration of climate change-related policies into national policies, and for increasing population awareness on climate change impact reduction.
Taking urgent action to combat climate change and its impacts relates to both adaptation and mitigation. The UNEP Adaptation Gap Report42 estimates the amount of public finance committed to adaptation to be between US$23–26 billion during the period 2012–2013, 90% of which was invested in developing countries. This is considerably less than the estimated amount needed to meet adaptation needs, which was put at between US$70–100 billion for developing countries in a World Bank study in 2010. Since then, more detailed national estimates indicate that adaptation costs could be considerably higher.43 More recent work on the adaptation gap, which has tried to estimate the costs as a function of different climate scenarios, suggests that there is little difference in adaptation expenditures between the 2°C and 3–5°C scenarios up to 2030. However, by 2050, a low-ambition agreement has very fast rising adaptation costs, and is estimated to cost around US$66 billion/year for the developing world, compared to the US$46 billion/year that is the estimated adaptation cost of a high-ambition agreement. The main issue, however, is that all the estimates of adaptation needs for the current period are above the amount currently allocated, which was around US$23–26 billion in 2012/2013. Therefore, a lot depends on future increases of these adaptation funds, along with the application of mitigation measures that are consistent with sustainable development priorities (i.e. better environmental policies, carbon finance, energy efficiency). Reducing the adaptation gap will increase resilience to climate change and reduce its impacts on the poorest and most vulnerable communities. Adaptation funds will address the increased vulnerability associated with climate change, especially to ensure that those who may fall into poverty or whose level of poverty may increase are prioritised in terms of assistance. Otherwise, there could be an impact on poor and vulnerable communities and this would be much larger after 2030 for the low-ambition climate agreement.
SDG14: Conserve and sustainably use the oceans, seas and marine resources for sustainable development SDG15: Protect, restore and promote sustainable use of terrestrial ecosystems, sustainably manage forests, combat desertification, and halt and reverse land degradation and halt biodiversity lossThe goals for the protection of marine and terrestrial ecosystems include targets for the reduction of marine pollution, the protection and conservation of marine, coastal and mountainous ecosystems, and the reduction and restoration of degraded natural habitat.
According to the Fifth Assessment Report of the IPCC (AR5), the main physical impacts of climate change with reference to marine and terrestrial ecosystems include, among others, coral reef reduction, falls in fishery catch potential at low latitudes, ocean acidification, reduced biodiversity, coastal inundation and habitat loss due to sea level rise, tree mortality and forest loss and risk of habitat loss and species extinction.
Under a high-ambition agreement, large investments would be directed towards environmentally friendly processes, new technologies that could prevent marine pollution from land-based activities, whilst additional funds would be directed towards coral reef and

The impact of climate change on the achievement of the post-2015 SDGs 234. Global and regional trends
Chapter 4
forest restoration and conservation. For example, the Reducing Emissions from Deforestation and forest Degradation (REDD+) mechanisms, a critical element of the climate deal, will bring additional finance for conservation and sustainable management of forests. Such finance combined with matching, stronger conservation policies will help achieve the desired goals. A low-ambition agreement would not be able to meet the targets for protection and sustainable management of ecosystems, as the financial resources would be significantly decreased, and global support is anticipated to be less favourable.
SDG16: Promote peaceful and inclusive societies for sustainable development, provide access to justice for all and build effective, accountable and inclusive institutions at all levels SDG17: Strengthen the means of implementation and revitalise the global partnership for sustainable developmentThese goals include targets for the reduction of all forms of violence, corruption and bribery, for equal access to justice for all, for the mobilisation of additional financial resources for developing countries, for the increase of developing countries exports, and for the enhancement of global partnership and international cooperation on access to science, technology and innovation.
Under the high-ambition agreement, there is likely to be greater investment in human capital and sustainable development driven by greater global collaboration in order to meet the target rates of decarbonisation. This scenario is associated with sustained efforts to achieve gender equality, to ensure access to education for all, along with increased international cooperation and high trade flows. The low-ambition agreement is likely to be associated with limited progress in reducing resource intensity or addressing environmental concerns as the rate of decarbonisation would be substantially lower and therefore there would be less incentive or need to reduce resource intensity. International collaboration is restricted, inequalities at a global level and within countries are high, there is lack of cooperation between governance and institutions, while policies are more security-oriented. The characteristics of the high-ambition agreement scenario are therefore more likely to support the achievement of these SDGs than the low-ambition agreement.
4.3 What does this mean at the national level?
The global and regional findings set the context for deeper analysis of selected SDGs at a country level, presented in the sections that follow. Three case studies are examined, selected so that they represent contrasting economies on different continents, with a spread of vulnerabilities to climate change, and therefore different implications under the two climate agreement scenarios:
y The Caribbean, with specific focus on Dominica and Jamaica, as two contrasting small island developing states (SIDS).
y Pakistan – a middle-income country with very high climate vulnerability. y Uganda – a least developed country (LDC).
The research on these case studies focuses on the following SDGs:
y Poverty (SDG 1). y Gender equality (SDG 5). y Water and sanitation (SDG 6). y Energy (SDG 7).

The impact of climate change on the achievement of the post-2015 SDGs24
Chap
ter 4
The case studies aim to provide specific examples and insights into the nuances and dynamics of responses to the high- and low-ambition climate agreement scenarios and explore the implications for achievement of the selected SDGs.
The countries examined here have made substantial progress towards achieving the MDGs by 2015. Notable improvement over the last decade against poverty and hunger elimination, gender equality etc. has been secured. As the SDGs build on lessons learned from and successes of the MDGs, it is essential to highlight each country’s progress on achievement of the MDGs, aiming to understand how a potential climate agreement might influence attainment of the SDGs.
We selected four SDGs to focus on, given the constraints of this work, which are both sensitive to climate impacts and which underpin sustainable development more broadly. The poverty goal (SDG 1) is the most important of the UN’s goals and one of the biggest threats facing humanity. However, in recent years, progress towards achieving the poverty MDG has been uneven for women, as gender imbalances in employment and education persist, and this is why the gender equality goal (SDG 5) is another important goal to examine. Regarding the water and sanitation goal (SDG 6), access to safe drinking water sources and improved sanitation facilities is a prerequisite to improved health and development. Although the safe drinking water MDG target was one of the first targets to be met, the sanitation target is one of the most off-track targets. It is therefore considered useful to analyse this goal given its linkages to other SDGs. Finally, achievement of the energy goal (SDG 7) is crucial to all dimensions of sustainable development given its strong links with carbon emissions and the climate agreement.
The impact of climate change on the achievement of the post-2015 SDGs 25
Chapter 5
5. Case study: Caribbean countries
5.1 Development context and key challenges
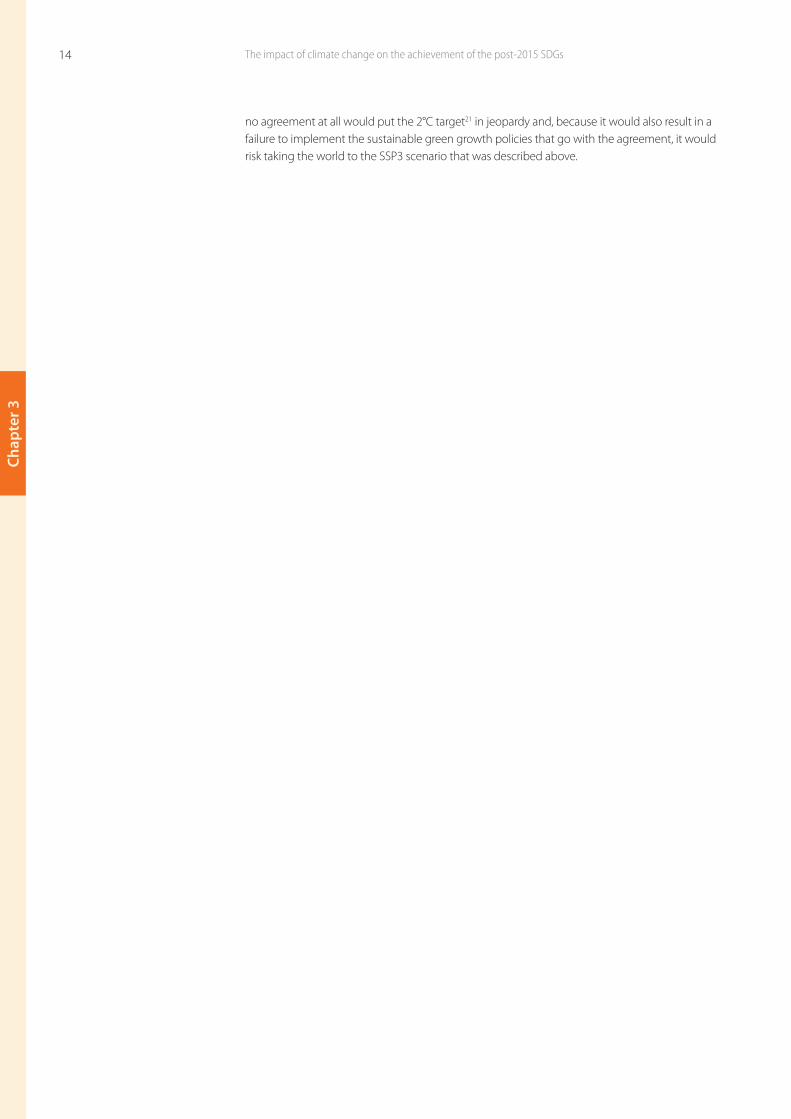
The Caribbean comprises a diverse range of countries, from SIDS with economies that depend mainly on tourism and agriculture, to the larger island of Haiti, and the Dominican Republic, which has a less developed economy. They are a mix of middle- and lower-income countries, with different development challenges. The islands and coastal areas of this region are highly vulnerable to climate variability and change, due to their economic dependence on climate sensitive sectors and exposure to extreme weather events such as hurricanes. Within this research, the two case studies of Dominica and Jamaica are considered to provide examples of the potential implications of the climate agreement for the achievement of selected SDGs in those countries. They have been chosen as they represent differently structured economies, with different climate vulnerabilities, and therefore have different implications under the scenario conditions modelled.
Table 5 provides an overview of the economic characteristics of these countries.
Table 5. Economic characteristics of Jamaica and Dominica
Economic characteristic Jamaica Dominica
GDP composition by sector (2013) 44, 45
y services 64.1% 68.7%
y agriculture 6.5% 15.7%
y industry 29.4% 15.6%
Net inflows in the economy from foreign investors in US$ billions (2013) 0.6 0.2
CO2 emissions in 2010 (metric tonnes per capita) 2.7 1.9
Source: World Bank (www.worldbank.org)
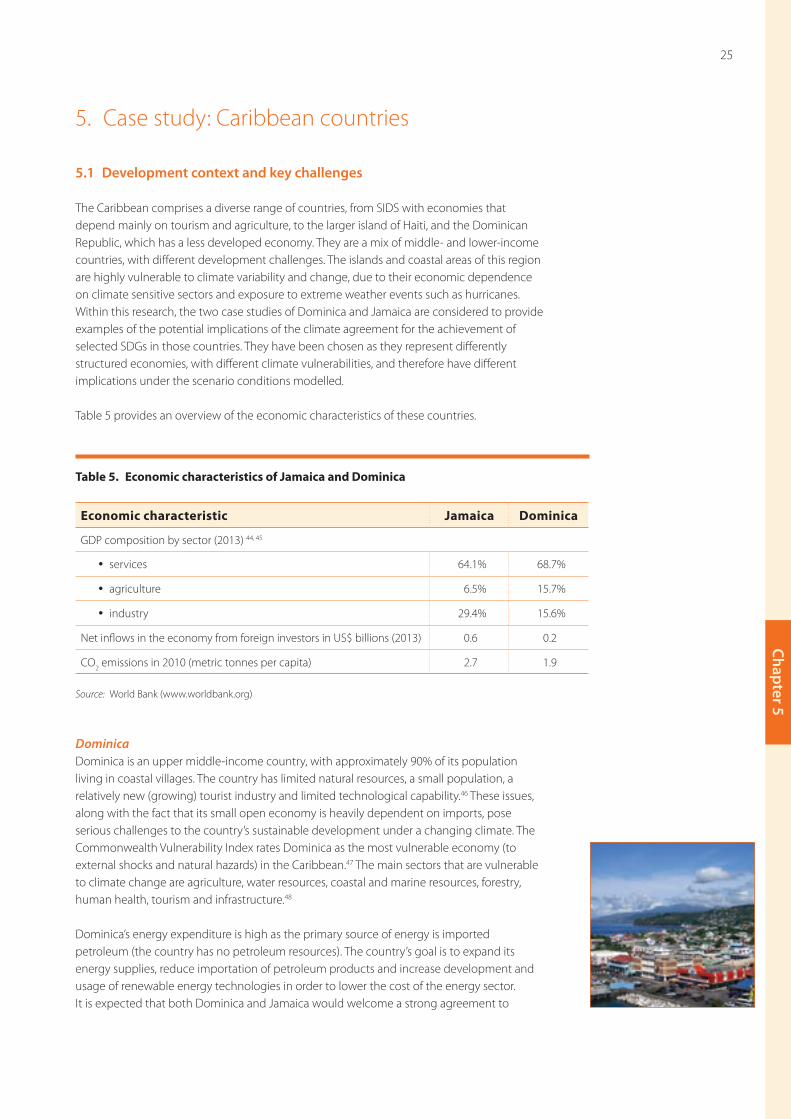
DominicaDominica is an upper middle-income country, with approximately 90% of its population living in coastal villages. The country has limited natural resources, a small population, a relatively new (growing) tourist industry and limited technological capability.46 These issues, along with the fact that its small open economy is heavily dependent on imports, pose serious challenges to the country’s sustainable development under a changing climate. The Commonwealth Vulnerability Index rates Dominica as the most vulnerable economy (to external shocks and natural hazards) in the Caribbean.47 The main sectors that are vulnerable to climate change are agriculture, water resources, coastal and marine resources, forestry, human health, tourism and infrastructure.48
Dominica’s energy expenditure is high as the primary source of energy is imported petroleum (the country has no petroleum resources). The country’s goal is to expand its energy supplies, reduce importation of petroleum products and increase development and usage of renewable energy technologies in order to lower the cost of the energy sector. It is expected that both Dominica and Jamaica would welcome a strong agreement to

The impact of climate change on the achievement of the post-2015 SDGs26
Chap
ter 5
the extent that it would secure the opportunity to access more resources for investment towards a more energy-efficient future that would help them reach their energy targets. Dominica’s geothermal potential is also being explored as part of efforts to reduce petroleum dependency. Its vision is that by reducing energy-sector costs, resources can be directed towards building climate-resilient infrastructure along the coastline, such as sea-defence walls, to reduce the island’s climate vulnerability.49
In summary, development challenges for Dominica include job-creating growth; reduction of public sector debt; reformation of the public service to become cost effective; reduction of poverty; improved effectiveness of public sector investments in upgrading economic infrastructure; upgraded regulation and oversight of energy, water, transportation (seaport and airport) and telecommunication services providers; and protection of the natural environment.
JamaicaJamaica is also an upper middle-income country, which has a predominantly urban economy mainly dependent on the services sector (including tourism). In recent years, the country has faced several development challenges including very small (or even negative) rates of economic growth, low productivity in most sectors, increasing poverty and high unemployment rates.50 The main sectors depending upon natural resources, which are under threat from climate change, are water, tourism, agriculture, fisheries and forestry. The country’s vision for 203051 includes a plan to address the macroeconomic challenges it faces, by undertaking tax reforms, strengthening the legislative and institutional structure of the financial system and eliminating fiscal deficits.
The development challenges for Jamaica include debt reduction, job-creating growth, improving productivity, reinforcing international competitiveness, reducing vulnerability to natural hazards, protecting social gains and achieving economic sustainability.
5.2 Current mitigation and adaptation policies
Climate change poses serious threats to the Caribbean islands’ economies, natural resources and infrastructure. Sea level rise and coastal erosion are already apparent, along with extreme weather events such as long periods of drought. Coral reef degradation is expected to affect the tourism industry since corals are one of the main attractions for millions of tourists52 visiting these islands, while ocean acidification poses threats to food security and the economy.53 The mountainous terrain of these islands limits their options for infrastructure development and economic activities to within the coastal zones, which puts them in a vulnerable position in terms of the physical impacts of climate change. The severity of those impacts is expected to become worse in the following years under a changing climate if no action is taken.
The Caribbean Community Climate Change Centre (CCCCC) coordinates the region’s climate change response. Caribbean island states are often dependent on imported fossil fuel as the primary energy source and this is particularly the case for countries with large-scale tourism and construction of hotels, including Jamaica. There is potential for Caribbean states to reduce their reliance on fossil fuels by growing the domestic renewables sector and to contribute to mitigation through energy efficiency improvements.54 Ambitious SDGs will support climate compatible development and will therefore support the region’s mitigation efforts. While carbon emissions from Caribbean currently represent a small proportion of global emissions (0.31% in 201055), securing climate compatible development in the region is

The impact of climate change on the achievement of the post-2015 SDGs 275. Case study: Caribbean countries
Chapter 5
important to ensuring that emissions do not grow in the future and therefore will contribute in a small way to achieving a high-ambition climate agreement to limit global warming to 2°C by 2100. Dominica’s Low-Carbon Climate Resilient Development Strategy,56 includes the following mitigation and adaptation policies, among others:
y agricultural diversification and improvement of practices to promote resilience of ecosystems and food security
y improved risk insurance for small-scale farmers and financial institutions supporting them y promoting a carbon-neutral status and increased usage of renewable energy y increasing agroforestry farms by 50% to enhance environmental resilience y improving water management and integrated coastal zone management y improving fisheries infrastructure to meet international requirements and facilitate trade y enhancing marine ecosystem resilience y climate proofing and reducing energy costs of tourism infrastructure y supporting business access to the Green Economy; educating and training the workforce
to promote the country’s green transition y establishing climate change and disaster risk reduction financing mechanisms.
Jamaica’s current mitigation and adaptation mechanisms include, among others:
y early warning systems for evacuating flood-prone areas y rainwater collection for usage when public supply fails y real-time weather forecasting y improved water-use efficiency and upgraded water supply networks y development of planning and policy programmes by the Sustainable Development Unit of
the Planning Institute of Jamaica y capacity-building initiatives by national and local institutions, aiming to improve awareness
and mitigation capacity.
Jamaica is due to publish a new Climate Change Policy Framework and Action Plan, which has been developed since 2012, aiming to support the country’s National Development Plan goals, Vision 2030 Jamaica. Although Jamaica is committed to tackling climate change, its limited financial resources and technological advances constrain the application of adaptation and mitigation measures across most sectors.57
5.3 Implications of a climate agreement for national development policies and trajectories
Both Dominica and Jamaica have ambitious plans for sustainable development over the next 15 years. Jamaica aims to increase its per capita gross domestic product in purchasing power parity (PPP GDP) to US$34,300 by 2030, a fivefold increase over the figure in 2010, implying an annual growth rate of 8%. 58 Other key indicator targets for development over the period to 2030 are an increase in life expectancy at birth from 72 to 76 years, a reduction in poverty59 from 17.6% to below 10%, based on the National Poverty Line (NPL), an increase in the Global Competitiveness Index on Infrastructure of 30%, an increase in energy from renewable sources from 4.8% to 20%, a 2.5-fold increase in the energy efficiency index (i.e. amount of output per unit of energy) and a decline in greenhouse gas emissions of 30%.
Such detailed targets are not available for Dominica. If current trends continue, per capita PPP GDP in 2030 will rise to US$24,100 from the 2010 level of US$10,060 (an annual increase of around 4%). As indicated in Section 5.2, such growth is intended to be consistent with
The impact of climate change on the achievement of the post-2015 SDGs28
Chap
ter 5
making the country climate resilient, by emphasising renewable energy expansion and low-carbon tourism development and by implementing integrated coastal zone management plans that account for climate impacts in these critical regions.
The impact of the climate agreement on these goals in the two Caribbean countries would be indirect. Both have small economies, with low population and low emissions compared to other countries. However, their energy expenditure is high, as the primary source of energy for both Jamaica and Dominica is imported petroleum. Therefore, both countries are keen on expanding their domestic energy supplies, and increasing the use of renewable energy technologies to lower the cost of the energy sector. It is expected that both countries would welcome a strong agreement to the extent that it would secure the opportunity to access more resources for investment towards a more sustainable energy-efficient future that would help them reach their energy targets.60 The Caribbean Community (CARICOM) climate negotiators have recently commented that they want to see a strong climate agreement secured, with high decarbonisation targets for rich countries and a commitment to financing for poor countries. It has been stated that “while the Lima talks are the bridge to the agreement in 2015, CARICOM and other SIDS have already drawn a red line that unless the commitments with respect to reducing greenhouse gases are of a significant and meaningful amount, they will not accept the agreement”. The negotiator further mentioned that “under the current round of negotiations, all countries will have to commit to reducing greenhouse gas emissions”. 61
Tourism is an important part of the region’s economy. By promoting themselves as green locations, these countries can enhance their attractiveness while also reducing operating costs by reducing their carbon footprint and showing their commitment to mitigation.
Another area where the Caribbean countries will benefit from a strong agreement is the forestry sector. Deforestation is responsible for some 20% of global emissions. Several CARICOM members have significant forest cover, and the global response to a strong climate agreement is expected to include measures for the protection of these forests and reduction of deforestation and its emissions. The mountainous terrain of these islands limits their options for infrastructure development and economic activities to within the coastal zones, which puts them in a vulnerable position in terms of the physical impacts of climate change.
5.4 Implications for the achievement of the SDGs: analysis and findings
SDG1: End poverty in all its forms everywhereBasic economic data on Dominica and Jamaica are given in Table 6. The poverty situation in the two countries is quite different. In Jamaica, 17.6% of the population was considered below the NPL62 in 2010. Poverty there has declined with real per capita income growth. NPL poverty fell from 18.7% to 17.6% between 2000 and 2010, with an increase in PPP GDP (2011 PPP Dollars) from US$6,500 to US$6,800 during that period, implying an elasticity of 1.66 of poverty with respect to per capita GDP growth. This is not an atypical elasticity for countries with Jamaica’s level of inequality.63
In the period to 2030, the OECD projections are for GDP per capita to rise to US$18,067 under SSP1 and to US$15,530 under SSP3 in Jamaica. These figures are well below Jamaica’s goal of US$34,300 by that date. Of course, if the national goal can be attained in a sustainable way then so much the better, but international green growth experts consider the goal to be too optimistic and suggest the range given above, with corresponding population projections of 2.8 million under SSP1 and 3.2 million under SSP3. Assuming this elasticity to hold, we

The impact of climate change on the achievement of the post-2015 SDGs 295. Case study: Caribbean countries
Chapter 5
Table 6. Poverty indicators for Jamaica and Dominica
Poverty indicator Jamaica Dominica
Poverty headcount ratio at national poverty lines (% of population) 17.6 (2010) 28.8 (2009)
Cash surplus/deficit (% of GDP) –4.0 (2012) –11.1 (2012)
Exports of goods and services (% of GDP) 30.4 (2012) 32.8 (2013)
GDP growth (annual %) 1.3 (2013) 6.0 (2013)
GNI per capita, PPP (current international $) 8,490.0 (2013) 10,060.0 (2013)
Industry, value added (% of GDP) 20.8 (2012) 14.0 (2013)
Services, etc., value added (% of GDP) 72.5 (2012) 68.8 (2013)
High-technology exports (% of manufactured exports) 0.6 (2012) 0.0 (2010)
Source: World Bank (www.worldbank.org) and CariBank (www.caribank.org)
estimate that under a high-ambition scenario the poverty head count will decline from 490,000 in 2015 to 180,000 in 2030 if SSP1 is realised. If, on the other hand, a low-ambition scenario is realised then the growth in GDP is less and that of population slightly more and poverty only declines to 400,000.
In the case of Dominica, we are dealing with a small country but one where the CariBank has estimated that of the 72,000 inhabitants (28.8%) were in poverty in 2009.64 The same report also indicates a fall in this percentage, from 39% in 2003, indicating an elasticity of poverty with respect to per capita GDP growth of 0.86. In the period to 2030, the OECD projections are for GDP per capita to rise to US$29,581 under SSP1 and to US$25,003 under SSP3.65 The corresponding population projections are 79,000 under SSP1 and 87,000 under SSP3. Hence if SSP1 is realised under a high-ambition scenario, poverty will decline from an estimated 20,700 in 2015 to 10,200 in 2030. If, on the other hand, a low-ambition scenario is realised then the growth in GDP is less and that of population slightly more and poverty only declines to 16,600.
Of course, poverty is not only impacted by GDP growth. Among other factors, an important one is through extreme events displacing people and making vulnerable groups fall into poverty if they were not already there. The number and frequency of such events is increasing66 and the difference between the high- and low-ambition scenarios is the availability of public resources to reduce the risk of damages through preventive actions and to provide support to affected communities after the event. In the high-ambition case, countries can expect enough finance to be available to ensure that at least the minimum relief is available and no one is left in extreme poverty. In a low-ambition scenario, it is unlikely that this can be guaranteed. Overall, a high-ambition agreement will be key to ensure that development and socioeconomic gains over the next 15 years are resilient to natural disasters and other shocks.
In Jamaica and Dominica, the number of people affected and economic damages suffered per year over the last 20 years are given in Table 7.
A significant number of people are affected by natural extreme events in Jamaica – it is equal to around one-third of the total number in poverty. Furthermore, this number is likely to go up with climate change if more is not done to protect people from such events. Likewise, the

The impact of climate change on the achievement of the post-2015 SDGs30
Chap
ter 5
high costs of losses (more than US$2,200 per person affected) indicate that the risks of falling below or further below the poverty line will increase for these people. In the case of Dominica the impacts are smaller – those affected number only around 700 in an average year, which is around 3% of the estimated poor population. At the same time losses per person, at US$16,100, are higher than in Jamaica and point to people being potentially placed at high risk of increased poverty.
SDG5: Achieve gender equality and empower all women and girls Table 8 provides details on selected gender equality indicators for Dominica and Jamaica.
The gender equality goal includes, among others, the target to “end all forms of discrimination against all women and girls everywhere” and the target to “ensure women’s full and effective participation and equal opportunities for leadership at all levels of decision-making in political, economic, and public life”. Dominica’s MDGs report (2012) suggests that the country is mainly working towards achieving gender equality in education. Although there is some progress regarding women’s taking part in decision-making as parliament members, cultural reasons are discouraging women’s involvement in politics. The lack of available gender-disaggregated data poses limitations in tracking further progress of gender indicators.67 According to the World Bank database, the proportion of seats held by women in national
Table 7. Average losses resulting from extreme events (per annum)
Country Average number of deaths
Average number of affected people
Losses (US$ million)
Dominica 0.3 683.0 11.0
Jamaica 15.0 164,781.0 366.0
Sources: Jamaica: http://www.desinventar.net/DesInventar/ Dominica: http://www.emdat.be/country_profile/index.html
Table 8. Gender equality indicators for Jamaica and Dominica
Gender equality indicator Jamaica Dominica
Adolescent fertility rate (number of births per 1,000 women aged 15–19) 70.1 (2012) –
Children in employment, female (% of female children ages 7–14) 8.3 (2005) –
Total number of female primary-school-age children who are not enrolled – 93.0 (2010)
Literacy rate (% of females ages 15–24 who can both read and write) 98.6 (2012) –
Unemployment, female (% of female labour force ) (modelled estimate) 19.5 (2013) –
Fertility rate, total (births per woman) 2.3 (2012) –
Maternal mortality ratio (modelled estimate, per 100,000 live births) 80.0 (2013) –
Proportion of seats held by women in national parliaments (%) 12.7 (2014) 12.9 (2014)
Ratio of girls to boys in primary and secondary education (%) – 102.6 (2011)
Ratio of female to male tertiary enrolment (%) 205.0 (2012) –
Source: World Bank (www.worldbank.org)
The impact of climate change on the achievement of the post-2015 SDGs 315. Case study: Caribbean countries
Chapter 5
parliaments increased from 12.9% (2005) to 18.8% (2008) but then followed a declining trend to 12.9% (2014). So overall there has been no progress in increasing the representation of women in the national parliament since 2005. Further, the ratio of female-to-male primary enrolment decreased from 100% (2005) to 97.4% (2012). The ratio of female to male secondary enrolment dropped from 108.2% (2005) to 107.1% (2011).
In contrast, a report reviewing Jamaica’s progress towards achieving the MDGs68 indicates that the gender target was achieved. The report indicates that there are no education inequalities, the country adopted a National Policy on Gender Equality (2011) and has a female prime minister. Nevertheless, more measures need to be promoted to ensure that women’s representation in the national parliament and on company boards increases. The proportion of seats held by women in national parliaments increased from 11.7% (2005) to 12.7% (2014). In addition, the ratio of female-to-male secondary enrolment increased from 103.6% (2005) to 105.6% (2011). The ratio of female to male tertiary enrolment decreased from 224% (2008) to 205% (2012). Further, the share of women employed in the non-agricultural sector (% of total non-agricultural employment) increased from 45.6% (2005) to 48.2% (2008).
A strong climate agreement, along with Jamaica’s policies on gender equality, could increase the available resources to women for enterprise and support plans that promote further progress on gender equality. Promotion of the empowerment of women is expected by undertaking policy reforms that give women equal rights to economic and natural resources and by eliminating gender disparities in education.
A potential shift of domestic resources towards climate change mitigation and adaptation measures could negatively impact the budget allocation for women’s empowerment and gender equality programmes. It is very important to integrate principles that promote women’s empowerment into adaptation and mitigation policies, by taking into consideration the gendered impacts of climate change and making sure their varying needs and priorities are supported.
Historically, women have had a high involvement in farming and agricultural activities, and their skills and knowledge around sustainable management of land could actively contribute to improve adaptation and mitigation plans,69 especially when new technologies are too expensive to adopt.
A high proportion of women are employed in the tourism sector in the Caribbean (55% according to the International Labour Organization (ILO) Laborsta Database as cited in UNWTO and UN Women70), hence climate impacts on tourism will disproportionately affect women. The climate impacts most likely to affect tourism in the Caribbean are short-term impacts, such as coral degradation, hence these may be realised before 2030.
In addition, because the allocation of economic resources is influenced by gender, women are having more limited access to survival and recovery resources for their families, which increases their vulnerability to natural disasters.71 For example, often female-headed households have poor-quality and severely overcrowded living conditions, without basic amenities. This type of housing is more likely to be affected by natural disasters.72
Climate change financing, policy decisions and allocation of resources can therefore strengthen women’s participation across all sectors of society by increasing their access to capital and by creating new opportunities to address gender inequalities, resulting in stronger economies that are not only tackling climate change but also are closer to achieving the gender SDG.

The impact of climate change on the achievement of the post-2015 SDGs32
Chap
ter 5
SDG6: Ensure availability and sustainable management of water and sanitation for allTable 9 provides information on water and sanitation indicators for Jamaica and Dominica.
The main stakeholders in Jamaica’s water sector include forest managers, farmers, water abstractors, industries, households and tourism. Whilst its water resources authority is not able to provide complete financial support for adaptation projects, increased adaptation finance under the high-ambition scenario would assist in the development of strategies that would reduce pressure on water demand (e.g. waste water recycling).73
A strong agreement followed by public–private partnerships would promote the development of water supply and sanitation infrastructure, while minimising system losses due to infrastructure leakages and inefficient irrigation practices. Increased storage capacity would provide for adequate water supply during the dry season. In addition, technological advances and a commitment to mitigation action would reduce the extensive usage of fertilisers by the agricultural sector, which not only is a major source of emissions, but is also responsible for poor water quality in many regions.
Sustainable allocation of resources and long-termism in policy decision-making are expected to strengthen water supply, storage and treatment infrastructure, allowing for more efficient management of the country’s water resources. Increased coverage of sanitation facilities, especially in rural zones, and proper maintenance of those facilities would reduce environmental contamination. New wastewater technologies will allow for energy efficient and environmentally friendly recycling of industrial water and promote water conservation. The wise management of water resources offers economic opportunities for the private sector as there are intimate linkages between the water and other sectors (e.g. improved water management leads to increased agricultural production and food security and efficient use of energy associated with water distribution).
For Dominica, a strong climate agreement would promote improved quality of services from water providers and policies that ensure the long-term sustainability of water resources. By controlling land-based activities and introducing legislation for water resources protection, improving infrastructure, and controlling water pollution, the country would be able to improve its water services.
SDG7: Ensure access to affordable, reliable, sustainable, and modern energy for all Basic energy data on Dominica and Jamaica are given in Table 10. The energy situation in the two countries is different, but they face the common challenge of reducing dependency on
Table 9. Water and sanitation indicators for Jamaica and Dominica
Water and sanitation indicator Jamaica Dominica
Water productivity (2005 US$ GDP per m3 of total freshwater withdrawal) – 26.0 (2013)
% of rural population with access to improved drinking water sources 88.8 (2012) 91.8 (2007)
% of urban population with access to improved drinking water sources 97.1 (2012) 95.7 (2012)
% of population with access to improved sanitation facilities 80.2 (2012) 81.1 (2007)
Annual freshwater withdrawals, total (% of internal resources) 9.9 (2013) –
Renewable internal freshwater resources per capita (cubic meters) 3,464.0 (2013) –
Source: World Bank (www.worldbank.org)

The impact of climate change on the achievement of the post-2015 SDGs 335. Case study: Caribbean countries
Chapter 5
imported fossil fuels. In Jamaica, imported petroleum as primary source of energy accounted for 83% of primary energy in 2009. Combustible renewables and waste-to-energy schemes accounted for 16% of renewable energy supply. Hydro (0.3%) and wind (0.1%) represented only 0.4%. Jamaica has an extensive energy infrastructure, with both public and private generators. There is a high level of access to energy in Jamaica. Over 90% of the population has access to electricity.
Dependency on imported petroleum is the major problem of Jamaica’s energy system. It brings enormous economic and environmental costs. In 2009, Jamaica imported US$1.6 billion of petroleum imports (30.5% of total imports and 12% of its GDP). Electricity prices for Jamaican residents are among the highest in the world, at around US$0.4 per kilowatt-hour, having more than doubled between 2005 and 2011 as a result of rising global oil prices and electricity grid losses. The high cost of energy is a major barrier to Jamaica’s economic development and a leading cause of business failure in the country.74 The reliance on fossil fuels for power generation also results in high local pollution and health care costs and contributes to global climate change.75 Vision 2030 Jamaica stipulates that no less than 20% of Jamaica’s energy supply must come from renewable sources by 2020, compared to 16% in 2009.76
A strong climate agreement could accelerate technology development and increase the available investments (national and international) for renewable projects, thus providing an opportunity for Jamaica to deploy the renewable energy projects necessary to achieve its renewable energy target. The development of commercial, non-carbon energy will bring co-benefits for Jamaica in the form of: less dependence on imported oil (which makes Jamaica highly vulnerable to disruptions to the supply and price of oil); reduced energy costs; less dirty fuel and fewer emissions of local pollutants from fossil fuel burning, which harm human
Table 10. Energy indicators for Jamaica and Dominica
Energy indicator Jamaica Dominica
Total primary energy supply136.4 PJ –
of which renewable, 22.2 PJ (16.3%)
2.0 PJ – of which renewable,
0.2 PJ (8.3%)
Combustible renewables and waste 16.4% 4.0%
Hydro 0.3% 4.0%
Wind 0.1% –
Oil 83.0% 92.0%
Energy self-sufficiency 16.3% 8.3%
Fuel imports (million US$)1,600.0
(30.5% of total imports)41.0
(17.2% of total imports)
Energy production (kt of oil equivalent) 548.8 (2011) –
Energy use (kg of oil equivalent per capita) 1,135.5 (2011) 607.4 (2007)
GDP per unit of energy use (constant 2011 PPP $ per kg of oil equivalent) 7.5 (2011) 16.0 (2007)
Electricity access rate 92.0% (2010) 91.2% (2010)
Source: World Bank (www.worldbank.org) and IRENA (www.irena.org)

The impact of climate change on the achievement of the post-2015 SDGs34
Chap
ter 5
health, ecosystems and physical infrastructure; new job creation77 and development of local industry; save limited financial resources and lower the country’s trade deficit. Under the low-ambition scenario, little progress is made in reducing fossil fuel dependency.
Imported oil dependency is even higher in Dominica, where 92% of primary energy (petroleum) had to be imported in 2009. This brings high economic and environmental costs. Subjected to world oil prices, the cost of electricity in Dominica has risen significantly in recent years and the electricity tariff is among the highest in the Eastern Caribbean. High energy costs constitute a development obstacle for numerous economic sectors. Dominica recognises that current high costs associated with importation of fossil fuel-based energy are unsustainable.78
The Government of Dominica has not set 2030 renewable energy targets, but the country plans to promote renewable energy by harnessing geothermal, solar, wind and hydro energy potential in order to address rising energy costs. These rising energy costs affect the cost of living and quality of life, cause increases in the costs of manufacturing and services, and pose a challenge to economic competitiveness.79 In a recent study, the Worldwatch Institute80 suggests that Dominica’s estimated “Renewable Share of Installed Capacity to Meet a Target” of 48% in CARICOM81 will have increased to 56% by 2027. Under a high-ambition scenario characterised by rapid technology development and focused international investment in renewables, Dominica will have the opportunity to deploy renewable energy projects to achieve this target. This will bring similar co-benefits to those realised in the Jamaican case. Under the low-ambition scenario, little progress is made in reducing fossil fuel dependency.
5.5 A comparative review between country-level and regional analysis
There are strong links between the achievement of the SDGs and implementation of the climate agreement for the two Caribbean case study countries. We see that the poverty impacts of the agreement through differences in growth are greater in these two islands than in the analysis of LAC as a whole, on account of the higher sensitivity of poverty to GDP growth in the former. We also see possible impacts of extreme events as being an important contributor to poverty and vulnerability, especially in the case of Jamaica. In the case of gender equality the main observation in the case studies is the potential for women to benefit from climate change financing through various channels. On water, the issues in these island states are less focused on adaptation needs and more on development of water supply and sanitation, which in any case is at a high level. Finally, the role of energy is seen as of considerable importance in the islands, perhaps more so than the regional level analysis would suggest. A high-ambition scenario would help create the right policy framework and also help to finance the kind of energy transition that Dominica and Jamaica are looking for, with a major increase in the share of renewables. Table 11 shows the risk of failure to achievement of the SDGs examined for the two Caribbean case study countries for both the high-ambition and low-ambition agreements.

The impact of climate change on the achievement of the post-2015 SDGs 355. Case study: Caribbean countries
Chapter 5
Table 11. Risk of failure to achieve the SDGs by 2030 (see explanation of key in Annex)
Sustainable Development Goals Risk Con�denceHigh-ambition Low-sambition
Glo
bal L
evel SDG 1 Poverty
SDG 5 Gender equality
SDG 6 Water and sanitation
SDG 7 Energy
Coun
try
Leve
l
Dom
inic
a
SDG 1 Poverty
SDG 5 Gender equality
SDG 6 Water and sanitation
SDG 7 Energy
Jam
aica
SDG 1 Poverty
SDG 5 Gender equality
SDG 6 Water and sanitation
SDG 7 Energy
Very high risk of failure to achieve the SDG
High risk of failure to achieve the SDG
Medium risk of failure to achieve the SDG
Low risk of failure to achieve the SDG
Very low risk of failure to achieve the SDG
High con�dence
Medium con�dence
Low con�dence

36
Chap
ter 6 Table 12. Economic characteristics of Pakistan
Economic characteristic
GDP composition by sector (2013)
y services 53.1%
y agriculture 25.3%
y industry 21.6%
Net inflows in the economy from foreign investors in US$ billions (2013) 1.3
CO2 emissions in 2010 (metric tonnes per capita) 0.9
Source: World Bank (www.worldbank.org)
6. Case study: Pakistan
6.1 Development context and key challenges
Pakistan is a lower middle-income country, with an agriculture-dependent economy (25% of GDP, and over 47% of the population are dependent on agriculture). In addition, the services sector plays a key role in the development of the country (53% of GDP, see Table 12). Economic growth, which has been variable and around 3–4% per annum in the last decade, has accelerated in the last few years but the country faces major challenges including rapid population growth, depletion of natural resources, need for employment generation, very low tax collection making public expenditures difficult to finance, food and water security, internal instability, and a growing demand for energy that is not being met.82
In summary, development challenges for Pakistan include job-creating growth, expansion and improvement of basic infrastructure (especially electricity of which there is a serious shortage), reinforcement of social conditions, enhancement of living standards for the poor, promotion of sustainable development and adaptation to climate change.83
6.2 Current mitigation and adaptation policies
Pakistan has enacted several pieces of legislation and policy initiatives in the areas of forestry, energy conservation and renewable energy development. These policies aim to integrate climate change mitigation and adaptation into national development and environmental priorities.84 Ambitious SDGs will support climate compatible development and will therefore support Pakistan’s mitigation efforts. While carbon emissions from Pakistan currently represent a small proportion of global emissions (0.72% in 2010),85 securing climate compatible development is important to ensuring that the country’s rapid economic and population growth is not accompanied by growth in carbon emissions and therefore will contribute in a small way to achieving a high-ambition climate agreement to limit global warming to 2˚C by 2100.
Pakistan’s climate change policy sets the country’s priorities in terms of mitigation and adaptation measures, from 2011 to 2030.86 Measures include:
y adapting to flash flood risks, by using early warning systems, automated weather stations, training of people on how to protect themselves

376. Case study: Pakistan
Chapter 6
y promoting sustainable use of land by introducing rain water harvesting, reforestation, more efficient irrigation techniques etc.
y encouraging usage of renewable energy, by increasing public awareness, enabling poor households to access low-cost energy-saving appliances, promoting new technologies etc.
y minimising energy consumption and emissions in the transport system y addressing needs for additional water storage and ensuring water conservation y improving crop productivity and nutritional quality of feed to livestock y developing risk management systems to insure agricultural failures against extreme events y incorporating measures to address health impacts of climate change into national health
plans y implementing population planning strategies and promoting awareness of uncontrolled
population growth problems y enhancing women’s role in decision-making relevant to climate change mitigation and
adaptation policies.
6.3 Implications of a climate agreement for national development policies and trajectories
The national vision for the country sees it as moving to the category of upper middle-income by 2030 with a per capita income of US$8,180. At the same time it recognises that there will be a major increase in population – from 174 million in 2010 to 227 million by 2025. The development strategy places an emphasis on increased investment through higher domestic and foreign savings; a shift towards an energy policy that enhances the role of nuclear, hydro and other renewables, while optimising energy conservation options; investment to increase water and food security; and promotion of rapid, sustainable urban growth.87,88 In all these areas the country would benefit from a high-ambition climate agreement. Investment in clean energy would be facilitated by a global agreement in which emissions reductions could be accounted in developing countries and in which finance could be raised via carbon credits or other market mechanisms. At the same time, investments in infrastructure for urban development could also take into account the potential for energy saving and obtain partial finance through that route. Lastly, adaptation finance, which will be substantial under a high-ambition agreement, will make more resources available for the agricultural and water sectors to deal with the climate variability and change that so affect livelihoods in Pakistan.
6.4 Implications for the achievement of the SDGs: analysis and findings
SDG1: End poverty in all its forms everywhere In Pakistan, 12.7% of the population was considered below the poverty line of US$1.25 per day in 2011. Poverty there has declined considerably with real per capita income growth (from 29.1% in 1999) with an increase in PPP GDP from US$3,303 to US$4,261 over the period 1999–2011, implying a poverty elasticity of 1.94 with respect to per capita GDP growth.89 In the period to 2030 the OECD projections are for per capita GDP to rise to US$8,233 under SSP1 and to US$6,526 under SSP3. The SSP1 is close to the national vision of US$8,180. The corresponding population projections – 225 million under SSP1 and 257 million under SSP3 – are close to the national projections. Table 13 provides some information on poverty indicators provided by the World Bank.
In these circumstances and assuming the poverty-GDP growth elasticity to hold, poverty will decline from 25 million people in 2015 to zero in 2030 if SSP1 is realised under a high-ambition scenario. If on the other hand a low-ambition scenario is realised then the growth in

The impact of climate change on the achievement of the post-2015 SDGs38
Chap
ter 6
Table 13. Poverty indicators for Pakistan
Poverty indicator
Poverty headcount ratio at NPL (% of population) 12.4 (2011)
Population (million) 173.6 (2010)
Income share held by highest 10% (percentage share of income or consumption ) 25.6 (2011)
Income share held by lowest 10% 4.2 (2011)
Poverty gap at US$1.25 a day (PPP) (%) 12.7 (2011)
Rural poverty headcount ratio at national poverty lines (% of rural population) 27.0 (2006)
Cash surplus/deficit (% of GDP) –5.2 (2013)
Exports of goods and services (% of GDP) 13.2 (2013)
GDP growth (annual %) 4.4 (2013)
GNI per capita, PPP (current international $) 4,840.0 (2013)
Industry, value added (% of GDP) 21.1 (2013)
Inflation, consumer prices (annual %) 7.7 (2013)
Services, etc., value added (% of GDP) 53.8 (2013)
High-technology exports (% of manufactured exports) 1.7 (2012)
Source: World Bank (www.worldbank.org)
GDP is less and that of population slightly more and poverty only declines to 8.6 million by 2030.
Poverty is also seriously affected by the number of extreme events in Pakistan. It is ranked number one in the world by the climate risk index developed by Germanwatch. Over the last 20 years the country has experienced 64 such events in the form of droughts, floods and storms (see Table 14). This has resulted in an average of 418 deaths a year, with over 2.5 million people affected and US$432 million in damages. With climate change, and in the absence of additional measures to limit these consequences, the impacts will be even greater.
The costs of adaptation to flood-related events such as those listed above have been estimated by UNFCCC and ENVORK, a Pakistani non-governmental organisation (NGO).90 Depending on the future frequency of such events the annual adaptation cost could range from US$2.0 billion to US$3.8 billion. These costs include damages that cannot be adapted to or avoided through preventive measures but that might need to be addressed by offering compensation or relief to those who suffer. Measures included in the programme include improving understanding and awareness of the risks and better enforcement of regulations to deal with them; provide early warning of events; and develop climate change resilient infrastructure.
Under a high-ambition scenario Pakistan can expect to be able to finance such a programme and thus achieve a major reduction in losses from such events. This will help ensure that the same events do not contribute to poverty in the country. For example, if we can ensure that none of those affected fall into poverty during the period after an extreme event through programmes supported by the Adaptation Fund, the number who could escape poverty at

The impact of climate change on the achievement of the post-2015 SDGs 396. Case study: Pakistan
Chapter 6
Table 14. Extreme events in Pakistan during the last 20 years
Event Number Per Year
Deaths Affected Damages ($000)
Drought 2.0 16.2 110,000.0 13.0
Flash flood 12.0 123.6 1,042,136.0 503.0
Riverine flood 32.0 185.6 1,273,544.0 431,652.0
Convective storm 5.0 3.7 30.0 –
Tropical storm 3.0 24.8 109,497.0 86.0
Unspecified 10.0 64.1 10,250.0 –
Total 64.0 418.0 2,545,457.0 432,254.0
Source: EM-DAT: The OFDA/CRED International Disaster Database (http://www.emdat.be/database)
present frequencies would be up to 2.5 million in an average year. Such a programme is seen as a major contributor to resilience and would be key to underpinning long-term success in meeting the development goals. In the absence of such a fund, some support will still be forthcoming but it will not be as generous or as comprehensive.
SDG5: Achieve gender equality and empower all women and girls According to the Pakistan MDGs report,91 the country is unlikely to meet the specified targets related to the promotion of gender equality and women’s empowerment (see Table 15). The proportion of women in non-agriculture wage employment increased from 8.07% in 2001 to 10.45% in 2010, while the 2015 target is 14%. The Gender Parity Index (GPI92) in primary education increased from 0.73 in 1990 to 0.90 in 2011 but it is very unlikely to meet the 1.00 target for 2015. Similarly, the GPI for secondary education increased from 0.75 (2001)
Table 15. Gender equality indicators for Pakistan
Gender equality indicator
Adolescent fertility rate (number of births per 1,000 women aged 15–19) 27.4 (2012)
Children in employment, female (% of female children ages 7–14) 13.5 (2011)
Total number of female primary-school-age children who are not enrolled 3,051,000.0 (2012)
Literacy rate, youth female (% of females ages 15–24 who can both read and write) 63.1 (2011)
Unemployment, female (% of female labour force ) (modelled estimate) 9.3 (2013)
Fertility rate, total (births per woman) 3.3 (2012)
Maternal mortality ratio (modelled estimate, per 100,000 live births) 170.0 (2013)
Proportion of seats held by women in national parliaments (%) 20.7 (2014)
Ratio of girls to boys in primary and secondary education (%) 81.7 (2012)
Ratio of female to male tertiary enrolment (%) 95.5 (2012)
Source: World Bank (www.worldbank.org)

The impact of climate change on the achievement of the post-2015 SDGs40
Chap
ter 6
to 0.81 (2011), whereas the target is 0.94 (2015). The youth literacy GPI increased from 0.51 (1990) to 0.81 (2011) but the 2015 target is 1.00. However, the country was successful in increasing the proportion of seats held by women in the national parliament.
A strong climate agreement accompanied by economic growth, higher levels of education and reduced poverty under SSP1 could increase women’s chances of equality and empowerment. Stronger social protection policies associated with this scenario are expected to ensure equal rights and access to economic resources for women. Reduced gender disparities in education would mean that more women are able to seek employment, and participate in decision-making in all aspects of society.
SDG6: Ensure availability and sustainable management of water and sanitation for all One of the MDG targets was to halve, by 2015, the proportion of the population without sustainable access to safe drinking water and basic sanitation. Pakistan has achieved the improved access to safe drinking water target but is unlikely to achieve the sanitation target.93 Table 16 provides details for selected water and sanitation indicators for Pakistan.
A strong climate agreement would further support enhanced water-use efficiency in Pakistan, by introducing water recycling technologies, sustainable irrigation schemes, infrastructure investments that will increase storage capacity etc. Increased investments in infrastructure, water supply systems and sewerage could result in improved management of the country’s water systems. In addition, community educational campaigns for the importance of in-house sanitation facilities, development of cost-efficient wastewater treatment facilities, waste reduction through refuse-derived fuels and electricity production would further increase the percentage of population with access to improved sanitation facilities and benefit the environment.
The provision of safe drinking water is a key element of increasing rural productivity in Pakistan and therefore reducing poverty through environmentally friendly pathways. Technological progress following a strong agreement could lead to the development of drought-tolerant crop varieties, introduction of water-saving technologies, and reduced application of agrochemicals, which are one of the main water pollutants over agricultural areas.
SDG7: Ensure access to affordable, reliable, sustainable, and modern energy for all Basic energy data on Pakistan are given in Table 17. Oil (31%) and natural gas (49%) are the two major energy sources of Pakistan’s primary energy supply. Combustible renewables and waste account for 34.6% of renewable energy supply. Alternative and nuclear energy
Table 16. Water and sanitation indicators for Pakistan
Water and sanitation indicator
Water productivity, total (constant 2005 US$ GDP per m3 of total freshwater withdrawal) 0.8 (2013)
% of rural population with access to improved drinking water sources 89.0 (2012)
% of urban population with access to improved drinking water sources 95.7 (2012)
% of population with access to improved sanitation facilities 47.6 (2012)
Annual freshwater withdrawals, total (% of internal resources) 333.6 (2013)
Renewable internal freshwater resources per capita (cubic meters) 302.0 (2013)
Source: World Bank (www.worldbank.org)

The impact of climate change on the achievement of the post-2015 SDGs 416. Case study: Pakistan
Chapter 6
represent 4.5%. Pakistan has achieved access to electricity for over 90% of its population, which is essential for socioeconomic development.
The country is a net importer of both crude oil (and refined products) and natural gas. With the current consumption pattern, domestic gas and oil resources will become depleted and imports will need to increase. To meet an increasingly large fraction of its future energy needs and lessen its exposure to global price shocks, Pakistan plans to use its vast unexploited coal resources (such as in the plans for Thar desert94) and to promote renewables. Accordingly, Pakistan’s Energy Security Action Plan (2005–2030) aims to shift its primary energy mix from fuel oil and, to some extent, natural gas, to coal, nuclear and alternative and renewable energy sources all of which have considerable untapped potential.95 Pakistan’s Energy Security Action renewable target involves increasing deployment of alternative and renewable energy sources (hydro, wind and solar) to meet increasing energy demand in the country targeting them to become 13.3% of the total energy mix by the year 2030.
A strong climate agreement scenario would support the development of commercial non-carbon energy in Pakistan up to, at least, 13.3% of the total energy mix by the year 2030, by deploying technologies and securing access to financial resources for renewable investments that will reduce greenhouse gas emissions and will bring other co-benefits in the form of creation of new jobs and reductions in local air pollutants, with the associated health benefits. Under a high-ambition scenario, the 13.3% target could even be exceeded if international policies make it worth developing alternative and renewable projects instead of coal plants.
6.5 A comparative review between country-level and regional analysis
This case study demonstrates that the link between climate agreements and SDGs can vary a lot across countries. Compared to the average for South Asia, the effect of a strong climate agreement on poverty is much greater in Pakistan; poverty could even be eliminated under the higher growth in SSP1 but would be left at around 8.6 million in poverty 2030 under SSP3 (the steep decline is also partly based on the Government of Pakistan’s own strong poverty reduction projections). This difference is reinforced by the fact that poverty is also impacted by extreme events and Pakistan is particularly vulnerable to them. Hence, unless measures are introduced to deal with the human consequences of these events, poverty will be impacted significantly in this particular country. The financial backing for these is much more likely under a strong agreement than under a weak one.
Table 17. Energy indicators for Pakistan
Energy indicator
Alternative and nuclear energy (% of total energy use) 4.5 (2011)
Combustible renewables and waste (% of total energy) 34.6 (2011)
Energy imports, net (% of energy use) 23.3 (2011)
Energy production (kt of oil equivalent) 65,066.6 (2011)
Energy use (kg of oil equivalent per capita) 481.6 (2011)
Fossil fuel energy consumption (% of total) 60.9 (2011)
GDP per unit of energy use (constant 2011 PPP US$ per kg of oil equivalent) 8.8 (2011)
Source: World Bank (www.worldbank.org)

The impact of climate change on the achievement of the post-2015 SDGs42
Chap
ter 6
Pakistan is also a more extreme case of the effects of climate agreements on water and sanitation and energy. The water sector needs significant resources in Pakistan, which is in danger of becoming a water scarce country. A strong climate agreement would not only address water shortages but also increase water infrastructure that will extend sanitation and water supply. This is an issue in other South Asian countries as well, but it is particularly marked in Pakistan. Finally, the energy deficit in the country is critical and the need for action is urgent. Under a strong agreement this can be supported by climate finance that will help develop hydro and renewable resources, which are part of the national vision. Table 18 provides an overview of the risk of failure to achievement of the SDGs considered at the country level for both the high- and low-ambition agreements.
Table 18. Risk of failure to achieve the SDGs by 2030 (see explanation of key in Annex)
Sustainable Development Goals Risk Con�denceHigh-ambition Low-ambition
Glo
bal L
evel SDG 1 Poverty
SDG 5 Gender equality
SDG 6 Water and sanitation
SDG 7 Energy
Coun
try
Leve
l
Paki
stan
SDG 1 Poverty
SDG 5 Gender equality
SDG 6 Water and sanitation
SDG 7 Energy
Very high risk of failure to achieve the SDG
High risk of failure to achieve the SDG
Medium risk of failure to achieve the SDG
Low risk of failure to achieve the SDG
Very low risk of failure to achieve the SDG
High con�dence
Medium con�dence
Low con�dence

The impact of climate change on the achievement of the post-2015 SDGs 43
Chapter 7
7. Case study: Uganda
7.1 Development context and key development challenges
Uganda is a least developed country (LDC) that in spite of its recent growth spurt continues to be one of the poorest nations in the world, with 37.8% of the population living on less than US$1.25 a day (see Table 19). Other social indicators match this situation: life expectancy is estimated to be 50.4 years; the infant mortality rate is approximately 54 deaths per 1,000 live births and 360 women die per 100,000 live births. It is still predominantly rural, with 85% of households living outside urban areas.
After a varied history, punctuated with periods of conflict, the country has performed rather well in economic terms in recent years. GDP growth has exceeded 6% for most years since 1997. This has helped reduce poverty, which fell between 2005–2006 and 2009–2010 from 31.1% to 24.5% of the national population living below the NPL (i.e. from 8.5 million to 7.5 million people). However, the economy is still fragile and highly sensitive to natural events such as floods and droughts, which have been increasing in frequency in recent years.
7.2 Current mitigation and adaptation policies
Uganda is vulnerable to climate change given its reliance on climate-sensitive sectors such as rain-fed agriculture, susceptibility to natural disasters, and widespread poverty.96 Ambitious SDGs will support climate compatible development and will therefore support Uganda’s mitigation efforts. While carbon emissions from Uganda currently represent a small proportion of global emissions (0.08% in 201097), securing climate compatible development is important to ensuring that the country’s rapid urban growth is not accompanied by growth in carbon emissions and therefore will contribute in a small way to achieving a high-ambition climate agreement to limit global warming to 2°C by 2100.
The Government of Uganda has prepared a detailed set of policies for climate mitigation and adaptation. Following extensive consultations with local stakeholders, a National Climate Change Policy (NCCP) with a costed implementation strategy was prepared by the Ministry of Environment and Water.98 The implementation strategy covers the period up to 2030 and sets out short-term (1–5 years), medium-term (6–10 years) and long-term (11–15 years) goals.
Table 19. Economic characteristics of Uganda
Economic characteristic
GDP composition by sector (2013)
y Services 50.0%
y Agriculture 23.1%
y Industry 26.9%
Net inflows in the economy from foreign investors in US$ billions (2013) 1.2
CO2 emissions in 2010 (metric tonnes per capita) 0.1
Source: World Bank (www.worldbank.org)

The impact of climate change on the achievement of the post-2015 SDGs44
Chap
ter 7
On mitigation the focus is on the following sectors: land use, land use change and forestry (LULUCF), wetlands, agriculture, energy generation and use, and waste management. The Ministry has estimated costs of US$804 million for conducting mitigation interventions in the various sectors for the next 15 years, with around: US$75 million for LULUCF to cover forest planting and REDD+ projects; US$19 million for wetland restoration to enhance wetlands as greenhouse gas sinks; US$141 million for agriculture to encourage those conservation practices that increase greenhouse gas sinks and promote sustainable rangeland management; US$26 million for investment in clean energy generation and promotion of other measures to reduce greenhouse gases from generation; US$108 million to promote energy efficiency, especially in use of wood fuel and in the design of buildings; US$421 to increase efficiency in the transport sector, including development of low-carbon modes of transport; US$9 million to improve efficiency in industrial processes that use fossil fuels; and US$3 million for waste management through waste-to-energy programmes.
On the adaptation side, a similar programme has been prepared with a total estimated cost of US$2.9 billion covering the next 15 years. The areas are:
y disaster risk management (US$12 million) y promotion of urban planning and development of human settlements that are
resilient and robust enough to withstand climate change–related risks and hazards (US$13 million)
y conservation of wildlife resources and plan for improved resilience of tourism resources and infrastructure to climate change (US$24 million)
y promotion of sustainable energy access and utilisation as a means of sustainable development in the face of uncertainties related to climate change (US$382 million)
y strengthening adaptive mechanisms for health and enhancing early-warning systems and ensuring adequate preparedness for climate change–related diseases (US$733 million)
y biodiversity and ecosystem services (US$6 million) y wetland conservation (US$2 million) y sustainable management of forestry resources (US$24 million) y developing and ensuring integrated planning and climate proofing of transport and other
physical infrastructure (US$1.1 billion) y strengthening efforts to promote integrated fisheries resource management
and improving aquaculture in order to ensure sustainable fisheries production (US$163xmillion)
y integrating climate change concerns into national efforts for sustainable and long-term conservation, access and effective utilisation and management of water resources (US$203 million)
y promoting climate change adaptation strategies that enhance resilient and productive agricultural systems and measures to ensure food security as a factor of resilience (US$297 million).
This substantial programme involves several government agencies and includes components for monitoring and evaluating success. It is not, however, fully funded, in the sense that domestic and foreign resources are yet to be identified for the individual elements. Furthermore the elements are not justified in terms of measured benefits relative to costs, although a CDKN study is currently ongoing to evaluate the costs of inaction and the benefits and costs of different measures to address climate impacts.99 This will support discussions on the financing process. Nevertheless, such a process will be constrained by the availability of funds and a high-ambition agreement is more likely to fund a greater part of the programme than a low-ambition one.

The impact of climate change on the achievement of the post-2015 SDGs 457. Case study: Uganda
Chapter 7
7.3 Implications of a climate agreement for national development policies and trajectories
The National Vision document100 foresees a consistent growth rate of around 8.2% in per capita PPP GDP reaching US$4,300 in 2030 and US$9,500 in 2040.101 It is an ambitious programme that foresees poverty in terms of the NPL falling from 25% in 2009 to 5% in 2040 and the economy becoming much less agriculture based, with the share of that sector falling from 22% in 2010 to 10% in 2040. At the same time, industry grows from 26% to 31% and services from 51% to 58%. These changes and the associated growth in GDP will be achieved through an increase in investment, from 24% of GDP at present to 30%, and major programmes of investment in transport, energy and water and urban infrastructure. The urban population will increase from 13% currently to 60% by the end of the period. Energy sources will change such that dependence on fuel wood and traditional biomass will be replaced by electricity and gas, with much of the former coming from new hydro and nuclear plants as well as some domestic gas.
All this depends on a lot of factors working in favour of implementation of sustainable development policies, one being a world in which there is an agreement to implement a high-ambition climate scenario. This will provide impetus to the kind of sustainable development that is envisaged in the Vision2040 document, with major urban infrastructure investments in compact, energy efficient developments, a transport system that is both efficient and low-carbon, and an energy system that develops the low-carbon indigenous resources to the extent feasible. The Vision2040 document has a business-as-usual power mix that is a combination of hydropower, geothermal, nuclear, solar, biomass and thermal power. A high-ambition scenario will provide a greater emphasis within that on renewables and non-fossil sources. Furthermore, external finance to support such a pathway will be enhanced by an agreement that includes significant funds to support mitigation through low-carbon programmes of development in countries like Uganda.
7.4 Implications for the achievement of the SDGs: analysis and findings
SDG1: End poverty in all its forms everywhere Uganda had 37.8% of the population below the poverty line of US$1.25 per day in 2013. This figure had declined from 59.4% in 1999, as a result of an increase in real per capita income, which went from US$686 to US$1,413 over the same period. The two figures imply a relatively low poverty elasticity of 0.34 with respect to per capita GDP growth. According to OECD, GDP per capita is projected to rise by 2030 to US$5,305 under SSP1 and to US$3,871 under SSP3 (in 2011 PPP Dollars). This range covers the Vision2040 aim of attaining US$4,383 by 2030, with SSP1 providing a slightly higher (21%) figure and SSP3 a slightly lower one (–12%). The corresponding population projections are 55 million under SSP1 and 65 million under SSP3. Assuming the elasticity to hold over the period to 2030, poverty will decline from 15 million (2015) to 12 million (2030) if SSP1 is realised under a high-ambition scenario. If, on the other hand, a low-ambition scenario is realised then the growth in GDP is less and that of population slightly more and poverty actually increases to 19 million by 2030. In neither case the goal of extreme poverty eradication under SDG1 is met. Table 20 provides a selection of poverty indicators provided by the World Bank.
This analysis is similar to one conducted by the World Bank, which used its own model to predict GDP per capita growth under business-as-usual, which was a rate of 4% per annum.102 This is almost exactly in the middle of our range of 3.2% under SSP3 and 5.3% under SSP1. The World Bank study concludes that under such a rate, the number of poor people at

The impact of climate change on the achievement of the post-2015 SDGs46
Chap
ter 7
US$1.25 per capita per day will be 11.5 million, not so different from our estimate of 12 million under SSP1. Both that study and this one conclude that poverty eradication by 2030 is a challenge; if the high-ambition scenario is realised and generates the small increase in growth we indicate, it should make some contribution to the reduction in poverty.
Poverty is also significantly affected by extreme events in Uganda, which can be a cause of people’s falling into poverty. The country is already vulnerable to extreme weather events in the form of floods and droughts. In their study of African country data since 1960, Shi and Tao103 note that the country is one of a group with the highest drought impacts. The northern region is particularly prone to floods and droughts as a result of high rainfall variability, with food security especially affected, for example, in the Karamoja region. On average, 30% of food needs are covered by aid in this region.104 The report on the impact of the 2010–2011 rainfall deficits by the Department of Disaster Management/Office of the Prime Minister105 gives detailed estimates for damage and production losses. The estimate of loss and damage was US$1.2 billion or about 7.5% of Uganda’s GDP in that year.
The Ugandan Agricultural Census106 reported that about 7% of the total of 3.95 million agricultural households was prone to flooding, mostly in the eastern region. It is striking that 8 out of the 10 most severe floods and droughts in terms of numbers affected since 1900 have occurred within the last 20 years.107 This supports claims that extreme weather events have been increasing in recent years. This is devastating for the food security of local populations since it takes an estimated two years to recover from each such drought.108
In order to address these problems, the Government of Uganda has a major component of its US$2.9 billion adaptation programme dedicated to extreme events and agriculture over the next 15 years. It has estimated a cost of US$280 million for the implementation of
Table 20. Poverty indicators for Uganda
Poverty indicator
Population (millions) 34.9 (2014)
Percent of population in poverty at US$1.25 per capita per day 37.8 (2013)
Income share held by highest 10% (percentage share of income or consumption ) 35.8 (2013)
Income share held by lowest 10% 2.5 (2013)
Cash surplus/deficit (% of GDP) –2.5 (2012)
Central government debt, total (% of GDP) 39.3 (2012)
Exports of goods and services (% of GDP) 23.7 (2013)
GDP growth (annual %) –0.9 (2013)
GNI per capita, PPP (current international $) 1,470.0 (2013)
Industry, value added (% of GDP) 28.7 (2013)
Inflation, consumer prices (annual %) 5.5 (2013)
Services, etc., value added (% of GDP) 46.8 (1,013)
High-technology exports (% of manufactured exports) 20.7 (2012)
Source: World Bank (www.worldbank.org)

The impact of climate change on the achievement of the post-2015 SDGs 477. Case study: Uganda
Chapter 7
insurance against crop failure, integrated water management schemes to control against floods and drought, flood warning systems, and water catchment protection. In addition, it has estimated a cost of US$620 million as the amount required to climate proof infrastructure – buildings and transport. It has also estimated a cost of US$297 million for agriculture to complement existing programmes in that sector and make it less vulnerable to climate change. Preliminary results from the CDKN study on the economics of adaptation indicate that such outlays are well justified in terms of reduced impacts. At present, however, the programme is not funded: the extent to which it can be implemented will depend on how much is available in the form of adaptation climate finance. Under a high-ambition agreement it should be possible to cover all the items in the present list but under a low-ambition agreement it is unlikely to be the case, with the consequence that extreme events will continue to impact vulnerable households and add to the level poverty in the country.
SDG5: Achieve gender equality and empower all women and girls Uganda is well on track to eliminate gender disparity in primary and secondary education, according to the country’s MDGs report.109 The proportion of seats held by women in the parliament increased from 17.9% in 2000 to 35% in 2012 (international average is 20%). Further, although the country already achieved gender parity targets for primary education, more effort is required towards achieving equality in secondary and tertiary education. The ratio of girls to boys in primary education increased from 93% in 2000 to 100% in 2012. The same ratio for secondary education increased from 79% to 85% and for tertiary education increased from 58% to 79%, between 2000 and 2012 (the target for 2015 is 100%). The share of non-agricultural waged female workers increased from 28.1% in 2006 to 33.4% in 2009. This rapid increase is expected to be beneficial for both women and men and helps to reduce gender-based inequalities.
Another factor with an important gender dimension is the impact of traditional energy on the emissions of pollutants that impact human health. One of the most significant contributors to greenhouse gas emissions in developing countries is cooking, which produces significant amounts of black carbon. By investing in clean cook stove technologies, not only will carbon emissions be largely reduced, but women’s health will significantly improve and associated morbidity rates will decrease.110 See below for a further discussion of energy issues under different ambition scenarios.
A strong climate agreement, along with Uganda’s policies on gender equality, is expected to further increase the number of women receiving secondary education and to create more opportunities for women to be enterprising, via increased access to available resources. It is, however, very important that existing domestic resources that are already allocated towards women’s empowerment and gender equality programmes will not get shifted towards climate change mitigation or adaptation measures. Separate funding for mitigation and adaptation is required. Table 21 provides selected gender equality indicators for Uganda.
SDG6: Ensure availability and sustainable management of water and sanitation for all Uganda is making significant progress towards achieving the target for provision of safe water and sanitation. Although the proportion of rural population with access to safe water is lower than the equivalent proportion of urban population, the progress in the rural regions is faster. Access to safe drinking water in rural areas is driven by public spending.
The country is on track to achieve its targets for rural areas, but progress in urban areas has stagnated. The Progress on Drinking Water and Sanitation report111 states that the country met the drinking water access target, but is not on track for meeting the sanitation facilities target. Table 22 details selected water and sanitation indicators for Uganda. In the future,

The impact of climate change on the achievement of the post-2015 SDGs48
Chap
ter 7
however, climate-related events such as floods and droughts will affect water supply and sanitation and the targets given in the table could decline.
A strong climate agreement could boost water-related economic activities, generate new employment types and promote improved water resources management. There are studies showing that even if Uganda fully exploits its irrigation potential, only 14% of the renewable water resources would be utilised. As part of a strong agreement, the hydropower potential will be further developed, providing more affordable electricity. Investment in infrastructure development and maintenance of its public water resources, such as construction of water reservoirs, will increase water security against floods and droughts and promote water-use efficiency.
The country’s rich freshwater resources (covering a third of the total land area of the country) could potentially become a source of socioeconomic transformation, through utilisation for irrigation, consumption, generation of hydropower, tourism and other sectors.
Table 21. Gender equality indicators for Uganda
Gender equality indicator
Adolescent fertility rate (number of births per 1,000 women aged 15–19) 126.6 (2012)
Children in employment, female (% of female children ages 7–14) 36.3 (2012)
Total number of female primary-school-age children who are not enrolled 285,000.0 (2011)
Literacy rate, youth female (% of females ages 15–24 who can both read and write) 85.5 (2010)
Unemployment, female (% of female labour force ) (modelled estimate) 4.5 (2013)
Fertility rate, total (births per woman) 6.0 (2012)
Maternal mortality ratio (modelled estimate, per 100,000 live births) 360.0 (2013)
Proportion of seats held by women in national parliaments (%) 35.0 (2014)
Ratio of girls to boys in primary and secondary education (%) 98.3 (2009)
Ratio of female to male tertiary enrolment (%) 26.9 (2011)
Source: World Bank (www.worldbank.org)
Table 22. Water and sanitation indicators for Uganda
Water and sanitation indicator
Water productivity, total (constant 2005 US$ GDP per m3 of total freshwater withdrawal) 49.2 (2013)
% of rural population with access to improved drinking water sources 71.0 (2012)
% of urban population with access to improved drinking water sources 94.8 (2012)
% of population with access to improved sanitation facilities 33.9 (2012)
Annual freshwater withdrawals, total (% of internal resources) 0.8 (2013)
Renewable internal freshwater resources per capita (cubic meters) 1,038.0 (2013)
Source: World Bank (www.worldbank.org)

The impact of climate change on the achievement of the post-2015 SDGs 497. Case study: Uganda
Chapter 7
SDG7: Ensure access to affordable, reliable, sustainable and modern energy for all Table 23 shows Uganda‘s basic energy data. Uganda has a total primary energy supply of 13.75 MTOE (million tonnes of oil equivalent) and energy consumption of 14.94 MTOE (data for 2012). Biomass is the most important source of energy for the majority of the Ugandan population. About 90% of the total primary energy consumption is generated through biomass, which can be separated into firewood (78.6%) used for cooking in rural areas, charcoal (5.6%) for the cooking needs of the urban population and crop residues (4.7%). Electricity contributes only 1.4% to the national energy balance. Oil products, which are mainly used for vehicles and thermal power plants, account for the remaining 9.7%.112 Uganda has an installed electricity capacity of 822 MW, mostly consisting of hydropower (84%). Uganda has one of the lowest per capita electricity consumptions in the world, with 215 kWh per capita per year (sub-Saharan Africa’s average: 552 kWh per capita, world average: 2,975 kWh per capita). In 2012, Uganda had to import 1.19 MTOE of energy (different petroleum products).113 The energy sector is one of the key sectors of the Ugandan economy. It is also a major source of employment.
Major problems facing Uganda’s energy system are associated with poor access to electricity and the central role played by traditional biomass in total energy use, which lead to both environmental and socioeconomic problems. There is also a recurring problem of inadequate electricity generation capacity. Access to electricity in 2010 at national level was only 14.6% (up from 5.6% in 1991), but just 7% in rural areas.
High demand for wood fuels, which are used inefficiently, results in overuse and depletion of forests. In 2012, 14.1% of Uganda’s land area was covered with forest (compared to 23.8% in 1990 and 19.4% in 2000) according to World Bank data. Traditional biomass energy totally dominates household energy demand, accounting for 99.7% of the sector’s total household energy. Currently about 90,000 hectares of forest cover are lost annually, which leads to fuel wood scarcity in rural areas and increasing price levels of charcoal and fuel wood. Furthermore, the traditional use of firewood is responsible for high indoor air pollution levels, thus causing respiratory diseases that affect women and children in particular. Moreover, both women and children need to travel long distances and spend a lot of time to collect fuel wood. This deprives women of valuable time to engage in income generating activities and children to go to school and study. Deforestation also leads to environmental problems such as biodiversity and ecosystem services loss.
Table 23. Energy indicators for Uganda
Energy indicator
Alternative and nuclear energy (% of total energy use) 0.0
Combustible renewables and waste (% of total energy) 88.9 (2012)
Fossil fuel energy consumption (% of total energy) 11.1 (2012)
Energy imports, net (% of energy use) 8.0 (2012)
Energy production114 (kt of oil equivalent) –
Energy use (kg of oil equivalent per capita) 411.0 (2012)
Electricity use per capita 215.0 kWh
Electricity access rate 14.6 (2010)
Source: World Bank (www.worldbank.org) and U.S. Energy Information Administration

The impact of climate change on the achievement of the post-2015 SDGs50
Chap
ter 7
Rural households without access to electricity use traditional lighting technologies, such as candles or kerosene lamps, that give poor quality lighting, emit noxious fumes and present hazards in terms of fires or burns. As noted above in the discussion on gender, this has serious negative impacts on households and on their health, especially for women and children. Lack of access to electricity also constrains the economic development of Uganda.
Uganda is richly endowed with abundant renewable energy resources, including hydropower, biomass, solar, geothermal. The overall policy goal of the Renewable Energy Policy for Uganda is to increase the use of modern renewable energy115 to 61% of the total energy consumption by the year 2017.116 Although Uganda has not defined a 2030 renewable energy target as such, the country has major plans to increase supply through hydropower and other renewable sources (solar-PV and geothermal). There are also plans for the development of nuclear, geothermal and thermal units, the last possibly exploiting indigenous resources that are being explored. However, current generation expansion plans, which go as far ahead as 2050, place only a small role on domestic oil and gas and the emphasis is on developing hydropower, with some geothermal and solar power to 2030, after which nuclear units are scheduled to come online, as are two sets of combined cycle gas turbines. In terms of CO2 , this programme will increase emissions but from a very low base. Currently these are only 0.08 tonnes per capita and by 2050 they will rise to 0.35 tonnes per capita. This compares to the world average of CO2 emissions in 2010 of 4.9 tonnes per capita.
In order to achieve its ambitions to gain middle-income status in a sustainable manner, the country needs a large increase in financing and the development of innovative financing mechanisms to attract public and private sector investments on a larger scale. A high-ambition agreement would help Uganda access the necessary funding to undertake its renewables plans, thus contributing to mitigating climate change and bringing other SDG co-benefits associated with having a greater share of total energy demand from these sources (and less from traditional biomass), including in health, ecosystems, gender and education. Less demand for and use of charcoal and fuel wood would result in:
y lower deforestation rates (currently about 90,000 hectares of forest cover are lost annually) y better biodiversity and ecosystem services conservation y lower indoor air pollution levels caused by the traditional use of firewood, which cause
respiratory diseases that affect women and children in particular y less time spent collecting fuel wood, which deprives women of valuable time to engage in
income generating activities and children time to go to school and study y reduced dependency on fuel wood (in recent years, forest loss has led to fuel wood scarcity
in rural areas and increasing price levels of charcoal and fuel wood.
7.5 A comparative review between country-level and regional analysis
The Uganda study complements the global and regional findings outlined in Section 4 in a number of respects. On the poverty reduction–climate agreement link, we see the high sensitivity of poverty targets to both GDP growth and natural hazards. The latter is especially important in Uganda, where farmers as well as urban dwellers are periodically affected enough to disrupt their livelihoods. The water sector faces imbalances in a number of regions due to water deficits and/or flooding. These are likely to be exacerbated by climate change but the government has in place a draft implementation strategy to deal with them. The strategy needs significant support that is more likely to be forthcoming under a strong climate agreement. The case study helps identify the areas where such support is needed and in what time frame. Finally, the study highlights the important links between developing

The impact of climate change on the achievement of the post-2015 SDGs 517. Case study: Uganda
Chapter 7
a modern energy sector and phasing out the high dependence on traditional biomass. The latter is environmentally and socially harmful, and if it can be replaced by renewable energy sources or even with sources such as LPG (liquefied petroleum gas) that are relatively lower in emissions, the co-benefits of such low-carbon development will be considerable. Table 24 provides an overview of the risk of failure to achieve the SDGs considered at the country level for both the high- and low-ambition agreement scenarios.
Table 24. Risk of failure to achieve the SDGs by 2030 (key explanation in Annex)
Sustainable Development Goals Risk Con�denceHigh-ambition Low-ambition
Glo
bal L
evel SDG 1 Poverty
SDG 5 Gender equality
SDG 6 Water and sanitation
SDG 7 Energy
Coun
try
Leve
l
Uga
nda
SDG 1 Poverty
SDG 5 Gender equality
SDG 6 Water and sanitation
SDG 7 Energy
Very high risk of failure to achieve the SDG
High risk of failure to achieve the SDG
Medium risk of failure to achieve the SDG
Low risk of failure to achieve the SDG
Very low risk of failure to achieve the SDG
High con�dence
Medium con�dence
Low con�dence
The impact of climate change on the achievement of the post-2015 SDGs52
Conc
lusi
on
ConclusionsThis research aims to provide decision-makers and negotiators at COP21 with a better understanding of the implications of the climate agreement decisions on the SDGs, by considering the impacts of two agreement scenarios: a high-ambition agreement that minimises global warming to 2°C by 2100 and a low-ambition agreement that limits global warming to 3–5°C by 2100, with associated policies and allocations of investment. It also aims to emphasise to SDG negotiators that successful implementation of ambitious SDGs requires an ambitious climate deal and that an ambitious climate deal requires ambitious SDGs to promote the necessary policy reforms.
2015 presents a unique opportunity to integrate sustainable development pathways with actions to reduce greenhouse gas emissions. Seizing this opportunity by promoting a strong climate agreement that will prioritise investments and policies directed towards clean energy and technologies will pave the way towards eradicating poverty, ensuring food security and protecting future generations from the impacts of a changing climate.
The interconnections between the outcomes of the UNFCCC process and the UN-SDG process should be carefully considered by negotiators in reaching an agreement on the climate change deal. The level of ambition is critical. A high-ambition climate agreement is likely to provide significant benefits to both the climate and development agendas over the next two decades. Likewise, strong SDGs will support efforts to implement a more ambitious climate agreement. The outcomes of this work are expected to be useful in strengthening the evidence base for negotiators and the development community to advocate a stronger climate deal and to ensure that the SDGs deliver climate compatible development in the poorest and most climate vulnerable countries.
The decisions that were taken at UNFCCC COP20 in Lima in 2014 and those that will be taken at COP21 in Paris will have a significant impact on global development by 2030, even before the resulting impacts on climate are felt. A high-ambition agreement that aims to minimise global warming to 2°C by 2100 is essential to have the best chance of achieving the SDGs by 2030. Such an agreement could provide a clear policy framework and the legal basis for action on climate change, incentivise international cooperation, and mobilise additional finance and resources for mitigation and adaptation activities that support climate compatible development. This can potentially have a significant impact on the state of the economy and social well-being in the poorest and most climate vulnerable countries before 2030, improving the likelihood that they will achieve the SDGs.
Table 25 summarises the influence of the level of ambition of the climate agreement on the risk of failure to achieve the SDGs at the global level and at the country level for the selected case studies. The table gives the level of confidence in the estimate of the magnitude of risk. For some SDGs, the high- and low-ambition scenarios have substantially different outcomes in terms of the risk of failure to achieve the SDGs by 2030.
Notable examples at the global and regional level are poverty (SDG 1), inequality (SDG 10), combatting climate change (SDG 13) and global partnerships for sustainable development (SDG 17), for which the low-ambition agreement is projected to result in a significantly greater risk of not achieving the SDGs than the high-ambition agreement. For example, by 2030 the low-ambition agreement is projected to result in 80–140% higher poverty levels for Asia and sub-Saharan Africa and 25% higher poverty levels for LAC than the high-ambition scenario.

The impact of climate change on the achievement of the post-2015 SDGs 53Conclusions
Conclusion
Sustainable Development Goals Risk Con�denceHigh-ambition Low-ambition
Glo
bal L
evel
Poverty
Hunger
Health
Education
Gender equality
Water and sanitation
Energy
Economic growth
Resilient infrastructure
Inequality
Sustainable cities
Consumption and production
Combatting climate change
Marine resources
Terrestrial ecosystems
Peaceful and inclusive societies
Global partnership
Coun
try
Leve
l
Dom
inic
a
Poverty
Gender equality
Water and sanitation
Energy
Jam
aica
Poverty
Gender equality
Water and sanitation
Energy
Paki
stan
Poverty
Gender equality
Water and sanitation
Energy
Uga
nda
SDG 1
SDG 2
SDG 3
SDG 4
SDG 5
SDG 6
SDG 7
SDG 8
SDG 9
SDG 10
SDG 11
SDG 12
SDG 13
SDG 14
SDG 15
SDG 16
SDG 17
SDG 1
SDG 5
SDG 6
SDG 7
SDG 1
SDG 5
SDG 6
SDG 7
SDG 1
SDG 5
SDG 6
SDG 7
SDG 1
SDG 5
SDG 6
SDG 7
Poverty
Gender equality
Water and sanitation
Energy
Table 25. Risk of failure to achieve the SDGs by 2030 (key explanation in Annex)
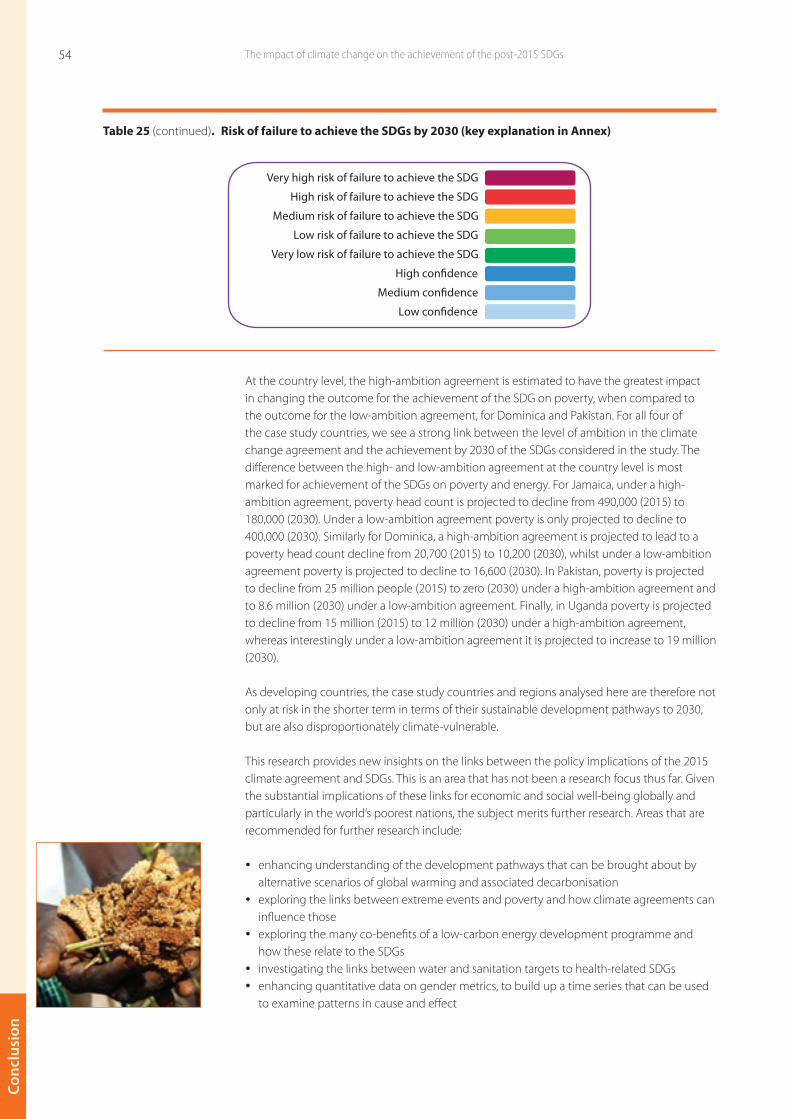
The impact of climate change on the achievement of the post-2015 SDGs54
Conc
lusi
on
At the country level, the high-ambition agreement is estimated to have the greatest impact in changing the outcome for the achievement of the SDG on poverty, when compared to the outcome for the low-ambition agreement, for Dominica and Pakistan. For all four of the case study countries, we see a strong link between the level of ambition in the climate change agreement and the achievement by 2030 of the SDGs considered in the study. The difference between the high- and low-ambition agreement at the country level is most marked for achievement of the SDGs on poverty and energy. For Jamaica, under a high-ambition agreement, poverty head count is projected to decline from 490,000 (2015) to 180,000 (2030). Under a low-ambition agreement poverty is only projected to decline to 400,000 (2030). Similarly for Dominica, a high-ambition agreement is projected to lead to a poverty head count decline from 20,700 (2015) to 10,200 (2030), whilst under a low-ambition agreement poverty is projected to decline to 16,600 (2030). In Pakistan, poverty is projected to decline from 25 million people (2015) to zero (2030) under a high-ambition agreement and to 8.6 million (2030) under a low-ambition agreement. Finally, in Uganda poverty is projected to decline from 15 million (2015) to 12 million (2030) under a high-ambition agreement, whereas interestingly under a low-ambition agreement it is projected to increase to 19 million (2030).
As developing countries, the case study countries and regions analysed here are therefore not only at risk in the shorter term in terms of their sustainable development pathways to 2030, but are also disproportionately climate-vulnerable.
This research provides new insights on the links between the policy implications of the 2015 climate agreement and SDGs. This is an area that has not been a research focus thus far. Given the substantial implications of these links for economic and social well-being globally and particularly in the world’s poorest nations, the subject merits further research. Areas that are recommended for further research include:
y enhancing understanding of the development pathways that can be brought about by alternative scenarios of global warming and associated decarbonisation
y exploring the links between extreme events and poverty and how climate agreements can influence those
y exploring the many co-benefits of a low-carbon energy development programme and how these relate to the SDGs
y investigating the links between water and sanitation targets to health-related SDGs y enhancing quantitative data on gender metrics, to build up a time series that can be used
to examine patterns in cause and effect
Very high risk of failure to achieve the SDG
High risk of failure to achieve the SDG
Medium risk of failure to achieve the SDG
Low risk of failure to achieve the SDG
Very low risk of failure to achieve the SDG
High con�dence
Medium con�dence
Low con�dence
Table 25 (continued). Risk of failure to achieve the SDGs by 2030 (key explanation in Annex)

The impact of climate change on the achievement of the post-2015 SDGs 55Conclusions
Conclusion
y deepening the analysis of implications of the climate agreement for SDGs at the global and regional level
y extending the country level analysis to cover more SDGs.
Enhancing both the quantitative and qualitative information in each of these areas will help to advance understanding and fill knowledge gaps and support the continual improvement of establishing strong climate compatible development policies and foster the political will for transformational climate and development policies.

56
Background readingBaastel (2014) Economic Assessment of the impacts of climate change in Uganda – Draft Energy
Sector Report. Gatineau, Canada: Baastel.
Caribbean Development Bank (2010) Country poverty assessment. reducing poverty in the face of vulnerability. St Michael, Barbados: Caribbean Development Bank.
DARA International (2012). Climate vulnerability monitor. 2nd Edition. A guide to the cold calculus of a hot planet. Madrid, Spain: DARA International and Climate Vulnerable Forum.
Government of Uganda (2007) Renewable Energy Policy for Uganda. Kampala, Uganda: Government of Uganda.
Kreft, S. and Eckstein, D. (2014). Climate risk index 2014. Bonn, Germany: Germanwatch.
Thomson, A.M., Calvin, K.V., Smith, S.J. Kyle, G.P., Volke, A., Patel, P., Delgado-Arias, S., Bond-Lamberty, B., Wise, M.A., Clarke, L.E. and Edmonds, J.A. (2011) ‘RCP4.5: A pathway for stabilization of radiative forcing by 2100’. Climatic Change 109: 77–94. doi:10.1007/s10584-011-0151-4.
Working Party on Climate, Investment and Development (2012) Long-term economic growth and environmental pressure: Reference scenarios for future global projections. ENV/EPOC/WPCID(2012)6. Paris: Organisation for Economic Co-operation and Development.
Back
grou
nd re
adin
g

57
SDG
s and targets
The draft SDGs and targets
Goal 1. End poverty in all its forms everywhere
1.1 By 2030, eradicate extreme poverty for all people everywhere, currently measured as people living on less than US$1.25 a day
1.2 By 2030, reduce at least by half the proportion of men, women and children of all ages living in poverty in all its dimensions according to national definitions
1.3 Implement nationally appropriate social protection systems and measures for all, including floors, and by 2030 achieve substantial coverage of the poor and the vulnerable
1.4 By 2030, ensure that all men and women, particularly the poor and the vulnerable, have equal rights to economic resources, as well as access to basic services, ownership and control over land and other forms of property, inheritance, natural resources, appropriate new technology and financial services, including microfinance
1.5 By 2030, build the resilience of the poor and those in vulnerable situations, and reduce their exposure and vulnerability to climate-related extreme events and other economic, social and environmental shocks and disasters
1.a Ensure significant mobilisation of resources from a variety of sources, including through enhanced development cooperation, to provide adequate and predictable means for developing countries, in particular LDCs, to implement programmes and policies to end poverty in all its dimensions
1.b Create sound policy frameworks, at national, regional and international levels, based on pro-poor and gender-sensitive development strategies to support accelerated investments in poverty eradication actions
Goal 2. End hunger, achieve food security and improved nutrition, and promote sustainable agriculture
2.1 By 2030, end hunger and ensure access by all people, in particular the poor and people in vulnerable situations including infants, to safe, nutritious and sufficient food all year round
2.2 By 2030, end all forms of malnutrition, including achieving by 2025 the internationally agreed targets on stunting and wasting in children under five years of age, and address the nutritional needs of adolescent girls, pregnant and lactating women, and older persons
2.3 By 2030 double the agricultural productivity and the incomes of small-scale food producers, particularly women, indigenous peoples, family farmers, pastoralists and fishers, including through secure and equal access to land, other productive resources and inputs, knowledge, financial services, markets, opportunities for value addition and non-farm employment
2.4 By 2030, ensure sustainable food production systems and implement resilient agricultural practices that increase productivity and production, that help maintain ecosystems, that strengthen capacity for adaptation to climate change, extreme weather, drought, flooding and other disasters, and that progressively improve land and soil quality
2.5 By 2020, maintain genetic diversity of seeds, cultivated plants, farmed and domesticated animals and their related wild species, including through soundly managed and diversified seed and plant banks at national, regional and international levels, and ensure access to and fair and equitable sharing of benefits arising from the utilisation of genetic resources and associated traditional knowledge as internationally agreed
2.a Increase investment, including through enhanced international cooperation, in rural infrastructure, agricultural research and extension services, technology development, and plant and livestock gene banks, to enhance agricultural productive capacity in developing countries, in particular in LDCs
2.b Correct and prevent trade restrictions and distortions in world agricultural markets, including by the parallel elimination of all forms of agricultural export subsidies and all export measures with equivalent effect, in accordance with the mandate of the Doha Development Round
2.c Adopt measures to ensure the proper functioning of food commodity markets and their derivatives, and facilitate timely access to market information, including on food reserves, in order to help limit extreme food price volatility
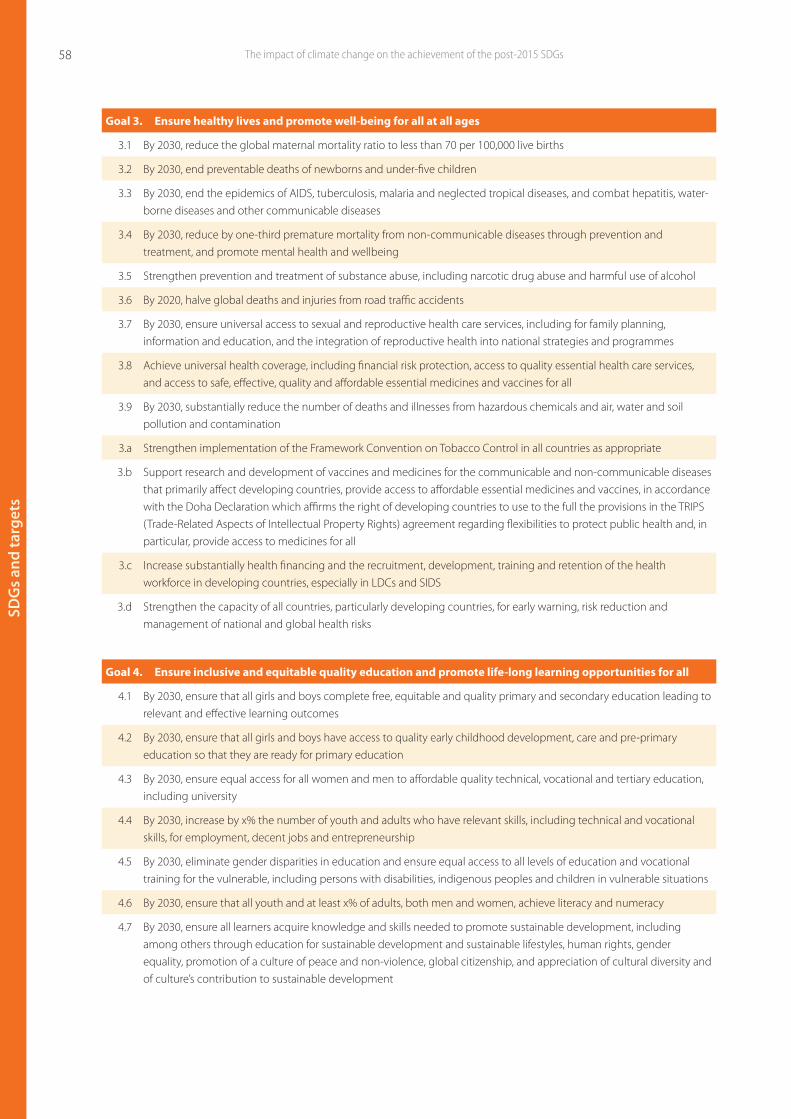
The impact of climate change on the achievement of the post-2015 SDGs58
SDG
s an
d ta
rget
s
Goal 3. Ensure healthy lives and promote well-being for all at all ages
3.1 By 2030, reduce the global maternal mortality ratio to less than 70 per 100,000 live births
3.2 By 2030, end preventable deaths of newborns and under-five children
3.3 By 2030, end the epidemics of AIDS, tuberculosis, malaria and neglected tropical diseases, and combat hepatitis, water-borne diseases and other communicable diseases
3.4 By 2030, reduce by one-third premature mortality from non-communicable diseases through prevention and treatment, and promote mental health and wellbeing
3.5 Strengthen prevention and treatment of substance abuse, including narcotic drug abuse and harmful use of alcohol
3.6 By 2020, halve global deaths and injuries from road traffic accidents
3.7 By 2030, ensure universal access to sexual and reproductive health care services, including for family planning, information and education, and the integration of reproductive health into national strategies and programmes
3.8 Achieve universal health coverage, including financial risk protection, access to quality essential health care services, and access to safe, effective, quality and affordable essential medicines and vaccines for all
3.9 By 2030, substantially reduce the number of deaths and illnesses from hazardous chemicals and air, water and soil pollution and contamination
3.a Strengthen implementation of the Framework Convention on Tobacco Control in all countries as appropriate
3.b Support research and development of vaccines and medicines for the communicable and non-communicable diseases that primarily affect developing countries, provide access to affordable essential medicines and vaccines, in accordance with the Doha Declaration which affirms the right of developing countries to use to the full the provisions in the TRIPS (Trade-Related Aspects of Intellectual Property Rights) agreement regarding flexibilities to protect public health and, in particular, provide access to medicines for all
3.c Increase substantially health financing and the recruitment, development, training and retention of the health workforce in developing countries, especially in LDCs and SIDS
3.d Strengthen the capacity of all countries, particularly developing countries, for early warning, risk reduction and management of national and global health risks
Goal 4. Ensure inclusive and equitable quality education and promote life-long learning opportunities for all
4.1 By 2030, ensure that all girls and boys complete free, equitable and quality primary and secondary education leading to relevant and effective learning outcomes
4.2 By 2030, ensure that all girls and boys have access to quality early childhood development, care and pre-primary education so that they are ready for primary education
4.3 By 2030, ensure equal access for all women and men to affordable quality technical, vocational and tertiary education, including university
4.4 By 2030, increase by x% the number of youth and adults who have relevant skills, including technical and vocational skills, for employment, decent jobs and entrepreneurship
4.5 By 2030, eliminate gender disparities in education and ensure equal access to all levels of education and vocational training for the vulnerable, including persons with disabilities, indigenous peoples and children in vulnerable situations
4.6 By 2030, ensure that all youth and at least x% of adults, both men and women, achieve literacy and numeracy
4.7 By 2030, ensure all learners acquire knowledge and skills needed to promote sustainable development, including among others through education for sustainable development and sustainable lifestyles, human rights, gender equality, promotion of a culture of peace and non-violence, global citizenship, and appreciation of cultural diversity and of culture’s contribution to sustainable development

59The draft SDGs and targetsThe impact of climate change on the achievement of the post-2015 SDGs
SDG
s and targets
4.a Build and upgrade education facilities that are child, disability and gender sensitive and provide safe, non-violent, inclusive and effective learning environments for all
4.b By 2020, expand by x% globally the number of scholarships for developing countries, in particular LDCs, SIDS and African countries, to enrol in higher education, including vocational training, information and communications technology (ICT), technical, engineering and scientific programmes in developed countries and other developing countries
4.c By 2030, increase by x% the supply of qualified teachers, including through international cooperation for teacher training in developing countries, especially LDCs and SIDS
Goal 5. Achieve gender equality and empower all women and girls
5.1 End all forms of discrimination against all women and girls everywhere
5.2 Eliminate all forms of violence against all women and girls in public and private spheres, including trafficking and sexual and other types of exploitation
5.3 Eliminate all harmful practices, such as child, early and forced marriage and female genital mutilations
5.4 Recognise and value unpaid care and domestic work through the provision of public services, infrastructure and social protection policies, and the promotion of shared responsibility within the household and the family as nationally appropriate
5.5 Ensure women’s full and effective participation and equal opportunities for leadership at all levels of decision-making in political, economic and public life
5.6 Ensure universal access to sexual and reproductive health and reproductive rights as agreed in accordance with the Programme of Action of the ICPD and the Beijing Platform for Action and the outcome documents of their review conferences
5.a Undertake reforms to give women equal rights to economic resources, as well as access to ownership and control over land and other forms of property, financial services, inheritance and natural resources, in accordance with national laws
5.b Enhance the use of enabling technologies, in particular ICT, to promote women’s empowerment
5.c Adopt and strengthen sound policies and enforceable legislation for the promotion of gender equality and the empowerment of all women and girls at all levels
Goal 6. Ensure availability and sustainable management of water and sanitation for all
6.1 By 2030, achieve universal and equitable access to safe and affordable drinking water for all
6.2 By 2030, achieve access to adequate and equitable sanitation and hygiene for all, and end open defecation, paying special attention to the needs of women and girls and those in vulnerable situations
6.3 By 2030, improve water quality by reducing pollution, eliminating dumping and minimising release of hazardous chemicals and materials, halving the proportion of untreated wastewater, and increasing recycling and safe reuse by x% globally
6.4 By 2030, substantially increase water-use efficiency across all sectors and ensure sustainable withdrawals and supply of freshwater to address water scarcity, and substantially reduce the number of people suffering from water scarcity
6.5 By 2030, implement integrated water resources management at all levels, including through transboundary cooperation as appropriate
6.6 By 2020, protect and restore water-related ecosystems, including mountains, forests, wetlands, rivers, aquifers and lakes
6.a By 2030, expand international cooperation and capacity-building support to developing countries in water and sanitation related activities and programmes, including water harvesting, desalination, water efficiency, wastewater treatment, recycling and reuse technologies
6.b Support and strengthen the participation of local communities for improving water and sanitation management

The impact of climate change on the achievement of the post-2015 SDGs60
SDG
s an
d ta
rget
s
Goal 7. Ensure access to affordable, reliable, sustainable and modern energy for all
7.1 By 2030, ensure universal access to affordable, reliable and modern energy services
7.2 Increase substantially the share of renewable energy in the global energy mix by 2030
7.3 Double the global rate of improvement in energy efficiency by 2030
7.a By 2030, enhance international cooperation to facilitate access to clean energy research and technologies, including renewable energy, energy efficiency, and advanced and cleaner fossil fuel technologies, and promote investment in energy infrastructure and clean energy technologies
7.b By 2030, expand infrastructure and upgrade technology for supplying modern and sustainable energy services for all in developing countries, particularly LDCs and SIDS
Goal 8. Promote sustained, inclusive and sustainable economic growth, full and productive employment and decent work for all
8.1 Sustain per capita economic growth in accordance with national circumstances, and in particular at least 7% per annum GDP growth in the least-developed countries
8.2 Achieve higher levels of productivity of economies through diversification, technological upgrading and innovation, including through a focus on high value added and labour-intensive sectors
8.3 Promote development-oriented policies that support productive activities, decent job creation, entrepreneurship, creativity and innovation, and encourage formalisation and growth of micro-, small- and medium-sized enterprises including through access to financial services
8.4 Improve progressively through 2030 global resource efficiency in consumption and production, and endeavour to decouple economic growth from environmental degradation in accordance with the 10-year framework of programmes on sustainable consumption and production, with developed countries taking the lead
8.5 By 2030, achieve full and productive employment and decent work for all women and men, including for young people and persons with disabilities, and equal pay for work of equal value
8.6 By 2020, substantially reduce the proportion of youth not in employment, education or training
8.7 Take immediate and effective measures to secure the prohibition and elimination of the worst forms of child labour, eradicate forced labour and, by 2025, end child labour in all its forms, including recruitment and use of child soldiers
8.8 Protect labour rights and promote safe and secure working environments of all workers, including migrant workers, particularly women migrants, and those in precarious employment
8.9 By 2030, devise and implement policies to promote sustainable tourism which creates jobs, promotes local culture and products
8.10 Strengthen the capacity of domestic financial institutions to encourage and to expand access to banking, insurance and financial services for all
8.a Increase Aid for Trade support for developing countries, particularly LDCs, including through the Enhanced Integrated Framework for LDCs
8.b By 2020, develop and operationalise a global strategy for youth employment and implement the ILO Global Jobs Pact

61The draft SDGs and targetsThe impact of climate change on the achievement of the post-2015 SDGs
SDG
s and targets
Goal 9. Build resilient infrastructure, promote inclusive and sustainable industrialisation and foster innovation
9.1 Develop quality, reliable, sustainable and resilient infrastructure, including regional and trans-border infrastructure, to support economic development and human well-being, with a focus on affordable and equitable access for all
9.2 Promote inclusive and sustainable industrialisation, and by 2030 raise significantly industry’s share of employment and GDP in line with national circumstances, and double its share in LDCs
9.3 Increase the access of small-scale industrial and other enterprises, particularly in developing countries, to financial services, including affordable credit, and their integration into value chains and markets
9.4 By 2030, upgrade infrastructure and retrofit industries to make them sustainable, with increased resource use efficiency and greater adoption of clean and environmentally sound technologies and industrial processes; all countries taking action in accordance with their respective capabilities
9.5 Enhance scientific research, upgrade the technological capabilities of industrial sectors in all countries, particularly developing countries, including by 2030 encouraging innovation and increasing the number of research and development workers per one million people by x% and public and private research and development spending
9.a Facilitate sustainable and resilient infrastructure development in developing countries through enhanced financial, technological and technical support to African countries, LDCs, LLDCs and SIDS
9.b Support domestic technology development, research and innovation in developing countries, including by ensuring a conducive policy environment for inter alia industrial diversification and value addition to commodities
9.c s Significantly increase access to ICT and strive to provide universal and affordable access to internet in LDCs by 2020
Goal 10. Reduce inequality within and among countries
10.1 By 2030, progressively achieve and sustain income growth of the bottom 40% of the population at a rate higher than the national average
10.2 By 2030, empower and promote the social, economic and political inclusion of all, irrespective of age, sex, disability, race, ethnicity, origin, religion or economic or other status
10.3 Ensure equal opportunity and reduce inequalities of outcome, including through eliminating discriminatory laws, policies and practices and promoting appropriate legislation, policies and actions in this regard
10.4 Adopt policies, especially fiscal, wage, and social protection policies, and progressively achieve greater equality
10.5 Improve regulation and monitoring of global financial markets and institutions and strengthen implementation of such regulations
10.6 Ensure enhanced representation and voice of developing countries in decision-making in global international economic and financial institutions in order to deliver more effective, credible, accountable and legitimate institutions
10.7 Facilitate orderly, safe, regular and responsible migration and mobility of people, including through implementation of planned and well-managed migration policies
10.a Implement the principle of special and differential treatment for developing countries, in particular LDCs, in accordance with World Trade Organization (WTO) agreements
10.b Encourage Official Development Assistance (ODA) and financial flows, including foreign direct investment, to states where the need is greatest, in particular LDCs, African countries, SIDS and LLDCs, in accordance with their national plans and programmes
10.c By 2030, reduce to less than 3% the transaction costs of migrant remittances and eliminate remittance corridors with costs higher than 5%

The impact of climate change on the achievement of the post-2015 SDGs62
SDG
s an
d ta
rget
s
Goal 11. Make cities and human settlements inclusive, safe, resilient and sustainable
11.1 By 2030, ensure access for all to adequate, safe and affordable housing, and basic services, and upgrade slums
11.2 By 2030, provide access to safe, affordable, accessible and sustainable transport systems for all, improving road safety, notably by expanding public transport, with special attention to the needs of those in vulnerable situations, women, children, persons with disabilities and older persons
11.3 By 2030, enhance inclusive and sustainable urbanisation and capacities for participatory, integrated and sustainable human settlement planning and management in all countries
11.4 Strengthen efforts to protect and safeguard the world’s cultural and natural heritage
11.5 By 2030, significantly reduce the number of deaths and the number of affected people and decrease by y% the economic losses relative to GDP caused by disasters, including water-related disasters, with the focus on protecting the poor and people in vulnerable situations
11.6 By 2030, reduce the adverse per capita environmental impact of cities, including by paying special attention to air quality, municipal and other waste management
11.7 By 2030, provide universal access to safe, inclusive and accessible, green and public spaces, particularly for women and children, older persons and persons with disabilities
11.a Support positive economic, social and environmental links between urban, peri-urban and rural areas by strengthening national and regional development planning
11.b By 2020, increase by x% the number of cities and human settlements adopting and implementing integrated policies and plans towards inclusion, resource efficiency, mitigation and adaptation to climate change, resilience to disasters; develop and implement in line with the forthcoming Hyogo Framework for holistic disaster risk management at all levels
11.c Support LDCs, including through financial and technical assistance, for sustainable and resilient buildings utilising local materials
Goal 12. Ensure sustainable consumption and production patterns
12.1 Implement the 10-Year Framework of Programmes on sustainable consumption and production (10YFP), all countries taking action, with developed countries taking the lead, taking into account the development and capabilities of developing countries
12.2 By 2030, achieve sustainable management and efficient use of natural resources
12.3 By 2030, halve per capita global food waste at the retail and consumer level, and reduce food losses along production and supply chains including post-harvest losses
12.4 By 2020, achieve environmentally sound management of chemicals and all wastes throughout their life cycle in accordance with agreed international frameworks and significantly reduce their release to air, water and soil to minimise their adverse impacts on human health and the environment
12.5 By 2030, substantially reduce waste generation through prevention, reduction, recycling and reuse
12.6 Encourage companies, especially large and trans-national companies, to adopt sustainable practices and to integrate sustainability information into their reporting cycle
12.7 Promote public procurement practices that are sustainable in accordance with national policies and priorities
12.8 By 2030, ensure that people everywhere have the relevant information and awareness for sustainable development and lifestyles in harmony with nature
12.a Support developing countries to strengthen their scientific and technological capacities to move towards more sustainable patterns of consumption and production
12.b Develop and implement tools to monitor sustainable development impacts for sustainable tourism which creates jobs, promotes local culture and products

63The draft SDGs and targetsThe impact of climate change on the achievement of the post-2015 SDGs
SDG
s and targets
12.c Rationalise inefficient fossil fuel subsidies that encourage wasteful consumption by removing market distortions, in accordance with national circumstances, including by restructuring taxation and phasing out those harmful subsidies, where they exist, to reflect their environmental impacts, taking fully into account the specific needs and conditions of developing countries and minimising the possible adverse impacts on their development in a manner that protects the poor and the affected communities
Goal 13. Take urgent action to combat climate change and its impacts * *Acknowledging that the UNFCCC is the primary international, inter-governmental forum for negotiating the global response
to climate change .
13.1 Strengthen resilience and adaptive capacity to climate related hazards and natural disasters in all countries
13.2 Integrate climate change measures into national policies, strategies and planning
13.3 Improve education, awareness-raising and human and institutional capacity on climate change mitigation, adaptation, impact reduction and early warning
13.a Implement the commitment undertaken by developed country Parties to the UNFCCC to a goal of mobilising jointly US$100 billion annually by 2020 from all sources to address the needs of developing countries in the context of meaningful mitigation actions and transparency on implementation and fully operationalise the Green Climate Fund through its capitalisation as soon as possible
13.b Promote mechanisms for raising capacities for effective climate change related to planning and management in LDCs, including focusing on women, youth, local and marginalised communities
Goal 14. Conserve and sustainably use the oceans, seas and marine resources for sustainable development
14.1 By 2025, prevent and significantly reduce marine pollution of all kinds, particularly from land-based activities, including marine debris and nutrient pollution
14.2 By 2020, sustainably manage and protect marine and coastal ecosystems to avoid significant adverse impacts, including by strengthening their resilience, and take action for their restoration, to achieve healthy and productive oceans
14.3 Minimise and address the impacts of ocean acidification, including through enhanced scientific cooperation at all levels
14.4 By 2020, effectively regulate harvesting, and end overfishing, illegal, unreported and unregulated (IUU) fishing and destructive fishing practices, and implement science-based management plans, to restore fish stocks in the shortest time feasible at least to levels that can produce maximum sustainable yield as determined by their biological characteristics
14.5 By 2020, conserve at least 10% of coastal and marine areas, consistent with national and international law and based on best available scientific information
14.6 By 2020, prohibit certain forms of fisheries subsidies which contribute to overcapacity and overfishing, and eliminate subsidies that contribute to IUU fishing, and refrain from introducing new such subsidies, recognising that appropriate and effective special and differential treatment for developing and least developed countries should be an integral part of the WTO fisheries subsidies negotiation117
14.7 By 2030, increase the economic benefits to SIDS and LDCs from the sustainable use of marine resources, including through sustainable management of fisheries, aquaculture and tourism
14.a Increase scientific knowledge, develop research capacities and transfer marine technology, taking into account the Intergovernmental Oceanographic Commission Criteria and Guidelines on the Transfer of Marine Technology, in order to improve ocean health and to enhance the contribution of marine biodiversity to the development of developing countries, in particular SIDS and LDCs
14.b Provide access for small-scale artisanal fishers to marine resources and markets
14.c Ensure the full implementation of international law, as reflected in UNCLOS (United Nations Convention on the Law of the Sea) for states parties to it, including, where applicable, existing regional and international regimes for the conservation and sustainable use of oceans and their resources by their parties

The impact of climate change on the achievement of the post-2015 SDGs64
SDG
s an
d ta
rget
s
Goal 15. Protect, restore and promote sustainable use of terrestrial ecosystems, sustainably manage forests, combat desertification, and halt and reverse land degradation and halt biodiversity loss
15.1 By 2020, ensure conservation, restoration and sustainable use of terrestrial and inland freshwater ecosystems and their services, in particular forests, wetlands, mountains and drylands, in line with obligations under international agreements
15.2 By 2020, promote the implementation of sustainable management of all types of forests, halt deforestation, restore degraded forests, and increase afforestation and reforestation by x% globally
15.3 By 2020, combat desertification, and restore degraded land and soil, including land affected by desertification, drought and floods, and strive to achieve a land-degradation neutral world
15.4 By 2030, ensure the conservation of mountain ecosystems, including their biodiversity, to enhance their capacity to provide benefits which are essential for sustainable development
15.5 Take urgent and significant action to reduce degradation of natural habitat, halt the loss of biodiversity, and by 2020 protect and prevent the extinction of threatened species
15.6 Ensure fair and equitable sharing of the benefits arising from the utilisation of genetic resources, and promote appropriate access to genetic resources
15.7 Take urgent action to end poaching and trafficking of protected species of flora and fauna, and address both demand and supply of illegal wildlife products
15.8 By 2020, introduce measures to prevent the introduction and significantly reduce the impact of invasive alien species on land and water ecosystems, and control or eradicate the priority species
15.9 By 2020, integrate ecosystems and biodiversity values into national and local planning, development processes, poverty reduction strategies and accounts
15.a Mobilise, and significantly increase from all sources, financial resources to conserve and sustainably use biodiversity and ecosystems
15.b Mobilise significantly resources from all sources and at all levels to finance sustainable forest management, and provide adequate incentives to developing countries to advance sustainable forest management, including for conservation and reforestation
15.c Enhance global support to efforts to combat poaching and trafficking of protected species, including by increasing the capacity of local communities to pursue sustainable livelihood opportunities
Goal 16. Promote peaceful and inclusive societies for sustainable development, provide access to justice for all and build effective, accountable and inclusive institutions at all levels
16.1 Significantly reduce all forms of violence and related death rates everywhere
16.2 End abuse, exploitation, trafficking and all forms of violence and torture against children
16.3 Promote the rule of law at the national and international levels, and ensure equal access to justice for all
16.4 By 2030, significantly reduce illicit financial and arms flows, strengthen recovery and return of stolen assets, and combat all forms of organised crime
16.5 Substantially reduce corruption and bribery in all its forms
16.6 Develop effective, accountable and transparent institutions at all levels
16.7 Ensure responsive, inclusive, participatory and representative decision-making at all levels
16.8 Broaden and strengthen the participation of developing countries in the institutions of global governance
16.9 By 2030, provide legal identity for all, including birth registration
16.10 Ensure public access to information and protect fundamental freedoms, in accordance with national legislation and international agreements

65The draft SDGs and targetsThe impact of climate change on the achievement of the post-2015 SDGs
SDG
s and targets
16.a Strengthen relevant national institutions, including through international cooperation, for building capacities at all levels, in particular in developing countries, for preventing violence and combating terrorism and crime
16.b Promote and enforce non-discriminatory laws and policies for sustainable development
Goal 17. Strengthen the means of implementation and revitalise the global partnership for sustainable development
Finance
17.1 Strengthen domestic resource mobilisation, including through international support to developing countries, to improve domestic capacity for tax and other revenue collection
17.2 Developed countries to implement fully their ODA commitments, including to provide 0.7% of gross national income (GNI) in ODA to developing countries of which 0.15–0.20% to LDCs
17.3 Mobilise additional financial resources for developing countries from multiple sources
17.4 Assist developing countries in attaining long-term debt sustainability through coordinated policies aimed at fostering debt financing, debt relief and debt restructuring, as appropriate, and address the external debt of highly indebted poor countries to reduce debt distress
17.5 Adopt and implement investment promotion regimes for LDCs
Technology
17.6 Enhance North–South, South–South and triangular regional and international cooperation on and access to science, technology and innovation, and enhance knowledge sharing on mutually agreed terms, including through improved coordination among existing mechanisms, particularly at UN level, and through a global technology facilitation mechanism when agreed
17.7 Promote development, transfer, dissemination and diffusion of environmentally sound technologies to developing countries on favourable terms, including on concessional and preferential terms, as mutually agreed
17.8 Fully operationalise the Technology Bank and STI (Science, Technology and Innovation) capacity-building mechanism for LDCs by 2017, and enhance the use of enabling technologies in particular ICT
Capacity building
17.9 Enhance international support for implementing effective and targeted capacity-building in developing countries to support national plans to implement all sustainable development goals, including through North–South, South–South, and triangular cooperation
Trade
17.10 Promote a universal, rules-based, open, non-discriminatory and equitable multilateral trading system under the WTO, including through the conclusion of negotiations within its Doha Development Agenda
17.11 Increase significantly the exports of developing countries, in particular with a view to doubling the LDC share of global exports by 2020
17.12 Realise timely implementation of duty-free, quota-free, market access on a lasting basis for all LDCs consistent with WTO decisions, including through ensuring that preferential rules of origin applicable to imports from LDCs are transparent and simple, and contribute to facilitating market access
Systemic issues
Policy and institutional coherence
17.13 Enhance global macroeconomic stability including through policy coordination and policy coherence
17.14 Enhance policy coherence for sustainable development
17.15 Respect each country’s policy space and leadership to establish and implement policies for poverty eradication and sustainable development

The impact of climate change on the achievement of the post-2015 SDGs66
SDG
s an
d ta
rget
s
Multi-stakeholder partnerships
17.16 Enhance the global partnership for sustainable development complemented by multi-stakeholder partnerships that mobilise and share knowledge, expertise, technologies and financial resources to support the achievement of sustainable development goals in all countries, particularly developing countries
17.17 Encourage and promote effective public, public–private, and civil society partnerships, building on the experience and resourcing strategies of partnerships
Data, monitoring and accountability
17.18 By 2020, enhance capacity-building support to developing countries, including for LDCs and SIDS, to increase significantly the availability of high-quality, timely and reliable data disaggregated by income, gender, age, race, ethnicity, migratory status, disability, geographic location and other characteristics relevant in national contexts
17.19 By 2030, build on existing initiatives to develop measurements of progress on sustainable development that complement GDP, and support statistical capacity-building in developing countries
Source: https://sustainabledevelopment.un.org/focusdgs.html

67The impact of climate change on the achievement of the post-2015 SDGs
Annex: Analytical methods used and models deployed
The estimates of how different climate agreements may affect the SDGs, involved: (a) linking economic growth to poverty reduction; and (b) modelling the changes in energy under the different RCP/SSP combinations. This annex describes the calculations and methods used.
A.1 Calculations of poverty changes with growth
One of the key factors in reducing poverty is growth in the economy. The relationship between growth in GDP per capita and changes in the poverty headcount rate has been studied in some depth. The parameter that links the two is the elasticity of poverty reduction with respect to growth. This gives the percentage fall in poverty per one percent increase in GDP per capita. The elasticity may vary due to a number of factors, of which perhaps the most important one is how pro-poor the growth is. If growth policies exacerbate inequality the growth may not reduce poverty by much, or at all. Some studies based on World Bank data show that, while the poverty elasticity of growth is 2 on average, and 4 in countries with an income Gini coefficient of 0.3 and lower, it is zero in countries with a Gini coefficient of 0.6 and higher. In this study we calculated the Gini coefficient for each region and applied the relationship between the Gini coefficient and poverty elasticity of growth as described above. This was done given forecasts of GDP per capita growth to 2030 for East Asia, South Asia, sub-Saharan Africa and LAC. For example if the Gini coefficient in a region is 0.3 and GDP per capita is estimated to grow by 20% between 2015 and 2030 then poverty will decline by (20% × 0.3) 6%. For Gini coefficients between 0.3 and 0.6 a linear relationship was assumed for the decline in the elasticity.
In the case studies we did not use the Gini coefficient link to the elasticity but instead estimated the actual value based on national data, going back to the late 1990s.
A.2 SDG 7 and the use of GCAM
A well-known Integrated Assessment Model (GCAM118) was run to compare the RCP/SSP combinations for the high- and low-ambition agreement to see how non-fossil energy shares compare. GCAM was one of the four models chosen by the Intergovernmental Panel on Climate Change (IPCC) to create the RCPs for the IPCC’s Fifth Assessment Report (AR5). It is a dynamic, recursive, economic partial equilibrium model driven by assumptions about population size and labour productivity that determines GDP in 32 geopolitical regions operating on 5-year time steps from 1990 to 2100. An important feature of the GCAM architecture is the terrestrial carbon cycle model embedded within the agriculture-land-use system model. Thus, all land uses and land covers, including the non-commercial lands, are fully integrated into the economic modelling in GCAM. This coverage gives GCAM the capability to model policies that jointly cover carbon in all activities in the energy, agriculture, forest and other land uses.

The impact of climate change on the achievement of the post-2015 SDGs68
The model assumes that targets are met by making the energy switches where they are least costly and all countries are part of the assessed programme. The results are shown in Table A1. There is a big difference between the two climate agreement scenarios in terms of these energy shares; globally the high-ambition agreement increases non-fossil energy to around 21% by 2030 compared to only 12% with the low-ambition agreement. There are also notable differences between the regions, which reflect the options available and the costs associated with them. Furthermore, the model also provides estimates of changes in trade between regions and shows greater increases in global trade for the high-ambition agreement.
An important consideration related to energy shifts is the cost. Again, many models have estimated the additional costs of making the shift to low-carbon technologies required to attain the 2ºC target. The figures are summarised in the recent IPCC AR5 report on mitigation options and indicate a range of 0–1.5% of GDP,119 with a few outliers coming up with higher figures. The total cost depends on assumptions on the rate at which the costs of renewable energy sources decline, the development of carbon capture and storage technology, the acceptability of nuclear etc. It also depends on wider considerations about the spill over benefits of new technology, notably the co-benefits of lower levels of local pollution. As far as the SDGs are concerned, the important factor is how much such costs are borne by the developing countries. That will depend on the way in which mitigation programmes are financed and in particular how much support is given to developing countries to make the shift to low-carbon technologies. These issues are very much at the heart of the current negotiations on a climate treaty.
Table A1. Non-fossil energy consumption as a percentage of total energy consumption
Region 2010 2020 2030 2040 2050
High-ambition agreement
Africa 43 43 35 29 32
South Asia 25 27 28 35 54
China & SE Asia 12 12 18 23 29
LAC 21 23 25 27 33
Global 13 16 21 26 33
Low-ambition agreement
Africa 43 34 29 26 24
South Asia 25 17 15 25 15
China & SE Asia 12 7 8 8 9
LAC 21 18 18 18 19
Global 13 11 12 13 14
Source: Estimates made for this study based on the GCAM model

The impact of climate change on the achievement of the post-2015 SDGs 69Annex
A.3 Metrics used in the risk of failure tables
Legend used in tables showing risk of failure to achieve the SDGs by 2030
Very high risk of failure to achieve the SDG
High risk of failure to achieve the SDG
Medium risk of failure to achieve the SDG
Low risk of failure to achieve the SDG
Very low risk of failure to achieve the SDG
High con�dence
Medium con�dence
Low con�dence
Risk of failure to achieve a SDG – Combines the likelihood of failing to achieve a SDG with the magnitude of departure from the SDG for a given climate agreement scenario.
Likelihood – The chance of an event or outcome occurring. We consider potential outcomes for two plausible scenarios of climate agreement and shared socioeconomic pathways.
Magnitude of departure from the SDG – Expresses how far or near the development outcome is to the level of development required by the SDG. For example, whether most of the targets under the SDG are achieve or whether most of the targets are nearly achieved.
Confidence – The degree to which the findings of the assessment are considered valid, based on the type, amount, quality and consistency of evidence, as well as the degree of agreement on the evidence.
Uncertainty – The degree to which an outcome cannot be precisely known, for example due to natural variability, limitations of models and the fact that the future cannot be known.
Very high risk of failure to achieve the SDG – Very likely (90–100% probability) that the SDG will not be achieved and potential for substantial departure from the SDG. Very unlikely to achieve the SDG.
High risk of failure to achieve the SDG – Likely (66–100% probability) that the SDG will not be achieved and potential for moderate to substantial departure from the SDG. Unlikely to achieve the SDG.
Medium risk of failure to achieve the SDG – About as likely as not (33–66% probability) that the SDG will not be achieved and potential for moderate departure from the SDG. About as likely as not to achieve
the SDG.
Low risk of failure to achieve the SDG – Unlikely (0–33% probability) that the SDG will not be achieved and potential for small departure from the SDG. Likely to achieve the SDG.
Very low risk of failure to achieve the SDG – Very unlikely (0–10% probability) that the SDG will not be achieved and potential for negligible departure from the SDG. Very likely to achieve the SDG.
Note that the probability ranges that are given are indicative ranges considered in expert judgement and the probability of achieving the SDG was not assessed quantitatively.
The levels of confidence used are:
Low – Expert view of potential implications for SDGs based on limited information, e.g. anecdotal evidence, or very simplistic estimation methods based on historical information.
Medium – Estimation of potential implications for SDGs based on reliable information, e.g. evidence of causal links or analytical estimation methods based on historical information and projected data.
High – Reliable analysis and methods, with a strong theoretical basis. This includes modelling or analytical methods that have made use of climate or SSP projections.

The impact of climate change on the achievement of the post-2015 SDGs70
Table A2. Metrics table and narrative for each SDG
SDG Results based on modelling, relative score or expert opinion of the authors
Narrative
1. Poverty Modelling and expert opinion The GCAM model is used to estimate changes in the number of people below the poverty line of US$1.25120 per day under the two climate agreement scenarios.
5. Gender equality
Relative score and expert opinion
Estimated based on recent observed trends available in the literature, each country’s progress towards achieving the MDGs, and the authors’ understanding of how a potential climate agreement might influence the gender equality SDG.
6. Water and sanitation
Relative score and expert opinion
Estimated based on recent observed trends available in the literature, each country’s progress towards achieving the MDGs, and the authors’ understanding of how a potential climate agreement might influence the access to safe drinking water and improved sanitation facilities.
7. Energy Modelling and expert opinion The GCAM model is used to estimate changes in the non-fossil energy shares under the two climate agreement scenarios.

The impact of climate change on the achievement of the post-2015 SDGs 71
Endnotes1. This final report presents the findings
from this research in full. The research has been carried out by HR Wallingford and Metroeconomica for CDKN.
2. The SDGs considered in this study are the proposed goals by the Open Working Group (OWG) of the UN General Assembly, which are being negotiated by governments during 2015 (see page 57).
3. The development of separate Representative Concentration Pathways (RCPs) and Shared Socioeconomic Pathways (SSPs) scenarios was a process initiated by the IPCC in 2010 (see http://sedac.ipcc-data.org/ddc/ar5_scenario_process/). Rather than starting with socioeconomic scenarios that give rise to alternative greenhouse gas emissions, the new scenarios take alternative futures in global greenhouse gas and aerosol concentrations as their starting point. These RCPs can be used in parallel by Integrated Assessment Models (IAMs) to explore alternative socioeconomic conditions that would result in such future atmospheric composition changes. In principle the SSPs can be combined with any of the RCPs, although the IPCC research community recognised that some of the combinations maybe inconsistent (e.g. a high level of radiative forcing with a rapid shift to renewables).
4. The Integrated Assessment Modelling Consortium (IAMC), a scientific organisation, coordinated the review and release of the RCPs.
5. Researchers from the Integrated Assessment Modelling (IAM) and Impacts, Adaptation and Vulnerability (IAV) communities developed the SSP storylines/narratives. O’Neill, B.C., Carter, T.R., Ebi, K.L., Edmonds, J., Hallegatte, S., Kemp-Benedict, E., Kriegler, E., Mearns, L., Moss, R., Riahi, K., van Ruijven, B., van Vuuren, D. (2012) Workshop on The Nature and Use of New Socioeconomic Pathways for Climate Change Research, Boulder, CO, November 2-4, 2011. Meeting Report Final Version, March 12, 2012. (http://www.isp.ucar.edu/socio-economic-pathways).
6. See Waldhoff, S. and Edmonds, J. (2013) ‘RCPs and SSPs: What are they and where are they going?’ Presentation to the GTSP
Annual Meeting, College Park, MD, 2 October (http://www.globalchange.umd.edu/data/gtsp/workshops/2013/Day2/Waldhoff_RCP_SSP_2013-10-02.pdf ).
7. Hanasaki, N., Fujimori, S., Yamamoto, T., Yoshikawa, S., Masaki, Y., Hijioka, Y., Kainuma, M., Kanamori, T., Masui, T., Takahashi, K. and Kanae, S. (2013) ‘A global water scarcity assessment under shared socio-economic pathways – part 1: water use’. Hydrology and Earth System Sciences 17: 2375–2391.
8. ToPDAd (2014) Overview of system responsiveness to climate change impacts in energy, transport and tourist sectors. Deliverable 2.3. Tool-supported Policy-Development for Regional Adaptation.
9. 9 Hiroyuki, I., Kobayashi, S., Kanae, S., Hasegawa, T., Fujimori, S., Shin, Y., Takahashi, K., Masui, T., Tanaka, A. and Honda, Y. (2014). ‘Global-scale projection and its sensitivity analysis of the health burden attributable to childhood undernutrition under the latest scenario framework for climate change research.’ Environmental Research Letters 9: 064014.
10. van Vuuren, D.P., Kriegler, E., O’Neill, B.C., Ebi, K.L., Riahi, K., Carter, T.R., Edmonds, J., Hallegatte, S., Kram, T., Mathur, R. and Winkler, H. (2013) ‘A new scenario framework for climate change research: scenario matrix architecture’. Climatic Change 122: 373–386. doi:10.1007/s10584-013-0906-1.
11. NCE (2014) Better Growth, Better Climate. The New Climate Economy Report. Washington, DC: The New Climate Economy, The Global Commission on the Economy and Climate.
12. Knutti, R. and Sedláček, J. (2013) ‘Robustness and uncertainties in the new CIMP5 climate model projections’. Nature Climate Change 3: 369–373. doi:10.1038/nclimate1716. Also in IPCC (2013). Climate change 2013: the physical science basis. Contribution of Working Group I to the Fifth Assessment Report of the Intergovernmental Panel on Climate Change [Stocker, T.F., Qin, D., Plattner, G-K., Tignor, M., Allen, S.K., Boschung, J., Nauels, A., Xia, Y., Bex, V. and Midgley, P.M. (eds.)]. Cambridge, UK and New York, NY: Cambridge University. Technical Summary. Figure TS-15.

The impact of climate change on the achievement of the post-2015 SDGs72
13. Weyant, J., Azar, C., Kainuma, M., Kejun, J., Nakicenovic, N., Shukla, P.R., La Rovere, E. and Yohe, G. (2009) Report of 2.6 Versus 2.9 Watts/m2 RCPP Evaluation Panel. Geneva: IPCC Secretariat.
14. Meinshausen, M., Smith, S.J., Calvin, K., Daniel, J.S., Kainuma, M.L.T., Lamarque, J.-F., Matsumoto, K., Montzka, S.A., Raper, S.C.B., Riahi, K., Thomson, A., Velders, G.J.M. and van Vuuren, D.P.P. (2011) ‘The RCP greenhouse gas concentrations and their extensions from 1765 to 2300’. Climatic Change 109 (1–2): 213–241. doi:10.1007/s10584-011-0156-z.
15. Riahi, K., Rao, S.,Krey, V., Cho, C., Chirkov, V., Fischer, G., Kindermann, G., Nakicenovic, N. and Rafaj, P. (2011) ‘RCP8.5 – A scenario of comparatively high greenhouse gas emissions’. Climatic Change 109: 33–57. doi:10.1007/s10584-011-0149-y.
16. Committee on Climate Change (2013) Fourth Carbon Budget Review – part 1. Assessment of climate risk and the international response. London: Committee on Climate Change. See also IPCC (2014) Climate Change 2014: Impacts, Adaptation and Vulnerability. Working Group II contribution to the Fifth Assessment Report of the Intergovernmental Panel on Climate Change. [Barros, V.R., Field, C.B., Dokken, D.J., Mastrandrea, M.D., Mach, K.J., Bilir, T.E., Chatterjee, M., Ebi, K.L., Estrada, Y.O., Genova, R.C., Girma, B., Kissel, E.S., Levy, A.N., MacCracken, S., Mastrandrea, P.R. and White, L.L. (eds)]. Cambridge, UK and New York: Cambridge University Press (http://www.ipcc.ch/report/ar5/wg2/).
17. Dessens, O., Anandarajah, G. and Gambhir, A. (2014) Review of existing emissions pathways and evaluation of decarbonisation rates. AVOID 2.
18. Seymour, F. (2008) Forests, climate change, and human rights: Managing risk and trade-offs. Bogor, Indonesia: Center for International Forestry Research.
19. Ibid.
20. http://ec.europa.eu/clima/policies/international/negotiations/future/index_en.htm
21. A 2°C temperature rise by 2100, on pre-industrial levels, has previously been established as the upper safe limit that allows for a stable climate system, although several recent studies claim that 2°C is not a safe limit (http://www.climateemergencyinstitute.com/2c.html).
22. Outcome document – ‘Introduction to the Proposal of the Open Working Group for Sustainable Development Goals’ (https://sustainabledevelopment.un.org/content/documents/4518SDGs_FINAL_Proposal%20of%20OWG_19%20July%20at%201320hrsver3.pdf ).
23. Ravillion, M. (2004) ‘Pro-poor Growth: A Primer’. World Bank Policy Research Working Paper 3242. Washington, DC: World Bank.
24. World Bank (2006) World Development Report 2006: Equity and Development. Washington, DC: World Bank, and New York: Oxford University Press.
25. This study assumes a linear function between the elasticity of poverty reduction with respect to growth, fitted to the values given in the text.
26. IPCC (2014) Op. cit.
27. Ibid.
28. Anon. (2013) Food security in Africa: Issues, challenges and lessons. Assessing progress in Africa toward the Millennium Development Goals. MDG Report 2013. United Nations Economic Commission for Africa, African Union, African Development Bank Group, and United Nations Development Programme.
29. Brody, A., Demetriades, J. and Esplen, E. (2008). Gender and climate change: Mapping the linkages. A scoping study on knowledge and gaps. Brighton: BRIDGE, Institute of Development Studies.
30. Wilbanks, T.J., Romero Lankao, P., Bao, M., Berkhout, F., Cairncross, S., Ceron, J.-P., Kapshe, M., Muir-Wood, R. and Zapata-Marti, R. (2007) ‘Industry, settlement and society’, in Parry, M.L., Canziani, O.F., Palutikof, J.P., van der Linden, P.J. and Hanson, C.E. (eds) Climate change 2007: Impacts, adaptation and vulnerability. Contribution of Working Group II to the Fourth Assessment Report of the Intergovernmental Panel on Climate Change. Cambridge, UK: Cambridge University Press.
31. Bessuges, P., Bloom, G., Fileccia, T., Graham, A. and Sisto, I. (2008) ‘Module 1: Introduction’, in Socio-economic and gender analysis (SEAGA) for emergency and rehabilitation programmes. Rome: World Food Program and Food and Agriculture Organization of the United Nations (http://www.fao.org/docrep/008/y5702e/y5702e03.htm).

The impact of climate change on the achievement of the post-2015 SDGs 73Endnotes
32. World Bank (2012) World Development Report 2012: Gender Equality and Development. Washington, DC: World Bank.
33. Roudi-Fahimi, F. and Moghadam, V. (2003) ‘Empowering women, developing society: Female education in the Middle East and North Africa’. MENA Policy Brief. Washington, DC: Population Reference Bureau.
34. Fitzgerald Reading, B. (2011) ‘Data highlights: Education leads to lower fertility and increased prosperity’. Earth Policy Institute (http://www.earth-policy.org/data_highlights/2011/highlights13).
35. Inter-agency Task Force on Gender and Water (2006) ‘Gender, Water and Sanitation: A Policy Brief’. UN-Water and Interagency Network on Women and Gender Equality (http://www.un.org/waterforlifedecade/pdf/un_water_policy_brief_2_gender.pdf ).
36. Kim, S.H., Edmonds, J., Lurz, J., Smith, S.J. and Wise, M. (2006) ‘The ObjECTS framework for integrated assessment: Hybrid modeling of transportation’. The Energy Journal 27: 63–91.
37. UNEP (2011) Towards a green economy: Pathways to sustainable development and poverty eradication. Nairobi: United Nations Environment Programme (http://www.unep.org/greeneconomy/Portals/88/documents/ger/0.0_CoverFrontmatter.pdf ).
38. UNEP (2008) Green Jobs: Towards decent work in a sustainable, low-carbon world. Policy messages and main findings for decision-makers. Nairobi: United Nations Environment Programme.
39. NCE (2014) Op. cit.
40. World Economic Forum (2013) The Green Investment Report: The ways and means to unlock private finance for green growth. Geneva: World Economic Forum.
41. NCE (2014) Op. cit.
42. UNEP (2014) The adaptation gap report 2014. Nairobi: United Nations Environment Programme.
43. Watkiss, P., Baarsch, F., Trabacchi, C., Caravani, A., de Bruin, K., Mullan, M., Ockenden, S. and Stadelmann, M. (2014) ‘The adaptation funding gap’, in UNEP The adaptation gap report 2014. Nairobi: United Nations Environment Programme.
44. Index Mundi (undated) ‘Jamaica GDP – composition by sector’. (http://www.indexmundi.com/jamaica/gdp_composition_by_sector.html).
45. Index Mundi (undated) ‘Dominica GDP – composition by sector’. (http://www.indexmundi.com/dominica/gdp_composition_by_sector.html).
46. PPCR (2011) Dominica Pilot Program for Climate Resilience (PPCR). First Joint Mission. July 20–22, 2011. Aide-Memoire. Dominica: Pilot Program for Climate Resilience.
47. Commonwealth of Dominica (2012) Second national communication on climate change. Roseau: Environmental Coordinating Unit, Ministry of Environment, Natural Resources, Physical Planning and Fisheries (http://unfccc.int/resource/docs/natc/dmanc2.pdf ).
48. PPCR (2011). Op. cit.
49. Richards, P. (2012) ‘Dominica seeks millions for climate change strategy’. Inter Press Service News Agency (http://www.ipsnews.net/2012/03/dominica-seeks-millions-for-climate-change-strategy/).
50. UN Jamaica (2011) United Nations Development Assistance Framework Jamaica 2012–2016. Kingston, Jamaica: United Nations Jamaica.
51. Planning Institute of Jamaica (2009) Vision 2030 Jamaica: National development plan. Kingston: Planning Institute of Jamaica.
52. NOAA Coral Reef Conservation Program (undated) ‘Tourism and recreation’. (http://coralreef.noaa.gov/aboutcorals/values/tourismrecreation/).
53. IPPC (2014). Op. cit.
54. CDKN (2014) A mitigation analysis of CDKN priority countries. Understanding the current mitigation landscape to help inform the development of intended nationally determined contributions (INDCs). London: Climate and Development Knowledge Network.
55. Ibid.
56. Climate Investment Funds (2012) Low-Carbon Climate-Resilient Development Strategy 2012-2020. [Dominica]: Climate Investment Funds.
57. CCCRA (2012) The Caribsave Climate Change Risk Atlas (CCCRA): Climate change risk profile for Jamaica. Christ Church, Barbados and London: Caribsave.
58. Planning Institute of Jamaica (2009) Op. cit.
59. Poverty headcount ratio at national poverty lines (% of population).

The impact of climate change on the achievement of the post-2015 SDGs74
60. Dominica has submitted a joint statement as part of the coalition of rainforest nations calling for an agreement that raises the pre-2020 ambition and gives, inter-alia, a fully integrated role to REDD+ and to an enhanced role for coastal and marine ecosystems for climate mitigation and adaptation in such an agreement (see http://unfccc.int/files/documentation/submissions_from_parties/adp/application/pdf/adp2-5_submission_by_cfrn_20140604.pdf ).
61. Anon. (2014) ‘Caricom draws climate change deal red line’. Jamaica Observer (http://www.jamaicaobserver.com/environment/Caricom-draws-climate-change-deal-red-line_17891849).
62. National Poverty Line (NPL) is the minimum level of income considered adequate in a particular country. National estimates of poverty are based on population-weighted estimates from household surveys and definitions of the poverty line vary considerably among nations. For example, rich nations generally employ more generous standards of poverty than poor nations. For Jamaica the NPL figure was 34,414 Jamaican Dollars per person per year in 2000. Converting this to 2015 US dollars would give a value of $3.06 per person per day.
63. We use the NPL when data on the poverty count of people under PPP US$1.25 per day are not available. In the case of Jamaica we could not get these data.
64. Kairi Consultants (2010) Country Poverty Assessment – Dominica: reducing poverty in the face of vulnerability. The Caribbean Development Bank.
65. These projections are based on estimates for middle income countries in the region as we do not have specific estimates for Dominica.
66. Yonetani, M. et al (2014) Global Estimates 2014. People displaced by disasters. Geneva: Internal Displacement Monitoring Centre.
67. John, N. (2014) Commonwealth of Dominica national review on the implementation of the Beijing Declaration and Platform for Action (1995) and the outcomes of the Twenty Third Special Session of the General Assembly (2000). Commonwealth of Dominica: Bureau of Gender Affairs, Ministry of Social Services, Community Development and Gender Affairs.
68. Commonwealth Foundation (2013) A civil society review of progress towards the Millennium Development Goals in Commonwealth countries. National Report: Jamaica. London: Commonwealth Foundation.
69. UNDP (2011) Ensuring gender equity in climate change financing. New York: United Nations Development Programme.
70. UNWTO and UN Women (2011) Global Report on Women in Tourism 2010. Preliminary Findings. Madrid: World Tourism Organization, and New York: United Nations Entity for Gender Equality and the Employment of Women.
71. Deare, F. (2004) A methodological approach to gender analysis in natural disaster assessment: A guide for the Caribbean. CEPAL-SERIE Manuales. Washington, DC: United Nations, Sustainable Development and Human Settlements Division, Women and Development Unit.
72. Ibid.
73. CCCRA (2012) Op. cit.
74. Auth, K., Konold, M., Musolino, E. and Ochs, A. (2012) Caribbean Sustainable Energy Roadmap (C-SERMS), Phase 1. Summary and Recommendations for Policymakers (working draft as of June). Washington, DC: CARICOM, Worldwatch Institute and Inter-American Development Bank.
75. Makhijani, S., Ochs, A., Weber, M., Konold, M., Lucky, M. and Ahmed, A. (2013) Jamaica Sustainable Energy Road Map: Pathways to an affordable, reliable, low-emission electricity system. Washington, DC: Worldwatch Institute.
76. This target may soon be raised to 30%. Planning Institute of Jamaica (2009) Op. cit.
77. In Bangladesh, a developing country with limited financial resources, a not-for-profit company has installed more than 100,000 solar home systems since 1996 and aims to reach 1 million households by 2015. So far, the programme has employed 660 women for installing, repairing and maintaining the PV systems, and has trained over 600 local youth as certified technicians. The company aims to create 100,000 jobs through renewable energy and related businesses.
78. Climate Investment Funds (2012) Op. cit.
79. Ibid.
80. Auth (2012) Op. cit.

The impact of climate change on the achievement of the post-2015 SDGs 75Endnotes
81. Antigua and Barbuda, The Bahamas, Barbados, Belize, Dominica, Grenada, Guyana, Haiti, Jamaica, Montserrat, St. Kitts and Nevis, St. Lucia, St. Vincent and the Grenadines, Suriname, and Trinidad and Tobago.
82. Planning Commission (2007) Pakistan in the 21st Century: Vision 2030. Islamabad: Planning Commission, Government of Pakistan.
83. World Bank (2014) ‘Enhancing development dialogue’. Pakistan Policy Paper Series. Washington, DC: World Bank (http://www.worldbank.org/en/country/pakistan/brief/pakistan-policy-paper-series-enhancing-development-dialogue).
84. CDKN (2014) Op. cit.
85. Ibid.
86. Chaudhry, Q., Mallick, S. and Sohail, M. (2011) National Climate Change Policy – Draft. Islamabad: Ministry of Environment, Government of Pakistan.
87. Khan, M.A.A. and Pervaiz, A. (2012) National Sustainable Development Strategy: Pakistan’s pathway to a sustainable & resilient future. [Islamabad]: Government of Pakistan.
88. Pakistan2025 (2014) One Nation – One Vision. Government of Pakistan.
89. These are in US$PPP at 2011 prices.
90. Khan, M.A.A., Amir, P., Ramay, S.A., Munawar, Z. and Ahmad, V. (2011) National Economic and Environmental Development Study (NEEDS): Pakistan. Pakistan: ENVORK and UNFCCC.
91. Government of Pakistan (2013). Pakistan Millennium Development Goals Report 2013. Pakistan: Planning Commission, Government of Pakistan.
92. Ratio of girls to boys.
93. Ministry of Planning, Development and Reform (2013) Pakistan Millennium Development Goals Report 2013. Islamabad: Ministry of Planning, Development and Reform, Government of Pakistan.
94. GSP Online (http://www.gsp.gov.pk/index.php?option=com_content&view=article&id=30:thar-coal&catid=1:data).
95. Government of Pakistan (2012). National Sustainable Development Strategy. Pakistan’s Pathway to a Sustainable & Resilient Future. Islamabad, Pakistan: Ministry of Climate Change.
96. CDKN (2014) Op. cit.
97. Ibid.
98. Government of Uganda (2013) Uganda National Climate Change Costed Implementation Strategy: Annex C to the National Climate Change Policy. Kampala: Ministry of Environment and Water.
99. CDKN (undated) ‘Economic assessment of the impacts of climate change in Uganda’. London: CDKN (http://cdkn.org/project/economic-assessment-of-the-impacts-of-climate-change-in-uganda/).
100. National Planning Authority (Undated) Uganda Vision 2040. [Kampala]: Government of Uganda (http://npa.ug/wp-content/themes/npatheme/documents/vision2040.pdf ).
101. These figures are in PPP$ at 2011 prices.
102. Gable, S., Lofgren, H. and Osorio-Rodarte, I. (2014) The post-2015 global agenda: A framework for country diagnostics. Washington, DC: World Bank (https://openknowledge.worldbank.org/handle/10986/20802).
103. Shi, W. and Tao, F. (2014). ‘Vulnerability of African maize yield to climate change and variability during 1961–2010’. Food Security 6(4): 471–481 (http://link.springer.com/article/10.1007/s12571-014-0370-4).
104. USAID (2011). US International Food Assistance Report. Written and submitted to the US Congress by the Office of Food for Peace, in conjunction with the US Department of Agriculture and USAID/Farmer-to-Farmer Program.
105. OPM (2012). The 2010–2011 Integrated Rainfall Variability Impacts, Needs Assessment and Drought Risk Management Strategy. Oxford, UK: Oxford Policy Management.
106. UBOS (2010). Uganda Census of Agriculture 2008/2009. Uganda: Uganda Bureau of Statistics.
107. CRED (2014). Centre for Research on the Epidemiology of Disasters, EM-DAT: The International Disasters Database – Uganda.
108. USAID (2011). Op. cit
109. MoFPED (2013) Millennium Development Goals report for Uganda 2013: Drivers of MDG progress in Uganda and the implications for the post-2015 development agenda. Kampala: Ministry of Finance, Planning and Economic Development.

The impact of climate change on the achievement of the post-2015 SDGs76
110. UNDP (2011) Op. cit.
111. WHO and UNICEF (2014). Progress on Sanitation and Drinking-water – 2014 Update. Geneva and New York: World Health Organization and United Nations Children’s Fund.
112. MEMD (2013) Biomass Energy Strategy (BEST) Uganda. Kampala: Ministry of Energy and Mineral Development, Government of Uganda.
113. Energypedia (undated) ‘Uganda energy situation – Energy supply’ (https://energypedia.info/wiki/Uganda_Energy_Situation#Energy_supply).
114. Refers to forms of primary energy – petroleum (crude oil, natural gas liquids and oil from nonconventional sources), natural gas, solid fuels (coal, lignite and other derived fuels), and combustible renewables and waste – and primary electricity, all converted into oil equivalents (source: World Bank).
115. Modern Renewable Energy refers to energy generated from water power, wind power, solar energy, geothermal energy and biomass cogeneration. It also refers to clean fuels derived from renewable energy resources like biogas, ethanol, methanol, hydrogen, biodiesel or solar water heating.
116. MEMD (2007) The Renewable Energy Policy for Uganda. Kampala: Ministry of Energy and Mineral Development, Government of Uganda.
117. Taking into account ongoing WTO negotiations and WTO Doha Development Agenda and Hong Kong Ministerial Mandate.
118. Kim et al (2006) Op. cit.
119. http://www.ipcc.ch/report/ar5/wg3/
120. If data on the US$1.25/day were not available, the NPL data were used.

The impact of climate change on the achievement of the post-2015 SDGs
About CDKNThe Climate and Development Knowledge Network (CDKN) aims to deliver climate compatible development. We do this by providing demand-led research and technical assistance, and channelling the best available knowledge on climate change and development to support policy processes at country and international levels. CDKN is managed by an alliance of five organisations that brings together a wide range of expertise and experience: PricewaterhouseCoopers LLP, Fundación Futuro Latinoamericano, LEAD Pakistan, the Overseas Development Institute and SouthSouthNorth.
This document is an output from a project commissioned through the Climate and Development Knowledge Network (CDKN). CDKN is a programme funded by the UK Department for International Development (DFID) and the Netherlands Directorate-General for International Cooperation (DGIS) for the benefit of developing countries. The views expressed and information contained in it are not necessarily those of or endorsed by DFID, DGIS or the entities managing the delivery of the Climate and Development Knowledge Network, which can accept no responsibility or liability for such views, completeness or accuracy of the information or for any reliance placed on them. This publication has been prepared for general guidance on matters of interest only, and does not constitute professional advice. You should not act upon the information contained in this publication without obtaining specific professional advice. No representation or warranty (express or implied) is given as to the accuracy or completeness of the information contained in this publication, and, to the extent permitted by law, the entities managing the delivery of CDKN, HR Wallingford and Metroeconomica do not accept or assume any liability, responsibility or duty of care for any consequences of you or anyone else acting, or refraining to act, in reliance on the information contained in this publication or for any decision based on it. Management of the delivery of CDKN is undertaken by PricewaterhouseCoopers LLP, and an alliance of organisations including Fundación Futuro Latinoamericano, LEAD Pakistan, the Overseas Development Institute, and SouthSouthNorth..
Copyright © 2015, Climate and Development Knowledge Network. All rights reserved.
www.cdkn.org e: [email protected]
Photo credits: Cover page: Pichugin Dmitry / Shutterstock.com; p.1: Andy Kristian Agaba/Gates Foundation; p.3: Cliff Hellis/Flickr.com; p.7, p.15, p.38: Asian Development Bank; p.8: cogito ergo imago/Flickr.com; p.13: Laura Elizabeth Pohl/Bread for the World; p.17, p.37: DFID/Russell Watkins; p.18: Breezy Baldwin/Flickr.com; p.19: Vicki Francis/Department for International Development; p.20: Leonidas Konstantinidis/Flickr.com; p.21: John Hanson/ US Army Africa/Flickr.com; p.22: sarahemcc/Flickr.com; p.23: S Bonardt/Flickr.com; p.25: reivax/Flickr.com; p.26: Héctor Mota/Flickr.com; p.27: Gerardo Pesantez/World Bank; p.28: scottmontreal/Flickr.com; p.31: James Willamor/Flickr.com; p.33: WorldWatchEn/Flickr.com; p.34: Heart to Heart International/Flickr.com; p.41: Muzaffar Bukhari/Flickr.com; p.43: Rod Waddington/Flickr.com; p.44: weesam2010/Flickr.com; p.45: Nicola Swann/Flickr.com; p.47, p.54: Pete Lewis/Department for International Development; p.49: Arne Hoel/World Bank; p.50: Global Environment Facility; p.52: Trust for Africas Orphans/Flickr.com
t: +44 (0) 207 212 4111
Editi
ng, d
esig
n an
d la
yout
: Gre
en In
k (w
ww
.gre
enin
k.co
.uk)

Funded by: