THE IMPACT OF CHANGES IN MALAYSIAN REGULATORY FRAMEWORK · PDF filethe impact of changes in...
334
THE IMPACT OF CHANGES IN MALAYSIAN REGULATORY FRAMEWORK ON THE DISCLOSURES OF EXECUTIVE DIRECTORS’ REMUNERATION SITI SERI DELIMA ABDUL MALAK Thesis submitted for the degree of Doctor of Philosophy Business School Faculty of the Professions The University of Adelaide January 2012
-
Upload
hoangkhanh -
Category
Documents
-
view
217 -
download
1
Transcript of THE IMPACT OF CHANGES IN MALAYSIAN REGULATORY FRAMEWORK · PDF filethe impact of changes in...

THE IMPACT OF CHANGES IN MALAYSIAN REGULATORY FRAMEWORK ON THE
DISCLOSURES OF EXECUTIVE DIRECTORS’ REMUNERATION
SITI SERI DELIMA ABDUL MALAK
Thesis submitted for the degree of
Doctor of Philosophy
Business School
Faculty of the Professions
The University of Adelaide
January 2012

2
Table of Contents
ACKNOWLEDGEMENTS ....................................................................................................... 5
LIST OF TABLES ..................................................................................................................... 6
LIST OF FIGURES ................................................................................................................... 7
LIST OF EQUATIONS ............................................................................................................. 8
LIST OF APPENDIX ................................................................................................................ 9
ABSTRACT ............................................................................................................................. 10
Thesis Declaration ................................................................................................................... 12
Chapter 1 Introduction ............................................................................................................. 13
1.0. Preamble ............................................................................................................................... 13
1.1. Research questions ............................................................................................................... 15
1.2. Objectives and motivations .................................................................................................. 15
1.3. Contributions ........................................................................................................................ 18
1.4. Scope of research .................................................................................................................. 19
1.5. Organization of the remaining chapters ............................................................................... 20
Chapter 2 Background on Malaysian capital market and regulatory framework .................... 21
2.0 Introduction .......................................................................................................................... 21
2.1 Overview of the Malaysian capital market ........................................................................... 21
2.2 Malaysian regulatory framework .......................................................................................... 25
2.2.1 The reforms of Malaysian corporate governance framework ...................................... 27
2.2.2 The reforms on Malaysian accounting standards ......................................................... 36
2.3 An overview of Malaysian directors’ remuneration practices and disclosure ..................... 38
2.4 Conclusion ............................................................................................................................. 40
Chapter 3 Literature Review .................................................................................................... 42
3.0 Introduction .......................................................................................................................... 42
3.1 Disclosure of corporate information ..................................................................................... 42
3.2 Theoretical Review ................................................................................................................ 47
3.2.1 Agency Theory ............................................................................................................... 47
3.2.2 Legitimacy Theory ......................................................................................................... 85
3.2.3 Signaling Theory and Proprietary Costs ........................................................................ 96
3.2.4 Proprietary costs and disclosure ................................................................................. 100
3.3 Review of prior empirical studies on the disclosure of executive remuneration ............... 104
3.4 Summary ............................................................................................................................. 114

3
Chapter 4 Hypotheses Development ...................................................................................... 125
4.0 Introduction ........................................................................................................................ 125
4.1 Disclosure of Executive Directors’ Remuneration Pre and Post Reforms ........................... 125
4.2 Determinants of Disclosure of Executive Directors’ Remuneration ................................... 126
4.2.3 Agency Theory ............................................................................................................. 126
4.2.4 Legitimacy Theory ....................................................................................................... 133
4.2.5 Signaling theory and proprietary costs ....................................................................... 135
4.3 Summary of Hypotheses ..................................................................................................... 138
Chapter 5 Research Methodology and Variables Measurement ............................................ 140
5.0 Introduction ........................................................................................................................ 140
5.1 Sampling .............................................................................................................................. 140
5.2 Data collection .................................................................................................................... 143
5.3 Empirical scheme ................................................................................................................ 145
5.4 Model development............................................................................................................ 156
5.5 Variable measurement........................................................................................................ 159
5.5.1 Dependent variables ................................................................................................... 159
5.5.2 The disclosure scoring index ....................................................................................... 160
5.5.3 Independent variables ................................................................................................ 163
5.5.4 Control variables ......................................................................................................... 175
5.6 Summary ............................................................................................................................. 176
Chapter 6 Empirical results and analysis ............................................................................... 184
6.0 Introduction ........................................................................................................................ 184
6.1 Univariate analysis .............................................................................................................. 184
6.1.1 Disclosure of executive directors’ remuneration score .............................................. 185
6.1.2 Descriptive statistics and univariate analysis of between score groups..................... 192
6.2 Bivariate analysis ................................................................................................................. 200
6.2.1 The Pearson Coefficients of Correlation, r .................................................................. 200
6.3 Multivariate analysis ........................................................................................................... 202
6.3.1 Classical Linear Regression Model (CLRM) Assumptions ............................................ 202
6.3.2 Model specifications ................................................................................................... 208
6.3.2 Multiple regression result and discussion .................................................................. 216
6.3.3 Sensitivity analysis ...................................................................................................... 228
6.3.4 Determinants of disclosure of individual executive director’s remuneration ............ 237
6.3.5 Period analysis ............................................................................................................ 245

4
6.3.6 Comparison between high and low disclosure score groups ..................................... 256
6.3.7 Redundant variables tests ........................................................................................... 261
6.4 Summary ............................................................................................................................. 264
Chapter 7 Conclusions ........................................................................................................... 274
7.0 Introduction ........................................................................................................................ 274
7.1 Summary of research .......................................................................................................... 274
7.2 Implications of the findings ................................................................................................. 278
7.3 Limitations of the study ...................................................................................................... 280
7.4 Directions for future research............................................................................................. 283
7.5 Concluding remarks ............................................................................................................ 284
Reference List ........................................................................................................................ 285
APPENDICES ....................................................................................................................... 301

5
ACKNOWLEDGEMENTS
I would like to offer my warmest gratitude to my principal supervisor, Prof. Scott Henderson
for his dedication, guidance and encouragements that had enable me to complete this thesis.
Thank you for being a wonderful mentor and teacher.
I would also like to thank my co-supervisor, Dr Maxwell Bessell for his advices, Dr George
Shan for sharing his wisdoms on statistics and Mrs. Kate Harris for her moral supports. I am
also grateful to all my fellow PhD mates for the experience that we shared together and all
the advices.
Thank you to the entire academic and support staffs at the Faculty of Business for their help
in assisting me to complete my thesis.
Finally, I would like to thank my parents, siblings and family for their undying supports and
love that help me throughout this journey. Thank you, mum and dad for giving me the best
chances in life. To my best friend Lisa (Mu’adz and Damia), you are my family away from
home.
To my dearest husband, words would never be enough to express my gratitude that I always
have you by my side. Thank you for all the love, patience and faith in me. To our little Atief,
may you be born safely and be proud of your mummy.
“I can no other answer make, but, thanks, and thanks.”
William Shakespeare, Twelfth Night

6
LIST OF TABLES Table 1 Number of cases prosecuted by the Securities Commission by years ........................ 35
Table 2 Summary of empirical research on ownership structure and voluntary disclosure .... 65
Table 3 Summary of corporate governance and disclosure studies ......................................... 80
Table 4 Summary of disclosure of executive remuneration studies ...................................... 116
Table 5 Summary of hypotheses and supporting literature ................................................... 139
Table 6 Breakdown of companies for the pooled sample from 2000 to 2008 by sectors ...... 142
Table 7 Distribution of company – years from 2000 to 2008 (N = 1788) ............................. 142
Table 8 Summary of prior studies with similar empirical research framework .................... 148
Table 9 Summary of disclosure scoring index items and scoring values .............................. 161
Table 10 Annual mandatory, voluntary and total score scoring values over 2000 to 2008 ... 162
Table 11 Definition and measurement of independent variables ........................................... 174
Table 12 Definition and measurement of control variables ................................................... 175
Table 13 Descriptive statistics for total executive directors’ remuneration score from 2000 to 2008........................................................................................................................................ 185
Table 14 Descriptive statistics for total voluntary score executive directors’ remuneration score from the period 2000 to 2008 ....................................................................................... 187
Table 15 Distribution of scoring by items for the pooled sample from 2000 to 2008 (n = 1788) ...................................................................................................................................... 189
Table 16 Summary statistics for independent variables of the pooled sample from 2000 to 2008 (n = 1788) ...................................................................................................................... 192
Table 17 Results of Mann Whitney Wilcoxon test on differences between high total score and low total score companies of the pooled sample from 2000 to 2008 (n = 1788) ................... 194
Table 18 Results of Mann Whitney Wilcoxon test on differences between high total voluntary score and low total voluntary score companies of the pooled sample from 2000 to 2008 (n = 1788) ...................................................................................................................................... 198
Table 19 Pearson correlation coefficients for total score (N = 1783) .................................... 201
Table 20 Pearson correlation coefficients for voluntary score (N = 1783)............................ 201
Table 21 Result of the LM Breusch-Pagan tests .................................................................... 209
Table 22 Variance inflation factors for total score ................................................................ 211
Table 23 Variance inflation factors voluntary score .............................................................. 211
Table 24 Correlation matrix for independent variables - quartile director ownership .......... 212
Table 25 Hausman's specification tests ................................................................................. 215
Table 26 Redundant Fixed Effect Tests for cross section fixed effects ................................. 216
Table 27 Result of Wald test of equality of coefficients ....................................................... 224
Table 28 Result of Wald test of equality of coefficients ....................................................... 227
Table 29 Result of redundant variable tests on research empirical framework (Y = Total score) ...................................................................................................................................... 262
Table 30 Result of redundant variable tests on research empirical framework (Y = Voluntary score) ...................................................................................................................................... 263
Table 31 Summary of the results of the hypothesis testing ................................................... 270

7
LIST OF FIGURES
Figure 1 Distribution of paid up capital according to types of investors ................................. 22
Figure 2 Distributions of paid up capital according to nationalities ....................................... 24
Figure 3 Overview of Malaysian disclosure of executive directors' remuneration from 2000 to 2008.......................................................................................................................................... 25
Figure 4 Timeframe for shift to disclosure based regulation ................................................... 28
Figure 5 The status of implementation of the Malaysian corporate governance reforms ....... 34
Figure 6 Average corporate governance score in 2008 ........................................................... 39
Figure 7 Ownership and the extent of agency problems .......................................................... 54
Figure 8 Forms of legitimacy and reasons for legitimacy ....................................................... 88
Figure 9 Research empirical scheme for disclosure of executive directors' remuneration .... 147
Figure 10 Disclosure Index of Executive Directors’ Remuneration ...................................... 177
Figure 11 Total executive director remuneration disclosure score from 2000 to 2008 ......... 186
Figure 12 Total executive directors remuneration voluntary disclosure score from 2000 to 2008........................................................................................................................................ 188
Figure 13 Results of regression for determinants of total score according to periods ........... 252
Figure 14 Results of regression for determinants of total score according to periods using winsorised estimators ............................................................................................................. 253
Figure 15 Results of regression for determinants of voluntary score according to periods .. 254
Figure 16 Results of regression for determinants of voluntary score according to periods using winsorised estimators ................................................................................................... 255

8
LIST OF EQUATIONS
Equation 1 Panel GLS result of determinants of total score from 2000 to 2008 (N=1783) .. 224
Equation 2 Panel GLS result of determinants of voluntary score from 2000 to 2008 (N=1783)................................................................................................................................................ 227
Equation 3 Panel GLS regression for determinants of total score using winsorised estimators (N = 1783) .............................................................................................................................. 230
Equation 4 Panel GLS regression for determinants of voluntary score using winsorised estimators (N=1783) .............................................................................................................. 230
Equation 5 Panel GLS result of determinants of total score from 2000 to 2008 including industry classifications (N=1783) .......................................................................................... 233
Equation 6 Panel GLS result of determinants of total score from 2000 to 2008 including industry classifications using winsorised estimators (N=1783)............................................. 234
Equation 7 Panel GLS result of determinants of voluntary score from 2000 to 2008 including industry classifications (N=1783) .......................................................................................... 235
Equation 8 Panel GLS result of determinants of voluntary score from 2000 to 2008 including industry classifications using winsorised estimators (N=1783)............................................. 236
Equation 9 Logit regression result of determinants of individual director’s remuneration disclosure from 2000 to 2008 (N=1783) ................................................................................ 243
Equation 10 Logit regression result of determinants of individual directors’ remuneration disclosure from 2000 to 2008 using winsorised estimators (N=1783) .................................. 244 Equations 11 to 13 Panel regression for determinants for total score according to periods..252
Equations 14 to 16 Panel regression for determinants for voluntary score according to periods………………………………………………………………………………………254
Equations 17 to 19 Panel regression for determinants of total score according to periods using winsorised estimates………………………………………………………………………...253
Equations 20 to 21 Panel regression for determinants of voluntary score according to periods using winsorised estimates………………………………………………………………….255
Equation 23 Panel regression for determinants of total score for HIGH SCORE GROUP (N= 1075) ...................................................................................................................................... 259
Equation 24 Panel regression for determinants of total score for LOW SCORE GROUP (N=708) .................................................................................................................................. 259
Equation 25 Panel regression for determinants of voluntary score for HIGH SCORE GROUP (N= 843) ................................................................................................................................. 260
Equation 26 Panel regression for determinants of voluntary score for LOW SCORE GROUP (N= 940) ................................................................................................................................. 260

9
LIST OF APPENDIX Appendix 1 List of sample companies ................................................................................... 302
Appendix 2 Sample of companies’ justifications for departure from the MCCG requirements................................................................................................................................................ 308
Appendix 3 Remuneration survey by the MSWG ................................................................. 310
Appendix 4 Descriptive statistics for independent variables ................................................. 311
Appendix 5 Distribution of independent variables from 2000 to 2008 (mean) ..................... 312
Appendix 6 Summary of scoring guide ................................................................................. 313
Appendix 7 Distribution of score per item ............................................................................ 314
Appendix 8 Distribution of total and voluntary score from 2001 to 2008............................. 319
Appendix 9 Definition of an independent director ................................................................ 320
Appendix 10 Eviews output for Equation 1 ........................................................................... 321
Appendix 11 Eviews output for Equation 2 ........................................................................... 322
Appendix 12 Eviews output for Equation 3 ........................................................................... 323
Appendix 13 Eviews output for Equation 3 ........................................................................... 324
Appendix 14 Eviews output for Equation 5 ........................................................................... 325
Appendix 15 Eviews output for equation 6 ........................................................................... 326
Appendix 16 Eviews output for Equation 7 ........................................................................... 327
Appendix 17 Eviews output for Equation 8 ........................................................................... 328
Appendix 18 Eviews output for Equation 9 ........................................................................... 329
Appendix 19 Eviews output for Equation 10 ......................................................................... 330
Appendix 20 Eviews output for Equation 23 ......................................................................... 331
Appendix 21Eviews output for Equation 24 .......................................................................... 332
Appendix 22 Eviews output for Equation 25 ......................................................................... 333
Appendix 23 Eviews output for Equation 26 ......................................................................... 334

10
ABSTRACT
The first objective of this study is to analyse the level of disclosure of executive directors’
remuneration before and after introduction of the Malaysian Code on Corporate Governance
in 2001, the changes in accounting standards FRS 2 ‘Share based payments’ in 2005 and FRS
124 ‘Related party disclosure’ in 2006 and the changes to the Bursa Malaysia Listing Rule.
The study seeks to examine the effectiveness of these reforms in improving the level of
disclosure of executive directors’ remuneration. The second objective is to fill the gaps in
prior study by empirically testing the determinants of the level of disclosure of executive
directors’ remuneration based on agency theory, legitimacy theory, signaling theory and
proprietary costs. These theories are represented by several ownership variables, corporate
governance variables and firm characteristics.
Using an un-weighted disclosure index, this study scored the level of disclosure of executive
directors’ remuneration of 200 publicly listed Malaysian companies over the period of 2000
to 2008. The period captured the revolving nature of the Malaysian regulatory framework on
disclosure of executive directors’ remuneration. The disclosure index is based on prior
studies and the regulatory framework. The dataset is in the form of a panel data and consisted
of 1788 company-years. The study employed non-parametric tests and multivariate analysis
to examine any significant changes in the level of disclosure of executive directors’
remuneration and the determinants of the level of disclosure.
The results showed that there were significant improvements in the level of disclosure of
executive directors’ remuneration after the reforms. However, Malaysian companies

11
appeared to take advantage of weaknesses in the reforms to fall back on the practice of
disclosing minimum of the mandatory requirements. A significant number of Malaysian
companies continued not to disclose on their individual executive directors’ remuneration.
The inconsistencies between the mandatory Listing Rule and the voluntary MCCG made it
easier for companies not to do so. These implied that the ‘hybrid’ approach adopted by the
regulators in implementing in the reforms was not sufficient in ensuring comprehensive
disclosure of executive directors’ remuneration.
Hypothesis tests on the determinants of the level of disclosure of executive directors’
remuneration found that traditional dominance by family shareholders was significant and
limit the extent of disclosure of executive directors’ remuneration. Other agency players
(regulators, foreign investors and creditors) roles appeared to be dwarfed by the presence of
controlling family shareholders. However, government shareholdings alleviated to a certain
extent, this dominance by significantly pushing for compliance with the reforms. Corporate
governance mechanisms of independent directors and level of audit quality were shown to
work differently in different disclosure environments in improving the level of disclosure of
executive directors’ remuneration. The findings also supported the notions of legitimacy
theory and signaling theory that company size, industry differences and profitability were
significantly associated with the level of disclosure. This study also showed that contrary to
expectations of proprietary costs, companies with higher growth were more likely to disclose
the remuneration of individual executive directors.

12
Thesis Declaration
I, SITI SERI DELIMA ABDUL MALAK certify that this works contains no material which
has been accepted for award of any other degree or diploma in any university or other tertiary
institutions and, to the best of my knowledge and belief, contains no material previously
published or written by another person, except where due reference has been made in the text.
I give consent to this copy of my thesis, when deposited in the University Library, being
made available for loan and photocopying, subject to the provisions of the Copyright Act
1968.
I also gave permission for the digital version of my thesis to be made available on the web,
via the University’s digital research repository, the Library catalogue and also through web
search engines, unless permission has been granted by the University to restrict access for a
period of time.

13
Chapter 1 Introduction
1.0. Preamble
“It is shameful” President Barrack Obama of USA (January 2009),
When commenting on the $18billion bonus that Wall Street executives received
The remuneration of executive directors is an issue where there is a high possibility of
conflict and divergence of interests between the outside shareholders and managers (Coulton,
James & Taylor 2001). It is not surprising that there have been various debates on excessive
senior executive remuneration and how performance based remuneration have encouraged
executives to manipulate earnings and engage in misleading corporate reporting practices.
The significant disparity between an executive director’s remuneration and an average
worker’s pay has fuelled debate on the ‘seemingly excessive’ level of remuneration
especially under current economic climate.
Traditional executive directors’ remuneration consisted of a fixed salary and perquisites that
did not have a direct link to the company’s or the executive’s performance. This form of
remuneration did not create incentives for executives to exert additional effort or penalize
them for poor performance. These weaknesses led to incentive based remuneration packages
that included cash bonuses and share based payments. The introduction of share based
payments the remuneration scheme was associated with inflating the total remuneration
received by senior executives.
In Malaysia, the annual average income per capita for the year 2011 was RM 28 725
(Economic Planning Unit, 2011). On the other hand, an average remuneration of Malaysian

14
executive director’s in 2011 was RM 824 000 (Minority Shareholders Watchdog Group,
2011). The highest paid executive in 2010 was from Genting Berhad with a remuneration of
RM 106 million (Chieh 2011). Although the level of Malaysian executive directors’
remuneration was not as exorbitant as their American counterparts, there was serious concern
about the minimal disclosure on remuneration policies and practices in the annual reports
(Minority Shareholders Watchdog Group, 2011). It was difficult for shareholders to gauge the
performance of the executive directors’ in working for them and whether their remuneration
was fair or excessive.
The aftermath of the East Asian financial crisis of 1997 and 1998 lead to the introduction of
the Malaysian Code on Corporate Governance (MCCG) in 2001. It was recommended that
companies disclose individual director’s remuneration and a statement of the principles
behind remuneration policies. The Bursa Malaysia Listing Rules were also amended to
include mandatory disclosure of directors’ remuneration by bands. This was followed by the
harmonization of Malaysian accounting standards with the International Accounting
Standards. The Financial Reporting Standard (FRS) 2 ‘Share based payments’ was
introduced in 2005. It required reporting entities to disclose details of executives’ share based
payments. The FRS 124 ‘Related party disclosure’ was introduced in 1999 and was amended
in 2005 to include disclosure of ‘key management personnel’ remuneration. These reforms
were introduced to improve the level of transparency into the market and to restore investors’
confidence the Malaysian capital market. The issue is whether these reforms are effective in
improving the transparency of remuneration practices and policies in Malaysia and the factors
that may influence the level of adoption to the reforms.

15
1.1. Research questions This study seeks to answer the following questions:
What is the level of total and voluntary disclosure of Malaysian executive directors’
remuneration before and after the reforms to the Malaysian regulatory framework?
Are the reforms to the Malaysian regulatory framework on the disclosure of executive
directors’ remuneration effective in improving the level of disclosure of Malaysian
executive directors’ remuneration? Was there any resistance to the evolving regulatory
changes on the disclosure framework?
What are the determinants of the level of disclosure of Malaysian executive directors’
remuneration? Can agency theory, legitimacy theory, signaling theory and proprietary
costs explain the level of disclosure of executive directors’ remuneration?
1.2. Objectives and motivations The first objective of this study is to examine the level of disclosure of Malaysian executive
directors’ remuneration before and after the introduction of the reforms of the disclosure
framework. Luo, Courtenay and Hossain (2006) argued that a disclosure rich environment
like the US may not capture the influence of the theoretical determinants on the extent of
disclosure. The adoption of an Anglo-American based corporate governance code in a
developing Asian market with distinctive ownership and cultural characteristics, provides an
interesting avenue in to study the extent and effectiveness of disclosure reforms. Chizema
(2008) argued that the introduction of an Anglo-American corporate governance code that
had been designed to maximise shareholders value may be resisted by institutional actors
such as family owners and banks who had largely enjoyed controlling power over company
policies. Prior studies have shown than corporations were resistant to the introduction of
requirements to disclose details of executive remuneration especially individual remuneration
and the valuation of executive options plans (Andjelkovic, Boyle & McNoe 2002; Chizema

16
2008). This study will investigate whether there was similar resistance to the implementation
of the reforms in Malaysian capital market and whether the reforms were effective in
improving the level of disclosure of executive directors’ remuneration.
The second objective is to fill the gaps in existing study of disclosure on directors’
remuneration. Prior studies concentrated on the question of whether remuneration policies
were effective in solving agency problems (Bizjak, Lemmon & Naveen 2008; Clarkson, P,
Van Bueren & Walker 2005; Core, Holthausen & Larcker 1999; Jensen & Murphy 1990;
Murphy 1985; Yermack 1995). However, to examine this issue there must be adequate
disclosure of remuneration data by companies. It is not surprising that a significant number
of the pay and performance studies were done in the US where disclosure requirements had
been extensive for some time. Andjelkovic et al. (2002) argued that the lack of disclosure
meant that shareholders would not be able to scrutinize remuneration and to demand the
board of directors place more emphasis on an association between pay and performance. The
lack of scrutiny may mean that the board of directors would be lax in setting remuneration
policies and disciplining executives. They may instead align their interests with those of the
executives. For example, Core, Holthausen and Larcker (1999) showed that a weak board of
directors may result in excessive CEO remuneration. Consequently, Andjelkovic argued that
there may be a link between the level of disclosure of executive directors’ remuneration and
the pay and performance association. The pay and performance association may be weaker
where there was no public disclosure of executive remuneration than in a country with
extensive disclosure requirement. He showed that the association between pay and
performance was weaker in New Zealand where there was less disclosure requirements on
remuneration than in the US where there were extensive requirements. Coulton et al. (2001)
argued that prior disclosure studies had focused on disclosure policies where the alignment of

17
interests may be likely, such as in external capital raising. There were limited studies on the
disclosure of executives’ remuneration and the factors that may determine their level of
disclosure (Chizema 2008; Clarkson, P, Van Bueren & Walker 2006; Coulton, James &
Taylor 2001; Liu, Jinghui. & Taylor 2008; Nelson, J & Majella 2005).
The final objective of this study is to consider agency theory, legitimacy theory, signaling
theory and proprietary costs influences on the level of disclosure of executive directors’
remuneration during the period of the evolving reforms in the Malaysian capital market. This
study integrates the different theoretical variables to build a comprehensive empirical
framework to test the hypotheses about potential associations between ownership variables,
corporate governance variables and company’s characteristics in shaping the disclosure
policies on executive directors’ remuneration. Prior studies had not integrated these different
theoretical perspectives into a comprehensive empirical framework.
This study offers a unique opportunity of examining the disclosure of directors’ remuneration
from the perspective of the Malaysian capital market where there is high ownership
concentration, dominance by family and state shareholders and regulatory intervention. Prior
studies on these issues had been in Western capital markets that had different capital market
characteristics and more established corporate governance structures. In more widely
dispersed ownership, there is less incentive for outside stockholders to monitor firm
operations. Conversely, a more concentrated ownership could result in greater vigilance by
shareholders and, therefore, increased pressure on directors to discipline executives through
remuneration policies. Disclosure plays an important role in ensuring sufficient information
flow so that outside shareholders may monitor the performance of the executive directors.
Earlier studies have suggested that Malaysian family owners continue to be a major obstacle

18
to the implementation of corporate reforms and in improving the level of public disclosure
(Haniffa & Cooke 2002; Mohd Ghazali & Weetman 2006).
1.3. Contributions The result of this study will be of interest to Malaysian policy makers and shareholders. They
will be able to assess the effectiveness of the reforms to the Malaysian regulatory framework
in improving the level of disclosure of executive directors’ remuneration. The results will be
useful in assessing whether the ‘hybrid method’ or the ‘comply or justify’ method of
corporate governance adopted by the regulators is sufficient to ensure compliance with the
MCCG recommendations on the disclosure of executive directors’ remuneration. The results
may assist shareholders in examining the adequacy of the disclosure of remuneration
information in assessing the performance of executive directors’ as their agents. The results
of the hypothesis testing will also show whether the traditional dominance exerted by the
family and the state in the Malaysian capital market is present in the adoption of the reforms
to the disclosure of executive directors’ remuneration. If so, regulators may have to adopt a
more prescriptive approach to the reforms.
This study fills gaps in existing studies on the disclosure of executives’ remuneration. It
extends prior studies by integrating the different theoretical perspectives offered by agency
theory, legitimacy theory, signaling theory and proprietary costs in influencing the level of
total, voluntary and individual disclosures of executives’ remuneration. This study uses all
the theories rather than employing a single theory as the explanatory theory and holding
others as control variables. In addition, no prior Malaysian studies have examined the level
and the determinants of the disclosure of executive directors’ remuneration prior to and after
the reforms to the Malaysian regulatory framework.

19
1.4. Scope of research This study is grounded in agency theory, legitimacy theory, signaling theory and proprietary
costs. A review of the literature provided a list of the explanatory variables that have been
used to represent the different theoretical perspectives in testing the associations between the
theories and the level of disclosure of Malaysian executive directors’ remuneration. The
variables include ownership variables, corporate governance variables and company
characteristics.
The sample size used in the study is 200 companies listed in the Bursa Malaysia from 2000 to
2008. The nine year period captures the evolving regulatory framework, including the
Malaysian Code of Corporate Governance, the Listing Rule, FRS 2 ‘Share based payments’
and FRS 124 ‘Related party disclosure’. This study also measures the extent of disclosure of
executive directors’ remuneration in excess of the mandatory disclosure requirements. It then
examines the differences between the characteristics of companies that disclose more and
companies that disclose less on executive directors’ remuneration.
This study focuses on the disclosure of executive directors’ remuneration in the annual
reports. Annual reports are probably the main communication between companies and
stakeholders (Branco & Rodrigues 2006). The reforms that were undertaken by Malaysian
regulators mainly dealt with the disclosure of information in the annual reports. Hence, it is
appropriate that this study focused on the disclosure of executive directors’ remuneration in
company annual reports.

20
1.5. Organization of the remaining chapters The remainder of this thesis is organized as follows. Chapter 2 provides an overview of the
Malaysian regulatory framework on disclosure of executive directors’ remuneration. It
examines the evolution of the framework. Chapter 3 provides a review of the current
literature on the theories that may be linked to the disclosure of executive directors’
remuneration. These theories are agency theory, legitimacy theory, signaling theory and
proprietary costs. It also discusses prior studies on disclosure of remuneration. Chapter 4
develops the hypotheses that are employed in the study and provides an overview of the
research empirical framework. In Chapter 5, the research methodology and variable
measurement are outlined. Chapter 6 outlines and discusses the results of the hypotheses
testing. The final chapter provides an overview of the results, their limitations and the
potential for future study.

21
Chapter 2 Background on Malaysian capital market and regulatory
framework
2.0 Introduction This chapter provides an overview of the Malaysian capital market and the regulatory
framework for executive directors’ remuneration. The section on the regulatory reforms
provides a discussion on the process embarked upon by Malaysian regulators to enhance the
corporate governance code and the accounting standards. The final section discusses
Malaysian executive directors’ remuneration policies and disclosure practices.
2.1 Overview of the Malaysian capital market The Malayan Stock Exchange was established in 1960. After the separation of Singapore
from Malaysia in 1964, the Exchange was named the Stock Exchange of Kuala Lumpur and
Singapore. In 1973, the Exchange was split and the Kuala Lumpur Stock Exchange (the
KLSE) was established. The KLSE consisted of the Main Board, the Second Board and the
MESDAQ Market. After a demutualisation exercise in April 2004, the KLSE was renamed
Bursa Malaysia. Subsequently, the Main Board and the Second Board were merged in August
2009 and named the Main Market. The MESDAQ Market was revamped as the ACE Market.
As of November 2011, the total market capitalization of the Main Market and the ACE
Market was RM 27614.95 billion and RM 1063.20 billion respectively1.
Figure 1 gives the distribution of the paid up capital according to the categories of investors in
the Malaysian market. It shows that nominees, corporations and individuals were the majority
of the investors in Malaysian market. Governments (including Malaysian and foreign) also
1 The shareholdings information was obtained from the Minority Shareholder Watchdog Group (MSWG) shareholdings analysis report for the period of 1997 to 2006.

22
had significant shareholdings in the capital market. Banks and investment houses had the
lowest investment in the market.
Figure 1 Distribution of paid up capital according to types of investors
Source: Shareholdings Analysis Report 1997 – 2006 (Minority Shareholders Watchdog Group, 2007)
The distribution of paid up capital shows the percentage of shares according to the types of
investors in Malaysian market. Further studies on the distribution of capital showed that the
Malaysian market is highly concentrated in terms of real ownership. For example, Claessens,
Djankov and Lang (2000) found that 85 percent of Malaysian shares was held by executives

23
related to the controlling family. In addition, they found that 67.2 percent of the shares was
controlled by single family and 13.4 percent was controlled by state or government linked
companies. Mohd Ghazali and Weetman (2006) also noted that significant numbers of
shareholders in Malaysia is ‘insiders’ holding direct and indirect stakes in companies. Fan
and Wong (2002) showed that the average voting right concentration in Malaysian companies
was 30.73 percent. This indicates the presence of dominant shareholders in Malaysian
companies.
Another characteristic of the Malaysian market is the dominant market presence of
government and state entities. There are a significant number of publicly listed companies
that are controlled or owned by the government or state entities. They are called government
linked companies or GLCs. An entity is a GLC if “the government could control (the) entity
(rather than have a percentage of ownership) with a primary commercial objective, either
directly or through GLICs (government linked investment companies). Control is defined as
“the ability to appoint members of the board of directors and senior management and to make
major decisions”(The Putrajaya The Putrajaya Committee 2005, p. 200).
Government linked companies (GLCs) in Malaysia can be divided into three types. There are
firstly companies that are controlled directly through Khazanah Nasional (the investment arm
of government of Malaysia), the National Pension Fund or the Bank Negara (the central bank
of Malaysia). The next type is companies that are controlled indirectly through other federal
government agencies such as the Employee Provident Fund, Permodalan Nasional Berhad
and Tabong Haji (an Islamic investment fund). The last type is companies that are controlled
by state agencies.

24
In 2004, the GLCs were valued at RM 232 billion, which was 32 percent of the value of the
market capitalization of Bursa Malaysia (World Bank 2005, p. 20). The total paid up capital
contributed by Malaysian government entities increased by 141 percent from 1997 to 2006
(The Minority Shareholders Watchdog Group & The University of Nottingham (Malaysia)
2007, p. 18). The Minority Shareholder Watchdog Group (MSWG) noted that the increase in
the government shareholdings seemed to contradict the government ‘transformation plan’ of
reducing stakes in the GLCs. However, the significant improvement in the level of
shareholdings may reflect the Malaysian government efforts to boost the Malaysian capital
market as it recovered from the East Asian financial crisis.
Figure 2 Distributions of paid up capital according to nationalities
Source: Shareholdings Analysis Report 1997 – 2006 (Minority Shareholders Watchdog Group, 2007)
Figure 2 provides the breakdown of the total paid up capital of Malaysian and foreign
investors. It shows that the percentage of foreign paid up capital over total paid up capital
was relatively constant over the period of 1997 to 2006. As of December 2006, the total paid
up capital by foreign investors was RM 36.817 billion. The MSWG noted that the level of

25
foreign investors was still not at the level prior to the East Asian financial crisis. This may
indicate that foreign investors’ confidence had not fully recovered from the crisis.
2.2 Malaysian regulatory framework Figure 3 Overview of Malaysian disclosure of executive directors' remuneration from 2000 to 2008
Figure 3 provides an overview of the Malaysian regulatory framework for the disclosure of
executive directors’ remuneration from 2000 to 2008. Before 2001, there were no specific
provisions or regulations in Malaysia that focused on executive remuneration disclosure.
There were broad guidelines in the existing legal framework that consisted of the Corporation
Acts, Companies Regulation 1999, the KLSE Listing rules, the Malaysian Code on
Takeovers and Mergers 1987 and supplementary regulatory directives from regulatory
bodies. The then Companies Act required companies only to disclose total fees and other
emoluments of the board of directors in the income statement. Disclosures of share based
payments were limited to the names of directors granted options or shares and the class of the
shares. Share based payments were not treated as part of remuneration and no valuation was

26
required (Pascoe 1999). There was a high degree of dependency on self-regulation by
companies and an emphasis on company constitutions to determine corporate governance
procedures. Thus, the disclosure of executive remuneration was voluntary.
The East Asian financial crisis of 1997-1998 affected most East Asian countries including
Malaysia. The crisis that started in Thailand led to the loss of investor confidence for the
whole region’s financial markets. From the end of June 1997 to end of August 1998, the
Bursa Malaysia (the then Kuala Lumpur Stock Exchange) composite index dropped by 72%
(Zulkafli, Abdul Samad & Ismail 2004). The total market capitalization of the Bursa
Malaysia declined from RM 717 billion in 1997 to RM 519 billion in 2003. The Malaysian
market has started a slow recovery and now has a market capitalization of RM 28 678 billion.
Weak corporate governance policies and enforcement in East Asian countries were held to be
largely responsible for the crisis (Aik Leng & Abu Mansor 2005; Tam & Tan 2007). Prior to
the crisis, the rapid growth of East Asian economies was not accomplished by a substantive
and functioning corporate governance structure making them susceptible to moral hazards
and financial externalities (Ngui, Voon & Lim 2008). These moral hazards and financial
externalities led to an erosion of investor confidence in the market and investment values.
There emerged a need to protect stakeholders in the financial market and especially
shareholders with efficient corporate governance policies (Zulkafli, Abdul Samad & Ismail
2004).
Prior to the reforms, there were no specific provisions or regulatory rules in Malaysia that
focused solely on corporate governance. Broad guidelines on corporate governance were

27
offered by the existing legal framework consisting of the Corporations Act, Companies
Regulation 1999, the Malaysian Code on Takeovers and Mergers 1987, the KLSE Listing
Requirements and supplementary regulatory directives from regulatory bodies. There was a
high degree of dependency on Malaysian companies to regulate themselves and emphasis
was placed on the constitution of a company to provide a corporate governance mechanism.
Another factor that influenced these reforms was the progressive shift by the Malaysian
Securities Commission (SC) from merit-based regulation to disclosure-based regulation.
Merit based regulation meant that information was disclosed as needed by the regulators,
such as in assessing the price of financial products offered by companies, the value of assets
for acquisition and the use of proceeds from public offerings (Securities Commission of
Malaysia 2001). This would not encourage the public disclosure of information as regulators
obtained the information directly from the companies rather than from annual reports, to
which non-affiliated or minority shareholders would not have access. This may have
contributed to weaknesses in the corporate governance policies that contributed for the
economic crisis.
2.2.1 The reforms of Malaysian corporate governance framework
Starting in 1995, the SC started to shift from merit-based regulation to disclosure-based
regulation. In 1996, the shift began in earnest with the SC establishing a time frame for full
disclosure-based regulation (see Figure 4). The aim was for regulators to evaluate corporate
proposals from the information disclosed in the publicly available annual reports. Reforms in
Malaysian corporate governance framework would complement this important shift.

28
Figure 4 Timeframe for shift to disclosure based regulation
Source: The Capital Market Master Plan, Securities Commission, 2001, Page 73(Appendix)
A. The Establishment of High Level Finance Committee on Corporate Governance
Recognising the economic fallout from the loss of investor confidence as a result of the lack
of corporate governance structures, on 24th March 1998, the government of Malaysia
established a High Level Finance Committee that consisted of government regulatory bodies
and private sector representatives. The mission of the Committee was to set up a corporate
governance framework and best practice guidelines.
The Committee was divided into two working groups. The first working group (JPK 1)
focused on the establishment of best practices in corporate governance and training and
a1172507
Text Box
NOTE: This figure is included on page 28 of the print copy of the thesis held in the University of Adelaide Library.

29
education. The group consisted mainly of industry participants and was chaired by the
Chairman of the Federation of Public-Listed companies. This was to allow for the standards
to be developed around companies’ needs, making it easier for them to adopt the practices.
However, regulatory bodies were also represented to ensure neutrality and the quality of the
standards. The second working group (JPK 2) was tasked with identifying and providing
recommendations to reform existing corporate regulations and enforcement mechanisms.
This group was chaired by the Securities Commission and consisted of representatives from
regulatory bodies, professional bodies and the corporate sector.
The Committee considered the following approaches in developing the corporate governance
code:
a) Prescriptive approach
This approach involved regulators prescribing a corporate governance code that specified the
expected standards in corporate governance. Companies were expected to comply with these
best standards and to disclose their level of compliance in annual reports. This would remove
the flexibility which companies had in building their corporate governance policies around
their individual needs.
The main concern of the Committee was that companies would resort to ‘box ticking’ of the
standards that had been complied with without considering and actively pursuing the
substance of each standard. This could mislead shareholders and other users into believing
that the companies that ticked most boxes had their corporate governance policies sanctioned
by the regulators. The Committee considered their experience with Malaysian cases of audit

30
committees that were established merely to the requirement to have them, with non-qualified
persons sitting on the committees.
b) Non-prescriptive (self-regulatory) approach
This approach relied on companies voluntary disclosing their actual corporate governance
practices. It allowed companies to develop their own corporate governance framework to suit
their specific needs. However, the Committee argued that the current level of corporate
governance practices and disclosures in Malaysia were very weak. This was evidenced by the
East Asian economic crisis. There was a need to ‘start from scratch’, to develop best
governance standards to improve the corporate governance practices of Malaysian
companies.
It is interesting to note that the Committee in their report considered the case of Australian
self-regulatory practices2 in coming to their conclusions. They argued that the level of
corporate governance practices in Australia would have been fairly advanced for the
Australian regulators to allow the companies flexibility in their corporate governance policies
(Finance Committee on Corporate Governance 2000, p. 83). Australia has since moved from
self-regulation to a prescriptive approach.
c) Hybrid approach
The Committee relied upon the evidence and recommendations of the UK’s Hampel report in
assessing the hybrid approach. The Hampel report was a review of UK existing corporate
governance codes (the Cadbury and Greenbury Codes) and was published on January 19983.
2 Prior to the reform, Australian corporate governance requirement was self-regulatory albeit having best standards 3 The result from this review had since been accepted by the London Stock Exchange.

31
The Hampel report found that the current codes had been applied against in a way that was
contrary to their original intentions, which were to provide benchmarks for good practice in
corporate governance. However, they allowed companies to adopt another alternative, if it
better represents the circumstance. The detailed guidelines provided by the Cadbury and
Greenbury codes were treated by UK companies as prescriptive rules instead of adapting the
best practices that would suit their specific needs (Finance Committee on Corporate
Governance 2000, p. 10). This resulted in ‘box-ticking’ of the established guidelines.
The Hampel report argued that there is no universal corporate governance guideline that
applies to all different companies at all times. Hence, there was a need to put the emphasis on
principles rather than detailed rules of corporate governance. It tried to differentiate between
principles and guidelines on corporate governance. It stated that, “With guidelines, one asks
‘How far are they complied with?”; with principles, the right question is ‘How are they
applied in practice?” (Finance Committee on Corporate Governance 2000, p. 16).”
One of the major recommendation by the Hampel report was that, “the current requirement
for companies to confirm otherwise compliance with Cadbury will be superseded by a
requirement to make a statement to show how they (i) apply the principles and (ii) comply
with the combined code and in the latter case to justify any significance variances (Finance
Committee on Corporate Governance 2000, p. 14).” The narrative disclosure requirement is,
was argued would mitigate the problem of ‘box-ticking’ as companies would now have to
provide arguments to explain why each relevant principle was or was not applied.
Although the Malaysian Committee drew considerably from the Hampel report, it argued that
the Malaysian code was more regulatory driven than the UK’s code. Ow-Yong and Guan

32
(2000) in their comparative review of both countries’ corporate governance codes highlighted
the fact that the implementation of the MCCG was reinforced by major revamps in Malaysian
regulations. This was unlike the reform in the UK’s code, which was not proceeded by major
reforms in their legal framework.
Ownership and control are not separated for many Malaysian companies as they are held
tightly by substantial and non-independent shareholders, such as family and states. This is
unlike UK where ownership is dispersed and control is separate from ownership. There are
fewer incentives for Malaysian companies to disclose information as their substantial
shareholders would be privy to insider information. The complementary regulatory reforms
would ensure that companies adapted to the new corporate governance framework and
consequently protected the interest of minority stakeholders (Ow Yong & Guan 2000).
The Malaysian High Level Finance Committee adopted the hybrid approach in their proposed
corporate governance code for Malaysia. Given that there was no existing or qualified
framework for corporate governance there was a need to prescribe a code for corporate
governance in Malaysia. However, the Malaysian committee took into account the
recommendation by UK’s Hampel Report by putting an emphasis on ‘substance over form’
by incorporating the requirement for a narrative statement on the extent of compliance and a
justification for any departure from the prescribed best standards.
The findings and recommendations by the Committee were published in February 1999. This
was partly incorporated in Malaysian Code on Corporate Governance (MCCG) which was

33
issued in March 2000 and revised in 20074. Part 1(B) and Part 4(B) of MCCG deal with
directors’ remuneration. It was recommended that companies link executive directors’
remuneration to company and individual performance. In addition, they were required to
disclose details of remuneration for each director. These recommendations are enforced by
paragraph 15.26 of the Listing Rules of Bursa Malaysia. However, companies have the
flexibility in applying them, provided that they justify the reasons for any departure. It is also
important to note that the MCCG does not fix the form or content of the disclosure
requirements. It is up to companies to determine the extent and form of disclosures of
executive remuneration. Part 2(AA) of the MCCG recommends that companies establish
remuneration committees that should consist of a majority of non-executive directors who
can seek outside advice if necessary. The committee will make recommendations to the board
about executive remuneration. Executive whose remuneration is discussed should abstain
from voting.
The MCCG and other recommendations from the High Level Finance Committee have been
continuously implemented through revisions of the regulations (changes in the Listing Rules
and securities laws), reforms to institutions (the introduction of Minority Shareholders
Working Group) and the issue of best standard guides (the issue of Best Practices in
Corporate Disclosure by a task force consisting of industry and regulatory representatives).
The Securities Commission reported that as of 31st December 2004, 42.5 percent of the
recommendations by the Committee were completely applied and 47.9% were in progress.
4 The 2007 revision covered the appointments and operations of board of directors and audit committee. There is also requirement for internal audit and clarification of its role.

34
Figure 5 The status of implementation of the Malaysian corporate governance reforms
Source: http://www.sc.com.my/eng/html/cg/implementation.html
The MCCG is enforced under paragraph 15.26 of the Listing Requirements of Bursa
Malaysia. The penalties for non-disclosure will be enforced by Bursa Malaysia under the
Listing Requirements. These can involve requesting the person to comply with the
requirement, issuing a fine proportionate to the seriousness of the offence or by cautioning
the person. Section 11(2) (b) of the Securities Industry (1998) was amended in 2003 to
increase the amount of fines, to a maximum of one million ringgits for a breach of Bursa
Malaysia Listing Requirements. Under Section 11 (2) (e) of the Securities Industry Act 1983,
the penalty for a breach of the listing rules could also be enforced upon directors of the
companies. This personal accountability imposed upon directors is to ensure that they strive
to achieve a high quality of corporate governance.
The Securities Commission (SC) also has the power to act against false or misleading
disclosures by companies. From 1996 to 2004, 29 cases of corporate governance enforcement
actions were taken by the SC (World Bank 2005, p. 32).
a1172507
Text Box
NOTE: This figure is included on page 34 of the print copy of the thesis held in the University of Adelaide Library.

35
Table 1 Number of cases prosecuted by the Securities Commission by years
Type of prosecution cases
1996 1997 1998 1999 2000 2001 2002 2003 2004 Total
Corporate Governance
2 0 0 6 4 5 6 3 3 29
Source: Report on the Observance of Standards and Codes (ROCS) Corporate Governance: Malaysia, the World Bank, June 2005, page 32
B. The establishment of Capital Market Advisory Committee
The High Level Finance Committee recommended that a successor committee be established
to observe and review the implementation of MCCG. The Capital Market Advisory
Committee was established in September 1999 as a successor of the High Level Finance
Committee. This new Committee released the Capital Market Master Plan (CMP) in 2001
that built on and improved the recommendations of its predecessor.
C. The establishment of Corporate Law Reform Committee (CLRC)
The CLRC was established on 17th December 2003 with the objective of reviewing the
Companies Act 1965. The CLRC noted that the recommendations by the High Level Finance
Committee on Corporate Governance should be complemented by statutory provision,
including amendments to the Companies Act. Although there had been prior amendments5
since the Act inception in 1965, they did not involve comprehensive reviews, and only
addressed specific sections of the Act. The CLRC released its final report in November
2008, with 188 recommendations.
5 35 amendments since 1965 to 2007 (Companies Commission of Malaysia, DATE)

36
Directors’ remuneration is covered in the Recommendations 2.29 of the final report. The
CLRC recommended the introduction of a statutory provision giving a right to shareholders
to vote on directors’ remuneration in annual general meeting. It also recommended that
substantial shareholders (5% or more shares) or by a block of 100 members with a right to
vote, be given the right to inspect the contracts of directors. These could lead to more
transparency and accountability.
2.2.2 The reforms on Malaysian accounting standards
Malaysian accounting standards have also undergone major changes especially in the light of
harmonisation with International Accounting Standards (IAS) and a response to the economic
crisis. The Financial Reporting Act 1997 was introduced as part of the reform process. Under
the Act, the Malaysian Accounting Standards Board (MASB) was established to function as
the sole regulatory body in setting accounting standards for Malaysia. The MASB will take
over the roles of Malaysian Association of Certified Public Accountants (MACPA) and
Malaysian Institute of Accountants (MIA) in preparing accounting standards and GAAPs.
Although acknowledging the existence of prior a financial reporting framework under these
bodies, the MASB argued that there was a need to extensively review all existing accounting
standards given that the extant GAAPs were inferior to IAS recommendations and to move
towards harmonisation (Koh, 1999). At its inception, the MASB adopted 24 of the extant
standards which would be revised in accordance with its review and IAS recommendation.
Eight of the extant standards were not adopted and would be replaced by new standards.
To date, MASB has adopted all the IAS into the Malaysian financial reporting framework.
Total convergence to the IAS is expected by early 2012. However, the transitional period has

37
been slow, with most of the revisions done by 2005 and applied for fiscal periods after
January 2006. Two specific standards are relevant for this study. They are FRS 124 ‘Related
Party Disclosure’ and FRS 2 ‘Share Based Payments’. FRS 124 was first issued in Malaysian
in 1999, and revised in 2004 to incorporate the recommendations of the IAS. However, the
revised FRS 124 2004 did not incorporate the recommendations of IAS 24 (the equivalent
international accounting standard for related party disclosure) for disclosure of key
management personnel compensation6. In 2005, another revision was made to Malaysian
FRS 124, with all of the recommendations by IAS incorporated into the FRS, including the
disclosure of key management personnel compensation. The only exception was the
exclusion of disclosure of transactions between state-controlled entities and other state-
controlled entities. The effect of this exemption could be significant as state controlled
entities make up 32 percent the value of market capitalization of Bursa Malaysia as of 2004
(World Bank 2005). The revised FRS 1242005 would take effect for fiscal period after 1st
October 2006.
The other applicable accounting standard for this study is FRS 2 ‘Share-based Payment’. The
Malaysian standard was first issued in 2005 and is consistent with IFRS 2 (the equivalent of
the IAS standard). Specific to this study, companies now have to disclose and expense the
value of option grants to executives over their maturity period. FRS 2 would apply for equity
based payment transactions that were granted after 31st December 2004 and had not been
vested at the date. This transitional provision could mean that there would be limited data on
equity based remuneration before the effective date.
6 IAS 24.16 The IAS 24 paragraph 16 required disclosure of remuneration of key management personnel.

38
The Security Commission (SC) is responsible for ensuring compliance with the Malaysian
accounting standards under Section 26(D) with the Financial Reporting Act 1997. It is
interesting to note that under the Act7, foreign companies listed in Bursa Malaysia are
allowed the option of using the MASB standards or other internationally recognised
accounting standards (on par with IAS). The acceptable international accounting standards
are from US, UK or Australia.
2.3 An overview of Malaysian directors’ remuneration practices and
disclosure
A survey entitled the Corporate Governance Survey Report 2008 conducted by the Minority
Shareholder Watchdog Group (MSWG) and the University of Nottingham provide the most
current information on Malaysian directors’ remuneration practices and disclosure. The
report scored and ranked all publicly listed companies (N = 960 companies) for the fiscal
year 2007 based on their compliance with the MCCG and international best practices. Figure
6 shows the average corporate governance score obtained by the sample in the survey.
7 Section 26(A) of the Financial Reporting Act 1997

39
Figure 6 Average corporate governance score in 2008
The report found that most Malaysian companies (89.58 percent, n = 860) complied with the
MCCG recommendation to establish a remuneration committee that will set up and monitor
remuneration schemes. 45.90 percent (n = 395) of the committees consisted of independent
and non-executive directors and 88.40 percent (n = 761) of the committees were formed to
assess and make recommendations on executive directors’ remuneration.
The report found that there was a lack of transparency and consistency on the disclosure of
remuneration in the annual reports. For example, only 1.39 percent (n = 12) of the companies
provided the details of the members of the remuneration committee in the directors’ report.
59.27 (n = 569) percent of the companies stated industry practice as a remuneration
benchmark and 45.10 percent (n = 433) of the companies specified the link between
executive director’s remuneration and performance. The report also showed that none of the
companies provided adequate information about the policies behind senior executives’ and
board of directors’ remuneration. Only seven companies clearly stated the use of performance

40
based remuneration but no further details were given. The report noted that others may have
done so but failed to disclose it. 39.39 percent of the companies (n = 378) claimed to have
used long term incentives pay such as share-based payment. Finally, only four companies
provided individual director remuneration and 146 companies (15.21 percent) disclosed
additional fees (committee fees and attendance fees) paid to non-executive directors. The
report concluded that there was a serious lack of emphasis on providing adequate information
to shareholders about the policies and practices of remuneration by Malaysian companies. It
argued that the information is important to assuage shareholders’ concerns and to remove
unwarranted speculation.
The study did not use the scores obtained by the report as a basis for its dependent variable of
disclosure. The report provided a good overview of the state of disclosure of directors’
remuneration but was only for one year. The scoring was limited to a few aspects of the
disclosure of remuneration. The scoring was not done on the comprehensiveness of the
information but was limited to either ‘yes’ or ‘no’. It also did not attempt to provide an
explanation of the factors that may determine the level of disclosure. This study will go
beyond describing the state of disclosure of executive directors’ remuneration. Various
theoretical lenses and prior empirical studies of disclosure will be applied to obtain greater
understanding of the level of disclosure of remuneration by Malaysian companies.
2.4 Conclusion This chapter provided an overview of the Malaysian capital market. It also touched on the
process and progress of the reforms undertaken by Malaysian regulators in improving the
regulatory framework and corporate governance code. It also described the voluntary and
mandatory disclosure framework of executive directors’ remuneration. The final section

41
provided an overview of existing practice on the level and disclosure of executive directors’
remuneration based on the most recent survey available.
The next chapter will provide a theoretical background to the theories that may contribute to
the level of disclosure of executive directors’ remuneration. It will also look at prior
empirical studies that have adopted various theoretical perspectives. The chapter will also
address prior studies on disclosure of executive directors’ remuneration.

42
Chapter 3 Literature Review
3.0 Introduction
This chapter provides a review of the different theoretical lenses that can be used to explain
the motives and incentives behind the disclosure of corporate information. The first section
briefly discusses the nature of voluntary and mandatory disclosure and some of the
motivations behind their disclosure. The following sections cover four main theories that may
be associated with the level of disclosure; agency theory, legitimacy theory, signaling theory
and proprietary costs. The basic anatomy of these theories will be discussed and explained by
a review of prior studies. In addition, prior empirical studies on disclosure that have used the
theories in testing their hypotheses will also be reviewed. The final section of the chapter will
look at the findings and the gaps of prior studies on the disclosure of directors’ remuneration.
3.1 Disclosure of corporate information Grossman (1981) and Milgrom (1981) posited that companies have incentives to disclose all
information. Brammer and Pavelin (2008) argued that corporate disclosure provides an
avenue for companies to influence the perceptions of external stakeholders of the future
performance of companies and consequently of their the value. However, various studies
have shown that companies use discretion any disclosure policies. For example, Dye (2001)
and Verrecchia (1983) showed that, in a voluntary environment, companies will withhold
unfavorable news. Deegan (2002) argued that leaving disclosure policies to managers leads to
the disclosure of biased information that gives a positive impression of the company.
Furthermore, managers may only disclose some information when going concern is
threatened. When there is no public policy on disclosure, access to information may be
restricted to powerful stakeholders in a company (Ramanathan 1976). This creates

43
information asymmetry in the market. The abuse of discretionary choices often leads to the
introduction of mandatory disclosure requirements to require more disclosures (Suijs 2005).
Mandatory disclosure reduces management’s ability to disclose only positive and symbolic
information (Mobus, 2005). Francis, Khurana and Pereira (2005) argued that disclosures that
do not offer strong investor protection may not be credible. Mandatory disclosure
requirements should improve the welfare of investors by addressing potential information
asymmetry in the market. They should provide all investors with equal access to the same
information in making decisions (La Porta, R. et al. 2000).
Burkart and Panunzi (2006) showed that regulations can be beneficial if they strengthen the
existing monitoring mechanisms. Complementary rules lower the marginal cost of
monitoring for shareholders, as companies have to provide more disclosure under the law.
This should make the market more attractive to small shareholders who would otherwise
shun the market because of exorbitant monitoring costs and the risks of exploitation by
substantial shareholders. Burkart and Panunzi argued that disclosure requirements and
accounting standards will complement existing monitoring mechanisms. However, if the law
acts as a substitute for monitoring mechanisms, it could aggravate agency conflicts between
minority and substantial shareholders. A substitutive law could reduce the ownership held by
substantial shareholders and decrease the original shareholders’ investment returns. The
substantial shareholders may try to recoup their capital losses by diverting more company
resources to themselves.

44
Although there is value in mandatory disclosure, the regulations may not be adequate or
efficient. Mobus (2005) contended that as the regulations are politically inspired, they can be
limited or captured by those with power to influence them. As a result, regulations can be
biased or inadequate. This may be especially true in Malaysia where regulatory standard
setting is dominated by the same parties that have significant shareholdings. Guedhami and
Pittman (2006) studied 190 privatised companies from 31 countries from 1980 to 2001. They
showed that disclosure standards and the choice of a ‘prominent’ auditor did not reduce
ownership concentration. However, countries with a legal framework that penalised auditors
for reporting failures had a more dispersed share ownership. They argued that enforcement
mechanisms are more effective in ensuring good corporate governance than comprehensive
investor protection laws. Hope (2003) studied the level of enforcement of accounting
standards in 22 countries. He showed that the extent of enforcement significantly influenced
the level of compliance with prescribed accounting standards. The level of enforcement was
also significantly and positively associated with the extent of forecast accuracy.
Kothari (2000) contended that companies should be allowed to set their own disclosure
policies with no regulatory intervention. Stocken (2000) showed that in multiple period
settings with no legal provisions for disclosure, managers will reveal all private information
to the market to protect their reporting credibility. This means that the market may still
efficiently allocate resources over time without disclosure regulations. However, Ahmad and
Sulaiman (2004) did not find evidence to support this proposition. They studied the
disclosure of environmental content in Malaysian annual reports where there was no
mandatory disclosure requirement. They interviewed 48 executives and examined 138 annual
reports and found that legal compliance was rated the highest and stakeholders’ related
influences scored lowest by the correspondents on what influence them in reporting on

45
environmental issues. In addition, only 38 of the sample companies disclosed on
environmental content. They concluded that companies were not affected by stakeholders’
concern for environmental issues and there was a need to impose mandatory disclosure
requirements.
The failure to disclose negative news may lead to executives incurring reputational costs
(1994). Stocken (2000) showed that managers disclose all information truthfully in the long
run to protect their reporting credibility. The market may punish them if they provide
misleading or withhold information. For example, it may affect their standing in the
managerial labour market and reduce the future value of their remuneration contracts.
Wolfson (1985) studied the relationship of general partners and limited partners in oil and gas
tax shelter programs. He assumed that limited partners were the principals and that general
partners were agents. He contended that the general partners have more incentives to take of
advantage of limited partners given their short term investment horizon. However, he found
that general partners’ opportunism will be constrained by the possible effect on their long
term reputation in the market. This concern aligns the interests of the general partners with
those of the limited partners.
Information asymmetry may create inefficiency as the market cannot effectively assess
private information that may lead to mispricing a company’s value. Botosan (1997) found
that a reduction in information asymmetry lead to a reduction in the cost of capital. Similar
findings were reported by Botosan and Plumlee (2002), Welker (1995), Bartov and Bodnar
(1996), Sengupta (1998), Leuz and Verrecchia (2000) and Khurana, Pereira and Martin
(2006). Schadewitz and Blevins (1998) argued that rational investors avoid companies that

46
fail to disclose adequate information because they cannot thoroughly assess the risks and
returns involved in their investment. The market may be less inclined to invest in a company
that withheld bad news and this may affect the company’s value and liquidity (Skinner,
1994). Improvements in information asymmetry may increase liquidity as investors
efficiently and correctly assess the value of companies (Makhija & Patton 2004).
The contents of annual reports are reasonably stable as companies are not likely to make
substantial changes to them on a regular basis (Lang & Lundholm 1993). Consequently, a
comprehensive annual report may be associated with a company’s commitment to
informative disclosure policies (Gelb 2000). A comprehensive disclosure policy reduces
information asymmetry (Debreceny & Rahman 2005). Gelb and Zarowin (2002) studied the
association between the level of disclosure and its influence on share prices. Their findings
supported the notion that better disclosure provided more benefits to investors by helping
them to better predict the future. Francis, Khurana and Pereira (2005), in a sample of
companies across 34 countries, found that companies that required external financing
disclosed more information8. They also found that these companies obtained equity capital
and debt at lower costs than companies with limited disclosure. They argued that this finding
implied that the incentive to voluntarily disclose information operates globally regardless of
any country’s mandatory regulatory environment. Khurana et al. (2006)’s study of US
companies for the period of 1984 to 1994 showed that having access to a lower cost of capital
from an expanded disclosure policy improved company growth.
8 The sample year used was either 1993 or 1995 depending on the availability of the data. The sample consisted of 672 company-year observation spanning over 34 countries.

47
3.2 Theoretical Review This section provides a review of the theories that could frame the study on disclosure of
executive directors’ remuneration. Four theories are explored; they are agency theory,
legitimacy theory, signaling theory and proprietary costs. The sections also discussed prior
empirical studies that have applied the theories in explaining the level of disclosure.
3.2.1 Agency Theory
3.2.1.1 Definition of agency theory
From a traditional economic perspective, a firm is a ‘black box’ with the sole objective of
maximising profit (Jensen 1983). It is assumed that the market is perfect. There is no
information asymmetry and no transaction costs incurred during the contracting process. This
theoretical framework failed to explain how conflicts of interests between various contracting
parties are resolved to achieve a costless equilibrium (Jensen & Meckling 1976). The
criticisms leveled at the ‘black box’ theory of the firm meant that there was a need to redefine
what constitutes a firm. Jensen and Meckling(1976, p. 8) in their seminal work formally
redefined a firm as “one form of a legal fiction which serves as a nexus of a set of contracting
relationships among individuals.” Their definition seeks to explain the nature of the
contractual relationships, the reasons for contracting among different parties, the
consequences of contracting and the effects of external factors on the contracts.
Jensen and Meckling (1976, p. 5) formally defined an agency relationship as “a contract
under which one or more persons (the principal(s)) engage another person (the agent) to
perform on their behalf which involves delegating some decision making authority to the
agent.” An important assumption of agency theory is that an individual is a rational and self
interested utility maximiser who will seek to maximize his or her wealth first and foremost.

48
This assumption leads to a potential divergence of interests between the agent and the
principal. The agent as a rational wealth maximiser may seek to improve his or her wealth
first and foremost and possibly at the expense of the principals. The divergence of interests
between the contracting parties leads to agency problems and consequently agency costs.
3.2.1.2 Agency problems
The wealth of managers is usually tied to their income from employment in a company. They
have less capital than can be diversified to limit their exposure to risks (Easterbrook 1984).
Consequently, they are more risk averse than the shareholders. They may avoid riskier
investments with higher possible returns to protect themselves from losing their employment
if the project fails (Shavell 1979). On the contrary, shareholders have more ability to
diversify their portfolio and would want managers to undertake riskier investment that may
result in higher returns (Cohen, Hall & Viceira 2000). Managers who fully bear the risks of
failure will not undertake such investments. This creates the agency problem of
underinvestment (James 1999).
Another agency problem is the difference in time horizons of managers and shareholders
(Jensen & Meckling 1976). Managers are assumed have a shorter time horizon than
shareholders. This means that they will be more interested in the short term performance of a
company. They are much less interested in the risks that are beyond their employment terms
and basic remuneration incentives (Vitaliano 1983). Under this assumption, managers may
only consider investments that give higher short term returns compared to stable and safe
long term investments. Shareholders with longer investment horizons may prefer otherwise.
Managers also have the incentives to overindulge in personal perquisites using the
companies’ resources. These are resources that should have been used to maximise the wealth

49
of the principals. Jensen and Meckling (1976) argued that managers that have less claim on
ownership will compensate for the lack of returns from shareholdings with the consumption
of pecuniary and non-pecuniary perquisites. They could spend excessive and gratuitous
amounts on business trips, exclusive club memberships and luxury items.
Managers may spend less time in seeking new investments opportunities and ‘shirk’ during
working hours. Managers who want to boost their own self-esteem and reputations might
engage in value destroying empire building. The company may be expanded beyond its
optimal point and not increase its market value (Baker, Jensen & Murphy 1988). These
behaviors are inconsistent with the expectations of the shareholders as the principals and may
eventually lead to a reduction in the value of the company. These problems mean that
contracting between two parties is not costless (Fama & Jensen 1983). These costs are called
agency costs.
3.2.1.3 Agency costs
Agency costs are defined by Jensen and Meckling (1976) as the sum of the monitoring
expenses incurred by principals, bonding expenses incurred by agents and residual losses.
Monitoring costs are incurred by principals to limit opportunistic behavior by agents.
Monitoring costs are not limited to measuring and observing agent behaviors. They may
include control mechanisms that are introduced into remuneration policies, budgets and
operating procedures (Jensen & Meckling 1976). However, it has been argued that, in an
efficient market the monitoring costs will be borne by agents as the principals are price
protected. Price protection is where the principals are assumed to have foreseen that there
will be a divergence of interests between them and the agent (Watts, R & Zimmerman 1986).
This expectation will be incorporated in the contracting process. It may include a reduction in

50
the agent’s future remuneration to compensate for monitoring costs. In this case, the agent
will bear the monitoring cost.
Consequently, it is in the agent’s interest to incur bonding costs to ensure that they will act to
maximise the interests of the principals. Bonding costs may require the agent to prepare
audited annual reports and covenants attached to decision making. In a perfect and efficient
contracting process, a Pareto optimal contract can be constructed that will give the principals
full price protection. The contract will consider all possible opportunistic behaviors and
incorporate mechanisms that will penalize such behaviors (Holmstrom 1979).
Nonetheless, it is impossible have perfect monitoring and bonding mechanisms that will
totally eliminate an agent’s opportunistic behaviours and that will perfectly align the interests
of the agent to those of the principals. There exists a residual loss from the inability to
eliminate agency problems in total. Jensen and Meckling (1976, p. 5) defined this residual
loss as “the dollar equivalent of the reduction in welfare experienced by the principals.”
However, the existence of agency costs does not imply that agency relationship should not be
created in the first place. The principals will have been in the position to assess the marginal
costs and benefits of entering into an agency relationship. Eisenhardt (1989) argued that the
principals will have to weigh in the costs of assessing agents’ actions and the costs of
evaluating performance and transferring risks.
Agency costs are not limited to relationships between managers and the shareholders. The
agency concept can be extended to include relationships between managers and creditors. For
example, managers may use debt financing to invest in risky investments to satisfy

51
shareholders but this increases the risk of debt default. They may also use free cash flows to
give themselves additional bonuses instead of repaying debt. Creditors may use debt
covenants to monitor the actions of managers (Jensen & Meckling 1976). Given that creditors
are also price protected, the cost of the covenants will be borne by managers. There is an
incentive for agents to demonstrate that they are not working against creditors’ interests. For
example, Jensen and Meckling argued that managers are better off voluntarily disclosing
audited information that otherwise would have been collated by creditors and charged to
managers. Given that managers are privy to insider information it will be cheaper for them to
disclose than to incur a bonding cost. Agency costs can also occur in the relationship between
creditors and shareholders. For example, shareholders may seek to improve their wealth at
the expense of the creditors by investing in riskier projects that give higher returns. However,
it will increase the risk of default on the debts. Managers as the middlemen in this
relationship have discretion in this transfer of wealth from one party to another. They could
choose a financial policy mix with the least cost that could maximise their own wealth
(Crutchley & Hansen 1989).
The extent of agency costs is also dependent on the supply and competition in the managerial
labor market. If the managers are not unique and replaceable, they will work for the interests
of the principals in order to maintain their employment (Jensen & Meckling 1976). Managers
also have incentives to maintain their reputation in the managerial labor market (Fama 1980).
Furthermore, shareholders always have the right to sell their ownership of a company. There
could be investors in the market who have the capacity to better monitor the agents or became
owner managers. If existing shareholders believe that they will get the full value of the
company from selling the shares compare to losing value due to agency problems and

52
incurring the costs of replacing managers from holding to the shares, they have an incentive
to sell (Jensen & Meckling 1976).
3.2.1.4 Agency costs and ownership structure
An important assumption of agency theory is that market forces determine the contract
between an agent and principal. If either party is not satisfied with the contractual terms, he
or she has the freedom to renegotiate or exit from the contracting process and seek a better
alternative (Hill & Jones 1992). The definitive contract is the most efficient and optimal
contract. However, the market is not necessarily efficient. For example, a better contracting
alternative may not exist due to a limited supply of agents. The agent would then have an
upper hand in the contracting process. There may also be an oversupply of agents in the
market. If the market forces cannot adjust efficiently to these conditions, the power
differentials may influence the contractual terms including the governance mechanisms build
into them (Hill & Jones 1992). Managers who are the decision makers in a manager
controlled company have more ability to exploit and gain from power differentials.
Power differentials may continue after the agency relationship has commenced. This may
limit the effectiveness of the corporate governance structure in mitigating agency problems.
In addition, the disadvantaged party may not have the ability or desire to efficiently alter
corporate governance mechanisms. Hills and Jones (1992) argued that pressure in the form of
sunk costs, political connections, the propensity to maintain precedents as a rule and a lack of
innovation may constrain responses in corporate governance structures to changes in the
relationship. The power differential may result in entrenchment of the board of directors. The
managers or controlling shareholders could control the board to further their own interests
over that of other shareholders (Weisbach 1988). Ownership concentration can determine the

53
existence and continuity of power differential in companies and influence the extent of
agency problems.
In a wholly owned company, the owner will not suffer from a conflict of interests given that
he or she can make the most optimal wealth maximization decision. However, a conflict is
likely in a public company, with an agency relationship between shareholders and managers.
The divergence is further intensified when there is a separation of ownership and control of
the company. Adam Smith (1937) alluded to this problem by highlighting the problem of the
profusion by directors of joint stock companies in managing the companies given that it is not
their wealth that is being managed. Berle and Means (1932) studied ownership dispersion of
the top 200 US companies’ shareholdings. They concluded that ownership and control had
become separate entities, where control was no longer embedded in ownership. In an owner
managed company, the principals would retain control of the decision making process even
with the employment of agents. In contrast, in a manager controlled company there may not
be a substantial stockholder with significant influence over managers’ decisions (Amihud &
Lev 1981). A majority of the ‘diffused’ shareholders also may not be qualified to lead the
company (Fama & Jensen 1983). Consequently, control of the company becomes the
prerogative of a select few, which is often the senior management team. With the separation
of decision and risk-bearing functions, managers became important decision makers without
sharing the effect of their choices on wealth (Fama & Jensen 1983). Equity based
remuneration was introduced to resolve this dilemma by making managers part-owners of
companies. Managers now have to share the risks arising from their decisions and would
have incentives to maximise the value of the companies. Managerial shareholdings are an
alignment mechanism that leads to a convergence of the interests of managers to that off
shareholders (Jensen & Meckling 1976).

54
However, La Porta, Lopez-de-Silanes and Shleifer (1999) showed that owner managed
companies suffer from another dimension of agency problems. La Porta et al (1999) in their
study of ownership concentration in twenty seven countries showed that most of the large
corporations were owned and managed by families and states. The external shareholders may
themselves own larger shareholdings than managers and that could mean that they dominate
managerial decisions (Makhija & Patton 2004). In this circumstance, the argument that the
substantial shareholders can force managers to behave consistently with shareholders’
interests may not be valid. The managers would often be appointed by the controlling family
or state. The substantial shareholders can pursue their own interests through ‘insider’
managers at the expense of minority shareholders. They could wield control beyond their
cash flow rights for their own private benefits (Guedhami & Pittman 2006). As shown in
Figure 7, high ownership concentration may lead to an entrenchment of private benefits
rather than convergence or alignment of interests between different contracting parties (Fan
& Wong 2002; Ho, Simon S. M. & Shun Wong 2001).
Figure 7 Ownership and the extent of agency problems
Level of ownership
Convergenceof interests hypothesis
Reduction in agency problems - incentives to
maximise all shareholders wealth
Entrenchment hypothesis Increase in agency problems
- entrenchments of private benefits at the expense of
minority shareholders

55
Burkart and Panunzi (2006) argued that in countries with poor legal protection, ownership
became more concentrated. La Porta et al (1999) and Fan and Wong (2002) showed that in
these countries exploitation of minority shareholders by controlling shareholders was
prevalent. For example, Wymeersch (2002) argued that compliance with a corporate
governance code will be difficult in European countries compared to the UK because
European companies were more tightly held. The substantial shareholders are more likely to
reject recommendations that would diminish their power and influence.
3.2.1.5 Ownership structure and disclosure
Fama and Jensen (1983) contended that agency relationships exist in spite of agency costs
because contracting is an effective approach to controlling agency problems. They argued
that contracts include ratification and monitoring mechanisms that may include corporate
governance structures. The mechanisms are separate from management’s initiation and
implementation decisions. The principals can develop a corporate governance structure that
will supervise the explicit and implicit contractual terms between agents and principals (Hill
& Jones 1992). Information systems play an important role in the corporate governance
structure as it can oversee and verify managers’ actions. Information about agents becomes a
tradable commodity in the market. The more information that principals have about agents’
actions, the less likely it is that agents will indulge in opportunism (Eisenhardt 1989).
Ownership structure can influence the extent of information disclosed to the market. Various
studies have looked at this association. These studies can be divided into studies of common
and civil law countries. Guedhami and Pittman (2006) showed that 7 out of 10 of countries
with ownership concentration of more than 50 percent were civil law countries. The average

56
shareholdings of the top three largest shareholders were at 42.8% of total shareholdings in
civil law countries compared to 27.6% in common law countries. In common law countries,
there were agency problems, as alluded to by Berle and Means (1932), with a high dispersion
of ownership concentration and manager controlled companies. The laws in a common law
country are designed to protect the rights of external investors to information (Babío Arcay &
Muiño Vázquez 2005). There would be greater demand for information by shareholders to
assess performance of managers as their agents (Gelb 2000).
In civil law countries, companies are tightly held by a few parties that are usually families or
states. The capital market is less developed and relatively illiquid. These countries reflect the
other dimension of agency problems as shown by La Porta et.al (1999). The regulatory
framework is built around protecting the interests of substantial shareholders rather than
minority shareholders (La Porta, Rafael et al. 2000).There would be less demand for
information because substantial shareholders have insider access to the companies. They also
may have incentives to restrict the flow of information to external parties to protect the
interests of majority shareholders (Babío Arcay & Muiño Vázquez 2005). Gray (1988)
hypothesised that family controlled companies are highly secretive and prefer confidentiality
and disclose information only to insiders. Extensive disclosure could expose the consumption
of private benefits by substantial shareholders (Makhija & Patton 2004). Information
asymmetry would be more prevalent in a dispersed ownership environment and in a situation
with substantial and minority shareholders (Brammer & Pavelin 2008).
Fan and Wong (2002) examined the association between the level of earnings disclosure
quality and the corporate ownership structure of a sample of 977 companies from seven East

57
Asian countries from 1991 to 19959. They showed that the average voting rights in East
Asian companies was 30.33%. The concentration of voting rights of Thailand companies was
the highest with an average of 36.32%, followed by Indonesian companies at 34.51%,
Malaysian companies at 30.73%, Hong Kong companies at 29.68%, Singaporean companies
at 28.95%, South Korean companies at 26.11% and Taiwanese companies at 24.70%. In a
quarter of these countries, approximately 40% of the voting rights were controlled by the
largest shareholders. They showed that a concentrated, pyramidal and cross holding of
ownership led to extensive exploitation of minority shareholders by the controlling
shareholders. The disclosure of accounting information was perceived by external investors
as a tool of self interested controlling owners making it less credible. In addition, they
showed that ownership concentration was significantly and inversely related to earnings
informativeness. As ownership became more concentrated, the controlling shareholders
would try to conceal information to avoid attention or competition to their rent seeking
operations. Their results supported the hypothesis that there was a negative association
between earnings disclosure informativeness and the level of controlling shareholders’
ownership.
Babío Arcay and Muiño Vázquez (2005) examined the extent of voluntary disclosure by
Spanish companies10. Spain had high shareholding concentration, low investor safeguards
and a less developed capital market that are hallmarks of a civil law country. They used
structural equations of path analysis to simultaneously control interactions between the
independent variables and found negative associations between ownership concentration and
the adoption of corporate governance mechanisms. The association consequently influenced
the extent of voluntary disclosure. They also showed that managerial ownership significantly 9 The earning informativeness is proxied by the cumulative net-of-market 12 month stock returns for firm i at year t 10 The disclosure index used are obtained from Actualidad Economica,a prominent business magazine in Spain

58
improved the level of voluntary disclosure. Schadewitz and Blevins (1998) in their study of
Finnish listed companies found an inverse and significant association between ownership
concentration and the extent of disclosure11. They argued that substantial shareholders may
rely on other information channels, for example by having a proxy on the board of directors.
Makhija and Patton (2004) studied the influence of ownership structure on the disclosure of
Czech non-financial companies12. The Czech capital market had undergone changes after
major privatisation in the 1990s. Given limited investment by individuals and restricted
foreign capital, investment funds became large block holders of the privatised companies.
Disclosure of information during the period was mostly driven by economic incentives and
not by regulations. Makhija and Patton argued that the Czech regulatory bodies had failed to
keep up with the transition to a free market. Consistent with agency theory, they found that
low levels of ownership (internal and external owners) positively influenced the level of
disclosure. Ownership at a lower level would push for the disclosure of more information to
improve share prices and maximise shareholders’ wealth. However, the association became
negative at higher levels of ownership. They argued that Czech investment funds that owned
more than 16% of shares would pursue their own private interests. They suggested that
regulators limit the maximum percentage of ownership held by investment funds to avoid the
exploitation of minority shareholders.
From a Kenyan market perspective, Barako, Hancock and Izan (2006) examined a sample of
47 companies from 1992 to 2001. Their sample consisted of nearly all of the companies listed
in the Nairobi Stock Exchange. The Kenyan government had introduced various reforms to
attract more capital that included privatisation, allowing foreign investments and corporate
11 The study involved 256 sample interim reports from sample years of 1990 to 1992. 12 The study involved 43 companies for the sample year of 1993.

59
governance reforms. The study showed that foreign and institutional ownership significantly
and positively influenced the level of voluntary disclosure. However, contrary to their
hypothesis, they found that ownership diffusion significantly and negatively influenced the
level of voluntary disclosure. They suggested that higher ownership diffusion led to diffusion
of power that meant no individual shareholder could exert power to significantly pressure
companies to disclose more information.
Leung and Horwitz (2004) examined the association between director ownership and
voluntary segment reporting using a sample of 376 Hong Kong listed companies using 1996
as the sample year. The sample year is the year prior to the East Asian financial crisis and the
disclosure of segment reporting by Hong Kong companies was relatively voluntary. The
ownership structure in the Hong Kong market indicated that executive directors controlled
both managerial and voting rights of the companies. The analysis showed that segment
disclosure was not linearly related to director ownership. The level of disclosure significantly
increased as executive director shareholding increased from 1% to 25%. However, when
executive director ownership became more concentrated, the level of voluntary disclosure
significantly declined. They also showed that non-performing companies that had over 25
percent executive director shareholding disclosed less information than other companies with
similar ownership concentration. The findings supported the notion that higher ownership
leads to greater entrenchment effects.
Chau and Gray (2002) studied the voluntary disclosure practices of 60 Hong Kong companies
and 62 Singaporean companies for the year 1997. Hong Kong and Singaporean companies
had similar ownership structures with high family ownership and a large number of family
controlled companies. The study hypothesised that wider ownership structure would
60
significantly and positively influence the level of voluntary disclosure. The dispersal of
ownership may mean that there would be more demand for information by shareholders.
Chau and Gray found evidence to support the hypothesis. They showed that high family
ownership significantly limited the level of voluntary disclosure. They also considered the
non-linearity of the association between ownership structure and level of disclosure. High
ownership dispersion may actually limit the level of disclosure if there was no significant
block holder. There may be no shareholder who could wield sufficient pressure to demand
more information from the companies. Chau and Gray retested their hypotheses using ranked
and quartile regression that would allow for any non-linear association between the variables.
The results were significantly consistent with the original analysis.
Huanfang and Jianguo (2007) examined the association between ownership structure and the
level of voluntary disclosure by 559 Chinese listed companies for the year 2002. They argued
that the cultural aspects of Chinese society of high levels of collectivism and power distance13
made the country a unique case study. These traits suggested that companies would have high
compliance regulations and would be less likely to disclose information voluntarily. The
ownership of Chinese companies is dominated by state owned enterprises that may have
easier access to capital at a cheaper cost than other companies. Consequently, they would
have less incentive to publicly disclose information to compete for external financing. The
study found that block ownership and foreign ownership significantly and positively
influenced the level of voluntary disclosure by Chinese companies. Contrary to their
hypothesis, they did not find a significant and negative association between state ownership
13 Hofstede defined collectivism as “a situation in which people belong to in groups or collectivities which are supposed to look after them in exchange for loyalty”. Power distance is defined as “the extent to which the less powerful members of institutions and organizations accept the power is distributed unequally” (Hofstede & Bond 1984, p. 419)

61
and the level of voluntary disclosure. They argued that the attempts by Chinese government
to improve transparency may have encouraged state owned companies to be more open.
Shan (2009) also studied the Chinese market and showed that ownership concentration and
foreign ownership significantly influenced the level of disclosure of related party
transactions. He examined a sample of 120 Chinese Shanghai SSE180 and Shenzhen SSE100
listed companies during the period of 2001 to 2005. He argued that the opening of the
Chinese market meant that companies would have to disclose more information to compete
and retain foreign capital. Contrary to Huanfang and Jianguo (2007), Shan hypothesised that
state owned companies would be more transparent and hence would significantly disclose
more information than other companies. However, the study found an insignificant
association between state ownership and the level of disclosure. He argued that state
ownership would make these companies safe from any penalty or scrutiny from regulatory
bodies even if they did not comply with disclosure requirements.
Abrahamson and Park (1994) studied the concealment of negative news in president’s letters
of 1118 United States companies for the year of 1989. They found that the concealment of
negative information in the letters was constrained by the presence of substantial
shareholders. Substantial shareholders have an incentive to pressure managers for full
disclosure of information. However, the dominance of small institutional shareholders could
increase the concealment. They argued that small institutional shareholders have a short term
focus and can easily sell their small block of shares. Managers might be wary about
disclosing bad news so as not to spook small institutional shareholders into selling their
shares. They also found that large shareholdings by outside directors increased concealment
as they were not independent of changes in the value of the company.
62
Birt et al. (2006) argued that substantial shareholders have power to exert on executives in
mitigating agency problems. They studied the top 500 Australian companies segment
reporting practices from 2000 to 2003. Their study period covered changes in accounting
standards on segment reporting. They found a significant positive association between the
level of the ownership of the top 20 shareholders and the level of disclosure. Brammer and
Pavelin studied the top 470 UK companies’ environmental disclosure for the year 2000
(Brammer & Pavelin 2008). They found that companies with higher ownership
concentrations were less likely to disclose their environmental policies but that ownership
concentration had no impact on the quality of disclosure.
Gelb (2000) found that companies with lower managerial ownership were rated highly in
terms of disclosure by analysts14. The study examined analyst ratings of 3219 US companies
from 1981 to 1993. It showed that an increase of one percent in executives’ shareholdings on
average led to approximately an eight percentile reduction in analyst disclosure ratings.
Lower managerial ownership means that shareholders in these companies demand more
information as they need to assess potential agency problems. However, managerial
ownership did not limit the level of disclosure of investor relations. Gelb suggested that
investor relations may be a less sensitive aspect of a company operation and would be less
likely to be influenced by managerial ownership. Gelb also considered non-linearity in testing
the hypotheses and the additional analysis supported the hypotheses.
14 Gelb (2000) used analyst ratings as proxy for disclosure quality. He argued that it is a better proxy of quality compared to using management disclosure forecasts. Control variables that were used are firm size, performance, volatility of past stock returns, frequency of offerings and concentration ratio.

63
Eng and Mak (2003) examined the influence of ownership structure on the level of voluntary
disclosure by Singaporean companies. Using a sample of 158 companies for the year of 1995,
they showed that the level of managerial ownership significantly and negatively influenced
the level of disclosure. This is consistent with the prediction of agency theory that lower
managerial ownership would lead to more monitoring by shareholders. Higher ownership can
be a substitute for direct monitoring. However, the negative association may also mean that
higher ownership by managers led them to withhold information from the shareholders and
exploit the information for their private benefit. Government linked companies (GLCs) were
found to significantly disclose more information than other companies. Unlike other
corporations, the GLCs would not only pursue profit maximisation goals but would have to
consider national interests. Given the potential conflict of interests, the GLCs may have
disclosed the additional information to reassure other shareholders that their interests were
also protected. The study did not find any association between block holdings and
institutional ownership on the level of disclosure.
Haniffa and Cooke (2002) studied 167 KLSE listed companies for the year of 1995. The
study examined the determinants of voluntary disclosure using the data prior to the East
Asian financial crisis modified by a consideration to the cultural differences in the Malaysian
market. The sample showed that the average shareholding by institutional investors and
foreigners were 15% and 21% respectively. The average shareholding of the top ten
shareholders that was used as a proxy for ownership diffusion was 68%. After controlling for
cultural differences such as ethnicity of directors, it showed that ownership diffusion and
foreign ownership significantly and positively influenced the level of voluntary disclosure.
The other ownership variables examined were the percentage of shareholdings by

64
institutional shareholders and Malay directors. However, these variables were not shown to
be significant.
Mohd Ghazali and Weetman (2006) extended Haniffa and Cooke (2002) by looking at the
data after the financial crisis. Similar to other East Asian countries, the financial crisis created
more awareness of the need for transparency and the protection of minority shareholders and
led to the introduction of various regulatory measures. The study assessed the effectiveness of
the regulatory measures in promoting greater disclosure and reducing the influence of
insiders on disclosure policies. It examined the level of voluntary disclosure of financial,
strategic and corporate social responsibility information. Consistent with the entrenchment
hypothesis, the study found that higher director ownership significantly restrained the level of
voluntary disclosure. They suggested that this could indicate that the reforms by Malaysian
regulators may not be effective in overcoming the traditional dominance of disclosure
policies exerted by insiders. Ownership concentration and government ownership were not
found to significantly influence the level of disclosure by Malaysian companies.

65
Table 2 Summary of empirical research on ownership structure and voluntary disclosure Author(s) Sample and
Data Ownership variable(s) Main findings
Shan (2009) Sample consisted of 120 Chinese Shanghai SSE180 and Shenzhen SSE100 listed companies for the sample period of 2001 to 2005
1. ownership concentration: proportion of shares held by top ten shareholders (-)
2. foreign ownership: proportion of shares held by foreigners from those in the top ten shareholders list (+)
3. state ownership: proportion of shares held by state from those in the top ten shareholders list (+)
The findings supported the hypotheses that these ownership variables significantly influenced the level of related party disclosure in Chinese listed companies. The state ownership variable was found to be insignificant.
Brammer and Pavelin (2008)
Sample year of 2000 consisting of 470 large UK industrial companies
1. aggregate share ownership of significant shareholdings (in excess of 3%) (-)
They did not find a significant association between the quality of environmental disclosure and dispersion of ownership. High ownership concentration appeared to promote minimal disclosure.
Huanfang and Jianguo (2007)
Sample year of 2002 consisting of 559 Chinese listed companies
1. block holder ownership: proportion of ordinary shares held by substantial shareholders with more than 5% ownership (+)
2. managerial ownership : proportion of shares held by senior executives and directors
3. legal person ownership:
The findings showed that higher block holdings and foreign ownership improved the level of voluntary disclosure. Managerial, legal person and state ownership were found not to be significant in influencing the level of disclosure.

66
proportion of shares held by the legal person (+)
4. foreign listing/share ownership: 1= issuance of H-share or B-share 0 = if none (+)
5. state ownership: proportion of ordinary shares held by state (-)
Luo, Courteney and Hossain (2006)
Sample period from 1994 to 2000 involving 172 companies listed on the Singapore Stock Exchange
1. managerial ownership: percentage of managers’ shareholdings (-)
2. outside block ownership: five largest shareholdings listed in the annual report (-)
3. government ownership: percentage of government shareholdings (+)
They concluded that ownership concentration led to higher agency costs. There was less voluntary disclosure in the companies with higher ownership concentration. They also found that companies with high voluntary score stock returns provided more information on future performance.
Barako, Hancock and Izan (2006)
Sample consisted of 43 companies listed in Nairobi Stock Exchange for the sample period of1992 to 2001
4. shareholders concentration: proportion of shares held by top twenty shareholders (+)
5. foreign ownership: proportion of shares owned by foreign shareholders (+)
6. institutional ownership: proportion of shares owned by institutional
They study showed that foreign and institutional ownership significantly and positively influenced the level of voluntary disclosure. However, contrary to their hypothesis, they found that ownership diffusion to significantly and negatively influence the level of voluntary disclosure. They suggested that higher ownership diffusion led to diffusion of power that meant no individual shareholder can exert power to significantly pressure

67
investors to total outstanding shares (+)
companies to disclose more information.
Mohd Ghazali and Weetman (2006)
Sample consisted of 87 Malaysian companies for the sample year of 2001
1. ownership concentration: proportion of shares owned by top ten shareholders to total number of shares (-)
2. number of shareholders (+)
3. proportion of direct and indirect shares held by executive and non-independent directors over total shares(-)
4. proportion of shares held by government (-)
The study found only director ownership to significantly influence the level of voluntary disclosure.
Babio Arcay and Muino Vazquez (2005)
Sample year of 1999 and involved 91 Spanish companies listed in Madrid Stock Exchange
1. ownership dispersion: Herfindahl Index n
OWNERSHIP = i=1Σ(Pi/0.51)2
Pi = percentage held by the largest stockholder
The index ranges from 0 to 1 indicating level ownership dispersion
2. ownership by directors: value of one (1) if the directors’ participation in the equity exists but is lower than 3%,and zero (0) otherwise (-
They found negative associations between ownership concentration and adoption of corporate governance mechanisms. The associations consequently influenced the extent of voluntary disclosure. Managers’ shareholdings positively influence the level of disclosure.
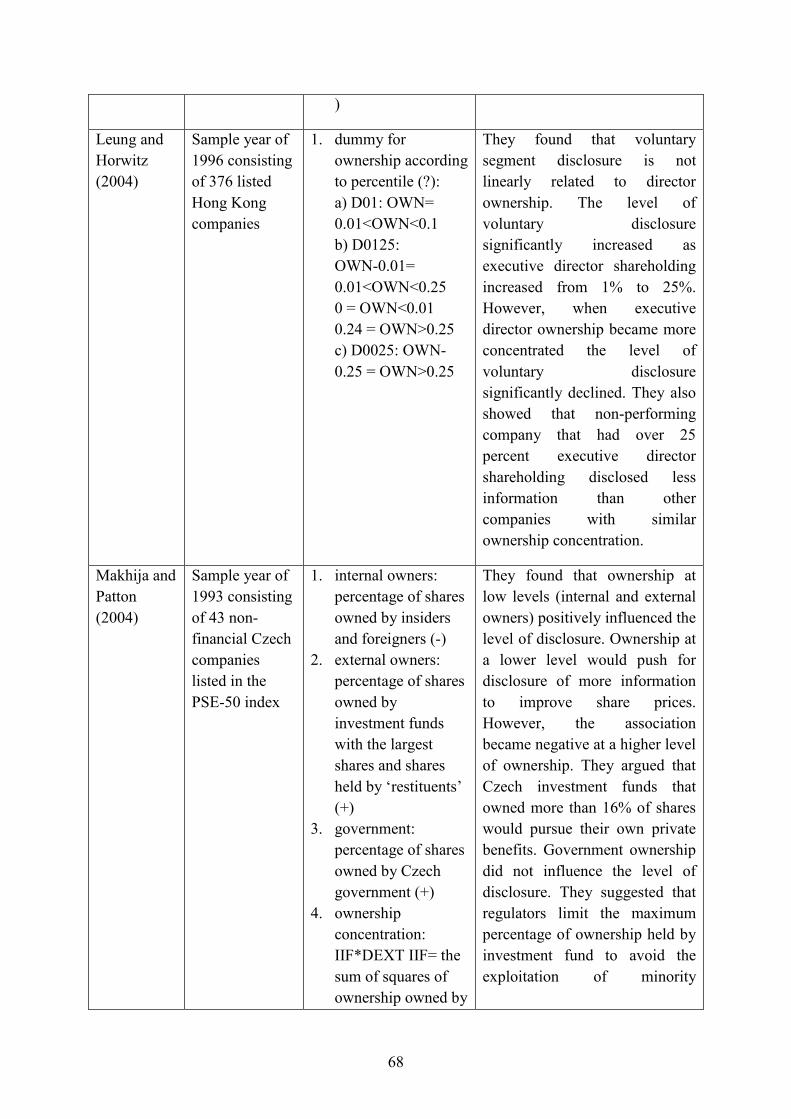
68
)
Leung and Horwitz (2004)
Sample year of 1996 consisting of 376 listed Hong Kong companies
1. dummy for ownership according to percentile (?): a) D01: OWN= 0.01<OWN<0.1 b) D0125: OWN-0.01= 0.01<OWN<0.25 0 = OWN<0.01 0.24 = OWN>0.25 c) D0025: OWN-0.25 = OWN>0.25
They found that voluntary segment disclosure is not linearly related to director ownership. The level of voluntary disclosure significantly increased as executive director shareholding increased from 1% to 25%. However, when executive director ownership became more concentrated the level of voluntary disclosure significantly declined. They also showed that non-performing company that had over 25 percent executive director shareholding disclosed less information than other companies with similar ownership concentration.
Makhija and Patton (2004)
Sample year of 1993 consisting of 43 non-financial Czech companies listed in the PSE-50 index
1. internal owners: percentage of shares owned by insiders and foreigners (-)
2. external owners: percentage of shares owned by investment funds with the largest shares and shares held by ‘restituents’ (+)
3. government: percentage of shares owned by Czech government (+)
4. ownership concentration: IIF*DEXT IIF= the sum of squares of ownership owned by
They found that ownership at low levels (internal and external owners) positively influenced the level of disclosure. Ownership at a lower level would push for disclosure of more information to improve share prices. However, the association became negative at a higher level of ownership. They argued that Czech investment funds that owned more than 16% of shares would pursue their own private benefits. Government ownership did not influence the level of disclosure. They suggested that regulators limit the maximum percentage of ownership held by investment fund to avoid the exploitation of minority
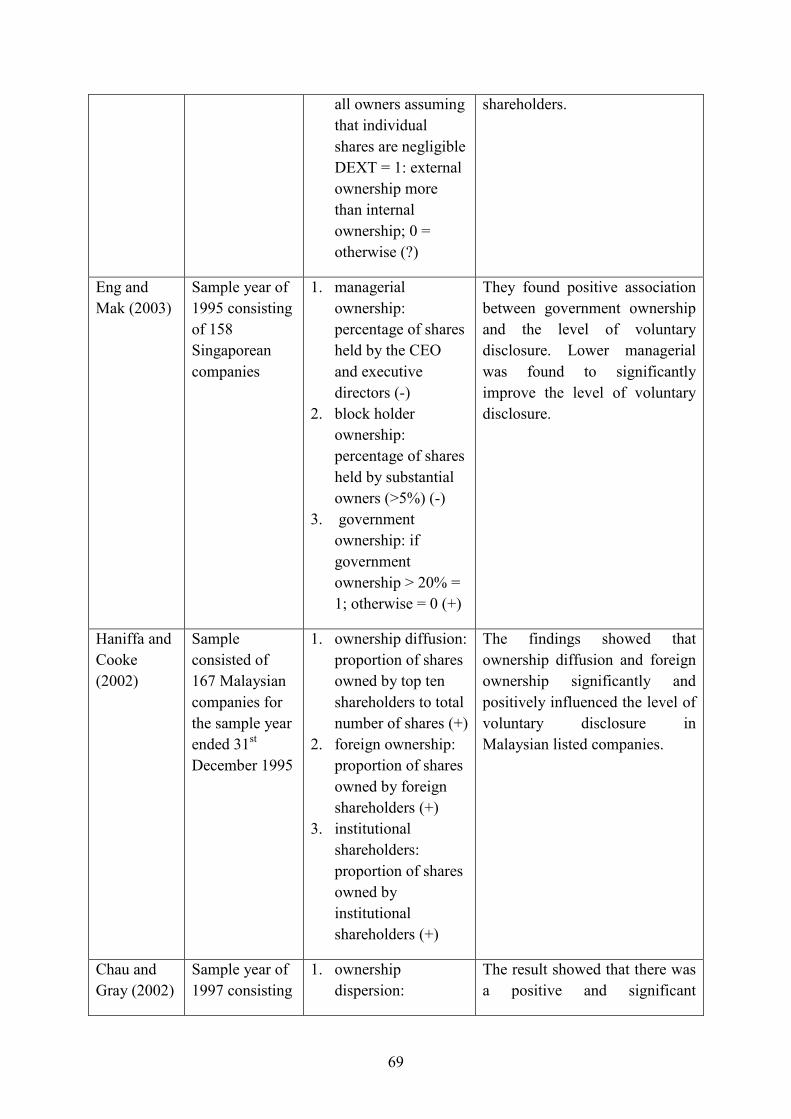
69
all owners assuming that individual shares are negligible DEXT = 1: external ownership more than internal ownership; 0 = otherwise (?)
shareholders.
Eng and Mak (2003)
Sample year of 1995 consisting of 158 Singaporean companies
1. managerial ownership: percentage of shares held by the CEO and executive directors (-)
2. block holder ownership: percentage of shares held by substantial owners (>5%) (-)
3. government ownership: if government ownership > 20% = 1; otherwise = 0 (+)
They found positive association between government ownership and the level of voluntary disclosure. Lower managerial was found to significantly improve the level of voluntary disclosure.
Haniffa and Cooke (2002)
Sample consisted of 167 Malaysian companies for the sample year ended 31st December 1995
1. ownership diffusion: proportion of shares owned by top ten shareholders to total number of shares (+)
2. foreign ownership: proportion of shares owned by foreign shareholders (+)
3. institutional shareholders: proportion of shares owned by institutional shareholders (+)
The findings showed that ownership diffusion and foreign ownership significantly and positively influenced the level of voluntary disclosure in Malaysian listed companies.
Chau and Gray (2002)
Sample year of 1997 consisting
1. ownership dispersion:
The result showed that there was a positive and significant

70
of 60 Hong Kong companies and 62 Singaporean companies.
proportion of equity owned by outsiders to total equity (+)
2. family ownership: proportion of equity held by family members (-)
association between ownership dispersion and the level of voluntary disclosure. However, the association was much weaker in companies with high family shareholdings.
Depoers (2000)
Sample year of 1995 consisting of 102 industrial and commercial French companies
1. ownership diffusion: percentage of shares held by the three largest shareholders (-)
The study did not find significant association between ownership concentration and the level of disclosure. She argued that the high correlation between size and ownership variables may have influence the association.
Gelb (2000) Sample period from 1981 to 1993 and 3219 firm-years. Non-bank and US companies.
1. insider ownership: percentage of outstanding ordinary shares held by insiders (-)
insiders = officers directors and any shareholder owning at least 10% of shares
The result showed a negative association between insider ownership and the level of voluntary disclosure.
Raffournier (1995)
Sample year of 1991 consisting of 161 industrial and commercial companies in Switzerland.
1. ownership diffusion: percentage of shares not held by known shareholders (-)
They did not find a significant association between the level of disclosure and ownership diffusion. They argued that size captured the effects of ownership on the extent of disclosure.
Abrahamson and Park (1994)
Sample year of 1989 and involved 1118 US companies’ president letters
1. percentage of shares held by outsiders (+)
2. percentage of shares held by executives (-)
3. percentage of shares held by institutional shareholders (+)
4. dummy for owner control (-)
They found that concealment of negative information in the president letters are limited by the presence of substantial shareholders. However, small institutional shareholders will support the concealment.

71
3.2.1.6 Corporate governance and disclosure
In a diffused ownership structure where no shareholder is dominant, the costs of collecting
and analyzing information for an individual shareholder can be expensive and impractical.
There would be a high level of information asymmetry. This limitation leads to a reliance on
third party governance such as the board of directors to ensure an adequate supply of
information at an economical level (Babío Arcay & Muiño Vázquez 2005; Hill & Jones
1992). Other corporate governance measures that can address information asymmetries may
include the creation of audit and remuneration committees, the employment of reputable
external auditors and the separation of the CEO and the Chairman roles. The stock market
can be an external monitoring mechanism for shareholders. The share price would be
reflection of the impact of the managers’ decisions on current and future net cash flows
(Fama & Jensen 1983). Managers would have the incentive to make decisions that do not
reduce share price.
The board of directors is the apex of a decision control system (Fama & Jensen 1983). It is in
a position to provide valuable information and to protect shareholders’ interests by
monitoring management actions and behaviors. It retains the crucial control of over managers
5. dummy for non institutional control (+)
6. dummy for institutional investor control (+)
7. percentage held by non-dominant institutional shareholders (+)

72
by having the power to ratify and monitor their decisions, to hire and replace them and to set
remuneration policies (Fama & Jensen 1983). An efficient board of directors can limit
managers’ opportunistic behavior. Eisenhardt (1989) argued that the depth of the information
offered by a board is assessed by considering the frequency of meetings, the proportion of
board members with experience (tenure, managerial and industrial) and the representation of
various shareholdings groups in board.
Weisbach (1988) classified board members as insiders, outsiders or grey directors. The
insider directors are senior management and outside directors are independent and non-
executive directors. Grey directors are non-independent and non-executive who have family
or business connections with the company or managers. Fama and Jensen (1983) argued that
insider directors can be more dominant since they have inside information on the company’s
operations. However, their presence on the board is still needed to ensure that there is a
consistent flow of inside information that would be used to assess the performance of the
company and the agents.
Outside directors play the independent role of resolving agency problems between the
shareholders and the inside directors. Fama and Jensen (1983, p. 315) argued that outside
directors have an incentive to show that “(1) they are decision experts, (2) they understand
the importance of diffuse and separate decision control, and (3) they can work with such
decision control systems.” Outside directors should have the balance the power over the non-
independent directors and prevent board entrenchment. They have to protect their human
capital value in the market for directors by showing that they are not colluding with the
managers. For example, Ferris, Jagannathan and Pritchard (2003) found that there was a

73
positive association between the past performance of companies in which an individual held a
directorship and his or her subsequent employment as a director15. They termed this as a
reputational effect of directorship.
In their model of board effectiveness, Hermalin and Weisbach (1988) showed that after a
crisis, companies seek more independent directors. Weisbach (1988) found that there was a
positive and significant association between the resignation of CEOs of poorly performing
companies and the proportion of independent directors16. Kosnik (1990) studied the 110 top
US companies that were subjected to greenmail17 takeover during the period of 1979 to 1983.
The practice reduces shareholders’ wealth as they have to repurchase the hostile party’s
shares at a higher price. He found that companies that were able to resist greenmail attempts
had a higher proportion of independent outside directors. Brickley and James (1987) found
that there was an inverse association between the proportion of independent directors and
management consumptions of perquisites18.
Li (1994) examined the effect of the ownership structure on the composition of the board of
directors of 390 large manufacturing companies from Japan, Western Europe and the US. He
showed that ownership was more dispersed in the US than in Japan and Western European
countries. He found that the pattern of ownership in the different countries influenced the
composition of the board. Ownership concentration had a negative and significant association
with the proportion of independent directors. He also showed that state controlled companies
had significantly more independent directors.
15 They studied 3190 of US companies and 23673 directors using the sample year of 1995. 16 The study involved 495 companies listed in the New York Stock Exchange between 1977 and 1980. 17 Greenmail is the practice of buying a company’s shares to a level that represents a takeover attempt by the hostile party. This will force the company to repurchase the shares at higher price to avert the takeover threat. 18 The study involved 891 US banks using the sample year of 1980.

74
Raffournier (1995) studied the determinants of disclosure by Swiss companies before the
reform of its company law in 1992. Prior to 1992, there were minimal accounting regulations.
Swiss companies are secretive in nature. For example, the list of substantial shareholders and
creditors were not widely available and other corporate disclosures were voluntary. The study
found that having a ‘Big Six’ audit firm as an external auditor and international business
diversification positively influenced the level of voluntary disclosure. Larger audit firms may
push for more disclosure of information to protect their own reputations. International
diversification meant that Swiss companies would have to comply with other countries’
regulatory frameworks that could be more comprehensive. Raffournier showed that the Swiss
companies’ major foreign trade involved the European Union and North America that have
more developed disclosure structures.
Babio Arcay and Muino Vazquez (2005) examined the adoption of corporate governance best
practices by Spanish companies. They found positive associations between the proportion of
independent directors, the presence of audit committee and the establishment of stock option
plans and the level of voluntary disclosure. They argued that controlling shareholders pushed
for the same individual to hold both the CEO and Chairman positions. The size of the board
of directors did not significantly influence the level of voluntary disclosure. This may imply
that the appointment of additional outside directors may only serve to boost the size of the
board without actually reducing the power of existing and dominant directors.
In the aftermath of significant and persistent corporate failures and the opening of the Kenyan
market, there was a greater emphasis placed upon good corporate governance. Barako et al
(2006) showed that the presence of an audit committee significantly and positively influenced
the level of voluntary disclosure by Kenyan companies. Consistent with their hypothesis, the

75
presence of more family members on the board and the dominant personality of a CEO who
undertook dual roles were shown to significantly limit the extent of disclosure. External
auditor reputation was not shown to significantly influence the level of disclosure. Contrary
to the predicted association, companies with a higher proportion of independent directors
were found to disclose less information instead of more information. This suggested either a
substitutive effect between good board composition and disclosure policies or that the board
had been captured by substantial or controlling shareholders.
Ho and Wong (2001) examined the association between corporate governance mechanisms
and the level of voluntary disclosure in Hong Kong listed companies using a sample of 90
companies for the year 1998. The study was in response to the legislative reactions to the
East Asian financial economic crisis that attempted to improve transparency and to protect
the rights of minority shareholders. The corporate governance measures that were considered
were the proportion of independent directors on the board, the formation of a voluntary audit
committee, the presence of CEO holding dual positions and the proportion of family
members on the board. They found that there was a negative association between the
proportion of family members on the board and the level of voluntary disclosure. The
existence of audit committee significantly improved the level of disclosure. The proportion of
independent directors did not significantly influence the level of disclosure. It was consistent
with the argument that in a concentrated market such as Hong Kong, the independent
directors were nominated and voted by the controlling shareholders. This was consistent with
the belief that Hong Kong’s board of directors is often held captive by the controlling
shareholders and would act according to their wishes.
76
Leung and Horwitz (2004) studied the effectiveness of independent directors in limiting the
influence of executive directors on the level of voluntary segment reporting by Hong Kong
companies. They found that the proportion of independent directors positively and
significantly influenced the level of voluntary disclosure for companies with lower ownership
concentrations. However the association was not significant for companies with high
ownership concentrations. This may mean that independent directors were less influential
than executive directors in influencing company disclosure policies. In addition, companies
that were audited by Big-Six audit firms were found to disclose significantly more
information than other companies.
Chen and Jaggi (2000) examined the influence of independent directors on the
comprehensiveness of mandatory disclosure of financial information in 87 Hong Kong listed
companies from 1993 to 1994. It is a requirement of the Stock Exchange of Hong Kong’s
Listing Rules for companies to have at least 2 independent directors to improve the
transparency and fairness of the board. They found that a higher presence of independent
directors on the board improved the comprehensiveness of financial disclosure. As expected
the association was weaker in family controlled companies. Chen and Jaggi suggested that
independent directors in family controlled companies may be impaired by personal
relationships with the family owner for them to be effective. This may mean that the
requirement of the Listing Rule was not effective in ensuring the independence of the
directors in family controlled companies. However, it could also be that there was less
demand for extensive information at the first place. The family shareholders being the
controlling owners would not rely on annual reports because they would have inside access to
information.

77
Huafang and Jianguo (2007) studied the associations between the corporate governance
variables of independent directors, CEO duality role and auditor reputation and the level of
voluntary disclosure by Chinese companies. The Chinese regulators introduced reforms when
the country joined the World Trade Organization. For example, the proportion of independent
directors was required to be at least a third of the board. Huafang and Jianguo examined the
determinants of disclosure in light of the reforms to the Chinese market. They found
significant and positive associations between the proportion of independent directors, audit
reputation and the level of disclosure. CEOs who held the role of chairman at the same time
were shown to significantly and negatively influence the level of disclosure as they exerted
too much control over the company.
Similar associations between corporate governance mechanisms and the extent of voluntary
disclosure were also examined from a Malaysian market perspective. Using data prior to the
East Asian financial crisis, Haniffa and Cooke (2002) found that there was a significant and
positive association between the proportion of family members on the board of directors and
the level of voluntary disclosure. Contrary to their hypothesis, they found that having an
independent and non-executive chairman significantly and negatively influenced the level of
voluntary disclosure. They suggested that an independent and non-executive chairman may
derive more private utility by keeping information private. The other corporate governance
variables (proportion of independent directors on board, CEO duality and chairman cross-
directorship) were shown not to be significant in influencing the level of disclosure. The
insignificant association between the proportion of independent directors and the level of
disclosure may also suggest that Malaysian boards are captured by the controlling

78
shareholders. These findings were significant given that their study sought to contribute to the
discussion on the formulation of the Malaysian corporate governance code.
Mohd Ghazali and Weetman (2006) examined the influence of corporate governance
variables on the level of voluntary disclosure by Malaysian companies using 2001 as the
sample year. During that year, the Malaysian Code on Corporate Governance was
implemented as a response to the East Asian financial crisis. They showed that requiring a
minimum requirement proportion of independent directors on the board and an independent
Chairman were not significant in improving the level of disclosure. The corporate governance
code did not appear have reduced the control exerted by controlling shareholders such as
family-owners. The presence of family directors was also shown to significantly limit the
extent of voluntary disclosure. The results suggested that family controlled companies
continued to be secretive. They would try to limit the involvement of outsiders by disclosing
minimum information and appointing minimum numbers of independent directors.
Bathala and Rao (1995) showed that there was an inverse association between the proportion
of outside directors on the board of directors and executive shareholdings. Similar results
were found by Li (1994) who studied Japanese, Western Europe and the US markets. The
Japanese and Western Europe markets are similar to the Malaysian market with a high
ownership concentration. The Eng and Mak (2003) study of the Singapore market also
showed that a higher proportion of independent directors significantly limited the level of
voluntary disclosure. Brammer and Pavelin (2008) studied the determinants of environmental
disclosure by UK companies19. They found a negative association between the proportion of
non-executive directors and the level of environmental initiatives disclosures. Barako et al.
19 The study involved 470 large UK industrial companies using the sample year of 2000.

79
(2006) also found similar associations in their study of Kenyan companies. This suggests that
there could be substitutive effect between various governance variables (Brickley & James
1987; Eng & Mak 2003). Companies may choose to adopt one mechanism another as the
preferred monitoring tools in mitigating agency conflicts. Bathala and Rao argued that a
company will choose the best mechanism that suits the characteristics of the company and its
industry. For example, voluntary disclosure could be limited if the company is satisfied with
the governance offered by their board composition (Barako, Hancock & Izan 2006).
However, Babío Arcay and Muiño Vázquez (2005) argued that compliance with a corporate
governance recommendation may lead to a strengthening of resolve to act on other
recommendations. This may lead to the introduction of other corporate governance measures
that will further restrict managers from withholding information and indulging in
opportunistic behaviors. Additional and sometimes overlapping corporate governance
mechanisms are put in place to complement each other and to provide checks and balances.

80
Table 3 Summary of corporate governance and disclosure studies
Author(s) Sample and Data Corporate governance variable(s) Main findings
Abrahamson and Park (1994)
Sample year of 1989 and involved 1118 companies’ president letters
1. Proportion of independent directors (+)
2. Auditor’s report: 0= not qualified; 1 = qualified (-)
They found that concealment of negative information in the president letters are limited by the presence of independent directors and qualified reports. However, outside directors with shareholdings support concealments. They argued that the shareholdings made the directors bias to releasing bad information for the fear of reducing the value of their equity.
Babio Arcay and Muino Vazquez (2005)
Sample year of 1999 and involved 91 Spanish companies listed in Madrid Stock Exchange
1. Proportion of independent directors (+)
2. Audit committee: 0 = none; 1= exist (+)
3. CEO/Chairman duality: 0 = yes, 1 = no (-)
4. Board size: 0 = do not follow recommendations, 1 = consistent with code (+)
5. Stock options scheme: 0 = none,1 = exist (+)
They found positive associations between proportion of independent directors, audit committee and establishment of stock option plans and the level of voluntary disclosure. They argued that high family shareholdings pushed for the same individual to hold the CEO and Chairman positions. Larger board size appeared not to affect level of voluntary disclosure. The presence of outside directors may only serve to boost the size but not replace current directors.
Chen and Jaggi (2000)
Sample period of 1993 to 1994 involving a sample of 87 Hong Kong listed companies
1. Proportion of independent directors (+)
2. Family controlled companies: 1 = controlled by family, 0 = otherwise
They found positive association between proportion of independent directors and level of mandatory disclosure. Consistent with their hypothesis, they showed that family controlled companies disclosed

81
(-) 3. Auditor reputation: 0=non Big Six
audit firm; 1= Big Six audit firm (+)
less information
Barako, Hancock and Izan (2006)
Sample consisted of 43 companies listed in Nairobi Stock Exchange for the sample period of1992 to 2001
1. Proportion of non-executive directors (+)
2. CEO duality: 1 = yes, 0= no 3. Board size: number of directors on
the board 4. Audit committee: 1= exist, 0 = none
(+) 5. Auditor reputation: 0=non Big Four
audit firm; 1= Big Four audit firm (+)
The study found that the presence of audit committee significantly improved the level of voluntary disclosure. However, the higher the proportion of non-executive directors the lower the level of disclosure. This may indicate a substitutive effect between various corporate governance mechanisms. Other variables were found not to be significant.
Brammer and Pavelin (2008)
Sample year of 2000 consisting of 450 large UK industrial companies
1. Proportion of non-executive directors (+)
They found a significant and negative association between the level of disclosure and the proportion of non-executive directors.
Raffournier (1995)
Sample year of 1991 consisting of 161 industrial and commercial companies in Switzerland.
1. Auditor’s size: 0=non Big Six audit firm; 1= Big Six audit firm (+)
The study found a positive association between auditor’s size and level of voluntary disclosure of Swiss companies.
Makhija and Patton (2004)
Sample year of 1993 consisting of 43 non-financial Czech companies
1. Auditor’s size: 0=non Big Six audit firm; 1= Big Six audit firm (+)
The study did not find an association between auditor’s size and level of voluntary disclosure of Czech companies.

82
listed in the PSE-50 index
Leung and Horwitz (2004)
Sample year of 1996 consisting of 376 Hong Kong listed companies
1. Proportion of non-executive directors (+)
2. Auditor’s size: 0=non Big Six audit firm; 1= Big Six audit firm (+)
They study found that the proportion of independent directors positively and significantly influenced the level of voluntary disclosure for companies with lower director ownership concentration. However the association was not significant for companies with high ownership concentration. This may show that the independent directors were less influential compared to entrenched executive directors. Companies that were audited by big-6 audit firms were found to significantly disclose more information than other companies.
Huafang and Jianguo (2007)
Sample year of 2002 consisting of 559 Chinese listed companies
1. Proportion of independent and experienced directors (+)
2. Proportion of non-executive directors (+)
3. CEO duality: 1= dual role, 0 = otherwise (-)
They found that proportion of independent directors was significantly and positively associated with the level of voluntary disclosure in Chinese firms. CEO who held dual positions were shown to significantly limit the level of disclosure.
Gul and Leung (2004)
Sample year of 1996 consisting of 385 Hong Kong listed companies
1. Proportion of independent directors (+)
2. CEO duality: 1= dual role, 0 = otherwise (-)
3. Auditor reputation: 0 = non Big
They found that proportion of independent directors positively and significantly influenced the level of voluntary disclosure. CEO who held dual positions were shown to significantly limit the level of disclosure.

83
Five audit firm; 1= Big Five audit firm (+)
4. Audit committee: 1= exist, 0 = none (+)
Shan (2009) Sample consisted of 120 Chinese Shanghai SSE180 and Shenzhen SSE100
listed companies for the sample period of 2001 to 2005
1. Proportion of professional supervisors (+)
2. Auditor reputation: 0 = non Big Four audit firm; 1= Big Four audit firm (+)
3. CEO duality: 1= dual role, 0 = otherwise (-)
The study found that there was a significant and positive association between the proportion of independent directors and level of related party disclosure. CEO who held dual positions were shown to significantly limit the level of disclosure. However, contrary to the hypothesis, the study found that proportion of professional supervisors significantly and negatively influenced the level of disclosure.
Ho and Wong (2001)
Sample consisted 98 Hong Kong listed companies for sample year of 1998
1. Proportion of independent directors (+)
2. Proportion of family member on the board of directors (-)
3. Audit committee: 1= exist, 0 = none (+)
The study found that there was a negative association between proportion of family members on the board and the level of voluntary disclosure. The existence of audit committee significantly improved the level of disclosure.
Eng and Mak (2003)
Sample year of 1995 consisting of 158 Singaporean companies
1. Proportion of independent directors (+)
2. Auditor’s size: 0=non Big Six audit firm; 1= Big Six audit firm (+)
Contrary to their hypothesis, they found a significant and inverse association between the proportion of independent directors and the level of voluntary disclosure. Auditor reputation was not found to be significant in influencing the level of voluntary disclosure.

84
Haniffa and Cooke
(2002)
Sample consisted of 167 Malaysian companies for the sample year ended 31st December 1995
1. Proportion of independent directors on the board of directors (+)
2. Proportion of family member on the board of directors (-)
3. Cross directorship: proportion of directors with directorship on the board of directors (-)
4. CEO duality: 1= dual role, 0 = otherwise (-)
5. Finance director on board: 1 = yes, 0 = no (+)
6. Chairman is independent and non-executive: 1 = yes, 0 = no (+)
7. Chairman with cross directorship: 1 = yes, 0 = no (+)
8. Auditor’s size: 0=non Big Six audit firm; 1= Big Six audit firm (+)
The study found that there was a significant and positive association between the proportion of family members on the board of directors and the level of voluntary disclosure. Contrary to the hypothesis, the study found that having an independent and non executive chairman significantly and negatively influenced the level of voluntary disclosure. They suggested that an independent and non-executive chairman may derive more private utility by keeping information private. The other corporate governance variables were shown not to be significant.
Mohd Ghazali and Weetman (2006)
Sample consisted of 87 Malaysian companies for the sample year of 2001
1. Proportion of family member on the board of directors (-)
2. Proportion of independent directors on the board of directors (+)
3. Chairman is independent and non-executive: 1 = yes, 0 = no (+)
The study only found the proportion of family members to have a significant association with the level of disclosure. The results suggested that family controlled companies continued to be secretive. They would try to limit the involvement of outsiders by disclosing minimum information and appointing minimum numbers of independent directors.

85
3.2.2 Legitimacy Theory
Legitimacy theory is the result of a social contract between an organization and the society in
which it operates (Deegan, C. 2002; Patten, D.M. 1991). Shocker and Sethi (1974, p. 67)
described the relationship as, “any social institution [including business] that operates in
society via a social contract, expressed or implied.” They further elaborated the concept by
arguing that “an institution must constantly meet the twin tests of legitimacy and relevance by
demonstrating that the society requires its services and that the groups benefitting from its
rewards have society’s approval.” Lindblom (1983, p. 2) formally defined legitimacy as “a
condition or status when an entity’s value system is congruent with the value of the larger
social system of which entity is a part. When a disparity, actual or potential, exists between
the two value systems, there is a threat to an entity’s legitimacy.” When there is a breach of
the social contract, a legitimacy gap may occur that may threaten the survival of an entity in
society (Branco & Rodrigues 2006). A legitimacy gap can be defined as “the difference
between the relevant public’s’ expectations relating to how an organization should act and
the perception of how they do act (Newson & Deegan 2002, p. 186)”.
The larger social system is composed of different constituents or participants who may have
conflicting or differing expectations of the prevailing social values or norms (Ashforth &
Gibbs 1990). The threats to legitimacy can be legal, economic or social sanctions (Dowling &
Pfeffer 1975). An entity will seek to avoid threats to its existence by ensuring its legitimacy
in the society in which it operates. Suchman (1995) argued that legitimacy is obtained by
constraining, constructing and empowering the various actors within an organization.
However, he further argued that legitimacy is “dependent on a collective audience, yet
independent of particular observers (Suchman 1995, p. 574).” An individual’s disapproval of
an entity’s value system does not necessitate a legitimacy gap. There needs to be a collective

86
agreement between the social constituents. In addition, an entity may diverge from society’s
aspirations and yet still maintain its legitimacy if the constituents are not privy to the gap
(Mobus 2005).
Lindblom (1983) argued that organizational legitimacy can be motivated by changes in the
society’s values or norms . Dowling and Pfeffer (1975) extended this by including
competition between organizations for resources as another motivation for legitimacy.
Legitimacy itself is a valuable resource for which entities compete. Society values or norms
can be congruent with or in conflict with market forces in defining and constraining an
entity’s domains in a society. The privatization of public services is an example where the
expectations of society and market mechanisms may conflict.
Traditional legitimacy theory assumes that legitimacy is limited to an entity utilizing
resources to maximise wealth (Friedman 1962). Legitimacy is then accorded to organizations
that perform well and consistently produce profits (Patten, D.M. 1991). However, the concept
has evolved and is now not constrained by marked based expectations. For example, Dowling
and Pfeffer (1975) argued that legitimacy is not only represented by economic exchanges or
resource allocations between an entity and the constituents in the social system. They cited
the case of drug cartels in the US that had adequate access to resources and conducted
efficient economic transactions even though they were illegal. This was compared to
inadequate access of basic healthcare in poor and rural areas.
Legitimacy cannot be assessed by mere conformity to the legal rules of a society. It can be
argued that there is an association between regulatory compliance and the values or norms of
society (Mobus 2005).However, the association is not perfect for it to be definitive (Dowling

87
& Pfeffer 1975). Dowling and Pfeffer (1975) gave three reasons why there is an imperfect
association between legality and society’s values or norms. Firstly, they contended that
society values or norms evolved over time compared to black letter rules that are tied to
formalities. Rules are harder to change and by the time new rules are introduced to meet
society’s demands, society’s values may have changed. Secondly, there can be conflicts
between constituents of the society about what are the right values or norms. One person’s
values may not be the same as another person’s. Regulations, on the other hand, can be
coherent. Lastly, there can be contradictions between the views of society and the law on
certain behaviour. For example, gambling may be tolerated by society but punished heavily
under certain laws. However, it does not mean that legal compliance is not essential in
assessing legitimacy. Mobus (2005) studied the association between mandatory
environmental performance disclosure and the ensuing environmental regulatory
performance20. He showed that mandatory disclosure requirements for environmental
performance meant that companies had to report on violations of the standards. This meant
that compliance to the rule became an essential part of legitimacy to some constituents.
Suchman (1995) identified three major forms of legitimacy (Figure 8). They are pragmatic,
moral and cognitive legitimacy. The distinction was based on their varying behavioral
dynamics. Pragmatic legitimacy may involve scrutiny by constituents of the direct and
practical consequences of an entity’s practices on them. However, pragmatic legitimacy is not
limited to interdependencies or exchanges between the entity and constituents. It can also be
obtained by responding to society’s concerns and making the constituents a part of the policy
making process (Meyer & Scott 1983; Suchman 1995). Moral legitimacy depends on value
judgments by constituents about whether an entity’s practices uphold societal welfare. The 20 The study involved 44 US petroleum refinery companies from 1992 to 1994.

88
evaluation on an entity’s moral legitimacy may include assessments of its products and
consequences, methods and dealings, structures and key personnel (Suchman 1995).
Cognitive legitimacy does not involve evaluations of the interests of constituents but is based
on comprehension and ‘taken-for-grantedness’ (Suchman 1995). Comprehension allows
society in a chaotic cognitive environment to view the importance of an organization without
any interference. ‘Taken-for-grantedness’ legitimacy assumes a calmer cognitive process, in
which an organization gains superiority over others by managing disorders and consequently,
taking control over the construction of new expectations (Suchman 1995). This is the highest
and most rewarding, but the hardest form of legitimacy that an organization can achieve.
Figure 8 Forms of legitimacy and reasons for legitimacy
Suchman (1995) contended that organizations seek legitimacy for four main reasons. They
are continuity, credibility, passive support and active support. To survive in a society,
organizations need to sustain the supply of resources obtained from society’s constituents. It
is, thus, important for them to stay congruent with society’s expectations. Credibility relates
to maintaining legitimate records of organizational practices so that society can reliably
believe in the legitimacy of the entity. Meyer and Rowan (1977) argued that companies that
Forms of legitimacy
pragmatic direct and practical
consequences of an entity's action on constituents
moral
value judgments by constituents on whether an entity is operating within
society's expectations
cognitive an entity can operate freely and set the expectations
Reasons for: continuity credibility
passive support active support

89
failed to provide adequate and credible information will be more susceptible to negligent or
unfounded claims against them. An entity that is only seeking passive support from the
constituents will have a lower legitimacy threshold than an entity aiming for active support
(Suchman 1995). This entity will address society’s common expectations and assume that it
is enough to avoid any further scrutiny. An entity that seeks active support will have to go
beyond this. It has to address society’s more complicated demands and compete with other
entities that are also trying to win society’s active endorsement.
There are several theories about how entities attempt to ensure their legitimacy. Ashford and
Gibbs (1990) categorised these methods as substantive management and symbolic
management. Substantive management entails real and substantial changes in the entity or in
the larger society value systems. In an ideal system, an entity will adapt output, objectives
and operating systems to correspond with society’s prevalent notion of legitimacy (Dowling
& Pfeffer 1975). This is a form of ‘coercive isomorphism’ (DiMaggio & Powell 1983).
Coercive isomorphism means that an entity is pressured to conform to society’s expectations
and often the expectations are automatically built into an organization (Ashforth & Gibbs
1990). However, an entity may only seek to meet the expectations of powerful or key
constituents that are critical for its survival (Deegan, C. 2002). Ashford and Gibbs (1990)
termed this as ‘role performance’ and may include maximizing shareholders’ return, ensuring
reasonable priced goods and services for customers and maintaining employees’ job security.
For example, Neu et al (1998) found that companies were significantly more responsive to
demands by government and substantial shareholders than to demands by conservationists.
An entity may also change the mix and degree of their dependence on constituents for
resources (Ashforth & Gibbs 1990). This may alter the legitimacy expectations placed upon
the entity. Another substantive management method is to alter society’s view of legitimacy to

90
that of the organization (Dowling & Pfeffer 1975). As an example Miles and Cameron (1982)
suggested the response of the tobacco industry to the anti smoking movements that threaten
its survival. Tobacco companies tried to negate the backlash through intense lobbying against
anti smoking legislations, sponsoring large events, embarking on extensive marketing and
awarding grants to the scientific community to provide empirical evidence to support the
industry.
Symbolic management is another category of legitimacy management as defined by Ashford
and Gibbs (1990). This involves superficial changes or portrayals of an entity as being
consistent with society’s perception of legitimacy. Ashford and Gibbs (1990) provided
several symbolic management strategies. They include promotion of an entity’s conformity to
society’s values while at the same time doing otherwise, withholding information that may
create legitimacy gaps and reframing and redefining any legitimacy issue through other
symbols, values or actors that are socially acceptable themselves. Furthermore, an entity can
justify or provide excuses to negate or limit presumptions of a lack of legitimacy and by
offering apologies and showing remorse to limit or delay potential losses from legitimacy
gaps. Finally, a company may ceremoniously observe highly visible and prominent practices
that conform to society’s value or norms without changing the entity’s essential operating
systems.
Legitimacy theory is consistent with the political costs hypothesis. Watts and Zimmerman
(1978) posited that there is a negative association between the disclosure of favorable
information and the probability of incurring political costs from the disclosure. They argued
that the degree of the political cost is dependent on the size of the company. For example,
they showed that Exxon (a bigger company) incurred significantly higher anti-trust claims

91
than a smaller competitor. These political costs come from constituents in a society who try
to impose their own notion of legitimacy upon an entity. Political costs can also arise from
decreases in profits from regulatory interventions, union claims and negative media attentions
(Wagenhofer 1990). Wagenhofer (1990) tested the hypothesis in his model of a duopolistic
market. He found that regulatory, union and media attentions led to significantly higher
political costs. When the risks of political costs are higher, the result showed that there was a
positive association between the level of favorable news withheld and the probability that
companies are also holding onto unfavourable information. This may mean that companies
are trying to avoid attention from either being too successful or worse off. Consistent with the
hypothesis, when political costs were low this association was not observed. However, Milne
(2002) argued that researchers have been using the political costs hypothesis rather loosely in
disclosure studies. He noted that Watts and Zimmerman did not refer to annual report
disclosure but focused on reported accounting numbers.
Deegan (2002) argued that from a legitimacy perspective the incentive to disclose
information should be distinguished from the obligatory disclosure of information to those
who are entitled to it. Companies need to indicate that they are congruent with society’s value
and norms for their efforts to be noticed by society (Ashforth & Gibbs 1990). To employ any
legitimacy management method without communicating it to society would be futile
(Cormier & Gordon 2001). The information is vital in changing society’s perceptions of the
company (Deegan, C. 2002). Gray et al. (1996) argued that annual reports play a significant
role in creating an impression of a company. Disclosure of information in the annual reports
may be effective in managing legitimacy given that annual reports are highly accessible
(Branco & Rodrigues 2006). In addition, the information may be deemed more credible given
that it will be reported within audited financial statements (Ahmad & Sulaiman 2004; Neu,

92
Warsame & Pedwell 1998; Tilt 1994). However, Mobus (2005) argued that voluntary
disclosure of information can be a diversion to appease society’s concern without having to
substantively address the issue. It is a symbolic management of the issue (Ashforth & Gibbs
1990).
Scott and Meyer (1991)showed that the notion of legitimacy differs between environments.
They argued that it is a fluid concept that is constrained by technical and institutional
dynamics. Furthermore, Deegan (2002) argued that legitimacy theory studies cannot be
examined without reflecting on political, social and institutional backgrounds. Thus, the
characteristics of entities may determine society’s expectations of them. One consistent
finding is an association between a company’s visibility and the extent of society’s
expectations. Company size has been used extensively as a proxy for visibility to show a
positive association between visibility and legitimacy issues (Brammer & Pavelin 2008;
Cormier & Gordon 2001; Cowen, S, Linda & Scott 1987; Hamid 2004; Huafang & Jianguo
2007; Leung & Horwitz 2004; Mobus 2005; Patten, D.M. 1991; Trotman & Ken 1981). It is
argued that larger companies are more likely to attract public attention and consequently face
a greater threat to their legitimacy. These companies also may have a larger number of
shareholders who may demand compliance with society’s values and norms (Cowen, S,
Linda & Scott 1987). Thus, it is argued that larger companies are more likely to disclose
information to indicate that they are legitimate.
The nature of the industry may also influence the extent of public pressure and the
consequent threat to legitimacy. Certain industries may be more scrutinised than others and
this may influence the level of legitimacy management (Brammer & Pavelin 2008; Branco &
Rodrigues 2006; Craswell & Taylor 1992; Patten, D.M. 1991; Raffournier 1995). For

93
example, the debate about excessive executive remunerations has been significant in the
financial sector. The scrutiny of financial institutions may force them to disclose more
information to justify salaries and limit potential losses from public dissatisfaction. In
addition, Cowen, Ferreri and Parker (1987) argued that regulatory pressure may differ across
industries. Given the ongoing debate on executive remuneration, it may be expected that
regulators will focus more on the finance companies compared than the rest of the market.
Patten (1991) studied the association between public pressure, profitability and the level of
voluntary disclosure of social information in annual reports. Social information disclosure
covered eight categories. They were environment, energy, fair business practices, human
resources, community involvement, products and others. His study of 128 US companies for
the year of 1985 showed a positive association between public pressure as proxied by size
and the level of disclosure. Politically sensitive industries such as petroleum, chemical and
paper mills were also hypothesised to have higher public scrutiny and more social disclosure.
The study also proposed that public pressure would have a greater influence on the level of
social disclosure than profitability. It was argued that profitability was important for the share
market that may have less demand for social disclosure. The study found significant support
for these arguments. The proxies for public pressure were found to significantly influence
social disclosure. Using the same set of categories of disclosure, Cowen et al. (1987) in their
study21 showed that industry classifications played a role in the disclosure of the categorical
information.
21 The study involved 134 US companies for sample year of 1978
94
However, Babío Arcay and Muiño Vázquez (2005) did not find a significant association
between Spanish companies operating in regulated industries and the extent of voluntary
disclosure. They showed that regulated companies were also among the largest companies in
the Spanish market. This meant that there was a high correlation between industry
classification and company size for the association to be independently tested. These
companies may have already disclosed more information than the rest of the industries
because of their size. A similar finding was observed by Conyon, Malin and Sadler (2002) in
their study of the disclosure of executive stock options in the UK. Owusu-Ansah (1998) also
found an insignificant association between industry classifications and the level of mandatory
disclosure in Zimbabwe companies.
O’Dwyer (2002) found that managers sometimes choose not to voluntarily disclose
information that relates to legitimacy gaps. He interviewed 29 senior managers of 27 Irish
companies on their social disclosure policies. Although the managers agreed that there was a
need to respond to legitimacy gaps, they would rather choose to let any public outcry go
away ‘on its own’. They perceived that by providing extensive disclosure on an issue, it
would legitimize the importance of the issue. The public was already skeptical and providing
further information may be counterproductive. On the other hand, with mandatory disclosure
requirements, managers might be better off to disclose all information, positive or negative.
Mobus (2005)studied the association of the disclosure of environmental performance and the
subsequent environmental performance of US petroleum refineries under a mandatory
disclosure framework. Mandatory disclosure leads to an exposure of non-compliance that
may not happen if it was left to managers’ discretion. He found that companies complied with
the regulations to protect them from further legitimacy threats. The level of non-compliance
for the subsequent years was also reduced.

95
When a crisis or unexpected event occurs, a company has to be reactive to maintain its
legitimacy (O’Donovan 2002). Prior studies have shown that companies responded to
negative media attention and public scrutiny and consequently to threats on their legitimacy
by disclosing additional information (Deegan, C. 2002; Hutchings & Taylor 2000; Patten,
Dennis M. 1992). For example, Patten and Dennis (1992) found that in the aftermath of the
Exxon Valdez oil spill there was significant disclosure of social responsibility by petroleum
companies to manage the negative publicity that the spill generated. There was a similar
response after the OK Tedi River pollution with a significant increase in environmental
disclosure by mining companies (Hutchings & Taylor 2000). Brammer and Pavelin (2008)
did not find a significant association between the extent of media attention and the level of
environmental disclosure of UK companies. However, as expected they found that the extent
of media attention was highly correlated with the sensitivities of the nature of the business.
The ongoing debate about executive remuneration may motivate a similar response from
Malaysian companies. There is an additional incentive to justify executive remuneration to
avoid negative reactions from society’s constituents. For example, Wade, Porac and Pollock
(1997) identified three types of justification for remuneration. They were external
corroborations, shareholders’ alignment narrations and discussions of company performance.
They studied the salary justifications of 266 listed companies in S & P for the year 1992 in
light of the debate on excessive CEO pay in US. They found that companies with high
ownership concentration, high salaries and high shareholder activism were more likely to
justify their executive remuneration policies by disclosing the appointment of external
remuneration consultants as advisors. These companies were also more likely to argue that, in
general, the remuneration policies aligned the interests of managers and shareholders.

96
However, the companies stopped short at disclosing whether the remuneration policies were
actually working in aligning the interests. They also found that companies with higher
accounting profits downplayed market performance and market volatility. They concluded
that these were symbolic attempts by management to legitimize their pay practices. However,
they noted that the analysis only covered one year and that they could not conclude definitely
that they were mere symbolic gestures or whether they involved more substantive efforts. To
quote Wade et al. (1997, p. 662), “substance may indeed induce symbolic acts, but symbolic
acts reinforce and shape substance.”
3.2.3 Signaling Theory and Proprietary Costs
Grossman (1981) and Milgrom (1981) argued that managers are likely to reveal all
information that they possess. The managers are apprehensive that the market would react
negatively by assuming the worst if it became known that they were holding back some
information. Investors may over-discount the value of a firm by assuming that managers are
reluctant to release bad news (Milgrom 1981). However, various studies have shown that
managers apply discretion on what and when to disclose to the market. Disclosure of
information is not costless. The costs are not limited to the money and time spent to prepare
and provide the information to the public but may include proprietary costs. Proprietary costs
are the costs of publicly disclosing proprietary information. It is an indirect cost of the
disclosure of information (Suijs 2005). Proprietary information is defined as “information
whose disclosure reduces the present value of the company endowed with the
information”(Dye 1985, p. 331). The disclosure of non-proprietary information may
inadvertently reveal some proprietary information (Dye 1985).

97
The existence of proprietary costs may limit the extent of disclosure. Verrecchia (1983)
argued that there is an inverse association between proprietary costs and the disclosure of
information. In his disclosure model, proprietary cost is the constant. The level of disclosure
is the dependent variable and the price of a risky asset is the independent variable. The
disclosure of proprietary information will reduce the value of the risky asset by a constant.
The model shows that when the proprietary cost is nil, managers will adopt total disclosure.
There is equilibrium when the managers’ expectation of the effect of withholding information
reconciles with the investors’ rational interpretation of the managers’ action. Verrecchia
argued that proprietary cost created noise in the model. When managers withhold news, it
opens the door to different interpretations by investors. They might infer that the withheld
news is bad news or non-dramatic good news that does not justify losing any proprietary
information (Suijs 2005). Non-disclosure is, thus, not necessarily interpreted as bad news by
the market. This may explain why managers are able to hold back information. However,
Wagenhofer (1990) argued that companies can still incur proprietary costs from withholding
of information. Competitors may take adverse actions from inferring to the information
content behind the withheld information. For example, if competitors believed that a
company is withholding information about a new technology, they might undertake
aggressive sales tactics to gain more market share. It may reduce the company’s current
earnings and its capability to exploit the new technology. This may buy the competitors some
time to catch up on the technology. Companies may reduce the probability of adverse
reactions by adopting a partial disclosure of information to negate the proprietary costs from
non-disclosure.
Verrecchia (1990) extended his 1983 model by considering the quality of the information and
its effect on the extent of disclosure. He showed that as the quality of the information

98
increased, managers are more likely to disclose more to the market. Managers are more
inclined to disclose credible information to avoid over discounting of company value by
investors if the information is withheld. Managers have been shown to ‘time’ the disclosure
of good and bad news. Disclosure of bad news tends to be delayed compared to favourable
news (Jung & Kwon 1988).Pastena and Ronen (1979) showed that managers delayed the
announcement of bad news until the end of fiscal year when it was no longer feasible to do so
because it had to be disclosed to independent auditors. In addition, Jung and Kwon (1988)
contended that managers will be forced to release withheld information if investors can
acquire the information independently.
In their model of voluntary disclosure built around adverse selection objectives, Lang and
Lundholm (1993) found that there is a performance threshold that influences the level of
disclosure. Companies that performed beyond the benchmark will disclose more information,
after considering disclosure costs. Newman and Sansing (1993) also showed that companies
that have good news, disclose them more informatively than companies with bad news.
Verrecchia (1983) argued that managers delay the disclosure of bad news in the hope that
some miracle or turnaround will occur without any consideration of rational expectations.
They did not consider that a rational market may infer that any non-disclosure means that
companies are holding back bad news. Mercer (2005) examined the effect of disclosure on
managers’ reporting credibility by looking at investors’ short and long term perceptions. He
found that in the short term, investors measure managers’ credibility by the forthcomingness
of the disclosure of especially bad news22. Investors associate the disclosure of negative news
as indicating more credible managers. However, in the long term, investors will associate
22 The study involved 244 MBA students that were given different sets of information over a period of two weeks. Their pre and post information disclosure of assessment of management credibility were measured to test the study hypotheses.

99
managers’ credibility with performance. Managers who now disclose good news are
presumed to be more credible than managers who report otherwise. The effects of full
disclosure of information on managers’ credibility are only temporary (Mercer 2005). This
may mean that performing or profitable companies are more likely to disclose more
information in the long run given that investors will relate more positively to good news than
otherwise.
Various studies have supported the view that good news is relayed faster and more
extensively than bad news (Leung & Horwitz 2004; Lev & Penman 1990; Pastena & Ronen
1979; Patell 1976; Patell & Wolfson 1982; Penman 1980; Scott 1994; Waymire 1984). For
example, Scott (1994) found that Canadian companies are more likely to disclose news of
reductions in pension costs than increases. Patell and Wolfson (1982) showed that companies
listed in the Chicago Board Options Exchange during the year 1976 to 1977, significantly
delayed the disclosure of bad news until after the close of a trading day. This news was
eventually published in the next’s day Wall Street Journal. They argued that companies tried
to provide a natural non trading period so as to systematically limit public exposure to the
negative announcements. The natural non trading period may act as a cooling off period so
the market can absorb the negative news and reduce the shock to the stock price when
markets are opened.
Studies have also found that better performing companies disclose more information than
poorer performing companies. Profitable companies disclose more information to distinguish
themselves from other companies. Without a signal, the market may price performing and

100
non-performing companies at the same price creating the ‘lemons’23 problem (Grossman
1981). Lang and Lundholm (1993) found that companies with higher stock returns disclosed
significantly more information than other companies24. Debreceny and Rahman (2005)
studied eight stock exchange online announcements of eight countries for 334 sample
companies. They found that companies with higher returns on equity provided significantly
more continuous disclosure. Similar results were also obtained by Patell (1976), Penman
(1980), Lev and Penman (1990), Skinner (1994), Schadewitz and Blevins (1998), Owusu-
Ansah (1998), Miller (2002), Gelb and Zarowin (2002), Hossain et al. (2005), Leung and
Horwitz (2004) and Raffournier (1995). However, several studies have found contrary
evidence where non-performing companies disclose more information. Skinner (1994) argued
that non-performing companies disclosed more information as a pre-emptive measure to
reduce potential litigation costs. Skinner (1997) extended this by showing that companies that
were already involved in lawsuits and that provided timely disclosure incurred significantly
lower settlement costs than companies that did not do so25.
3.2.4 Proprietary costs and disclosure
Clinch and Verrecchia (1997) in their model of companies in a duopolistic market, showed
that the probability and range of disclosure were reduced with increases in the level of
competitiveness. However, Darrough and Stoughton (1990) suggested that competition in the
form of new entrants would improve voluntary disclosure. They assumed that low entry costs
will increase the probability of new entrants into the market. The existing companies are
23 Akerlof (1970) provided a scenario where the owner of a good used car ‘cherry’ will not sell his car in a used car market. This is because the average price of all used cars in the market would be lowered by clunkers or worse off used cars ‘lemons’ by uninformed buyers. The similar scenario can be applied to the capital market when there is information asymmetry when investors do not have enough information to distinguish between performing and non-performing companies. 24 Lang and Lundholm (1993) studied 2319 company years of Financial Analysts Federation Corporation Information Committee Reports between sample years of 1985 to 1989. 25 The study involved a sample of 221 US companies that were involved in litigations during sample period of 1989 to 1994.

101
forced to reveal more proprietary information to distinguish themselves from the new
entrants. Contrary to this, they argued that Verrechia’s model assumed that new entrants will
increase the pool of rivals. As the pool of competitors increases, the proprietary costs became
higher and the company will be more reluctant to disclose information. Although their
perspectives on the effect of new entrants differ, the conclusion of both these models is
similar. An increase in proprietary costs will limit disclosure (Darrough & Stoughton 1990).
Prior studies have used various proxies for proprietary costs including industry
competitiveness such as the industry sales concentration ratio of the four largest companies
within a specific industry (Berger & Hann 2002; Gelb 2000; Harris 1998; Leung & Horwitz
2004; Luo, Courtenay & Hossain 2006) and company total sales over the total sales of its
specific industry classification (Clarkson, PM, Kao & Richardson 1994; Debreceny &
Rahman 2005; Hagerman & Zmijewski 1979; Mohd Ghazali & Weetman 2006; Press &
Weintrop 1990). The industry competitiveness ratio seeks to measure directly the extent of
competition within a specific industry.
Another proxy for proprietary costs is a company’s investment growth opportunities. High
growth companies have more to lose from disclosing vital proprietary information that may
reduce future returns if it is revealed to competitors (Shan 2009). The competitors can exploit
the proprietary information and take away the disclosing company’s competitive edge for
potential future growth (Bamber & Cheon 1998). High growth companies are thus expected
to disclose less information to limit any proprietary costs. However, Schadewitz and Blevins
(1998) provided an alternative argument for the inverse association between disclosure and
growth potential. They argued that companies rely on positive performance measure to signal

102
future return from growth opportunities rather than providing additional disclosure. If the
performance signal is adequate in informing investors of the companies’ future, companies
do not have to incur potential proprietary costs from additional disclosure. Investment growth
opportunities can be represented by the ratio of market value to the book value of equity
(MKBVE) (Adam & Goyal 2008; Bamber & Cheon 1998; Berger & Hann 2002; Clarkson, P,
Van Bueren & Walker 2006; Debreceny & Rahman 2005; Frankel, Kothari & Weber 2006;
Garcia-Meca & Martinez 2007; Gelb & Zarowin 2002; Gul & Leung 2004; Hossain, Ahmed
& Godfrey 2005; Lang & Lundholm 1993; Ryan 2001; Schadewitz & Blevins 1998).
MKBVE represents the value of a company represented by the cash flow from assets in place
and future growth potential (Adam & Goyal 2008). High growth companies have high market
capitalizations relative to the value of their in-use assets. Their market values are derived
from future assets that depend on future discretionary decisions by executives (Ryan 2001).
Prior empirical studies have investigated the association between proprietary costs and the
extent of disclosure. They have looked at the influence of proprietary costs on different
segments and types of disclosure using various proxies for proprietary costs. Scott (1994)
examined the determinants of voluntary disclosure of details of defined benefit pension plans
by Canadian firms26. He found that proprietary costs proxied by the frequency of strikes, pay
rate and company profitability relative to industry, have significant negative associations with
the level of disclosure by defined benefit plans. Lou et al. (2006) found that higher
proprietary costs; proxied by a competition index, constrained the voluntary disclosure of
future earnings27. Talha et al. (2008) found that Malaysian companies that provided more
segment reporting information had higher competitive disadvantages. They measured
26 The study examined 288 Canadian companies excluding companies that were wholly-owned, government listed or privately held for the years 1997 and 1998. 27 The study analysed 172 Singaporean companies between sample years 1994 to 2000.

103
proprietary costs using a total performance index that consisted of the aggregated total z-
scores of operating margin, return on total assets and value added ratios28.
Bamber and Cheon (1998) in their study of voluntary disclosure of earning forecasts of 151
New York Stock Exchange listed companies from 1981 to 1991 accepted the hypothesis that
high growth companies disclose significantly less information. Managers of high growth
companies were also found to disclose information to limited audiences, such as in private
meetings with reporters and analysts, rather than in a general statement. Huafang and Jianguo
(2007) also found a negative association between growth opportunities and the level of
disclosure in Chinese companies. They argued that companies with greater growth would
delay disclosure of information to protect their core competitiveness.
Contrary to the studies that had found that growth opportunities limit the level of disclosure,
Riahi-Belkaoui (2001) found that the quality of disclosure significantly improved with higher
investment opportunities29. The study used analyst’s ratings of disclosure comprehensiveness
as a proxy for disclosure quality. Similar results are also found by Garcia-Meca and Martinez
(2007).They found that analyst’s reports of listed Spanish companies with high market to
book ratios disclosed more information on intellectual capital30. They argued that there was
an incentive for analysts to disclose more information to substantiate their positive
recommendations. This can also be a signal to distinguish themselves from low growth firms
by disclosing positive earnings prospects from the growth opportunities. Gul and Leung
28 The study covered a sample of 116 listed Malaysian companies for the year 2002. 29 The sample set included 313 US companies for the sample period of 1986 to 1990. 30 The sample consisted of 260 analyst reports of Spanish listed companies during the years of 2000 to 2003 using a self constructed disclosure index.

104
(2004) also found a significant and positive association between growth opportunities and the
level of disclosure in Hong Kong companies.
In addition, there have been several studies that have failed to find significant associations
between proprietary costs and the level of disclosure. Cahan and Hossain (1996) studied the
association between investment opportunities and the disclosure of forecasts by Malaysian
listed companies. They hypothesised that high growth companies would disclose more
information on their future to show a commitment to growth strategies and to constrain
potential managerial discretion. However, the hypothesis was rejected. They argued that the
captive nature of the Malaysian market means that disclosures on a company’s future are a
mere public relations facade while ‘real’ information is disseminated informally to insiders
and substantial shareholders. This result is consistent with Mohd Ghazali and Weetman
(2006) who also failed to find a significant association between the level of competition and
voluntary disclosure in Malaysian companies’ annual reports31. They argued that in Malaysia,
the dominance by families and insiders is stronger than market forces.
3.3 Review of prior empirical studies on the disclosure of executive
remuneration Andjelkovic, Boyle and McNoe (2002) studied the reactions to and importance of public
disclosure requirements for CEO remuneration. Prior to 1997, New Zealand companies were
not required to disclose the level of executive remuneration. After July 1997, Section 211(1)g
of the revised Companies Act required companies to disclose by bands and individually the
remuneration of executives. The new requirement had been met with great resistance by
influential groups such as the NZ Employers Federation, the NZ Business Roundtable and the 31 The study involved 812 Malaysian companies that are listed in Bursa Malaysia using sample year of 2001.

105
NZ Privacy Commissioner. Andjelkovic et al. suggested that the resistance was because
companies did not want to disclose existing remuneration policies that may have been lax and
not in the interests of shareholders. The long term nature of remuneration contracts may
mean that companies would not have time to restructure the contracts and avoid being
exposed when the new requirements took place. Andjelkovic et al. tested this argument by
examining 49 New Zealand companies for the year 1997 when the disclosure requirement
was not mandatory. They compared companies that adopted the requirement earlier and those
that did not. They found that the early adopters had a significant CEO pay and performance
association. The non-adopters did not show a significant association. They argued that this
supported their hypothesis that companies that were more likely to resist the requirement
were those who did not ensure the efficiency of their remuneration structure and would have
more to lose out if they were to comply with it. The result also showed that only after the
introduction of the disclosure requirement that a significant number of companies started to
engage in proactive measures to improve their remuneration policies for example by creating
remuneration committees and introducing option plans. Andjelkovic et al. concluded that
without the disclosure requirements, executive remuneration would not be effective in
mitigating agency problems because it could not be independently and publicly assessed.
They argued that it could lead to a dissociation of pay and performance that should have been
the primary objective of remuneration. They concluded that there was a need to further
examine the association between pay and performance and the level of disclosure after the
mandatory disclosure came into effect.
Forker (1992) examined the quality of disclosure of executive share options of 182 UK
companies for the accounting year ending between October 1987 and September 1988. The
study categorised the companies into six ranks, Class A being the highest and Class F being

106
the lowest. 46% of the companies were ranked in Class A and 6% in Class F. The study then
tested the associations between the quality of disclosure and the threat of takeover,
administrative costs of disclosure, audit quality, managerial ownership, the existence of an
audit committee, independent directors, dominant personality and opportunistic benefits from
non-disclosure. However, the study only found that the administrative costs of disclosure and
the presence of a dominant personality significantly limited the quality of the disclosure of
executive stock options. The corporate governance measures of audit committees and
independent directors were only found to weakly influence the quality of disclosure. Forker
suggested there should be an adequate guideline before the independent directors and audit
committee could effectively discharge their responsibilities as governance mechanisms.
Conyon, Malin and Sadler (2002) extended Forker (1992) by studying 350 FTSE listed
companies for 1994 and 1995. Contrary to Forker, they found a positive association between
the quality of the disclosure of options and the proportion of non-executive directors. The
regulatory landscape during the sample period had changed since Forker’s study with the
release of the Greenbury report in 1995 that set up comprehensive corporate governance
guidelines and recommended more disclosure on remuneration. This may have guided the
independent directors in exercising their duties. The result also showed significant and
negative associations between company size, performance measures and the quality of
disclosure. They attributed this association to higher proprietary and political costs incurred
by bigger and more profitable companies if they were to disclose more information.
However, they cautioned that the association between size and the quality of disclosure may
be non-linear. They tested this by including the square of company size into the models. The
result showed a concave association between size and disclosure. This may imply that there

107
was a trade-off between the benefits and costs of disclosing more information, for example
credibility versus proprietary costs.
Coulton, James & Taylor (2001) studied the level of disclosure of CEO remuneration by 513
Australian listed companies from 1998 to 2000. During the period, the Australian government
ammended Section 300A and Section300(1)(d) of the Corporations Law that required
companies to disclose the nature and details of the emoluments of company’s directors and
top five highest paid officers. The requirements were heavily criticised for being inconsistent
and ambiguous since some of the terms of the laws, for example “emoluments” and “officers”
were not properly defined. However, the regulators stated that companies should follow the
spirit of the laws that advocated transparency rather than on the ‘black letter’ words. Given
the perceived ambiguities, the study expected that there would be significant variations in the
level of compliance with the disclosure requirement. These variations were also hypothesised
to be influenced by economic, corporate governance and ownership variables. The study
showed that Australian companies were mostly reluctant to disclose the association between
pay and performance (average score = 8.8%) and the valuation method used in executive
options schemes (average score = 15.24%). The absolute disclosure score distribution for the
sample period showed a significant variation ranging from a minimum of 2.0 to a maximum
of 8.5. The level of CEO remuneration disclosure was significantly and positively influenced
by company size and performance. The level of remuneration and outsider blockholdings
significantly limited the level of transparency. The CEO may disclose less information when
the level of remuneration is high to avoid public scutiny. Outsider blockholders would have
the power to obtain information from other channels given their large shareholdings.
Corporate governance variables, insider ownership and the composition of remuneration did
not significantly influence the level of disclosure of CEO remuneration. Coulton et al. (2001)

108
argued that corporate governance measures had a minimal impact on the disclosure of CEO
remuneration as remuneration is an issue where there may be a divergence of interests
between the CEO and external shareholders.
Nelson and Majella (2005) studied the disclosure of executive stock options for 197
Australian companies for the years of 2000 and 2002. The disclosure level was measured
using AASB 1028 ‘Accounting for Employee Entitlements 1994’ and AASB 1017 ‘Related
Party Disclosure 1997’. They found that the level of compliance with the accounting standards
was poor. No company fully complied with the standards. The average mandatory disclosure
score was 45.16%. Companies were mostly reluctant to disclose the price information of the
executive option plans (mean = 29.44%). This may indicate that companies perceived price
information as so sensitive that it had to be withheld. The study also considered whether
companies voluntarily disclosed information beyond the accounting standards. The voluntary
score was also poor with an average of 10.21%. Nelson and Majella concluded that
Australian companies treated mandatory accounting standards as voluntary and perceived that
there was lack of enforcement for non-compliance. Further analysis showed that the presence
of remuneration committees and company size significantly improved the level of
compliance with the accounting standards and improved the level of options disclosure.
Bassett, Koh and Tutticci (2007) examined the role of corporate governance on the
mandatory and voluntary disclosure of executive stock options after the introduction of a
revised version of Australian AASB 1028 ‘Employee Benefits’ in 2001. They studied 283
Australian listed companies using 2003 as the sample year. The revised AASB 1028 set down
more stringent disclosure requirements for executive stock options compared to the preceding

109
regulations such as the s300A of the Corporations Law and the existing AASB 1028. The
results showed that a significant number of Australian companies did not comply fully with
the mandatory accounting standard. The mean and median mandatory disclosure was 76.1%
and 80% respectively. Companies were shown to be reluctant to disclose the voting and
dividend rights and the expiry dates of the options. Bassett et al. (2007) argued that this
reflected differing assessments by Australian companies of the cost of non-compliance with
the mandatory disclosure requirements. The mean and median values of disclosure in excess
of the mandatory accounting standards were 19.5% and 16.7% respectively. Companies that
had external audits by the ‘Big Four’ were significantly associated with higher mandatory
and voluntary disclosure of executive stock options. Consistent with the expectation,
companies whose CEOs held dual roles as Chairman had significantly lower levels of
compliance with the disclosure requirements. The presence of audit committees, board size
and the proportion of executive directors were not significant in influencing mandatory and
voluntary disclosures of executive options. Bassett et al. argued that these variables played a
less significant and more indirect role in setting company disclosure policies. Companies that
were also listed in the US significantly disclosed more information. This is expected given
that the equivalent of AASB 1028 in US is the SFAS 123 that required a more comprehensive
disclosure of executive options. In addition, Australian companies that only granted options
to senior management voluntarily disclosed more information. These companies were under
more public scrutiny as the exclusivity of the options scheme could be negatively construed
as being unequal profit sharing.
Jinghui and Taylor (2008) examined the level and determinants of the disclosure of executive
remuneration prior to the application of AASB1046 Director and Executive Disclosures by
Disclosing Entities. The new accounting standard introduced more prescriptive and extensive

110
requirements for executive remuneration disclosure. The objective of the study was to
observe the level and determinants of disclosure in a relatively voluntary disclosure
environment. Using legitimacy theory as their theoretical framework, Jinghui and Taylor
examined 191 Australian listed companies for the years 2003 and 2004. There was a
significant improvement in the level of equity based remuneration disclosure from 2003 to
2004. However, the disclosure of the post employment benefits of executives remained
minimal. The new accounting standards did not apply to the disclosure of post-employment
benefits. This suggested that companies would not disclose additional information without
prescription of the law. Jinghui and Taylor also showed that the level of media attention
significantly and positively influenced the level of disclosure of remuneration in 2004 but
that it was not significant in 2003. They argued that the anticipated introduction of the
reforms on disclosure in 2004 led to greater media attention and hence more disclosure by
companies as they sought to legitimize the level of remuneration. The level of shareholder
activism and the disclosure of remuneration were also found to be significant and positive.
Companies disclose more information as a legitimising tactic to counter potential shareholder
activism from a proposal to increase remuneration. Consistent with their hypothesis, larger
companies disclosed significantly more information. They argued that larger companies faced
more attention and greater political costs from concealing publicly sensitive information such
as executive remuneration. The proportion of independent directors positively and
significantly influenced the level of remuneration disclosure. The independent directors
would push for more disclosure of information to protect their own reputation or impartiality.
However, the presence of a remuneration committee was not significant factor in improving
the level of disclosure.

111
Clarkson, Van Bueren and Walker (2006) extended these Australian studies by looking at a
longer time period that included the years leading to and the year of the introduction of
AASB 1046. They examined 124 companies from 1998 to 2004. The study did not
distinguish between mandatory and voluntary disclosure of CEO remuneration. They argued
that it was the intention of the regulators to make all the reforms mandatory from the start.
They found that there was significant improvement in the level of disclosure of CEO
remuneration after the introduction of the AASB 1046. The earlier introduction of CLRA98
showed a significant increase in disclosure from 1998 to 1999. However, the level of
improvement was not sustained in the years before 2004. The results showed that companies
waited for the disclosure recommendations under CLRA98 to be mandatory before providing
more comprehensive disclosure of CEO remuneration. They argued that companies only
provided extensive and high quality disclosure of CEO remuneration under a prescriptive and
detailed regulatory framework and not under principle based recommendations. They also
showed that the size of companies, corporate governance, quality of audit and cross listing
status positively and significantly influenced the level of CEO remuneration disclosure.
However, the level of significance changed over the study period. The level of significance
was higher for the earlier years of the study when there was more scrutiny of remuneration.
However, after the introduction of the CLERP 9 and AASB1024, the roles played by
companies’ internal governance were replaced by the regulations.
Chizema (2008) examined the disclosure of individual executive remuneration in the German
market using 100 largest Germany companies for the years 2002 to 2005. The German
market was constrained by long term ownership by banks and families with a culture of high

112
collectivism and uncertainty avoidance32. Like Australia, the German market is also
undergoing reforms of its regulatory framework with the introduction of the German Code of
Corporate Governance (KODEX) in 2005. Section 4.2.4 of the KODEX recommended the
disclosure of individual director’s remuneration in annual reports. This recommendation was
opposed by companies during the discussion process. Chizema examined the characteristics
of the companies that complied with the code over the sample period and the differences in
the characteristics of early and late adopters of the code. The study adopted an institutional
theoretical lens that looked at the influence of various owners (banks, family, state and
foreign) on the level of compliance. The results showed that at the end of 2004, 25% of the
sample companies had not complied with the recommendations of the code. Consistent with
the hypotheses, the study found that institutional ownership, dispersion of ownership, state
ownership, prior adoption of international accounting standards and firm size were
significantly and positively associated with the disclosure of individual executive
remuneration. Chizema also found that the size of the supervisory board and firm age were
significantly and negatively associated with the disclosure of individual executive
remuneration. The comparison between early and late adopters of the individual remuneration
requirement showed that early adopters were larger and more profitable companies with
higher institutional investors that had previously adopted certain IAS or US GAAP. The
opening up of the Germany market increased the presence of foreign shareholders that
positively and significantly influenced the level of compliance of later adopters. The
association was not observed in the early adopter model. The comparison also showed that
Germany companies with higher state ownership led the way in conforming to the code,
arguably setting an example to others in the market. Chizema (2008) concluded that a
bandwagon effect would follow as other companies look to the early adopters and mimic
32 Hofstede defined uncertainty avoidance as “the extent to which people feel threatened by ambiguous situations, and have created beliefs and institutions that try to avoid these (Hofstede & Bond 1984, p. 419)”.

113
their actions. However, he suggested that compliance may need to be coerced in the first
place before the effect would take place given the institutional characteristics of German
companies.
There are several gaps in these prior studies on disclosure of remuneration that this study has
identified and attempts to improve upon. Firstly, most of them did not adopt an inclusive
theoretical framework that considers agency theory, legitimacy theory, signaling theory and
proprietary costs. The exclusion of these theories may lead to omitted variables bias that may
severely restrict the validity of their empirical findings. Even if they did include the proxies
for the all theories, they may have included them as control variables and did not elaborate on
the theoretical assumptions behind the inclusions of the variables. Secondly, these prior
studies had not been done in developing and East Asian countries where family and state
dominance are very significant. In addition, the culture of disclosure in Asian countries like
Malaysia may be different and play significant part in the level of disclosure of remuneration.
Finally, these studies focused on just individual CEO pay or a specific component of
remuneration such as options or just on individual disclosure.
In the context of Malaysia, no empirical studies had examined the disclosure of executive
directors’ remuneration in any depth. The most recent work on this subject was the
descriptive survey discussed conducted by the MSWG and the University of Nottingham.
Earlier Malaysian studies focused on overall corporate governance measures (Zulkafli, Abdul
Samad & Ismail 2004); on factors that affect their implementation (Haniffa & Cooke 2002;
Mohd Ghazali & Weetman 2006; Ngui, Voon & Lim 2008); on the actual compliance of
Malaysian firms with the corporate reforms (Christopher & Hassan 2005); and on the impact

114
of adopting corporate governance measures on firms or on Malaysian market indices (Abdul
Wahab, How & Verhoeven 2007; Aik Leng & Abu Mansor 2005; Nowland 2008). These
studies did not focus on the disclosure of Malaysian executive directors’ remuneration. Most
of these studies examined the level of compliance after the introduction of the MCCG but did
not consider the changes that followed the introduction of new accounting standards.
3.4 Summary This chapter has presented the theoretical perspectives of that this study will be grounded
upon. The chapter reviewed agency theory, legitimacy theory, signaling theory and
proprietary costs. Agency theory revealed the conflicts between the managers and other
stakeholders (i.e. shareholders, creditors, government and family owners) in companies. The
conflicts extended to managing the agency problems themselves of where shareholdings may
mitigate or create further agency problems. The review of agency theory was then linked to
disclosure as a mechanism to mitigate agency problems and reduce agency costs. The role of
corporate governance structures such as board of directors and external audits in pushing for
more disclosure were also explored.
Legitimacy theory posited that companies as organizations have incentives to meet society’s
expectation to maintain their existence in the market. Company size, profitability and the type
of industry were some of the variables that prior studies have identified that may drive the
extent of social expectations that a company will have to meet. The review showed that
remuneration policies and practices can be a significant legitimacy issue that may need to be
managed through adequate disclosure.

115
Signaling theory suggested that companies use disclosure of information to signal their real
value and to distinguish themselves to the market. Prior studies discussed in this chapter
showed that profitable companies disclosed more information compared to the others. The
level of competition in the market may also drive companies to protect their proprietary
information. Studies have linked the level of investment growth opportunities to potential
proprietary costs that companies may incur.
The next chapter will construct a research empirical framework that will be based on the
literature reviewed and the gaps identified in this chapter. This study will attempt to reconcile
the different theoretical perspectives into a single empirical framework. The framework will
then be used to develop several hypotheses that will be empirically tested.

116
Table 4 Summary of disclosure of executive remuneration studies
Author(s) Sample and Data
Disclosure variable Independent variable(s) Methodology Main findings
Chizema (2008)
Sample of 100 biggest companies listed in the German DAX from 2002 to 2005
Disclosure of individual executive compensation:
1 = disclosed
0 = not disclosed
1. Institutional ownership: percentage of shares held by institutional investors (+)
2. Foreign ownership: percentage of shares held by non-German investors (+)
3. Dispersion of ownership: total percentage of shares not held by block holders (+)
4. Bank ownership: percentage of shares held by German banks (-)
5. Family ownership: percentage of shares held by family members (-)
6. State ownership: percentage of shares held by state and federal government (+)
7. Size of the supervisory board: number of directors
Logistic regression
1. Early disclosure versus non-disclosure
2. Late disclosure versus non-disclosure
The study found that institutional ownership, dispersion of ownership, state ownership, prior adoption to international accounting standards and firm size were significantly and positively associated with the disclosure of individual executive remuneration. Consistent with their hypotheses, they also found that size of the supervisory board and firm age were significantly and negatively associated with individual disclosure of executive remuneration.

117
on supervisory board (-) 8. Prior adoption: 1 =
adoption of US GAAP or IAS before 2002; 0 = otherwise (+)
9. Firm experience: natural logarithm of age(-)
10. Firm size: natural logarithm of total asset (+)
11. Firm performance: ROA (+)
12. Industry classification
Jinghui & Taylor (2008)
Sample of 191 Australian listed companies for the years 2003 and 2004
Un-weighted
disclosure index of equity based remuneration and post employment benefits (share rights, share options and termination benefits): Number of word devoted to remuneration/Number of executives
1. Media attention: frequency of news (+)
2. Shareholder activism: number of AGM resolutions on remuneration (+)
3. Size of companies: (+) 4. Proportion of independent
directors (+) 5. Remuneration committee:
1 = if exist; 0 = otherwise
Yearly OLS regression
R2 =0.248 (2004); 0.228 (2003)
They showed that the level of media attention significantly and positively influenced the level of disclosure of remuneration in 2004 but was not significant in 2003. They argued that the anticipated introduction of reforms on disclosure in 2004 led to greater media attention. The level of shareholder activism and disclosure were also found significant and positive. Companies will disclose more information as a legitimising tactic to counter potential shareholder

118
activism from a proposed resolution to increase remuneration. Consistent with their hypothesis larger companies were found to disclose significantly more information. They argued that larger companies faced more attention and greater political costs from concealing publicly sensitive information such as executive remuneration. The proportion of independent directors positively and significantly influenced the level of remuneration disclosure. The independent directors would push for more disclosure of information to protect their own reputation of impartiality. However, the presence of remuneration committee was not significant in improving the level of disclosure.
Bassett, Koh & Tutticci (2007)
Sample of 283 ASX listed companies for the year 2003
Disclosure of executive stock options:
40 mandatory items (based on AASB 1028 and AASB 2)
1. Audit quality: 1 = big four audit; 0 = otherwise (+)
2. Proportion of independent and non-executive directors (+)
3. Board size: number of directors on the board (?)
Tobit regression
The study found that audit quality was associated with higher voluntary and mandatory disclosure. CEO duality was shown to limit the level of mandatory disclosure. Australian companies that were also listed in the US stock exchange significantly

119
39 voluntary items
0 = not disclosed
0.5 = some missing information
1 = complete information
4. CEO duality: 1 = yes and 0 = no (-)
5. Size: natural log of total assets at the end of the financial year (+)
6. Cross listed in US: 1 = yes and 0 = no (+)
7. The proportion of number of executive stock options outstanding over number of shares outstanding (?)
8. Limited ESOS: 1 = available only to executives and directors and 0 = otherwise (+)
9. Discontinued ESOS; 1 = discontinued and 0 = otherwise (-)
disclosed more information. Companies that only granted stock options to senior management were shown to voluntarily disclose more information compared to other companies.
Clarkson, Van Bueren & Walker (2006)
Sample of 124 Australian listed companies from 1998 to 2004
Un-weighted disclosure index based on AASB1046 (10 items)
Dichotomous score based from the scale of 0 to 3.
1. Total asset: the book value of assets (+)
2. Profitability: return on equity (+)
3. Growth: the market to book ratio of equity (+)
4. Leverage: total debt to equity (-)
1. Time period model: pooled generalize least squares
2. Yearly
They found that there was significant improvement in the level of disclosure of CEO remuneration only after the introduction of the AASB 1046. The earlier introduction of CLRA98 in 1998 that was voluntary in nature failed to improve the level of disclosure. The result showed that

120
5. Governance: corporate governance factor for fiscal year (+)
6. Foreign listing: 1 = foreign listed; 0 = otherwise (+)
7. CEO turnover: 1 = new CEO; 0 = otherwise (+)
8. Takeover or merger: 1 = subject to takeover or merger; 0 = otherwise (+)
9. Audit quality: 1 = big four audit; 0 = otherwise (+)
10. Auditor turnover: 1 = new auditor; 0 = otherwise (+)
OLS regression
companies waited for the disclosure recommendations under CLRA98 to be mandatory under the AASB1046 before providing comprehensive disclosure on CEO remuneration. They argued that companies would only provided extensive and high quality disclosure of CEO remuneration under a prescriptive and detailed regulatory framework and not under principle based recommendations. They also showed that size of companies, corporate governance, auditor quality and cross listing status positively and significantly influenced the level of CEO remuneration disclosure. However, their level of significance changes over the sample period. The level of significance was high at the earlier years of the study when there was more scrutiny of remuneration. However, after the introduction of the CLERP 9 and AASB1024, their roles were replaced by the regulations.

121
Nelson and Majella (2005)
Sample of 197 Australian companies for the years of 2000 and 2002
Un-weighted disclosure index based on the AASB 1028 and AASB 1017
1. Remuneration committee: 1 = exist, 0 = none (+)
2. Ownership concentration: 1 - % wholly owned subsidiary (-)
3. Dual listing: 1 = US listed, 0 = otherwise (+)
4. Audit quality: 1 = big five audit; 0 = otherwise (?)
5. Performance: operating profit after tax scaled by sales (?)
6. Leverage: long term debt over total assets (?)
7. Size: log of total assets (+)
Pooled logistic regression
Remuneration committee, size and audit quality were shown to significantly and positively improve the level of disclosure of executive stock option plans. Ownership concentration and dual listing status were significantly and negatively associated with the level of disclosure.
Conyon, Malin and Sadler (2002)
Sample of 350 FTSE listed companies for the sample years of 1994 and 1995
Quality of disclosure
- Seven dependent variables
1. Size: log market value of company (+)
2. Proportion of non-executive directors (+)
3. Debt structure: debt to equity ratio (+)
4. Performance: return on capital (-)
5. Risk: beta (systematic risk
Probit regression
They found a positive association between the quality of disclosure of options and proportion of non-executive directors. The result also showed significant and negative associations between company size, performance measure and the quality of disclosure. They attributed the association to higher proprietary and

122
of the ordinary shares) (-) 6. Industry classifications
political costs incurred by bigger and more profitable companies if they were to disclose more information. However, they cautioned that the association between size and the quality of disclosure may be non-linear. They tested this by including the square of company size into the models. The result showed a concave association between size and disclosure. This may imply that there was a trade-off between the benefits and costs of disclosing more information, for example credibility versus proprietary costs. The other variables were found to be insignificant or inconsistent in the different models for conclusions to be made.
Coulton, James & Taylor (2001)
Sample of 513 Australian listed companies for the sample period of 1998 to 2000
Un-weighted disclosure index based on the requirements of s300A and s300(1)(d)
0 = not disclosed
0.5 = some missing
1. Proportion of independence directors (+)
2. Number of directors (-) 3. CEO duality: 1 = yes and 0
= no (-) 4. Remuneration committee:
1 = if exist; 0 = otherwise (+)
Tobit regression
Consistent with other studies, the result showed a positive association between company size and the level of disclosure of CEO remuneration. However, the study did find any significant influences between all the corporate governance variables and the level of disclosure of CEO

123
information
1 = complete information
5. Audit committee: 1 = if exist, 0 = otherwise (+)
6. Audit quality: 1 = big four audit; 0 = otherwise (+)
7. Total remuneration (less options) deflated by total sales (+)
8. The ratio of option compensation to total CEO remuneration (+)
9. Outsider block holdings: percentage of shareholdings by outsiders who held more than 5% of total shares (+)
10. Insider block holdings (-) 11. Firm size: natural
logarithm of book value of assets (+)
12. Performance: unadjusted annual stock return (+)
13. Growth opportunities: book value of equity divided by the market value of equity (+)
14. Analyst following: the average monthly analysts following measured
remuneration Contrary to the hypothesis, the presence of substantial outsider block holdings appeared to limit the level of disclosure rather than improve it. Coulton et al. (2001) argued that the substantial shareholders may rely on other form of information channel such as private contracting to secure information on CEO remuneration.

124
15. Foreign listing: 1 = foreign listed; 0 = otherwise (+)
16. Industry classifications
Forker (1992)
Sample of 182 UK companies for fiscal year ending between October 1987 and September 1988
Companies were categorised in six different and dichotomous classes based on the quality of the disclosure on options.
A: Highest
F: Lowest
The ranking was based on the requirement of the Companies Act.
1. Takeover threat: market value of equity shares (-)
2. Administrative costs of disclosure: proportion of options held by directors (-)
3. Audit quality: 1 = big six audit; 0 = otherwise (+)
4. Managerial ownership (?) 5. Audit committee: 1 = exist,
0 = otherwise (+) 6. Proportion of independent
directors (+) 7. CEO duality: 1 = yes and 0
= no (-) 8. Opportunistic benefits:
proportion of options outstanding over total equity capital (-) or value of options held by directors (-)
Probit regression
The study found that the administrative costs of disclosure and the presence of dominant personality to significantly limit the quality of disclosure of executive stock options. The corporate governance measures of audit committee and independent directors were only found to weakly influence the quality of disclosure. Forker suggested there should be an adequate guideline so that the independent directors and audit committee could effectively discharge their responsibilities as governance mechanisms. Other associations were shown not to be significant.

125
Chapter 4 Hypotheses Development
4.0 Introduction This chapter develops the hypotheses for this study based on the literature review explored in
the preceding chapter. The first section addresses the effectiveness of the reforms of the
Malaysian regulatory framework to the disclosure of executive directors’ remuneration. The
second section develops the hypotheses for the determinants of the disclosure of executive
directors’ remuneration. The final section provides a summary of the hypotheses.
4.1 Disclosure of Executive Directors’ Remuneration Pre and Post
Reforms The reforms to the disclosure of Malaysian executive remuneration parallel ongoing reforms
in other countries. These are, in part, a response to intense public scrutiny on seemingly
excessive remuneration and corporate collapses that were linked to executives seeking to
achieve bonus targets. Several studies have examined the effectiveness of the reforms to the
level of remuneration disclosure, the extent of compliance and the factors that drive the level
of disclosure (Bassett, Koh & Tutticci 2007; Chizema 2008; Clarkson, Van Bueren & Walker
2006; Coulton, James & Taylor 2001; Finch 2006; Jinghui & Dennis 2008).
Bassett, Koh and Tutticci (2007) examined the role of corporate governance on the
mandatory and voluntary disclosure of executive stock options after the introduction of
Australian AASB 1028 ‘Employee benefits’ in 2001. They found that a significant number of
Australian companies voluntarily reported more than the mandatory requirements of the
accounting standard. Clarkson, Van Bueren and Walker (2006) extended this by examining
the disclosure of Australian CEO remuneration between 1998 to 2004. They found an

126
increase in overall disclosure after the reforms. They argued that the improvements in
disclosure in the later years of the study were a result of the more prescriptive and detailed
nature of the regulations. These findings are interesting, given that the Malaysian executive
remuneration disclosure requirements under the MCCG and the Malaysian accounting
standards are very broad.
Earlier Malaysian studies focused on overall corporate governance measures (Zulkafli, Abdul
Samad & Ismail 2004); on factors that affect their implementation (Haniffa & Cooke 2002;
Mohd Ghazali & Weetman 2006; Ngui, Voon & Lim 2008); on the actual compliance of
Malaysian firms with the corporate reforms (Christopher & Hassan 2005); and on the impact
of adopting corporate governance measures on firms or on Malaysian market indices (Abdul
Wahab, How & Verhoeven 2007; Aik Leng & Abu Mansor 2005; Nowland 2008). These
studies did not focus on the disclosure of Malaysian executive directors’ remuneration. Most
of the studies examined the level of compliance after the introduction of the MCCG but did
not consider the changes that followed the introduction of new accounting standards. This
leads to the following hypothesis:
Hypothesis 1: That there was an improvement in the level of disclosures of executive
directors’ remuneration by Malaysian companies after the introduction of the Malaysian
Code on Corporate Governance and changes in accounting standards.
4.2 Determinants of Disclosure of Executive Directors’ Remuneration
4.2.3 Agency Theory
In Malaysia, family and government ownership of companies is very significant and may
influence the extent of disclosure of executive remuneration. Claessens, Djankov and Lang

127
(2000) found that 85 percent of Malaysian shares are held by executives related to the
controlling family. In addition, 67.2 percent were controlled by a single family and 13.4
percent were controlled by state or government linked companies. Given the concentration of
ownership in Malaysia, it is argued that the disclosure of remuneration is a sensitive issue.
The owners and connected family directors may not be willing to disclose benefits as a result
of being in managerial positions.
This possibility can be viewed from the perspective of agency theory. Agency theory posits
that agents are self interested and rational and will seek to maximize their personal wealth
first and foremost at the expense of principals (Jensen & Meckling 1976) . Disclosure of
information can be an indirect form of monitoring agency costs between the various
stakeholders. However, in a concentrated market, disclosure of information may be limited
given that the influential and substantial shareholders are privy to insider information
(Ramaswamy, Veliyath & Gomes 2000). Li (1994) argued that financial institutions which
were the majority shareholders of most Germany listed companies relied more on insider
information than on other corporate governance measures. For example, they can assess the
managerial performance of executives directly from the companies instead of relying on
public disclosure.
Bin, Petroni and Safieddine (1999) in their comparative study of publicly and privately held
US insurance companies found that privately held insurers relied on direct monitoring rather
than on annual reports in assessing the performance of executives. A similar finding was
found by Bushee and Noe (2000) in their US study of 4314 company years from 1982 to
1996. They found no association between companies with large and stable institutional

128
ownership and changes in disclosure. This was attributed to direct channels of
communication between the companies and significant institutional owners. However, an
improvement in disclosure resulted in an increase in transient institutional ownership that the
study attributed to short-term investment strategies.
A study by Mohd Ghazali and Weetman (2006) examined the influence of dominant family
and directors’ shareholdings on the level of voluntary disclosure by Malaysian companies
after the introduction of the MCCG33. They found that these variables significantly
influenced the level of voluntary disclosure despite the changes in disclosure regulations.
They attributed this to the highly captive and regulated Malaysian capital market that may not
encourage transparency. This leads to the following hypotheses:
Hypothesis 2: That for Malaysian companies, there is an inverse association between the
level of executive director’s remuneration disclosures and the level of family ownership.
Hypothesis 3: That for Malaysian companies, there is an inverse association between the
level of executive director’s remuneration disclosures and the level of ownership
concentration.
There are conflicting views about the effect of government ownership on disclosure. Eng and
Mak (2003) argued that state controlled companies disclose more information to manage their
agency relationships with minority and other external shareholders. They need to assure these
shareholders that the government is not diverting the companies’ wealth to national interests
instead of to shareholders’ return (Shan 2009). These companies would have easier access to
33 The study involved a sample of 87 Malaysian companies listed in the Bursa Malaysia in 2001. Several control variables are included in the analysis.

129
public funds. The public as implicit shareholders want to know how their funds had been
used by these companies (Li, 1994). Chizema (2008) also argued that state controlled
companies need to set examples of high compliance with the regulatory framework given that
it is the state that initiated it.
However, government linked companies might disclose less information as they can access
government funds and may not need to compete for external capital (Naser & Nuseibeh
2003). Another factor is political connection that is associated with government ownership of
Malaysian companies. Mohd Ghazali and Weetman (2006) argued that government linked
companies will disclose less information to protect the interests of political figures or to
conceal gains from political connection. Given that executive remuneration is a sensitive
issue, these companies might have an incentive not to disclose information so as not to draw
attention to the benefits from the political connection of the executive directors. This study
adopts the view that government ownership in Malaysian companies will positively influence
the extent of disclosure of executive directors’ remuneration. The Malaysian government has
been actively promoting the ‘GLC Transformation Plans’ that include greater emphasis on
transparency. This may promote more disclosure of executive directors’ remuneration in
companies where government is also shareholder. Therefore, the next hypothesis is:
Hypothesis 4: That for Malaysian companies, there is a positive association between the level
of executive director’s remuneration disclosures and the level of government shareholdings.
Another variable that can be viewed from an agency perspective is foreign ownership. Shan
(2009) suggested that there are more demands for transparency and accountability by foreign
130
investors. Companies have the incentive to disclose more information to gain and retain that
investment (Babío Arcay & Muiño Vázquez 2005) Foreign owners may also be more
accustomed to comprehensive disclosure of executive directors’ remuneration in their own
countries (Chizema 2008). The fifth hypothesis is:
Hypothesis 5: That for Malaysian companies, there is a positive association between the level
of executive director’s remuneration disclosures and foreign ownership.
An agent’s remuneration is part of the contracting process that seeks to limit agency costs. It
provides incentives for the agents to align their interests to that of the principals (Lambert
1983). The principals will seek to construct an efficient contract that can enforce interest
alignment. A remuneration package typically consists of fixed and incentive driven
components (Fama & Jensen 1983). Simply paying executives fixed salaries will not entice
them to work harder for the shareholders. This is because any additional returns made from
the extra efforts by the executives will not trickle down to them as their salaries are constant
(Holmstrom 1979). The executives may also make bad decisions that will result in a
reduction in company value but they will not be penalised through a reduction in their
salaries (Fama & Jensen 1983).
The need to tie executives’ decisions and performances to the movement in share price led to
introduction of equity based pay into remuneration contracts. Paying executives in a form of
equity makes them part-owners of the company. This may effectively solve any divergence of
interests between the executives and the shareholders. Now the executives may share a
similar perspective to that of the shareholders that is to maximise company value (Cohen,
Hall & Viceira 2000). By improving the shareholders’ wealth, the executives are also

131
simultaneously maximising their own wealth (Hill & Jones 1992). Equity based pay may
consist of ordinary shares, restricted shares and options.
Executive directors who hold significant ownership interests may not need to protect their
position or remuneration (Jensen, Murphy & Wruck 2004). They can use their influence to
limit the extent of disclosure of their remuneration. Therefore the sixth hypothesis is:
Hypothesis 6: That for Malaysian companies, there is an inverse association between the
level of executive director’s remuneration disclosures and the level of executive directors’
shareholdings.
The agency relationship between companies and creditors may also influence the extent of
the disclosure of executive directors’ remuneration. Creditors may expect that executives to
pay themselves excessively rather than paying debts. This rational expectation may mean that
creditors may limit the extent of financing, charge higher interest or impose restrictive debt
covenants. Given that creditors are price protected, companies have an incentive to disclose
more information to limit the costs of the price protection (Chalmers & Godfrey 2004). The
creditors themselves can demand more information to assess the extent of compliance with
debt covenants (Wallace & Naser 1995). Thus the seventh hypothesis is:
Hypothesis 7: That for Malaysian companies, there is a positive association between the level
of executive director’s remuneration disclosures and leverage.
Independent directors may want to protect their credibility and impartiality and thus push for
greater disclosure of executives’ remuneration in the annual reports (Liu, Jinghui. & Taylor

132
2008). However, Eng and Mak (2003) argued that the presence of independent directors can
actually limit the extent of disclosure when there is a substitution effect between these
variables. Independent directors may ensure that the executive remuneration is reasonable
and based on performance. This may reduce the demand of disclosure of executive directors’
remuneration by stakeholders given that independent directors can provide a direct
monitoring role on executive directors. The eighth hypothesis is:
Hypothesis 8: That for Malaysian companies, there is a positive association between the level
of executive director’s remuneration disclosure and proportion of independent directors on
the board.
Employing prominent external auditors may lend more credibility to companies’ financial
reporting. It can show that companies are limiting the opportunities for expropriation of
private benefits by controlling shareholders. Prominent auditors are expected to ensure that
managers choose appropriate accounting and disclsoure policies that would restrict or reveal
siphoning of company value by controlling shareholders (Guedhami & Pittman 2006). Fan
and Wong (2005) found that Asian companies with greater agency problems appoint a
prominent external auditor (then the Big 5) as part of their monitoring mechanisms. It has
been suggested that bigger audit firms are less sensitive to client demands as that they do not
depend on just a few companies for profit. This is unlike smaller audit firms that may have
stronger bonding relationships with clients (Wallace and Naser, 1995). The bigger audit firms
could demand more comprehensive disclosure in annual reports. In addition, bigger audit
firms may want to protect their reputation or ‘brand name’ by ensuring that their audits are of
the highest standards (DeAngelo, 1981 and Bassett et. al., 2007). However, the case of Enron
has shown that it was not the size or prestige of the audit firm that mattered but the level of

133
independence. The prestige of Arthur Andersen had not reduced bonding relationships
between the external auditors and Enron executives.
Bassett, Koh and Tuccitti (2007) found a positive and significant association between
Australian companies that were audited by the Big Four audit firms and the extent of
mandatory and voluntary disclosure of executive stock options. This finding is similar to that
of Nelson and Percy (2004) who examined mandatory disclosure of executive stock options
in Australia. This finding is also supported if Clarkson et al (2006). Thus, the ninth
hypothesis states that:
Hypothesis 9: That for Malaysian companies, there is a positive association between the level
of executive director’s remuneration disclosures and the quality of external audit.
4.2.4 Legitimacy Theory
Social contract theory predicts that companies will seek to ensure their legitimacy34 by
meeting society’s expectations (Lindblom 1983). Executive directors’ remuneration is a
legitimate issue that society will consider in assessing the existence of a company. Consistent
with Mobus (2005), this study considers that pragmatic and moral legitimacy is relevant in
examining executive directors’ remuneration. Pragmatic legitimacy is often perceived by
constituents that are directly connected to the company, but may also include those who are
connected socially or politically. In this case, constituents that may assess a company through
a pragmatic legitimacy lens can be shareholders and regulators. Moral legitimacy involves
assessing the entity against the expectations of a social contract (Mobus 2005). For example,
34 Lindblom (1983, p. 2) defined legitimacy as “a condition or status when an entity’s value system is congruent with the value of the larger social system of which entity is a part. When a disparity, actual or potential, exists between the two value systems, there is a threat to entity’s legitimacy.”

134
Ramanathan (1976) argued that they are two objectives of a company. Firstly, it is to deliver
socially acceptable and useful goods and services. Secondly, it is to ensure equal and fair
distribution of economic, social or political benefits to constituents. Excessive remuneration
relative to an average personal salary appears to be contrary to the second objective of equal
and fair economic distribution. This can constitute a breach of the social contract between the
entity and the prevalent society and consequently may threaten the entity’s survival.
Following Suchman (1995), society can evaluate moral legitimacy from a procedural
perspective . The company will need to disclose that they have “sound practice” behind its
executive remuneration structure to maintain its legitimacy.
The threat to their legitimacy may greater in larger companies since they are more visible and
may depend more on social and political supports for their going concerns (Dowling &
Pfeffer 1975; Hagerman & Zmijewski 1979). This is also consistent with the political cost
hypothesis that states that these companies will attract more public or political scrutiny than
others (Watts, RL & Zimmerman 1978). Larger companies also have substantial resources at
their disposal to protect their legitimacy. Fry and Hock (1976) found that larger companies
and companies in highly sensitive industries significantly report more on their socially
acceptable practices. Similar findings are found by Bowman and Haire (1975), Preston
(1978), Raffournier (1995) and Brammer and Pavelin (2008).
Most studies of executive remuneration have found that executives in larger companies are
paid more compared to their counterparts in smaller companies (Core & Guay 2002; Gomez-
Mejia, Tosi & Hinkin 1987; Hall & Liebman 1998; Jensen & Murphy 1990; Lewellen et al.
1992; Murphy 1985; Smith Jr & Watts 1992). They attributed this to the fact that larger
companies are able to attract and employ highly skilled executives with higher pay. Given

135
that executive remuneration is a sensitive issue, larger companies can use disclosure to
manage the perceptions of society that their remuneration schemes are justified and to limit
any government interventions (Liu, Jinghui. & Taylor 2008)35. Companies might also want
to avoid bad publicity if stakeholders discover for themselves that the executives have been
paid seemingly excessive remuneration. Therefore:
Hypothesis 10: That for Malaysian companies, there is a positive association between the
level of executive director’s remuneration disclosures and company size.
4.2.5 Signaling theory and proprietary costs
Under signaling theory, executive directors have an incentive to address information
asymmetry by voluntarily releasing information to the market. Lang and Lundholm (1993)
and Verrecchia (1983) showed that companies were better off by releasing both bad and good
news to the market to avoid being penalised through over discounting or undervaluation of
shares by misinformed investors. Companies tend to disclose good news more
comprehensively and quicker than bad news (Wallace & Naser 1995). Hossain et al. (2005)
argued that profitability is a measure of managerial performance. Executives of better
performing companies have higher incentives to convey more information to indicate their
superior performance. Executive directors have more incentive to disclose information on
improvements in the association between their pay and performance than a decrease. This
may signal to the market that the executives are working hard for shareholders and deserve
future increases in remuneration. Therefore:
Hypothesis 11: That for Malaysian companies, there is a positive association between the
level of executive director’s remuneration disclosures and company profitability.
35 For example, Patten (1992) found that in the aftermath of the Exxon Valdez oil spill there was significant disclosure of social responsibility by petroleum companies to manage the negative publicity that the spill generated. Similar response was found after the OK Tedi River pollution with significant increase in environmental disclosure of mining companies (Hutchings & Taylor 2000).

136
Dye (1985) argued that competition put constraints on the disclosure of specific information.
Companies with high growth opportunities have higher proprietary costs given that disclosure
of information may reduce the present value of the returns from the growth opportunities
(Bamber & Cheon 1998). These companies may have employed executives who are valuable
in creating and exploiting the opportunities. Disclosure of information on the executives’
remuneration may attract rival bids from competitors who seek the managerial talents that
can bring similar growth to their companies. The loss of executives to rivals may mean that
there would be reduction in the future growth return. High growth companies may be less
inclined to disclose extensive information on their executives’ remuneration to avoid these
potential losses.
Although prior Malaysian studies (Cahan & Hossain 1996; Mohd Ghazali & Weetman 2006)
have failed to find significant associations between proprietary costs and the extent of
disclosure, it is still worthwhile to re-examine the association in light of the corporate
governance reforms in Malaysia. The study by Mohd Ghazali and Weetman (2006) attempted
to review the association under the new reforms with the selection of 2001 as their sample
year. The year 2001 was the first year that the MCCG was introduced. The reforms may not
have been fully implemented by companies or their effects yet to take place. Shan (2009)
found a weak association between disclosures of related party transaction in China listed
companies and proprietary costs. The Chinese market is similar to the Malaysian market
where family and state controlled companies are prevalent. He argued that the weak
association is a positive signal that reforms on China’s disclosure framework are slowly

137
working to mitigate the traditional forces and making room for market forces. Similar results
may be observed in the Malaysian market.
However, there is potential trade off in proprietary costs of the disclosure and mitigating
agency costs. For example, Newman and Sansing (1993) show that companies have to
balance between maximizing shareholders’ wealth and the threat of new entrants with
disclosure of information. Their model shows that companies may disclose imprecise or
‘noisy’ and not necessarily truthful messages to discourage new competitors from entering
the market, often at the expense of shareholders who would prefer full disclosure of
information. Nonetheless, Harris (1998) argued that non-disclosure of proprietary
information may mean protection of shareholders’ value given that competitors cannot
exploit future earnings potential.
Executives with undiversified capital are posited to have higher degree of risk aversion
compared than shareholders. High growth companies are more likely to pay higher
remuneration especially in the form of options (Bryan, Hwang & Lilien 2000; Gaver & Gaver
1993; Ho, S.S.M., Lam & Sami 2004; Ryan 2001; Smith Jr & Watts 1992). Equity based
remuneration may induce executives to undertake more risk, extend their investment horizon
and thus maximize shareholders’ return.
There is more information asymmetry in high growth companies. Executives have greater
discretion in the strategies that can be used to exploit growth opportunities (Bryan, Hwang &
Lilien 2000). The shareholders may allow more discretion so that an above normal return
138
may be achieved (Hossain, Ahmed & Godfrey 2005). However, this additional discretionary
power may create an information gap between the executives and the shareholders. In setting
company disclosure policies managers may view the incentive of reducing information
asymmetry as outweighing the potential proprietary costs.
When there is higher information asymmetry, principals will have to put more monitoring in
place to guard their interests. In a price protected environment, executives will have to bear
the costs of monitoring by their principals. Executives have the incentive to voluntarily
disclose more information to protect their remuneration (Nelson, J & Percy 2008). In
addition, shareholders and other stakeholders may demand additional information on
remuneration to review the performance of executives in exploiting the growth opportunities.
Executives may also want to disclose remuneration information to ensure they will be
rewarded appropriately from undertaking additional risks.
Hypothesis 12: That for Malaysian companies, there is a positive association between the
level of executive director’s remuneration disclosures and company growth.
4.3 Summary of Hypotheses Table 5 below provides a summary of the study hypotheses, the expected signs of the
associations and the supporting literature. The next chapter will provide a discussion on the
research empirical framework and methodology including the definition and measurement of
variables and models.

139
Table 5 Summary of hypotheses and supporting literature
Statement of hypothesis Exp. sign
Supportive Literature
H1 That there was an improvement in the level of disclosure of executive directors’ remuneration by Malaysian companies after the introduction of the Malaysian Code on Corporate Governance and changes in accounting standards.
+ Bassett, Koh & Tutticci 2007; Chizema 2008; Clarkson, Van Bueren & Walker 2006; Coulton, James & Taylor 2001; Finch 2006; Jinghui & Dennis 2008
H2 That for Malaysian companies, there is an inverse association between the level of executive director’s remuneration disclosures and the level of family ownership.
- Shan 2009; Chizema 2008; Mohd Ghazali & Weetman 2006; Chau & Gray 2002; Chen & Jaggi 2000
H3 That for Malaysian companies, there is an inverse association between the level of executive director’s remuneration disclosures and the level of ownership concentration
- Shan 2009; Bushee & Noe 2000; Ramaswamy et al 2000; Li 1994; Bin et al. 1999
H4 That for Malaysian companies, there is a positive association between the level of executive director’s remuneration disclosures and the level of government shareholdings.
+ Shan 2009; Chizema 2008; Huafang & Jianguo 2007; Lou et al. 2006; Mohd Ghazali & Weetman 2006; Makhija & Patton 2004
H5 That for Malaysian companies, there is a positive association between the level of executive director’s remuneration disclosures and foreign ownership.
+ Shan 2009; Chizema 2008; Barako et al. 2006; Haniffa & Cooke 2002
H6 That for Malaysian companies, there is an association between the level of executive director’s remuneration disclosures and the level of executive directors’ shareholdings
? Shan 2009; Huafang & Jianguo 2007; Lou et al. 2006;Leung & Horwitz 2004; Eng & Mak 2003
H7 That for Malaysian companies, there is a positive association between the level of executive director’s remuneration disclosures and leverage.
+ Mohd Ghazali & Weetman 2006; Clarkson et al. 2006; Nelson & Majella 2005; Conyon et al. 2002;
H8 That for Malaysian companies, there is a positive association between the level of executive director’s remuneration disclosures and proportion of independent directors on the board.
+ Liu & Taylor 2008; Bassett et al 2007; Clarkson et al. 2006; Babio Arcay & Muino Vazquez 2005; Nelson & Majella 2005; Gul & Leong 2004; Conyon et al. 2002; Chen & Jaggi 2000
H9 That for Malaysian companies, there is a positive association between the level of executive director’s remuneration disclosures and of external audit
+ Liu & Taylor 2008; Bassett et al 2007; Barako et al. 2006; Clarkson et al. 2006; Nelson & Majella 2005; Chen & Jaggi 2000
H10 That for Malaysian companies, there is a positive association between the level of executive director’s remuneration disclosures and company size.
+ Chizema 2008; Liu & Taylor 2008; Bassett et al 2007; Clarkson et al. 2006Nelson & Majella 2005; Conyon et al. 2002;
H11 That for Malaysian companies, there is a positive association between the level of executive director’s remuneration disclosures and company profitability.
+ Chizema 2008; Clarkson et al. 2006; Wallace & Nasser 1995;Owusu-Ansah 1998; Miller 2002; Gelb and Zarowin 2002; Hossain et al. 2005; Leung and Horwitz 2004
H12 That for Malaysian companies, there is a positive association between the level of executive director’s remuneration disclosures and company growth.
+ Shan 2009; Clarkson et al. 2006; Bryan et al. 2000; Cahan & Hossain 1996

140
Chapter 5 Research Methodology and Variables Measurement
5.0 Introduction The preceding chapter developed several hypotheses that will be tested in this study. It also
provided an empirical framework that will contribute to the development of the research
methodology and variables measurement. This chapter provides a discussion of the research
methodology and measurement of variables employed in this study. The first section describes
the sampling process, followed by the data collection and then proceeds to a discussion of the
content analysis technique. Section 5.5 summarizes the research empirical scheme that
contributes to the construction of the research models in the following section. The final section
discusses the definition and measurement of the dependent variables, independent variables and
control variables.
5.1 Sampling The study adopts a panel dataset that consists of observations of the same set of sample
companies over the sample period. A panel data allows for analysis of both the cross-sectional
and the period effects of the hypotheses. The companies were selected from the Main and
Second Boards of the Bursa Malaysia stock exchange. The two Boards were merged into a single
market called the Main market on the 3rd August 2009. The companies were narrowed from the
list of companies that were publicly listed at the start of the fiscal year 2000 and that continued to
exist until the end of the fiscal year 2008. This would allow for observations and availability of
data for the same set of sample companies over the study period. The final sample consisted of
200 selected Malaysian companies listed in the Bursa Malaysia stock exchange..

141
The 200 companies consisted were all the companies listed in the Bursa Malaysia that satisfied
the selection criteria. No other company was listed continuously or had annual reports over the
sample period of 2000 to 200836. This precluded the application of random sampling to the data.
The sample of 200 companies should be sufficiently large to test the study hypotheses. It
satisfied the rule of thumb of a good sample size in a multiple regression as proposed by Green
(1991) that N ≥ 50 + 8m, where m is the number of the explanatory variables. In this case, as m =
13, N should be equal to or more than 154.
The sample period is from 2000 to 2008. This period covers the changes in the regulatory
framework for directors’ remuneration disclosure. The year 2000 is a barometer for the effects of
the regulatory reforms on the extent of disclosure as there was no regulation prior to and during
that year. The MCCG and KLSE listing rules on disclosure of remuneration by bands first
applied in 2001. The FRS 2 ‘Share based payments’ and FRS 124 ‘Related party transactions’
were introduced in 2005 and 2006 respectively. The nine year period allows for a learning period
so that companies can adapt to the reforms. After allowing for changes in fiscal years, a total of
1788 annual reports were collected for the 200 sample companies over the study period.
36 Companies that were not selected may have been listed later than 2000, delisted during the sample period, merged or taken over by other companies or did not provide annual reports.

142
Table 6 Breakdown of companies for the pooled sample from 2000 to 2008 by sectors
GICS37 Code Number of company-years Percentage Consumer discretionary 248 13.87 Consumer staples 378 21.14 Energy 9 0.50 Finance 399 22.32 Healthcare 27 1.51 Industrials 412 23.04 Information and technology 99 5.54 Materials 162 9.06 Telecommunications 9 0.50 Utilities 45 2.52 1788 100.00
Table 6 provides a breakdown of the company – years according to their industry classifications
over the sample period. The study did not exclude any sector from the sample as it is focused on
executive remuneration disclosure. There should be no significant noise from additional or
different regulatory requirements for each sector. However, it is hypothesised that the level of
disclosure of executive remuneration is different across different sectors. Due to changes in
fiscal years, there was a few missing annual reports that led to an unbalanced panel data. A
balanced panel data would consist of 1800 company-years (200 companies x 9 years). Table 7
provides the distribution of the company years according to years. A list of the sample
companies is included in Appendix 1.
Table 7 Distribution of company – years from 2000 to 2008 (N = 1788)
Year 2000 2001 2002 2003 2004 2005 2006 2007 2008 Total
Annual reports
200 200 200 199 197 198 196 198 200 1788
37 The GICS stands for Global Industry Classification Standard developed by the MSCI and Standard & Poor’s rating agencies. It represents ten main sectors.

143
5.2 Data collection The study employs the content analysis technique in collecting the data for this study.
Krippendorf (1980, page 21) defined content analysis as “method of codifying the text (or
content) of a piece of writing into various groups or categories depending on selected criteria.”
Mathews (1997, page 504) posited that “continuing with the tradition of empirical research aim
at documenting and analysing what is disclosed in the areas of social and environmental
accounting...is valuable as a record of the current state of organizational disclosure and,
therefore of the distance that remains to be travelled along the path of full accountability by
economic actors.”
The application of content analysis is especially important in obtaining the disclosure score. The
study relies on manually scoring the disclosure of executive directors’ remuneration in the
annual reports based on a disclosure index. The disclosure index consists of items that pertained
to the disclosure of executive directors’ remuneration drawn from the regulatory framework and
prior studies. This scoring system is similar to Schadewitz and Blevins (1998), Inchausti (1997),
Clarkson et al. (2006) and Branco and Rodrigues (2006).
The study did not rely on a proxy for the disclosure score. Lang and Lundholm (1993), Gelb and
Zarowin (2002), Gelb (2000) and Khurana, Pereira and Martin (2006) used analysts’ ratings as a
proxy for disclosure score rather than directly scoring the disclosure. The analysts’ ratings
measure the informativeness of companies’ disclosure and companies are ranked accordingly.
They argued that higher analyst ratings should translate to a higher disclosure score. A major
limitation of this proxy is that the analysts’ ratings may be biased or not representative of
144
disclosure quality. Mercer (2005) pointed out this limitation by arguing that the timeframe
between the disclosure of information and the time that analysts rated a company might
introduce bias. The analysts may have been influenced by other information or prior ratings.
The primary source of data was companies’ annual reports. Annual reports can be argued to be
the main form of communication between companies and stakeholders (Branco & Rodrigues
2006). The reforms that were undertaken by Malaysian regulators mainly dealt with the
disclosure of information in the annual reports. Hence, it is appropriate that this study focused on
the disclosure of executive directors’ remuneration in companies’ annual reports.
Malaysian companies are required to lodge annual reports to the Bursa Malaysia. The annual
reports are then published in the Bursa Malaysia website. When annual reports were not
available on the Bursa Malaysia’s website, they were sourced from companies’ individual
websites. The scoring of the disclosure index was done by reading the annual report in its
entirety to obtain information on executive director’s remuneration. Remuneration information is
usually found in the:
Corporate governance statement;
Remuneration report;
Financial statements; and
Notes to annual report.
Other information collected from the annual reports is:

145
Corporate governance information (board composition, name of directors, family
relationships, name of external auditors);
Ownership structure (executive director direct and indirect shareholdings, family direct and
indirect shareholdings, substantial shareholdings, government shareholdings and foreign
shareholdings); and
Financial information (total assets, total liabilities, total debt, total shareholders’ equity, net
profit).
Market data was obtained from Osiris, Mint Global and Thomson One Banker. These electronic
databases were also searched to find information that was missing from the annual reports. Osiris
and Mint Global are electronic databases compiled by Bureau van Dijk Electronic Publishing.
Thomson One Banker is an electronic database compiled by Thomson Publications. The market
data obtained was:
Industry classifications;
Financial ratios (Profitability, leverage and growth ratios); and
Market values of total equity and total assets.
5.3 Empirical scheme Deegan (2002) argued that managerial actions can be explained by building a conceptual
framework that consisted of several theories. He did not agree with purists who believed that
research should only adopt one theoretical lens. There are great benefits from using multiple
theories in explaining managerial actions. For example, Eisenhardt (1989) recommended that
researchers used agency theory along with other complementary theories. She contended that
although agency theory is valid, it offers an incomplete view of the world and organisations.

146
Using it together with complementary theories may capture and explain more of the problem
studied. The theories may share similar insights yet offer additional understandings of the
motivations behind management disclosure of executive directors’ remuneration. Lemon and
Cahan (1997, p 79) wrote that, “one reason for the persistence of multiple views of why firms
make social disclosure is that researchers have not been very successful in developing tests that
allow them to assess the validity of different theories.”Chizema (2008) concurred by stating that
a study of disclosure should not just take into account the economic concerns but also the social
dynamics of compliance with a recommendation or code on disclosure.
Figure 9 illustrates the research empirical framework for studying the disclosure of executive
directors’ remuneration. The figure includes the theories and the variables that act as their
proxies. Prior disclosure studies that have used similar framework are Eisenhardt and Bourgeois
(1988), Conlon and Parks (1990), Gelb (2000), Depoers (2000), Leung and Horwitz (2004), Birt
(2006), Clarkson et al. (2006), Mohd Ghazali and Weetman (2006), Chizema (2008) and Shan
(2009).

147
Figure 9 Research empirical scheme for disclosure of executive directors' remuneration
Agency theory Family ownership Substantial ownership
Government ownership Foreign ownership
Executive director ownership Leverage Proportion of independent directors Audit quality
Legitimacy theory Company size Disclosure of executive
directors’ remuneration Profitability Signalling theory Profitability Proprietary costs Growth
Table 8 provides a summary of the prior disclosure studies that applied a similar research
empirical framework in testing their hypotheses.

148
Table 8 Summary of prior studies with similar empirical research framework
Author(s) Sample and Data
Disclosure variable
Theoretical variable(s) Methodology Main findings
Shan (2009)
Sample consisted of 120 Chinese Shanghai SSE180 and Shenzhen SSE100 listed companies for the sample period of 2001 to 2005
Unweighted disclosure index- counting of words
9. Proportion of independent directors (+)
10. Proportion of professional supervisors (+)
11. Auditor reputation: 0=non Big Four audit firm; 1= Big Four audit firm (+)
12. CEO duality: 1= dual role, 0 = otherwise (-)
13. Firm size: natural logarithm of total asset (+)
14. Media attention: frequency of name appearance in print media (+)
15. Growth: market to book value of total asset ratio (-)
16. Ownership concentration: proportion of shares held by top ten shareholders (-)
17. Foreign ownership: proportion of shares held by foreigners from those in the top ten shareholders list (+)
18. State ownership: proportion of shares held by state from those
Panel GLS fixed effect regression
The study showed that ownership concentration, proportion of professional supervisors and CEO duality to significantly and negatively influence the level of related part disclosure. Foreign shareholding, proportion of independent directors, firm size and media attention significantly and positively influenced the level of related party disclosure.

149
in the top ten shareholders list (+)
Huafang and Jianguo (2007)
Sample year of 2002 consisting of 559 Chinese listed companies
Unweighted voluntary disclosure score: 30 items
Dichotomous measure: 0 and 1
4. Block ownership: proportion of ordinary shares held by substantial owners (>5%) (+)
5. Managerial ownership: proportion of ordinary shares held by top executives (+)
6. State ownership: proportion of shares owned by government (-)
7. Legal person ownership: proportion of shares held by the legal person (+)
8. Foreign listing/share ownership: 1= issuance of H-share or B-share 0 = if none (+)
9. Proportion of independent directors (+)
10. CEO duality: 1= dual role, 0 = otherwise (-)
11. Firm size: total asset at the end of the year (+)
12. Leverage: total liabilities/total assets (+)
13. Growth opportunities: total intangible asset/total asset (+)
14. Auditor reputation: 0=non Big
OLS regression The study found that block ownership, foreign ownership, proportion of independent directors and size of company to have significant and positively influence on the level of voluntary disclosure by Chinese companies. CEO duality and growth opportunities significantly and negatively influenced the level of disclosure.

150
Four audit firm; 1= Big Four audit firm (+)
Clarkson, Van Bueren & Walker (2006)
Sample of 124 Australian listed companies from 1998 to 2004
Unweighted disclosure index based on AASB1046 (10 items)
Dichotomous score based from the scale of 0 to 3.
10. Total asset: the book value of assets (+)
11. Profitability: return on equity (+) 12. Growth: the market to book ratio
of equity (+) 13. Leverage: total debt to equity (-) 14. Governance: corporate
governance factor for fiscal year (+)
15. Foreign listing: 1 = foreign listed; 0 = otherwise (+)
16. CEO turnover: 1 = new CEO; 0 = otherwise (+)
17. Takeover or merger: 1 = subject to takeover or merger; 0 = otherwise (+)
18. Audit quality: 1 = big four audit; 0 = otherwise (+)
19. Auditor turnover: 1 = new auditor; 0 = otherwise (+)
3. Time period model: pooled generalize least squares
4. Yearly OLS regression
They showed that size of companies, corporate governance, quality of audit and cross listing status positively and significantly influenced the level of CEO remuneration disclosure. However, their level of significance changes over the sample period. The level of significance was high at the earlier years of the study when there was more scrutiny of remuneration. However, after the introduction of the CLERP 9 and AASB1024, their roles were replaced by the regulations.
Barako, Hancock and Izan (2006)
Sample consisted of 43 companies listed in Nairobi
Weighted and unweighted disclosure index: 47 items
7. Shareholders concentration: proportion of shares held by top twenty shareholders (+)
8. Foreign ownership: proportion of shares owned by foreign shareholders (+)
Panel regression (pooled cross section and time series data)
The study found significant and negative associations between proportion of non-executive directors and shareholder concentration and the level of voluntary disclosure in Kenyan listed companies. The

151
Stock Exchange for the sample period of1992 to 2001
Dichotomous measure: 0 and 1
9. Institutional ownership: proportion of shares owned by institutional investors to total outstanding shares (+)
10. Proportion of non-executive directors (+)
11. Dual board structure: 1 = yes, 0 = no (+)
12. Board size: number of directors on the board (+)
13. Audit committee: 1= exist, 0 = none (+)
14. Firm size: total assets (+) 15. Leverage: the ratio of total debt
to total assets 16. Auditor reputation: 0=non Big
Four audit firm; 1= Big Four audit firm (+)
17. Profitability: net profit to total shareholders’ equity
18. Liquidity: current asset to current liabilities
19. Industry classifications
presence of audit committee, foreign ownership, institutional ownership, firm size and leverage to positively and significantly influence the level of disclosure.
Mohd Ghazali and Weetman (2006)
Sample consisted of 87 Malaysian companies
Unweighted disclosure index: 53 items
Dichotomous
5. Ownership concentration: proportion of shares owned by top ten shareholders to total number of shares (-)
6. Number of shareholders (+)
Stepwise regression
The study showed significant and negative associations between the proportion of family members, percentage of director ownership and the level of voluntary disclosure.

152
for the sample year of 2001
measure: 0 and 1
7. Proportion of direct and indirect shares held by executive and non-independent directors over total shares(-)
8. Proportion of shares held by government (-)
9. Proportion of family member on the board of directors (-)
10. Proportion of independent directors on the board of directors (+)
11. Chairman is independent and non-executive: 1 = yes, 0 = no (+)
12. Competitiveness: ratio of total sales over industry sales (market share) (-)
13. Competitiveness: ratio of total sales made by the two largest companies in the industry to the total sales (concentration) (-)
14. Firm size: number of employees (+)
15. Profitability: ratio of profit before tax to shareholders’ equity (+)
16. Gearing: ratio of long term debt to shareholders’ equity (+)
Profitability and size were shown to significantly and positively influence the level of disclosure.
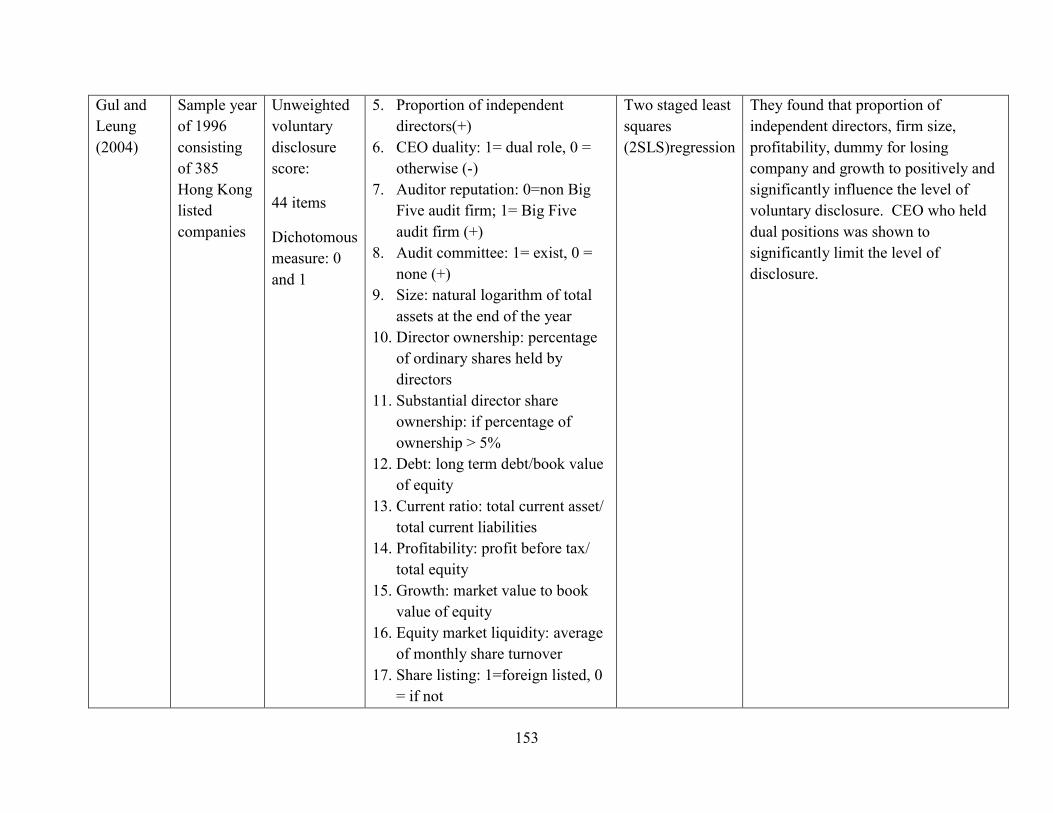
153
Gul and Leung (2004)
Sample year of 1996 consisting of 385 Hong Kong listed companies
Unweighted voluntary disclosure score:
44 items
Dichotomous measure: 0 and 1
5. Proportion of independent directors(+)
6. CEO duality: 1= dual role, 0 = otherwise (-)
7. Auditor reputation: 0=non Big Five audit firm; 1= Big Five audit firm (+)
8. Audit committee: 1= exist, 0 = none (+)
9. Size: natural logarithm of total assets at the end of the year
10. Director ownership: percentage of ordinary shares held by directors
11. Substantial director share ownership: if percentage of ownership > 5%
12. Debt: long term debt/book value of equity
13. Current ratio: total current asset/ total current liabilities
14. Profitability: profit before tax/ total equity
15. Growth: market value to book value of equity
16. Equity market liquidity: average of monthly share turnover
17. Share listing: 1=foreign listed, 0 = if not
Two staged least squares (2SLS)regression
They found that proportion of independent directors, firm size, profitability, dummy for losing company and growth to positively and significantly influence the level of voluntary disclosure. CEO who held dual positions was shown to significantly limit the level of disclosure.

154
18. Consolidation: 1= consolidate, 0 = otherwise
19. Share issue: 1 = new issue, 0 = otherwise
20. Loss: 1 = negative income, 0 = otherwise
Eng and Mak (2003)
Sample year of 1995 consisting of 158 Singaporean companies
Unweighted disclosure index
Scale of 1 to 5
2. Proportion of independent directors (+)
3. Auditor’s size: 0=non Big Six audit firm; 1= Big Six audit firm (+)
4. Managerial ownership: percentage of shares held by the CEO and executive directors (-)
5. Block holder ownership: percentage of shares held by substantial owners (>5%) (-)
6. Government ownership: if government ownership > 20% = 1; otherwise = 0 (+)
7. Growth: market to book value of equity (+) and price-earnings ratio (+)
8. Firm size: market value of shares 9. Leverage: total liabilities by total
assets (-) 10. Industry: regulated industry = 1,
otherwise = 0 (+)
OLS regression They found that proportion of independent directors, debt and managerial ownership to significantly and negatively influence the level of voluntary disclosure. Government ownership and firm size was shown to significantly and positively influence the level of disclosure. Other variables were found not to be significant.

155
11. Analyst’s following: number of analyst following the companies (+)
12. Profitability: ROE, ROA (+)
Depoers (2000)
Sample year of 1995 consisting of 102 industrial and commercial French companies
Unweighted voluntary disclosure score:
65 items
Dichotomous measure: 0 and 1
1. Firm size: natural logarithm of sales (+)
2. Foreign activity: exports on sales ratio (+)
3. Ownership structure: percentage of shares held by the three largest shareholders (-)
4. Leverage: debt on total assets ratio (+)
5. Auditor size: 0=non Big Six audit firm; 1= Big Six audit firm (+)
6. Labour pressure: labour charges/turnover (-)
7. Barriers to entry: gross fixed asset (+)
Stepwise multiple regression
The study only found size and foreign activity to significantly influence the level of disclosure of French companies. Depoers argued that the external factors such as competitors played more important roles in shaping French companies disclosure policies rather than traditional agency variables.

156
5.4 Model development
A basic panel data regression equation can be represented in the following form:
Y it = α + β1Xit +β2Xit + ….. + δc Controlit + u it ; i = 1,2,3……, N; t = 1,2,3….T
Where,
Y is the dependent variable;
α is the constant term;
β is the value of the coefficient for the explanatory variable;
X is the explanatory variable;
δc Controlit is the control variable;
u is the normal distribution error term;
i is a sample company; and
t is a year.
From the research empirical scheme, the following base model was formed. The base model
integrates all the theoretical perspectives explored in the literature review and hypotheses
development chapters. It consists of the factors that represent agency theory, legitimacy theory,
signaling theory and proprietary costs. The base model also includes control variables. The base
model is shown below:
Disclosure Index Score = β0 + ΣβO Agency theoryit + Σ βP Legitimacy theoryit + Σ βQ Signalling
theoryit + Σ βR Proprietary costsit + Σ δc Controlit + εit
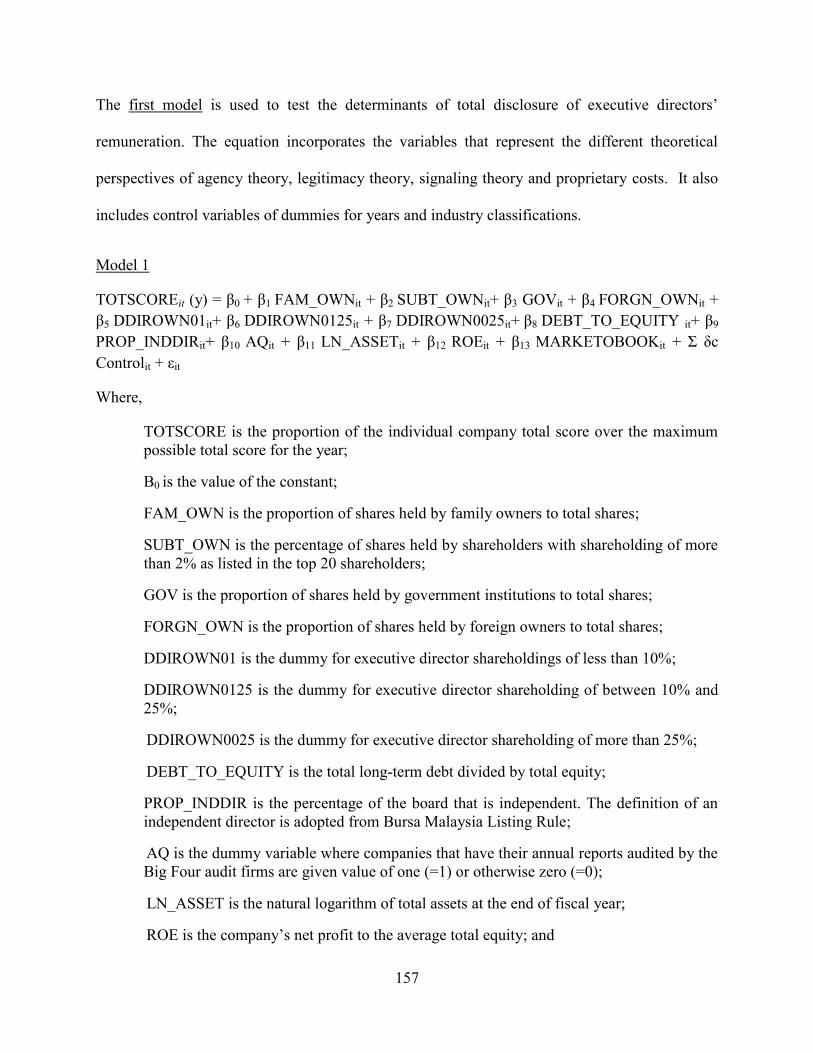
157
The first model is used to test the determinants of total disclosure of executive directors’
remuneration. The equation incorporates the variables that represent the different theoretical
perspectives of agency theory, legitimacy theory, signaling theory and proprietary costs. It also
includes control variables of dummies for years and industry classifications.
Model 1
TOTSCOREit (y) = β0 + β1 FAM_OWNit + β2 SUBT_OWNit+ β3 GOVit + β4 FORGN_OWNit + β5 DDIROWN01it+ β6 DDIROWN0125it + β7 DDIROWN0025it+ β8 DEBT_TO_EQUITY it+ β9
PROP_INDDIRit+ β10 AQit + β11 LN_ASSETit + β12 ROEit + β13 MARKETOBOOKit + Σ δc Controlit + εit
Where,
TOTSCORE is the proportion of the individual company total score over the maximum possible total score for the year;
Β0 is the value of the constant;
FAM_OWN is the proportion of shares held by family owners to total shares;
SUBT_OWN is the percentage of shares held by shareholders with shareholding of more than 2% as listed in the top 20 shareholders;
GOV is the proportion of shares held by government institutions to total shares;
FORGN_OWN is the proportion of shares held by foreign owners to total shares;
DDIROWN01 is the dummy for executive director shareholdings of less than 10%;
DDIROWN0125 is the dummy for executive director shareholding of between 10% and 25%;
DDIROWN0025 is the dummy for executive director shareholding of more than 25%;
DEBT_TO_EQUITY is the total long-term debt divided by total equity;
PROP_INDDIR is the percentage of the board that is independent. The definition of an independent director is adopted from Bursa Malaysia Listing Rule;
AQ is the dummy variable where companies that have their annual reports audited by the Big Four audit firms are given value of one (=1) or otherwise zero (=0);
LN_ASSET is the natural logarithm of total assets at the end of fiscal year;
ROE is the company’s net profit to the average total equity; and
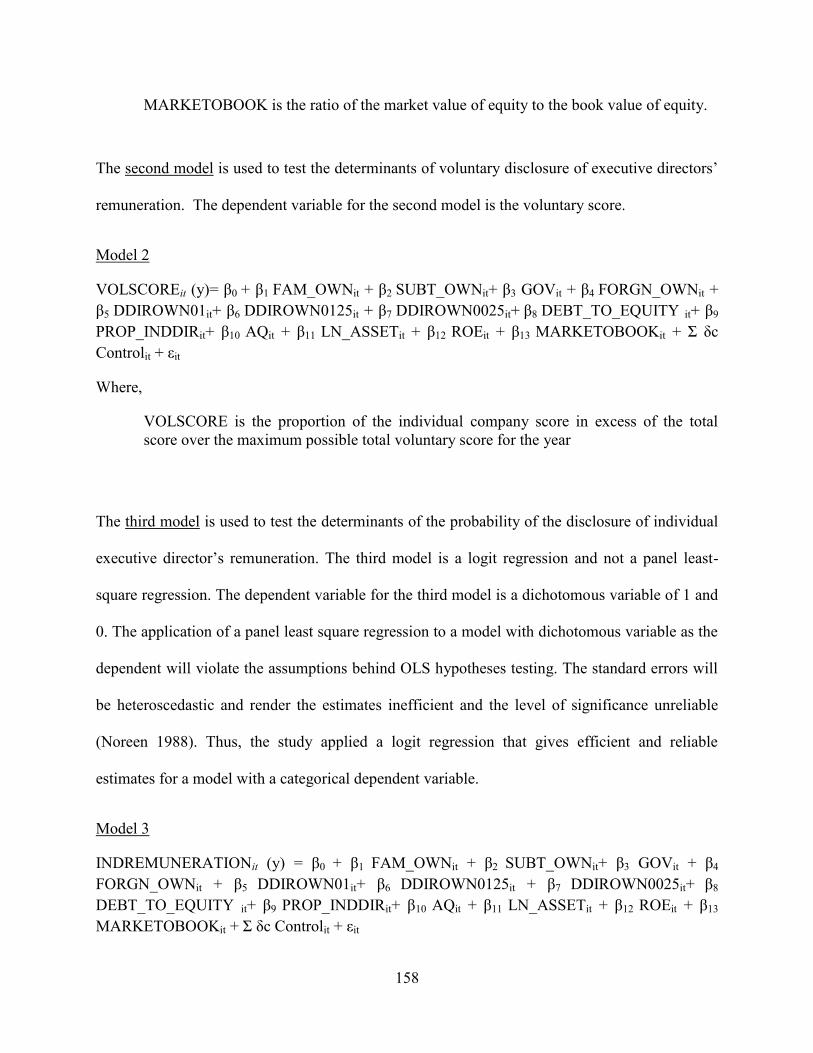
158
MARKETOBOOK is the ratio of the market value of equity to the book value of equity.
The second model is used to test the determinants of voluntary disclosure of executive directors’
remuneration. The dependent variable for the second model is the voluntary score.
Model 2
VOLSCOREit (y)= β0 + β1 FAM_OWNit + β2 SUBT_OWNit+ β3 GOVit + β4 FORGN_OWNit + β5 DDIROWN01it+ β6 DDIROWN0125it + β7 DDIROWN0025it+ β8 DEBT_TO_EQUITY it+ β9
PROP_INDDIRit+ β10 AQit + β11 LN_ASSETit + β12 ROEit + β13 MARKETOBOOKit + Σ δc Controlit + εit
Where,
VOLSCORE is the proportion of the individual company score in excess of the total score over the maximum possible total voluntary score for the year
The third model is used to test the determinants of the probability of the disclosure of individual
executive director’s remuneration. The third model is a logit regression and not a panel least-
square regression. The dependent variable for the third model is a dichotomous variable of 1 and
0. The application of a panel least square regression to a model with dichotomous variable as the
dependent will violate the assumptions behind OLS hypotheses testing. The standard errors will
be heteroscedastic and render the estimates inefficient and the level of significance unreliable
(Noreen 1988). Thus, the study applied a logit regression that gives efficient and reliable
estimates for a model with a categorical dependent variable.
Model 3
INDREMUNERATIONit (y) = β0 + β1 FAM_OWNit + β2 SUBT_OWNit+ β3 GOVit + β4
FORGN_OWNit + β5 DDIROWN01it+ β6 DDIROWN0125it + β7 DDIROWN0025it+ β8
DEBT_TO_EQUITY it+ β9 PROP_INDDIRit+ β10 AQit + β11 LN_ASSETit + β12 ROEit + β13
MARKETOBOOKit + Σ δc Controlit + εit

159
Where,
INDREMUNERATION is the disclosure of an individual executive director’s remuneration. It is represented by one for disclosure of an individual executive director’s remuneration and zero for non-disclosure of an individual executive director’s remuneration.
5.5 Variable measurement
5.5.1 Dependent variables
The dependent variables that measure the disclosure of executive directors’ remuneration are
represented by:
1. Total score: the proportion of an individual company’s total score of the disclosure of
executive directors’ remuneration over the maximum possible total score of the disclosure of
executive directors’ remuneration for the year. The total score consists of the voluntary and
mandatory disclosure of executive directors’ remuneration. The scoring is based on a scoring
index derived from regulations and prior studies.
TOT SCORE it = TOTAL SCORE it
TOTAL SCORE t
2. Voluntary score: the proportion of an individual company’s voluntary score of the
disclosure of executive directors’ remuneration over the maximum possible voluntary
score of the disclosure of executive directors’ remuneration for the year. Voluntary score
is measured as the disclosure in excess of mandatory disclosure for a particular year.
VOLSCORE it = VOLUNTARY SCORE it
VOLUNTARY SCORE t

160
3. Disclosure of individual remuneration (INDREMUNERATIONit): the value of one is given to
a company that disclosed of an individual executive director’s remuneration and the value of
zero for otherwise.
5.5.2 The disclosure scoring index
This study focuses on the total disclosure of executive directors’ remuneration inclusive of
mandatory and voluntary disclosure. One might infer that a study that examined disclosure in a
regulated market is futile given that companies are obliged to disclose information and may
choose not to disclose beyond that requirement. However, Dye (1986) contended that the
introduction of mandatory disclosure requirements can improve the extent of voluntary
disclosure. For example, Naser and Nuseibeh (2003) studied the level of compliance of Saudi
Arabian listed companies with mandatory disclosure requirements and the extent of voluntary
disclosure in these companies. They found a positive and significant correlation (r=0.53,
p<0.000) between the level of mandatory and voluntary disclosure for the total sample.
The disclosure scoring index incorporates mandatory items of executive directors’ remuneration
as required by the FRS 2 and the Bursa Malaysia Listing rule. It also contains additional and
voluntary disclosure items derived from Malaysian FRS 124, Australian AASB 124 ‘Related
party disclosure’ and prior studies (Bassett, Koh & Tutticci 2007; Clarkson, P, Van Bueren &
Walker 2006; Laksmana 2008). AASB 124 required more stringent and detailed disclosure than
FRS 124 and thus acts as a template for comprehensive disclosure of executive directors’
remuneration. A total of thirteen items is included in the index (Table 9).

161
Table 9 Summary of disclosure scoring index items and scoring values
Disclosure item Score
Scoring value 0 1 2 3
Disaggregated remuneration 0 1 NA NA Disclosure of short term benefits 0 1 NA NA Disclosure of post-employment benefits 0 1 NA NA Disclosure of other long term benefits 0 1 NA NA Disclosure of termination benefits 0 1 NA NA Disclosure of share based payment 0 1 NA NA Specific section for remuneration 0 1 NA NA Disclosure of individual remuneration 0 1 NA NA Comparative period information 0 1 NA NA Discussion on principles of remuneration 0 1 2 NA Discussion on pay and performance association 0 1 2 NA Options valuation and right details 0 1 2 3 Disclosure by bands 0 1 NA NA Score 0 is for non-compliance or undisclosed information. Score 1 is for compliance or
disclosure of information. The additional score of 2 and 3 applies to items that are scored based
on the extensiveness of the disclosure not on mere compliance. NA – The score is not applicable
for the particular item. Figure 10 provides details of the disclosure items and examples.
Consistent with previous studies (Bassett, Koh & Tutticci 2007; Clarkson, P, Van Bueren &
Walker 2006; Laksmana 2008), this study scores the disclosure items on a range of values
instead of counting the words. Simply counting words may include repetitive sentences or
lengthy but not meaningful sentences, and may exclude details provided by graphic
representations and links to the number of directors in the board. Scoring based on values allows
for the identification of minimum, maximum and excess values to distinguish between the
mandatory and voluntary disclosure of executive directors’ remuneration. The maximum total
score inclusive of mandatory and voluntary items is seventeen for companies that issued
executive options and fourteen for other companies. Both the maximum mandatory and
voluntary scores evolved throughout the study period depending on the regulatory framework
that was introduced progressively over the nine years.

162
Table 10 Annual mandatory, voluntary and total score scoring values over 2000 to 2008
2000 2001 2002 2003 2004 2005 2006 2007 2008
NO WO NO WO NO WO NO WO NO WO NO WO NO WO NO WO NO WO
Max. Man. score
0 0 13 16 13 16 13 16 13 16 1 4 1 4 1 4 1 4
Max. Vol. score
14 17 1 1 1 1 1 1 1 1 13 13 13 13 13 13 13 13
Total score
14 17 14 17 14 17 14 17 14 17 14 17 14 17 14 17 14 17
NO: No options – companies that did not have option based remuneration schemes WO: With options – companies that had option based remuneration schemes
The index is an un-weighted relative disclosure index. Information is therefore assumed to be
assessed equally by all users in making decisions (Chau & Gray 2002). Weight is a measurement
of the pooled opinion of some, but not all users, and is not related to a ‘real’ decision making
process and therefore it may not reflect reality (Cooke 1989; Wallace & Naser 1995). The weight
may not be constant over time (Dhaliwal 1980). The assignment of the weights is subjective
since most users’ preferences are unknown (Chang, Most & Brain 1983; Firth 1979).
Nonetheless, Chow and Wong-Boren (1987) found no significant differences between the results
of their weighted and un-weighted indices. The main underlying principle of the index is whether
most users of annual reports would find the disclosed information sufficiently comprehensive.
Prior studies that have used an un-weighted disclosure index includes (Chang, Most & Brain
1983; Chau & Gray 2002; Chow & Wong-Boren 1987; Clarkson, P, Van Bueren & Walker
2006; Cooke 1989; Liu, J., Taylor & Harris 2006; Meek, Roberts & Gray 1995; Mohd Ghazali &
Weetman 2006; Owusu-Ansah 1998; Shan 2009; Wallace & Naser 1995).

163
The annual reports were read in their entirety before they were scored because remuneration
information can be disclosed in various sections of the annual report. Companies were not
penalised for non-disclosure of items that were not relevant to them. To limit the researcher’s
bias and to ensure consistency, independent and random verification was done by an independent
research assistant.
5.5.3 Independent variables
The study does not analyse changes in the independent variables from one period to another.
There is likely to be little variation in the independent variables especially the structural
variables; ownership variables, board of directors’ compositions and firm size, over the eight
year study period. However, the performance variables; return on equity, can significantly
change from one year to the next. Lang and Lundholm (1993) argued that company disclosure
can be ‘sticky’ in that auditors are reluctant to enforce substantial changes in the general content
of annual reports on a yearly basis. This may incur additional costs. It can be expected that as
companies settle into a new reporting regime, annual reports will stay unchanged until new
regulations come into force.
5.5.3.1 Agency theory variables
The variables that are considered for agency theory are ownership and corporate governance
mechanisms variables.
5.5.3.1.1 Ownership variables
Ownership structure plays a significant role in agent and principals relationships. The level of
ownership concentration and the shareholder composition are the variables that may influence
the level of disclosure of executive directors’ remuneration in Malaysian companies. The level of

164
ownership concentration may introduce power differentials into the relationships that may either
mitigate or compound agency problems. Various studies have looked at the effects of ownership
concentration on the level of disclosure in companies. Two terms have been used to test the
hypothesis of an association between ownership concentration and the level of disclosure. The
terms are ‘ownership diffusion’ (Babio Arcay and Muino Vazquez (2005), Haniffa and Cooke
(2002), Chau and Gray (2002), Depoers (2000) and Raffournier (1995)) and ‘ownership
concentration’ (Shan (2009), Brammer and Pavelin (2008), Barako et al. (2006), Mohd Ghazali
and Weetman (2006) and Makhija and Patton (2004)). These terms may be used interchangeably
as measures of the ownership concentration of various shareholders.
The notion of ownership concentration is more applicable to the Malaysian market because of
the significant concentration of the shareholdings of Malaysian companies among families and
government linked entities (Claessens, Djankov & Lang 2000). Malaysian companies are
required under the Bursa Malaysia Listing Rule to disclose the top 20 shareholdings in the
annual reports. The requirement includes direct and indirect share ownership in the companies.
Ownership concentration (SUBT_OWN) is then measured as:
SUBT_OWN it = Number of shares held by shareholders with shareholding of more than 2% it
Total number of shares outstanding it
Family ownership has been shown to be associated with the level of disclosure (Chen and Jaggi
(2000), Chau and Gray (2002), Mohd Ghazali and Weetman (2006) and Chizema (2008)). The
presence of family shareholders may limit the disclosure of executive directors’ remuneration.
The Bursa Malaysia Listing Rule and the FRS 124 ‘Related Party Transactions’ require

165
companies to disclose family relationships between key management personnel and other
shareholders in the annual reports. They are also required to disclose direct and indirect
shareholdings by key management personnel and their family members. Section 122A of the
Malaysian Companies Act (1965) includes spouse, parent, child, brother, sister and the spouse of
such child, brother or sister as family members.
Family ownership is thus measured as:
FAM_OWN it = Number of shares held by family shareholders it
Total number of shares outstanding it
The Malaysian market is also dominated by government linked companies and state ownership.
Prior studies offered alternative views of whether government shareholdings improve or restrict
the level of the public disclosure of information (Li (1994), Eng and Mak (2003), Chizema
(2008) and Shan (2009)). Government shareholders may either behave like insiders by using
informal channels for information or push for more disclosure in line with the government
corporate reforms initiatives. Government ownership data included shareholdings by
Government Linked Investment Companies (GLICs)38 and state investment companies. The data
for government shareholdings is obtained from the list of the top 20 shareholders for the fiscal
year.
38 The GLICs consisted of Employee Provident Fund (EPF), Khazanah Nasional, Kumpulan Wang Persaraan (KWAP), Lembaga Tabung Angkatan Tentera (LTAT), Lembaga Tabung Haji (LTH), Menteri Kewangan Diperbadankan (MKD) and Perbadanan Nasional Berhad (PNB).

166
Government ownership is measured as:
GOV it = Number of shares held by government shareholders it
Total number of shares outstanding it
Another ownership variable is foreign shareholdings. Foreign shareholders may have been
exposed to more transparency and accountability in disclosure of executive directors’
remuneration. They may also have greater demand for more information to overcome their
language or geographical barriers. The data for foreign shareholdings is obtained from the list of
the top 20 shareholders for the fiscal year.
Foreign ownership is measured as:
FORGN_OWNit = Number of shares held by foreign shareholders it
Total number of shares outstanding it
The final ownership factor that is considered in this study is executive directors’ shareholdings.
Prior studies used an absolute measurement of the percentage of executive director ownership
(Huanfang and Jianguo (2007), Luo et al (2006), Eng and Mak (2003) and Abrahamson and Park
(1994)).
They measured executive director ownership as:
DIR_OWNit = Number of shares held by executive directors it
Total number of shares outstanding it
However, this measurement assumed a linear association between the level of disclosure and
executive directors’ ownership. Leung and Horwitz (2004) argued that there is a convex

167
association between the level of directors’ ownership and agency costs. At a lower level of
director ownership, executive directors may disclose more about director remuneration to prove
that they are working for the interests of the shareholders. However, at a higher level of
ownership, the executive directors may use their influence to limit the level of disclosure and
conceal potential expropriation. An absolute measurement of executive directors’ ownership will
not represent this convex association. Thus, creating dummy variables for executive director
ownership at different percentiles will be more appropriate than using an absolute percentage
variable.
Consistent with Leung and Horwitz (2004), the dummies for executive directors’ remuneration at
three different percentiles are measured as:
Dummy for executive director shareholdings of less than 10%
(DDIROWN01it ) OWN = 0.01<OWN<0.1
Dummy for executive director shareholding of between 10% and 25%
(DDIROWN0125it) OWN-0.01= 0.01<OWN<0.25
0 = OWN<0.01
0.24 = OWN>0.25
Dummy for executive director shareholding of more than 25%
(DDIROWN0025it) OWN-0.25 = OWN>0.25
Finally, another agency variable that is considered in the study is the power exerted by debt
holders or creditors in influencing the level of disclosure in Malaysian companies. The debt
structure of a company may influence their disclosure policy through imposition of debt
covenants on the level of disclosure of information or competition for new and cheaper debt that

168
requires disclosure of information. The hypothesised association between debt structure and the
level of disclosure is usually represented by the leverage ratio (Barako et al. (2006), Clarkson et
al. (2006), Mohd Ghazali and Weetman (2006), Nelson and Majella (2005) Gul and Leung
(2004), Eng and Mak (2003) and Conyon et al. (2002)).
It is measured as:
DEBT_TO_EQUITYit = Total long-term debt it
Total equity it
5.5.3.1.2 Corporate governance mechanisms
Corporate governance mechanisms are primarily to protect the interests of shareholders
especially minority shareholders from exploitation by agents and substantial shareholders. This
study considers only two corporate governance mechanisms. They are the proportion of
independent and non - executive directors on the board of the directors and the level of audit
quality. These two mechanisms are arguably the most significant corporate governance variables
that may influence the level of disclosure of executive directors’ remuneration.
The first corporate governance mechanism that is considered is the percentage of the board that
is independent. Independent directors have incentives to push for more transparency and greater
accountability by key management personnel through greater disclosure of information (Liu and
Taylor (2008), Shan (2008), Barako et al. (2006), Conyon et al. (2002), Coulton et al. (2001) and
Chen and Jaggi (2000)). The definition of an independent director is adopted from Bursa

169
Malaysia Listing Rule. The Listing Rule and the MCCG require companies to have at least one
third of the members of the board of directors to be independent and non-executive. The number
of independent directors on the board and the size of the board are given in the annual reports.
The definition of independent director is obtained from paragraph 1.01 of the Bursa Malaysia
Listing Rule (Appendix 9).
The variable is measured as:
PROP_INDDIRit = Number of independent directors on board it
Total number of directors on the board it
The second corporate governance mechanism included in this study is the quality of the external
audit. The quality of the external audit has been represented in prior studies by the choice of
external auditors (Raffournier (1995), Chen and Jaggi (2000), Makhija and Patton (2004), Leung
and Horwitz (2004), Gul and Leung (2004), Barako et al. (2006) and Shan (2009). External
audits completed by bigger and highly reputable audit firms are associated with higher quality of
audit and subsequently greater disclosure of information. A dummy variable is created to
represent the annual quality of audit, where:
AQit = 1 (Big four external audito during the fiscal year) and 0 (Non big-four external audito
during the fiscal year)

170
5.5.3.2 Legitimacy theory variables
The association between legitimacy and the level of disclosure of executive directors’
remuneration is tested using company size and profitability as proxies for legitimacy. Company
size may be measured by:
Total assets: Chizema (1998); Coulton et al. (2001); Nelson and Majella (2005); Barako et al.
(2006); Clarkson et al. (2006); Huafang and Jianguo (2007) and Shan (2009);
Market capitalization: Conyon et al. (2002); Eng and Mak (2003) and Gelb and Greenstein
(2004);
Total revenues or net revenue: Lim and McKinnon (1993); Patten (1991) and Belkaoui and
Karpik (1989); and
Total number of employees: Mohd Ghazali and Weetman (2006).
Given that market capitalization of the Malaysian market is relatively small compared to other
developed markets; total assets are used in this study as a proxy for company size. Total revenue
or net revenue is not chosen as a proxy because the value may fluctuate or be volatile over the
sample period. The total number of employees may not be an adequate representation of
company size. The size of a company labour force may not be a reliable estimate of size because
a small startup company may have a high labour force as it attempts to enter the market. A big
company may have consolidated its labour force and not have as many employees.
Thus, total assets make a better proxy for size. It is measured as:
LN_ASSET it = ln (Total assets at the end of fiscal year)it
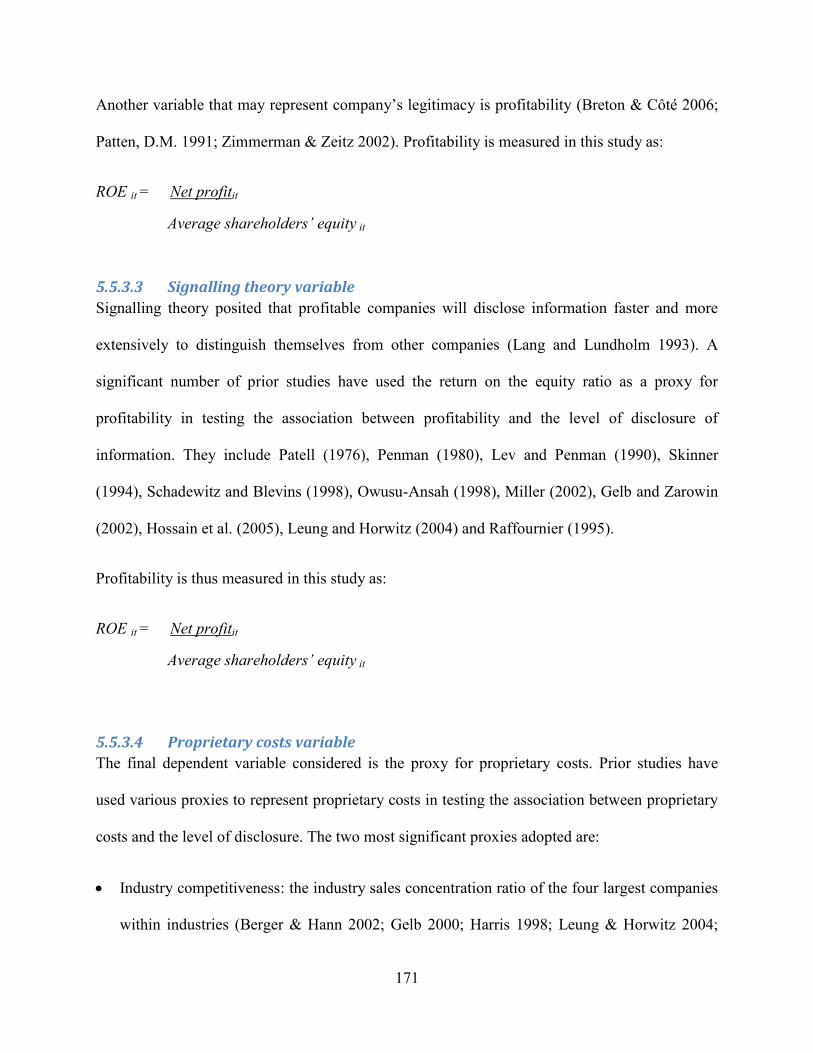
171
Another variable that may represent company’s legitimacy is profitability (Breton & Côté 2006;
Patten, D.M. 1991; Zimmerman & Zeitz 2002). Profitability is measured in this study as:
ROE it = Net profitit
Average shareholders’ equity it
5.5.3.3 Signalling theory variable
Signalling theory posited that profitable companies will disclose information faster and more
extensively to distinguish themselves from other companies (Lang and Lundholm 1993). A
significant number of prior studies have used the return on the equity ratio as a proxy for
profitability in testing the association between profitability and the level of disclosure of
information. They include Patell (1976), Penman (1980), Lev and Penman (1990), Skinner
(1994), Schadewitz and Blevins (1998), Owusu-Ansah (1998), Miller (2002), Gelb and Zarowin
(2002), Hossain et al. (2005), Leung and Horwitz (2004) and Raffournier (1995).
Profitability is thus measured in this study as:
ROE it = Net profitit
Average shareholders’ equity it
5.5.3.4 Proprietary costs variable
The final dependent variable considered is the proxy for proprietary costs. Prior studies have
used various proxies to represent proprietary costs in testing the association between proprietary
costs and the level of disclosure. The two most significant proxies adopted are:
Industry competitiveness: the industry sales concentration ratio of the four largest companies
within industries (Berger & Hann 2002; Gelb 2000; Harris 1998; Leung & Horwitz 2004;

172
Luo, Courtenay & Hossain 2006); company total sales over the total sales of its specific
industry classification (Clarkson, PM, Kao & Richardson 1994; Debreceny & Rahman 2005;
Hagerman & Zmijewski 1979; Mohd Ghazali & Weetman 2006; Press & Weintrop 1990).
Investment growth opportunities: the ratio of market value to the book value of equity
(MKBVE) (Adam & Goyal 2008; Bamber & Cheon 1998; Berger & Hann 2002; Clarkson, P,
Van Bueren & Walker 2006; Debreceny & Rahman 2005; Frankel, Kothari & Weber 2006;
Garcia-Meca & Martinez 2007; Gelb & Zarowin 2002; Gul & Leung 2004; Hossain, Ahmed
& Godfrey 2005; Lang & Lundholm 1993; Ryan 2001; Schadewitz & Blevins 1998).
This study intended to use both measurements as proxies for proprietary costs. However, the data
for industry sales in Malaysia was only available for the period of 2003 to 2008. This will
severely limit the depth of the analysis since the missing years include the years 2000 and 2001
that are important for testing the first hypothesis. Consequently, the study adopts only investment
growth opportunities as a proxy for proprietary costs. Companies with higher growth
opportunities have more proprietary information about the unexploited and future investment
opportunities (Shan 2009). These companies may have more to lose from disclosing too much
information.
Consistent with prior studies, this study represents investment growth opportunities using the
ratio of market value to the book value of equity. It measures the value of a company represented
by the cash flow from assets in place and future growth potential (Adam & Goyal 2008). The
ratio data is obtained from the Thomson OneBanker electronic database. It is measured as:

173
MARKETOBOOK = Total outstanding share it x Shares closing price it
Total book value of outstanding shares it
Table 11 provides the definition and the measurement of the independent variables that are
applied in the research empirical scheme.

174
Table 11 Definition and measurement of independent variables
Variable Measurement Family ownership FAM_OWN Proportion of shares held by family
owners to total shares Ownership concentration SUBT_OWN Percentage of shares held by
shareholders with shareholding of more than 2% as listed in the top 20 shareholders
Government ownership GOV Proportion of shares held by government institutions to total shares
Foreign ownership FORGN_OWN Proportion of shares held by foreign owners to total shares
Executive directors’ share ownership
DDIROWN01 OWN = 0.01<OWN<0.1
Dummy for executive director shareholdings of less than 10%
DDIROWN0125 OWN-0.01= 0.01<OWN<0.25 0 = OWN<0.01 0.24 = OWN>0.25
Dummy for executive director shareholding of between 10% and 25%
DDIROWN0025 OWN-0.25 = OWN>0.25
Dummy for executive director shareholding of more than 25%
Leverage DEBT_TO_EQUITY Total long-term debt divided by total equity
Independent board composition
PROP_INDDIR The percentage of the board that is independent. The definition of an independent director is adopted from Bursa Malaysia Listing Rule
Audit quality AQ Dummy variable where companies that have their annual reports audited by the Big Four audit firms are given value of one (=1) or otherwise zero (=0)
Company size LN_ASSET Natural logarithm of total assets at the end of fiscal year
Profitability ROE The company’s net profit to the average total equity
Growth MARKETOBOOK The ratio of the market value of equity to the book value of equity

175
5.5.4 Control variables
The control variables include dummies for years and dummies for industry classifications. The
dummies for years are to control for any uniqueness or differences in the years that may
significantly influence the level of disclosure of executive directors’ remuneration. The other
control variable is industry classification. The dummies for industry classifications may control
for any industry specific differences.
Table 12 Definition and measurement of control variables
Variable Measurement Year dummy
δ2000 Dummy for 2000 is included as part of the constant to avoid the problem of perfect multicollinearity
δ2001 Year 2001 is given the value of one and otherwise is zero δ2002 Year 2002 is given the value of one and otherwise is zero δ2003 Year 2003 is given the value of one and otherwise is zero δ2004 Year 2004 is given the value of one and otherwise is zero δ2005 Year 2005 is given the value of one and otherwise is zero δ2006 Year 2006 is given the value of one and otherwise is zero δ2007 Year 2007 is given the value of one and otherwise is zero δ2008 Year 2008 is given the value of one and otherwise is zero
Industry dummy
Consumer discretionary
Value of one for company in consumer discretionary sector and zero otherwise
Consumer staples Value of one for company in consumer discretionary sector and zero otherwise
Energy Value of one for company in energy sector and zero otherwise
Finance Value of one for company in finance sector and zero otherwise
Healthcare Value of one for company in healthcare sector and zero otherwise
Industrials Value of one for company in industrial sector and zero otherwise
Information and technology
Value of one for company in information and technology sector and zero otherwise
Materials Value of one for company in materials sector and zero otherwise
Utilities Value of one for company in utilities sector and zero otherwise
Telecommunications Dummy for telecommunications is included as part of the constant to avoid the problem of perfect multicollinearity

176
5.6 Summary
This chapter has discussed the research methodology and variable measurements employed in
this study. The sample consisted of 200 Malaysian companies listed in the Bursa Malaysia
continuously from 2000 to 2008. The final unbalanced panel dataset consisted of 1788 company
– years. The main source of data is the annual reports obtained from the websites of Bursa
Malaysia and individual companies. Supplementary or missing data is sourced from electronic
databases (Osiris, Mint Global and Thomson OneBanker).
The chapter also expanded on the research empirical framework by specifying the models that
will be used to test the hypotheses. The discussion also included the definitions and measurement
of the proxies used to represent the theoretical constructs. Table 11 and Table 12 provide a
summary of the independent and control variables that are included in the models.
The following chapter will elaborate on the statistical methods applied to test the hypotheses. It
will also discuss the results of the hypotheses testing and their significance.

177
Figure 10 Disclosure Index of Executive Directors’ Remuneration
Item Coding Index REFERENCE
FRS 124
--------------------------------- DISCLOSURE UNDER FRS 124 RELATED PARTY TRANSACTIONS--------------------
1 Disaggregated remuneration
0 = No
Para 16. An entity shall disclose key management personnel compensation in total and for each of the following categories:
(a) Short-term employee benefits
(b) Post-employment benefits (c) Other long-term benefits (d) Termination benefits; and (e) Share based payment
Para 9. Key management personnel are those persons having authority and responsibility for planning, directing and controlling the activities of the entity, directly or indirectly, including any director (whether executive or otherwise) of that entity
1 = Yes
2 Disclosure of short-term benefits
0 = No
Para 9. Short-term benefits include wages, salaries and social security contributions, paid annual leave and paid sick leave, short term profit-sharing and bonuses and non-
1 = Yes
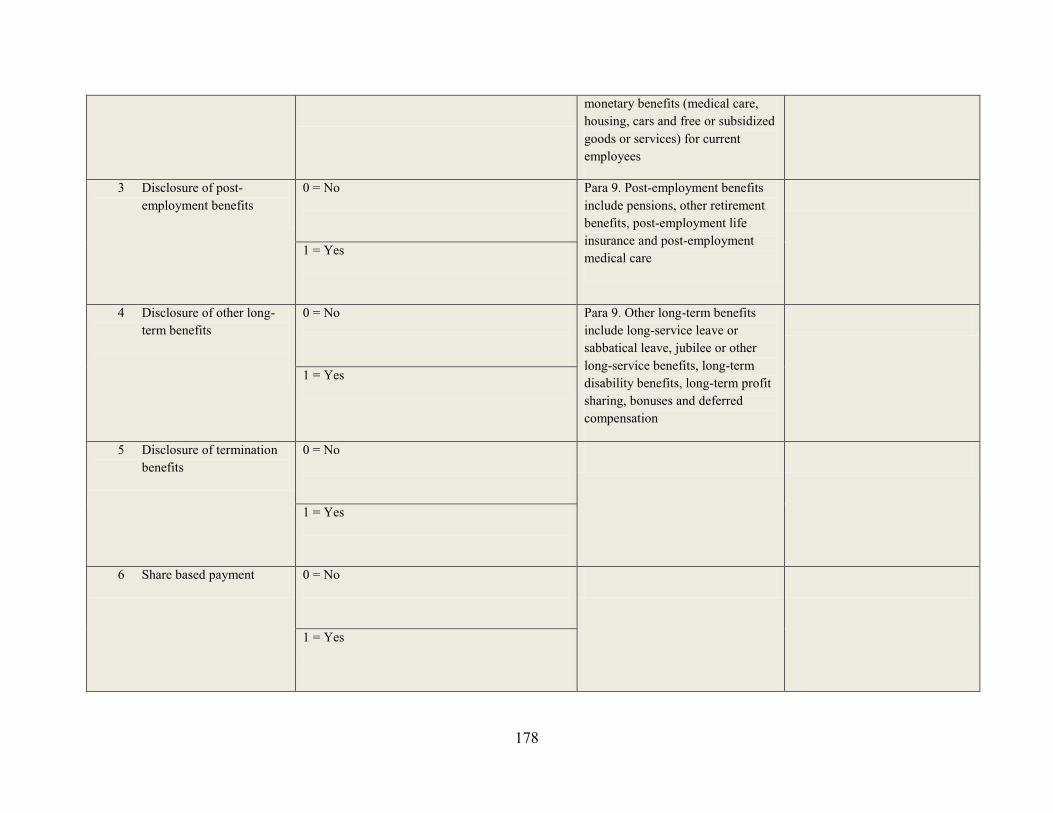
178
monetary benefits (medical care, housing, cars and free or subsidized goods or services) for current employees
3 Disclosure of post-employment benefits
0 = No
Para 9. Post-employment benefits include pensions, other retirement benefits, post-employment life insurance and post-employment medical care
1 = Yes
4 Disclosure of other long-term benefits
0 = No
Para 9. Other long-term benefits include long-service leave or sabbatical leave, jubilee or other long-service benefits, long-term disability benefits, long-term profit sharing, bonuses and deferred compensation
1 = Yes
5 Disclosure of termination benefits
0 = No
1 = Yes
6 Share based payment 0 = No
1 = Yes

179
---------------------------------------------------DISCLOSURE IN EXCESS OF FRS 124 ---------------------------------------------------------
MCCG
7 Specific section for remuneration in directors’ report
0 = No Part 1B: The company annual reports should contain a statement of remuneration policy….. 1 = Yes
8 Separate disclosure for individual executive directors
0 = No Part 1B: The company annual reports should contain ……. details of the remuneration of each director.
1 = Yes
9 Comparative period information
0 = No
1 = Yes
10 Discussion on principles of remuneration
0 = No discussion
Para Aus.25.5 (a) Discussion of board policy for determining the nature and amount of compensation of key management
1 = General discussion of process

180
personnel of the entity
Para Aus.25.5 (d) For each grant of a cash bonus, performance-related bonus or share-based payment compensation benefit, whether part of a specific contract for services or not, the terms and conditions of each grant affecting compensation in this or future reporting periods
Para Aus.25.5 (e) For each contract. such further explanations as are necessary… to provide an understanding of how the amount of compensation in the current reporting period was determined and how the terms of the contract affect compensation in future periods
2 = Detailed discussion of process

181
11 Discussion on pay and performance association
0 = No discussion
Para Aus.25.5 (b) Discussion of the relationship between such policy and the entity’s performance
Para Aus.25.5 (c) If an element of the compensation of a key management person is dependent on the satisfaction of a performance condition:
(i) a detailed summary of the performance condition;
(ii) an explanation of why the performance condition was chosen;
(iii) a summary of the methods used in assessing whether the performance condition is satisfied and an explanation of why those methods were chosen
(iv) if the performance condition involves a comparison with factors external to the entity:
(A) a summary of the factors to be used in making the comparison; and
(B) if any of the factors relates to the performance of another entity, of two or more other entities or an index in which the securities of an
Part 1B: Levels of remuneration should be sufficient to attract and retain the directors (executive and non-executive) needed to run the company successfully. Whilst remuneration of executive directors should reflect corporate and individual performance, remuneration packages of non- executive directors should commensurate with their experience and level of responsibilities.
1 = Broad discussion of pay and performance association (summary of performance benchmark)
2 = Detailed discussion of pay and performance association

182
entity or entities are included – the identity of that entity, of each of those entities or of the index [Further elaborated in para Aus.25.5 (f) to (h)]
----------------------------------------------------DISCLOSURE UNDER FRS 2 SHARE BASED PAYMENT-----------------------------------------------
12 Options valuation and rights details
0 = No details disclosed
Para. Aus 25.7.1 The following details…shall be disclosed; (a) the number of options and rights over the reporting period [granted and vested] and (b) terms and conditions of each grant [fair value at grant date, exercise price, amount paid or payable, expiry date, exercise dates and performance hurdles that must be met before the equity is vested]
1 = Broad or partial details of options and rights granted
2 = Terms and condition of grants
3 = Valuation method and options and rights

183
value disclosed with valuation models input
---------------------------MANDATORY REQUIREMENT UNDER THE BURSA MALAYSIA LISTING RULE -----------------------------------
13 Disclosure by band as per Bursa Malaysia listing rule
0 = No bands provided
1 = Provides disclosure by band

184
Chapter 6 Empirical results and analysis
6.0 Introduction This chapter describes the results of the hypotheses testing. The study employed univariate,
bivariate and multivariate analysis to test the hypotheses. The analysis was conducted using
Eviews 7; a statistical software that allowed for an unbalanced panel dataset. The univariate
analysis involved non-parametric testing because the skewness in the dataset ruled out a
normal parametric t-test. The multivariate analysis was conducted mainly using panel GLS
regression with fixed effects estimations and panel Logit regression.
6.1 Univariate analysis
This section provides the descriptive statistics of the dataset and the results of the univariate
analysis of the determinants of the disclosure of executive director remuneration.

185
6.1.1 Disclosure of executive directors’ remuneration score
Table 13 Descriptive statistics for total executive directors’ remuneration score from 2000 to 2008
Panel A Mean Median Max Min. Std. Dev. 2000 0.1988 0.1429 0.6471 0.0000 0.0845 2001 0.4561 0.4286 0.8571 0.0714 0.1338 2002 0.5150 0.5000 1.0000 0.2857 0.1204 2003 0.5483 0.5000 1.0000 0.2143 0.1343 2004 0.5741 0.5714 1.0000 0.2143 0.1354 2005 0.5854 0.5714 1.0000 0.2857 0.1359 2006 0.6005 0.5882 1.0000 0.2857 0.1376 2007 0.6234 0.6429 1.0000 0.3571 0.1411 2008 0.6495 0.6471 1.0000 0.0714 0.1530 All 0.5275 0.5294 1.0000 0.0000 0.1842 Median χ2 test = 330.3005 ***39 Kruskal – Wallis (tie-adj.) = 698.1131***40 Jarque-Bera test = 19.0093 *** Panel B Result of Mann Whitney Wilcoxon (tie-adj.)41 tests Mean Rank Mean score Value YR 0001 2000 109.2050 -0.6919
15.9376*** 2001 291.7950 0.7246 YR 0008 2000 103.2075 -0.7352
16.9795*** 2008 297.7925 0.7671 YR 0108 2001 134.2300 -0.5428
11.4858*** 2008 266.7700 0.54445 *** Significance at 1% level
Panel A (Table 13) shows that the average total disclosure of executive director remuneration
over the study period is 0.5275 ranging from the maximum of one to a minimum of zero.
This indicates diversity in the extent of disclosure of executive directors’ remuneration. The
average total score shows a continuous improvement from 2000 to 2008 (Figure 11).
39 The adjusted -median χ2 test is a ‘rank-based ANOVA test based on the comparison of the number of observations above and below the overall median in each sub-groups (Eviews Manual, page 318)’. The null hypothesis is that there are no differences in the medians of the groups. 40 The Kruskal – Wallis (tie-adj.) is an application of the concept of the Mann Whitney test on more than two sub-groups. 41 Mann Whitney Wilcoxon (tie-adj) is a non-parametric test. The test ranked the series from smallest to largest order. It then compares the mean rank from the two series. The null hypothesis of the test is that ‘the two subgroups are independent samples from the same general distribution. The alternative hypothesis is that “the values of the first group are different from the values of the second group (EViews Manual)”.The Jarque-Bera statistic rejects the hypothesis that the total score is normally distributed (p=0.0001). It rules out the applicability of parametric test that depends on normality assumption. .

186
Figure 11 Total executive director remuneration disclosure score from 2000 to 2008
However, the trend of the average minimum score has not been consistent. There was a
significant increase in the early part of the study, a decrease between 2002 and 2004, an
improvement in 2005 and 2007 and a decline in 2008. The increasing periods are the years
when new disclosure regulations were first introduced and the following years. This may
reflect a learning period for companies when they react to the new regulations. The declining
trends are in the years between new regulations. This may indicate that low disclosure
companies first conform to new disclosure regulations by disclosing more but then fall back
to previous patterns of disclosing less information.
The Mann Whitney Wilcoxon test (Table 13) shows a significant difference between the
average total disclosure score of 2000 and 2001 (p = 0.0000). This improvement can be
explained by the introduction of MCCG and Bursa Malaysia listing rule for disclosures by
bands in 2001. Tests between 2000 and 2008 also show a significant difference (p = 0.000).
2008 encapsulates the regulatory requirement of the Listing Rule, FRS 2, FRS 124 and the
MCCG. The final Mann Whitney Wilcoxon test in Panel B compares 2001 and 2008 and also
0
0.2
0.4
0.6
0.8
1
1.2
2000 2001 2002 2003 2004 2005 2006 2007 2008
Sco
re
Year
Total score (mean)
Maximum score
Minimum score

187
shows a significant difference between the scores. This indicates that the introduction of the
FRS 2 and FRS 124 into the regulatory framework further improved the total disclosure of
executive directors’ remuneration. These results support hypothesis one that there was an
improvement in the level of disclosure of executive directors’ remuneration after the changes
in Malaysian regulatory framework.
Table 14 Descriptive statistics for total voluntary score executive directors’ remuneration score from the period 2000 to 2008
Panel A Mean Median Max Min. Std. Dev. 2000 0.1988 0.1429 0.6471 0.0000 0.0845 2001 0.4203 0.3846 0.8462 0.0769 0.1411 2002 0.4817 0.4615 1.0000 0.2308 0.1291 2003 0.5174 0.4615 1.0000 0.2308 0.1437 2004 0.5449 0.5385 1.0000 0.2308 0.1446 2005 0.5462 0.5385 1.0000 0.2308 0.1585 2006 0.5577 0.5385 1.0000 0.2308 0.1584 2007 0.5800 0.6154 1.0000 0.3077 0.1614 2008 0.6104 0.6154 1.0000 0.0769 0.1667 All 0.4949 0.4615 1.0000 0.0000 0.1864 Median χ2 test = 283.3632 *** Kruskal – Wallis (tie-adj.) = 633.9115*** Jarque-bera test = 15.4351 *** Panel B Result of Mann Whitney Wilcoxon(tie-adj) tests Mean Rank Mean score Value YR 0001 2000 115.4650 -0.6509
14.8433*** 2001 285.5350 0.6832 YR 0008 2000 104.0350 -0.7310
16.8513*** 2008 296.9650 0.7589 YR 0108 2001 138.7225 -0.5060
10.7199*** 2008 262.2475 0.5096 ** *Significant at 1% level

188
Figure 12 Total executive directors remuneration voluntary disclosure score from 2000 to
2008
The voluntary score measure consists of items that are reported in excess of the mandatory
requirements of the Listing Rule and FRS 2. In year 2000, there was no disclosure
requirement. Therefore all disclosure of executive directors’ remuneration was voluntary.
Table 14 indicates that there are large variations in the level of voluntary disclosure from a
maximum voluntary score of one to none at all. The introduction of the MCCG in 2001
significantly improved the level of voluntary disclosure from the previous year (p=0.0000).
The average voluntary score consistently improved over the years. This is supported by the
Mann Whitney Wilcoxon tests on 2000 and 2008 and 2001 and 2008. However, there is a
marked increase of minimum voluntary disclosure in 2007. This is consistent with the
introduction of FRS 124 in 2006 that may have caused companies to voluntarily disclose
more about executive directors’ remuneration as they formed part of companies’ ‘key
management personnel’. The results provide further support for hypothesis one that there was
an improvement in the level of disclosure of executive directors’ remuneration in Malaysia.
0
0.2
0.4
0.6
0.8
1
1.2
2000 2001 2002 2003 2004 2005 2006 2007 2008
Vo
lun
tary
sco
re
Year
Mean
Maximum vol.score
Minimum vol.score

189
The minimum voluntary score trends appear to stabilize after 2001. However, there is a
significant decline in the level of minimum disclosure in 2008. Low disclosure companies
may initially disclose more information given the emphasis on remuneration in FRS 124 but
eventually disclose less as it becomes clear that FRS 124 is very broad in its disclosure
requirements. It only requires mandatory disclosure of ‘key management personnel’
remuneration but not for individual or total executive directors.
Table 15 Distribution of scoring by items for the pooled42 sample from 2000 to 2008 (n = 1788)
Disclosure item Score
Percentage of compliance 0 1 2 3
Disaggregated remuneration 67.62 32.38 NA NA Disclosure of short term benefits 16.22 83.78 NA NA Disclosure of post-employment benefits 67.90 32.10 NA NA Disclosure of other long term benefits 65.72 34.28 NA NA Disclosure of termination benefits 2.01 97.99 NA NA Disclosure of share based payment 0.22 99.78 NA NA Specific section for remuneration 20.36 79.64 NA NA Disclosure of individual remuneration 88.87 11.13 NA NA Comparative period information 45.53 54.47 NA NA Discussion on principles of remuneration 30.93 60.07 9.00 NA Discussion on pay and performance association 73.99 24.89 1.12 NA Options valuation and right details 0 1.18 88.31 10.51 Disclosure by bands 11.58 88.42 NA NA Score 0 is for non-compliance or undisclosed information. Score 1 is for compliance or
disclosure of information. The additional score of 2 and 3 applies for items that are scored
based on the extensiveness of the disclosure not on mere compliance. NA – The score is not
applicable for the particular item.
Appendix 7 provides an overview of the distribution of individual item scores over the
sample period. It shows that the introduction of the regulations and recommendations on
disclosure of remuneration improved the level of disclosure for each item. The improvement
was especially significant between the years 2000 and 2001. However, it shows that a
42 The pooled sample combined all the observations from 2000 to 2008 of the 200 sample companies. The total observations consisted of 1788 annual reports or company years.

190
significant number of Malaysian companies did not reveal the remuneration of each
individual executive director.
Based on the pooled sample over the nine year period, only 11.13 percent of the annual
reports disclosed individual executive director’s remuneration (Table 15). This is inconsistent
with the recommendations of the MCCG. Prior to the introduction of MCCG in 2001, only
one company provided disclosure of individual director’s remuneration. In 2008, the number
of companies that disclosed individual remuneration declined from 25 in 2007 to 19.
Appendix 2 provides examples of narrative statements that some Malaysian companies used
to justify a departure from the MCCG recommendation. For example, Kia Lim Berhad in
their 2005 annual reports attempted to justify the departure by stating, “Details of the
remuneration of each Director are not disclosed due to security reasons” (Kia Lim Berhad
2005).
There was similar resistance in Germany (Chizema 2008). He showed that, in 2005, three
years after the German Code of Corporate Governance (KODEX) was introduced, a quarter
of the sample companies (n=31/126) did not disclose individual executive remuneration as
required by the KODEX. Chizema (2008) found that ownership structure, firm size,
supervisory board and company age significantly influenced German companies’ compliance
with individual remuneration disclosure requirement.
Most Malaysian companies provided only a broad policy description of the principles behind
their remuneration package over the sample years (n = 1074/1788 company-years). For

191
example, the remuneration policy of Advance Synergy Berhad was explained as follows, “to
ensure that the Company attracts and retains the right caliber of the Directors needed to run
the Group successfully. The remuneration Committee reviews and recommends to the Board,
the company remuneration policy for Executive Directors to ensure that they are
appropriately rewarded for their contribution to the Group” (Annual Reports Advance
Synergy Berhad 2007). There is no disclosure on the actual policy, details of the principles or
the terms of any remuneration policy. Over the period of 2000 to 2008, only 9 percent of the
sample annual reports provided comprehensive details of the principles behind their
remuneration packages. 73.99 percent of annual reports did not disclose the association
between pay and performance. 24.89 percent of the sample annual reports did disclose some
performance benchmark while 1.12 percent went further by providing a detailed summary of
the performance threshold that executives had to achieve to earn their remuneration (Table
15).
Malaysian companies that issue share based payments are required to comply with the FRS 2
‘Share based payments’. However, over the period of 2000 to 2008, only 10.51 percent of
those companies’ annual reports adopted the mandatory disclosure requirements of FRS 2.
The other companies failed to disclose their option valuation model, the input data and the
assumptions associated with the model. The users of the annual reports thus could not make
an independent assessment of the value of the executives’ options.
88.42 percent of the sample annual reports over the nine year period disclosed executive
directors’ remuneration by bands. However, only ten companies disclosed this information
before it was made mandatory by the Bursa Malaysian listing rule in 2001. After 2001, most
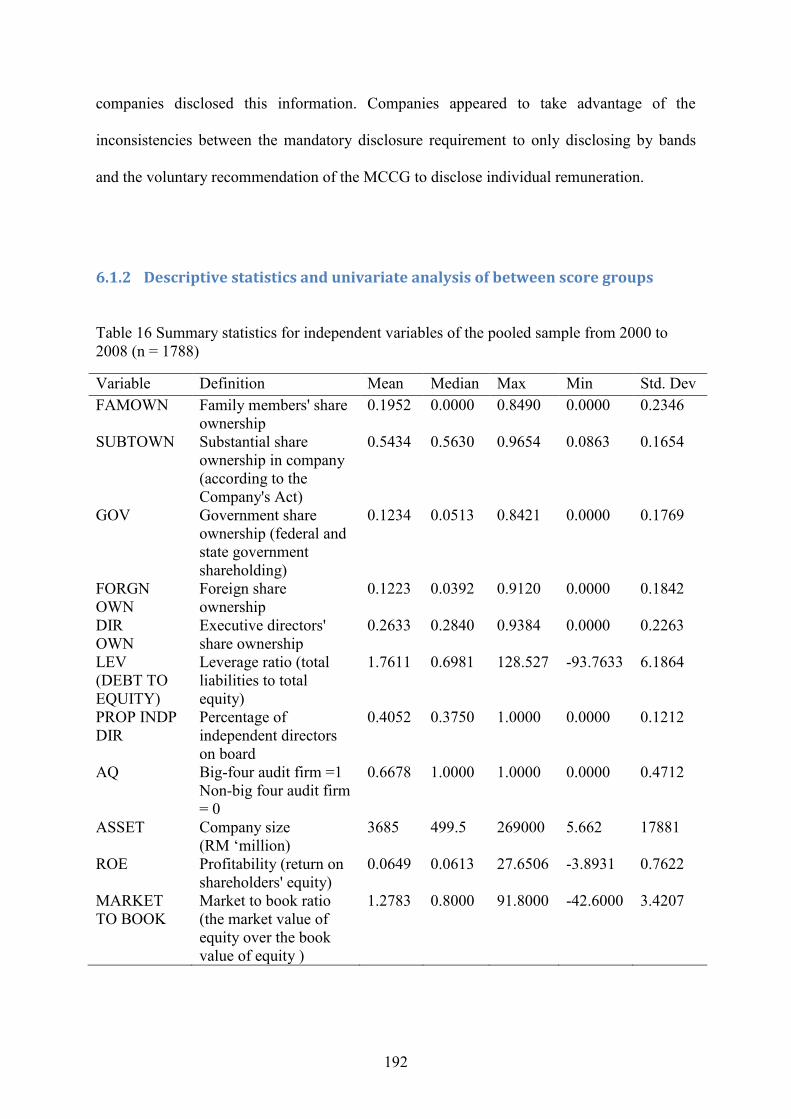
192
companies disclosed this information. Companies appeared to take advantage of the
inconsistencies between the mandatory disclosure requirement to only disclosing by bands
and the voluntary recommendation of the MCCG to disclose individual remuneration.
6.1.2 Descriptive statistics and univariate analysis of between score groups
Table 16 Summary statistics for independent variables of the pooled sample from 2000 to 2008 (n = 1788)
Variable Definition Mean Median Max Min Std. Dev FAMOWN Family members' share
ownership 0.1952
0.0000 0.8490 0.0000 0.2346
SUBTOWN Substantial share ownership in company (according to the Company's Act)
0.5434
0.5630 0.9654 0.0863 0.1654
GOV Government share ownership (federal and state government shareholding)
0.1234
0.0513 0.8421 0.0000 0.1769
FORGN OWN
Foreign share ownership
0.1223
0.0392 0.9120 0.0000 0.1842
DIR OWN
Executive directors' share ownership
0.2633
0.2840 0.9384 0.0000 0.2263
LEV (DEBT TO EQUITY)
Leverage ratio (total liabilities to total equity)
1.7611
0.6981 128.527 -93.7633 6.1864
PROP INDP DIR
Percentage of independent directors on board
0.4052
0.3750 1.0000 0.0000 0.1212
AQ Big-four audit firm =1 Non-big four audit firm = 0
0.6678 1.0000 1.0000 0.0000 0.4712
ASSET Company size (RM ‘million)
3685
499.5 269000 5.662 17881
ROE Profitability (return on shareholders' equity)
0.0649
0.0613 27.6506 -3.8931 0.7622
MARKET TO BOOK
Market to book ratio (the market value of equity over the book value of equity )
1.2783 0.8000 91.8000 -42.6000 3.4207

193
The descriptive statistics (refer to Table 16) for the ownership structure of the sample
Malaysian companies reflects the high degree of family and state ownership in publicly listed
companies (Claessens, Djankov & Lang 2000). The largest government and family
ownership in the sample was 84.21 percent and 84.9 percent respectively. Executive directors
of the sample Malaysian companies on average held 26.33 percent of their companies’
stocks. The average ownership by foreigners is 12.23 percent. The Board composition is on
average had 40.52 percent of independent directors. As for the audit quality, 594 company
years are audited by non-Big 4 audit firms and 1194 by Big 4 audit firms. There is also
diversity in the companies’ characteristics. The size of the sample companies proxied by total
assets ranges from (RM) 5.662m to 269000m. More variance is observed in the ROE with a
minimum of -3.8931 percent and maximum of 27.6506 percent while leverage is on average
1.7611. The market to book value of equity also differs ranging from -42.60 percent to 91.80
percent.
The next step in the research segregated the companies into low scoring and high scoring
groups. The low scoring group consisted of companies with scores of less than 50 percent
while the high scoring group is made up of companies with a score of 50 percent and more.
The cut-off point is an arbitrary measure adopted by this study to distinguish between high
and low scoring companies. 711 and 1077 of the sample annual reports were categorised as
low score and high score respectively. The study used non-parametric tests to determine
statistical differences between high total score and low total score groups for each of the
specific independent variables. This test is used because the data set is not normally
distributed and thus rules out the use of parametric tests. Non parametric tests are also not
affected by outliers as it either ranks the means of the series or compares the medians
(Aharony, Barniv & Falk 2010).

194
Table 17 Results of Mann Whitney Wilcoxon test on differences between high total score and low total score companies of the pooled sample from 2000 to 2008 (n = 1788)
Variable Groups Median Mean rank Mean score Value Probability FAMOWN Low score 0.0063 912.7669 0.0891 1.3399 0.1803 High score 0.0000 881.6281 0.0443 SUBTOWN Low score 0.5646 898.3218 0.0198 0.2874 0.7738 High score 0.5626 891.1509 -0.0130 GOV Low score 0.0465 872.1789 -0.085 1.4514 0.1467 High score 0.0572 908.3853 0.0445 FORGNOWN Low score 0.0218 824.1014 -0.1059 4.6602 0.0000*** High score 0.0502 940.0799 0.1012 DIROWN Low score 0.2903 914.7338 0.0664 1.3840 0.1663 High score 0.2674 880.3315 -0.0069 LEV Low score 0.6939 896.1338 0.0085 0.1419 0.8872 High score 0.7012 892.5933 -0.0056 P_INDD Low score 0.3750 832.3028 -0.1378 4.1315 0.0000*** High score 0.4000 934.6732 0.0919 AQ Low score 1.0000 867.5782 -0.0768 2.1539 0.0312** High score 1.0000 911.4183 -0.0082 SIZE Low score 418.747 844.8930 -0.0946 3.2664 0.0011*** High score 552.097 926.3733 0.00623 ROE Low score 0.0515 822.6493 -0.1365 4.7459 0.0000*** High score 0.0683 941.0371 0.0900 MARKETOBOOK Low score 0.8000 875.2260 -0.0355 4.2850 0.2506 High score 0.8000 903.8662 0.0234 Number of low score sample = 711 Number of high score sample = 1077 *** Significant at the 1% level ** Significant at the 5% level

195
The tests results shown in Table 17 indicate that there are no statistical differences in the
disclosure of executive directors’ remuneration for the level of family ownership, substantial
ownership, government ownership, executive director shareholdings, and leverage between
low score and high score groups. This is contrary to agency theory arguments that suggest
that the extent of ownership and debt level can influence the level of disclosure of executive
directors’ remuneration (Jensen & Meckling 1976). This leads to the rejection of hypotheses
two, three, four, six and seven. However, high scoring companies are shown to have a higher
level of foreign ownership. The median of foreign ownership for high scoring companies is
5.02 percent (mean score = -0.1059) compared to low scoring group median of 2.18 percent
(mean score = 0.1012). Foreign shareholders may demand more transparency of executive
remuneration given that the debates on pay performance sensitivities are more common in
developed markets (Chizema 2008). This means that hypothesis five is accepted.
The rejection of hypotheses two (family ownership), three (substantial ownership), four
(government ownership), six (executive director ownership) and seven (leverage) may be
explained by an increasing presence of independent directors and foreign shareholders over
the sample period. Appendix 5 shows that there had been consistent increases in the
proportion of independent directors and foreign ownership. The average family ownership,
substantial ownership, government ownership, executive director ownership and leverage
appeared to fall. Independent directors and foreign shareholders may mitigate possible
agency costs from insider owners by demanding more disclosure of executive directors’
remuneration. Creditors may also depend on the higher presence of independent directors and
foreign ownership to look after their interest instead of self-monitoring.

196
The two groups are also statistically different in terms of the independent directors on the
board of directors. The high score group has a higher proportion of independent directors
than the low score group. This result supports hypothesis eight of a positive association
between the extent of the disclosure of executive directors’ remuneration and the proportion
of independent directors. This is consistent with the monitoring role that independent
directors play in mitigating agency costs for minority and external shareholders (Chen &
Jaggi 2000). The independent directors can demand more disclosure of remuneration to help
shareholders assess the performance of the executives. The independent directors do not have
the incentive to protect executives from public scrutiny by not disclosing details on
remuneration. In addition, this result rejects the argument that independent directors are a
substitute for disclosure.
Hypothesis nine states that there is positive association between audit quality and the level of
disclosure. It is suggested that companies that are audited by big-4 audit firms are more likely
to disclose more information. The Mann Whitney Wilcoxon result shows that there is a
significant difference between the level of audit quality for low scoring and high scoring
groups. The high scoring group has a significantly higher audit quality than the lower scoring
group. This means that hypothesis nine is supported.
There is a statistically significant difference in the size (proxied by total asset) of low scoring
and high scoring groups. The high scoring group has a larger median size than the low
scoring group. This is consistent with legitimacy theory that suggests that bigger companies
disclose more information to mitigate the political costs associated with non-disclosure
(Patten, Dennis M. 1992). Another proxy for political cost is profitability when more
profitable companies will have more visibility. These results mean that hypothesis ten is

197
accepted. There is a positive association between the extent of the disclosure of executive
directors’ remuneration and the size of the company.
In addition, from a signalling theory perspective, better performing companies disclose more
information to distinguish themselves from poorly performing companies (Lang & Lundholm
1993). The result of the Mann Whitney Wilcoxon tests for return on equity (ROE) is
consistent with the size proxy. High scoring companies have statistically higher profitability
compared to the low scoring companies. This means that hypothesis eleven is accepted.
There is a positive association between profitability and the level of disclosure of executive
directors’ remuneration.
The market to book ratio of equity represents the level of growth and the extent of proprietary
costs. It is hypothesised that companies with higher growth are associated with higher
proprietary costs and would disclose less information. However, the result of Mann Whitney
Wilcoxon test shows that there is no significant difference
between the market to book ratio of equity of low scoring and high scoring groups. Thus, the
hypothesis twelve is rejected.

198
Table 18 Results of Mann Whitney Wilcoxon test on differences between high total voluntary score and low total voluntary score43 companies of the pooled sample from 2000 to 2008 (n = 1788)
Variable Groups Median Mean rank Mean score Value Probability FAMOWN Low score 0.0000 900.1326 0.0771 0.5670 0.5867 High score 0.0000 887.1481 0.0454 SUBTOWN Low score 0.5655 910.0180 0.0394 1.3870 0.1654 High score 0.5608 876.1031 -0.0440 GOV Low score 0.0425 855.4406 -0.0394 3.3523 0.0008*** High score 0.0677 937.0823 0.0937 FORGNOWN Low score 0.0242 848.6654 -0.0469 3.935 0.0001*** High score 0.0523 944.6523 0.0924 DIROWN Low score 0.2827 898.3738 0.0361 0.3801 0.7039 High score 0.2815 888.1132 0.0066 LEV Low score 0.6939 899.6023 0.0017 0.4851 0.6276 High score 0.7015 887.7405 -0.0193 P_INDD Low score 0.3750 851.6092 -0.0920 3.6956 0.0002*** High score 0.4000 941.3632 0.1041 AQ Low score 1.0000 850.8446 -0.1029 4.5810 0.0000*** High score 1.0000 942.2174 0.0400 SIZE Low score 448.526 844.4496 -0.1001 4.2908 0.0000*** High score 569.056 949.3626 0.1118 ROE Low score 0.0520 833.9353 -0.1140 5.2012 0.0000*** High score 0.0737 961.1102 0.1274 MARKETOBOOK Low score 0.7750 864.9952 -0.0508 2.3799 0.0173** High score 0.8300 923.1333 0.0566 Low voluntary score = 943 High voluntary score = 845 *** Significant at the 1% level ** Significant at the 5% level
Table 18 shows the result of the Mann Whitney Wilcoxon test on differences between high
voluntary score and low voluntary score. 943 and 845 of the annual reports were identified as
low voluntary score and high voluntary score groups respectively. Consistent with the results
of differences in the total score, there are statistical differences between size, return on
equity, foreign ownership and the proportion of independent directors of low voluntary score
and high voluntary score groups.
43 The voluntary score measure is derived from the level of score in excess of the mandatory score.

199
However, government ownership appears to be statistically different between low voluntary
score and high voluntary score groups. The high voluntary score group has a higher median
and mean rank of government ownership than the low voluntary score group. This means that
hypothesis four that there is a positive association between the extent of voluntary disclosure
of executive directors’ remuneration and government shareholding is accepted. This is
consistent with Chizema (2008) who found that state controlled companies in Germany
complied more with the requirement of disclosing individual executive’s remuneration in
order to set example to the market. This also may imply that external and minority
shareholders in Malaysian state controlled companies demand more voluntarily disclosure to
protect their interests (Eng & Mak 2003) .
The mean and median of the market to book ratio of equity is significantly higher in the high
voluntary score group than in the low voluntary score group. The market to book ratio of
equity represents the level of growth. Higher growth companies are hypothesised to incur
more proprietary costs and hence disclose less information. However, the result has shown
otherwise with high growth companies disclosing more information. This may imply that
companies consider that the benefits of voluntarily disclosing information outweigh the
proprietary costs of doing so. For example, studies have shown that companies with higher
growth have higher information asymmetry because of the discretionary powers given to
managers so that they can exploit growth opportunities (Bryan, Hwang & Lilien 2000).
Consequently, shareholders of higher growth companies may demand more information to
assess the performance of the managers.
The main limitation of a univariate analysis is that it does not consider the interaction
between the explanatory variables. For example, larger companies may be associated with

200
higher profitability than smaller companies. A univariate analysis only provides a one way
hypothesis testing between an explanatory variable and a specific dependent variable, holding
other associations constant. The results cannot be generalised. Nonetheless, the results
discussed in this section provide preliminary tests of the theoretical framework that is used in
the study.
6.2 Bivariate analysis
6.2.1 The Pearson Coefficients of Correlation, r
The results of the Pearson Coefficient of Correlation (r) provide indications of the validity of
the explanatory variable in influencing the level of total and voluntary disclosure of executive
director remuneration. The Pearson Coefficient of Correlation measures the linear association
between an explanatory variable, holding other factors constant and the dependent variable,
the disclosure of executive director remuneration. The covariance value gives the measure of
how the two variables change or move mutually (Gujarati 1995). The correlation value
provides a degree of the linear dependency between the variables. The results show that all
the explanatory variables except for foreign ownership, low director ownership (director
ownership<10%) and growth (proxied by market to book ratio), have significant pair wise
linear associations with total and voluntary scores of executive director remuneration.
Although these variables are insignificant it does not mean that they should be dropped from
the consequent models. The r only measures the strength of a pair wise linear association
between the dependent and one explanatory variable. It does not consider interactions
between multiple explanatory variables. Furthermore, the inclusion of the insignificant
explanatory variables is based on the significant theoretical framework and dropping them
may introduce omitted variable bias into the consequent analysis.

201
Table 19 Pearson correlation coefficients for total score (N = 1783)
FAM OWN
SUBT OWN GOV FORGN OWN
DDIR OWN
01
DDIR OWN 0125
DDIR OWN 0025
DEBT TO
EQUITY
PROP INDDIR AQ LN
ASSET ROE MARKET
TO BOOK
Covariance -0.0020 -0.0014 0.0013 0.0009 0.0000 -0.0012 -0.0015 -0.0606 0.0040 0.0107 0.0299 0.0067 -0.0104
Correlation -0.0466 -0.0462 0.0405 0.0274 0.0187 -0.0532 -0.0586 -0.0532 0.1804 0.1231 0.1086 0.0481 -0.0165
t-Statistic -1.9685 -1.9509 1.7085 1.1580 0.7886 -2.2483 -2.4756 -2.2479 7.7391 5.2366 4.6099 2.0307 -0.6946
Probability 0.0492
**
0.0512
*
0.0877
*
0.2470 0.4305 0.0247
**
0.0134
**
0.0247
**
0.0000
***
0.0000
***
0.0000
***
0.0424
**
0.4874
Table 20 Pearson correlation coefficients for voluntary score (N = 1783)
FAM OWN
SUBT OWN GOV FORGN
OWN
DDIR OWN
01
DDIR OWN 0125
DDIR OWN 0025
DEBT TO
EQUITY
PROP INDDIR AQ LN
ASSET ROE MARKET
TO BOOK
Covariance -0.0023 -0.0014 0.0014 0.0011 0.0000 -0.0012 -0.0015 -0.0567 0.0037 0.0111 0.0308 0.0070 -0.0108
Correlation -0.0530 -0.0459 0.0438 0.0318 0.0181 -0.0541 -0.0582 -0.0492 0.1663 0.1270 0.1107 0.0491 -0.0170
t-Statistic -2.2387 -1.9409 1.8493 1.3423 0.7629 -2.2870 -2.4595 -2.0780 7.1169 5.4041 4.7004 2.0765 -0.7159
Probability 0.0253
**
0.0524
*
0.0646
*
0.1797
0.4456
0.0223
**
0.0140
**
0.0379
**
0.0000
***
0.0000
***
0.0000
***
0.0380
**
0.4741

202
6.3 Multivariate analysis
6.3.1 Classical Linear Regression Model (CLRM) Assumptions
There are a few classical assumptions that have to be made and satisfied before a valid
statistical inference can be made from the models. If the first six assumptions are met, “the
OLS estimators are best linear unbiased estimators (BLUE) (Gujarati 1995, p. 348).”
According to the Gauss-Markov theorem, an OLS estimator with a BLUE property means
that the OLS estimator has minimum variance and is the best estimate of the true population
values. An efficient estimate has the lowest possible minimum variance. An unbiased
estimate means that if the analysis is repeatedly made on different and larger samples, the
average estimates converge on the true population values.
The first three assumptions are:
1. The regression model is linear and correctly specified and has an additive error term
2. The error has a zero population mean
3. All explanatory variables are uncorrelated with the error term
The first three assumptions are concerned with specification errors that may render the model
inefficient. Specification errors may lead to higher and imprecise estimated standard errors
and wider confidence intervals. The errors can be from redundant independent variables,
omitted independent variables, measurement errors or incorrect functional forms. The models
assume a linear association between the level of the score and the independent variables.
Additional analysis also includes potential concave associations between different
concentrations of director ownerships and the level of disclosure by applying dummy

203
variables based on ownership quartiles. The model also included error terms that may capture
other explanatory variables that are not included or and unobserved but could influence the
dependent variable.
Assumption II implies that, on average there is no association between Y and the error term
and vice versa. Assumption III is not essential as this study involves a conditional regression
analysis where the values of the dependent variables (Xs) are fixed numbers (Gujarati 1995).
Conditional regression means that the multiple regression equation gives the conditional
mean value of the score conditional upon the given values of the independent variables. The
value of Y depends or is conditional on the values of Xs.
The Ramsey Reset Test can be used to formally test the first three assumptions. However, the
test is currently not available for panel data analysis. Visual inspections of the residual plots
may be used to assist in detecting specification errors. The inspection of the residual plots
after correction for serial correlation and heteroscedasticity did not indicate distinct patterns
that may reflect any specification errors. In addition, the models have been based on an
extensive theoretical framework that would mitigate potential specification errors.

204
4. Observations of the error term are uncorrelated with each other (there is no serial or
auto correlation)
Autocorrelation is defined as “correlation between members of observations ordered in time
(as in time series data) or space (as in cross sectional data) (Gujarati 1995, p. 378).”44 It
means that any disturbance that affects one cross sectional unit or time unit would not affect
another cross sectional unit or the subsequent time unit. For example, the effect of changes in
board composition of a company on the level of disclosure would not affect another
company’s disclosure policies. However, if it does, then there is autocorrelation. The former
company may be viewed as a benchmark for corporate governance for the later company.
The dependency reflects autocorrelation. Another example is where the presence of a
learning curve before companies fully adapt to a new disclosure regulation may mean that an
improvement in the level of the current year disclosure would impact the level of disclosure
of the subsequent year. This means that autocorrelation is plausible in the study dataset.
When there is autocorrelation, the ordinary least squares (OLS) estimators are no longer
efficient and are biased. The variance and standard errors of the estimators would be
understated and t-statistics overstated. It increases the chances of rejecting a null hypothesis
and inferring a significant association between the dependent and independent variables. The
adjusted R2 will also be an unreliable estimate (Gujarati 1995).
Autocorrelation can be formally tested by the Durbin-Watson d statistics (DWDS). The
DWDS ranges between 0 and 4. As a general rule of thumb, a Durbin-Watson d statistic of
approximately two indicates that there is no correlation, zero indicates a perfect positive
44 Consistent with Gujarati, the study uses the terms auto and serial correlation inter changeably. Alternatively, auto correlation can be defined as the lag of a series with itself and serial correlation is a correlation between two time series (Titner 1965).

205
correlation and four a perfect negative correlation. However, there is a DWDS table that can
give specific critical values for the level of significance of 1% and 5%. The table gives a
lower and upper d statistics based on the number of observations and dependent variables. A
d statistic that lies between the critical values means that there is no inconclusive evidence of
autocorrelation. The DWDS value for each equation estimated is shown in the appendices.
5. The error term has a constant variance or homoscedastic (no heteroscedasticity)
Homoscedastic is when “individual Y values are spread around their mean values with the
same variance (Gujarati 1995, p. 154).” If the variance of the error term of the individual
cross sectional unit is not constant, the assumption is violated and there is heteroscedasticity.
The error term represents other independent variables that may potentially affect the level of
disclosure of scores but are not accounted for in the model. For example, changes in the
Malaysian political scene may influence government linked companies more than other
companies. These changes may affect the GLCs disclosure policies on executive
remuneration. Thus, there can be a higher variability in the level of disclosure of the GLCs
compared to other companies. The variance of the error term is no longer constant between
the different companies and this leads to heteroscedasticity. In addition, the study uses a
sample of cross sectional data (companies) that represents different segments of the
Malaysian market for example small, medium and large companies. This can lead to some
scale effect that may lead to heteroscedasticity (Gujarati 1995). The presence of outliers may
also lead to a non-constant variance of the error term. In the presence of heteroscedasticity,
the estimates are still linear and unbiased but they do not have a minimum variance. The
standard error of the co-efficient would be over (under)estimated and the t-statistic would be
under (over)estimated. The statistical inferences made will no longer be valid as the

206
confidence intervals, the t-tests and the F-test of the level of significance are also incorrect.
Any conclusions can be misleading.
Visual inspection of the residual plots reveals outliers and the pooling of various segments of
the market leads to an assumption of a high probability of heteroscedasticity in the datasets.
The Lagrange Multiplier (LM) Breusch–Pagan test was manually coded and run to test for
the presence of heteroscedasticity. The null hypothesis of the test is that there is no
heteroscedasticity. If the chi-square value of the LM statistic has a higher value than the
critical chi-square value, the null hypothesis is rejected and there is a significant probability
of heteroscedasticity. The study adopts a critical chi-square at the level of significance of 5%
and the degree of freedom is based on the number of independent variables excluding the
constant and error terms.
6. No explanatory variable is a perfect linear function of any other explanatory variable
(no perfect multicollinearity)
Multicollinearity occurs when two explanatory variables significantly influence each other. If
the association is perfectly linear, then there is perfect multicollinearity. When there is a
perfect multicollinearity between two explanatory variables, the regression cannot find
unique estimates of all factors since the standard errors are infinite (Gujarati 1995). No valid
statistical conclusions can be made from the analysis. Although it will not violate the sixth
assumption, an imperfect but high level of multicollinearity can influence the efficiency of
OLS estimates. For example, an improvement in company profitability may also improve the
assets of the company. If the correlation between these two variables is high, it may create

207
problems with the analysis. A high correlation may lead to higher variance and standard error
of the estimates, larger confidence intervals and insignificant t-statistics. The adjusted R2 may
be higher but with only a few significant t-statistics (Gujarati 1995).
The degree of multicollinearity can be measured by looking at a correlation matrix and
variance inflation factor (VIF). A Pearson correlation matrix gives a pair wise correlation
value that ranges between -1 to +1. Perfect multicollinearity is when the value is at either -1
or +1. A common threshold for a high degree of multicollinearity is at the absolute value of
0.80 (Gujarati 1995). A variance inflation factor of more than 5 is an accepted threshold of a
multicollinearity problem. Unlike the Pearson correlation matrix that only gives a pair wise
correlation value, the VIF considers the correlation coefficient of an explanatory variable
against all other explanatory variables.
7. The error term is normally distributed
The error term is normally distributed when the mean is zero and the variance is constant. A
normal distribution allows for a comparison of the estimators and the real values of a
population. The Central Limit Theorem states that when there is a large sample size, with
some exceptions, the distribution of the error term is more likely to be normal. The Jarque –
Bera test can be applied to test for normality. The test is based on the model residual. The
null hypothesis states that the error term is normally distributed. If the null hypothesis is
rejected at the applied level of significance then the error term may be inferred to be not
normally distributed. Although this assumption is operational, it is not required under the
Gauss Markov Theorem. A model can still be BLUE (Best Linear Unbiased Estimators) even

208
if the error term is not normally distributed as long as Assumptions I to VI hold. The results
of the Jarque-Bera tests are reported in the Appendix.
6.3.2 Model specifications
This section described the results of the tests run to test the consistency of the models to the
Gauss Markov Theorem. The tests are first conducted on the basic models or equations
(Equation 1 and Equation 2). Further tests are then conducted on the advanced models or
equations that included winsorised estimates, industry classifications, disclosure of individual
remuneration, period analysis and comparative analysis of high and low scoring groups. In
total, there are 26equations that are tested.
6.3.2.1 Serial correlation
The (un-weighted) Durbin-Watson d statistics of the models show that there is problem of
serial correlation in the dataset (see Appendix 10 to 23). Their values are less than 2 and are
indications of serial correlation. Consistent with Clarkson et al. (2006), the study adopts panel
Generalised Least Square (GLS) that corrects for serial or autocorrelation in panel regression.
A panel GLS model incorporates the nature of autocorrelation and heteroscedasticity in the
estimation by transforming the variables with each company weight. A panel OLS model
does not allow for this. If there is no autocorrelation and heteroscedasticity, the estimates of
OLS and GLS should be consistent with each other (Gujarati 1995).
6.3.2.1 Heteroscedasticity
The results of the Lagrange Multiplier (LM) Breusch–Pagan tests on the models show that
there are problems with heteroscedasticity in the dataset. All the LM tests except for
Equations 11 and 14 rejected the null hypothesis that there was no heteroscedasticity. The
LM statistics are significantly higher than the critical Chi-square values at a level of
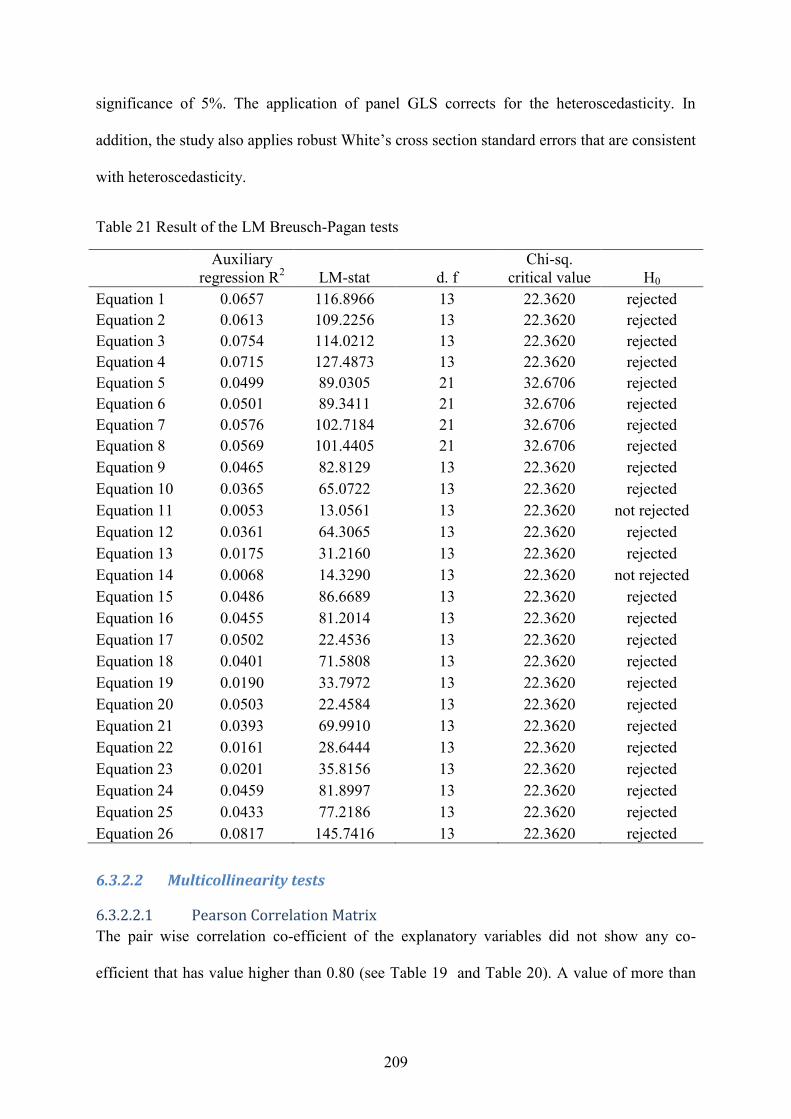
209
significance of 5%. The application of panel GLS corrects for the heteroscedasticity. In
addition, the study also applies robust White’s cross section standard errors that are consistent
with heteroscedasticity.
Table 21 Result of the LM Breusch-Pagan tests
Auxiliary regression R2 LM-stat d. f
Chi-sq. critical value H0
Equation 1 0.0657 116.8966 13 22.3620 rejected Equation 2 0.0613 109.2256 13 22.3620 rejected Equation 3 0.0754 114.0212 13 22.3620 rejected Equation 4 0.0715 127.4873 13 22.3620 rejected Equation 5 0.0499 89.0305 21 32.6706 rejected Equation 6 0.0501 89.3411 21 32.6706 rejected Equation 7 0.0576 102.7184 21 32.6706 rejected Equation 8 0.0569 101.4405 21 32.6706 rejected Equation 9 0.0465 82.8129 13 22.3620 rejected Equation 10 0.0365 65.0722 13 22.3620 rejected Equation 11 0.0053 13.0561 13 22.3620 not rejected Equation 12 0.0361 64.3065 13 22.3620 rejected Equation 13 0.0175 31.2160 13 22.3620 rejected Equation 14 0.0068 14.3290 13 22.3620 not rejected Equation 15 0.0486 86.6689 13 22.3620 rejected Equation 16 0.0455 81.2014 13 22.3620 rejected Equation 17 0.0502 22.4536 13 22.3620 rejected Equation 18 0.0401 71.5808 13 22.3620 rejected Equation 19 0.0190 33.7972 13 22.3620 rejected Equation 20 0.0503 22.4584 13 22.3620 rejected Equation 21 0.0393 69.9910 13 22.3620 rejected Equation 22 0.0161 28.6444 13 22.3620 rejected Equation 23 0.0201 35.8156 13 22.3620 rejected Equation 24 0.0459 81.8997 13 22.3620 rejected Equation 25 0.0433 77.2186 13 22.3620 rejected Equation 26 0.0817 145.7416 13 22.3620 rejected
6.3.2.2 Multicollinearity tests
6.3.2.2.1 Pearson Correlation Matrix
The pair wise correlation co-efficient of the explanatory variables did not show any co-
efficient that has value higher than 0.80 (see Table 19 and Table 20). A value of more than

210
0.80 indicates high correlation between two of the explanatory variables. This result indicates
that there is no serious problem of multicollinearity that can undermine the models.
6.3.3.2.2 Variance Inflation Factors
The result of the VIF test also showed that no explanatory variable had a VIF value of more
than 5 (Table 22 to
Table 23). The highest value is 4.0390 for director ownership of between 10% and 25%. This
is consistent with the results of the correlation matrix (Table 24). There is no high
multicollinearity observed in the models.

211
Table 22 Variance inflation factors for total score
Variable Coefficient Variance Centered VIF FAM_OWN 0.0004 2.7565
SUBT_OWN 0.0005 1.4263
GOV 0.0006 1.7573
FORGN_OWN 0.0003 1.4722
DDIROWN01 57.1995 1.2964
DDIROWN0125 0.0028 4.0390
DDIROWN0025 0.0023 3.9475
DEBT_TO_EQUITY 0.0000 1.4684
PROP_INDDIR 0.0008 1.2923
AQ 0.0000 1.2362
LN_ASSET 0.0000 1.7714
ROE 0.0000 1.2842
MARKETOBOOK 0.0000 1.6646
Table 23 Variance inflation factors voluntary score
Variable Coefficient Variance Centered VIF FAM_OWN 0.0005 2.7758 SUBT_OWN 0.0006 1.3954 GOV 0.0007 1.6592 FORGN_OWN 0.0004 1.4800 DDIROWN01 68.6909 1.2933 DDIROWN0125 0.0034 3.9759 DDIROWN0025 0.0027 3.9006 DEBT_TO_EQUITY 0.0000 1.4286 PROP_INDDIR 0.0010 1.2853 AQ 0.0001 1.2087 LN_ASSET 0.0000 1.6843 ROE 0.0000 1.2630 MARKETOBOOK 0.0000 1.6747

212
Table 24 Correlation matrix for independent variables - quartile director ownership
FAM OWN
SUBT GOV FORGN DDIR DDIR DDIR DEBT PROP AQ LN ROE MARKET
OWN OWN OWN01 OWN 0125 OWN0025 TO EQUITY INDDIR ASSET TO BOOK
FAM OWN 1.0000
-----
SUBT OWN 0.1837 1.0000
0.0000 -----
GOV -0.2170 0.2748 1.0000
0.0000 0.0000 -----
FORGN OWN -0.1087 0.1845 -0.1381 1.0000
0.0000 0.0000 0.0000 -----
DDIROWN01 -0.1592 0.0349 0.1021 0.0093 1.0000
0.0000 0.1404 0.0000 0.6956 -----
DDIROWN0125 0.6094 0.0580 -0.3433 -0.1340 -0.2185 1.0000
0.0000 0.0143 0.0000 0.0000 0.0000 -----
DDIROWN0025 0.6649 0.2808 -0.2503 -0.1414 -0.1625 0.7402 1.0000
0.0000 0.0000 0.0000 0.0000 0.0000 0.0000 -----
DEBT_TO_EQUITY -0.0285 -0.0123 0.0732 -0.0539 -0.0069 -0.0857 -0.0736 1.0000
0.2290 0.6026 0.0020 0.0229 0.7712 0.0003 0.0019 -----
PROP_INDDIR -0.1970 -0.1184 -0.0215 -0.0459 -0.0153 -0.1147 -0.0883 0.0632 1.0000
0.0000 0.0000 0.3634 0.0526 0.5185 0.0000 0.0002 0.0076 -----
AQ -0.0909 0.1425 0.1192 0.1636 0.0655 -0.0903 -0.0693 0.0057 0.0666 1.0000
0.0001 0.0000 0.0000 0.0000 0.0056 0.0001 0.0034 0.8094 0.0049 -----
LN_ASSET -0.0892 0.0985 0.2584 0.1324 0.1614 -0.1367 -0.1184 0.2292 0.0097 0.1771 1.0000
0.0002 0.0000 0.0000 0.0000 0.0000 0.0000 0.0000 0.0000 0.6836 0.0000 -----
ROE -0.0009 0.0369 0.0033 0.0528 -0.0012 -0.0255 -0.0035 -0.3034 0.0173 0.0166 0.0049 1.0000
0.9697 0.1195 0.8880 0.0256 0.9601 0.2819 0.8838 0.0000 0.4661 0.4833 0.8377 -----
MARKETOBOOK -0.0715 0.0626 0.0318 0.1109 0.0038 -0.1107 -0.0721 0.2863 0.0183 0.0800 0.0665 -0.1020 1.0000
0.0025 0.0082 0.1798 0.0000 0.8713 0.0000 0.0023 0.0000 0.4408 0.0007 0.0050 0.0000 -----

213
6.3.2.1 Summary of the BLUEness of the models
The tests show that there are violations of the Gauss-Markov Theorem. Assumptions IV and
V are violated with the detection of possible serial correlation and heteroscedasticity. If there
is no correction to the models, they will not give the best linear and unbiased estimators
(BLUE). This will affect the validity of any statistical inference. The study adopts panel
Generalised Least Square (GLS) that corrects for serial or autocorrelation and
heteroscedasticity in panel regression. Clarkson et al. (2005) argued that a panel GLS would
give a more efficient estimate as it takes into account the companies’ individual correlation
coefficients in estimating the autoregressive parameters of each company. A
heteroscedasticity consistent standard error is also applied to ensure the robustness of the
models. These procedures resolve the problems identified from the diagnostic tests and
ensure that the models are consistent with the Gauss-Markov Theorem.
6.3.2.2 Additional assumption for panel data: fixed effect estimator
The study applies panel data multivariate regression that incorporates cross sectional
(companies) and time (years) dimensions. Unlike pooled regressions that combine all cross
sectional units and years into a collective sample, panel data allows for the individual
companies to retain their identification and for the years to be distinct. Panel regression also
takes into account the heterogeneity or the individuality of companies and years. The
individual characteristics may not have been captured by the model’s explanatory variables.
For example, executive directors’ management style, the enforcement of disclosure
requirements, the public reputation of a company and other unobserved variables may
influence the level of disclosure of executive directors’ remuneration for a specific company.
Furthermore, one specific year may have a unique effect on the level of disclosure more than
the rest of the sample years. For example, the level of disclosure in 2001 may be unique
compares to the other years since it was the first year that the MCCG was introduced.

214
These unobserved effects would be captured by the error term. The error term can be
represented by:
u it = μ it + υ it
The u it is the error term that consists of μ it that is the individual unobserved effects and υ it is
other disturbances that affect all sample units and times (Baltagi 2008). If there is any
correlation between the unobserved effects and explanatory variables, the estimates may be
inconsistent and biased. This would be a violation of assumption III of the Gauss Markov
Theorem that there is no correlation between the explanatory variables and the error term.
The unobserved effects can be either fixed or random across the cross sections and time
periods. The Hausman’s specification test is used to test whether to include fixed or random
effects in the panel regressions. The Hausman’s specification test null hypothesis is that
individual effects are uncorrelated with the other explanatory variables when a random effect
is applied. If the null hypothesis is rejected the fixed effects should be applied. A fixed effect
model assumes that the coefficient and intercepts of the individual unit is constant across
time.
The Hausman’s specification tests except for Equations 24 and 26 (Table 25) reject the null
hypotheses of random effects. The study adopts fixed effects estimates in all of the models45.
It is important to note that, the study assumes a one way cross sectional effect that creates a
dummy variable for each company (n = 200). The time period effect is applied manually by
creating dummy variables for the years. This allows for the application of panel GLS. A
45 The study decided to apply fixed effect estimates on Equation 24 and Equation 26 given that the result of the redundant fixed effect tests are more robust as it allows for the use of robust standard error that correct for heteroscedasticity.

215
panel GLS cannot be applied automatically with both cross-sectional and period fixed effects
simultaneously selected in the Eviews software. However, creating dummy year variables
allows for both effects to be manually applied at the same time.
Table 25 Hausman's specification tests
Chi-Sq. Statistic Probability Equation1 64.0267 0.0000 Equation 2 49.0961 0.0001 Equation 3 – 4* Not available Equation 5 61.6247 0.0000 Equation 6 47.0047 0.0001 Equation 7 – 8* Not available Equation 9 – 10** Not applicable Equation 11*** Not applicable Equation 12 34.1507 0.0011 Equation 13 29.6021 0.0054 Equation 14*** Not applicable Equation 15 34.3761 0.0011 Equation 16 24.9547 0.0234 Equation 17*** Not applicable Equation 18 33.9662 0.0012 Equation 19 31.1607 0.0032 Equation 20*** Not applicable Equation 21 33.9233 0.0012 Equation 22 25.1132 0.0223 Equation 23 44.3312 0.0021 Equation 24 19.2969 0.5661 Equation 25 44.3324 0.0021 Equation 26 23.3685 0.3247 * The models included dummies for industry classifications that will not allow for simultaneous random effect estimates because it will create duplicate dummy individual dummy variables for each company. ** The models are logit regressions that do not allow for fixed or random effects. *** The models are annual OLS regressions that do not allow for fixed or random effects.
As a robustness test, the Redundant Fixed Effect tests were also run to test the validity of the
inclusion of the cross sectional individual fixed effects in the models. The null hypothesis of
the Redundant Fixed Effect test is that the fixed effects are not necessary or redundant. All
results reject the hypothesis that the cross - sectional fixed effects are redundant (Table 26).

216
Table 26 Redundant Fixed Effect Tests for cross section fixed effects
Statistics Degree of freedom Probability Equation1 19.6646 (199, 1566) 0.0000 Equation 2 19.5622 (199, 1566) 0.0000 Equation 3 – 4* Not available Equation 5 18.8717 (199, 1566) 0.0000 Equation 6 18.6773 (199, 1566) 0.0000 Equation 7 – 8* Not available Equation 9 – 10** Not applicable Equation 11*** Not applicable Equation 12 25.2649 (199, 579) 0.0000 Equation 13 14.1551 (199, 573) 0.0000 Equation 14*** Not applicable Equation 15 6.2261 (199, 582) 0.0000 Equation 16 12.9626 (199, 576) 0.0000 Equation 17*** Not applicable Equation 18 23.9281 (199, 579) 0.0000 Equation 19 103.1019 (199, 573) 0.0000 Equation 20*** Not applicable Equation 21 24.9740 (199, 579) 0.0000 Equation 22 132.0953 (199, 573) 0.0000 Equation 23 11.8200 (197, 489) 0.0000 Equation 24 3.0951 (197, 489) 0.0000 Equation 25 6.7566 (161, 660) 0.0000 Equation 26 4.0180 (197, 721) 0.0000 *The models include dummies for industry classifications that will not allow for simultaneous fixed effect estimates because it will create duplicate dummy individual dummy variables for each company. ** The models are logit regressions that do not allow for fixed or random effects. *** The models are annual OLS regressions that do not allow for fixed or random effects.
6.3.2 Multiple regression result and discussion
This section provides the results of the multiple regression and hypotheses testing.
6.3.2.1 Panel data result
6.3.2.1.1. Hypothesis testing on determinants of total disclosure score
The first equation (Equation 1) analyses the determinants of the total disclosure of executive
directors’ remuneration from 2000 to 2008. The adjusted R-squared value of the model is
84.93% which means that 84.93% of the variation in the total disclosure of executive

217
directors’ remuneration is explained by the explanatory variables. The F-statistic is
significant at the 1% level and means that there is at least one explanatory variable that is
non-zero and significantly influences the level of disclosure. The dummy year variables are
incorporated in the model to test for the evolving disclosure requirements throughout the
sample period. The year 2000 is the base year and is part of the intercept (C). The dummy
years are shown to be statistically significant. The coefficients for the dummy years
significantly increased over time from 0.2622 in 2001 to 0.4193 in 2008. A Wald test of the
equality of the coefficients was also conducted to confirm the statistical differences between
the coefficients (Table 27). The null hypothesis for the Wald test is that the coefficients for a
pair of the dummy years are equal. If the F-test value is significant then the null hypothesis is
rejected and it can be assumed that the coefficient for the individual dummy year is different.
The result of the Wald test rejects the null hypothesis that the coefficients are equal
(p=0.0000). The results are consistent with the findings of the non-parametric testing that
found significant mean differences between the different years. The panel regression result
supports the first hypothesis that there was an improvement in the level of disclosure of
executive directors’ remuneration after the changes in the Malaysian disclosure requirements.
From an agency theory perspective, a family controlled company may disclose less
information to protect the family’s interests (Chen & Jaggi 2000). The directors could be
family members or family associates. The sample shows that on average 20.46% of the
directors on the board are family connected. Extensive disclosure of executive directors’
remuneration may draw attention to the dominance and influence of the family ownership on
company policies. There may also be less demand of information because family
shareholders could use their insider status to gain access of private information without
relying on public disclosure. Consequently, Hypothesis 2 states that there is an inverse

218
association between the level of disclosure of executive directors’ remuneration and the level
of family ownership. The result supports the hypothesis and shows that an increase in 1% in
family ownership significantly decreased the total disclosure of executive directors’
remuneration by 4.88%. The result is consistent with Mohd Ghazali and Weetman (2006)
who found that the influence of a dominant family on the disclosure policies of Malaysian
companies continued even after the introduction of the MCCG. They argued that the
Malaysian market is still held captive by traditional family dominance that exerts significant
power over companies.
The tests reject Hypothesis 3 of an inverse association between ownership concentration
(SUBT_OWN) and the level of disclosure of executive directors’ remuneration. The sign is
as predicted but it is not statistically significant. This is inconsistent with Shan (2009), Luo et.
al (2006), Barako et. al (2006) and Babio and Vazquez (2005). However, the result is
consistent with Depoers (2000) and Raffournier (1995) who also found an insignificant
association between ownership concentration by substantial shareholders and the level of
disclosure. They attributed their insignificant findings to a significant correlation between
company size and ownership concentration. They argued that company size may have
captured the association of ownership on the level of disclosure. In this study, significant pair
wise correlations (but not high) were shown between ownership concentration
(SUBT_OWN) and other ownership variables; family, government and foreign ownership.
These mean that the main substantial shareholders include family, government and foreign
shareholders. In addition, company size also has a significant correlation with shareholder
concentration.

219
Hypothesis 4 states that there is a positive association between the level of government
ownership and the level of disclosure of executive directors’ remuneration. There is a
potential exploitation of other shareholder interests by the government. Eng and Mak (2003)
argued that government linked companies would disclose more information to satisfy the
demand of other shareholders for assurance that their wealth is not being diverted to pursue
pure national interests. The introduction of the MCCG may also have compelled government
linked companies to set an example by complying with the disclosure requirements. Chizema
(2008) found that Germany companies with high state ownership significantly complied with
the KODEX requirements for disclosure of individual executive remuneration. However, the
association was not statistically significant in this study and Hypothesis 4 is rejected. The
insignificant result is consistent with Huafang and Jianguo (2007), Mohd Ghazali and
Weetman (2006), Makhija and Patton (2004).
Foreign shareholders may be exposed to more corporate governance issues than local
shareholders. Geographical and cultural barriers may also lead them to demand more
information to protect their investment (Shan 2009). Consequently, hypothesis 5 states that
there is a positive association between the level of executive directors’ remuneration and the
level of foreign ownership. However, the panel regression rejects this hypothesis. The result
is not consistent with Shan (2009), Huafang and Jianguo (2007), Barako et al. (2006) and
Haniffa and Cooke (2002). However, Chizema (2008) also did not find significant association
between foreign ownership and the level of disclosure. The result may be attributed to the
level of foreign shareholdings in Malaysian companies that is still in a recovery phase post
the financial crisis. Their level of ownership may not be sufficient to exert pressure on
companies’ disclosure policies.

220
Hypothesis 6 is based on the argument that there is a convex association between director
ownership and the level of disclosure. Share ownership is used to align the interests of the
executive directors to that of the shareholders and to mitigate agency problems. Leung and
Horwitz (2004) argued that there was a convex association between the level of directors
ownership and agency costs. At a lower level of director ownership, executive directors may
disclose more about director remuneration to prove that they are working for the interests of
the shareholders. However, at a higher level of ownership, the executive directors may use
their influence to limit the level of disclosure and conceal potential expropriation. Hypothesis
6 was tested using three dummy variables that reflect quartiles in director shareholding
(DDIROWN01, DDIROWN0125 and DDIROWN0025). However, there were no statistically
significant associations between executive directors’ ownership at different quartiles and the
level of disclosure of executive directors’ remuneration. This leads to the rejection of
Hypothesis 6. It is noted that the signs of the coefficients of director ownership below of
10% and between 10 % and 25% are negative and is positive for director ownership of more
than 25%. The result is inconsistent with Leung and Horwitz (2004) and Gelb (2000).
Hypothesis 7 states that there is a positive association between leverage
(DEBT_TO_EQUITY) and the level of disclosure of executive directors’ remuneration.
Creditors are involved in an agency relationship with the companies and have incentives to
demand more information to ensure that executives are not neglecting debt commitments or
covenants (Wallace & Naser 1995). The coefficient sign of the hypothesis testing is
consistent with the prediction but is not statistically significant. Thus, the hypothesis is not
accepted. This may mean that creditors put more emphasis on policies other than executive

221
remuneration in considering the credit worthiness of companies and the risk of default.
Depoers (2000) and Ho and Wong (2001) also did not find significant a association between
leverage and the level of disclosure by French and Hong Kong companies, respectively.
As a third party governance mechanism, independent directors have a role to protect the
interests of shareholders from agency costs. They also have incentives to push for more
disclosure of remuneration to protect their own reputation of impartiality (Liu, Jinghui. &
Taylor 2008). The test result supports hypothesis 8 that a higher proportion of independent
directors is associated with a significantly higher level of disclosure of executive directors’
remuneration. The panel regression shows that an increase of 1% in the proportion of
independent directors on a board improves the level of total disclosure by 7.66%. This result
also invalidates the concerns of Haniffa and Cooke (2002) that Malaysian independent
directors may lack impartiality and effectiveness because they were often nominated by the
controlling parties. This result is consistent with Liu and Taylor (2008), Clarkson et al.
(2006), Babío Arcay and Muiño Vázquez (2005), Leung and Horwitz (2004), Conyon et al.
(2002) and Chen and Jaggi (2000).
The employment of an external auditor is another corporate governance mechanism to protect
the interests of shareholders. It is argued that the employment of a reputable external auditor
improves the level of compliance with disclosure requirements and thus improves the level of
disclosure (Bassett, Koh & Tutticci 2007). Hence, hypothesis 9 states that companies that
have a Big-4 auditor as their external auditor would have a significantly higher level of
disclosure of executive directors’ remuneration than other companies. However, the study
rejects this hypothesis and does not find a significant association between the level of audit

222
quality and the level of disclosure. Other studies that also found insignificant associations
between audit quality and the level of disclosure are Owusu-Ansah (1998), Wallace et al.
(1994) and Cooke (1992).
Hypothesis 10 is based on the perspective of legitimacy theory that companies need to protect
their existence in the market by ensuring that they meet society’s expectations (Lindblom
1983). Company legitimacy may be threatened if the public perceives that they are paying
excessive remuneration without justification. Companies have an incentive to manage the
perceptions of society by disclosing sufficient information about their remuneration schemes
(Liu, Jinghui. & Taylor 2008). The threat to legitimacy may be greater for larger companies
because they are more visible and dependent on society’s approval for their continuance
(Hagerman & Zmijewski 1979). Furthermore, larger companies have been shown to pay their
executives more and are more susceptible to public and political scrutiny. Thus, hypothesis
10 states that there is a positive association between the level of executive directors’
remuneration disclosures and the company size (LN_ASSET). The test supports the
hypothesis. The result is consistent with Shan (2009), Liu and Taylor (2008), Chizema
(2008), Huafang and Jianguo (2007), Clarkson et al. (2006), Hossain et al. (2005) and
Haniffa and Cooke (2002).
According to signalling theory, companies are better off disclosing all information to the
market so that all investors are well informed (Lang & Lundholm 1993). However, good
news tends to be disclosed quicker and more extensively than bad news (Wallace & Naser
1995). Managers of profitable companies may have an incentive to signal their superior
performance over other managers by disclosing more information about their pay and their
223
performance sensitivities. Consequently, hypothesis 11 states that there is a positive
association between profitability (ROE) and the level of disclosure of executive directors’
remuneration. However, the test result does not show a significant association between these
variables and thus hypothesis 11 is rejected. Clarkson et al. (2006), Barako et al. (2006) and
Nelson and Percy (2005) also found an insignificant association between profitability and the
level of disclosure.
Finally, Hypothesis 12 is based on proprietary costs. Companies with higher growth need to
protect their proprietary information. Revealing too much information may lead to significant
proprietary costs. Disclosure of executive directors’ remuneration of a high growth company
may attract bids from rival companies that seek to lure the managerial talents to their
companies. Hence, the hypothesis states that companies with high growth
(MARKETOBOOK) are associated with less disclosure of executive directors’ remuneration.
However, the test result is not significant and does not support the hypothesis. Clarkson et al.
(2006), Mohd Ghazali and Weetman (2006), Eng and Mak (2003) and Cahan and Hossain
(1996) also did not find a significant association between proprietary costs and the level of
disclosure.

224
Equation 1 Panel GLS result of determinants of total score from 2000 to 2008 (N=1783)
Variable Pred. sign Coefficient t-Statistic Prob. C
-0.3246 -6.7791 0.0000 ***
FAM_OWN - -0.0555 -3.4825 0.0005 ***
SUBT_OWN - 0.0265 1.2403 0.2151 GOV + 0.0314 1.5877 0.1125 FORGN_OWN + -0.0093 -0.7037 0.4817 DDIROWN01 ? -2.0507 -0.8417 0.4001 DDIROWN0125 ? 0.0281 1.1059 0.2689 DDIROWN0025 ? -0.0085 -0.4697 0.6386 DEBT_TO_EQUITY + 0.0003 1.1795 0.2384 PROP_INDDIR + 0.0386 2.2807 0.0227 **
AQ + 0.0078 0.9541 0.3402 LN_ASSET + 0.0382 13.0287 0.0000 ***
ROE + 0.0011 0.6757 0.4993 MARKETOBOOK - -0.0005 -0.7294 0.4659 δ2001
0.2622 261.7847 0.0000 ***
δ2002
0.3178 205.9616 0.0000 *** δ2003
0.3439 152.4062 0.0000 ***
δ2004
0.3590 160.7391 0.0000 ***
δ2005
0.3645 172.1245 0.0000 *** δ2006
0.3749 175.2868 0.0000 ***
δ2007
0.3918 179.8875 0.0000 *** δ2008
0.4193 170.6199 0.0000 ***
R-squared 0.8679 F-statistics 46.5882 Adjusted R-squared 0.8493 F-significance 0.0000 ***level of significance at 1% **level of significance at 5% *level of significance at 10%
Table 27 Result of Wald test of equality of coefficients
Probability δ2001 0.0000 δ2002 0.0000 0.0000 δ2003 0.0000 0.0000 0.0000 δ2004 0.0000 0.0000 0.0000 0.0000 δ2005 0.0000 0.0000 0.0000 0.0000 0.0000 δ2006 0.0000 0.0000 0.0000 0.0000 0.0000 0.0000 δ2007 0.0000 0.0000 0.0000 0.0000 0.0000 0.0000 0.0000 δ2008 0.0000 0.0000 0.0000 0.0000 0.0000 0.0000 0.0000 0.0000
δ2000
(intercept) δ2001 δ2002 δ2003 δ2004 δ2005 δ2006 δ2007

225
6.3.3.1.2 Hypothesis testing on determinants of voluntary disclosure score
The second equation (Equation 2) examines the determinants of voluntary disclosure of
executive directors’ remuneration from 2000 to 2008. The level of voluntary disclosure is
measured as the percentage of disclosure score in excess of the Malaysian mandatory
disclosure requirements. The adjusted R-square of the model is 83.72% that means that
81.43% of the variation in the voluntary disclosure of executive directors’ remuneration is
explained by the explanatory variables. The F-statistic is significant at 1% level and means
that there is at least one explanatory variable that is non-zero and significantly influences the
level voluntary of disclosure. The dummy coefficients for the years are statistically
significant and increase over the years. The result supports hypothesis 1 that the reforms to
the executive directors’ remuneration disclosure framework improves the level of disclosure
of executive directors’ remuneration of Malaysian companies. The result of the Wald test on
the equality of the coefficients (Table 27) also rejects the null hypothesis that the coefficients
are equal.
Consistent with the first equation, Equation 2 accepts hypothesis 2 that family ownership is
significantly and negatively associated with the level of voluntary disclosure of executive
directors’ remuneration. In addition, Hypothesis 8 is accepted. The hypothesis states that the
proportion of independent directors and the level of voluntary disclosure are positively
associated. The analysis also shows that company size is significantly and positively
associated with the level of voluntary disclosure. This means that hypothesis 10 is also
accepted. However, contrary to the first equation, the analysis finds that government
ownership significantly and positively influences the level of voluntary disclosure of
executive directors’ remuneration. This supports the argument that government linked
companies have incentives to set examples in the market. The result is consistent with Shan

226
(2009), Huafang and Jianguo (2007), Mohd Ghazali and Weetman (2006) and Makhija and
Patton (2004) who also found a significant and positive association between government
ownership and the level of voluntary disclosure. The tests found that all the other hypotheses
were not significant and were therefore rejected.

227
Equation 2 Panel GLS result of determinants of voluntary score from 2000 to 2008 (N=1783)
Variable Pred. sign Coefficient t-Statistic Prob. C
-0.3131 -5.1446 0.0000 ***
FAM_OWN - -0.0568 -3.8074 0.0001 *** SUBT_OWN - 0.0256 1.1162 0.2645
GOV + 0.0572 2.6449 0.0083 *** FORGN_OWN + -0.0269 -1.5657 0.1176
DDIROWN0025 ? -3.6957 -1.3839 0.1666 DDIROWN01 ? 0.0258 0.9417 0.3465 DDIROWN0125 ? -0.0039 -0.1723 0.8633 DEBT_TO_EQUITY + 0.0003 1.3326 0.1829 PROP_INDDIR + 0.0494 2.7773 0.0055 ***
AQ + 0.0054 0.6009 0.5480 LN_ASSET + 0.0372 10.2120 0.0000 ***
ROE + 0.0016 0.7569 0.4492 MARKETOBOOK - -0.0006 -0.8475 0.3968 δ2001
0.2257 251.8193 0.0000 ***
δ2002
0.2842 181.2903 0.0000 *** δ2003
0.3124 136.3586 0.0000 ***
δ2004
0.3295 143.8307 0.0000 *** δ2005
0.3250 140.2951 0.0000 ***
δ2006
0.3308 143.6978 0.0000 *** δ2007
0.3446 142.1033 0.0000 ***
δ2008
0.3753 134.5635 0.0000 *** R-squared 0.8372 F-statistics 36.5104 Adjusted R-squared 0.8143 F-significance 0.0000 ***level of significance at 1% **level of significance at 5% *level of significance at 10%
Table 28 Result of Wald test of equality of coefficients
Probability δ2001 0.0000 δ2002 0.0000 0.0000 δ2003 0.0000 0.0000 0.0000 δ2004 0.0000 0.0000 0.0000 0.0000 δ2005 0.0000 0.0000 0.0000 0.0000 0.0000 δ2006 0.0000 0.0000 0.0000 0.0000 0.0000 0.0000 δ2007 0.0000 0.0000 0.0000 0.0000 0.0000 0.0000 0.0000 δ2008 0.0000 0.0000 0.0000 0.0000 0.0000 0.0000 0.0000 0.0000
δ2000
(intercept) δ2001 δ2002 δ2003 δ2004 δ2005 δ2006 δ2007
228
6.3.3 Sensitivity analysis
6.3.3.1 Winsorised data
The descriptive statistics show that the dataset is significantly skewed and not normally
distributed (Appendix 4). This suggests the presence of outliers in the variables. Although
they do not affect the validity of the estimates, they can affect the accuracy of the estimates to
the true population values and may lead to spurious regressions. As a robustness test,
winsorisation is applied to a number of the independent variables that have extreme outliers.
The independent variables are FAM_OWN, SUBT_OWN, GOV, FORGN_OWN,
DEBT_TO_EQUITY, ROE and MARKETOBOOK. Prior studies that have used this method
were Cassar and Holmes (2003) and Deegan and Hallam (1991). A winsorisation does not
remove the outliers from the sample but limits the extreme values of the distribution by
replacing them with the average values of the percentiles. In this study, a winsorisation of
99.5% is adopted where the values below the 0.25th percentile are set to the average value of
the 0.25th percentile. On the other hand, the values above the 99.75th percentile are set to the
average value of the 99.75th percentile. The results obtain from the winsorised estimators are
mostly consistent with the first and second equations.
However, in equations 3 and 4, the winsorised estimates did not reject the hypothesis of
positive association between government ownership and the level of total disclosure of
executive directors’ remuneration. However, the positive association is weak as it is only
accepted at 10% level of significance. The positive association may have been partly due to
the highly positive and significant association between government ownership and the level
of voluntary disclosure as seen in Equations 2 and 4.

229
In addition, the winsorised estimate accepts hypothesis 11 that there is a positive association
between profitability and the level of disclosure. The association is weakly accepted at a 10%
level of significance. The profitability shows a significant variance from a maximum of
27.6506% to a minimum of -3.8931% and a mean of 0.0649. The winsorisation considered
the outliers and would have provided a more precise estimate of the association between
profitability and the level of disclosure. Although the association is weakly significant, it
indicates that profitability may influence the level of disclosure to a certain extent.

230
Equation 3 Panel GLS regression for determinants of total score using winsorised estimators (N = 1783)
Variable Coefficient t-Statistic Prob. C -0.3290 -7.3205 0.0000 ***
FAM_OWN -0.0632 -4.6208 0.0000 *** SUBT_OWN 0.0345 1.5192 0.1289
GOV 0.0331 1.8152 0.0697 * FORGN_OWN -0.0138 -0.8911 0.3730
DDIROWN01 -0.0049 -0.2709 0.7865 DDIROWN0125 -1.6813 -0.6637 0.5070 DDIROWN0025 0.0243 0.8995 0.3685 DEBT_TO_EQUITY -0.0006 -0.9546 0.3399 PROP_INDDIR 0.0447 2.7510 0.0060 ***
AQ 0.0085 1.0435 0.2969 LN_ASSET 0.0384 13.5664 0.0000 ***
ROE 0.0059 1.6822 0.0927 * MARKETOBOOK -0.0013 -0.8296 0.4069
δ2001 0.2607 262.8457 0.0000 *** δ2002 0.3173 218.7111 0.0000 *** δ2003 0.3433 184.3337 0.0000 *** δ2004 0.3589 182.7359 0.0000 *** δ2005 0.3638 190.6225 0.0000 *** δ2006 0.3740 193.7219 0.0000 *** δ2007 0.3902 212.1479 0.0000 *** δ2008 0.4182 181.3461 0.0000 *** R-squared 0.8678 F-statistics 46.5862 Adjusted R-squared 0.8491 F- significance 0.0000
Equation 4 Panel GLS regression for determinants of voluntary score using winsorised estimators (N=1783)
Variable Coefficient t-Statistic Prob. C -0.3167 -5.2818 0.0000 ***
FAM_OWN -0.0658 -4.9664 0.0000 *** SUBT_OWN 0.0343 1.4122 0.1581
GOV 0.0629 3.1349 0.0018 *** FORGN_OWN -0.0297 -1.5547 0.1202
DDIROWN01 0.0004 0.0173 0.9862 DDIROWN0125 -3.2407 -1.1477 0.2513 DDIROWN0025 0.0226 0.7926 0.4281 DEBT_TO_EQUITY -0.0006 -0.7349 0.4625 PROP_INDDIR 0.0557 3.1996 0.0014 ***
AQ 0.0062 0.6937 0.4880 LN_ASSET 0.0373 10.0650 0.0000 ***
ROE 0.0074 1.6804 0.0931 * MARKETOBOOK -0.0021 -1.1460 0.2520
δ2001 0.2243 207.1120 0.0000 *** δ2002 0.2836 172.3013 0.0000 *** δ2003 0.3115 163.1314 0.0000 *** δ2004 0.3293 160.3209 0.0000 *** δ2005 0.3236 146.0091 0.0000 *** δ2006 0.3296 151.9969 0.0000 *** δ2007 0.3429 176.1335 0.0000 *** δ2008 0.3740 132.9012 0.0000 *** R-squared 0.8367 F-statistics 36.3657 Adjusted R-squared 0.8136 F- significance 0.0000

231
6.3.3.2 Industry classifications
Another factor that may influence the level of disclosure is industry classifications. Prior
studies that have included industry classifications in their empirical framework were Shan
(2009), Chizema (2008), Coulton et al. (2001) and Conyon et al. (2002). However, the use of
panel GLS with cross sectional fixed effects does not allow for the introduction of dummies
for industry classifications. The application of cross sectional fixed effects that creates
dummies for individual companies and a dummy for each industry classification
simultaneously leads to perfect multicollinearity. Under perfect multicollinearity, the
regression analysis cannot be computed. As a robustness test, the study removed the cross
sectional fixed effects from the models and retested the equations by including dummies for
industry classifications. Equation 5 and Equation 7 supports the hypothesis that industry
classifications may be associated with the level of total and voluntary disclosure of executive
directors’ remuneration. In Equation 5 (y=total score), the Healthcare industry has the highest
coefficient of 0.3150 and the lowest is the Energy sector at 0.1353. Similar results are seen in
Equation 7 (y=voluntary score). The coefficient of the Healthcare industry is 0.3309 and for
the Energy industry it is 0.1093. The analysis is repeated using the winsorised estimators
(Equation 6 and Equation 8) and the results are consistent with the original equations.
However, it should be noted that the removal of the cross sectional fixed effects from the
original equations affects the adjusted R-squared significantly. The original equation for the
determinants of total score (Equation 1) is 84.93% and after removal of the cross sectional
fixed effects (Equation 5) the adjusted R-squared is 58.04%. Similar observation can be made
on the determinants of voluntary score. The adjusted R-squared of the original equation
(Equation 2) is 81.43% and the adjusted R-squared of the cross sectional fixed effect free
equation (Equation 6) is 66.73%. These imply that the cross sectional fixed effect models are

232
more sensitive to the variations in the sample. They represent the heterogeneity of the
individual company and not just the specific industry. Due to this limitation, the other results
in Equation 5 and 6 are not reported as they are not the best estimates of the determinants of
the disclosure of executive directors’ remuneration.

233
Equation 5 Panel GLS result of determinants of total score from 2000 to 2008 including industry classifications (N=1783)
Variable Coefficient t-Statistic Prob. C -0.1080 -2.8292 0.0047
FAM_OWN -0.0037 -0.6181 0.5366 SUBT_OWN -0.0575 -2.8114 0.0050 GOV 0.0356 1.7794 0.0753 FORGN_OWN -0.0198 -1.5237 0.1278 DDIROWN01 -2.8082 -0.9088 0.3636 DDIROWN0125 -0.0357 -1.9233 0.0546 DDIROWN0025 0.0381 1.5054 0.1324 DEBT_TO_EQUITY -0.0005 -1.2291 0.2192 PROP_INDDIR -0.0230 -1.2889 0.1976 AQ 0.0337 5.8875 0.0000 LN_ASSET 0.0063 3.8806 0.0001 ROE 0.0048 1.5321 0.1257 MARKETOBOOK 0.0007 1.3575 0.1748 δ2001 0.2624 319.1659 0.0000 ***
δ2002 0.3178 386.4685 0.0000 *** δ2003 0.3457 482.0684 0.0000 *** δ2004 0.3679 418.5329 0.0000 *** δ2005 0.3759 379.3659 0.0000 *** δ2006 0.3905 341.4913 0.0000 *** δ2007 0.4137 319.7763 0.0000 *** δ2008 0.4456 404.3651 0.0000 *** CONSUMER_DISCRETIONARY 0.2538 7.6495 0.0000 *** CONSUMER_STAPLES 0.2397 7.1167 0.0000 *** FINANCIALS 0.2512 8.3400 0.0000 *** ENERGY 0.1353 2.6689 0.0077 *** HEALTHCARE 0.3150 6.6010 0.0000 *** MATERIALS 0.2081 7.2549 0.0000 *** UTILITIES 0.2176 7.4535 0.0000 *** INDUSTRIALS 0.2267 7.1445 0.0000 *** INFORMATION_TECHNOLOGY 0.2607 8.1428 0.0000 *** R-squared 0.5875 F-statistics 83.1585 Adjusted R-squared 0.5804 F- significance 0.0000 ***level of significance at 1% **level of significance at 5% *level of significance at 10%
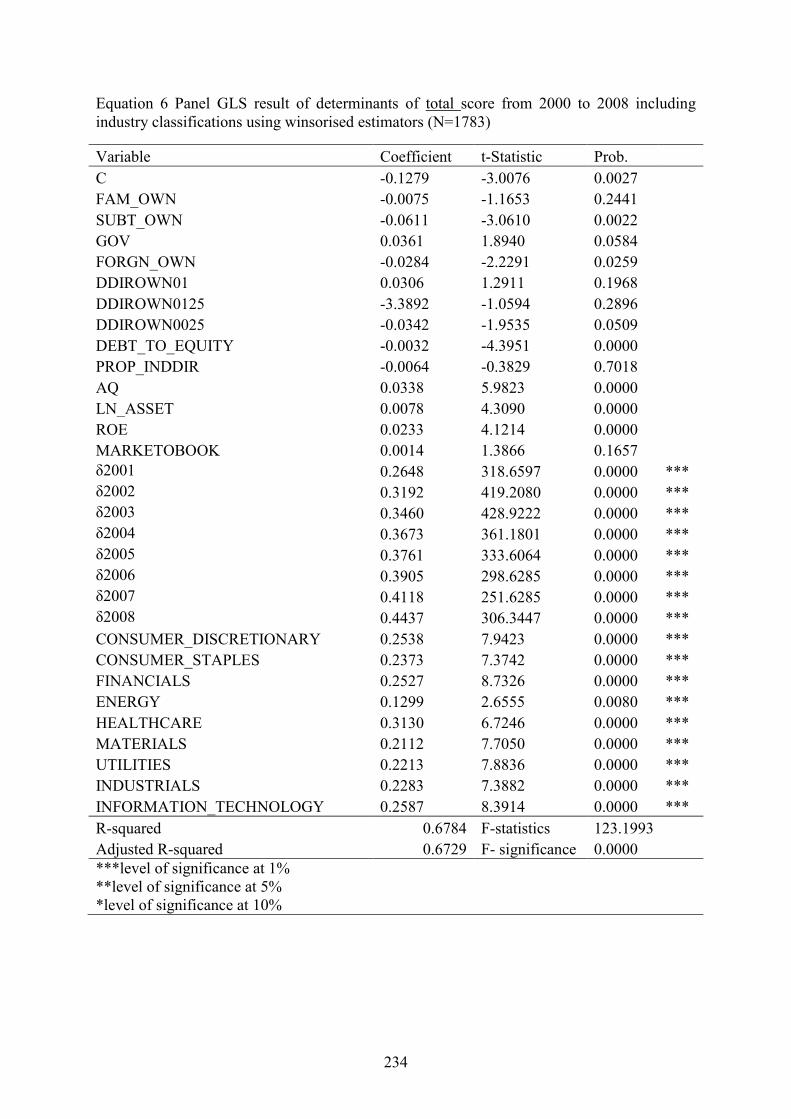
234
Equation 6 Panel GLS result of determinants of total score from 2000 to 2008 including industry classifications using winsorised estimators (N=1783)
Variable Coefficient t-Statistic Prob. C -0.1279 -3.0076 0.0027
FAM_OWN -0.0075 -1.1653 0.2441 SUBT_OWN -0.0611 -3.0610 0.0022 GOV 0.0361 1.8940 0.0584 FORGN_OWN -0.0284 -2.2291 0.0259 DDIROWN01 0.0306 1.2911 0.1968 DDIROWN0125 -3.3892 -1.0594 0.2896 DDIROWN0025 -0.0342 -1.9535 0.0509 DEBT_TO_EQUITY -0.0032 -4.3951 0.0000 PROP_INDDIR -0.0064 -0.3829 0.7018 AQ 0.0338 5.9823 0.0000 LN_ASSET 0.0078 4.3090 0.0000 ROE 0.0233 4.1214 0.0000 MARKETOBOOK 0.0014 1.3866 0.1657 δ2001 0.2648 318.6597 0.0000 ***
δ2002 0.3192 419.2080 0.0000 *** δ2003 0.3460 428.9222 0.0000 *** δ2004 0.3673 361.1801 0.0000 *** δ2005 0.3761 333.6064 0.0000 *** δ2006 0.3905 298.6285 0.0000 *** δ2007 0.4118 251.6285 0.0000 *** δ2008 0.4437 306.3447 0.0000 *** CONSUMER_DISCRETIONARY 0.2538 7.9423 0.0000 *** CONSUMER_STAPLES 0.2373 7.3742 0.0000 *** FINANCIALS 0.2527 8.7326 0.0000 *** ENERGY 0.1299 2.6555 0.0080 *** HEALTHCARE 0.3130 6.7246 0.0000 *** MATERIALS 0.2112 7.7050 0.0000 *** UTILITIES 0.2213 7.8836 0.0000 *** INDUSTRIALS 0.2283 7.3882 0.0000 *** INFORMATION_TECHNOLOGY 0.2587 8.3914 0.0000 *** R-squared 0.6784 F-statistics 123.1993 Adjusted R-squared 0.6729 F- significance 0.0000 ***level of significance at 1% **level of significance at 5% *level of significance at 10%

235
Equation 7 Panel GLS result of determinants of voluntary score from 2000 to 2008 including industry classifications (N=1783)
Variable Coefficient t-Statistic Prob. C -0.1270 -3.3830 0.0007
FAM_OWN -0.0122 -1.7144 0.0866 SUBT_OWN -0.0676 -2.9488 0.0032 GOV 0.0383 1.4762 0.1401 FORGN_OWN -0.0233 -1.5296 0.1263 DDIROWN01 -3.8278 -1.2659 0.2057 DDIROWN0125 -0.0275 -1.2247 0.2208 DDIROWN0025 0.0486 1.8811 0.0601 DEBT_TO_EQUITY -0.0005 -1.2186 0.2232 PROP_INDDIR -0.0295 -1.4469 0.1481 AQ 0.0387 5.8779 0.0000 LN_ASSET 0.0069 3.7982 0.0002 ROE 0.0067 1.6330 0.1027 MARKETOBOOK 0.0008 1.4317 0.1524 δ2001 0.2254 229.0986 0.0000 ***
δ2002 0.2861 287.7582 0.0000 *** δ2003 0.3158 417.0204 0.0000 *** δ2004 0.3400 344.2151 0.0000 *** δ2005 0.3346 297.8511 0.0000 *** δ2006 0.3463 317.6215 0.0000 *** δ2007 0.3676 316.8503 0.0000 *** δ2008 0.4036 346.2428 0.0000 *** CONSUMER_DISCRETIONARY 0.2679 8.1941 0.0000 *** CONSUMER_STAPLES 0.2552 7.4870 0.0000 *** FINANCIALS 0.2696 8.7157 0.0000 *** ENERGY 0.1093 2.0329 0.0422 ** HEALTHCARE 0.3309 6.8236 0.0000 *** MATERIALS 0.2230 7.6655 0.0000 *** UTILITIES 0.2283 8.1288 0.0000 *** INDUSTRIALS 0.2422 7.4308 0.0000 *** INFORMATION_TECHNOLOGY 0.2663 8.6560 0.0000 *** R-squared 0.6729 F-statistics 120.1583 Adjusted R-squared 0.6673 F- significance 0.0000 ***level of significance at 1% **level of significance at 5% *level of significance at 10%

236
Equation 8 Panel GLS result of determinants of voluntary score from 2000 to 2008 including industry classifications using winsorised estimators (N=1783)
Variable Coefficient t-Statistic Prob. C -0.1498 -3.5897 0.0003
FAM_OWN -0.0157 -2.1213 0.0340 SUBT_OWN -0.0730 -3.2701 0.0011 GOV 0.0408 1.6492 0.0993 FORGN_OWN -0.0306 -2.0181 0.0437 DDIROWN01 0.0416 1.7904 0.0736 DDIROWN0125 -4.5235 -1.4618 0.1440 DDIROWN0025 -0.0262 -1.2605 0.2076 DEBT_TO_EQUITY -0.0034 -4.4157 0.0000 PROP_INDDIR -0.0118 -0.6299 0.5288 AQ 0.0384 5.9804 0.0000 LN_ASSET 0.0087 4.3733 0.0000 ROE 0.0262 4.3846 0.0000 MARKETOBOOK 0.0017 1.4005 0.1616 δ2001 0.2283 222.9881 0.0000 ***
δ2002 0.2877 282.2360 0.0000 *** δ2003 0.3160 348.9383 0.0000 *** δ2004 0.3390 288.1872 0.0000 *** δ2005 0.3349 251.4033 0.0000 *** δ2006 0.3468 266.2724 0.0000 *** δ2007 0.3658 261.4783 0.0000 *** δ2008 0.4019 279.5858 0.0000 *** CONSUMER_DISCRETIONARY 0.2677 8.5385 0.0000 *** CONSUMER_STAPLES 0.2526 7.7884 0.0000 *** FINANCIALS 0.2710 9.1675 0.0000 *** ENERGY 0.1033 1.9765 0.0483 ** HEALTHCARE 0.3303 6.9677 0.0000 *** MATERIALS 0.2265 8.1794 0.0000 *** UTILITIES 0.2330 8.6235 0.0000 *** INDUSTRIALS 0.2445 7.7126 0.0000 *** INFORMATION_TECHNOLOGY 0.2641 8.8990 0.0000 *** R-squared 0.5956 F-statistics 85.9953 Adjusted R-squared 0.5886 F- significance 0.0000 ***level of significance at 1% **level of significance at 5% *level of significance at 10%

237
6.3.4 Determinants of disclosure of individual executive director’s remuneration
A significant number of Malaysian companies did not follow the MCCG recommendation to
provide information on individual director’s remuneration. The recommendation is not
mandatory but companies must provide justifications for non-disclosure. The study finds that
only 10.54% of the sample companies provided disclosure of individual executive director’s
remuneration over the period of 2000 to 2008. Given that there is a significant resistance
from companies to this recommendation, the study looked at the determinants of the
disclosure of individual executive director’s remuneration. A Logit regression analysis was
conducted to examine the association between the explanatory variables and the probability
that companies will disclose individual executive director’s remuneration. A Logit regression
is the preferred method for multivariate analysis with a dependent variable that consist of
binary values of 0 (no individual disclosure) and 1 (provides individual disclosure) and that
has a skewed distribution (Walsh 1987). The same method was adopted by Chizema (2008)
in examining the determinants of disclosure of individual director’s remuneration in
Germany.
Equation 9 shows the result of the Logit regression on the determinants of individual
director’s remuneration. 199 company years provided disclosure of individual director’s
remuneration and 1584 company years did not do so. The Likelihood Ratio (LR) statistics
accepts the null hypothesis that Equation 9 is the best model (p = 0.0000, α = 1%). The
McFadden R-squared suggests that the 10.58 percent of the variance in the probability of
disclosure of individual executive director’s remuneration is estimated by the explanatory
variables46.
46 It is usual for the value of the R-squared of a logit regression to be lower than the R-squared of a least square regression.

238
Consistent with the study’s earlier finding, the result accepts the hypothesis that family
ownership (FAM_OWN) significantly limits the level of disclosure of individual
remuneration. Disclosure of individual executive director’s remuneration may stimulate
scrutiny of the private wealth derived by family-managers and family shareholdings. The
additional attention may also expose exploitation of minority shareholders. Thus, family
owners seek to protect their control over the company by limiting the public disclosure of
individual executive remuneration.
Contrary to hypothesis 3 in the empirical framework, the study finds that ownership
concentration (SUBT_OWN) is significantly and negatively associated with the probability
that companies will disclose individual executive director’s remuneration. This supports the
notion that substantial shareholders may behave like insiders. They may use their substantial
block holdings to demand insider information from companies rather than relying on public
disclosure of information. Nelson and Majella (2005) found a similar negative association
between disclosure of executive stock options and ownership concentration in Australian
companies.
There is a significant and positive association between the level of government ownership
and the probability that companies will disclose on individual’s remuneration. The result is
consistent with the analysis in Equation 2 Panel GLS result of determinants of voluntary
score from 2000 to 2008 (N=1783) that found a significant and positive association between
government ownership (GOV) and the level of voluntary disclosure. This further indicates

239
that Malaysian GLCs are at the forefront of promoting good corporate governance practices.
The result is consistent with Chizema (2008) that also found that government ownership in
Germany companies significantly improve the probability of disclosure of individual
director’s remuneration.
Executive directors’ shareholdings at a level of below 10 percent (DDIROWN01) and of
more than 25 percent (DDIROWN0025) were found to significantly and positively improve
the probability of the disclosure of individual director’s remuneration. This is consistent with
the expectations of agency theory that equity shareholdings may mitigate agency problems.
Executive directors have the incentive to disclose information on remuneration to protect
their managerial positions and allow shareholders to assess their performance. Hence, they
would not resist the disclosure of their individual remuneration.
Contrary to the expectation, leverage (DEBT_TO_EQUITY) is significantly and negatively
associated with the probability of disclosure of individual director’s remuneration. From an
agency theory perspective, creditors may demand more information in order to assess the risk
of default and whether free cash flows are being used to service debt or pay excessive
remuneration. This finding suggests that companies with higher leverage seek to protect
information on individual director’s remuneration. Disclosure of individual remuneration
may allow creditors to impose a more restrictive debt covenant that may include a high
individual pay and performance sensitivity threshold. Executives of a high levered company
may not disclose their own remuneration to avoid such restrictive term.

240
There is a weak significant and positive association between audit quality (AQ) and the
likelihood of disclosure on individual executive director’s remuneration (α = 10%).
Nonetheless, the result is consistent with hypothesis 9 that states that companies with higher
audit quality are positively associated with the extent of disclosure of executive directors’
remuneration. Clarkson et al. (2006) and Bassett et al. (2007) found a similar association
between audit quality and the level of voluntary and mandatory disclosure of remuneration in
Australian companies.
All the dummies for years are found to be positive and significant. The results are consistent
with the study’s earlier findings. These imply that the reforms to Malaysian disclosure
framework significantly improved the extent of disclosure of executive directors’
remuneration including disclosure of individual remuneration. Foreign ownership, director
ownership between 10 and 25 percent (DDIROWN0125), proportion of independent directors
(PROP_INDDIR), company size (LN_ASSET), profitability (ROE) and growth
(MARKETOBOOK) were not significantly associated with the disclosure of individual
director’s remuneration.
Equation 10 retests the model using the using winsorised estimators. The winsorisation
technique substitutes the outliers or the values below and above the chosen percentiles with
the average value of the minimum and maximum percentiles. The presence of extreme values
may lead to imprecise estimates from wider confidence intervals and standard errors. The
value of the McFadden R-squared has improved from 10.58 percent to 12.57 percent in the
winsorised equation. The results are generally consistent with Equation 9 except for the
associations between the probability of individual director’s remuneration and director

241
ownership of more than 25 percent (DDIROWN0025) and audit quality (AQ) that are no
longer statistically significant.
There is a significant and positive association between executive directors’ shareholding
between 10 and 25 percent (DDIROWN0125) and the probability of disclosure of individual
executive director’s remuneration. Although the results of hypothesis testing of associations
between the two level of executive directors’ shareholdings (DDIROWN0125 and
DDIROWN0025) and probability of individual disclosure of executive director’s
remuneration vary in both of the equations, the sign of the coefficients are consistently
positive.
Growth (MARKETOBOOK) is now significantly and positively associated with the
probability of disclosure of individual director’s remuneration. This result is inconsistent with
the result of the main analysis of Equation 1 to 4 that finds significant and negative
associations between the level of growth and in total and voluntary disclosure of disclosure of
executive directors’ remuneration. These suggest that the influence of growth on disclosure
of individual remuneration may be more distinct than on the other components of
remuneration disclosure. Companies may perceive that the marginal benefits of disclosure of
individual remuneration outweigh its marginal costs. Executives of high growth companies
may have the incentive to provide more disclosure especially on their personal performance.
This may ensure that they are appropriately rewarded for undertaking additional risks in
exploiting the growth opportunities.

242
In addition, there is now positive but weak significant association (α = 10%) proportion of
independent directors (PROP_INDDIR) and the probability of disclosure of individual
director’s remuneration. This may indicate that the corporate governance mechanism put in
place by shareholders is working to a certain extent in protecting their interests. However, the
independent directors may not be powerful enough in mitigating the traditional dominance of
family owners in pushing for disclosure of individual remuneration.
Profitability (ROE) is also shown to have a weak but positive and significant association (α =
10%) with the probability of disclosure of individual director’s remuneration. Profitable
companies are argued would disclose all information to distinguish themselves from other
companies. Executives of profitable companies may have the incentives to disclose their
individual remuneration and performance to protect their value in the managerial labour
market.
All the dummies for the years stay positive and significant in the winsorised estimates. This
is consistent with the earlier test results.

243
Equation 9 Logit regression result of determinants of individual director’s remuneration disclosure from 2000 to 2008 (N=1783)
Variable Coefficient Std. Error z-Statistic Prob.
C -6.0650 1.3549 -4.4762 0.0000 ***
FAM_OWN -1.8423 0.4496 -4.0980 0.0000 ***
SUBT_OWN -1.1746 0.5863 -2.0033 0.0451 **
GOV 2.0292 0.4958 4.0932 0.0000 ***
FORGN_OWN 0.3386 0.4463 0.7586 0.4481 DDIROWN01 169.4682 60.5060 2.8009 0.0051 ***
DDIROWN0125 0.7427 1.0961 0.6775 0.4981 DDIROWN0025 2.0353 0.9273 2.1950 0.0282 **
DEBT_TO_EQUITY -0.0555 0.0307 -1.8066 0.0708 *
PROP_INDDIR 1.1287 0.7626 1.4799 0.1389 AQ 0.3252 0.1967 1.6531 0.0983 *
LN_ASSET 0.0191 0.0577 0.3308 0.7408 ROE 0.3433 0.2870 1.1963 0.2316 MARKETOBOOK 0.0876 0.0804 1.0892 0.2761 D2001 3.5675 1.0607 3.3632 0.0008 ***
D2002 3.6808 1.0609 3.4696 0.0005 ***
D2003 3.3391 1.0580 3.1561 0.0016 ***
D2004 3.2203 1.0663 3.0200 0.0025 ***
D2005 3.3301 1.0649 3.1271 0.0018 ***
D2006 3.2677 1.0660 3.0653 0.0022 ***
D2007 3.2854 1.0736 3.0601 0.0022 ***
D2008 3.0458 1.0724 2.8402 0.0045 ***
McFadden R-squared 0.1058 Mean dependent var. 0.1116
S.D. dependent var. 0.3150 S.E. of regression 0.3023 Akaike info criterion 0.6504 Sum squared resid. 160.9377 Schwarz criterion 0.7181 Log likelihood -557.7962 Hannan-Quinn criter. 0.6754 Deviance
1115.5920
Restr. deviance 1247.6280 Restr. log likelihood -623.8138 LR statistic 132.0352 Avg. log likelihood -0.3128 Prob. (LR statistic) 0
Obs. with Dep=0 1584 Total obs. 1783
Obs. with Dep=1 199 ***level of significance at 1% **level of significance at 5% *level of significance at 10%

244
Equation 10 Logit regression result of determinants of individual directors’ remuneration disclosure from 2000 to 2008 using winsorised estimators (N=1783)
Variable Coefficient Std. Error z-Statistic Prob.
C -6.7522 1.4876 -4.5391 0.0000 ***
FAM_OWN -1.8491 0.4589 -4.0299 0.0001 ***
SUBT_OWN -1.4535 0.5990 -2.4263 0.0153 **
GOV 2.1717 0.5123 4.2388 0.0000 ***
FORGN_OWN 0.0930 0.4689 0.1985 0.8427 DDIROWN01 2.1002 0.9573 2.1939 0.0282 **
DDIROWN0125 170.5500 61.9283 2.7540 0.0059 ***
DDIROWN0025 0.9818 1.0999 0.8927 0.3720 DEBT_TO_EQUITY -0.1231 0.0546 -2.2552 0.0241 **
PROP_INDDIR 1.4263 0.7767 1.8364 0.0663 *
AQ 0.2724 0.1920 1.4185 0.1560 LN_ASSET 0.0474 0.0635 0.7461 0.4556 ROE 0.5102 0.2859 1.7843 0.0744 *
MARKETOBOOK 0.1999 0.0457 4.3722 0.0000 ***
D2001 3.8602 1.1866 3.2531 0.0011 ***
D2002 3.9753 1.1815 3.3645 0.0008 ***
D2003 3.6055 1.1785 3.0595 0.0022 ***
D2004 3.4764 1.1876 2.9273 0.0034 ***
D2005 3.6108 1.1862 3.0441 0.0023 ***
D2006 3.5978 1.1861 3.0332 0.0024 ***
D2007 3.5391 1.1860 2.9841 0.0028 ***
D2008 3.3285 1.1956 2.7840 0.0054 ***
McFadden R-squared 0.1257 Mean dependent var. 0.1116
S.D. dependent var. 0.3150 S.E. of regression 0.2988 Akaike info criterion 0.6364 Sum squared resid 157.2558 Schwarz criterion 0.7041 Log likelihood -545.3806 Hannan-Quinn criter. 0.6614 Deviance
1090.7610
Restr. deviance 1247.6280 Restr. log likelihood -623.8138 LR statistic 156.8663 Avg. log likelihood -0.3059 Prob. (LR statistic) 0
Obs. with Dep=0 1584 Total obs. 1783
Obs. with Dep=1 199 ***level of significance at 1% **level of significance at 5% *level of significance at 10%

245
6.3.5 Period analysis
Figure 13 show the test results of panel regression by periods for the determinants of total and
voluntary disclosure of executive directors’ remuneration. Period 1 is the year 2000 when
there was no regulations on the disclosure of executive directors’ remuneration. Period 2
covers 2001 to 2004, during which the MCCG and the Bursa Malaysia Listing Rule were
introduced. Period 3 is from 2005 to 2008, during which the mandatory accounting standards
of FRS 2 and FRS 124 were implemented and worked concurrently with the MCCG and the
Listing Rule. The test results provided a comparative analysis of the determinants of the
disclosure of executive directors’ remuneration under different regulatory environments.
The test results in Figure 13 show that the adjusted R-squared values improved from period 1
to period 3. In period 1, only 9.95 percent of the variation in the total disclosure score was
explained by the explanatory variables. The adjusted R-squared improved in period 2 and 3 to
88.45 percent and 96.68 percent respectively. This can be explained by the acceptance of
more explanatory variables that were significantly associated with the total disclosure of
executive directors’ remuneration in period 2 and period 3 compared to period 1. The East
Asian financial crisis stimulated greater attention on corporate governance and transparency.
Period 1 represents the period where there was less demand for information from key
stakeholders. Period 2 and period 3 represent a shift to greater shareholders’ and other
stakeholders’ activism. The introduction of the various disclosure requirements may have
also created more awareness among the various players in the market of the need to focus on
disclosure policies and practices.
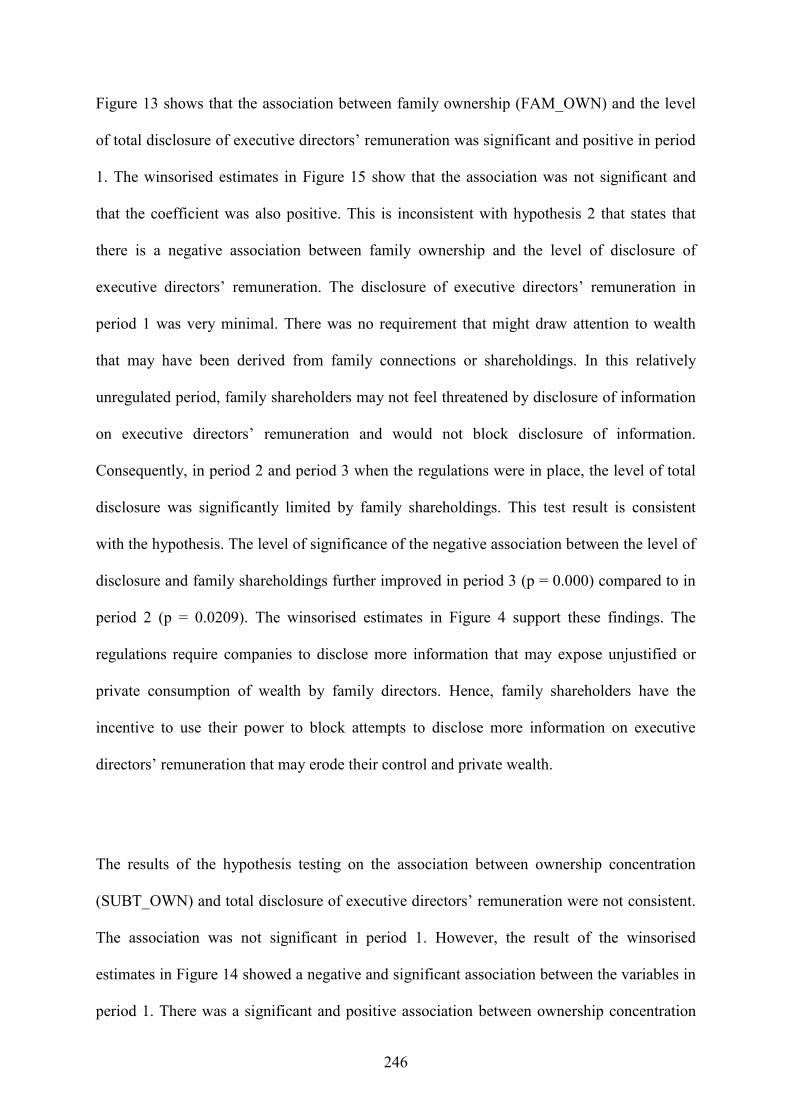
246
Figure 13 shows that the association between family ownership (FAM_OWN) and the level
of total disclosure of executive directors’ remuneration was significant and positive in period
1. The winsorised estimates in Figure 15 show that the association was not significant and
that the coefficient was also positive. This is inconsistent with hypothesis 2 that states that
there is a negative association between family ownership and the level of disclosure of
executive directors’ remuneration. The disclosure of executive directors’ remuneration in
period 1 was very minimal. There was no requirement that might draw attention to wealth
that may have been derived from family connections or shareholdings. In this relatively
unregulated period, family shareholders may not feel threatened by disclosure of information
on executive directors’ remuneration and would not block disclosure of information.
Consequently, in period 2 and period 3 when the regulations were in place, the level of total
disclosure was significantly limited by family shareholdings. This test result is consistent
with the hypothesis. The level of significance of the negative association between the level of
disclosure and family shareholdings further improved in period 3 (p = 0.000) compared to in
period 2 (p = 0.0209). The winsorised estimates in Figure 4 support these findings. The
regulations require companies to disclose more information that may expose unjustified or
private consumption of wealth by family directors. Hence, family shareholders have the
incentive to use their power to block attempts to disclose more information on executive
directors’ remuneration that may erode their control and private wealth.
The results of the hypothesis testing on the association between ownership concentration
(SUBT_OWN) and total disclosure of executive directors’ remuneration were not consistent.
The association was not significant in period 1. However, the result of the winsorised
estimates in Figure 14 showed a negative and significant association between the variables in
period 1. There was a significant and positive association between ownership concentration

247
and the disclosure of executive directors’ remuneration in period 2. However, the association
shifted to be a significant and negative association in period 3. The result in period 3 is
consistent with hypothesis 3 that there is a significant and negative association between
ownership concentration and the level of disclosure of executive directors’ remuneration. A
company with high ownership concentration is more likely to have substantial shareholders
that behave like insiders. They could use their power to demand information on remuneration
without relying on the public disclosure of such information. The inconsistency between the
periods may be explained by the trend in the average ownership concentration over the
sample period of 2000 to 2008 (Appendix 5). The average ownership concentration decreased
from 2000 to 2005, before it improved in 2006.
The association between government shareholding (GOV) and the level of total disclosure
was only significant in period 3. This is consistent with the expectation of hypothesis 4 that
there is a positive association between government shareholding and the level of disclosure of
executive directors’ remuneration. Although the test results in period 1 and period 2 were not
significant, the level of the coefficient of the association between government shareholding
and the level of total disclosure of executive directors’ remuneration was positive and
continuously improved over the three periods as more reforms were introduced, culminating
in the mandatory accounting standards in 2005. Companies with government shareholdings
improved their level of disclosure of information on executive directors’ remuneration. The
test result of the winsorised estimates in Figure 14 also supports this finding.
The association between foreign ownership (FORGN_OWN) and the level of total score of
executive directors’ remuneration was only significant in period 1. However, contrary to the

248
expectation in hypothesis 5, the association was negative instead of positive. The result of the
winsorised estimates did not support this finding. There was no significant association
between foreign ownership and the disclosure of executive directors’ remuneration in any of
the periods. This suggests that foreign ownership has a limited influence on the disclosure of
executive directors’ remuneration of Malaysian companies.
Hypothesis 8 states that there is a significant association between executive director
ownership and the disclosure of executive directors’ remuneration. There were significant
inconsistencies in the test results of the standard analysis in Figure 15 and in the test results
of the winsorised estimates in Figure 16. The trend in the average director ownership
declined over the sample period with a significant drop in 2001. The focus on corporate
governance may have led to a dilution of executive director ownership. This may have
contributed to the inconsistencies in the result. Nonetheless, in period 3, the level of director
ownership in the different percentiles was significantly associated with the level of total
disclosure of executive directors’ remuneration. The winsorised estimates in Equation 19
show that there was a significant and positive association between director ownership below
10 percent (DDIROWN01) and director ownership between 10 and 25 percent
(DDIROWN0125) and the level of total disclosure of executive directors’ remuneration. The
test results also indicate a significant and negative association between director ownership of
more than 25 percent (DDIROWN025) and the level of total disclosure of executive
directors’ remuneration. This supports the argument that executive director ownership at
lower levels may encourage disclosure of remuneration to mitigate agency costs. However,
executive director ownership at a higher level limits disclosure as executive directors have
the power to capture board decisions.

249
The test results in Figure 13 show that there was a significant and positive association
between leverage (DEBT_TO_EQUITY) and the level of total disclosure of executive
directors’ remuneration in period 1 and period 2. This means that hypothesis 7 is accepted.
However, there was no significant association between the variables in period 3. This may be
explained by a decreasing trend in the average leverage over the sample period. When the
level of debt is low, creditors may not have sufficient power to demand more information
about executive directors’ remuneration. The winsorised estimates in Figure 14 provide
similar results.
The average proportion of independent directors increased from 2000 to 2008. This reflects a
greater emphasis on the protection of minority shareholders through a third party corporate
governance mechanism. The test results in Figure 13 show that there was a positive and
significant association between the proportion of independent directors (PROP_INDDIR) and
the level of total disclosure of executive directors’ remuneration in period 2. The result is
consistent with hypothesis 8. However, the hypothesis was rejected in period 1 and period 3.
There were similar findings in the winsorised estimates (Figure 14). This may indicate that
there is a lower limit and an upper limit in the proportion of independent directors’ ability to
effectively improve the level of transparency. An alternative explanation is that there was a
substitutive effect between the effectiveness of independent directors and the intensiveness of
the regulatory framework on disclosure. During period 3, the regulatory framework on the
disclosure of executive directors’ remuneration was more extensive with the presence of the
mandatory accounting standards, the MCCG and the Bursa Malaysia Listing Rule. This may

250
have substituted the role of independent directors to a certain extent in ensuring adequate
disclosure of information.
The ninth hypothesis states that there is a positive association between audit quality (AQ) and
the level of disclosure of executive directors’ remuneration. A company that retained an
established external auditor was expected to disclose more information because the auditor
would have its reputation to maintain. The hypothesis was accepted for period 2 and period 3.
There was no significant association between audit quality and the level of total disclosure of
executive directors’ remuneration in period 1 although the coefficient was positive. Similar
findings were observed in the winsorised estimates in Figure 14. The data showed that
Malaysian companies began retaining established external auditors (Big-4) only after the year
2001 (Appendix 5). This may have influenced the level of significance of the association
between audit quality and the level of total disclosure of executive directors’ remuneration in
period 1.
The test results in Figure 13 found that there was a significant and positive association
between company size (LN_ASSET) and the level of total disclosure of executive directors’
remuneration in period 1 and period 3. This is consistent with hypothesis 10 that states that
there is a positive and significant association between company size and the level of
disclosure of executive directors’ remuneration. However, the association was found to be
significant and negative in period 2. This may have been due to the presence of outliers in the
sample of company size. The winsorised estimates in Equation 18 (Figure 14) show that the
coefficient of the association between the company size and the level of total disclosure of
executive directors’ remuneration was now positive for all periods.

251
The eleventh hypothesis states that there is a positive association between profitability (ROE)
and the level of disclosure of executive directors’ remuneration. The test results in Figure 13
show that there was a positive and significant association between profitability and the level
of disclosure of executive directors’ remuneration in period 1 and period 2. The winsorised
estimate in Figure 14 also shows that the association between the variables was positive and
significant in period 3. This supports hypothesis 11 and indicates that profitable companies
are more likely to disclose information to the market than other companies.
The final hypothesis is that there is a negative and significant association between growth
(MARKETOBOOK) and the level of disclosure of executive directors’ remuneration. The
hypothesis was only accepted in period 3. In period 2, there was a positive and significant
association between growth and the level of disclosure of executive directors’ remuneration.
The association between the variables was not significant in period 1 although the coefficient
was negative. The winsorised estimates in Figure 14 also show similar findings. The variation
in the hypothesis testing results is consistent with variation in the average growth over the
three periods.
Figure 15 and Figure 16 show the results of the determinants of voluntary disclosure of
executive directors’ remuneration for the three periods. The results were consistent with the
periodic analysis of the total disclosure of executive directors’ remuneration. The dummies
for the years were significant in all of the results discussed in this section.

252
Figure 13 Results of regression for determinants of total score according to periods
Period I (2000) Period II (2001 to 2004) Period III (2005 to 2008)
Equation 11 Equation 12 Equation 13
Variable Coefficient Prob. Coefficient Prob. Coefficient Prob. C 0.0313 0.5206 0.5402 0.0000 *** 0.2205 0.0000 *** FAM_OWN 0.0471 0.0570 * -0.0450 0.0209 ** -0.0597 0.0000 *** SUBT_OWN -0.0407 0.2852 0.0548 0.0059 *** -0.0723 0.0000 *** GOV 0.0081 0.8723 0.0138 0.6410 0.0439 0.0002 *** FORGN_OWN -0.0761 0.0119 ** -0.0451 0.2333 -0.0075 0.1632 DDIROWN01 16.8694 0.3850 1.6347 0.5844 2.9788 0.0046 *** DDIROWN0125 0.1240 0.2864 0.0834 0.0000 *** -0.0239 0.0110 ** DDIROWN0025 -0.2024 0.0099 *** -0.0693 0.0471 ** 0.1652 0.0000 *** DEBT_TO_EQUITY -0.0004 0.0838 * 0.0014 0.0047 *** 0.0001 0.2359 PROP_INDDIR 0.0039 0.9264 0.0933 0.0000 *** 0.0000 0.3327 AQ 0.0093 0.4405 0.0209 0.0000 *** 0.0191 0.0100 *** LN_ASSET 0.0142 0.0001 *** -0.0097 0.0485 ** 0.0268 0.0000 *** ROE 0.0249 0.0346 ** 0.0112 0.0017 *** -0.0005 0.8529 MARKETOBOOK -0.0014 0.6235 -0.0134 0.0000 *** 0.0004 0.0242 ** D2002
0.0512 0.0000 ***
D2003 0.0773 0.0000 *** D2004 0.0886 0.0000 *** D2005
D2006 0.0016 0.0000 *** D2007 0.0084 0.0000 *** D2008 0.0311 0.0000 *** R-squared 0.1583 0.9158 0.9759 Adjusted R-squared 0.0995 0.8845 0.9668

253
Figure 14 Results of regression for determinants of total score according to periods using winsorised estimators
Period I (2000) Period II (2001 to 2004) Period III (2005 to 2008)
Equation 17 Equation 18 Equation 19
Variable Coefficient Prob. Coefficient Prob. Coefficient Prob. C 0.1019 0.1127 0.3777 0.0000 *** 0.26986 0.0000 *** FAM_OWN 0.0336 0.2720 -0.0462 0.0369 ** -0.0645 0.0000 *** SUBT_OWN -0.1059 0.0388 ** 0.0637 0.0005 *** -0.0582 0.0002 *** GOV 0.0347 0.5392 0.0103 0.7354 0.03316 0.0000 *** FORGN_OWN -0.0444 0.2309 -0.0552 0.1667 0.03141 0.1110 DDIROWN01 -0.1447 0.0667 * -0.0905 0.0137 ** 0.14353 0.0000 *** DDIROWN0125 21.0993 0.2710 1.1574 0.7082 3.12482 0.0023 *** DDIROWN0025 0.1338 0.2073 0.0829 0.0001 *** -0.0388 0.0516 ** DEBT_TO_EQUITY 0.0048 0.2989
0.0017 0.0346 ** 0.00067 0.1789
PROP_INDDIR -0.0187 0.6442 0.1000 0.0000 *** 0.00949 0.4150 AQ 0.0080 0.5069 0.0217 0.0000 *** 0.02266 0.0269 ** LN_ASSET 0.0104 0.0402 ** 0.0019 0.7341 0.02455 0.0000 *** ROE 0.0038 0.9339 0.0135 0.0296 ** 0.01127 0.0000 *** MARKETOBOOK -0.0008 0.8312 -0.0102 0.0629 ** 0.00291 0.0000 *** D2002
0.0512 0.0000 ***
D2003 0.0755 0.0000 *** D2004 0.0874 0.0000 *** D2005
D2006 0.00474 0.0000 *** D2007 0.01705 0.0000 *** D2008 0.03765 0.0000 *** R-squared 0.1877 0.9123 0.9759 Adjusted R-squared 0.1310 0.8801 0.9668

254
Figure 15 Results of regression for determinants of voluntary score according to periods
Period I (2000) Period II (2001 to 2004) Period III (2005 to 2008)
Variable Equation 14 Equation 15 Equation 16 C Coefficient Prob. Coefficient Prob. Coefficient Prob. FAM_OWN 0.0313 0.5206 0.5026 0.0000 *** 0.2454 0.0012 *** SUBT_OWN 0.0471 0.0570 * -0.0513 0.0116 ** -0.0587 0.0000 *** GOV -0.0407 0.2852 0.0610 0.0045 *** -0.0603 0.0120 ** FORGN_OWN 0.0081 0.8723 0.0197 0.4872 0.0250 0.0000 *** DDIROWN01 -0.0761 0.0119 ** -0.0632 0.1057 0.0245 0.2845 DDIROWN0125 16.8694 0.3850 1.5890 0.5684 2.9270 0.0878 * DDIROWN0025 0.1240 0.2864 0.0988 0.0000 *** -0.0313 0.0000 *** DEBT_TO_EQUITY -0.2024 0.0099 *** -0.0690 0.0572 * 0.1279 0.0000 *** PROP_INDDIR -0.0004 0.0838 * 0.0016 0.0041 *** 0.0002 0.7770 AQ 0.0039 0.9264 0.0975 0.0000 *** 0.0107 0.9990 LN_ASSET 0.0093 0.4405 0.0195 0.0001 *** 0.0247 0.0467 ** ROE 0.0142 0.0001 *** -0.0098 0.0600 * 0.0268 0.0000 *** MARKETOBOOK 0.0249 0.0346 ** 0.0110 0.0015 *** -0.0004 0.8575 D2002 -0.0014 0.6235 -0.0144 0.0000 *** 0.0004 0.0547 * D2003
0.0538 0.0000 ***
D2004 0.0823 0.0000 ***
D2005 0.0944 0.0000 ***
D2006
D2007 0.0055 0.0000 *** D2008 0.0173 0.0000 *** R-squared 0.0366 0.0000 *** Adjusted R-squared 0.1583 0.9189 0.9827
0.0995 0.8887 0.9763

255
Figure 16 Results of regression for determinants of voluntary score according to periods using winsorised estimators
Period I (2000) Period II (2001 to 2004) Period III (2005 to 2008)
Equation 20 Equation 21 Equation 22
Variable Coefficient Prob. Coefficient Prob. Coefficient Prob. C 0.1019 0.1127 0.3298 0.0001 *** 0.242752 0.0025 *** FAM_OWN 0.0336 0.2720 -0.0528 0.0240 ** -0.067243 0.0000 *** SUBT_OWN -0.1059 0.0388 ** 0.0716 0.0003 *** -0.074838 0.0112 ** GOV 0.0347 0.5392 0.0147 0.6156 0.049476 0.0000 *** FORGN_OWN -0.0444 0.2309 -0.0765 0.0681 * -0.005956 0.4582 DDIROWN01 -0.1447 0.0667 * -0.0939 0.0177 ** 0.182043 0.0000 *** DDIROWN0125 21.0993 0.2710 1.1840 0.6877 3.181917 0.0707 * DDIROWN0025 0.1338 0.2073 0.0985 0.0000 *** -0.036789 0.0058 *** DEBT_TO_EQUITY 0.0048 0.2989
0.0020 0.0269 ** 0.0002 0.7076
PROP_INDDIR -0.0187 0.6442 0.0982 0.0000 *** -0.005125 0.7762 AQ 0.0080 0.5069 0.0198 0.0000 *** 0.01956 0.0768 * LN_ASSET 0.0104 0.0402 ** 0.0029 0.6203 0.025213 0.0001 *** ROE 0.0038 0.9339 0.0133 0.0360 ** 0.01281 0.0002 *** MARKETOBOOK -0.0008 0.8312 -0.0115 0.0489 ** 0.002101 0.0202 ** D2002
0.0543 0.0000 ***
D2003 0.0807 0.0000 *** D2004 0.0934 0.0000 *** D2005
D2006 0.001333 0.0000 *** D2007 0.008211 0.0000 *** D2008 0.031869 0.0000 *** R-squared 0.1877 0.9155 0.9820 Adjusted R-squared 0.1310 0.8841 0.9752

256
6.3.6 Comparison between high and low disclosure score groups
Panel regression analysis was also conducted to compare the differences in the disclosure of
executive directors’ remuneration between high and low scoring groups. Individual
regressions were conducted on the high and low scoring groups. The results (Equations 23 to
26) indicate that there are significant differences in the factors that may explain the level of
disclosure by high and low scoring groups. Equation 23 shows that the level of disclosure of
the high total score group was significantly and negatively associated with family ownership
(FAM_OWN). Audit quality (AQ), company size (LN_ASSET), profitability (ROE) and
growth (MARKETOBOOK) were significantly and positively associated with the level of
total disclosure in high scoring group. The results are consistent with the prediction of the
hypotheses. Consistent with earlier analysis, the coefficients of the dummies for the years
were increasing. However, the dummy years for 2001 and 2002 were not significant. This
may reflect a learning period before companies that already disclosed more information
started to significantly disclose additional information as required by the requirements of the
new MCCG.
Equation 24 shows that ownership concentration (SUBT_OWN), director ownership at less
than 10% (DDIROWN01) and proportion of independent directors (PROP_INDDIR) were
positively and significantly associated with the level of total disclosure in low scoring group.
All the dummy years were significant. However, the level of the coefficient of the dummies
improved from 2001 to 2003 before declining in 2005 and improving again in 2006 with
further declines in 2007 and 2008. This is consistent with the observations in Figure 11 that
showed that companies with minimum disclosure first conformed to the new regulations by
disclosing more information but then fell back to previous patterns of disclosing less
information.

257
Equations 25 and 26 examined the determinants of the voluntary disclosure of executive
directors’ remuneration for high and low scoring groups respectively. Equation 25 shows
that family ownership (FAM_OWN) significantly and negatively influenced the level of
voluntary disclosure of the high scoring group. There was also a significant and positive
association between audit quality (AQ) and the level of voluntary disclosure for high scoring
group. There were significant and positive associations between ownership concentration
(SUBT_OWN), leverage (DEBT_TO_EQUITY) and company size (LN_ASSET) and the
level of voluntary disclosure of the high scoring group. The results are consistent with the
expectations of the empirical framework of the study. The coefficients of the dummies for
2001 and 2001 are negative before turning to positive in the following years. This may reflect
some resistance to the introduction of the reforms to the disclosure requirements before
companies slowly adapted to the changes and voluntarily disclosed more information.
Equation 26 found a significant and positive association between government ownership
(GOV), executive directors’ shareholdings of more than 25% (DDIROWN0025) and the
proportion of independent directors (PROP_INDDIR) and the level of voluntary disclosure
by the low scoring group. The coefficients for the dummies for the years are significant and
positive and follow the trends observed in Figure 1. Although more information was now
voluntarily disclosed, low disclosure companies conformed to the minimum disclosure
requirements.
The results from Equations 23 to 26 show that regulations play a more important role than the
other explanatory variables for the low scoring companies than the high scoring companies.
The coefficients of the dummies for the years that serve as proxies for changes in the
disclosure requirements in the low scoring group are larger and more statistically significant

258
than for the high scoring group. More explanatory variables appear to drive the level of total
and voluntary disclosure in the high scoring group than in the low scoring group. It can be
inferred that companies with low disclosure practices only disclose more information under
regulatory pressure. In addition, other external factors may not be influential in shaping
disclosure policies of these companies than for companies with high levels of disclosure
practices. It may be argued that the stakeholders of companies with high disclosure practices
are more likely to demand more information as there is an expectation that companies would
maintain their high quality of disclosure.
The results also showed that different corporate governance mechanisms may substitute each
other depending on the disclosure environment. The results showed that the level of audit
quality played a positive and significant role in the level of total and voluntary disclosure of
executive directors’ remuneration in high scoring companies. There was no significant
association observed between proportion of independent directors and the level of total and
voluntary disclosure of high scoring group. The opposite results were found in the low
scoring group where independent directors were shown to positively influence the level of
total and voluntary disclosure of executive directors’ remuneration and no significant
association was noted for the level of audit quality.

259
Equation 23 Panel regression for determinants of total score for HIGH SCORE GROUP (N= 1075)
Variable Coefficient t-Statistic Prob. C 0.2464 2.2905 0.0222 **
FAM_OWN -0.1175 -3.6280 0.0003 *** SUBT_OWN 0.0520 1.6083 0.1081
GOV 0.0214 1.1663 0.2438 FORGN_OWN -0.0398 -0.9824 0.3262 DDIROWN01 -3.6553 -1.4224 0.1553 DDIROWN0125 -0.0090 -0.2824 0.7777 DDIROWN0025 -0.0320 -0.6198 0.5356 DEBT_TO_EQUITY 0.0012 1.5565 0.1200 PROP_INDDIR 0.0200 0.5093 0.6107 AQ 0.0231 1.9007 0.0577 *
LN_ASSET 0.0239 3.2402 0.0012 *** ROE 0.0079 3.6914 0.0002 *** MARKETOBOOK 0.0044 2.1550 0.0314 ** δ2001 -0.0001 -0.0046 0.9963
δ2002 0.0074 0.6570 0.5114 δ2003 0.0202 1.9282 0.0541 *
δ2004 0.0366 3.2249 0.0013 *** δ2005 0.0459 3.9508 0.0001 *** δ2006 0.0550 4.7154 0.0000 *** δ2007 0.0666 5.6324 0.0000 *** δ2008 0.0999 7.7658 0.0000 *** R-squared 0.7483 F-statistics 12.9112 Adjusted R-squared 0.6903 F- significance 0.0000
Equation 24 Panel regression for determinants of total score for LOW SCORE GROUP (N=708)
Variable Coefficient t-Statistic Prob. C -0.0900 -0.5907 0.5550 FAM_OWN -0.0139 -0.9249 0.3555 SUBT_OWN 0.0326 0.7468 0.4555 GOV 0.0071 0.1382 0.8901 FORGN_OWN -0.0135 -0.3337 0.7387 DDIROWN01 0.5816 0.3172 0.7513 DDIROWN0125 0.0015 0.0366 0.9708 DDIROWN0025 0.1006 1.8190 0.0695 *
DEBT_TO_EQUITY -0.0002 -1.3562 0.1757 PROP_INDDIR 0.0396 2.4093 0.0164 **
AQ -0.0138 -0.9848 0.3252 LN_ASSET 0.0186 1.6071 0.1087 ROE -0.0030 -1.2556 0.2099 MARKETOBOOK 0.0004 1.6535 0.0989 *
δ2001 0.1851 265.9376 0.0000 ***
δ2002 0.2307 101.8496 0.0000 ***
δ2003 0.2324 70.9998 0.0000 ***
δ2004 0.2382 100.4604 0.0000 ***
δ2005 0.2406 102.8388 0.0000 ***
δ2006 0.2462 103.0097 0.0000 ***
δ2007 0.2411 90.0097 0.0000 ***
δ2008 0.2270 48.4399 0.0000 ***
R-squared 0.8831 F-statistics 16.9513 Adjusted R-squared 0.8310 F- significance 0.0000

260
Equation 25 Panel regression for determinants of voluntary score for HIGH SCORE GROUP (N= 843)
Variable Coefficient t-Statistic Prob. C 0.3113 2.3183 0.0207 **
FAM_OWN -0.0760 -6.2273 0.0000 *** SUBT_OWN 0.0745 1.6940 0.0907 * GOV 0.0049 0.1931 0.8469
FORGN_OWN -0.0506 -0.6197 0.5357 DDIROWN01 -2.9121 -0.8104 0.4180 DDIROWN0125 0.0280 0.3962 0.6921 DDIROWN0025 -0.0882 -1.3519 0.1769 DEBT_TO_EQUITY 0.0015 1.6992 0.0897 *
PROP_INDDIR 0.0083 0.1446 0.8851 AQ 0.0262 1.9250 0.0547 *
LN_ASSET 0.0203 1.8995 0.0579 * ROE 0.0049 1.3464 0.1786
MARKETOBOOK 0.0021 0.7315 0.4647 δ2001 -0.0362 -2.1835 0.0293 **
δ2002 -0.0229 -1.6056 0.1088 δ2003 0.0055 0.4026 0.6874 δ2004 0.0213 1.4308 0.1529 δ2005 0.0372 2.1986 0.0283 **
δ2006 0.0406 2.4574 0.0143 ** δ2007 0.0550 3.2514 0.0012 *** δ2008 0.0745 4.5028 0.0000 *** R-squared 0.6899 F-statistics 8.0672 Adjusted R-squared 0.6044 F- significance 0.0000
Equation 26 Panel regression for determinants of voluntary score for LOW SCORE GROUP (N= 940)
Variable Coefficient t-Statistic Prob. C 0.0854 0.5788 0.5629 FAM_OWN -0.0237 -1.4626 0.1440 SUBT_OWN 0.0320 0.9359 0.3496 GOV 0.0752 2.1162 0.0347 **
FORGN_OWN 0.0051 0.1610 0.8721 DDIROWN01 1.2547 1.0401 0.2986 DDIROWN0125 -0.0258 -0.9163 0.3598 DDIROWN0025 0.0874 2.8194 0.0049 ***
DEBT_TO_EQUITY 0.0001 0.5134 0.6078 PROP_INDDIR 0.0249 3.0940 0.0021 ***
AQ -0.0104 -0.6831 0.4948 LN_ASSET 0.0053 0.4410 0.6593 ROE 0.0002 0.0707 0.9437 MARKETOBOOK 0.0002 1.1279 0.2597 δ2001 0.1594 581.7369 0.0000 ***
δ2002 0.2080 240.7950 0.0000 *** δ2003 0.2201 324.2485 0.0000 *** δ2004 0.2256 100.2638 0.0000 *** δ2005 0.2116 83.4192 0.0000 *** δ2006 0.2140 62.0605 0.0000 *** δ2007 0.2228 52.9856 0.0000 *** δ2008 0.2073 89.5483 0.0000 *** R-squared 0.8248 F-statistics 15.5675 Adjusted R-squared 0.7718 F- significance 0.0000

261
6.3.7 Redundant variables tests
The models have incorporated the different theoretical perspective discussed earlier, namely
agency theory, legitimacy theory, signalling theory and proprietary costs. As a robustness
test, the redundant variables tests were applied to test the significance of incorporating the
various proxies for the different theoretical constructs into a single model or equation. The
null hypothesis of a redundant variable test is that the coefficients of the variables that are
dropped from the equation are jointly zero or they are redundant. Table 29 shows the result of
the redundant variables tests on Equation 1 Panel GLS result of determinants of total score
from 2000 to 2008 (N=1783)). For each test, variables that acted as proxy for other theories
were excluded from the test equation and only variables associated with a specified theory
were included in the model. All the results of the redundant variable tests shown in Table 29
reject the null hypothesis that the variables excluded from the model are redundant. The tests
were repeated on Equation 2 Panel GLS result of determinants of voluntary score from 2000
to 2008 (N=1783)). Table 30 reports the results of the redundant variable test on voluntary
disclosure of executive directors’ remuneration as the dependent variable. The test results
reject the null hypothesis that the excluded variables are redundant. The results provide
evidence to support the incorporation of the various theoretical constructs into the research
empirical framework.

262
Table 29 Result of redundant variable tests on research empirical framework (Y = Total score)
Variables excluded Results of redundant variable tests (F-statistics) Variables included in equation Agency Theory FAM_OWN, SUBT_OWN, GOV FORGN_OWN , DDIROWN01, DDIROWN0125, DDIROWN0025, DEBT_TO_EQUITY, PROP_INDDIR, AQ
Legitimacy Theory LN_ASSET, ROE
Signalling ROE
Proprietary Costs MARKETOBOOK
LN_ASSET ROE MARKETOBOOK
18.8574 p = 0.0000***
FAM_OWN SUBT_OWN GOV FORGN_OWN DDIROWN01 DDIROWN0125 DDIROWN0025 DEBT_TO_EQUITY PROP_INDDIR AQ MARKETOBOOK
1.7200 p = 0.0636*
FAM_OWN SUBT_OWN GOV FORGN_OWN DDIROWN01 DDIROWN0125 DDIROWN0025 DEBT_TO_EQUITY PROP_INDDIR AQ LN_ASSET MARKETOBOOK
6.3229 p = 0.0000***
FAM_OWN SUBT_OWN GOV FORGN_OWN DDIROWN01 DDIROWN0125 DDIROWN0025 DEBT_TO_EQUITY PROP_INDDIR AQ LN_ASSET ROE
6.3129 p = 0.0000***
***level of significance at 1% **level of significance at 5% *level of significance at 10%

263
Table 30 Result of redundant variable tests on research empirical framework (Y = Voluntary score) Variables excluded Results of redundant variable tests (F-statistics)
Variables included in equation Agency Theory FAM_OWN, SUBT_OWN, GOV FORGN_OWN , DDIROWN01, DDIROWN0125, DDIROWN0025, DEBT_TO_EQUITY, PROP_INDDIR, AQ
Legitimacy Theory LN_ASSET, ROE
Signalling ROE
Proprietary Costs MARKETOBOOK
LN_ASSET ROE MARKETOBOOK
2.1152 p = 0.0207**
FAM_OWN SUBT_OWN GOV FORGN_OWN DDIROWN01 DDIROWN0125 DDIROWN0025 DEBT_TO_EQUITY PROP_INDDIR AQ MARKETOBOOK
1.9356 p = 0.0313**
FAM_OWN SUBT_OWN GOV FORGN_OWN DDIROWN01 DDIROWN0125 DDIROWN0025 DEBT_TO_EQUITY PROP_INDDIR AQ LN_ASSET MARKETOBOOK
5.6513 p = 0.0000***
FAM_OWN SUBT_OWN GOV FORGN_OWN DDIROWN01 DDIROWN0125 DDIROWN0025 DEBT_TO_EQUITY PROP_INDDIR AQ LN_ASSET ROE
6.6535 p = 0.0000***
***level of significance at 1% **level of significance at 5% *level of significance at 10%

264
6.4 Summary
Table 31 provides a summary of the results of the multivariate analysis. Consistent with the
study hypothesis, there was an overall improvement in the level of disclosure of executive
directors’ remuneration after the reforms in Malaysian disclosure framework. The results of
the univariate and multivariate analysis supported the first hypothesis that there were
improvements in the level of disclosure of executive directors’ remuneration after the
reforms. The average total and voluntary disclosure showed continuous improvements
throughout the sample period. The level of disclosure of executive directors’ remuneration in
the years after the reforms was significantly higher compared to the year 2000, when no
regulations existed.
However, there appeared to be weaknesses in the reforms introduced to the Malaysian
disclosure framework. The result showed that companies took advantage of the mandatory
nature of the Listing Rules that prescribe the disclosure of remuneration by bands to override
the recommendation of the MCCG to disclose remuneration individually. Only 10.54 percent
of the Malaysian companies that were examined disclosed on individual executive director’s
remuneration.
There was also poor conformity with the recommendation of the MCCG for companies to
disclose the principles behind remuneration and its association with performance. Most of the
companies appeared to be reluctant to disclose the details behind their remuneration policies
and practices in depth. The narrative statements offered by these companies in explaining
their remuneration policies were often very broad at best and did not disclose the link
between executive directors’ remuneration and companies’ performance.

265
Although there was improvement in the extent of disclosure after the introduction of the FRS
124 ‘Related Party Transactions’, companies quickly realized that the requirements are very
broad. The term ‘key management personnel’ in the standards means that companies are not
mandatorily required to disclose separately the remuneration of executive directors. Given
these weaknesses, some Malaysian companies reverted to the old patterns of disclosing less
information and at the minimum of the mandatory requirements.
There was also poor compliance with the requirements of FRS 2 ‘Share Based Payments’
even though the standard was mandatory. A significant number of Malaysian companies that
had share based remuneration schemes failed to disclose the details (valuation models,
benchmarks and assumptions) behind the schemes. It was interesting to note that these
companies did not received qualified audit reports even though they did not meet the full
requirements of the mandatory accounting standards.
Traditional family dominance continued to exert their influence on the Malaysian capital
market and disclosure policies. This study found that the level of family shareholdings
significantly limited the level of disclosure of executive directors’ remuneration. This is
consistent with the expectation of agency theory. The result is consistent with Mohd Ghazali
and Weetman (2006). They also found that the dominance of family shareholders on the level
of voluntary disclosure continued after the reforms. Government shareholdings on the other
hand exerted a positive influence on the disclosure of executive directors’ remuneration at

266
each level (total, voluntary and individual)47. This is not surprising given that the reforms
were introduced by the government.
In terms of ownership concentration, the results of the hypothesis tests did not find significant
associations between ownership concentration and total and voluntary disclosure of executive
directors’ remuneration. However, significant associations between ownership concentration
and the level of disclosure of executive directors’ remuneration were shown in the periodical
analysis and tests on determinants of individual disclosure of remuneration. The inconsistent
results may be attributed to weaknesses in the variable of SUBT_OWN as a proxy for
ownership concentration. The effect that ownership concentration had on the level of
disclosure of executive directors’ remuneration may have been captured by other ownership
variables and company size.
Contrary to the hypothesis, this study did not find significant and consistent associations
between foreign shareholders and the disclosure of executive directors’ remuneration at total,
voluntary and individual levels. Although there was an increasing trend in foreign ownership
over the sample period, the level of foreign ownership had not been at the level seen prior to
the East Asian economic crisis. Their presence in the Malaysian capital market may be not
strong enough to significantly influence companies’ disclosure policies.
Executive directors’ shareholdings at various percentiles did not significantly influence the
level of total and voluntary disclosure of executive directors’ remuneration. However,
executive directors’ shareholdings at the lower percentiles of below 10 percent and between 47 Summary of the findings are based on the results of the winsorised estimates. The winsorised estimates should provide better conclusions. They had considered the presence of outliers that would have influence the accuracy of the original estimates.
267
10 and 25 percent were found to significantly improve the probability of disclosure of
individual executive director’s remuneration. This is consistent with the argument that
executive directors’ with low ownership would do more to satisfy shareholders’ concern and
protect their own wealth. In terms of the periodic analysis, during 2005 to 2008, the level of
executive directors’ shareholdings at the three percentiles levels were significantly associated
with total and voluntary disclosure of executive directors’ remuneration. The results were
consistent with the convex association between executive directors’ ownership and the level
of disclosure predicted by prior literature.
Another agency variable considered is the level of leverage. The hypothesis tests did not find
significant associations between total and voluntary disclosure of executive directors’
remuneration. The results of the periodic analysis were inconsistent except for the year 2001
to 2004 where the hypothesis was accepted. Contrary to the hypothesis, the result found that
leverage significantly limited the probability of disclosure of individual executive director’s
remuneration. Executive directors of a high leveraged company may have more incentive not
to disclose their own remuneration to avoid restrictive debt covenant.
In terms of corporate governance mechanism, there appeared to be no substitutive effects
between the roles of independent directors in mitigating agency problems and the
introduction of the disclosure requirements. It appeared that independent directors had
significantly pushed for greater compliance to the requirements and demanded more
disclosure of executive directors’ remuneration. The results also invalidated some prior
studies concern that Malaysian independent directors were controlled by ‘insiders’. The level
of audit quality did not significantly influence the companies’ disclosure policies (total,
voluntary and individual) on executive directors’ remuneration except for the period analysis

268
from 2001 to 2008 and high disclosure companies. This may indicate that there was an
improving emphasis by Big-4 auditors on ensuring compliance to the evolving disclosure
requirements on executive directors’ remuneration.
The results of this study showed consistently, that company size was positively and
significantly associated with the disclosure policies on executive directors’ remuneration.
This supports the view of legitimacy theory that larger companies are subjected to higher
social expectations and could manage the expectations through public disclosure of
information. In addition, there was a plausible link between larger companies paying higher
executive directors’ remuneration and thus, incurring greater public scrutiny. The additional
analysis on industrial differences also showed that the level of disclosure of executive
directors’ remuneration may be determined by industry specific differences.
From a signalling theory perspective, more profitable companies have more incentives to
disclose more information. The results of this study found evidence to support this
hypothesis. However, for the periodic analysis, the positive association was not significant in
the sample year of 2000. This may be attributed to a recovery phase in the capital market
after the financial crisis.
The final paradigm considered is proprietary costs that were proxied by companies’ future
growth. The results showed that the level of growth to positively and significantly improved
the probability of disclosure of individual executive director’s remuneration. Companies with
higher growth potential may weigh the marginal benefits of disclosing proprietary
information on individual remuneration to be more than the marginal costs of not disclosing
them. Competition for external finance may have driven them to risk incurring proprietary

269
costs. The results of the other hypothesis tests (total, voluntary and periodic) were
inconsistent and this may be because of the large variation in the level of growth over the
sample period.
The multivariate analysis of comparison between high and low scoring companies showed
that corporate governance mechanisms of independent directors and audit quality worked
differently in different disclosure environment. Only the dummies for the years were
significant across the two groups, the other variables varied. In addition, the results showed
that regulations played a greater role than the theoretical variables in influencing the
disclosure policies of low disclosure companies. This is consistent with the findings of this
study that low disclosure companies conformed to the minimum of the disclosure
requirements. This implied that there was a need to have better and comprehensive disclosure
requirements that will ensure high disclosure across all companies.
The last chapter of this thesis will provide a final overview of this study, its findings and
implications, limitations of this research and directions for future studies.

270
Table 31 Summary of the results of the hypothesis testing48
Statement of hypothesis Exp. sign
Results Total score
Vol. score
Individual. disclosure
High tot. score
Low tot. score
High vol. score
Low vol. score
H1 That there was an improvement in the level of disclosure of executive directors’ remuneration by Malaysian companies after the introduction of the Malaysian Code on Corporate Governance and changes in accounting standards.
+ Supported p < 0.01
Supported p < 0.01
Supported p < 0.01
Supported p < 0.01
Supported p < 0.01
Supported p < 0.01
Supported p < 0.01
H2 That for Malaysian companies, there is an inverse association between the level of executive director’s remuneration disclosures and the level of family ownership.
- Supported p < 0.01
Supported p < 0.01
Supported p < 0.01
Supported p < 0.01
Not Supported
Supported p < 0.01
Not Supported
H3 That for Malaysian companies, there is an inverse association between the level of executive director’s remuneration disclosures and the level
- Not Supported
Not Supported
Supported p < 0.05
Not Supported
Not Supported49 p < 0.10 t = + 1.7734
Not Supported p < 0.10 t = + 1.6913
Not Supported
48 The results summarized here were a summary of the winsorised results. 49 The hypotheses were not supported because the signs of the coefficients were not as predicted.

271
of ownership concentration
H4 That for Malaysian companies, there is a positive association between the level of executive director’s remuneration disclosures and the level of government shareholdings.
+ Supported p < 0.05
Supported p < 0.01
Supported p < 0.01
Not Supported
Not Supported
Not Supported
Supported p < 0.05
H5 That for Malaysian companies, there is a positive association between the level of executive director’s remuneration disclosures and foreign ownership.
+ Not Supported
Not Supported
Not Supported
Not Supported
Not Supported
Not Supported
Not Supported
H6 That for Malaysian companies, there is an association between the level of executive director’s remuneration disclosures and the level of executive directors’ shareholdings
? Not Supported
Not Supported
Supported DDIROWN01 p < 0.05 DDIROWN0125 p < 0.01
Not Supported
Not Supported DDIROWN01 p < 0.05 t = -0.0258
Not Supported
Not Supported DDIROWN0025 p < 0.01 t = 0.0844
H7 That for Malaysian companies, there is a positive association between the level of executive director’s
+ Not Supported
Not Supported
Not supported p < 0.05 t = - 0.1231
Not Supported
Not Supported
Not Supported
Not Supported

272
remuneration disclosures and leverage.
H8 That for Malaysian companies, there is a positive association between the level of executive director’s remuneration disclosures and proportion of independent directors on the board.
+ Supported p < 0.01
Supported p < 0.01
Supported p < 0.10
Not Supported
Supported p < 0.05
Not Supported
Supported p < 0.01
H9 That for Malaysian companies, there is a positive association between the level of executive director’s remuneration disclosures and of external audit
+ Not Supported
Not Supported
Not Supported
Supported p < 0.10
Not supported
Supported p < 0.10
Not Supported
H10 That for Malaysian companies, there is a positive association between the level of executive director’s remuneration disclosures and company size.
+ Supported p < 0.01
Supported p < 0.01
Not Supported
Supported p < 0.01
Not Supported
Supported p < 0.10
Not Supported
H11 That for Malaysian companies, there is a positive association
+ Supported p < 0.10
Supported p < 0.10
Supported p < 0.10
Supported p < 0.01
Not Supported
Not Supported
Not Supported

273
between the level of executive director’s remuneration disclosures and company profitability.
H12 That for Malaysian companies, there is a positive association between the level of executive director’s remuneration disclosures and company growth.
+ Not Supported
Not Supported
Supported p < 0.01
Supported p < 0.05
Not Supported
Not Supported
Not Supported

274
Chapter 7 Conclusions
7.0 Introduction This chapter provides an overview of the study with a summary of the research. It is followed by
a discussion of the implications of the empirical results on policy settings and corporate
governance mechanisms. It also addresses the limitations of the study and the directions for
future research on the disclosure of Malaysian directors’ remuneration.
7.1 Summary of research The first objective of this study was to examine the effectiveness of the reforms to the Malaysian
regulations on the disclosure of executive directors’ remuneration. The reforms included the
Malaysian Code of Corporate Governance ‘the MCCG’, the Bursa Malaysia Listing Rule, the
FRS 2 ‘Share Based Payments’ and the FRS 124 ‘Related Party Transactions’. The study
considered the level of disclosure of executive directors’ remuneration before and after the
implementations of the reforms. The second objective was to fill in the gaps in existing studies of
the disclosure of executives’ remuneration. The final objective was to employ different
theoretical models to explain the disclosure policies on executive directors’ remuneration. These
objectives led to the following research questions:
What was the level of total and voluntary disclosure of Malaysian executive directors’
remuneration before and after the reforms to the Malaysian regulatory framework?
Were the reforms to the Malaysian regulatory framework on the disclosure of executive
directors’ remuneration effective in improving the level of disclosure of Malaysian executive
directors’ remuneration? Was there any resistance to the evolving regulatory changes on the
disclosure framework?

275
What were the determinants of the level of disclosure of Malaysian executive directors’
remuneration? Can agency theory, legitimacy theory, signaling theory and proprietary costs
explain the level of disclosure of executive directors’ remuneration?
This study examined a sample of 200 publicly listed companies from 2001 to 2008. The
companies were manually scored based on a disclosure index constructed on the Malaysian
regulatory framework on disclosure and prior studies. The analysis was based on an unbalanced
panel dataset.
The key findings of the study were:
Univariate analysis
The results of the univariate analysis (non-parametric tests) found significant improvements in
the level of disclosure of executive directors’ remuneration throughout the evolving reforms to
the Malaysian disclosure framework. This suggested that the reforms were successful in
improving the level of disclosure of executive directors’ remuneration. However, the descriptive
analysis also found some significant weaknesses in the regulations. Some of the issues identified
were inconsistencies between the various regulations, ineffectiveness of the ‘opt out clause’, lack
of comprehensive disclosure of remuneration policies, partial compliance to accounting
standards and a significant reluctance to disclose individual remuneration. A significant number
of Malaysian companies also resorted to a pattern of disclosing only the minimum requirements
of the regulatory framework.

276
The results of the univariate analysis also showed significant differences in the characteristics of
companies with high and low disclosures of executive directors’ remuneration. The results found
that government ownership50, independent directors, company size, profitability and foreign
ownership influenced the differences in high and low scoring companies.
Bivariate analysis
The results of the bivariate analysis confirmed the validity of integrating the different theoretical
perspectives (agency theory, legitimacy theory, signaling theory and proprietary costs) into a
single research empirical framework. The analysis showed interactions between the proxies for
the different theories in determining the level of disclosure of executive directors’ remuneration.
Multivariate analysis
The multivariate analysis provided further evidence that there was improvement in the level of
disclosure of executive directors’ remuneration after the reforms. The reforms were effective in
improving the overall level of disclosure of executive directors’ remuneration but failed to
significantly improve the level of disclosure of individual executive director’s remuneration.
This disclosure is arguably the most significant information in the assessment of executive
director’s performance. The result also showed that the regulations’ weaknesses were exploited
by low disclosing companies who reverted to the disclosure of minimum information.
50 Only for voluntary disclosure
277
The introduction of the MCCG and reforms to the accounting standards did not weaken the
traditional influence of family shareholdings over Malaysian companies’ disclosure policies. All
the analysis showed that the association between family shareholdings and the disclosure of
executive directors’ remuneration is consistently significant and negative. The result suggests
that family owners view disclosure of executive directors’ remuneration as sensitive information
that may threatened their control over the companies. Extensive disclosure on executive
remuneration, especially on individual director’s remuneration may expose exploitation of
minority shareholders and the consumption of private benefits by family managers.
The results of the hypothesis tests of the effects of the other ownership variables on ownership
concentration were mixed. The inconsistencies may be attributed to correlation between
ownership concentration and other ownership variables (family, foreign and government). A
lower proportion of executive directors’ shareholdings were shown to improve the level of
disclosure of executive directors’ remuneration. The level of debt was only shown to
significantly limit the probability of disclosure of individual executive director’s remuneration.
An increase in the proportion of independent directors was shown to be effective in improving
the level of disclosure of executive directors’ remuneration especially in low disclosure
companies. These were inconsistent with some preconceived notions that these directors were
not truly independent and were controlled by ‘insiders’. The periodic analysis also showed that
there was a plausible size threshold where the board would more effective in influencing
disclosure policy. The influence of audit quality on the disclosure of executive directors’

278
remuneration was shown to improve after the introduction of the reforms and was stronger in
high disclosure companies.
The result of this study provided evidence for legitimacy theory. It found that company size as a
proxy for the theory was significantly associated with the level of disclosure of executive
directors’ remuneration. The results also supported the notion of signaling theory that better
performed companies will disclose more information. Finally, contrary to expectations,
companies with higher risks of incurring proprietary costs were more likely to disclose the
remuneration of individual executive directors.
7.2 Implications of the findings
Although the study found a significant improvement in the level of disclosure of executive
directors’ remuneration after the reforms, the results also suggested that Malaysian regulators
may have to strengthen the disclosure requirements. The ‘opt out’ clause in the MCCG and the
broad nature of FRS 124 ‘Related Party Transactions’ may need to be replaced by more detailed
and prescriptive requirements to ensure adequate disclosure of executive directors’ remuneration.
The term ‘key management personnel’ in the FRS 124 should be replaced by a term that is more
clearly defined and specifies the requirements for the disclosure of individual remuneration. The
Australian regulators had a similar experience with companies taking advantage of broad
disclosure requirements and ambiguous terms. They have since now given way to a more black
letter approach to disclosure requirements. The Australian disclosure requirements are now very
comprehensive and spell out clearly the ‘required’ disclosures of executives’ remuneration.

279
There is also a need to remove the inconsistencies between the MCCG and the Bursa Malaysia
Listing Rules. The mandatory requirements of the Listing Rule to disclose remuneration
according to bands provided an ‘escape route’ for companies not wanting to disclose individual
executive director’s remuneration as it was only voluntary under the MCCG. The disclosure of
individual remuneration would provide more information to investors than disclosure by bands.
This is especially important in assessing the performance of the executive directors as agents for
the shareholders.
If the MCCG was maintained at a voluntary level, greater enforcement would be needed to
ensure that companies provided valid and comprehensive statements to justify departures from
the recommendations of the MCCG. The level of compliance to the mandatory accounting
standards also indicated that there was a need for better enforcement of the standards. Companies
were lax in their application of the full requirements of the standards and only applied part of the
requirements. External auditors also appeared not to push for disclosure of executive directors’
remuneration in accordance with the full requirements of the mandatory accounting standards.
The dominance exerted on disclosure policies by family shareholder in protecting their own self-
interest provides another strong reason to change the approach in the Malaysian regulatory
framework on disclosure. A voluntary approach and broad based standards were shown in this
study not to be sufficient to mitigate the dominant family influence on Malaysian companies.
The presence of other players such as regulators, foreign investors and creditors in the market,
has also been shown as not strong enough to offset the power exerted by families. The Malaysian

280
government’s current goal of divesting its shareholdings in listed companies may also remove
the positive influence that government ownership had on disclosure policies.
Regulators may also need to embark on a greater campaign to educate investors especially
minority shareholders of their rights to information and the existing regulations on the disclosure
framework. This may increase the demands for higher quality and comprehensive information on
executive directors’ remuneration. The efforts of independent groups such as the Minority
Shareholders’ Watchdog Group in compiling annual corporate governance index that included
assessment directors’ remuneration needs to be supported and sustained.
7.3 Limitations of the study Firstly, the study may be constrained by omitted variables that may influence the level of
disclosure of executive directors’ remuneration. For example, the study did not directly consider
the unique cultural characteristics of Malaysian companies such as multi-ethnicity, religions and
education that could influence the level of disclosure. Using the Hofstede-Gray societal values,
Haniffa and Cooke (2002) identified the differences in the ethnics of the Malays and Chinese
who made off majority of the Malaysian population. The Malays are relatively more secretive
than the Chinese. The Chinese are less risk averse than the Malays. These different cultural traits
may influence the level of disclosure in Malaysia. Haniffa and Cooke (2002) suggested that
Malaysian regulators may have faced a backlash from threatened parties if regulatory measures
are focused around cultural or ethnic differences. A corporate governance code that was seen to
protect one ethnic interest over the other may result in secrecy by the threatened or
disadvantaged ethnic. However, an examination of the ownership variables may indirectly reflect

281
these cultural differences as they should reflect the ownership composition in Malaysian market.
The study also did not include all corporate governance measures that a company can implement.
It focused on the measures that had key roles in disclosure policies. However, other corporate
governance mechanisms such as audit and remuneration committees and policies on CEO duality
may have an indirect association with the level of disclosure of executive directors’
remuneration.
The second limitation is the disclosure of remuneration information in channels other than
annual reports. Jinghui and Taylor (2008) showed that the debate on remuneration may affect the
personal legitimacy of the executives rather than the their companies. The executives may react
by personally addressing the issue through personal mail and verbal statements at the Annual
General Meetings rather than through disclosure of information in the annual reports. This study
only considered the disclosure of remuneration information in the annual reports. The disclosure
of remuneration information in alternative channels may affect the comprehensiveness of the
disclosure index.
Another limitation that is linked to the disclosure index is the manual scoring of the annual
reports. This method is susceptible to subjectivity and bias on the part of the researcher.
However, steps were undertaken to limit the potential for researcher bias and errors. The annual
reports were read in their entirety before being scored in the second read. The scoring index had
clear instructions and was supported by examples. In addition, a random and independent
verification was done by another researcher on the ongoing data scoring and final data scores.

282
Another potential limitation is the use of proxies for the various theoretical constructs. For
example, the use of size as an independent variable may be a proxy for various theoretical
assumptions and be subjected to various theoretical interpretations (Depoers 2000). Watts and
Zimmerman (1986) argued size can be ‘noisy’ proxy for political costs. It can also have high
correlation with other independent variables rendering simultaneous analysis or multiple
regression results ineffective. Jinghui and Taylor (2008) argued that size can be a proxy for
extraneous variables such as disclosure capability in terms of expertise and finance. Another
example was the use of the profitability ratio (ROE) as a proxy for legitimacy. This may be
contrary to the argument that legitimacy is not only defined by economic measures. However,
Patten (1991) argued that a social measure is harder to obtain. Thus, profitability might be the
best proxy.
The final potential limitation of this study is the popularity of nominee accounts in the Malaysian
capital market. For example, there has been an increase of 85 percent in capital investments by
nominees account holders from 1997 to 2006. The use of nominees as an investment medium
may provide investors with a certain anonymity. This may limit the accuracy of the ownership
variables that were applied in this study. For example, foreign shareholders may use domestic
nominee companies to act on their behalf. The list of shareholdings will only list the names of
nominee companies and not the individual shareholder’s identity or nationality. Mohd Ghazali
and Weetman (2006) argued that Malaysian government policies on equity redistribution
according to race have also increased the popularity of nominee accounts. However, there should
be minimal impact on the measurement of family and executive directors’ shareholdings because

283
the Listing Rule and accounting standards required disclosure of direct and indirect
shareholdings of related parties.
7.4 Directions for future research Future studies may consider including cultural, ethnicity and religious elements into the overall
empirical framework. Unlike the Western market, culture and religion are integral parts of doing
business in Asian countries including Malaysia. The modified Hofstede-Gray societal values
index constructed by Haniffa and Cooke (2002) provides a good framework for examining the
influence that these different social traits may have on the level of disclosure of Malaysian
executive directors’ remuneration. The modified index included unique Malaysian social values
that may be determined by racial profiles (Malay and non-Malays, Chinese and non-Chinese)
and religious beliefs (Muslims and non-Muslims).
The scope of the disclosure may be expanded to include disclosure of executive directors’
remuneration via other formal and informal channels, such as interim reports, letters to
shareholders, external remuneration surveys and press releases. The inclusion of the disclosure of
remuneration in alternative channels may improve the empirical findings. In addition, external
remuneration surveys, if accessible, may prove to be valuable in providing inputs into whether
benchmarks are used efficiently by companies in setting their remuneration policies and on
whether extensive remuneration information is more readily available privately rather than in the
public domain. Future studies may also consider the association between executive directors’
remuneration and companies’ performance. This is another area that has been extensively
researched in American and European capital markets but not in a Malaysian context.
284
7.5 Concluding remarks This study has filled the gaps in existing studies on disclosure of executives’ remuneration by
integrating different theoretical paradigms. It also provided a comprehensive overview of the
disclosure of Malaysian executive directors’ remuneration during the evolving Malaysian
regulatory framework on disclosure. This study showed that the reforms are effective in
improving the level of disclosure of executive directors’ remuneration. However, there were
significant weaknesses in the reforms that were exploited by Malaysian companies and need to
be improved by the regulators. The improvement in the level of disclosure of executive directors’
remuneration after the reforms provided a positive indicator of the move to greater corporate
transparency and good governance after the East Asian financial crisis. However, there is still a
need to consider or curtail the traditional dominance exerted by family shareholders in the
implementations and enforcement of existing and future regulations. Under such an environment,
a ‘hybrid’ approach to regulations may need to give way to a stronger mandatory and
prescriptive regulatory framework.

285
Reference List
Abrahamson, E & Park, C 1994, 'Concealment of negative organizational outcomes: An agency theory perspective', The Academy of Management Journal, vol. 37, no. 5, pp. 1302-1334. Adam, T & Goyal, VK 2008, 'The investment opportunity set and its proxy variables', Journal of Financial Research, vol. 31, no. 1, pp. 41-63. Advance Synergy Berhad 2007, 'Annual Reports'. Aharony, J, Barniv, R & Falk, H 2010, 'The impact of mandatory IFRS adoption on equity valuation of accounting numbers for security investors in the EU', paper presented to Higher Degree by Research Seminar, University of Adelaide, 24 April 2010. Ahmad, NNN & Sulaiman, M 2004, 'Environmental disclosures in Malaysian annual reports: A legitimacy theory perspective', International Journal of commerce & management, vol. 14, no. 1, pp. 44-58. Aik Leng, AC & Abu Mansor, S 2005, 'Can Good Corporate Governance Practices Contribute to Firms' Financial Performance- Evidence from Malaysian Companies', International Journal of Business Governance and Ethics, vol. 1, no. 4, pp. 350-362. Amihud, Y & Lev, B 1981, 'Risk reduction as a managerial motive for conglomerate mergers', The Bell Journal of Economics, pp. 605-617. Andjelkovic, A, Boyle, G & McNoe, W 2002, 'Public disclosure of executive compensation: Do shareholders need to know?', Pacific-Basin Finance Journal, vol. 10, no. 1, pp. 97-117. Ashforth, BE & Gibbs, BW 1990, 'The double-edge of organizational legitimation', Organization science, vol. 1, no. 2, pp. 177-194. Babío Arcay, MR & Muiño Vázquez, MF 2005, 'Corporate Characteristics, Governance Rules and the Extent of Voluntary Disclosure in Spain', Advances in Accounting, vol. 21, pp. 299-331. Baker, GP, Jensen, MC & Murphy, KJ 1988, 'Compensation and Incentives: Practice vs. Theory', Journal of Finance, vol. 43, no. 3, pp. 593-616. Baltagi, B 2008, Econometric Analysis of the Panel Data, 3 edn, John Wiley & Sons Ltd, Sussex, UK. Bamber, LS & Cheon, YS 1998, 'Discretionary management earnings forecast disclosures: Antecedents and outcomes associated with forecast venue and forecast specificity choices', Journal of Accounting Research, vol. 36, no. 2, pp. 167-190.

286
Barako, DG, Hancock, P & Izan, HY 2006, 'Factors Influencing Voluntary Corporate Disclosure by Kenyan Companies', Corporate Governance: An International Review, vol. 14, no. 2, pp. 107-125. Bartov, E & Bodnar, GM 1996, 'Alternative accounting methods, information asymmetry and liquidity: Theory and evidence', Accounting Review, pp. 397-418. Bassett, M, Koh, PS & Tutticci, I 2007, 'The Association between Employee Stock Option Disclosures and Corporate Governance: Evidence from An Enhanced Disclosure Regime', The British Accounting Review, vol. 39, no. 4, pp. 303-322. Bathala, CT & Rao, RP 1995, 'The determinants of board composition: An agency theory perspective', Managerial and Decision Economics, vol. 16, no. 1, pp. 59-69. Belkaoui, A & Karpik, PG 1989, 'Determinants of the corporate decision to disclose social information', Accounting, Auditing & Accountability Journal, vol. 2, no. 1. Berger, PG & Hann, RN 2002, 'Segment Disclosures, Proprietary Costs, and the Market for Corporate Control', SSRN eLibrary. Berle, A & Means, G 1932, The Modern Corporation and Private Property, MacMillan, New York. Berle, AA & Means, GC 1932, 'The Modern Corporation and Private Property', Chicago: Commerce Clearing House. Bin, K, Petroni, K & Safieddine, A 1999, 'Ownership concentration and sensitivity of executive pay to accounting performance measures: Evidence from publicly and privately-held insurance companies', Journal of Accounting & Economics, vol. 28, no. 2, pp. 185-209. Birt, JL, Bilson, CM, Smith, T & Whaley, RE 2006, 'Ownership, competition, and financial disclosure', Australian Journal of Management, vol. 31, no. 2, p. 235. Bizjak, JM, Lemmon, ML & Naveen, L 2008, 'Does the use of peer groups contribute to higher pay and less efficient compensation?', Journal of Financial Economics, vol. 90, no. 2, pp. 152-168. Botosan, CA 1997, 'Disclosure level and the cost of equity capital', Accounting Review, pp. 323-349. Botosan, CA & Plumlee, MA 2002, 'A re examination of disclosure level and the expected cost of equity capital', Journal of Accounting Research, vol. 40, no. 1, pp. 21-40. Bowman, EH & Haire, M 1975, 'A strategic posture toward corporate social responsibility', California Management Review, vol. 18, no. 2, pp. 49-58.

287
Brammer, S & Pavelin, S 2008, 'Factors influencing the quality of corporate environmental disclosure', Business Strategy and the Environment, vol. 17, no. 2, pp. 120-136. Branco, MC & Rodrigues, LL 2006, 'Communication of corporate social responsibility by Portuguese banks: A legitimacy theory perspective', Corporate Communications: An International Journal, vol. 11, no. 3, pp. 232-248. Breton, G & Côté, L 2006, 'Profit and the legitimacy of the Canadian banking industry', Accounting, Auditing & Accountability Journal, vol. 19, no. 4, pp. 512-539. Brickley, JA & James, CM 1987, 'The takeover market, corporate board composition, and ownership structure: The case of banking', Journal of Law and Economics, vol. 30, no. 1, pp. 161-180. Bryan, S, Hwang, LS & Lilien, S 2000, 'CEO stock-based compensation: An empirical analysis of incentive-intensity, relative mix, and economic determinants', Journal of Business, vol. 73, no. 4, pp. 661-693. Burkart, M & Panunzi, F 2006, 'Agency conflicts, ownership concentration, and legal shareholder protection', Journal of Financial Intermediation, vol. 15, no. 1, pp. 1-31. Bushee, BJ & Noe, CF 2000, 'Corporate disclosure practices, institutional investors, and stock return volatility', Journal of Accounting Research, vol. 38, pp. 171-202. Cahan, SF & Hossain, M 1996, 'The investment opportunity set and disclosure policy choice: Some Malaysian evidence', Asia Pacific Journal of Management, vol. 13, no. 1, pp. 65-85. Cassar, G & Holmes, S 2003, 'Capital structure and financing of SMEs: Australian evidence', Accounting & Finance, vol. 43, no. 2, pp. 123-147. Chalmers, K & Godfrey, J 2004, 'Reputation costs: the impetus for voluntary derivative financial instrument reporting', Accounting, Organizations and Society, vol. 29, no. 2, pp. 95-125. Chang, LS, Most, KS & Brain, CW 1983, 'The utility of annual reports: An international study', Journal of International Business Studies, pp. 63-84. Chau, GK & Gray, SJ 2002, 'Ownership structure and corporate voluntary disclosure in Hong Kong and Singapore', The International Journal of Accounting, vol. 37, no. 2, pp. 247-265. Chen, CJP & Jaggi, B 2000, 'Association between Independent Non-executive Directors, Family Control and Financial Disclosures in Hong Kong', Journal of Accounting and Public Policy, vol. 19, no. 4-5, pp. 285-310. Chieh, YH 2011, 'Genting directors highest paid, Nazir took pay cut in 2010', The Malaysian Insider, viewed 1 September 2011,

288
<http://www.themalaysianinsider.com/business/article/genting-director-highest-paid-nazir-took-pay-cut-in-2010/>. Chizema, A 2008, 'Institutions and voluntary compliance: The disclosure of individual executive pay in Germany', Corporate Governance: An International Review, vol. 16, no. 4, pp. 359-374. Chow, CW & Wong-Boren, A 1987, 'Voluntary Financial Disclosure by Mexican Corporations', The Accounting Review, vol. 62, no. 3, pp. 533-541. Claessens, S, Djankov, S & Lang, LHP 2000, 'The separation of ownership and control in East Asian Corporations', Journal of Financial Economics, vol. 58, no. 1-2, pp. 81-112. Clarkson, P, Van Bueren, A & Walker, J 2005, 'Evidence on the Link between CEO Remuneration and Company Performance ', Woking Paper, Australian National University, <http://ecocomm.anu.edu.au/fas/pdf/28oct2005.pdf>. —— 2006, 'Chief executive officer remuneration disclosure quality: corporate responses to an evolving disclosure environment', Accounting and Finance, vol. 46, no. 5, pp. 771-796. Clarkson, PM, Kao, JL & Richardson, GD 1994, 'The Voluntary Inclusion of Forecasts in the MD&A Section of Annual Reports*', Contemporary Accounting Research, vol. 11, no. 1, pp. 423-450. Clinch, G & Verrecchia, RE 1997, 'Competitive Disadvantage and Discretionary Disclosure in Industries', Australian Journal of Management, vol. 22, no. 2, 12, pp. 125-137. Cohen, R, Hall, B & Viceira, L 2000, 'Do Executive Stock Options Encourage Risk Taking?', Working Paper, Harvard Business School, <http://www.people.hbs.edu/lviceira/cohallvic3.pdf>. Conlon, EJ & Parks, JML 1990, 'Effects of monitoring and tradition on compensation arrangements: An experiment with principal-agent dyads', Academy of Management Journal, pp. 603-622. Conyon, MJ, Mallin, C & Sadler, G 2002, 'The disclosure of directors' share option information in UK companies', Applied Financial Economics, vol. 12, no. 2, pp. 95-103. Cooke, TE 1989, 'Voluntary Corporate Disclosure by Swedish Companies', Journal of International Financial Management & Accounting, vol. 1, no. 2, pp. 171-195. Core, JE & Guay, WR 2002, The Other Side of the Trade-Off: The Impact of Risk on Executive Compensation: A Revised Comment, SSRN, <http://ssrn.com/paper=292955 >. Core, JE, Holthausen, RW & Larcker, DF 1999, 'Corporate governance, chief executive officer compensation, and firm performance', Journal of Financial Economics, vol. 51, no. 3, pp. 371-406.

289
Cormier, D & Gordon, IM 2001, 'An examination of social and environmental reporting strategies', Accounting, Auditing & Accountability Journal, vol. 14, no. 5, pp. 587-617. Coulton, JJ, James, C & Taylor, SL 2001, The Effect of Compensation Design and Corporate Governance on the Transparency of CEO Compensation Disclosures, SSRN, <http://ssrn.com/paper=273628 >. Cowen, S, Linda, B & Scott, S 1987, 'The impact of corporate characteristics on social responsibility disclosure: a typology and frequency-based analysis', Accounting, Organizations and Society, vol. 12, no. 2, pp. 111-122. Cowen, SS, Ferreri, LB & Parker, LD 1987, 'The impact of corporate characteristics on social responsibility disclosure: a typology and frequency-based analysis', Accounting, Organizations and Society, vol. 12, no. 2, pp. 111-122. Craswell, AT & Taylor, SL 1992, 'Discretionary disclosure of reserves by oil and gas companies: an economic analysis', Journal of Business Finance & Accounting, vol. 19, no. 2, pp. 295-308. Crutchley, CE & Hansen, RS 1989, 'A test of the agency theory of managerial ownership, corporate leverage, and corporate dividends', Financial Management, vol. 18, no. 4, pp. 36-46. Darrough, MN & Stoughton, NM 1990, 'Financial disclosure policy in an entry game', Journal of Accounting and Economics, vol. 12, no. 1-3, pp. 219-243. Debreceny, R & Rahman, A 2005, 'Firm-specific determinants of continuous corporate disclosures', The International Journal of Accounting, vol. 40, no. 3, pp. 249-278. Deegan, C 2002, 'Introduction: the legitimising effect of social and environmental disclosures–a theoretical foundation', Accounting, Auditing & Accountability Journal, vol. 15, no. 3, pp. 282-311. Deegan, C & Hallam, A 1991, 'The voluntary presentation of value added statements in Australia: A political cost perspective', Accounting & Finance, vol. 31, no. 1, pp. 1-21. Depoers, F 2000, 'A cost benefit study of voluntary disclosure: some empirical evidence from French listed companies', European Accounting Review, vol. 9, no. 2, pp. 245-263. Dhaliwal, DS 1980, 'The effect of the firm's capital structure on the choice of accounting methods', Accounting Review, pp. 78-84. DiMaggio, PJ & Powell, WW 1983, 'The iron cage revisited: Institutional isomorphism and collective rationality in organizational fields', American sociological review, pp. 147-160. Dowling, J & Pfeffer, J 1975, 'Organizational legitimacy: Social values and organizational behavior', The Pacific Sociological Review, vol. 18, no. 1, pp. 122-136.

290
Dye, RA 1985, 'Disclosure of nonproprietary information', Journal of Accounting Research, vol. 23, no. 1, pp. 123-145. —— 1986, 'Proprietary and nonproprietary disclosures', Journal of Business, pp. 331-366. Easterbrook, FH 1984, 'Two Agency-Cost Explanations of Dividends', American Economic Review, vol. 74, no. 4, p. 650. Eisenhardt, KM 1989, 'Agency theory: An assessment and review', The Academy of Management Review, vol. 14, no. 1, pp. 57-74. Eisenhardt, KM & Bourgeois III, LJ 1988, 'Politics of strategic decision making in high-velocity environments: Toward a midrange theory', Academy of Management Journal, pp. 737-770. Eng, LL & Mak, YT 2003, 'Corporate governance and voluntary disclosure', Journal of Accounting and Public Policy, vol. 22, no. 4, pp. 325-345. Fama, EF 1980, 'Agency Problems and the Theory of the Firm', Journal of Political Economy, vol. 88, no. 2, p. 288. Fama, EF & Jensen, MC 1983, 'Separation of Ownership and Control', Journal of Law & Economics, vol. 26, no. 2, pp. 301-326. Fan, JPH & Wong, TJ 2002, 'Corporate ownership structure and the informativeness of accounting earnings in East Asia* 1', Journal of Accounting and Economics, vol. 33, no. 3, pp. 401-425. Ferris, SP, Jagannathan, M & Pritchard, AC 2003, 'Too busy to mind the business? Monitoring by directors with multiple board appointments', The Journal of Finance, vol. 58, no. 3, pp. 1087-1111. Finance Committee on Corporate Governance 2000, The Malaysian Code on Corporate Governance Securities Commission Malaysia, Kuala Lumpur. Firth, M 1979, 'The impact of size, stock market listing, and auditors on voluntary disclosure in corporate annual reports', Accounting and Business Research, vol. 9, no. 36, pp. 273-280. Forker, JJ 1992, 'Corporate governance and disclosure quality', Accounting and Business Research, vol. 22, no. 86, pp. 111-124. Francis, JR, Khurana, IK & Pereira, R 2005, 'Disclosure incentives and effects on cost of capital around the world', Accounting Review, vol. 80, no. 4, p. 1125. Frankel, R, Kothari, S & Weber, J 2006, 'Determinants of the informativeness of analyst research', Journal of Accounting and Economics, vol. 41, no. 1-2, pp. 29-54.

291
Friedman, M 1962, Capitalism and Freedom, Chicago: University of Chicago Press. Fry, F & Hock, RJ 1976, 'Who claims corporate responsibility? The biggest and the worst', Business and society Review, vol. 18, no. 62, p. 5. Garcia-Meca, E & Martinez, I 2007, 'The use of intellectual capital information in investment decisions:: An empirical study using analyst reports', The International Journal of Accounting, vol. 42, no. 1, pp. 57-81. Gaver, JJ & Gaver, KM 1993, 'Additional evidence on the association between the investment opportunity set and corporate financing, dividend, and compensation policies', Journal of Accounting and Economics, vol. 16, no. 1-3, pp. 125-160. Gelb, DS 2000, 'Managerial ownership and accounting disclosures: an empirical study', Review of Quantitative Finance and Accounting, vol. 15, no. 2, pp. 169-185. Gelb, DS & Zarowin, P 2002, 'Corporate disclosure policy and the informativeness of stock prices', Review of Accounting Studies, vol. 7, no. 1, pp. 33-52. Gomez-Mejia, LR, Tosi, H & Hinkin, T 1987, 'Managerial Control, Performance, and Executive Compensation', Academy of Management Journal, vol. 30, no. 1, pp. 51-70. Gray, R, Owen, D & Adams, C 1996, Accounting & Accountability: changes and challenges in corporate social and environmental reporting, Prentice Hall. Gray, SJ 1988, 'Towards a Theory of Cultural Influence on the Development of Accounting systems Internationally', Abacus, vol. 24, no. 1, pp. 1-15. Green, SB 1991, 'How many subjects does it take to do a regression analysis', Multivariate behavioral research, vol. 26, no. 3, pp. 499-510. Grossman, SJ 1981, 'The informational role of warranties and private disclosure about product quality', Journal of Law and Economics, pp. 461-483. Guedhami, O & Pittman, JA 2006, 'Ownership concentration in privatized firms: The role of disclosure standards, auditor choice, and auditing infrastructure', Journal of Accounting Research, vol. 44, no. 5, pp. 889-929. Gujarati, D 1995, Basic Econometrics, McGraw Hill, USA. Gul, FA & Leung, S 2004, 'Board leadership, outside directors' expertise and voluntary corporate disclosures', Journal of Accounting and Public Policy, vol. 23, no. 5, pp. 351-379. Hagerman, RL & Zmijewski, ME 1979, 'Some economic determinants of accounting policy choice', Journal of Accounting and Economics, vol. 1, no. 2, pp. 141-161.

292
Hall, BJ & Liebman, JB 1998, 'Are CEOS Really Paid Like Bureaucrats?', Quarterly Journal of Economics, vol. 113, no. 3, pp. 653-691. Hamid, FZA 2004, 'Corporate social disclosure by banks and finance companies: Malaysian evidence', Corporate Ownership Control, vol. 1, no. 4, pp. 118-131. Haniffa, RM & Cooke, TE 2002, 'Culture, Corporate Governance and Disclosure in Malaysian Corporations', Abacus, vol. 38, no. 3, pp. 317-349. Harris, MS 1998, 'The association between competition and managers' business segment reporting decisions', Journal of Accounting Research, vol. 36, no. 1, pp. 111-128. Hermalin, BE & Weisbach, MS 1988, 'The determinants of board composition', The RAND Journal of Economics, vol. 19, no. 4, pp. 589-606. Hill, CWL & Jones, TM 1992, 'Stakeholder-agency theory', Journal of management studies, vol. 29, no. 2, pp. 131-154. Ho, SSM, Lam, KCK & Sami, H 2004, 'The investment opportunity set, director ownership, and corporate policies: evidence from an emerging market', Journal of Corporate Finance, vol. 10, no. 3, pp. 383-408. Ho, SSM & Shun Wong, K 2001, 'A Study of the Relationship between Corporate Governance Structures and the Extent of Voluntary Disclosure', Journal of International Accounting, Auditing and Taxation, vol. 10, no. 2, pp. 139-156. Hofstede, G & Bond, MH 1984, 'Hofstede's culture dimensions', Journal of Cross-Cultural Psychology, vol. 15, no. 4, p. 417. Holmstrom, B 1979, 'Moral hazard and observability', Bell Journal of Economics, vol. 10, no. 1, Spring79, pp. 74-91. Hope, OK 2003, 'Disclosure practices, enforcement of accounting standards, and analysts' forecast accuracy: An international study', Journal of Accounting Research, vol. 41, no. 2, pp. 235-272. Hossain, M, Ahmed, K & Godfrey, JM 2005, 'Investment opportunity set and voluntary disclosure of prospective information: a simultaneous equations approach', Journal of Business Finance & Accounting, vol. 32, no. 5 6, pp. 871-907. Huafang, X & Jianguo, Y 2007, 'Ownership structure, board composition and corporate voluntary disclosure: Evidence from listed companies in China', Managerial Auditing Journal, vol. 22, no. 6, pp. 604-619.

293
Hutchings, G & Taylor, DW 2000, 'The Intra-industry Effects of a Major Environmental Event on Cumulative Abnormal Returns and Environmental Disclosures in the Mining Industry', Asian Review of Accounting, vol. 8, no. Special, pp. 33-54. Inchausti, AG 1997, 'The influence of company characteristics and accounting regulation on information disclosed by Spanish firms', European Accounting Review, vol. 6, no. 1, pp. 45-68. James, HS 1999, 'Owner as Manager, Extended Horizons and the Family Firm', International Journal of the Economics of Business, vol. 6, no. 1, pp. 41 - 55. Jensen, MC 1983, Organization Theory and Methodology, SSRN, <http://ssrn.com/paper=94036 >. Jensen, MC & Meckling, WH 1976, Theory of the Firm: Managerial Behavior, Agency Costs and Ownership Structure, SSRN, <http://ssrn.com/paper=94043 >. Jensen, MC & Murphy, KJ 1990, 'Performance Pay and Top-Management Incentives', Journal of Political Economy, vol. 98, no. 2, pp. 225-264. Jensen, MC, Murphy, KJ & Wruck, EG 2004, Remuneration: Where We've Been, How We Got to Here, What are the Problems, and How to Fix Them, SSRN, <http://ssrn.com/paper=561305>. Jung, WO & Kwon, YK 1988, 'Disclosure when the market is unsure of information endowment of managers', Journal of Accounting Research, vol. 26, no. 1, pp. 146-153. Khurana, IK, Martin, X & Pereira, R 2006, 'Financial development and the cash flow sensitivity of cash', Journal of Financial and Quantitative Analysis, vol. 41, no. 4, p. 787. Khurana, IK, Pereira, R & Martin, X 2006, 'Firm growth and disclosure: An empirical analysis', Journal of Financial and Quantitative Analysis, vol. 41, no. 02, pp. 357-380. Kia Lim Berhad 2005, Annual Reports, Kuala Lumpur. Kosnik, RD 1990, 'Effects of board demography and directors' incentives on corporate greenmail decisions', Academy of Management Journal, pp. 129-150. Kothari, S 2000, 'The role of financial reporting in reducing financial risks in the market', vol. 44, pp. 89-102. La Porta, R, Lopez-De-Silanes, F & Shleifer, A 1999, 'Corporate Ownership Around the World', The Journal of Finance, vol. 54, no. 2, pp. 471-517. La Porta, R, Lopez-de-Silanes, F, Shleifer, A & Vishny, R 2000, 'Investor protection and corporate governance* 1', Journal of Financial Economics, vol. 58, no. 1-2, pp. 3-27.

294
La Porta, R, Lopez-de-Silanes, F, Shleifer, A & Vishny, RW 2000, 'Agency Problems and Dividend Policies around the World', The Journal of Finance, vol. 55, no. 1, pp. 1-33. Laksmana, I 2008, 'Corporate Board Governance and Voluntary Disclosure of Executive Compensation Practices', Contemporary Accounting Research, vol. 25, no. 4, pp. 1147-1182. Lambert, RA 1983, 'Long-term contracts and moral hazard', Bell Journal of Economics, vol. 14, no. 2, pp. 441-452. Lang, M & Lundholm, R 1993, 'Cross-Sectional Determinants of Analyst Ratings of Corporate Disclosures', Journal of Accounting Research, vol. 31, no. 2, pp. 246-271. Leung, S & Horwitz, B 2004, 'Director ownership and voluntary segment disclosure: Hong Kong evidence', Journal of International Financial Management & Accounting, vol. 15, no. 3, pp. 235-260. Leuz, C & Verrecchia, RE 2000, 'The Economic Consequences of Increased Disclosure', Journal of Accounting Research, pp. 91-124. Lev, B & Penman, SH 1990, 'Voluntary forecast disclosure, nondisclosure, and stock prices', Journal of Accounting Research, vol. 28, no. 1, pp. 49-76. Lewellen, W, Loderer, C, Martin, K & Blum, G 1992, 'Executive Compensation and the Performance of the Firm', Managerial & Decision Economics, vol. 13, no. 1, pp. 65-74. Li, J 1994, 'Ownership structure and board composition: A multi country test of agency theory predictions', Managerial and Decision Economics, vol. 15, no. 4, pp. 359-368. Lim, S & McKinnon, J 1993, 'Voluntary disclosure by NSW statutory authorities: the influence of political visibility', Journal of Accounting and Public Policy, vol. 12, no. 3, pp. 189-216. Lindblom, CK 1983, 'The Concept of Organizational Legitimacy and its Implications for Corporate Social Responsibility Disclosure', American Accounting Association Public Interest Section. Liu, J & Taylor, D 2008, 'Legitimacy and corporate governance determinants of executives' remuneration disclosures', Corporate Governance: The International Journal of Effective Board Performance, vol. 8, no. 1, 02/20/, pp. 59-72. Liu, J, Taylor, D & Harris, K 2006, 'Legitimacy and Corporate Governance Determinants of the Disclosure of Executives’ Share Rights, Options andTermination Benefits', paper presented to UniSA Seminar Series, Adelaide. Luo, S, Courtenay, SM & Hossain, M 2006, 'The effect of voluntary disclosure, ownership structure and proprietary cost on the return-future earnings relation', Pacific-Basin Finance Journal, vol. 14, no. 5, pp. 501-521.

295
Makhija, AK & Patton, JM 2004, 'The impact of firm ownership structure on voluntary disclosure: Empirical evidence from Czech annual reports', Journal of Business, pp. 457-491. Meek, GK, Roberts, CB & Gray, SJ 1995, 'Factors Influencing Voluntary Annual Report Disclosures by U.S., U.K. and Continental European Multinational Corporations', Journal of International Business Studies, vol. 26, no. 3, pp. 555-572. Mercer, M 2005, 'The fleeting effects of disclosure forthcomingness on management’s reporting credibility', The Accounting Review, vol. 80, no. 2, pp. 723-744. Meyer, JW & Rowan, B 1977, 'Institutionalized organizations: Formal structure as myth and ceremony', American journal of sociology, pp. 340-363. Meyer, JW & Scott, W 1991, 'The organization of societal sectors: propositions and early evidence', The new institutionalism in organizational analysis, University of Chicago Press, Chicago, pp. 108-140. Meyer, JW & Scott, WR 1983, Organizational environments: Ritual and rationality, Sage, Beverly Hills, US. Miles, RH & Cameron, KS 1982, Coffin nails and corporate strategies, Prentice Hall. Milgrom, PR 1981, 'Good news and bad news: Representation theorems and applications', The Bell Journal of Economics, vol. 12, no. 2, pp. 380-391. Mobus, JL 2005, 'Mandatory environmental disclosures in a legitimacy theory context', Accounting, Auditing & Accountability Journal, vol. 18, no. 4, pp. 492-517. Mohd Ghazali, NA & Weetman, P 2006, 'Perpetuating traditional influences: Voluntary disclosure in Malaysia following the economic crisis', Journal of International Accounting, Auditing and Taxation, vol. 15, no. 2, pp. 226-248. Murphy, KJ 1985, 'Corporate performance and managerial remuneration : An empirical analysis', Journal of Accounting and Economics, vol. 7, no. 1-3, pp. 11-42. Naser, K & Nuseibeh, R 2003, 'Quality of Financial Reporting: Evidence from the Listed Saudi Non-financial Companies', The International Journal of Accounting, vol. 38, no. 1, pp. 41-69. Nelson, J & Majella, P 2005, 'The Transparency of Executive Stock Option Disclosures in Australian Annual Reports', Financial Reporting, Regulation and Governance, vol. 4, no. 2, pp. 1-32. Nelson, J & Percy, M 2008, 'Stock option disclosures of directors: where transparency can mask secrecy', Asian Review of Accounting, vol. 16, no. 3, pp. 185-196.

296
Nelson, JE & Percy, M 2005, 'The transparency of executive stock option disclosures in Australian annual reports', Financial Reporting, Regulation and Governance, vol. 4, no. 2. Neu, D, Warsame, H & Pedwell, K 1998, 'Managing public impressions: environmental disclosures in annual reports', Accounting, Organizations and Society, vol. 23, no. 3, pp. 265-282. Newman, P & Sansing, R 1993, 'Disclosure policies with multiple users', Journal of Accounting Research, vol. 31, no. 1, pp. 92-112. Newson, M & Deegan, C 2002, 'Global expectations and their association with corporate social disclosure practices in Australia, Singapore, and South Korea', The International Journal of Accounting, vol. 37, no. 2, pp. 183-213. Ngui, KS, Voon, ML & Lim, EA 2008, The Effects of Insider and Blockholder Ownerships on Firm Performance: The Mediating Role of Internal Governance Mechanisms, SSRN, <http://ssrn.com/paper=1095138 >. Noreen, E 1988, 'An empirical comparison of probit and OLS regression hypothesis tests', Journal of Accounting Research, vol. 26, no. 1, pp. 119-133. O’Donovan, G 2002, 'Environmental disclosures in the annual report: extending the applicability and predictive power of legitimacy theory', Accounting, Auditing & Accountability Journal, vol. 15, no. 3, pp. 344-371. Ow Yong, K & Guan, CK 2000, 'Corporate Governance Codes: a comparison between Malaysia and the UK', Corporate Governance: An International Review, vol. 8, no. 2, pp. 125-132. Owusu-Ansah, S 1998, 'The impact of corporate attributes on the extent of mandatory disclosure and reporting by listed companies in Zimbabwe', The International Journal of Accounting, vol. 33, no. 5, pp. 605-631. Pascoe, J 1999, 'Regulation and Disclosure of Financial Benefits to Directors and Related Parties: A Comparative Analysis of the Malaysian and Australian Approaches. ', Singapore Journal of International & Comparative Law, vol. 3, pp. 108 - 133. Pastena, V & Ronen, J 1979, 'Some hypotheses on the pattern of management's informal disclosures', Journal of Accounting Research, vol. 17, no. 2, pp. 550-564. Patell, JM 1976, 'Corporate forecasts of earnings per share and stock price behavior: Empirical test', Journal of Accounting Research, pp. 246-276. Patell, JM & Wolfson, MA 1982, 'Good news, bad news, and the intraday timing of corporate disclosures', Accounting Review, vol. 57, no. 3, pp. 509-527.

297
Patten, DM 1991, 'Exposure, legitimacy, and social disclosure', Journal of Accounting and Public Policy, vol. 10, no. 4, pp. 297-308. —— 1992, 'Intra-industry Environmental Disclosures in Response to the Alaskan Oil Spill: A Note on Legitimacy Theory', Accounting, Organizations and Society, vol. 17, no. 5, pp. 471-475. Penman, SH 1980, 'An empirical investigation of the voluntary disclosure of corporate earnings forecasts', Journal of Accounting Research, vol. 18, no. 1, pp. 132-160. Press, EG & Weintrop, JB 1990, 'Accounting-based constraints in public and private debt agreements:: Their association with leverage and impact on accounting choice', Journal of Accounting and Economics, vol. 12, no. 1-3, pp. 65-95. Preston, LE 1978, 'Analyzing corporate social performance: Methods and results', Journal of Contemporary Business, vol. 7, no. 1. Raffournier, B 1995, 'The determinants of voluntary financial disclosure by Swiss listed companies', European Accounting Review, vol. 4, no. 2, pp. 261-280. Ramanathan, KV 1976, 'Toward a theory of corporate social accounting', Accounting Review, pp. 516-528. Ramaswamy, K, Veliyath, R & Gomes, L 2000, 'A Study of the Determinants of CEO Compensation in India', Management International Review, vol. 40, no. 2, 04/01/, p. 167(125). Riahi-Belkaouhi, A 2001, 'Level of multinationality, growth opportunities, and size as determinants of analysts ratings of corporate disclosures', American Business Review, vol. 19, no. 2, pp. 115-120. Ryan, HE 2001, 'The influence of firm-and manager-specific characteristics on the structure of executive compensation', Journal of Corporate Finance, vol. 7, no. 2, pp. 101-123. Schadewitz, HJ & Blevins, DR 1998, 'Major determinants of interim disclosures in an emerging market', American Business Review, vol. 16, no. 1, pp. 41-55. Scott, TW 1994, 'Incentives and disincentives for financial disclosure: Voluntary disclosure of defined benefit pension plan information by Canadian firms', Accounting Review, vol. 69, no. 1, pp. 26-43. Securities Commission of Malaysia 2001, Capital Market Masterplan Securities Commission of Malaysia, Kuala Lumpur. Sengupta, P 1998, 'Corporate disclosure quality and the cost of debt', Accounting Review, pp. 459-474.

298
Shan, GY 2009, 'Related-party Disclosures in China: Influences of Factors Identified from Agency, Legitimacy and Signalling Theories', paper presented to Symposium SA, Adelaide, 19 February 2009. Shavell, S 1979, 'Risk sharing and incentives in the principal and agent relationship', Bell Journal of Economics, vol. 10, no. 1, Spring79, pp. 55-73. Shocker, AD & Sethi, SP 1974, An approach to incorporating social preferences in developing corporate action strategies, The unstable ground: Corporate social policy in a dynamic society, vol. 67, Melville Publishing: Los Angeles. Skinner, DJ 1994, 'Why firms voluntarily disclose bad news', Journal of Accounting Research, vol. 32, no. 1, pp. 38-60. —— 1997, 'Earnings disclosures and stockholder lawsuits', Journal of Accounting and Economics, vol. 23, no. 3, pp. 249-282. Smith, A 1937, 'The Wealth of Nations (1776)', New York: Modern Library, p. 740. Smith Jr, CW & Watts, RL 1992, 'The investment opportunity set and corporate financing, dividend, and compensation policies', Journal of Financial Economics, vol. 32, no. 3, 12, pp. 263-292. Stocken, PC 2000, 'Credibility of voluntary disclosure', The RAND Journal of Economics, pp. 359-374. Suchman, MC 1995, 'Managing legitimacy: Strategic and institutional approaches', The Academy of Management Review, vol. 20, no. 3, pp. 571-610. Suijs, J 2005, 'Voluntary disclosure of bad news', Journal of Business Finance & Accounting, vol. 32, no. 7 8, pp. 1423-1435. Talha, M, Sallehhuddin, A & Mohammad, J 2008, 'Competitive disadvantage and segment disclosure: evidence from Malaysian listed companies', International Journal of Commerce and Management, vol. 17, no. 1/2, pp. 105-124. Tam, OK & Tan, MGS 2007, 'Ownership, Governance and Firm Perfromance in Malaysia', Corporate Governance: An International Review, vol. 15, no. 2, pp. 208-222. The Minority Shareholders Watchdog Group & The University of Nottingham (Malaysia) 2007, Shareholdings Analysis Report 1997-2006, The Minority Shareholders Watchdog Group, Kuala Lumpur. The Putrajaya Committee 2005, GLC Transformation Manual, Kuala Lumpur.

299
Tilt, CA 1994, 'The influence of external pressure groups on corporate social disclosure: some empirical evidence', Accounting, Auditing & Accountability Journal, vol. 7, no. 4, pp. 47-72. Titner, G 1965, Econometrics, Science edn, John Wiley & Sons, New York. Trotman, G, W. & Ken, T 1981, 'Associations between social responsibility disclosure and characteristics of companies* 1', Accounting, Organizations and Society, vol. 6, no. 4, pp. 355-362. Verrecchia, RE 1983, 'Discretionary Disclosure', Journal of Accounting and Economics, vol. 5, pp. 179-194. —— 1990, 'Information quality and discretionary disclosure', Journal of Accounting and Economics, vol. 12, no. 4, pp. 365-380. Vitaliano, P 1983, 'Cooperative Enterprise: An Alternative Conceptual Basis for Analyzing a Complex Institution', American Journal of Agricultural Economics, vol. 65, no. 5, 12, pp. 1078-1083. Wade, JB, Porac, JF & Pollock, TG 1997, 'Worth, words, and the justification of executive pay', Journal of Organizational Behavior, vol. 18, no. s 1, pp. 641-664. Wagenhofer, A 1990, 'Voluntary disclosure with a strategic opponent* 1', Journal of Accounting and Economics, vol. 12, no. 4, pp. 341-363. Wallace, R & Naser, K 1995, 'Firm Specific Determinants of the Comprehensiveness of Mandatory Disclosure in the Corporate Annual Reports of Firms Listed on the Stock Exchange of Hong Kong', Journal of Accounting and Public Policy, vol. 14, pp. 311-368. Walsh, A 1987, 'Teaching Understanding and Interpretation of Logit Regression', Teaching Sociology, vol. 15, no. 2, pp. 178-183. Watts, R & Zimmerman, JL 1986, Positive Accounting Theory, Prentice Hall, New Jersey. Watts, RL & Zimmerman, JL 1978, 'Towards a Positive Theory of the Determination of Accounting Standards', The Accounting Review, vol. 53, no. 1, pp. 112-134. Waymire, G 1984, 'Additional evidence on the information content of management earnings forecasts', Journal of Accounting Research, vol. 22, no. 2, pp. 703-718. Weisbach, MS 1988, 'Outside directors and CEO turnover', Journal of Financial Economics, vol. 20, pp. 431-460. Welker, M 1995, 'Disclosure Policy, Information Asymmetry, and Liquidity in Equity Markets*', Contemporary Accounting Research, vol. 11, no. 2, pp. 801-827.

300
Wolfson, M 1985, 'Empirical evidence of incentive problems and their mitigation in oil and gas tax shelter programs', Principals and Agents: the Structure of Business. HBS Press, Boston, pp. 101–125. World Bank 2005, Report on the Observance of Standards and Codes (ROSC): Corporate Governance Country Assessment (Malaysia), World Bank, US. Wymeersch, D 2002, 'Convergence or divergence in corporate governance patterns in Western Europe', Corporate governance regimes: Convergence and diversity. Yermack, D 1995, 'Do corporations award CEO stock options effectively?', Journal of Financial Economics, vol. 39, no. 2-3, pp. 237-269. Zimmerman, MA & Zeitz, GJ 2002, 'Beyond survival: Achieving new venture growth by building legitimacy', Academy of Management Review, pp. 414-431. Zulkafli, AH, Abdul Samad, MF & Ismail, MI 2004, Corporate Governance in Malaysia, Research, Malaysian Institute of Corporate Governance, Kuala Lumpur, <http://www.micg.net/research/CORPORATE%20GOVERNANCE%20IN%20MALAYSIA%20-%20MICG.pdf>.

301
APPENDICES

302
Appendix 1 List of sample companies
NO NAME OF COMPANY 1 HOCK SENG LEE BERHAD 2 BINA PURI HOLDINGS BHD 3 LOH & LOH BHD 4 IJM CORPORATION BERHAD 5 DKLS INDUSTRIES BHD 6 BREM HOLDING BERHAD 7 GOLD BRIDGE ENGINEERING & CONSTRUCTION BERHAD 8 PINTARAS JAYA BERHAD 9 PJ DEVELOPMENT HOLDINGS
10 PLB ENGINEERING 11 GAMUDA BERHAD 12 YTL CORPORATION BERHAD 13 EKOVEST BERHAD 14 LATITUDE TREE 15 PUTERA CAPITAL 16 HONG LEONG INDUSTRIES BERHAD 17 KHEE SAN 18 FRASER & NEAVE 19 BRITISH AMERICAN TOBACCO (MALAYSIA) BERHAD 20 NESTLE (MALAYSIA) BERHAD 21 CARLSBERG 22 PPB GROUP BERHAD 23 CYCLE & CARRIAGE BINTANG BERHAD 24 DUTCH LADY MILK INDUSTRIES BERHAD 25 HUP SENG INDUSTRIES BERHAD 26 NEW HOONG FATT HOLDINGS BERHAD 27 YEO HIAP SENG 28 DNP HOLDINGS BERHAD 29 TAN CHONG MOTOR HOLDINGS BERHAD 30 KENMARK INDUSTRIAL CO 31 MWE HOLDINGS 32 GOLDEN PHAROS BERHAD 33 NIKKO ELECTRONICS 34 MAMEE-DOUBLE DECKER (M) BERHAD 35 GENERAL CORPORATION BERHAD 36 GUINNESS ANCHOR BERHAD

303
37 LINEAR CORPORATION BERHAD 38 ADVANCE SYNERGY BERHAD 39 KIA LIM 40 LEADER UNIVERSAL 41 MIECO CHIPBOARD BERHAD 42 SOUTHERN STEEL 43 PAN MALAYSIA CORPORATION BERHAD 44 KECK SENG 45 PRESS METAL 46 LANDMARKS BERHAD 47 GRAND CENTRAL ENTERPRISES BHD 48 SHANG RI LA 49 FABER GROUP BERHAD 50 GULA PERAK 51 PUNCAK NIAGA HOLDINGS BERHAD 52 YTL POWER INTERNATIONAL BERHAD 53 DIGI 54 KIAN JOO CAN 55 BOX PAX (MALAYSIA) BERHAD 56 SINORA INDUSTRIES BERHAD 57 THONG GUAN 58 ANN JOO RESOURCES BERHAD 59 GOH BAN HUAT BERHAD 60 PETALING TIN BERHAD 61 AMANAH HARTA TANAH PNB 62 LITYAN 63 HEITECH 64 MAA HOLDINGS BERHAD 65 MHC PLANTATIONS BHD 66 TDM BERHAD 67 THE AYER MOLEK RUBBER COMPANY BERHAD 68 MALAYSIAN PACIFIC INDUSTRIES BERHAD 69 UNISEM (M) BERHAD 70 ENG TEKNOLOGI HOLDINGS BERHAD 71 MESINIAGA BERHAD 72 AIC CORPORATION BERHAD 73 PATIMAS COMPUTERS BERHAD 74 GLOBETRONICS TECHNOLOGY BHD 75 SUNGEI BAGAN RUBBER COMPANY (MALAYA) BERHAD

304
76 CHIN TECK PLANTATIONS BERHAD 77 ASIATIC DEVELOPMENT BERHAD 78 KURNIA SETIA BERHAD 79 UNITED PLANTATIONS BERHAD 80 NEGERI SEMBILAN OIL PALMS BERHAD 81 INCH KENNETH KAJANG RUBBER PUBLIC LIMITED COMPANY 82 KUALA LUMPUR KEPONG BERHAD 83 BATU KAWAN BERHAD 84 A&M REALTY BERHAD 85 BINA DARULAMAN BERHAD 86 COUNTRY HEIGHTS HOLDINGS BERHAD 87 PK RESOURCES BERHAD 88 FARLIM GROUP (MALAYSIA) BERHAD 89 MUI PROPERTIES BERHAD 90 SUNWAY CITY BERHAD 91 BANDAR RAYA DEVELOPMENT BERHAD 92 UNITED MALAYAN LAND BERHAD 93 SOUTH MALAYSIA INDUSTRIES BERHAD 94 BOLTON BERHAD 95 LIEN HOE CORPORATION BERHAD 96 ASIA PACIFIC LAND BERHAD 97 TANCO HOLDINGS BERHAD 98 LAND & GENERAL BERHAD 99 DAMANSARA REALTY BERHAD
100 PASDEC HOLDINGS BERHAD 101 SPK SENTOSA CORPORATION BERHAD 102 UNICO DESA PLANTATIONS BERHAD 103 IOI CORPORATION BERHAD 104 MULTI VEST RESOURCES BERHAD 105 KLUANG RUBBER COMPANY (MALAYA) BERHAD 106 KWANTAS CORPORATION BERHAD 107 GLENEALY PLANTATIONS (MALAYSIA) BERHAD 108 SARAWAK OIL PALMS BERHAD 109 KULIM (MALAYSIA) BERHAD 110 NV MULTI CORPORATION BERHAD 111 HARRISON HOLDINGS (MALAYSIA) BERHAD 112 GENTING BERHAD 113 KONSORTIUM LOGISTIC BERHAD 114 IPMUDA BERHAD

305
115 PADIBERAS NASIONAL BERHAD 116 MULPHA INTERNATIONAL BERHAD 117 KUB MALAYSIA BERHAD 118 MECHMAR CORPORATION (MALAYSIA) BERHAD 119 MALAYAN UNITED INDUSTRIES BERHAD 120 KFC HOLDINGS MALAYSIA BERHAD 121 JOHORLAND BERHAD 122 IGB CORPORATION BERHAD 123 PARAMOUNT CORPORATION BERHAD 124 SELANGOR PROPERTIES BERHAD 125 PHARMANIAGA BERHAD 126 SP SETIA BHD GROUP 127 INTEGRATED LOGISTIC GROUP 128 KNUSFORD BERHAD 129 METACORP BERHAD 130 TALICORPS CORPORATION BERHAD 131 FAR EAST HOLDINGS BERHAD 132 LKT INDUSTRIAL BERHAD 133 HO HUP CONSTRUCTION COMPANY BERHAD 134 MALAYAN FLOUR MILLS BERHAD 135 UMW HOLDINGS BERHAD 136 YEE LEE CORPORATION BERHAD 137 ORIENTAL HOLDINGS BERHAD 138 PACIFICMAS BERHAD 139 RHB CAPITAL BERHAD 140 APEX EQUITY HOLDINGS BERHAD 141 PAN MALAYSIA CAPITAL BERHAD 142 MALPAC HOLDINGS BERHAD 143 EASTERN PACIFIC INDUSTRIAL CORPORATION BERHAD 144 BOUSTEAD HOLDINGS BERHAD 145 TIME ENGINEERING BERHAD 146 MULTI PURPOSE HOLDINGS BERHAD 147 RIVERVIEW RUBBER ESTATES BERHAD 148 JT INTERNATIONAL BERHAD 149 ASAS DUNIA BERHAD 150 TSH RESOURCES BERHAD 151 NAM FATT CORPORATION BERHAD 152 BONIA CORPORATION BERHAD 153 PADINI HOLDINGS BERHAD

306
154 PROLEXUS BERHAD 155 TAKASO RESOURCES BERHAD 156 POH HUAT RESOURCES HOLDINGS BERHAD 157 HUNZA CONSOLIDATION BERHAD 158 REX INDUSTRIES BERHAD 159 UPA CORPORATION BERHAD 160 HWA TAI INDUSTRIES BERHAD 161 LII HEN INDUSTRIES BERHAD 162 JERASIA CAPITAL BERHAD 163 FOREMOST HOLDINGS BERHAD 164 LEN CHEONG HOLDINGS BERHAD 165 PARAGON UNION BERHAD 166 APEX HEALTHCARE BERHAD 167 KHIND HOLDINGS BERHAD 168 ASTRAL ASIA BERHAD 169 KUMPULAN JETSON BERHAD 170 AHMAD ZAKI RESOURCES BERHAD 171 PWE INDUSTRIES BERHAD 172 SELOGA HOLDINGS BERHAD 173 BINA GOODYEAR BERHAD 174 GADANG HOLDINGS BERHAD 175 PACIFIC & ORIENT BERHAD 176 LPI CAPITAL BHD 177 MALAYAN BANKING BERHAD 178 HONG LEONG BANK BERHAD 179 HLG CAPITAL BERHAD 180 SYARIKAT TAKAFUL 181 INSAS BERHAD 182 HWANG DBS (MALAYSIA) BERHAD 183 K&N KENANGA 184 MALAYSIA BUILDING SOCIETY BERHAD 185 PUBLIC BANK BERHAD 186 JERNEH ASIA BERHAD 187 OSK HOLDINGS BERHAD 188 CAHYA MATA SARAWAK 189 SURIA CAPITAL 190 AFFIN HOLDINGS BERHAD 191 DELLOYD VENTURES BERHAD 192 HO WAH GENTING BERHAD

307
193 P.I.E INDUSTRIAL BERHAD 194 TA ANN HOLDINGS BERHAD 195 MINHO (M) BERHAD 196 CHOO BEE METAL 197 WTK HOLDINGS BERHAD 198 WIJAYA BARU 199 MUDA HOLDINGS BERHAD 200 KUCHAI DEVELOPMENT

308
Appendix 2 Sample of companies’ justifications for departure from the MCCG requirements
No Name of company Fiscal year
Statement of departure
1 Hwang DBS Malaysia Berhad
2007 The Code recommends disclosure of details of the remuneration of each Director. However, the Board is of the view that the disclosure of the remuneration of the Directors by bands of RM50000 is sufficient to meet the objective of the Code.
2 IGB Corporation Berhad 2006 For security and confidentiality reasons, the details of Directors’ remuneration are not shown with reference to Directors individually. The Board is of the view that the transparency and accountability aspects of the corporate governance on Directors’ remuneration are appropriately served by the band disclosure made.
3 INSAS Berhad 2007 The remuneration of the Directors are further analysed by applicable bands of RM50000 which comply with the disclosure requirements under the Listing Requirements of the Bursa Malaysia Securities Berhad. The Board is of the view that the transparency and accountability aspect of corporate governance which is applicable to Directors’ Remuneration are appropriately served by the band disclosure.
4 KHIND Holdings Berhad 2006 On the recommended disclosure of detail of the remuneration of each Director, the Board is of the view that the transparency and accountability aspects of corporate governance as applicable to Directors’ remuneration are appropriately served by the “Band Disclosure” made.
5 KiaLim Berhad 2005 Details of the remuneration of each Director are

309
not disclosed due to security reasons.
6 Kian Joo Can Factory Berhad 2007 The Board is of the view that the transparency and accountability aspects applicable to Directors’
Remuneration are appropriately served by the ‘band disclosure of RM50000 as set out under Note 30 of the Notes to the Financial Statements, which complies with the disclosure requirements under the Bursa Malaysia Securities Berhad’s Listing Requirements.
7 Lii Hen Industries Berhad 2006 While the Board is aware that best practice under the Malaysian Code is to provide disclosure of individual remuneration, however the Board is of the view it is consider appropriate to disclose the remuneration of the directors in aggregate and bands.
8 Tanco Holdings Berhad 2007 The above disclosures format meets the requirements of the Listing Requirements

310
Appendix 3 Remuneration survey by the MSWG

311
Appendix 4 Descriptive statistics for independent variables
FAM OWN SUBT OWN GOV
FORGN OWN
DIR OWN
DEBT TO EQUITY
Mean 0.1956 0.5435 0.1235 0.1219 0.2639 1.7632 Median 0.0000 0.5631 0.0513 0.0388 0.2852 0.6986 Maximum 0.8490 0.9654 0.9680 0.9120 0.9384 128.5270 Minimum 0.0000 0.0863 0.0000 0.0000 0.0000 -93.7633 Std. Dev. 0.2346 0.1652 0.1770 0.1835 0.2262 6.1924 Skewness 0.6598 -0.3312 2.1437 1.9024 0.2107 5.1765 Kurtosis 1.9091 2.5814 7.3782 5.6856 1.7660 176.6564 Jarque-Bera 217.8922 45.6480 2791.2310 1612.2580 126.3917 2249604 Probability 0.0000 0.0000 0.0000 0.0000 0.0000 0.0000 Sum 348.9918 969.5977 220.3098 217.4710 470.8325 3145.4870 Sum Sq. Dev. 98.1629 48.6595 55.8752 60.0657 91.2186 68371.1600
PROP INDDIR AQ
LN ASSET ROE
MARKET TO BOOK
Mean 0.4049 0.6682 13.3080 0.0651 1.2748 Median 0.3750 1.0000 13.1225 0.0613 0.8000 Maximum 1.0000 1.0000 19.4106 27.6506 91.8000 Minimum 0.0000 0.0000 8.6415 -3.8931 -42.6000 Std. Dev. 0.1210 0.4710 1.4947 0.7630 3.4262 Skewness 0.7714 -0.7143 0.9008 26.7593 11.5874 Kurtosis 5.0177 1.5102 4.8767 964.7990 317.2432 Jarque-Bera 479.5524 316.6794 503.0867 68975507 7380250 Probability 0.0000 0.0000 0.0000 0.0000 0.0000 Sum 722.2867 1192.0000 23741.4800 116.1872 2274.2680 Sum Sq. Dev. 26.1169 395.5516 3983.5030 1037.9530 20930.6500

312
Appendix 5 Distribution of independent variables from 2000 to 2008 (mean)
.185
.190
.195
.200
.205
.210
.215
YEAR
=200
0
YEAR
=200
1
YEAR
=200
2
YEAR
=200
3
YEAR
=200
4
YEAR
=200
5
YEAR
=200
6
YEAR
=200
7
YEAR
=200
8
FAM_OWN
.52
.53
.54
.55
.56
.57
YEAR
=200
0
YEAR
=200
1
YEAR
=200
2
YEAR
=200
3
YEAR
=200
4
YEAR
=200
5
YEAR
=200
6
YEAR
=200
7
YEAR
=200
8
SUBT_OWN
.105
.110
.115
.120
.125
.130
.135
YEAR
=200
0
YEAR
=200
1
YEAR
=200
2
YEAR
=200
3
YEAR
=200
4
YEAR
=200
5
YEAR
=200
6
YEAR
=200
7
YEAR
=200
8
GOV
.10
.11
.12
.13
.14
.15
.16
YEAR
=200
0
YEAR
=200
1
YEAR
=200
2
YEAR
=200
3
YEAR
=200
4
YEAR
=200
5
YEAR
=200
6
YEAR
=200
7
YEAR
=200
8
FORGN_OWN
.25
.26
.27
.28
.29
.30
YEAR
=200
0
YEAR
=200
1
YEAR
=200
2
YEAR
=200
3
YEAR
=200
4
YEAR
=200
5
YEAR
=200
6
YEAR
=200
7
YEAR
=200
8
DIR_OWN
0.8
1.2
1.6
2.0
2.4
2.8
YEAR
=200
0
YEAR
=200
1
YEAR
=200
2
YEAR
=200
3
YEAR
=200
4
YEAR
=200
5
YEAR
=200
6
YEAR
=200
7
YEAR
=200
8
DEBT_TO_EQUITY
.34
.36
.38
.40
.42
.44
YEAR
=200
0
YEAR
=200
1
YEAR
=200
2
YEAR
=200
3
YEAR
=200
4
YEAR
=200
5
YEAR
=200
6
YEAR
=200
7
YEAR
=200
8
PROP_INDDIR
.56
.60
.64
.68
.72
YEAR
=200
0
YEAR
=200
1
YEAR
=200
2
YEAR
=200
3
YEAR
=200
4
YEAR
=200
5
YEAR
=200
6
YEAR
=200
7
YEAR
=200
8
AQ
13.1
13.2
13.3
13.4
13.5
YEAR
=200
0
YEAR
=200
1
YEAR
=200
2
YEAR
=200
3
YEAR
=200
4
YEAR
=200
5
YEAR
=200
6
YEAR
=200
7
YEAR
=200
8
LN_ASSET
-.04
.00
.04
.08
.12
.16
.20
.24
YEAR
=200
0
YEAR
=200
1
YEAR
=200
2
YEAR
=200
3
YEAR
=200
4
YEAR
=200
5
YEAR
=200
6
YEAR
=200
7
YEAR
=200
8
ROE
0.8
1.0
1.2
1.4
1.6
1.8
YEAR
=200
0
YEAR
=200
1
YEAR
=200
2
YEAR
=200
3
YEAR
=200
4
YEAR
=200
5
YEAR
=200
6
YEAR
=200
7
YEAR
=200
8
MARKETOBOOK
Means by YEAR

313
Appendix 6 Summary of scoring guide
ITEM MAXIMUM SCORE DESCRIPTION
1 1 Disaggregated remuneration V 2 1 Disclosure of short-term benefits V
3 1 Disclosure of post-employment benefits V 4 1 Disclosure of other long-term benefits V 5 1 Disclosure of termination benefits V 6 1 Share based payment V 7 1 Specific section for remuneration in directors' report V 8 1 Separate disclosure for individual executive directors V 9 1 Comparative period information V
10 2 Discussion on principles of remuneration V 11 2 Discussion on pay and performance association V
12 3 Options valuation and right details M
13 1 Disclosure by band as per the listing rule M
TOTAL SCORE WITH OPTION 17 VOLUNTARY SCORE 7
TOTAL SCORE NO OPTION 14 VOLUNTARY SCORE(EX FRS&LISTING RULE) 13
VALID AFTER 2001 VOLUNTARY SCORE IN 2000 MANDATORY SCORE WITH OPTION 10 WITH OPTIONS 17
MANDATORY SCORE WITHOUT OPTION 7 WITHOUT OPTIONS 14
VOLUNTARY SCORE PRIOR TO FRS (VALID FROM 2001 TO 2004)
WITH OPTIONS 16
WITHOUT OPTIONS 13
VOLUNTARY SCORE AFTER FRS (VALID FROM 2005) 13

314
Appendix 7 Distribution of score per item
2000 2001 2002 2003 2004 2005 2006 2007 2008
Year
0 197 175 169 144 124 116 109 100 75
1 3 25 31 55 73 82 87 98 125
0
50
100
150
200
250
Co
un
t 1. Disaggregated remuneration
2000 2001 2002 2003 2004 2005 2006 2007 2008
Year
0 197 175 169 144 124 117 110 101 77
1 3 25 31 55 73 81 86 97 123
0
50
100
150
200
250
Co
un
t
3. Disclosure of post-employment benefits

315
2000 2001 2002 2003 2004 2005 2006 2007 2008
Year
0 189 46 14 13 8 6 6 5 3
1 11 154 186 186 189 192 190 193 197
0
50
100
150
200
250
Co
un
t
2. Disclosure of short term benefits
2000 2001 2002 2003 2004 2005 2006 2007 2008
Year
0 198 170 164 140 118 111 106 96 72
1 2 30 36 59 79 87 90 102 128
0
50
100
150
200
250
Co
un
t
4. Disclosure of other long term benefits
2000 2001 2002 2003 2004 2005 2006 2007 2008
Year
0 21 7 1 1 1 1 1 1 2
1 179 193 199 198 196 197 195 197 198
0
50
100
150
200
250
Co
un
t
5. Disclosure of termination benefits
2000 2001 2002 2003 2004 2005 2006 2007 2008
Year Total
0 3 0 0 0 0 0 0 0 1 4
1 197 200 200 199 197 198 196 198 199 1784
0200400600800
100012001400160018002000
Co
un
t
6. Disclosure of share based payments

316
2000 2001 2002 2003 2004 2005 2006 2007 2008
Year
0 186 34 18 19 21 22 20 20 24
1 14 166 182 180 176 176 176 178 176
020406080
100120140160180200
Co
un
t
7. Specific section in director's report
2000 2001 2002 2003 2004 2005 2006 2007 2008
Year
0 199 173 170 175 174 173 171 173 181
1 1 27 30 24 23 25 25 25 19
0
50
100
150
200
250
Co
un
t
8. Individual executive director's remuneration
2000 2001 2002 2003 2004 2005 2006 2007 2008
Year
0 177 123 106 87 79 75 72 59 36
1 23 77 94 112 118 123 124 139 164
020406080
100120140160180200
Co
un
t
9. Comparative period information
2000 2001 2002 2003 2004 2005 2006 2007 2008
Year
0 192 105 47 37 36 35 30 28 43
1 6 81 133 142 141 143 146 148 134
2 2 14 20 20 20 20 20 22 23
0
50
100
150
200
250
Co
un
t
10. Discussion on principles of remuneration
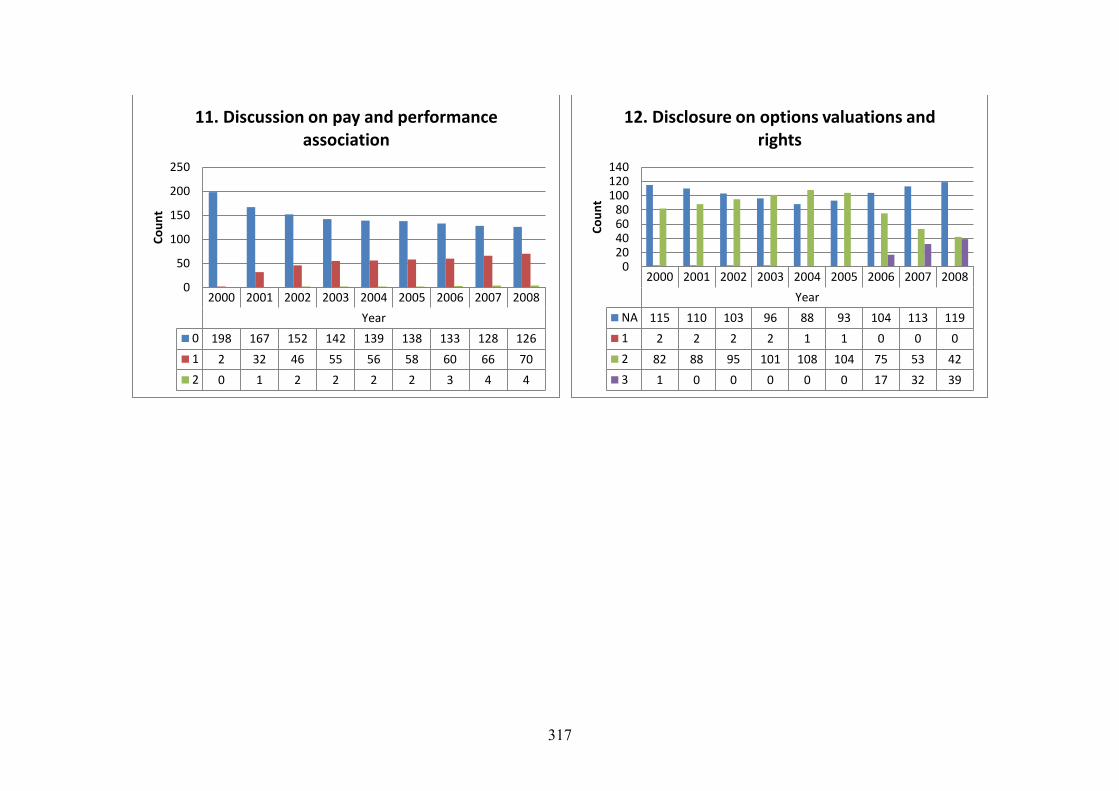
317
2000 2001 2002 2003 2004 2005 2006 2007 2008
Year
0 198 167 152 142 139 138 133 128 126
1 2 32 46 55 56 58 60 66 70
2 0 1 2 2 2 2 3 4 4
0
50
100
150
200
250C
ou
nt
11. Discussion on pay and performance association
2000 2001 2002 2003 2004 2005 2006 2007 2008
Year
NA 115 110 103 96 88 93 104 113 119
1 2 2 2 2 1 1 0 0 0
2 82 88 95 101 108 104 75 53 42
3 1 0 0 0 0 0 17 32 39
020406080
100120140
Co
un
t
12. Disclosure on options valuations and rights

318
2000 2001 2002 2003 2004 2005 2006 2007 2008
Year
0 190 8 2 2 1 1 0 0 3
1 10 192 198 197 196 197 196 198 197
0
50
100
150
200
250
Co
un
t
13. Disclosure of remuneration by bands

319
Appendix 8 Distribution of total and voluntary score from 2001 to 2008
2000 2001 2002 2003 2004 2005 2006 2007 2008 All
Year
low score 0.1929 0.3738 0.4173 0.4191 0.4253 0.4290 0.4283 0.4239 0.4017 0.3493
high score 0.5882 0.5993 0.6018 0.6199 0.6347 0.6440 0.6534 0.6648 0.6932 0.6448
All 0.1988 0.4561 0.5150 0.5483 0.5741 0.5854 0.6005 0.6234 0.6495 0.5275
0.0000
0.1000
0.2000
0.3000
0.4000
0.5000
0.6000
0.7000
0.8000
Tota
l sco
re (
%)
Total score from 2001 to 2008
2000 2001 2002 2003 2004 2005 2006 2007 2008 All
Year
low score 0.1929 0.3461 0.3934 0.4042 0.4088 0.4023 0.4038 0.4099 0.3956 0.3502
high score 0.5882 0.5976 0.6036 0.6340 0.6400 0.6686 0.6731 0.6860 0.6939 0.6564
All 0.1988 0.4203 0.4817 0.5174 0.5449 0.5462 0.5577 0.5800 0.6104 0.4949
0.00000.10000.20000.30000.40000.50000.60000.70000.8000
Vo
lun
tary
sco
re (
%)
Voluntary score from 2001 to 2008

320
Appendix 9 Definition of an independent director
Paragraph 1.01 of the Bursa Malaysia Listing Rule
An “independent director” means a director who is independent of management and free from any business or other relationship which could interfere with the exercise of independent judgement or the ability to act in the best interests of an applicant or a listed issuer. Without limiting the generality of the foregoing, an independent director is one who -
(a) is not an executive director of the applicant, listed issuer or any related corporation of such applicant or listed issuer (each corporation is referred to as “said Corporation”);
(b) has not been within the last 2 years and is not an officer (except as a non-executive director) of the said Corporation. For this purpose, “officer” has the meaning given in section 4 of the Companies Act 1965;
(c) is not a major shareholder the said Corporation;
(d) is not a family member of any executive director, officer or major shareholder of the said Corporation;
(e) is not acting as a nominee or representative of any executive director or major shareholder of the said Corporation (this paragraph is referred to as “paragraph (e)”);
(f) has not been engaged as an adviser by the said Corporation under such circumstances as prescribed by the Exchange or is not presently a partner, director (except as an independent director) or major shareholder, as the case may be, of a firm or corporation which provides professional advisory services to the said Corporation under such circumstances as prescribed by the Exchange (this paragraph is referred to as “paragraph (f)”); or
(g) has not engaged in any transaction with the said Corporation under such circumstances as prescribed by the Exchange or is not presently a partner, director or major shareholder, as the case may be, of a firm or corporation (other than subsidiaries of the applicant or listed issuer) which has engaged in any transaction with the said Corporation under such circumstances as prescribed by the Exchange (this paragraph is referred to as “paragraph (g)”).

321
Appendix 10 Eviews output for Equation 1
Dependent Variable: TOTALSCORE
Method: Panel EGLS (Cross-section weights)
Date: 11/27/11 Time: 23:29
Sample: 2000 2008
Periods included: 9
Cross-sections included: 200
Total panel (unbalanced) observations: 1783
Linear estimation after one-step weighting matrix
White cross-section standard errors & covariance (d.f. corrected)
Variable Coefficient Std. Error t-Statistic Prob. C -0.324594 0.047881 -6.779128 0.0000
FAM_OWN -0.055482 0.015932 -3.482479 0.0005
SUBT_OWN 0.026477 0.021348 1.240288 0.2151
GOV 0.031422 0.019790 1.587743 0.1125
FORGN_OWN -0.009282 0.013189 -0.703725 0.4817
DDIROWN01 -2.050712 2.436284 -0.841738 0.4001
DDIROWN0125 0.028130 0.025436 1.105928 0.2689
DDIROWN0025 -0.008454 0.017997 -0.469739 0.6386
DEBT_TO_EQUITY 0.000277 0.000235 1.179504 0.2384
PROP_INDDIR 0.038633 0.016939 2.280734 0.0227
AQ 0.007771 0.008145 0.954106 0.3402
LN_ASSET 0.038196 0.002932 13.02869 0.0000
ROE 0.001101 0.001629 0.675736 0.4993
MARKETOBOOK -0.000450 0.000617 -0.729400 0.4659
D2001 0.262179 0.001002 261.7847 0.0000
D2002 0.317846 0.001543 205.9616 0.0000
D2003 0.343947 0.002257 152.4062 0.0000
D2004 0.359013 0.002234 160.7391 0.0000
D2005 0.364528 0.002118 172.1245 0.0000
D2006 0.374902 0.002139 175.2868 0.0000
D2007 0.391778 0.002178 179.8875 0.0000
D2008 0.419343 0.002458 170.6199 0.0000 Effects Specification Cross-section fixed (dummy variables) Weighted Statistics R-squared 0.867927 Mean dependent var 0.655043
Adjusted R-squared 0.849325 S.D. dependent var 0.330667
S.E. of regression 0.087464 Sum squared resid 11.94935
F-statistic 46.65823 Durbin-Watson stat 1.320696
Prob(F-statistic) 0.000000 Unweighted Statistics R-squared 0.794041 Mean dependent var 0.527539
Sum squared resid 12.43881 Durbin-Watson stat 1.186567

322
Appendix 11 Eviews output for Equation 2
Dependent Variable: TOT_VOLSCORE
Method: Panel EGLS (Cross-section weights)
Date: 09/29/11 Time: 12:35
Sample: 2000 2008
Periods included: 9
Cross-sections included: 200
Total panel (unbalanced) observations: 1783
Linear estimation after one-step weighting matrix
White cross-section standard errors & covariance (d.f. corrected)
Variable Coefficient Std. Error t-Statistic Prob. C -0.313093 0.060858 -5.144622 0.0000
FAM_OWN -0.056808 0.014921 -3.807391 0.0001
SUBT_OWN 0.025587 0.022923 1.116216 0.2645
GOV 0.057237 0.021640 2.644909 0.0083
FORGN_OWN -0.026940 0.017206 -1.565744 0.1176
DDIROWN01 -3.695743 2.670438 -1.383947 0.1666
DDIROWN0125 0.025762 0.027358 0.941672 0.3465
DDIROWN0025 -0.003850 0.022350 -0.172252 0.8633
DEBT_TO_EQUITY 0.000338 0.000254 1.332584 0.1829
PROP_INDDIR 0.049418 0.017794 2.777263 0.0055
AQ 0.005444 0.009061 0.600890 0.5480
LN_ASSET 0.037216 0.003644 10.21201 0.0000
ROE 0.001590 0.002101 0.756882 0.4492
MARKETOBOOK -0.000615 0.000725 -0.847547 0.3968
D2001 0.225663 0.000896 251.8193 0.0000
D2002 0.284213 0.001568 181.2903 0.0000
D2003 0.312447 0.002291 136.3586 0.0000
D2004 0.329457 0.002291 143.8307 0.0000
D2005 0.324959 0.002316 140.2951 0.0000
D2006 0.330845 0.002302 143.6978 0.0000
D2007 0.344633 0.002425 142.1033 0.0000
D2008 0.375319 0.002789 134.5635 0.0000 Effects Specification Cross-section fixed (dummy variables) Weighted Statistics R-squared 0.837195 Mean dependent var 0.606716
Adjusted R-squared 0.814265 S.D. dependent var 0.307647
S.E. of regression 0.095729 Sum squared resid 14.31433
F-statistic 36.51042 Durbin-Watson stat 1.286791
Prob(F-statistic) 0.000000 Unweighted Statistics R-squared 0.758573 Mean dependent var 0.494964
Sum squared resid 14.93056 Durbin-Watson stat 1.146478

323
Appendix 12 Eviews output for Equation 3
Dependent Variable: TOTALSCORE
Method: Panel EGLS (Cross-section weights)
Date: 01/26/12 Time: 15:10
Sample: 2000 2008
Periods included: 9
Cross-sections included: 200
Total panel (unbalanced) observations: 1783
Linear estimation after one-step weighting matrix
White cross-section standard errors & covariance (d.f. corrected)
Variable Coefficient Std. Error t-Statistic Prob. C -0.329002 0.044943 -7.320475 0.0000
FAMOWNWIN -0.063157 0.013668 -4.620763 0.0000
SUBTOWNWIN 0.034463 0.022685 1.519151 0.1289
GOVWIN 0.033094 0.018232 1.815166 0.0697
FORGNOWNWIN -0.013776 0.015460 -0.891094 0.3730
DDIROWN0025 -0.004906 0.018112 -0.270890 0.7865
DDIROWN01 -1.681334 2.533322 -0.663687 0.5070
DDIROWN0125 0.024264 0.026975 0.899516 0.3685
LEVERAGEWIN -0.000636 0.000667 -0.954619 0.3399
PROPIND 0.044722 0.016256 2.751007 0.0060
AQ 0.008470 0.008117 1.043484 0.2969
LN_ASSETWIN 0.038362 0.002828 13.56641 0.0000
ROEWIN 0.005931 0.003526 1.682186 0.0927
MARKETOBOOKWIN -0.001329 0.001603 -0.829603 0.4069
D2001 0.260705 0.000992 262.8457 0.0000
D2002 0.317262 0.001451 218.7111 0.0000
D2003 0.343292 0.001862 184.3337 0.0000
D2004 0.358910 0.001964 182.7359 0.0000
D2005 0.363785 0.001908 190.6225 0.0000
D2006 0.374037 0.001931 193.7219 0.0000
D2007 0.390169 0.001839 212.1479 0.0000
D2008 0.418207 0.002306 181.3461 0.0000 Effects Specification Cross-section fixed (dummy variables) Weighted Statistics R-squared 0.867750 Mean dependent var 0.653644
Adjusted R-squared 0.849123 S.D. dependent var 0.332298
S.E. of regression 0.087241 Sum squared resid 11.88832
F-statistic 46.58621 Durbin-Watson stat 1.325487
Prob(F-statistic) 0.000000 Unweighted Statistics R-squared 0.794451 Mean dependent var 0.527539
Sum squared resid 12.41405 Durbin-Watson stat 1.186307

324
Appendix 13 Eviews output for Equation 3
Dependent Variable: TOT_VOLSCORE
Method: Panel EGLS (Cross-section weights)
Date: 09/29/11 Time: 15:06
Sample: 2000 2008
Periods included: 9
Cross-sections included: 200
Total panel (unbalanced) observations: 1783
Linear estimation after one-step weighting matrix
White cross-section standard errors & covariance (d.f. corrected)
Variable Coefficient Std. Error t-Statistic Prob. C -0.316748 0.059970 -5.281792 0.0000
FAMOWNWIN -0.065753 0.013240 -4.966397 0.0000
SUBTOWNWIN 0.034320 0.024302 1.412238 0.1581
GOVWIN 0.062876 0.020057 3.134859 0.0018
FORGNOWNWIN -0.029673 0.019085 -1.554737 0.1202
DDIROWN0025 0.000368 0.021237 0.017305 0.9862
DDIROWN01 -3.240666 2.823594 -1.147709 0.2513
DDIROWN0125 0.022607 0.028523 0.792602 0.4281
LEVERAGEWIN -0.000574 0.000781 -0.734934 0.4625
PROPIND 0.055652 0.017393 3.199589 0.0014
AQ 0.006217 0.008962 0.693658 0.4880
LN_ASSETWIN 0.037303 0.003706 10.06499 0.0000
ROEWIN 0.007360 0.004380 1.680392 0.0931
MARKETOBOOKWIN -0.002059 0.001797 -1.146004 0.2520
D2001 0.224272 0.001083 207.1120 0.0000
D2002 0.283610 0.001646 172.3013 0.0000
D2003 0.311506 0.001910 163.1314 0.0000
D2004 0.329250 0.002054 160.3209 0.0000
D2005 0.323642 0.002217 146.0091 0.0000
D2006 0.329601 0.002168 151.9969 0.0000
D2007 0.342889 0.001947 176.1335 0.0000
D2008 0.373958 0.002814 132.9012 0.0000 Effects Specification Cross-section fixed (dummy variables) Weighted Statistics R-squared 0.836653 Mean dependent var 0.605105
Adjusted R-squared 0.813646 S.D. dependent var 0.307706
S.E. of regression 0.095450 Sum squared resid 14.23082
F-statistic 36.36571 Durbin-Watson stat 1.291330
Prob(F-statistic) 0.000000 Unweighted Statistics R-squared 0.759222 Mean dependent var 0.494964
Sum squared resid 14.89038 Durbin-Watson stat 1.146933

325
Appendix 14 Eviews output for Equation 5
Dependent Variable: TOTALSCORE
Method: Panel EGLS (Cross-section weights)
Date: 10/03/11 Time: 23:18
Sample: 2000 2008
Periods included: 9
Cross-sections included: 200
Total panel (unbalanced) observations: 1783
Linear estimation after one-step weighting matrix
White cross-section standard errors & covariance (d.f. corrected)
Variable Coefficient Std. Error t-Statistic Prob. C -0.108014 0.038179 -2.829150 0.0047
FAM_OWN -0.003725 0.006028 -0.618065 0.5366
SUBT_OWN -0.057543 0.020468 -2.811360 0.0050
GOV 0.035640 0.020029 1.779434 0.0753
FORGN_OWN -0.019806 0.012999 -1.523681 0.1278
DDIROWN01 -2.808225 3.089874 -0.908848 0.3636
DDIROWN0125 -0.035672 0.018547 -1.923335 0.0546
DDIROWN0025 0.038062 0.025283 1.505418 0.1324
DEBT_TO_EQUITY -0.000482 0.000392 -1.229059 0.2192
PROP_INDDIR -0.022962 0.017816 -1.288851 0.1976
AQ 0.033665 0.005718 5.887513 0.0000
LN_ASSET 0.006254 0.001611 3.880602 0.0001
ROE 0.004808 0.003138 1.532143 0.1257
MARKETOBOOK 0.000687 0.000506 1.357541 0.1748
D2001 0.262445 0.000822 319.1659 0.0000
D2002 0.317800 0.000822 386.4685 0.0000
D2003 0.345677 0.000717 482.0684 0.0000
D2004 0.367914 0.000879 418.5329 0.0000
D2005 0.375862 0.000991 379.3659 0.0000
D2006 0.390510 0.001144 341.4913 0.0000
D2007 0.413663 0.001294 319.7763 0.0000
D2008 0.445616 0.001102 404.3651 0.0000
CONSUMER_DISCRETIONARY 0.253785 0.033177 7.649481 0.0000
CONSUMER_STAPLES 0.239743 0.033687 7.116731 0.0000
FINANCIALS 0.251222 0.030123 8.339957 0.0000
ENERGY 0.135348 0.050713 2.668930 0.0077
HEALTHCARE 0.314962 0.047714 6.600999 0.0000
MATERIALS 0.208149 0.028691 7.254877 0.0000
UTILITIES 0.217637 0.029199 7.453494 0.0000
INDUSTRIALS 0.226716 0.031733 7.144457 0.0000
INFORMATION_TECHNOLOGY 0.260729 0.032020 8.142779 0.0000 Weighted Statistics R-squared 0.672936 Mean dependent var 0.663956
Adjusted R-squared 0.667336 S.D. dependent var 0.333810
S.E. of regression 0.127563 Sum squared resid 28.50888
F-statistic 120.1583 Durbin-Watson stat 0.711003
Prob(F-statistic) 0.000000 Unweighted Statistics R-squared 0.514518 Mean dependent var 0.527539
Sum squared resid 29.32048 Durbin-Watson stat 0.507411

326
Appendix 15 Eviews output for equation 6
Dependent Variable: TOT_VOLSCORE
Method: Panel EGLS (Cross-section weights)
Date: 10/03/11 Time: 23:25
Sample: 2000 2008
Periods included: 9
Cross-sections included: 200
Total panel (unbalanced) observations: 1783
Linear estimation after one-step weighting matrix
White cross-section standard errors & covariance (d.f. corrected)
Variable Coefficient Std. Error t-Statistic Prob. C -0.126960 0.037529 -3.382981 0.0007
FAM_OWN -0.012157 0.007091 -1.714393 0.0866
SUBT_OWN -0.067614 0.022929 -2.948845 0.0032
GOV 0.038280 0.025932 1.476169 0.1401
FORGN_OWN -0.023341 0.015259 -1.529622 0.1263
DDIROWN01 -3.827819 3.023724 -1.265929 0.2057
DDIROWN0125 -0.027475 0.022434 -1.224708 0.2208
DDIROWN0025 0.048607 0.025840 1.881064 0.0601
DEBT_TO_EQUITY -0.000526 0.000432 -1.218555 0.2232
PROP_INDDIR -0.029466 0.020365 -1.446918 0.1481
AQ 0.038672 0.006579 5.877912 0.0000
LN_ASSET 0.006870 0.001809 3.798191 0.0002
ROE 0.006732 0.004123 1.632964 0.1027
MARKETOBOOK 0.000786 0.000549 1.431652 0.1524
D2001 0.225445 0.000984 229.0986 0.0000
D2002 0.286050 0.000994 287.7582 0.0000
D2003 0.315834 0.000757 417.0204 0.0000
D2004 0.339951 0.000988 344.2151 0.0000
D2005 0.334639 0.001124 297.8511 0.0000
D2006 0.346315 0.001090 317.6215 0.0000
D2007 0.367551 0.001160 316.8503 0.0000
D2008 0.403595 0.001166 346.2428 0.0000
CONSUMER_DISCRETIONARY 0.267901 0.032694 8.194100 0.0000
CONSUMER_STAPLES 0.255202 0.034086 7.486964 0.0000
FINANCIALS 0.269564 0.030929 8.715680 0.0000
ENERGY 0.109320 0.053777 2.032850 0.0422
HEALTHCARE 0.330871 0.048489 6.823618 0.0000
MATERIALS 0.223035 0.029096 7.665524 0.0000
UTILITIES 0.228316 0.028087 8.128826 0.0000
INDUSTRIALS 0.242194 0.032593 7.430753 0.0000
INFORMATION_TECHNOLOGY 0.266302 0.030765 8.655990 0.0000 Weighted Statistics R-squared 0.587450 Mean dependent var 0.616512
Adjusted R-squared 0.580385 S.D. dependent var 0.315045
S.E. of regression 0.140176 Sum squared resid 34.42542
F-statistic 83.15850 Durbin-Watson stat 0.693057
Prob(F-statistic) 0.000000 Unweighted Statistics R-squared 0.426990 Mean dependent var 0.494964
Sum squared resid 35.43658 Durbin-Watson stat 0.489906

327
Appendix 16 Eviews output for Equation 7
Dependent Variable: TOTALSCORE
Method: Panel EGLS (Cross-section weights)
Date: 09/26/11 Time: 22:13
Sample: 2000 2008
Periods included: 9
Cross-sections included: 200
Total panel (unbalanced) observations: 1783
Linear estimation after one-step weighting matrix
White cross-section standard errors & covariance (d.f. corrected)
Variable Coefficient Std. Error t-Statistic Prob. C -0.127887 0.042522 -3.007560 0.0027
FAMOWNWIN -0.007491 0.006428 -1.165313 0.2441
SUBTOWNWIN -0.061103 0.019962 -3.060963 0.0022
GOVWIN 0.036069 0.019044 1.894005 0.0584
FORGNOWNWIN -0.028351 0.012719 -2.229115 0.0259
DDIROWN0025 0.030612 0.023710 1.291116 0.1968
DDIROWN01 -3.389242 3.199240 -1.059390 0.2896
DDIROWN0125 -0.034162 0.017488 -1.953450 0.0509
LEVERAGEWIN -0.003154 0.000718 -4.395090 0.0000
PROPIND -0.006406 0.016731 -0.382896 0.7018
AQ 0.033750 0.005642 5.982280 0.0000
LN_ASSETWIN 0.007802 0.001811 4.309041 0.0000
ROEWIN 0.023292 0.005651 4.121367 0.0000
MARKETOBOOKWIN 0.001445 0.001042 1.386597 0.1657
D2001 0.264811 0.000831 318.6597 0.0000
D2002 0.319166 0.000761 419.2080 0.0000
D2003 0.345974 0.000807 428.9222 0.0000
D2004 0.367251 0.001017 361.1801 0.0000
D2005 0.376139 0.001127 333.6064 0.0000
D2006 0.390548 0.001308 298.6285 0.0000
D2007 0.411795 0.001637 251.6285 0.0000
D2008 0.443729 0.001448 306.3447 0.0000
CONSUMER_DISCRETIONARY 0.253803 0.031956 7.942322 0.0000
CONSUMER_STAPLES 0.237339 0.032185 7.374217 0.0000
FINANCIALS 0.252679 0.028935 8.732584 0.0000
ENERGY 0.129927 0.048927 2.655521 0.0080
HEALTHCARE 0.312967 0.046541 6.724605 0.0000
MATERIALS 0.211236 0.027415 7.705022 0.0000
UTILITIES 0.221333 0.028075 7.883629 0.0000
INDUSTRIALS 0.228264 0.030896 7.388190 0.0000
INFORMATION_TECHNOLOGY 0.258660 0.030825 8.391370 0.0000 Weighted Statistics R-squared 0.678413 Mean dependent var 0.664756
Adjusted R-squared 0.672906 S.D. dependent var 0.335947
S.E. of regression 0.126989 Sum squared resid 28.25316
F-statistic 123.1993 Durbin-Watson stat 0.720286
Prob(F-statistic) 0.000000 Unweighted Statistics R-squared 0.519527 Mean dependent var 0.527539
Sum squared resid 29.01793 Durbin-Watson stat 0.514592

328
Appendix 17 Eviews output for Equation 8
Dependent Variable: TOT_VOLSCOREMODIFIED
Method: Panel EGLS (Cross-section weights)
Date: 09/26/11 Time: 22:11
Sample: 2000 2008
Periods included: 9
Cross-sections included: 200
Total panel (unbalanced) observations: 1783
Linear estimation after one-step weighting matrix
White cross-section standard errors & covariance (d.f. corrected)
Variable Coefficient Std. Error t-Statistic Prob. C -0.149781 0.041725 -3.589700 0.0003
FAMOWNWIN -0.015734 0.007417 -2.121261 0.0340
SUBTOWNWIN -0.072964 0.022312 -3.270118 0.0011
GOVWIN 0.040764 0.024718 1.649177 0.0993
FORGNOWNWIN -0.030609 0.015167 -2.018110 0.0437
DDIROWN0025 0.041645 0.023260 1.790403 0.0736
DDIROWN01 -4.523477 3.094454 -1.461801 0.1440
DDIROWN0125 -0.026223 0.020803 -1.260526 0.2076
LEVERAGEWIN -0.003411 0.000772 -4.415704 0.0000
PROPIND -0.011826 0.018774 -0.629944 0.5288
AQ 0.038413 0.006423 5.980402 0.0000
LN_ASSETWIN 0.008663 0.001981 4.373272 0.0000
ROEWIN 0.026175 0.005970 4.384600 0.0000
MARKETOBOOKWIN 0.001664 0.001188 1.400464 0.1616
D2001 0.228271 0.001024 222.9881 0.0000
D2002 0.287679 0.001019 282.2360 0.0000
D2003 0.316044 0.000906 348.9383 0.0000
D2004 0.338998 0.001176 288.1872 0.0000
D2005 0.334941 0.001332 251.4033 0.0000
D2006 0.346788 0.001302 266.2724 0.0000
D2007 0.365766 0.001399 261.4783 0.0000
D2008 0.401938 0.001438 279.5858 0.0000
CONSUMER_DISCRETIONARY 0.267741 0.031357 8.538470 0.0000
CONSUMER_STAPLES 0.252573 0.032429 7.788401 0.0000
FINANCIALS 0.271043 0.029566 9.167523 0.0000
ENERGY 0.103342 0.052285 1.976505 0.0483
HEALTHCARE 0.330290 0.047403 6.967723 0.0000
MATERIALS 0.226467 0.027687 8.179386 0.0000
UTILITIES 0.232994 0.027019 8.623463 0.0000
INDUSTRIALS 0.244458 0.031696 7.712620 0.0000
INFORMATION_TECHNOLOGY 0.264099 0.029677 8.898972 0.0000 Weighted Statistics R-squared 0.595555 Mean dependent var 0.617880
Adjusted R-squared 0.588629 S.D. dependent var 0.318823
S.E. of regression 0.139568 Sum squared resid 34.12769
F-statistic 85.99525 Durbin-Watson stat 0.701668
Prob(F-statistic) 0.000000 Unweighted Statistics R-squared 0.432410 Mean dependent var 0.494964
Sum squared resid 35.10137 Durbin-Watson stat 0.495517

329
Appendix 18 Eviews output for Equation 9
Dependent Variable: INDIVIDUALDISCLOSURE
Method: ML - Binary Logit (Quadratic hill climbing)
Date: 11/18/11 Time: 21:55
Sample: 2000 2008
Included observations: 1783
Convergence achieved after 7 iterations
QML (Huber/White) standard errors & covariance Variable Coefficient Std. Error z-Statistic Prob. C -6.065003 1.354935 -4.476232 0.0000
FAM_OWN -1.842308 0.449565 -4.097981 0.0000
SUBT_OWN -1.174597 0.586332 -2.003298 0.0451
GOV 2.029189 0.495750 4.093169 0.0000
FORGN_OWN 0.338595 0.446324 0.758629 0.4481
DDIROWN01 169.4682 60.50598 2.800850 0.0051
DDIROWN0125 0.742668 1.096121 0.677542 0.4981
DDIROWN0025 2.035331 0.927253 2.195011 0.0282
DEBT_TO_EQUITY -0.055494 0.030718 -1.806583 0.0708
PROP_INDDIR 1.128650 0.762630 1.479945 0.1389
AQ 0.325190 0.196721 1.653052 0.0983
LN_ASSET 0.019072 0.057652 0.330818 0.7408
ROE 0.343293 0.286970 1.196265 0.2316
MARKETOBOOK 0.087616 0.080439 1.089228 0.2761
D2001 3.567495 1.060736 3.363226 0.0008
D2002 3.680776 1.060856 3.469627 0.0005
D2003 3.339070 1.057964 3.156130 0.0016
D2004 3.220322 1.066338 3.019984 0.0025
D2005 3.330057 1.064910 3.127079 0.0018
D2006 3.267747 1.066048 3.065290 0.0022
D2007 3.285401 1.073639 3.060060 0.0022
D2008 3.045757 1.072386 2.840170 0.0045 McFadden R-squared 0.105829 Mean dependent var 0.111610
S.D. dependent var 0.314974 S.E. of regression 0.302308
Akaike info criterion 0.650360 Sum squared resid 160.9377
Schwarz criterion 0.718051 Log likelihood -557.7962
Hannan-Quinn criter. 0.675360 Deviance 1115.592
Restr. deviance 1247.628 Restr. log likelihood -623.8138
LR statistic 132.0352 Avg. log likelihood -0.312841
Prob(LR statistic) 0.000000 Obs with Dep=0 1584 Total obs 1783
Obs with Dep=1 199

330
Appendix 19 Eviews output for Equation 10
Dependent Variable: INDIVIDUALDISCLOSURE
Method: ML - Binary Logit (Quadratic hill climbing)
Date: 01/26/12 Time: 17:52
Sample: 2000 2008
Included observations: 1783
Convergence achieved after 7 iterations
QML (Huber/White) standard errors & covariance Variable Coefficient Std. Error z-Statistic Prob. C -6.752207 1.487576 -4.539066 0.0000
FAMOWNWIN -1.849139 0.458854 -4.029905 0.0001
SUBTOWNWIN -1.453476 0.599041 -2.426336 0.0153
GOVWIN 2.171682 0.512337 4.238777 0.0000
FORGNOWNWIN 0.093049 0.468871 0.198455 0.8427
DDIROWN0025 2.100151 0.957284 2.193863 0.0282
DDIROWN01 170.5500 61.92825 2.753994 0.0059
DDIROWN0125 0.981798 1.099867 0.892652 0.3720
LEVERAGEWIN -0.123080 0.054576 -2.255210 0.0241
PROPIND 1.426265 0.776671 1.836383 0.0663
AQ 0.272387 0.192024 1.418502 0.1560
LN_ASSETWIN 0.047392 0.063520 0.746094 0.4556
ROEWIN 0.510182 0.285933 1.784271 0.0744
MARKETOBOOKWIN 0.199901 0.045721 4.372177 0.0000
D2001 3.860246 1.186632 3.253111 0.0011
D2002 3.975275 1.181549 3.364462 0.0008
D2003 3.605472 1.178459 3.059481 0.0022
D2004 3.476394 1.187594 2.927259 0.0034
D2005 3.610809 1.186175 3.044078 0.0023
D2006 3.597838 1.186138 3.033237 0.0024
D2007 3.539094 1.185974 2.984125 0.0028
D2008 3.328451 1.195574 2.783976 0.0054 McFadden R-squared 0.125732 Mean dependent var 0.111610
S.D. dependent var 0.314974 S.E. of regression 0.298830
Akaike info criterion 0.636434 Sum squared resid 157.2558
Schwarz criterion 0.704125 Log likelihood -545.3806
Hannan-Quinn criter. 0.661433 Deviance 1090.761
Restr. deviance 1247.628 Restr. log likelihood -623.8138
LR statistic 156.8663 Avg. log likelihood -0.305878
Prob(LR statistic) 0.000000 Obs with Dep=0 1584 Total obs 1783
Obs with Dep=1 199
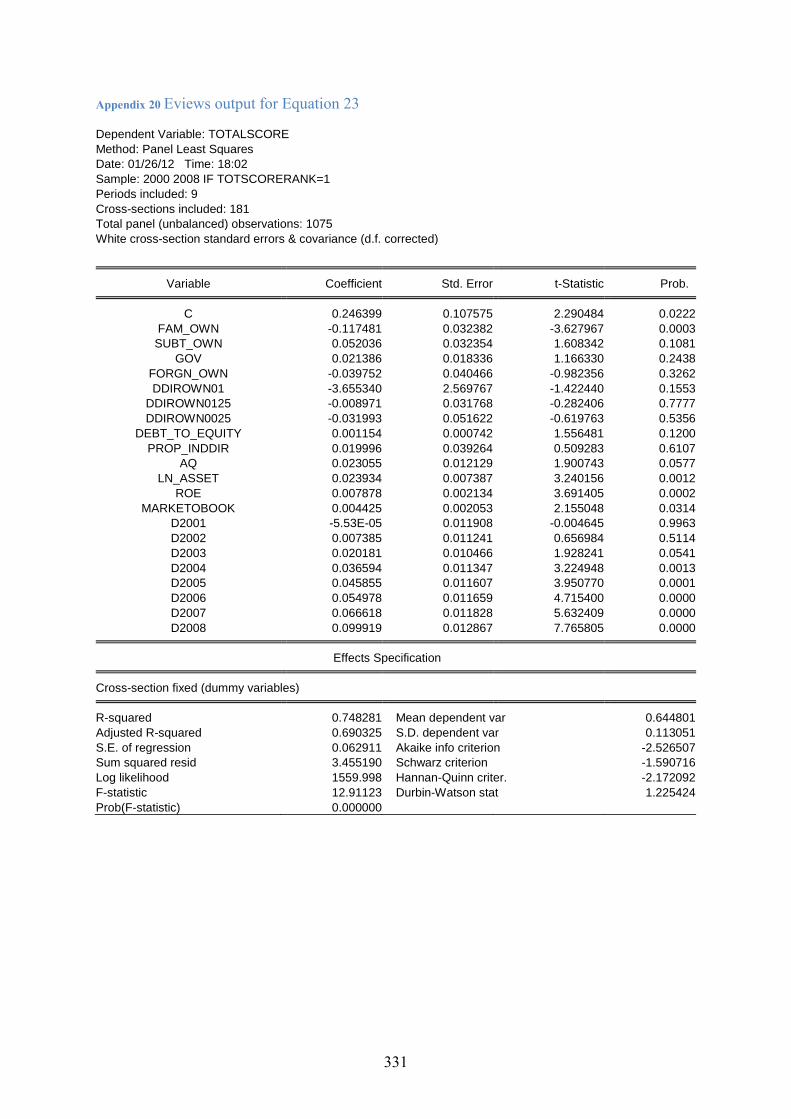
331
Appendix 20 Eviews output for Equation 23
Dependent Variable: TOTALSCORE
Method: Panel Least Squares
Date: 01/26/12 Time: 18:02
Sample: 2000 2008 IF TOTSCORERANK=1
Periods included: 9
Cross-sections included: 181
Total panel (unbalanced) observations: 1075
White cross-section standard errors & covariance (d.f. corrected)
Variable Coefficient Std. Error t-Statistic Prob. C 0.246399 0.107575 2.290484 0.0222
FAM_OWN -0.117481 0.032382 -3.627967 0.0003
SUBT_OWN 0.052036 0.032354 1.608342 0.1081
GOV 0.021386 0.018336 1.166330 0.2438
FORGN_OWN -0.039752 0.040466 -0.982356 0.3262
DDIROWN01 -3.655340 2.569767 -1.422440 0.1553
DDIROWN0125 -0.008971 0.031768 -0.282406 0.7777
DDIROWN0025 -0.031993 0.051622 -0.619763 0.5356
DEBT_TO_EQUITY 0.001154 0.000742 1.556481 0.1200
PROP_INDDIR 0.019996 0.039264 0.509283 0.6107
AQ 0.023055 0.012129 1.900743 0.0577
LN_ASSET 0.023934 0.007387 3.240156 0.0012
ROE 0.007878 0.002134 3.691405 0.0002
MARKETOBOOK 0.004425 0.002053 2.155048 0.0314
D2001 -5.53E-05 0.011908 -0.004645 0.9963
D2002 0.007385 0.011241 0.656984 0.5114
D2003 0.020181 0.010466 1.928241 0.0541
D2004 0.036594 0.011347 3.224948 0.0013
D2005 0.045855 0.011607 3.950770 0.0001
D2006 0.054978 0.011659 4.715400 0.0000
D2007 0.066618 0.011828 5.632409 0.0000
D2008 0.099919 0.012867 7.765805 0.0000 Effects Specification Cross-section fixed (dummy variables) R-squared 0.748281 Mean dependent var 0.644801
Adjusted R-squared 0.690325 S.D. dependent var 0.113051
S.E. of regression 0.062911 Akaike info criterion -2.526507
Sum squared resid 3.455190 Schwarz criterion -1.590716
Log likelihood 1559.998 Hannan-Quinn criter. -2.172092
F-statistic 12.91123 Durbin-Watson stat 1.225424
Prob(F-statistic) 0.000000

332
Appendix 21Eviews output for Equation 24
Dependent Variable: TOTALSCORE
Method: Panel Least Squares
Date: 01/26/12 Time: 18:11
Sample: 2000 2008 IF TOTSCORERANK=0
Periods included: 9
Cross-sections included: 198
Total panel (unbalanced) observations: 708
White cross-section standard errors & covariance (d.f. corrected)
Variable Coefficient Std. Error t-Statistic Prob. C -0.089992 0.152346 -0.590707 0.5550
FAM_OWN -0.013861 0.014986 -0.924918 0.3555
SUBT_OWN 0.032630 0.043692 0.746822 0.4555
GOV 0.007097 0.051352 0.138210 0.8901
FORGN_OWN -0.013518 0.040506 -0.333738 0.7387
DDIROWN01 0.581598 1.833822 0.317151 0.7513
DDIROWN0125 0.001461 0.039946 0.036571 0.9708
DDIROWN0025 0.100586 0.055297 1.819018 0.0695
DEBT_TO_EQUITY -0.000195 0.000144 -1.356220 0.1757
PROP_INDDIR 0.039584 0.016429 2.409302 0.0164
AQ -0.013794 0.014007 -0.984791 0.3252
LN_ASSET 0.018602 0.011574 1.607144 0.1087
ROE -0.002982 0.002375 -1.255560 0.2099
MARKETOBOOK 0.000361 0.000219 1.653455 0.0989
D2001 0.185111 0.000696 265.9376 0.0000
D2002 0.230664 0.002265 101.8496 0.0000
D2003 0.232356 0.003273 70.99979 0.0000
D2004 0.238187 0.002371 100.4604 0.0000
D2005 0.240627 0.002340 102.8388 0.0000
D2006 0.246179 0.002390 103.0097 0.0000
D2007 0.241147 0.002679 90.00969 0.0000
D2008 0.227023 0.004687 48.43989 0.0000 Effects Specification Cross-section fixed (dummy variables) R-squared 0.883137 Mean dependent var 0.349493
Adjusted R-squared 0.831038 S.D. dependent var 0.115568
S.E. of regression 0.047504 Akaike info criterion -3.007440
Sum squared resid 1.103496 Schwarz criterion -1.596175
Log likelihood 1283.634 Hannan-Quinn criter. -2.462190
F-statistic 16.95128 Durbin-Watson stat 2.024408
Prob(F-statistic) 0.000000

333
Appendix 22 Eviews output for Equation 25
Dependent Variable: TOT_VOLSCORE
Method: Panel Least Squares
Date: 01/26/12 Time: 18:25
Sample: 2000 2008 IF VOLSCORERANK=1
Periods included: 9
Cross-sections included: 162
Total panel (unbalanced) observations: 843
White cross-section standard errors & covariance (d.f. corrected)
Variable Coefficient Std. Error t-Statistic Prob. C 0.311340 0.134298 2.318281 0.0207
FAM_OWN -0.076037 0.012210 -6.227323 0.0000
SUBT_OWN 0.074455 0.043952 1.694005 0.0907
GOV 0.004869 0.025218 0.193097 0.8469
FORGN_OWN -0.050632 0.081710 -0.619662 0.5357
DDIROWN01 -2.912147 3.593503 -0.810392 0.4180
DDIROWN0125 0.027995 0.070668 0.396150 0.6921
DDIROWN0025 -0.088181 0.065230 -1.351857 0.1769
DEBT_TO_EQUITY 0.001508 0.000887 1.699225 0.0897
PROP_INDDIR 0.008299 0.057401 0.144572 0.8851
AQ 0.026181 0.013600 1.925003 0.0547
LN_ASSET 0.020334 0.010705 1.899521 0.0579
ROE 0.004899 0.003638 1.346392 0.1786
MARKETOBOOK 0.002144 0.002931 0.731480 0.4647
D2001 -0.036215 0.016585 -2.183543 0.0293
D2002 -0.022876 0.014247 -1.605603 0.1088
D2003 0.005467 0.013580 0.402597 0.6874
D2004 0.021279 0.014872 1.430848 0.1529
D2005 0.037152 0.016898 2.198614 0.0283
D2006 0.040611 0.016526 2.457410 0.0143
D2007 0.055018 0.016921 3.251425 0.0012
D2008 0.074496 0.016544 4.502792 0.0000 Effects Specification Cross-section fixed (dummy variables) R-squared 0.689883 Mean dependent var 0.656362
Adjusted R-squared 0.604366 S.D. dependent var 0.107681
S.E. of regression 0.067731 Akaike info criterion -2.357122
Sum squared resid 3.027703 Schwarz criterion -1.328813
Log likelihood 1176.527 Hannan-Quinn criter. -1.963071
F-statistic 8.067184 Durbin-Watson stat 1.214170
Prob(F-statistic) 0.000000

334
Appendix 23 Eviews output for Equation 26
Dependent Variable: TOT_VOLSCORE
Method: Panel Least Squares
Date: 01/26/12 Time: 18:36
Sample: 2000 2008 IF VOLSCORERANK=0
Periods included: 9
Cross-sections included: 198
Total panel (unbalanced) observations: 940
White cross-section standard errors & covariance (d.f. corrected)
Variable Coefficient Std. Error t-Statistic Prob. C 0.085402 0.147552 0.578794 0.5629
FAM_OWN -0.023655 0.016173 -1.462566 0.1440
SUBT_OWN 0.032021 0.034215 0.935898 0.3496
GOV 0.075161 0.035517 2.116177 0.0347
FORGN_OWN 0.005078 0.031534 0.161025 0.8721
DDIROWN01 1.254698 1.206323 1.040102 0.2986
DDIROWN0125 -0.025848 0.028208 -0.916335 0.3598
DDIROWN0025 0.087370 0.030989 2.819370 0.0049
DEBT_TO_EQUITY 6.72E-05 0.000131 0.513427 0.6078
PROP_INDDIR 0.024919 0.008054 3.093965 0.0021
AQ -0.010363 0.015171 -0.683071 0.4948
LN_ASSET 0.005335 0.012097 0.441003 0.6593
ROE 0.000150 0.002116 0.070670 0.9437
MARKETOBOOK 0.000192 0.000170 1.127931 0.2597
D2001 0.159433 0.000274 581.7369 0.0000
D2002 0.208017 0.000864 240.7950 0.0000
D2003 0.220092 0.000679 324.2485 0.0000
D2004 0.225559 0.002250 100.2638 0.0000
D2005 0.211642 0.002537 83.41916 0.0000
D2006 0.213990 0.003448 62.06046 0.0000
D2007 0.222794 0.004205 52.98557 0.0000
D2008 0.207344 0.002315 89.54825 0.0000 Effects Specification Cross-section fixed (dummy variables) R-squared 0.824866 Mean dependent var 0.350221
Adjusted R-squared 0.771913 S.D. dependent var 0.105375
S.E. of regression 0.050326 Akaike info criterion -2.939892
Sum squared resid 1.826047 Schwarz criterion -1.810905
Log likelihood 1600.749 Hannan-Quinn criter. -2.509512
F-statistic 15.57733 Durbin-Watson stat 1.692246
Prob(F-statistic) 0.000000