The Impact of Capital and Foreign Exchange Flows on the ... · ... and income lead to real exchange...
31
The Impact of Capital and Foreign Exchange Flows on the Competitiveness of Developing Countries Damyana Bakardzhieva, Sami Ben Naceur, and Bassem Kamar WP/10/154
Transcript of The Impact of Capital and Foreign Exchange Flows on the ... · ... and income lead to real exchange...

The Impact of Capital and Foreign Exchange Flows on the Competitiveness
of Developing Countries
Damyana Bakardzhieva, Sami Ben Naceur, and
Bassem Kamar
WP/10/154

© 2010 International Monetary Fund WP/10/154 IMF Working Paper
IMF Institute
The Impact of Capital and Foreign Exchange Flows on the Competitiveness of Developing Countries
Prepared by Damyana Bakardzhieva1, Sami Ben Naceur, and Bassem Kamar2
Authorized for distribution by Abdelhadi Yousef
July 2010
Abstract
This Working Paper should not be reported as representing the views of the IMF. The views expressed in this Working Paper are those of the author(s) and do not necessarily represent those of the IMF or IMF policy. Working Papers describe research in progress by the author(s) and are published to elicit comments and to further debate.
1 University of Maryland-College Park, Morrill Hall 1106D, College Park, MD 20742. 2 IMF Institute, International Monetary Fund, 700 19th Street, N.W., Washington, D.C. 20431. We thank Enrica Detragiache, Dalia Hakura, Luca Ricci, Nikola Spatafora and Abdelhadi Yousef for useful comments, and Yasmina Zinbi and Naseebah Hajjaj for editorial assistance.
Attracting capital and foreign exchange flows is crucial for developing countries. Yet, these flows could lead to real exchange rate appreciation and may thus have detrimental effects on competitiveness, jeopardizing exports and growth. This paper investigates this dilemma by comparing the impact of six types of capital and foreign exchange flows on real exchange rate behavior in a sample of 57 developing countries covering Africa, Europe, Asia, Latin America, and the Middle East. The results reveal that portfolio investments, foreign borrowing, aid, and income lead to real exchange rate appreciation, while remittances have disparate effects across regions. Foreign direct investments have no effect on the real exchange rate, contributing to resolve the above dilemma.
JEL Classification Numbers: C23, F2, F31, F41
Keywords: Real Exchange Rate, Competitiveness, Capital Flows, Developing Countries, FDI, Foreign Exchange Flows, Panel Data Econometrics, Emerging Markets.
Author’s E-Mail Address: [email protected]; [email protected]; [email protected]

2
CONTENTS PAGE
I. Introduction ............................................................................................................................3
II. Capital Flows and the Real Exchange Rate Nexus: Related Literature ................................5
III. Capital Flows and Other REER Determinants .....................................................................9 A. REER Index ..............................................................................................................9 B. Capital and Foreign Exchange Flows Variables .....................................................10 C. Control Variables ....................................................................................................12
Government Consumption ...............................................................................12 Trade Openness ................................................................................................12 Productivity ......................................................................................................12 Terms of Trade .................................................................................................13
IV. Empirical Methodology .....................................................................................................13
V. Interpretation of the Results ................................................................................................14
VI. Conclusion and Policy Implication ....................................................................................20 References ................................................................................................................................26 TABLES 1. GMM-in System Estimates of the Impact of Capital Flows on Real Effective ...................16 2. GMM-in System Estimates of the Impact of Capital Flows on Real Effective by Region .18 3. Capital and Foreign Exchange Flows to the CEECs in percent of GDP .............................24 FIGURES 1. REER for all Six Regions Including GCC ...........................................................................21 2. Aggregated Capital Flows....................................................................................................21 3. Income..................................................................................................................................21 4. Aid........................................................................................................................................22 5. Aid in All Regions Excluding GCC.....................................................................................22 6. Remittances ..........................................................................................................................22 7. FDI .......................................................................................................................................23 8. Portfolio Investments ...........................................................................................................23 9. Portfolio Investments Excluding GCC ................................................................................23 10. Debt ....................................................................................................................................24 11. Debt Excluding GCC .........................................................................................................24 APPENDIXES 1. List of Countries Included in our Sample ............................................................................25 2. List of Variables Included in our Model ..............................................................................25

3
I. INTRODUCTION
Maintaining a high level of competitiveness is an important objective for developing and emerging economies, as it enhances their exports and growth and contributes to their economic diversification3. Therefore, investigating the determinants of competitiveness and identifying the factors that might undermine them is essential. Competitiveness can have different measures, including labor productivity, the real effective exchange rate (REER), unit labor cost, terms of trade, Balassa's index of revealed comparative advantage, and the World Economic Forum competitiveness index. The paper uses the real effective exchange rate (REER)4 as it has been the most widely used measure for competitiveness in the literature in recent years5. Capital flows are an important determinant of the possible loss of competitiveness. Most of the related literature indicates that an increase in capital flows leads to the appreciation6 of the real effective exchange rate (REER), which may have detrimental effects on the external competitiveness (Corden, 1994). On another hand, capital flows are essential for developing and emerging markets. They contribute to enhancing investments and financing current account deficits. This dual effect creates a dilemma for policy makers on how to manage capital inflows to maximize the benefit for the economy. Resolving this dilemma requires identifying which capital flows lead to the least significant appreciation of the REER, or have no impact on the REER at all, and thus do not necessarily undermine competitiveness. Capital flows can be divided into several types. Three distinctive flows appear in the financial account of the balance of payments, namely foreign direct investments (FDI), portfolio investments and other investments. Three others appear in the current account — remittances, aid, and income. While these flows are not typically labeled as “capital” flows, their implications for competitiveness could be significant. These flows are referred to in the paper as “foreign exchange” flows.
3 Though competitiveness is not a goal in itself, relatively fast growing countries need improved competitiveness to sustain high output growth without straining the balance of payments, (e.g. Lipschitz and McDonald, 1991). 4 This paper uses the IMF REER Index. 5 See for example Eyraud (2009), Bennett and Zarnic (2008) and Monfort (2008). Nevertheless, as with all other proxies, using REER as an indicator for competitiveness could have some limitations. For example, as long as relative productivity rises faster than the percentage appreciation of the REER, competitiveness can improve even as the REER appreciates. 6 It should be noted that the paper’s analysis of the appreciation or depreciation of the REER cannot tell whether it is a misalignment or an equilibrium phenomenon.

4
The related literature reveals a disparity in the impact of the different types of capital flows on competitiveness, and even a disparity in the impact of specific types of capital flows across countries and regions. The impact depends on the types of expenditure each flow is tied to. For example, a long-run increase in aid or in remittances devoted to poverty alleviation will likely generate increased spending on non-tradables, and an increase in the relative price of non-tradables (i.e. REER appreciation). Conversely, if an increase in, say, FDI or natural-resource revenues is spent mainly on imported capital goods, then it may be less likely to lead to REER appreciation, but this does not translate into greater external sustainability7. In addition, while FDI, aid and remittances attracted the focus of researchers in this field, other flows like portfolio investments, other investments and income witnessed very limited or no attention. One can argue that the impact of any of these three flows on REER also depends on the types of expenditure each flow is tied to. If portfolio investments flows are oriented towards the modernization of firms in developing countries, which requires new machinery and new product lines, the impact might be similar to that of FDI, but if they are mainly volatile investments for speculation, the impact might be different. The same applies to other investments flows in the financial account of the balance of payments. These flows can be either liabilities of the private or the public sector of the economy. If these flows are to be used to build golf courses, their impact on REER might be different than if they are used to finance exports production, which would be also different than if the flows are used to finance non-tradables like building houses. Concerning income flows in the current account, their impact on REER might be less obvious. While one might think they would lead to the appreciation of REER like capital flows in general, in some cases like those of the rich oil countries with wealth funds, it is possible that income received from investments is reinvested abroad and should then have no impact on the REER. Because of all these possibilities of having mixed results, we find it very interesting to examine the impact of each of these capital flows on REER, and also compare their impact across different regions. The contribution of this paper lies in comprehensively examining the effect of each distinctive capital and foreign exchange flow on the REER in various geographical regions.8 The review of the empirical literature shows that earlier studies were confined to fewer types of flows and were also restricted to single countries or to limited country groups. To our knowledge, this paper is the first attempt to fill this gap by investigating this issue in a large set of developing countries. The estimations in the paper are conducted on a panel of 57 countries covering 6 regions, namely Africa, Central and Eastern European Countries 7 For an extensive study on real exchange rate assessment and external sustainability in low income countries see Christiansen et al. (2009). 8 We want to underline that the main objective of the paper is to identify the degree to which each type of inflow affects the REER. The details on why FDI or remittances might affect the REER differently or on why aid might have different impacts across regions are beyond the scope of this research.

5
(CEEC), South and East Asia, Latin America, Middle East and North Africa (MENA), and the Gulf Cooperation Council (GCC).9 The Generalized Method of Moments (GMM) estimator is used to examine the relationship between each type of capital and foreign exchange inflow and REER appreciation. This estimator has the advantage of dealing with omitted variable and endogeneity biases, often presented as two sources of inconsistency in the literature on REER and capital flows. The most significant finding of the paper is that FDI does not lead to the appreciation of REER in almost all regions and even leads to its depreciation in the CEEC and MENA. This makes a strong case for implementing policies encouraging FDI which might improve developing countries’ competitiveness and mitigate the overall negative impact of aggregated capital flows on REER appreciation. The next section summarizes the main findings available in the literature related to the impact of different types of capital flows on the REER. Section III presents the theoretical determinants of the REER behavior and explores each type of capital flow across the six regions. Section IV discusses the appropriateness of the GMM estimator approach and describes the econometric methodology. Section V presents the results, and Section VI concludes.
II. CAPITAL FLOWS AND THE REAL EXCHANGE RATE NEXUS: RELATED LITERATURE
The Salter (1959), Swan (1960), Corden (1960) and Dornbusch (1974) paradigm serves as the theoretical underpinning to test empirically the incidence of capital flows on the REER in emerging economies. The model explains how a surge in capital flows would generate an appreciation of the REER (Corbo and Fisher, 1995). A rise in capital flows increases real wages, which in turn bring out a rise in domestic demand and hence in prices of nontradable goods relative to tradable goods that are exogenously priced. Since the REER is generally defined as the value of domestic prices of nontradable goods relative to prices of tradable goods, a rise in the relative price of nontradable goods corresponds to a real exchange appreciation (spending effect). This is indicative of the presence of “Dutch Disease effects” (Corden and Neary, 1982), which describes the side effect of natural-resource booms or increases in capital flows on the competitiveness of export-oriented sectors and import-competing sectors. However, different types of capital flows may have different effects on the REER because they affect it through different channels.
9 While the GCC are part of the MENA region, they are analyzed separately in the paper because of the specific nature of their economies and the possible unique impact capital and foreign exchange flows in these countries can have on the REER. By contrast with other regions, remittances and aid are mainly outflows, and income inflows are the result of large and increasing oil-revenue investments abroad.
6
REER determinants have been the subject of numerous theoretical and empirical investigations and are widely used to estimate the REER equilibrium and its misalignment. Capital flows are included as a determinant in most of the studies (Aron et al., 1998, Elbadawi and Soto, 1997, and many others). However, recent studies have tried to assess the impact of capital flows per se on the REER as a measure of competitiveness. Some of them distinguish FDI and other capital flows, some have concentrated on specific foreign exchange flows, such as aid and remittances, and some have interacted capital flows with economic policy variables. Capital Flows: FDI, Portfolio Investments, Other Investments (Debts) For the papers related to the impact of foreign direct investment (FDI) versus other flows, Athukorala and Rajapatirana (2003), in a study of countries in Latin America and South and East Asia, find that non-FDI capital flows lead to real exchange rate appreciation (to a far greater degree in Latin America than in East Asia), while FDI tends to depreciate the real exchange rate. The authors explain their findings by the hypothesis that FDI tends to be more biased toward tradable goods compared with the other types of capital flows. Lartey (2007) reveals that FDI causes the REER to appreciate in Sub-Saharan Africa but to a lesser extent compared with aid flows, which is similar to a “Dutch Disease effect.” The impact of portfolio investment and other investments (debt) flows on REER seems to have received little attention so far. Elbadawi and Soto (1994) disaggregate capital flows for the case of Chile into four components: short-term capital flows, long-term capital flows, portfolio investment, and foreign direct investment. They find that short-term capital flows and portfolio investment have no effect on the equilibrium real exchange rate, but long-term capital flows and foreign direct investment have a significant appreciating effect. Foreign Exchange Flows To our knowledge, the analysis of the relation between REER and income flows that appear in the current account has been so far relatively neglected. Analyzing this variable is increasingly important from our point of view. Many developing countries are accumulating reserves and are creating large wealth funds to manage their accumulated surpluses. This is the case not only in oil rich countries, but also in China and some other countries. The return from these wealth-funds’ investments abroad appears in the income account of the balance of payments. As current account surpluses in these countries increase, wealth-fund investments grow and the income flows rise. The impact of this rise in income on the REER depends on whether these revenues are tied to local or foreign goods consumption and on how such flows would affect the price of non-tradables. The impact also depends on possible nominal exchange rate appreciation, which could be subject to the existing exchange rate regime and to the sterilization of exchange rate interventions. The significance and sign of the impact of income on REER in our tests will be informative about the channels through which income affects economic activity in different regions.

7
For the studies focusing on workers’ remittances, several papers confirmed the presence of a large spending effect that causes a rise in relative prices of nontradables and REER appreciation, producing a “Dutch Disease effect.” Amuedo-Dorantes and Pozo (2004) find that doubling the transfers of workers’ remittances leads to an appreciation of the REER by 22 percent in a panel of 13 Latin American countries. In the same vein, Lopez et al. (2007) confirm that surges in remittances cause the REER to appreciate in Latin America. The findings also indicate that the observed changes in the REER are driven not solely by natural appreciation but that some changes are linked to misalignment. More recently, Lartey et al. (2008) show that an increased level of remittances in developing countries can lead to REER appreciation. The study also finds that the “Dutch Disease effect” is more acute in the presence of fixed exchange rate regimes. Rajan and Subramanian (2005) study the impact of remittances and find that they have no effects on external competitiveness. They explain this surprising result by the argument that remittance flows are mainly directed toward unskilled-labor activities and tradable sectors such as manufacturing. Their analysis also concludes that aid flows have systematic adverse effects on a country’s competitiveness, as reflected in a decline in the share of labor intensive and tradable industries in the manufacturing sector. They find evidence suggesting that these effects stem from the real exchange rate overvaluation caused by aid flows. Following-up on aid flows in a multi-country setting, Elbadawi (1999) finds that a 10 percent increase in the aid flows contributes to a rise of 1 percent in the REER in a panel study of 62 developing countries. Later on, Elbadawi et al. (2008) using a behavioral real exchange model on a sample of 83 countries between 1970 and 2004 find that although post-conflict countries receive larger aid flows, they exhibit moderate REER overvaluation. Along the same line, Prati and Tressel (2006) find in a sample of developing countries that foreign aid flows have a negative impact on exports of poor countries as implied by the “Dutch Disease” theory. IMF (2005) reports on an absence of appreciation of the exchange rate in five African countries following the surge of aid flows. The study concludes that part of the reason that real appreciation (and consequently, Dutch disease) was not observed in those cases is precisely because authorities were concerned with competitiveness and restricted aid absorption accordingly. Adenauer and Vagassky (1998) find that aid contributes substantially to real exchange appreciation in the countries of the West African Economic and Monetary Union. For a large sample of developing countries, Kang et al. (2007) find that aid flows have a negative effect on exports linked to REER overvaluation for half the sample and a positive impact on growth and exports for the other half of the sample. Fielding (2007) also reaches the same mixed results when using a conditional VAR for ten Pacific economies to assess whether aid flows lead to real exchange appreciation.

8
More recently, Arellano et al. (2009) find that higher aid flows are associated with a higher relative price of nontradables and thus a real appreciation. In a study covering 73 aid-dependent countries, they explain that aid increases the availability of tradables relative to nontradables, raising the equilibrium price of the latter. At the same time, it pushes up the returns to capital, the factor assumed to be used intensively in nontradable production, thus increasing the relative cost of producing nontradables. Yet, they also emphasize that no real appreciation would occur if the capital stock were freely interchangeable between sectors. Gupta et al. (2005) demonstrate that the impact of aid flows on the REER depends on the uses of aid, its contents, and its assumed policy response. If foreign aid is spent on imports, there is no effect on the REER. However, if the proceeds are sold by the government to the central bank, the impact on REER will depend on how much the central bank will sell of the aid-related foreign exchange in the domestic market and on how much of this amount of local currency counterpart is spent domestically. Adam and Bevan (2004) and Nkusu (2004) point out that the more elastic the supply response, the smaller the real exchange appreciation needed, which emphasizes the mitigating role of excess output capacity. Atingi-Ego (2005) confirms the above argument in finding that excess capacity in the nontraded sector of some African countries limits the potential of price increases stemming from aid flows. Additionally, Adam and Bevan (2004) demonstrate that the reaction of the REER to aid flows depends on the variation of the composition of aid expenditures. For individual country studies, White and Wignaraja (1992) conclude that aid flows have caused REER appreciation in Sri-Lanka. Opoku-Afary et al. (2004) examine the case of Ghana using vector autoregression (VAR) econometric modeling and find no short-run effect, but the impact of aid in the long run is strong and conducive to real exchange appreciation. More recently, Bourdet and Falck (2006) find that aid flows in the Cape Verde Islands cause some REER appreciation with an elasticity of less than 10 percent. Both Falck (1997) and Nyomi (1998) examine the impact of aid flows on the REER in Tanzania. While Flack’s ordinary least squares (OLS) estimation indicates real exchange appreciation, Nyomi’s error correction model finds, to the contrary, that foreign aid generates depreciation in the REER. The literature review reveals several gaps in the analysis of the impact of the different types of capital and foreign exchange flows on competitiveness. In addition, there are ambiguous and sometimes contradictory results regarding the effect of any of the disaggregated capital or foreign exchange flows across countries, regions, and econometric methodologies. This calls for further research on the subject.

9
III. CAPITAL FLOWS AND OTHER REER DETERMINANTS
In order to investigate the impact of each type of capital flow on REER behavior in developing countries, we are applying our tests to 57 developing countries (Appendix 1), covering six different regions; Africa, CEEC, South and East Asia, GCC, Latin America and MENA. The capital flows and foreign exchange flows data are obtained from the balance of payments data reported in the International Financial Statistics. The data for other control variables are from the World Economic Outlook (WEO) database. The sample period is from 1980 to 2007. The paper empirically examines the factors that influence the real effective exchange rate by estimating a number of variants of equation (1), depending on the assumption made about the error term and the exogeneity of the independent variables:
REERi,t = α1+ α2Capital Flowsi,t + α3Policyi,t + α4Controli,t + εi,t ( 1 )
where i refers to the country and t refers to time.
A. REER Index
REER indices for countries in the sample are obtained from the IMF’s Information Notice System (INS) database.10 Figure 1 examines the behavior of the REER across regions.11 The year 2000 is taken as a common base year for comparison across all countries, even though it does not represent a particular REER equilibrium level for any country or region. The REER depreciated over the period from 1980 to early 1990s for all regions. After that, REER stabilized in Latin America, the GCC, and Africa. Asia has seen a depreciation of the REER during the Asian crisis, and MENA shows a strong appreciation during the first Gulf war in 1991. The CEEC presents a special case as the region witnessed a continuous appreciation of the REER since the economic transformation of the early 1990s. Section B below describes trends in the six types of capital and foreign exchange flows. Section C explains the definition of other determinants of the REER that are included in the regression estimations, including policy variables (monetary, fiscal, and trade-openness variables) and some other control variables, and their theoretical relationship with the REER.
10 Appendix 2 provides the definition and data sources for the variables used in the paper. 11 Ghana is excluded from the calculation of the average REER for Africa because the index exceeded 3800 in 1983, and constitutes an important outlier.

10
B. Capital and Foreign Exchange Flows Variables
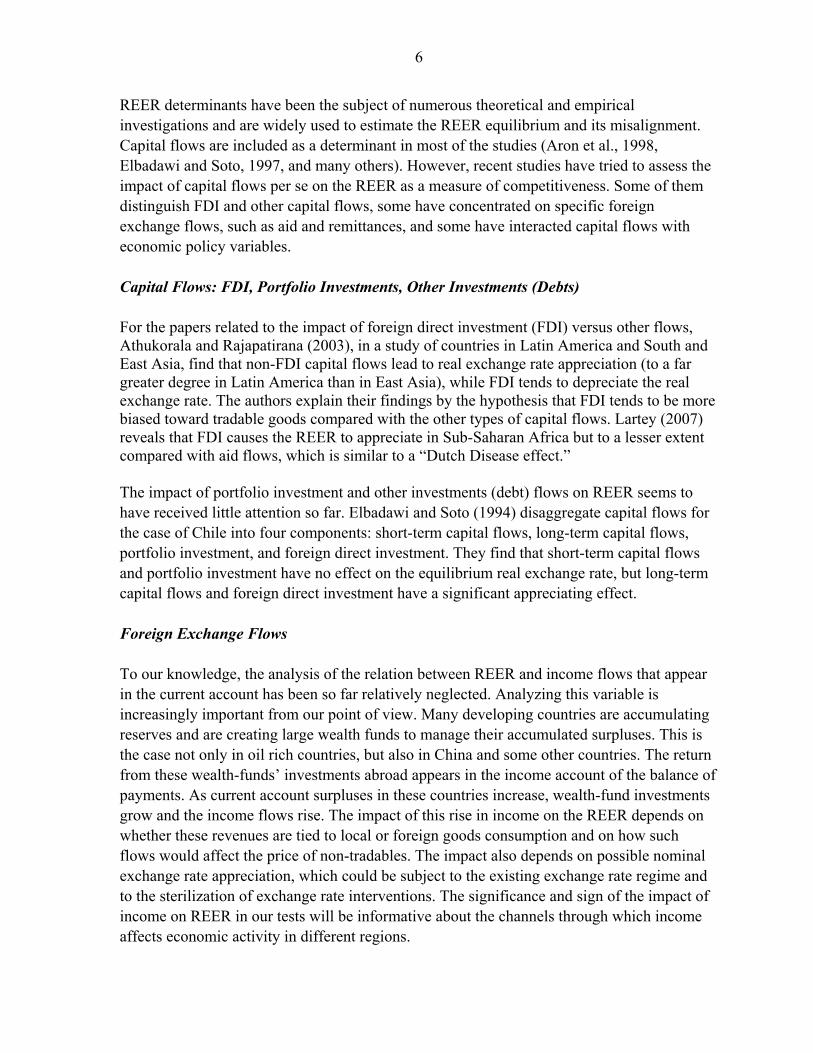
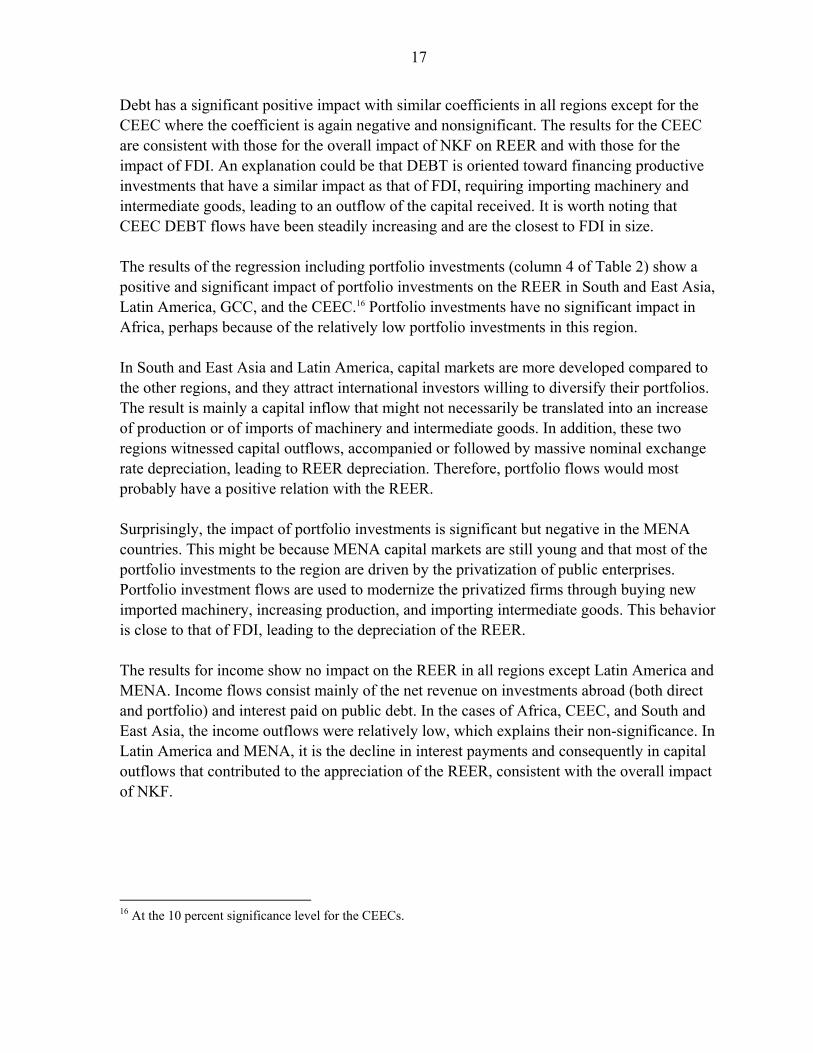
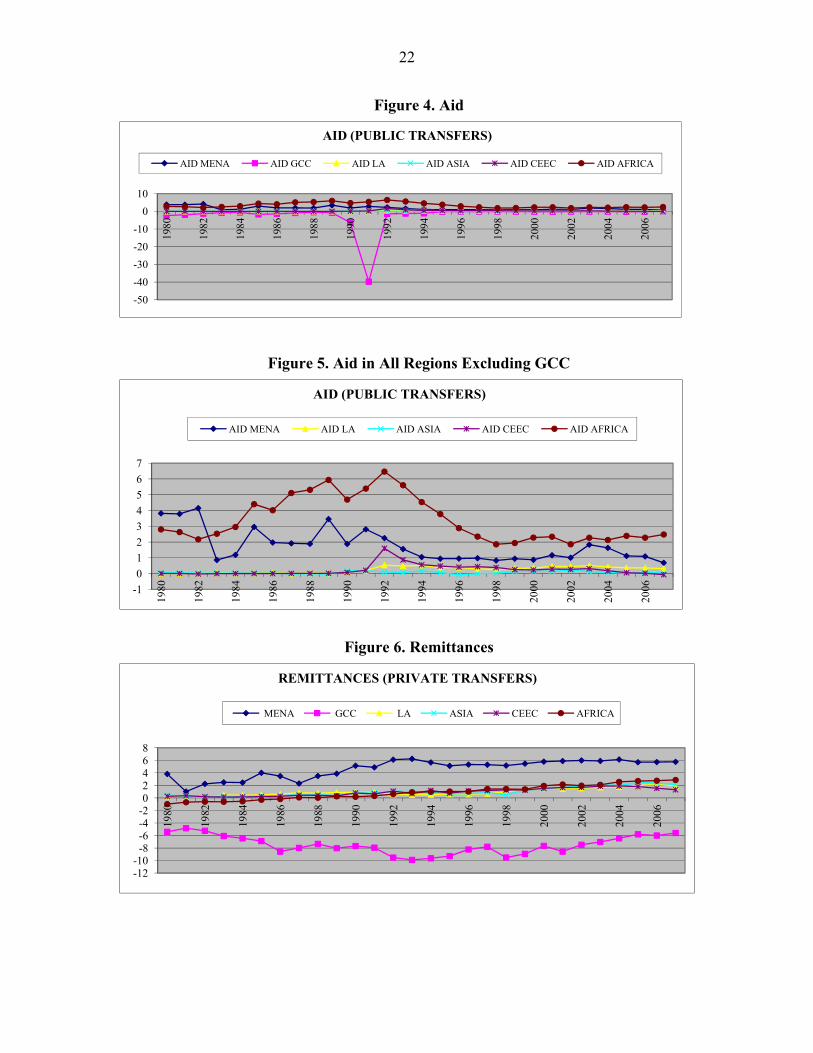
The calculation of the aggregated capital and foreign exchange flows (that we label net capital flows or NKF) includes flows in both the current account (income, remittances, and aid) and the financial account (FDI, portfolio investments, and other investments). The sum of these six variables would be equal to the inverse sign of the balance of goods and services after subtracting the change in reserves, to get only the total capital and foreign exchange flows without any central bank intervention. The net capital flows in the different regions have been following close trends, except for the case of the GCC (Figure 2). While the other five regions witnessed positive capital flows over the period from 1980 to 2007, the GCC had an opposite pattern, with massive capital outflows reaching almost 27 percent of GDP, especially in recent years. The year 1991 is an exception owing to the first Gulf war and represents a recurrent outlier in almost all data related to the GCC. The MENA region seems to have attracted the highest ratio of NKF to GDP over the period, oscillating on average between 10 and 20 percent. The second region is Africa, joined by the CEEC by the end of the period. South and East Asia and Latin America received the lowest NKF/GDP that oscillated between +/- 5 percent. Next the paper analyzes the various types of flows, starting with the current account flows (income, aid, and remittances), followed by the financial account flows (FDI, portfolio investments, and debt). The GCC enjoyed the highest level of income to GDP over the sample period (Figure 3), reaching almost 18 percent in the early 1980s. This could be due to the investment of oil revenue abroad that allowed the GCC countries to receive high returns in their income account. In almost all other regions, income was negative, reflecting higher amounts of interest paid on debt than returns on investments. The second variable is the public official current transfers. It is referred to in the paper as AID and is calculated as a percentage of GDP (Figure 4). Figure 5 excludes the GCC because of their outlier in 1991, to allow us to better visualize the aid flows in the other regions. It shows that Africa received the highest ratios of aid to GDP, reaching more than 6 percent in 1993, followed by MENA, CEEC since 1992, Latin America, and finally South and East Asia. The third flow variable in the current account is the private unilateral transfers to GDP ratio and is a proxy for remittances. All regions except the GCC have seen increasing or stable remittances flows to their economies (Figure 6). Owing to the nature of the GCC economies, which rely mainly on foreign labor, these countries face constant remittances outflows between 5 and 10 percent of GDP.

11
The MENA countries are the most important recipients of remittances, reaching more than 5 percent of GDP since the early 1990s, followed by Africa at 3 percent, South and East Asia, Latin America, and CEEC. With respect to the flows in the financial account, FDI flows to developing countries, have been increasing steadily over the past three decades. Figure 7 shows that the level of FDI to GDP has been lower than 2 percent in the 1980s and started to pickup in the beginning of the 1990s. Since the second half of the nineties, the CEEC were on average the highest receivers of FDI, followed by Latin America, MENA, South and East Asia, Africa, and the GCC respectively; with the share of MENA increasing in recent years. Figure 8 shows the net portfolio investments as a percentage of GDP (PORT). It can be seen that the GCC are a special case with increasing portfolio investment outflows since 1996. This is mainly owing to the creation of sovereign wealth funds that invest part of the oil revenues in the international capital markets. With the increase of oil prices and the increase in the GCC oil revenue surplus, portfolio outflows from these countries have been steadily growing, reaching more than 16 percent of GDP. The other regions have been receiving increasing levels of portfolio flows since the early 1990s, but they never exceeded 2 percent of GDP in any region (Figure 9). Portfolio investments were marked by an increasing volatility and episodes of massive outflows, such as occurred in Asia in 1997 and 1998, in Latin America in 2003 and 2004, and in the CEEC in 2005. MENA and Africa were also subject to portfolio investment outflows but at a lower degree, not exceeding 1 percent of GDP. Other net investments in the financial account as a percentage of GDP (DEBT) are taken to proxy for the net borrowing from abroad (Figure 10). The GCC again exhibit an outlier in 1991. Before that date, the GCC had negative ratios reflecting the capacity of these countries to lend to others using their excess oil revenue. There was a change in the pattern of debt flows over the sample period in other regions (Figure 11). In the 1980s and 1990s, Africa was the most important recipient of debt flows, reaching almost 9 percent of GDP, while other regions received less than 5 percent. Since then, Asian countries started lending, with their exports of debt capital reaching 5 percent of GDP, followed by Latin America in some years, and to a lower extent, Africa, which has seen massive debt outflows in 2006. Conversely, the CEEC witnessed a continuous increase of debt flows since 2002, reaching almost 10 percent of GDP in 2007.

12
C. Control Variables
Government Consumption GCON is the logarithm of the public consumption expenditure as a percent of GDP. The theoretical impact of public consumption expenditure on real exchange rate is ambiguous. It would be necessary to determine if the public spending is oriented more toward tradable or nontradable goods. Empirical studies tend to confirm that government expenditure is biased toward nontradable goods, and so a public spending increase leads to a real exchange rate appreciation. But in non-industrialized countries, increases in public wages may come from public spending, and GCON can indirectly depreciate the real exchange rate if the rise in private spending owing to the higher wages falls stronger on tradable goods. Also, an increase in government spending would deteriorate the fiscal balance and is therefore liable to put downward pressure on the exchange rate. Trade Openness OPEN describes the degree of openness. Usually, the main proxy for OPEN is the ratio of the sum of exports and imports to GDP. OPEN's impact on the real exchange rate is mixed in the literature. Egert (2003) drew up an overview of the real exchange rate determinants from empirical studies and their coefficient's expected sign. If we consider openness as an indicator of trade liberalization, an improvement in openness should lead to a depreciation of the real exchange rate. However, supply capacity can be improved by openness and this leads to an improvement in the trade balance and an appreciation of the exchange rate. The case of oil exporting countries is somewhat specific. A sharp increase in oil prices can be misinterpreted as an improvement of openness (Kamar and Bakardzhieva, 2005). Even if exports, imports, and GDP are expressed in volume, oil exports can result from exogenous factors (world oil demand) that are not linked to openness. Consequently, to avoid misinterpretation, we use the imports to GDP ratio (IMP) as a second proxy for openness (Kamar and Ben Naceur, 2007). Productivity Balassa (1964) and Samuleson (1964) noted that differences in technological progress could affect REERs. Since technological progress is more likely to take place in the traded relative to the nontraded sector of an economy, the increase in productivity in the traded sector raises wages in that sector, requiring that relative prices of nontraded goods increase. Real GDP per capita (PROD) is used to proxy for the Balassa-Samuelson effect. It is anticipated that countries with higher per capita incomes will experience a real appreciation in their currencies.

13
Terms of Trade Shocks to the external terms of trade (TOT) may also elicit REER movements. An increase in the relative price of exports relative to imports induces contraction of the non-traded goods sector and encourages labor flows to the export sector and REER appreciation.
IV. EMPIRICAL METHODOLOGY
Logarithms are taken of all variables—except capital and foreign exchange flows indicators since these variables display negative values— and the estimated equation is therefore specified as follows:
0 1 2 3
4 5
( ) * ( ) * ( ) * ( )
* ( ) * ( )
it it it it
it it it
Ln REER Capital Flows Ln GCON Ln OPEN
Ln PROD Ln TOT
(2)
In equation (2) i=1,2,…,57 refers to each of the 57 developing economies in our sample (Appendix 1) and t denotes the time period, which ranges from 1980 to 2007. The different types of capital and foreign exchange flows are incorporated alternatively according to the regression specification. The first studies on the nexus of REER and capital flows suffer from two sources of inconsistency: omitted variable and endogeneity biases. With this in mind, we use the Generalized Method of Moments (GMM) estimator, which corrects for both of these biases and takes into account the dynamics of real exchange rates. Moreover, the GMM estimator as suggested by Blundell and Bond (1998) deals well with the dynamics of REER and addresses the presence of unit roots in data (Ouattara and Strobl, 2008). More specifically, GMM models allow past levels of REER to affect current levels of REER. Since the lagged dependent variable is most likely to be correlated with the country-specific effects, estimation using OLS gives inconsistent and biased estimates (Hsiao, 1986). The GMM estimator yields consistent estimates. The regression is estimated in first-differences to eliminate the country-specific effects12. The estimator also instruments all the right-hand side variables using their lagged values (eliminating the inconsistency arising from potential endogeneity of the regressors).
12 Differencing the time series to introduce stationarity makes it impossible to pin down the long-run relationship among levels. Nevertheless, the Blundell and Bond (1998) procedure produces consistent estimates, and is appropriate for our dynamic analysis, which focuses on the short run.

14
Since the number of periods (T=27) is smaller than the number of countries (N=57), it is appropriate to use the system GMM estimator of Arellano and Bover (1995) and Blundell and Bond (1998). The basic idea behind this estimator is: 1) the unobserved fixed effects μi are removed by taking first differences; 2) the right hand side variables are instrumented using lagged values of the regressors, and the equations in first differences and in levels are jointly estimated; 3) the validity of the instruments is tested using a Hansen test of over-identifying restrictions and a test of the absence of serial correlation of the residuals. Although the two-step estimator is asymptotically more efficient in the presence of heteroskedasticity of the error term, Arellano and Bond (1991) and Blundell and Bond (1998) show that the two-step estimates are biased in small samples, like in our case. Thus, we prefer to display the one-step results.
V. INTERPRETATION OF THE RESULTS
As described earlier, the first estimated regression includes a variable capturing the aggregated capital flows proxied by NKF, along with the following control variables: terms of trade, openness, government consumption, and productivity (column 1 in Table 1). The results show that NKF has a positive impact on REER, which means that an increase in NKF will lead to the appreciation of REER and to a possible loss of competitiveness. The increase of terms of trade and productivity also leads to the appreciation of the REER, while the increase of openness and government consumption tends to depreciate REER.
The second regression specification replaces NKF with the different types of flows, namely FDI, portfolio investments, debt, income, aid, and remittances. The results reported in column 2 of Table 1, emphasize that all capital flows except FDI have a significant positive impact on the REER. The coefficients13 of debt, portfolio investments, income, aid, and remittances are consistent with the coefficient of NKF reported in column 1. The fact that FDI has no significant impact on the REER confirms our intuition that while this type of flow might lead to REER appreciation in the short run when the economy receives the flows, its impact is diluted over time as part of the flows start to leave the country in the form of imports of machinery and other capital goods. Also, the increase in production induced by FDI can lead to downward pressure on prices and to REER depreciation. These results are in line with the findings of Athukorala and Rajapatirana (2003).
13 The focus of the analysis is on comparing the estimates of the coefficients and not on the extent to which each variable affects the REER.

15
Table 2 reports the results of the regression estimations that examine the impact across the six regions of: (i) the aggregated NKF (column 1); and (ii) each type of capital flows (columns 2 to 7) on REER. To assess these relations, we create interaction variables between each capital and foreign exchange flow and each of the six regions. The aim is to identify for each region how each of the flows affected the behavior of the REER. In each regression specification (2 to 7), we include the interaction variable between each region and the flow we study, the control variables, and the other flows aggregated. For example, for portfolio flows (PORT) in column 4 of Table 2, we included an interaction dummy between each region and portfolio investments, taking the value of 1 for each group of countries and 0 for all other countries. Thus, we include the previous control variables, and NKF minus PORT to control for the impact of the other capital flows (aggregated) on the REER. The results in column 1 of Table 2 confirm that NKF has a positive and significant impact on REER in all regions14 except the CEEC. These results suggest NKF did not harm competitiveness in the CEEC. The case of the CEEC is particularly interesting as not only does NKF have no significant impact on REER, but it also has a negative sign. The explanation could be that these countries have been receiving massive FDI flows compared with other capital flows (Table 3), which, as shown earlier, have no effect on the REER appreciation in the long run. This is another confirmation that FDI does not seem to harm competitiveness. It also reveals that if FDI is large enough in comparison with other capital and foreign exchange flows, it could counter their negative effect on competitiveness. When analyzing the impact of the different types of capital flows on REER in each region using the interaction variables, the results reveal a relatively similar impact across regions leading to REER appreciation (with a varying magnitude). FDI is the only exception as it seems to have a nonsignificant (yet negative) effect on REER in almost all regions. The impact of FDI on REER (Table 3, column 2) is negative and nonsignificant in Latin America, South and East Asia, CEEC, and MENA, and nonsignificant with a positive sign in GCC. These results confirm that FDI does not lead to an appreciation of the REER; it could even be leading to its depreciation and to a potential improvement of competitiveness as suggested by Athukorala and Rajapatirana (2003). Only Africa is showing a significant positive impact of FDI on the REER,15 suggesting a loss of competitiveness, which corroborates the findings of Lartey (2007).
14 For MENA, the impact is significant only at 10 percent confidence interval. 15 According to Saborowski (2009) this result could possibly be due to the lack of financial sector development.

16
Table 1: GMM-in System Estimates of the Impact of Capital Flows on
Real Effective Exchange Rate
(1) (2)
Constant LagREER LNGDP LTOT LGCON LOPEN NKF FDI DEBT PORT INCOME AID REMIT Sargan test Serial correlation test No. of countries No. of observations
0.603 (0.437)
0.785*** (0.049)
0.134*** (0.031) 0.158** (0.074)
-0.104** (0.049) -0.051* (0.031)
0.006*** (0.001)
0.139 0.654
57 1347
0.311 (0.610)
0.751*** (0.057)
0.094*** (0.030) 0.224** (0.111) -0.064 (0.047) -0.024 (0.027)
0.002 (0.002) 0.003** (0.001)
0.006*** (0.002) 0.009** (0.004)
0.006*** (0.002) 0.008* (0.004) 0.242 0.888
57 1313
This table presents the results of GMM-in system estimation for our sample of 57 countries over the 1980-2007 period. The dependent variable is the Log Real Effective Exchange Rate. Two specifications are estimated: one assessing the global impact (column 1) and the other assessing the impact of each type of capital flow (column 2). The nature of the GMM estimation method leads to the introduction of lagged dependent variables. For the Sargan test, the null hypothesis is that the instruments are not correlated with the residuals. For the test of serial correlation, the null hypothesis is that the errors in the first difference regression exhibit no second-order serial correlation. Standard errors of estimates are reported in parentheses. Serial correlation and Sargan tests show p-values. ***, ** and * refers to levels of significance of 1 percent, 5 percent and 10 percent, respectively.
17
Debt has a significant positive impact with similar coefficients in all regions except for the CEEC where the coefficient is again negative and nonsignificant. The results for the CEEC are consistent with those for the overall impact of NKF on REER and with those for the impact of FDI. An explanation could be that DEBT is oriented toward financing productive investments that have a similar impact as that of FDI, requiring importing machinery and intermediate goods, leading to an outflow of the capital received. It is worth noting that CEEC DEBT flows have been steadily increasing and are the closest to FDI in size. The results of the regression including portfolio investments (column 4 of Table 2) show a positive and significant impact of portfolio investments on the REER in South and East Asia, Latin America, GCC, and the CEEC.16 Portfolio investments have no significant impact in Africa, perhaps because of the relatively low portfolio investments in this region. In South and East Asia and Latin America, capital markets are more developed compared to the other regions, and they attract international investors willing to diversify their portfolios. The result is mainly a capital inflow that might not necessarily be translated into an increase of production or of imports of machinery and intermediate goods. In addition, these two regions witnessed capital outflows, accompanied or followed by massive nominal exchange rate depreciation, leading to REER depreciation. Therefore, portfolio flows would most probably have a positive relation with the REER. Surprisingly, the impact of portfolio investments is significant but negative in the MENA countries. This might be because MENA capital markets are still young and that most of the portfolio investments to the region are driven by the privatization of public enterprises. Portfolio investment flows are used to modernize the privatized firms through buying new imported machinery, increasing production, and importing intermediate goods. This behavior is close to that of FDI, leading to the depreciation of the REER. The results for income show no impact on the REER in all regions except Latin America and MENA. Income flows consist mainly of the net revenue on investments abroad (both direct and portfolio) and interest paid on public debt. In the cases of Africa, CEEC, and South and East Asia, the income outflows were relatively low, which explains their non-significance. In Latin America and MENA, it is the decline in interest payments and consequently in capital outflows that contributed to the appreciation of the REER, consistent with the overall impact of NKF.
16 At the 10 percent significance level for the CEECs.

18
Table 2: GMM System Estimates of the Impact of Capital Flows on
Real Effective Exchange Rate by Region
(NKF) (FDI) (DEBT) (PORT) (INCOME) (AID) (REMIT) Constant LagLREER LNGDP LTOT LGCON LOPEN NKF or Flow-MENA NKF or Flow -GCC NKF or Flow -L.A. NKF or Flow -ASIA NKF or Flow -CEEC NKF or Flow -AFRICA Other-K. flows Sargan test Serial correl. test No. of countries No. of observations
0.193 (0.522)
0.773*** (0.051)
0.127*** (0.034) 0.239** (0.090) -0.078* (0.051) -0.042 (0.032)
0.004* (0.002)
0.006*** (0.002)
0.012** (0.005)
0.007*** (0.002)
-0.001 (0.002)
0.009*** (0.003)
0.177 0.836
57
1347
0.330 (0.512)
0.779*** (0.049)
0.137*** (0.036) 0.219** (0.088) -0.105* (0.057) -0.043 (0.032)
-0.002 (0.004)
0.003
(0.003)
-0.010 (0.012)
-0.004 (0.007)
-0.003 (0.004
0.014** (0.006)
0.007*** (0.002)
0.108 0.703
57
1347
0.351 (0.442)
0.771*** (0.051)
0.135*** (0.035)
0.217*** (0.074) -0.089* (0.051) -0.048 (0.033)
0.007** (0.004)
0.006*** (0.002)
0.008* (0.005)
0.009*** (0.003)
-0.003 (0.002)
0.007*** (0.002)
0.007*** (0.002)
0.161 0.836
57
1347
0.235 (0.460)
0.788*** (0.051)
0.124*** (0.032)
0.220*** (0.079) -0.089* (0.049) -0.041 (0.029)
-0.007** (0.004)
0.009*** (0.002)
0.013*** (0.005)
0.015*** (0.005)
0.006* (0.003)
0.009
(0.006)
0.006*** (0.002)
0.205 0.792
57
1347
0.075 (0.445)
0.784*** (0.054)
0.111*** (0.034)
0.261*** (0.082) -0.066 (0.042)
-0.056** (0.027)
0.010*** (0.003)
0.001
(0.001)
0.022** (0.010)
0.002
(0.007)
0.009 (0.008)
-0.045 (0.005)
0.006*** (0.002)
0.259 0.817
57
1347
0.054 (0.415)
0.792*** (0.053)
0.115*** (0.036)
0.248*** (0.073) -0.072 (0.047) -0.045 (0.028)
0.009
(0.011)
0.007*** (0.002)
0.017
(0.012)
0.106* (0.056)
0.047** (0.019)
0.014* (0.007)
0.005*** (0.001)
0.298 0.815
57
1308
0.155 (0.541)
0.780*** (0.054)
0.118*** (0.031) 0.210** (0.103) -0.023 (0.041) -0.036
(-0.003)
0.003 (0.003)
0.021*** (0.008)
-0.010 (0.016)
0.017** (0.007)
-0.04*** (0.013)
0.018** (0.008)
0.005*** (0.001)
0.199 0.844
57
1308
This table presents the results of GMM system estimation for a sample of 57 countries over the 1980-2007 period. The dependent variable is the Log Real Effective Exchange Rate. Seven specifications are estimated: one assessing the aggregated impact of NKF on REER in each region (column 2) and the others assessing the impact of each type of capital flow in interaction with each region. The nature of the GMM estimation method leads to the introduction of lagged dependent variables. For the Sargan test, the null hypothesis is that the instruments are not correlated with the residuals. For the test of serial correlation, the null hypothesis is that the errors in the first difference regression exhibit no second-order serial correlation. Standard errors of estimates are reported in parentheses. ***, ** and * refers to levels of significance of 1 percent, 5 percent, and 10 percent, respectively.

19
The impact of aid is positive and significant in CEEC, the GCC, South and East Asia, and Africa. Its impact is not significant in MENA and Latin America, which can be explained if aid is spent on imports (Gupta et al., 2005) or if its absorption is very low and it is accumulated in reserves. In this case, there is no need for a real exchange rate appreciation to mediate a fall in net exports and thereby absorb the aid (IMF, 2005). Africa has been receiving massive aid flows and the literature has demonstrated that aid contributed to the appreciation of the REER in this region. The case of the GCC is less obvious as this region has seen mainly aid outflows to other countries. This might have played a role in depreciating the REER, consistent with the positive sign for the relation we have in our model. Finally, remittances reveal disparate results. It is generally expected that an increase in remittance receipts would result in an appreciation of the economy’s equilibrium real exchange rate, as analyzed in detail in Chami et al (2008). This expected positive and significant impact is obtained in the cases of GCC, South and East Asia, and Africa, and a positive and nonsignificant impact in MENA. Yet the results point to a negative and nonsignificant impact in Latin America, and negative and significant impact in CEEC. These diverging results reflect that remittances could have different impacts depending on their nature and magnitude. As suggested by Rajan and Subramanian (2005) a nonsignificant impact could result from remittances being directed mainly toward unskilled-labor activities and tradable sectors. A deeper analysis of the particular impact of remittances across regions could elucidate how the nature and size of the remittances could affect competitiveness differently. While most of our results confirm the findings of previous research, the disparity of the results of the impacts of different capital and foreign exchange flows on REER behavior across regions calls for further investigations. Several factors could explain this disparity; the shocks and crises that each region faced, the policies implemented by the different governments, the level of development of the economy and its institutions, and the degree of financial market sophistication among others. We intend to address these issues in a future research.

20
VI. CONCLUSION AND POLICY IMPLICATION
The paper’s examination of the impact of different types of capital and foreign exchange flows on REER across regions reveals original contributions to the literature that allow us to draw insightful policy implications. To our knowledge, this is the first attempt to compare the impact of the different types of capital and foreign exchange flows on competitiveness across 57 developing countries. The paper finds that aggregated capital flows (NKF) have a positive impact on REER in all regions under investigation, except the CEEC. These findings confirm the contention of existing literature that capital flows could result in appreciation of the REER that tend to undermine competitiveness. The explanation could be that the CEEC countries have been receiving massive FDI flows compared with other capital flows. In the long run, FDI flows are used to import machinery and raw materials from abroad, partially offsetting the impact on REER. Also, the increase in production induced by the FDI could lead to downward pressure on prices and REER depreciation. When disaggregating the capital and foreign exchange flows into foreign direct investments, portfolio investments, debt, income, aid, and remittances, the paper finds that, for the entire sample, income has the strongest impact on REER appreciation, followed by remittances, aid, portfolio investments, and debt. Here again, the results are in line with the literature on the determinants of competitiveness. Interestingly, FDI is the only variable that has no significant impact on REER appreciation. The cross-regional comparison of the impact of each of these six flows on REER reveals disparate results. Portfolio investments, debt, aid, and income show close results, pointing towards an appreciation of the REER, except for the case of MENA where portfolio investments have a negative sign. The fact that MENA capital markets are young and that portfolio investments were encouraged by the privatization of public enterprises could reveal a behavior similar to that of FDI. Remittances reveal disparate results, probably owing to the diversity of their nature and size across regions. The results for FDI are highly interesting as they clearly point toward no positive impact on REER appreciation in any region, except in Africa. These results could be very useful for policy makers in their aim to reconcile the dilemma of attracting capital and foreign exchange flows to finance current account deficits and enhance investments, while maintaining competitiveness to enhance exports and economic growth.

21
Figure 1. REER for all Six Regions Including GCC
Figure 2. Aggregated Capital Flows
Figure 3. Income
0
50
100
150
200
250
1980
1982
1984
1986
1988
1990
1992
1994
1996
1998
2000
2002
2004
2006
REER
Latin America CEEC Africa MENA GCC Asia
-30
-20
-10
0
10
20
30
1980
1982
1984
1986
1988
1990
1992
1994
1996
1998
2000
2002
2004
2006
Aggregated Net Capital Flows
NKF MENA NKF GCC NKF LA NKF ASIA NKF CEEC NKF AFRICA
-10
-5
0
5
10
15
20
1980
1982
1984
1986
1988
1990
1992
1994
1996
1998
2000
2002
2004
2006
INCOME
INCOME MENA INCOME GCC INCOME LA
INCOME ASIA INCOME CEEC INCOME AFRICA
22
Figure 4. Aid
Figure 5. Aid in All Regions Excluding GCC
Figure 6. Remittances
-50
-40
-30
-20
-10
0
10
1980
1982
1984
1986
1988
1990
1992
1994
1996
1998
2000
2002
2004
2006
AID (PUBLIC TRANSFERS)
AID MENA AID GCC AID LA AID ASIA AID CEEC AID AFRICA
-1
0
1
2
3
4
5
6
7
1980
1982
1984
1986
1988
1990
1992
1994
1996
1998
2000
2002
2004
2006
AID (PUBLIC TRANSFERS)
AID MENA AID LA AID ASIA AID CEEC AID AFRICA
-12-10
-8-6-4-202468
1980
1982
1984
1986
1988
1990
1992
1994
1996
1998
2000
2002
2004
2006
REMITTANCES (PRIVATE TRANSFERS)
MENA GCC LA ASIA CEEC AFRICA

23
Figure 7. FDI
Figure 8. Portfolio Investments
Figure 9. Portfolio Investments Excluding GCC
-2
0
2
4
6
8
10
1980
1982
1984
1986
1988
1990
1992
1994
1996
1998
2000
2002
2004
2006
FDI
FDI MENA FDI GCC FDI LA FDI ASIA FDI CEEC FDI AFRICA
-20
-15
-10
-5
0
5
1980
1982
1984
1986
1988
1990
1992
1994
1996
1998
2000
2002
2004
2006
PORTFOLIO INVESTMENTS
FPI MENA FPI GCC FPI LA FPI ASIA FPI CEEC FPI AFRICA
-3-2.5
-2-1.5
-1-0.5
00.5
11.5
2
1980
1982
1984
1986
1988
1990
1992
1994
1996
1998
2000
2002
2004
2006
PORTFOLIO INVESTMENTS
FPI MENA FPI LA FPI ASIA FPI CEEC FPI AFRICA

24
Figure 10. Debt
Figure 11. Debt Excluding GCC
Table 3. Capital and Foreign Exchange Flows to the CEECs in percent of GDP
CEEC FDI DEBT FPI INCOME AID REMITTANCES
Av. 1980-2007 2.4 2.1 0.2 -1.6 0.2 0.9
Av. 1990-2007 3.8 2.8 0.3 -1.8 0.4 1.3
Av. 2000-2007 5.3 4.6 0.0 -2.7 0.2 1.7
-40
-20
0
20
40
60
80
1980
1982
1984
1986
1988
1990
1992
1994
1996
1998
2000
2002
2004
2006
DEBT (OTHER INVESTMENTS)
DEBT MENA DEBT GCC DEBT LA
DEBT ASIA DEBT CEEC DEBT AFRICA
-15
-10
-5
0
5
10
15
1980
1982
1984
1986
1988
1990
1992
1994
1996
1998
2000
2002
2004
2006
DEBT (OTHER INVESTMENTS)
DEBT MENA DEBT LA DEBT ASIA DEBT CEEC DEBT AFRICA

25
Appendix 1: List of Countries Included in our Sample
Africa CEEC South and East Asia
Latin America
MENA GCC
Cameroun Côte d'Ivoire Ghana Kenya Mali Mozambique Nigeria Senegal South Africa Tanzania Zambia
Bulgaria Croatia Czech Rep. Estonia Hungary Latvia Lithuania Poland Romania Slovak Rep. Slovenia
China India Indonesia Korea Malaysia Pakistan Philippines Singapore Thailand
Argentina Bolivia Brazil Chile Colombia Ecuador Mexico Peru Uruguay Venezuela
Egypt Iran Jordan Lebanon Morocco Sudan Syria Tunisia Turkey
Bahrain Kuwait Oman Qatar Saudi Arabia UAE
Appendix 2: List of Variables Included in the Regressions
Variable Definition Source REER Real Effective Exchange Rate Index IMF Staff database
GCON Government Consumption = Public Consumption Expenditure / GDP (current, local currency)
Authors’ Calculation based on WEO data
PROD Productivity = Real GDP per Capita WEO
LIQ Liquidity = Broad Money / GDP (current, local currency)
Authors’ Calculation based on WEO data
TOT Terms of Trade (Price of Exports to the Price of Imports), Index 2000=1
WEO
OPEN Degree of Openness = (Imports + Exports) / GDP (Constant, Local Currency)
Authors’ Calculation based on WEO data
IMP Degree of Openness = Imports / GDP (Constant, Local Currency)
Authors’ Calculation based on WEO data
NKF
Net Capital Flows = Balance of goods and services [- (Exports . Imports) / GDP] - Change in Gross international reserves (including gold, in current US Dollars] / GDP (Current, Billion USD)
Authors’ Calculation based on WEO data
FDI FDI = Foreign Direct investments / GDP (Current, USD)
Authors’ Calculation based on IFS data
PORT Portfolio = Portfolio investments / GDP (Current, USD) Authors’ Calculation
based on IFS data
DEBT Debt (Other Investments in the Financial Account)= Other investments / GDP (Current, USD)
Authors’ Calculation based on IFS data
INCOME Income (Current Account) = Income / GDP (Current, USD)
Authors’ Calculation based on IFS data
AID Aid = Official unrequited transfers (Current Account) / GDP (Current, USD)
Authors’ Calculation based on IFS data
REMIT Remittances = Other unrequited transfers (Current Account) / GDP (Current, USD)
Authors’ Calculation based on WEO data

26
REFERENCES
Adam, C., and D. Bevan, 2004, "Aid, Public Expenditure and Dutch Disease," Development
and Comp Systems 0409027, EconWPA. Adenauer, I., and L. Vagassky, 1998, "Aid and the Real Exchange Rate: Dutch Disease
Effects in African Countries,” Review of International Trade and Development, Vol.33, pp. 177-85.
Amuedo-Dorantes, C., and S. Pozo, 2004, "Workers' Remittances and the REER: A Paradox
of Gifts," World Development, Vol. 32(8), August, pp. 1407-17. Arellano, C., A. Bulír, T. Lane, and L. Lipschitz, 2009, "The Dynamic Implications of
Foreign Aid and its Variability", Journal of Development Economics, Elsevier, Vol. 88(1), January, pp. 87-102.
Arellano, M., and O. Bover. 1995, "Another Look at the Instrumental Variables Estimation
of Error Component Models," Journal of Econometrics, Vol. 68, pp. 29-52. Aron, J., I. Elbadawi, and B. Kahn, 1998, "Determinants of the REER in South Africa,"
Working Papers Series 98-16, Centre for the Study of African Economies, University of Oxford.
Athukorala, P.C., and S. Rajapatirana, 2003, "Capital Flows and the REER: A Comparative
Study of Asia and Latin America," The World Economy, Vol. 26(4), pp. 613-37. Atingi-Ego, M., 2005, "Choice of Appropriate Monetary Policy Instrument Mix by Bank of
Uganda” (unpublished; Kampala: Bank of Uganda). Baffes, J., I. Elbadawi, and S. A. O’Connell, 1999, "Single-Equation Estimation of the
Equilibrium Real Exchange Rate,” Exchange Rates Misalignment: Concepts and Measurement for Developing Countries, ed. by L. Hinkle and P. Montiel, World Bank Policy Research Paper (Washington, D.C.: World Bank).
Balassa, B., 1964,"The Purchasing Power Parity Doctrine: A Reappraisal," Journal of
Political Economy, Vol. 72, December, pp. 584-96. Bennett, H., and Z. Zarnic, 2008, “International Competitiveness of the Mediterranean
Quartet: A Heterogeneous-Product Approach”, IMF Working Paper 08/240, (Washington, DC: International Monetary Fund).

27
Blundell, R., and S. Bond, 1998, "Initial Conditions and Moment Restrictions in Dynamic Panel Data Models," Journal of Econometrics, Vol. 87(1), pp. 115-43.
Bourdet, Y., and H. Falck, 2006, "Emigrants' Remittances and Dutch Disease in Cape
Verde," International Economic Journal, Korean International Economic Association, Vol. 20(3), September, pp. 267-84.
Calvo, G.A., and A. Drazen, 1997, "Uncertain Duration of Reform: Dynamic Implications,"
NBER Working Paper 5925 (Cambridge, Massachusetts: National Bureau of Economic Research).
Chami, R., A. Barajas, T. Cosimano , C. Fullenkamp, M. Gapen, and P. Montiel, 2008,
“Macroeconomic Consequences of Remittances,” IMF Occasional Paper 259 (Washington, DC: International Monetary Fund).
Christiansen, L., A. Prati, L. Ricci, and T. Tressel, 2009, “External Balance in Low Income Countries,” IMF Working Paper 09/221 (Washington, DC: International Monetary Fund).
Corbo, V., and S. Fisher (1995), ‘Structural Adjustment, Stabilisation and Policy Reforms:
Domestic and International Finance’ in Handbook of Development Economics, ed. by J. Behrman and T. N. Srinivasan, Vol. III, pp. 2846-924.
Corden, W. M., 1960, "The Geometric Representation of Policies to Attain Internal and
External Balance,” Review of Economic Studies, Vol. 18(1), pp. 1-22. _______, 1994, Economic Policy, Exchange Rates and the International System (Oxford: Oxford University Press). _______, and J. P. Neary, 1982, "Booming Sector and De-industrialization in a Small Open
Economy,” Economic Journal, Vol. 92, pp. 1–24. Dornbusch, R., 1974, "Tariffs and Nontraded Goods," Journal of International Economics,
Vol. 4(2), May, pp. 177-85. Edwards, S., 1989, "Real Exchange Rates in the Developing Countries: Concepts and
Measurement," NBER Working Paper No. 2950, (Cambridge, Massachusetts: National Bureau of Economic Research).
_______, 1992, "Exchange Rates as Nominal Anchors," NBER Working Paper No. W4246
(Cambridge, Massachusetts: National Bureau of Economic Research). Elbadawi, I., 1999, “External Aid: Help or Hindrance to Export Orientation in Africa,”
Journal of African Economies, Vol. 8(4), pp. 578-616.

28
_______, and R. Soto, 1994, “Capital Flows and Long Term Equilibrium Real Exchange
Rates in Chile,” WB Policy Research Working Paper WPS1306 (Washington, DC: World Bank).
_______, and R. Soto, 1997, "REERs and Macroeconomic Adjustment in Sub-Saharan
Africa and Other Developing Countries," Journal of African Economies, Vol. 6(3), pp. 74-120.
Elbadawi, I., L. Kaltani, and K. Schmidt-Hebbel, 2008, "Foreign Aid, the REER, and
Economic Growth in the Aftermath of Civil Wars," World Bank Economic Review 22, pp. 113-40.
Eyraud, L., 2008, “Madagascar: A Competitiveness and Exchange Rate Assessment,” IMF
Working Paper 09/107, (Washington, DC: International Monetary Fund). Falck, H., 1997, "Aid and Economic Performance-The Case of Tanzania," Department of
Economics, University of Lund. Fielding, D., 2007. "Aid and Dutch Disease in the South Pacific," UNU-WIDER Research
Paper, World Institute for Development Economic Research. Gupta, S, R. Powell, and Y. Yang, 2005, “The macroeconomic Challenges of Scaling up Aid
to Africa,” IMF Working Paper 05/79 (Washington, D.C.: International Monetary Fund).
Hsiao, C, 1986, Analysis of Panel Data (Cambridge: Cambridge University Press). International Monetary Fund, 2005, "The Macroeconomics of Managing Increased Aid
Inflows: Experiences of Low-Income Countries and Policy Implications" (Washington, D.C.: International Monetary Fund).
Kamar, B., and D. Bakardzhieva, 2005, “Economic Trilemma and Exchange Rate
Management in Egypt,” Review of Middle East Economics and Finance, Vol. 3 (2), pp. 91–114.
Kamar, B., and S. Ben Naceur, 2007, “GCC Monetary Union and the Degree of
Macroeconomic Coordination,” IMF Working Paper 07/249 (Washington, D.C.: International Monetary Fund).

29
Kang, J. S., A. Prati, and A. Rebucci, 2007, "Aid, Exports, and Growth: A Time Series Perspective on the Dutch Disease Hypothesis” (Washington, D.C.: International Monetary Fund).
Lartey, E. K., 2007, "Capital Inflows and the Real Exchange Rate: An Empirical Study of
Sub-Saharan Africa," The Journal of International Trade & Economic Development, Vol. 16(3), pp. 337–57.
_______, F. S. Mandelman, and P. A. Acosta, 2008, "Remittances, Exchange Rate Regimes,
and the Dutch Disease: A Panel Data Analysis," Federal Reserve Bank of Atlanta Working Paper 2008-12.
Lipschitz, L., and D. McDonald, 1991, "Real Exchange Rates and Competitiveness: A
Clarification of Concepts, and Some Measurements for Europe, " IMF Working Paper 91/25 (Washington, D.C.: International Monetary Fund).
López, H., L. Molina, and M. Bussolo, 2007, “Remittances and the REER,” World Bank
Policy Research Working Paper 4213. Monfort, B., 2008, “Chile: Trade Performance, Trade Liberalization, and Competitiveness,”
IMF Working Paper 08/128, (Washington, DC: International Monetary Fund). Nickell, S.J., 1981, "Biases in Dynamic Models with Fixed Effects," Econometrica, Vol. 49,
pp. 1417-26. Nkusu, M., 2004, "Aid and the Dutch Disease in Low-Income Countries: Informed
Diagnoses for Prudent Prognoses," IMF Working Paper 04/49 (Washington, D.C.: International Monetary Fund).
Nwachukwu, J., 2008, "Foreign Capital Inflows, Economic Policies and the Real Exchange
Rate in Sub-Saharan Africa: Is There an Interaction Effect?" Brooks World Poverty Institute Working Paper No. 25.
Nyomi, T.S., 1998, "Foreign Aid and Economic Performance in Tanzania," World
Development, Vol. 26, pp. 1235-40. Opoku-Afari, M, O. Morrissey, and T. Lloyd, 2004, “Real Exchange Response to Capital
Inflows: A Dynamic Analysis for Ghana,” CREDIT Research Paper 04/12. Ouattara, B., and E. Strobl, "Aid, Policy and Growth: Does Aid Modality Matter?" Review of
World Economics, Vol. 144, No. 2 (1 July 2008), pp. 347-65.

30
Prati, A., and T. Tressel, 2006, "Aid Volatility and Dutch Disease: Is There a Role for Macroeconomic Policies?" IMF Working Paper 06/145 (Washington, D.C.: International Monetary Fund).
Rajan, R., and A. Subramanian, 2005, "What Undermines Aid’s Impact on Growth?” IMF
Working Paper 05/126 (Washington, D.C.: International Monetary Fund). Saborowski, C., 2009, "Capital Inflows and the Real Exchange Rate: Can Financial
Development Cure the Dutch Disease?" IMF Working Paper 09/20 (Washington, D.C.: International Monetary Fund).
Salter, W.E, 1959, "Internal and External Balance: The Role of Price and Expenditure
Effects," Economic Record 35, Vol. 71, pp. 226–38. Samuelson, P., 1964, "Theoretical Notes on Trade Problems," Review of Economics and
Statistics, Vol. 23. Swan, T. W, 1960, "Economic Control in a Dependent Economy," Economic Record 36, Vol.
73, pp. 51–66. White, H., and G. Wignaraja, 1992, "Exchange Rates, Trade Liberalisation and Aid: The Sri
Lankan Experience," World Development 20(10), pp. 1471-80.