The impact of atmospheric transport on the tropical tropospheric ... · The impact of atmospheric...
127
The impact of atmospheric transport on the tropical tropospheric composition Zachariasse, M. DOI: 10.6100/IR556140 Published: 01/01/2002 Document Version Publisher’s PDF, also known as Version of Record (includes final page, issue and volume numbers) Please check the document version of this publication: • A submitted manuscript is the author's version of the article upon submission and before peer-review. There can be important differences between the submitted version and the official published version of record. People interested in the research are advised to contact the author for the final version of the publication, or visit the DOI to the publisher's website. • The final author version and the galley proof are versions of the publication after peer review. • The final published version features the final layout of the paper including the volume, issue and page numbers. Link to publication Citation for published version (APA): Zachariasse, M. (2002). The impact of atmospheric transport on the tropical tropospheric composition Eindhoven: Technische Universiteit Eindhoven DOI: 10.6100/IR556140 General rights Copyright and moral rights for the publications made accessible in the public portal are retained by the authors and/or other copyright owners and it is a condition of accessing publications that users recognise and abide by the legal requirements associated with these rights. • Users may download and print one copy of any publication from the public portal for the purpose of private study or research. • You may not further distribute the material or use it for any profit-making activity or commercial gain • You may freely distribute the URL identifying the publication in the public portal ? Take down policy If you believe that this document breaches copyright please contact us providing details, and we will remove access to the work immediately and investigate your claim. Download date: 09. Jun. 2018
Transcript of The impact of atmospheric transport on the tropical tropospheric ... · The impact of atmospheric...

The impact of atmospheric transport on the tropicaltropospheric compositionZachariasse, M.
DOI:10.6100/IR556140
Published: 01/01/2002
Document VersionPublisher’s PDF, also known as Version of Record (includes final page, issue and volume numbers)
Please check the document version of this publication:
• A submitted manuscript is the author's version of the article upon submission and before peer-review. There can be important differencesbetween the submitted version and the official published version of record. People interested in the research are advised to contact theauthor for the final version of the publication, or visit the DOI to the publisher's website.• The final author version and the galley proof are versions of the publication after peer review.• The final published version features the final layout of the paper including the volume, issue and page numbers.
Link to publication
Citation for published version (APA):Zachariasse, M. (2002). The impact of atmospheric transport on the tropical tropospheric compositionEindhoven: Technische Universiteit Eindhoven DOI: 10.6100/IR556140
General rightsCopyright and moral rights for the publications made accessible in the public portal are retained by the authors and/or other copyright ownersand it is a condition of accessing publications that users recognise and abide by the legal requirements associated with these rights.
• Users may download and print one copy of any publication from the public portal for the purpose of private study or research. • You may not further distribute the material or use it for any profit-making activity or commercial gain • You may freely distribute the URL identifying the publication in the public portal ?
Take down policyIf you believe that this document breaches copyright please contact us providing details, and we will remove access to the work immediatelyand investigate your claim.
Download date: 09. Jun. 2018

The Impact of Atmospheric Transport on the Tropical Tropospheric
Composition
PROEFSCHRIFT
ter verkrijging van de graad van doctor aan de
Technische Universiteit Eindhoven, op gezag van de
Rector Magnificus, prof.dr. R.A. van Santen, voor een
commissie aangewezen door het College voor Promoties
in het openbaar te verdedigen op
donderdag 20 juni 2002 om 13.00 uur
door
Mijke Zachariasse
geboren te Utrecht

Dit proefschrift is goedgekeurd door de promotoren: prof.dr. H. Kelder en prof.dr. J. Lelieveld Copromotor: dr. P.F.J. van Velthoven Druk: Universiteitsdrukkerij Eindhoven CIP-DATA LIBRARY TECHNISCHE UNIVERSITEIT EINDHOVEN Zachariasse, Mijke The impact of atmospheric transport on the tropical tropospheric composition / by Mijke Zachariasse . – Eindhoven : Technische Universiteit Eindhoven, 2002 Proefschrift. ISBN 90-386-1979-0 NUR 912 Trefwoorden: atmosferisch ozon / stratosfeer-troposfeer uitwisseling / atmosferische luchtstromingen / tracer-transport modellering Subject headings: tropospheric ozone / stratosphere-troposphere exchange / interhemispheric transport / Intertropical Convergence Zone / tracer-transport modeling

The mind of the beginner is empty, free of the
habits of the expert, ready to accept, to doubt,
and open to all possibilities
Shunryk Suzuki
Voor mijn ouders – met liefde

Cover : The Maldives in the Indian Ocean appear to be one of the most pristine regions of the Earth, hundreds of kilometers from the nearest source of pollution, India. The truth is, however, that these paradise islands are directly downwind of India and southeast Asia for a large part of the year. During the winter monsoon heavily polluted air is transported far over the Indian Ocean, creating a thick, brown smog layer. De Malediven in de Indische Oceaan lijken op het eerste gezicht onvervuilde en schone gebieden, honderden kilometers verwijderd van de dichtstbijzijnde bron van vervuiling, India. Niets is echter minder waar. Gedurende een groot gedeelte van het jaar bevinden deze paradijselijke eilanden zich in het uitstroomgebied van vervuiling van India en zuidoost Azië. Onder invloed van de winter moesson wordt een kilometers dikke bruine smoglaag duizenden kilometers ver over de oceaan getransporteerd. The work presented in this thesis was funded by the Netherlands Earth and Life Science Foundation (ALW- 750.296.03B) with financial aid from the Netherlands Organization for Scientific Research (NWO).

Contents
Contents
Voorwoord i Samenvatting iii 1 Introduction 1
1.1 The Indian Ocean Experiment 1
1.2 The tropical circulation 2
1.2.1 Monsoons 2
1.2.2 Tropical convergence zones 5
1.3 Stratosphere-troposphere exchange 7
1.4 Atmospheric general circulation models and trajectory models 11
1.4.1 General circulation models 11
1.4.2 Trajectory models 12
1.5 Outline of the thesis 13
2 Influence of stratosphere-troposphere exchange on tropospheric O3 over the tropical Indian Ocean during the winter monsoon 17
2.1 Introduction 18
2.2 Measurements 19
2.3 Trajectory model 20
2.4 Analyses and discussion of the O3 profiles 21
2.4.1 Description of the profiles 21
2.4.2 Dry, mid-tropospheric O3 maxima 24
2.4.3 Upper-tropospheric O3 laminae 27
2.5 Conclusions and discussion 29
3 Cross-tropopause and interhemispheric transports into the tropical free troposphere over the Indian Ocean 33
3.1 Introduction 34

Contents
3.2 Measurements 35
3.3 Trajectory model 35
3.4 Results 37
3.4.1 Upper-tropospheric O3 laminae 38
3.4.2 The upper troposphere in profiles with a double tropopause 41
3.4.3 Dry, mid-tropospheric O3 maxima 43
3.5 Conclusions and discussion 44
4 Tropospheric O3 distribution over the Indian Ocean during spring 1995 evaluated with a chemistry-climate model 49
4.1 Introduction 50
4.2 The ECHAM4 model 50
4.3 Newtonian relaxation 51
4.4 Measurements 53
4.5 Trajectory model 54
4.6 Results 54
4.6.1 Surface data 54
4.6.2 O3 profiles 56
4.7 Conclusions 61
5 Interhemispheric exchange and the Intertropical Convergence Zone in tracer experiments with the ECHAM4 model 65
5.1 Introduction 66
5.2 Model and experimental setup 67
5.3 Where does the interhemispheric exchange occur? 70
5.4 Flux calculations 75
5.4.1 Global interhemispheric mass fluxes 75
5.4.2 Regional variations in the interhemispheric mass flux 78
5.5 The timescales for interhemispheric exchange 79
5.6 Discussion 80
5.7 Conclusions 83

Contents
6 Summary and outlook 87 6.1 Summary 87
6.2 Outlook 91
Bibliography 95 Curriculum Vitae 107


Voorwoord
Voorwoord Iets beginnen is moeilijk maar iets afmaken en laten gaan nog veel meer. Jaren lang is het concept ‘proefschrift’ iets abstracts tot het laatste half jaar waarin ineens je hele leven er door overgenomen lijkt. Het voelt dan ook heel onwerkelijk dat ik straks een hele lading neutrale kartonnen doosjes mag ophalen, stuk voor stuk bomvol met blauwe boekjes met mijn naam er op. Tjonge. Het leek nog niet eens zo heel lang geleden dat Hennie mij tijdens een groepsuitje naar Haarlem vertelde dat nu toch echt alles rond was met NWO en dat ik oio kon worden. Ik geloof dat ik de rest van de dag met een enorme glimlach heb rondgelopen. En dat was het begin van een hele leuke tijd op het KNMI. Mijn promotor Hennie Kelder is dan ook de eerste die ik hier wil bedanken. Hennie- je hebt me altijd het gevoel gegeven dat je vertrouwen in mij had en dat is voor een oio erg belangrijk. Bedankt! Mijn andere promotor, Jos Lelieveld, bedank ik voor zijn ideeën gedurende mijn promotie. Jij keek weer net wat anders aan tegen mijn onderzoek en elke keer als ik bij je vandaan kwam had ik het gevoel dat er nog zoveel meer in de resultaten zat dan ik in eerste instantie had gezien. Peter van Velthoven- ik heb veel respect voor jouw verantwoordelijkheidsgevoel en je betrokkenheid bij ‘jouw’ onderzoekers, je bent een integer persoon. Onze oio-begeleider verhouding was gebaseerd op veel vrijheid en dat is erg leerzaam geweest. Bedankt! Hans Cuijpers en Marc Allaart zijn van onschatbare waarde voor alles wat met computers te maken heeft. Aangezien ik nog weleens ruzie had met mijn computer en met ECHAM zijn jullie vaak mijn ridders in nood geweest. Hans- bedankt voor al je hulp met ECHAM! Rinus Scheele- bedankt voor je hulp op het gebied van trajectorieën. NWO wil ik ook bedanken voor mijn reputatie als reis-oio. Gelukkig kwamen jullie er pas na 4 jaar achter dat ik een beperkt budget had. Ik ben ervan overtuigd dat het voor jonge onderzoekers heel waardevol is dat ze de mogelijkheid krijgen om hun resultaten te leren presenteren en verdedigen voor een kritische groep wetenschappers. Buiten het feit dat reizen natuurlijk gewoon vreselijk leuk is en een van de extra’s van het oio-schap. Paul Crutzen- bedankt voor je input en ideeën m.b.t. mijn laatste hoofdstuk. Richard Somerville, thanks for your enthusiasm to work with me, unfortunately I never made it to La Jolla. Herman Smit, bedankt voor je data en alle discussies die we hebben gevoerd over de ozonverdeling boven de Indische Oceaan. Jos de Laat- bedankt voor je substantiële bijdrage aan hoofdstuk 4. De groep ‘Atmosferische Samenstelling’ is natuurlijk de gezelligste groep van het KNMI, dat is algemeen bekend. Het lunchgroepje, Hans, Pieter, Michael, Bas, Jos, Ernst, Jeroen, Ge, Dirk, Renske, Jojanneke- bedankt voor alle lunches waarin we het niet over het werk hebben gehad! Renske- met jou heb ik heel veel gezellige jaren doorgebracht. Ik kan het onmogelijk beter treffen met een nieuwe kamergenoot dus er zit maar één ding op: ik zal je moeten meenemen naar mijn nieuwe baan!
i

Voorwoord
Prasad- thanks for making the workshop in India so much fun. And never underestimate the impact of giving a girl your last chocolate chip cookie! Andy- thanks for all the jokes and home-made chocolates, they certainly brightened my day many times the last year. Stay in touch guys! Bernhard- I’m still trying to make it to NY so you can make the poffertjes this time! En als je dan echt even geen zin meer hebt om nog een weekend op het KNMI door te brengen zijn daar gelukkig altijd nog je vrienden en vriendinnen! Toen ik de laatste paar maanden zo druk aan het schrijven was heb ik pas gemerkt hoe ontzettend belangrijk het is om af en toe even lekker te gaan eten, skaten, de kroeg in te gaan, te gaan dansen of quizzen bij de Florin&Firkin! In alfabetische volgorde: Adwin, Anke, Annelieke, Anne Marie, Dimfy, Edwin, Emilie, Femke, Folkert, Francis, Frans, Gosse, Harm, Jeroen, Jojanneke, Jop, Joris, Laura, Lotte, Maaike, Marie-Louise, Martin, Nicole, Reinout, Renske, Rob, Rikkie, Sander, Toi, Unni, Willeke - thanx!! Femke, mijn ‘derde paranimf’- ik ben blij dat we al zo lang vriendinnen zijn, ondanks het feit dat we best verschillend zijn hebben we vaak aan een half woord al genoeg en dat is toch wel erg speciaal. Jojanneke- het aantal stellingen dat ik over promoveren samen met jou zou kunnen schrijven is eindeloos. Allemaal komen ze er op neer dat zelfs in het weekend werken op een mooie lentedag leuk kan zijn als een van je vriendinnen in de kamer naast je zit. Bedankt voor alles, op naar de rest van ons leven! Een speciaal plaatsje in mijn hart is voor Adriaan. De afgelopen 6 jaar is niet zomaar in woorden te vatten maar je weet wel wat ze zijn, veel liefs. Ad, Renate en Anna B.- bedankt voor al jullie hartelijkheid, ik heb me altijd heel erg thuis gevoeld bij jullie. Ik vind het vooral ook erg speciaal dat mijn opa en oma bij mijn promotie kunnen zijn. Jullie interesse in alles wat er in de wereld gebeurt is onvoorstelbaar! Guido- Van anoniem in de aftiteling zomaar ineens hoofdpersoon! Je bent een echte Supergroover geweest de afgelopen paar maanden. In Ali G speak: me digs ye massive and me finks ye is a wicked geezer. Boka foreva! En een kus. En ten slotte mijn familie, Jol, Bas, mamma en pappa- bedankt! Jol, lieve sis, ik vind het echt hartstikke leuk dat je mijn paranimf bent! Lieve pap en mam- jullie bijdrage aan dit proefschrift zit in zoveel grote en kleine dingen dat het moeilijk is om het allemaal op te schrijven. Jullie hebben mij het vertrouwen en de energie gegeven om het te beginnen en het af te maken. Daarom is het voor jullie.
Mijke
Nu je bij het eind van mijn voorwoord aangekomen bent is de kans groot dat je nu linea recta doorgaat naar mijn CV en al het werk daartussenin overlaat aan de ‘die-hards’. Daar hoef je geen schuldgevoel aan over te houden, dat is statistisch verantwoord. Intelligent meebladeren tijdens de verdediging is natuurlijk wel vereist…
ii

Samenvatting
Samenvatting
Deze samenvatting begint met een inleiding voor de leek waarin de gebruikte begrippen worden uitgelegd zodat dit proefschrift voor het algemeen publiek hopelijk wat begrijpelijker wordt. Inleiding In de verticale richting is de atmosfeer opgebouwd uit verschillende lagen die van elkaar gescheiden worden door temperatuurmaxima en –minima. De onderste laag is de troposfeer. Hierin speelt het weer zich af. De troposfeer bestaat voornamelijk uit zuurstof (O2), stikstof (N2) en waterdamp (H2O), maar bevat ook kleine hoeveelheden koolstofdioxide (CO2) en methaan (CH4). De temperatuur in de troposfeer neemt af met de hoogte tot een minimum dat de tropopauze genoemd wordt. De hoogte van de tropopauze varieert van ongeveer 18 km in de tropen tot zo’n 10 km aan de polen. De tropopauze markeert de bovengrens van de troposfeer en de ondergrens van de stratosfeer. Chemisch gezien zijn er grote verschillen tussen deze twee lagen. Zo bevat de stratosfeer veel meer ozon (O3) en minder waterdamp, koolstofdioxide en methaan dan de troposfeer. Ozon is een verbinding van zuurstof die een groot gedeelte van de schadelijke ultraviolette straling van de zon absorbeert. Dit zorgt er voor dat de temperatuur in de stratosfeer toeneemt met de hoogte tot ongeveer 50 km waar de stratosfeer eindigt en een volgende laag begint. De temperatuurtoename in de stratosfeer zorgt voor een stabiele gelaagdheid, dat wil zeggen dat luchtmassa’s niet zomaar van de ene naar de andere laag kunnen bewegen zonder eerst opgewarmd te worden (bijvoorbeeld door de zon). De tropopauze vormt dan ook een barrière voor verticale bewegingen. In de troposfeer worden het noordelijk en zuidelijk halfrond van elkaar gescheiden door de Intertropische Convergentie Zone (ITCZ). De ITCZ wordt gevormd door de samenkomst van winden van beide halfronden in de tropen, de noordoost en de zuidoost passaat (windconvergentie). Aan het aardoppervlak komen de warme, vochtige luchtmassa’s bij elkaar. Aangezien warme lucht lichter is dan koude lucht zullen de warme, vochtige luchtmassa’s opstijgen, dit wordt convectie genoemd. Deze opwaartse bewegingen leiden tot condensatie van de vochtige lucht en er worden wolken gevormd, de zogenaamde convectieve wolkengebieden van de ITCZ. Eenmaal bij de tropopauze wordt verder opwaarts transport belemmerd en zal het grootste gedeelte van de luchtmassa’s weer terugkeren naar het oorspronkelijke halfrond, ondertussen langzaam dalend. Hoewel enige uitwisseling tussen beide halfronden plaats kan vinden bij samenkomst van de luchtmassa’s vormt de ITCZ voornamelijk een barrière voor uitwisseling van lucht tussen het noordelijk en het zuidelijk halfrond. De ITCZ is het hele jaar aanwezig, maar de plaats van de ITCZ is afhankelijk van het jaargetijde. De ITCZ bevindt zich altijd op het halfrond waar het op dat moment zomer is en volgt dus de seizoenscyclus die verbonden is met de positie van de zon. Net zoals de luchtmassa’s aan weerszijden van de tropopauze chemisch verschillend zijn, hebben de
iii

Samenvatting
luchtmassa’s aan weerszijden van de ITCZ ook een hele eigen samenstelling. Dit wordt veroorzaakt door invloeden van de mens. In de tropen vindt op grote schaal verbranding van biomassa en fossiele brandstoffen plaats. Door de grotere landmassa van de noordelijk halfrond tropen komt het grootste gedeelte van de luchtvervuiling die hierbij geproduceerd wordt (zoals ozon, koolstofmonoxide (CO) en methaan) daar terecht. Lucht van het zuidelijk halfrond is relatief schoon. Samenvattend, de tropopauze en de ITCZ vormen belangrijke barrières tussen chemisch verschillende gebieden. Echter, met behulp van tracers, stoffen of grootheden die kenmerkend zijn voor een luchtmassa uit een bepaald gebied (de stratosfeer is bijvoorbeeld rijk aan ozon dus ozon is een tracer voor stratosferische luchtmassa’s; koolstofmonoxide komt veel voor in vervuilde lucht en is dus een tracer voor luchtmassa’s van de noordelijk halfrond continenten), is gebleken dat deze barrières doordringbaar zijn en dat er wel degelijk enige uitwisseling plaats kan vinden tussen de troposfeer en de stratosfeer en tussen het noordelijk en het zuidelijk halfrond. Uit de literatuur blijkt dat stratosfeer-troposfeer uitwisseling, bijvoorbeeld, veroorzaakt kan worden door zogenaamde tropopauzevouwen, grootschalige vervormingen van de tropopauze. Deze komen vooral voor in de subtropen waar de tropopauzehoogte een sterke sprong maakt. Deze sprong valt samen met een sterke oost-west luchtstroming, de subtropische straalstroom. In metingen komen tropopauzevouwen naar voren als instromingen van ozonrijke, droge lucht. En uit metingen van bijvoorbeeld methaan en koolstofmonoxide blijkt uitwisseling tussen beide halfronden waarin convectie een belangrijke rol speelt. Dit proefschrift De atmosfeer bestaat uit een aantal gebieden die verschillen in chemische samenstelling. Deze gebieden worden gescheiden door verticale en horizontale barrières die onderlinge uitwisseling belemmeren. Deze barrières zijn bijvoorbeeld de tropopauze en de ITCZ. In dit proefschrift wordt aan de hand van metingen en computerexperimenten onderzocht hoe er ondanks deze barrières toch uitwisseling van luchtmassa’s plaats kan vinden en hoe dit de chemische samenstelling van de atmosfeer beïnvloedt. Schematisch samengevat:
ITCZ tropopauze
troposfeer
stratosfeer
noordelijk
halfrond
zuidelijk
halfrond
tropen aardoppervlak
iv

Samenvatting
Het onderzoek in dit proefschrift is verricht in het kader van het Indische Oceaan Experiment (INDOEX), een grootschalige, internationale meetcampagne. Het doel van INDOEX was te onderzoeken hoe vervuiling van India, zuidoost Azië en Afrika de samenstelling en het klimaat van de tropische atmosfeer boven de Indische Oceaan beïnvloedt. In dit proefschrift worden voornamelijk verticale ozonmetingn gebruikt (ozonprofielen). Deze zijn verkregen door een ozonmeetinstrument vanaf een schip aan een weerballon op te laten. Aangezien ozon een tracer is voor zowel luchtvervuiling als voor stratosferische lucht geven deze verticale profielen informatie over het transport van luchtmassa’s door de atmosfeer. De metingen laten zien dat er een complexe wisselwerking tussen verschillende transportprocessen is in de atmosfeer boven de Indische Oceaan. Door de grote variaties in windrichting en windsnelheid met de hoogte is de atmosferische samenstelling sterk gelaagd. In veel metingen zijn de lagere en middelste troposferische luchtlagen ozonrijk. Deze lucht is voornamelijk afkomstig uit vervuilde gebieden in India, zuidoost Azië en Afrika. In andere metingen wordt juist ozonarme lucht in de lagere en middelste luchtlagen gevonden. Dit wordt veroorzaakt door ozonafbraak tijdens langdurig transport over de oceaan. In convectieve gebieden of in tropische cyclonen wordt deze lucht vervolgens naar de hogere luchtlagen getransporteerd. Behalve hoge ozonniveaus ten gevolge van vervuiling zijn ook regelmatig ozonrijke luchtmassa’s gevonden die door instroming van ozon vanuit de stratosfeer veroorzaakt zijn (intrusies). Deze komen voor in de middelste luchtlagen in de vorm van droge lagen met een dikte van enkele kilometers, en net onder de tropopauze in de vorm van zeer ozonrijke lagen met een dikte van slechts enkele honderden meters. De oorsprong van deze luchtmassa’s is bepaald met behulp van een computermodel dat de banen van luchtdeeltjes door de atmosfeer (trajectorieën) kan berekenen. Het is gebleken dat beide vormen van ozonrijke lucht meestal afkomstig zijn uit het gebied van de subtropische straalstroom van het noordelijk of zuidelijk halfrond. Sterke snelheidverschillen rond de straalstroom zorgen ervoor dat de stratosferische intrusies uitgerekt kunnen worden tot hele lange dunne en vrijwel horizontale lagen. De ozonrijke lagen komen in de hele tropen voor, niet alleen vlakbij de straalstromen. Dit betekent dat de invloed van de stratosfeer tot op de evenaar reikt. In enkele metingen is een dubbele tropopauze gevonden. Trajectorieën wijzen in die gevallen op transport vanaf de subtropische straalstromen op beide halfronden in plaats van op slechts een halfrond. Metingen over meerdere jaren laten zien dat stratosferische intrusies rond de subtropische straalstroom van een of beide halfronden zeer frequent voorkomen boven de Indische Oceaan. Stratosferische intrusies zijn al eerder door anderen geobserveerd maar het herhaaldelijk voorkomen van dunne, uitermate ozonrijke stratosferische intrusies zo vlak onder de tropopauze en samenhangend met de subtropische straalstroom, ongeacht de klimatologische staat van de atmosfeer, is een nieuwe ontdekking. Alhoewel atmosferische klimaatmodellen goed in staat zijn de grootschalige transportprocessen van ozon te simuleren hebben ze problemen met het simuleren van deze dunne lagen. Behalve stratosferische intrusies bleek uit de combinatie van metingen en trajectorieën ook transport van lucht van het ene naar het andere halfrond. Deze uitwisseling is belangrijk omdat de lucht afkomstig van het noordelijk halfrond vervuild is en die van het zuidelijk halfrond relatief schoon. Beide luchtmassa’s worden gescheiden door de ITCZ. Met een klimaatmodel (ECHAM4) is onderzocht hoeveel lucht er nu eigenlijk over de ITCZ heen gaat, waar dit gebeurt, en wanneer. Hiervoor is een methode ontwikkeld die gebaseerd is op tracers. In een eerste experiment werd de positie van de ITCZ bepaald door middel van het loslaten van één tracer op het noordelijk halfrond
v

Samenvatting
en één op het zuidelijk halfrond. Aangezien de ITCZ een barrière is voor uitwisseling tussen de halfronden ontstaat er ter plekke van de ITCZ een sterke tracer gradiënt. Aan de hand van de gradiënt kan de locatie van de ITCZ bepaald worden. Met behulp van deze ‘chemische ITCZ’ definitie kan nu de uitwisseling nauwkeurig bepaald worden. Dit is gedaan door in een tweede experiment de troposfeer van beide halfronden helemaal op te vullen met de respectievelijke tracers en daarna het model deze tracers gedurende een maand te laten transporteren. Het transport van de tracers wordt gedomineerd door de verplaatsingen van de ITCZ in de loop van de seizoenen. De uitwisseling van lucht vindt voornamelijk plaats in de middelste en hogere lagen van de troposfeer (8-12 km hoogte) in het gebied waar de uitstroming van de convectieve wolken in de ITCZ plaatsvindt. Dit is consistent met gemeten grootschalige ozonarme lucht op die hoogte die afkomstig is van de onderste laag van de troposfeer. Uitwisseling aan het oppervlak duidt op het bestaan van drie verschillende gebieden die gescheiden worden door barrières in de potentiële temperatuur¢: de ‘binnenste’ tropen, en de subtropen van het noordelijk en zuidelijk halfrond. Het eerste gebied wordt gekarakteriseerd door sterke menging van de tracers aan het oppervlak terwijl in de subtropen uitwisseling tussen de halfronden samenhangt met het uitstroomgebied van convectie in de tropen. Dit laatste gebied wordt gekarakteriseerd door sterke verticale en zwakke horizontale gradiënten in de potentiële temperatuur. Het is gebleken dat gedurende een jaar ongeveer evenveel lucht van het noordelijk naar het zuidelijk halfrond getransporteerd wordt als omgekeerd. Ook is gebleken dat de ITCZ gemiddeld op het noordelijk halfrond ligt, rond 4ºN. Het zuidelijk halfrond is dus ongeveer 8% groter dan het noordelijk halfrond in termen van de atmosfeersamenstelling. Hierbij is een halfrond gedefinieerd als zijnde ten noorden of ten zuiden van de ITCZ en niet ten noorden of zuiden van de evenaar. Dit leidt ertoe dat het langer duurt om het zuidelijk halfrond te ‘verversen’ dan het noordelijk halfrond (0.9 jaar en 0.74 respectievelijk).
¢ De potentiële temperatuur is de temperatuur die een hoeveelheid lucht op een willekeurige hoogte in de atmosfeer zou hebben als het pakketje lucht zonder uitwisseling van warmte met de omgeving tot een standaarddruk van 1000 millibar (het aardoppervlak) gebracht zou worden. Aangezien de luchtdruk op een hoogte boven het aardoppervlak lager is wordt het pakketje lucht samengedrukt en daardoor opgewarmd. Al deze opwarming komt ten goede aan het pakketje lucht aangezien er geen uitwisseling met de omgeving is. Op deze manier spelen temperatuursverschillen veroorzaakt door drukverschillen in de atmosfeer geen rol als de potentiële temperatuur gebruikt wordt i.p.v de ‘gewone’ temperatuur. De enige manier waarop de potentiële temperatuur van een pakketje lucht kan veranderen is door opwarming (door bijvoorbeeld de zon) of door afkoeling. De potentiële temperatuur is een veel gebruikt en handig begrip in onderzoek naar atmosferisch transport.
vi


Introduction
1
Introduction This chapter is intended to provide a general background for the research presented in the rest of the thesis. Each topic in this introduction is of relevance to the main theme of the thesis: the influence of transport processes on the composition of the tropical troposphere. The global monsoon circulation, in terms of relentless large-scale atmospheric overturning, for example, lies at the root of a whole range of transport features. Convection and its large-scale organization into tropical convergence zones are components of this tropical monsoon circulation. They can cause rapid vertical mixing as well as horizontal exchange between the northern and southern hemisphere (NH and SH) and are therefore important for transport. Another contribution that is important for the tropical troposphere is inflow from the stratosphere. The stratosphere (from roughly 17-20 km to 50 km in the tropics) is chemically very different from the troposphere. As a consequence, transport from the stratosphere into the troposphere affects tropospheric chemistry and the distribution of trace gases. Such transport processes can be studied by analyzing trace gas measurements in combination with model simulations of air mass motions. This yields a very useful tool to advance understanding of transport in the tropics. The work described in this thesis has been performed within the framework of the Indian Ocean Experiment (INDOEX). 1.1 The Indian Ocean Experiment The Indian subcontinent and its surrounding countries harbor about half of the world’s population. Large-scale use of fossil fuels and biofuels (such as dung, agricultural waste and wood) in these highly populated areas cause major air pollution problems. With a continuing population growth and increasing economic activity in these areas the anthropogenic emissions are increasing at a high rate. These chemical perturbations of the atmosphere affect the radiation balance of the Earth and thereby climate in a region where the solar radiation is most intense, the tropics. Until some years ago, warming due to greenhouse gas emissions and some types of aerosols was believed to be the most important climatic consequence. A contrasting effect, however, is the cooling due to specific types of aerosols. Acting as tiny atmospheric mirrors, both directly and indirectly by influencing cloud properties [Twomey et al., 1984; Charlson et al., 1992], cooling by anthropogenic aerosols could well mask the greenhouse warming. To study how the Indian/SE-Asian pollution is affecting the tropical atmosphere, a major measurement campaign was carried out: the Indian Ocean Experiment (INDOEX). The Indian Ocean has unique features. To the south lies a vast ocean with a clean atmosphere over it. On all other sides however, the Indian Ocean is bounded by continents with large pollution sources to the atmosphere. During boreal winter (December-January-February, DJF) the high pressure area over SE-Asia traps pollutants in a very stable boundary layer, which extends vertically
1

Chapter 1
to a few km above the surface. The monsoon circulation joins these highly contrasting air masses at the Intertropical Convergence Zone (ITCZ) (Figure 1.1).
Figure 1.1. European Centre for Medium-Range Weather Forecasts (ECMWF) wind (arrows) and relative humidity (RH) at 1000 hPa: February climatology (1990-1999). Large arrows numbered 1 to 4 indicate the main flow channels: (1) NE trades over the western Arabian Sea, (2) NW-NE flow along the west coast of India, (3) NE trades over the western Bay of Bengal, and (4) NE flow from SE Asia. These channels represent transport of pollution. The dashed lines represent the major (SH) and minor (NH) ITCZs of the Indian Ocean [Verver et al., 2001].
The strong gradient of pollution across the ITCZ provides a perfect region for studies that address issues relating to chemical perturbations of the tropical free troposphere [Crutzen and Ramanathan, 2001]. INDOEX was set up by Prof. Crutzen and Prof. Ramanathan and organized by the Centre for Clouds, Chemistry and Climate at Scripps Institution of Oceanography, University of California, San Diego. The intensive measurement campaign of INDOEX in 1999 was preceded by several smaller campaigns in 1995-1998, intended to support the planning of the major campaign. During January-April 1999, scientists from the US, Europe and India used multiple aircraft, ships, island stations, balloons, and geostationary satellites to collect data. The Netherlands participated through aircraft measurements, meteorological support [Verver et al., 2001] and chemistry and transport studies [Lelieveld et al., 2001]. 1.2 The tropical circulation 1.2.1 Monsoons The term ‘monsoon’ stems from the Arabic word for season. As one of the most dramatic annual weather cycles it dominates the daily life of half the world’s population. Often referred to as a complete reversal of the surface winds it is even more commonly thought of in terms of a wet and a
2

Introduction
dry phase. The geographic area defined to have a monsoon climate (in terms of a wind reversal and corresponding rainfall cycle) covers almost one quarter of the Earth’s surface [Webster, 1986]. The dominant monsoon systems are the Asian-Australian, the African and the American monsoons [Trenberth et al., 2000]. Like many other tropospheric circulations, the monsoon is essentially driven by solar heating. A pattern of differential heating develops due to the different heat capacity of land and sea, the distribution of the continents and the annual cycle of the incoming solar radiation. The pattern changes in time. This results in a pressure gradient force with a strong thermal low-pressure area over the summer continents and a high-pressure area during winter. The atmosphere reacts with a shallow southwesterly onshore flow of moist air in summer, and a northeasterly dry offshore flow in winter (most visible over India, Figure 1.2a and 1.3a) that are influenced by the Earth’s rotation. Moist processes intensify the monsoon circulation by adding an extra energy source through the release of latent heat. This north-south view of the monsoon is only part of the picture. The global monsoon circulation is essentially a persistent large-scale overturning of the entire tropical and subtropical atmosphere that varies with the seasons [Trenberth et al., 2000]. It consists of zonal and meridional thermally driven cells that transport moist static energy. The meridional component of the global monsoon is referred to as the lateral monsoon, whereas the zonal component is generally called the transverse monsoon [Webster et al., 1998]. However, this is still not the complete picture. A recent study by Trenberth et al. [2000] of the divergent mass circulation found in the NCEP (National Center for Environmental Prediction) and ECMWF reanalyses points to the existence of two vertical modes, a shallow and a deep overturning monsoon mode.
a
b
Figure 1.2. ECMWF wind and RH at (a) 925 hPa and (b) 700 hPa: January climatology (1983-1992). The convergence zones correspond to the shaded regions in (b). The South Pacific Convergence Zone (SPCZ) stretches southeastward from New Guinea to 150°W.
3

Chapter 1
a
b
Figure 1.3. ECMWF at 925 hPa (a) and relative humidity (RH) at 700 hPa (b): July climatology (1983-1992).
The first and dominant monsoon mode is a deep tropospheric overturning mode with a maximum in vertical motion at 400 hPa, wind divergence in the upper troposphere and convergence in the lower troposphere. The Hadley circulation (embedded in the lateral monsoon) and three transverse cells, the Pacific and Atlantic Walker cells and the Asian-African cell, are all part of this deep mode. These cells exist year-round but migrate and change significantly with the seasons. The transverse Walker cells consist of rising in the west and sinking in the east, whereas the Asian-African cell circulates the other way around. The Hadley circulation comprises two cells that vary in strength between the seasons in such a way that the winter cell is strongest. The peak mass fluxes in the Hadley cell are about two to three times larger than those of the transverse cells although there is still uncertainty about the true strength of the Hadley circulation. The second monsoon mode is a vigorous lower-tropospheric overturning and is more a local feature. The axis of the shallow cell is at approximately 800 hPa. It is strongest over Africa but also influences the Middle East and Australia and appears to be an important component of the overturning, and thus the ITCZ (section 1.2.2), in the Pacific and Atlantic sectors. To summarize, the monsoon circulation is a global-scale feature in terms of a seasonally varying persistent overturning of the atmosphere. It comprises both zonal and meridional overturning as well as two vertical modes: a shallow and a deep cell. The latter is dominant and describes the global-scale monsoon. The shallow cell is important for the lower-troposphere monsoon activity. Only two oceanic regions, the eastern Pacific and Atlantic, do not qualify as monsoon regions in terms of a seasonal reversal in the overturning circulation as the ITCZs there reside north of the equator year-
4

Introduction
round [Trenberth et al., 2000]. They nevertheless do participate in the global monsoon through changes in the large-scale overturning. 1.2.2 Tropical convergence zones Perhaps the most characteristic features of the tropical circulation are the tropical convergence zones, which appear as zones of maximum cloudiness in satellite imagery (Figure 1.4). These large-scale features are essentially manifestations of low-level horizontal wind convergence and associated moisture convergence of the tropical trade winds (Figures 1.2 and 1.3). This leads to upward motion and condensation takes place, creating a band of clouds. This overturning process is called deep convection and neutralizes the convectively unstable environment created by the moisture convergence and the solar heating. The threshold temperature for organized convection in the tropics is about 28°C. Convection occurs when the atmosphere becomes unstable, which requires a decreasing equivalent potential temperature+ (θe) with height.
Convective transport in the tropics is very important for the vertical redistribution of chemical species. Rapid vertical motions can transport boundary layer pollutants to the upper troposphere in less than an hour, often without much dilution with the mid-tropospheric air surrounding the convection. Convection plays an important role in the tropical tropospheric chemistry due to the strong difference in chemical lifetime of trace gases between the lower and upper troposphere. Through redistribution of greenhouse gases, especially water vapor, convection considerably changes the radiative properties of the upper troposphere and lower stratosphere. The deepest convection sometimes reaches and even lifts the tropopause, thereby triggering stratosphere-troposphere exchange (STE). Due to mass conservation, the upward motion in the convective turrets causes downward motion in the surrounding environment. This takes place on small scales as downdrafts, associated with a narrow zone of intense precipitation, and on mesoscales, as widespread slow subsidence. The downdrafts are caused by evaporation of precipitation, melting of ice particles and precipitation drag [Lu et al., 2000]. If the convection reaches its uppermost boundary, the tropopause, turrets may overshoot into the stable stratified stratosphere [Danielsen, 1982]. Part of the air in the updraft will rapidly descend in the downdrafts. The majority of the flow, however, will spread quasi-horizontally away from the convective core. The quasi-horizontal spreading produces the typical anvil clouds associated with deep convection. Turbulent motions, mixing and subsidence due to radiative and evaporative cooling lead to the final disappearance of these clouds. After the disappearance of the anvil, thin layers with elevated concentrations of chemically active tracers remain in the upper troposphere. These layers, which originate from the boundary layer, continue to exist for some time and gradually mix with local clean upper-tropospheric air masses. Mesoscale subsidence is one of
+ θe is the temperature that a parcel of moist air at pressure p and temperature T would have if it were expanded or compressed adiabatically (without the exchange of energy with the environment) to a standard pressure (usually taken to be 1000 hPa) and if all the release of latent heat by condensation is used to warm the parcel. Every air parcel has a unique θe and this value is conserved for moist adiabatic motion. Since synoptic-scale motions are approximately adiabatic outside regions of active precipitation, θe is a quasi-conserved quantity for such motions and often serves as a tracer in moist diabatic processes. For dry air parcels the potential temperature (θ) is used.
5

Chapter 1
the major control mechanisms on the trade wind boundary layer depth and provides a source of free-tropospheric air for the boundary layer [Lu et al., 2000].
Figure 1.4. Meteosat5 satellite visible image of the Indian Ocean, 20 October, 1998. The ITCZ is visible as a zonal band of white clouds.
Organized convection in the tropics predominantly occurs in the tropical convergence zones. There are principally three tropical convergence zones associated with the major precipitation regions (Figures 1.2 and 1.3): the Indian Ocean/W-Pacific/E-Pacific ITCZ, the S-Pacific Convergence Zone (SPCZ) and the ITCZ in the tropical Atlantic. The first is mainly zonally oriented whereas the latter two exhibit a distinct northwest-southeast orientation (see Vincent [1994] for a review on the SPCZ). The longitudinal extent of the convection zones generally exceeds 1000 km and the latitudinal extent ranges from 200-800 km depending on region and season. The convergence zones can be viewed in terms of monthly (or seasonally) and zonally averaged phenomena, namely as the upward branches of the planetary-scale monsoon overturning circulation. They are also recognizable on daily weather maps where they show considerable day to day fluctuations. Satellite images of the outgoing longwave radiation (OLR), low OLR being a measure of convection, often do not show a continuous band of clouds at the tropical convergence zones but rather individual superclusters of convective cells with relatively cloud-free patches in between. Embedded in the convergence zones are westward moving disturbances. The ITCZ over the Indian Ocean, for example, spawns yearly approximately a dozen tropical cyclones via easterly waves and monsoon surges [Jury et al., 1994]. The convergence zones generally form over oceans with the warmest sea surface temperatures (SST) as an observational study by Waliser et al. [1993] showed. SST migrations associated with the seasonal cycle in solar heating and with phenomena such as the El Niño/Southern Oscillation therefore cause major displacements of the convergence zones. The global monsoon circulation draws the convergence zones towards the summer hemisphere. Exceptions to this are the ITCZ in the E-Pacific and the Atlantic Oceans, which remain in the NH throughout the year (approximately
6

Introduction
6-7°N) in spite of symmetric annual mean insolation. What causes this asymmetry with respect to the equator? The answer to this question is not trivial and has been the subject of many studies [Waliser and Somerville, 1994; Philander et al., 1996; Li, 1997; Wang and Wang, 1999]. The ITCZ resides over the warmest surface waters, which do not occur on the equator, as would be expected from the solar radiation cycle, but north of the equator. In fact, in the E-Pacific there is a strong cold tongue at and south of the equator. According to numerical experiments by Li [1997] the key to the problem lies in complex ocean-atmosphere interactions with the geographical distribution of continents playing a crucial role. These interactions support a number of antisymmetric modes around the equator and can convert a symmetric state to an asymmetric one through three types of positive feedback processes. These processes are: (1) meridional wind-SST feedback, (2) evaporation-wind feedback and (3) low-level stratus cloud-SST feedback. Li [1997] argued that the most important reason for the ITCZ to stay north of the equator is the bulge of northwestern Africa for the Atlantic and the combination of the existence of equatorial easterlies, the symmetry-breaking tilt of the western coast of the Americas, and atmosphere-ocean interactions for the Pacific. The positive feedbacks could favor either hemisphere but the distribution of the continents is eventually the reason for the NH preference of the E-Pacific and Atlantic ITCZ. Why is the annual mean northward displacement of the ITCZ so important? The answer to this lies in the interaction between the ITCZ and tracer transport. The major upwelling regions of the ITCZ form a barrier for tropospheric mass transport between the regions to the north and south [Gregory et al., 1999]. Differences in chemical signatures between the NH∗ and the SH over the Pacific Ocean indicate that the ITCZ and SPCZ are quite effective transport barriers at low-altitudes (below 5 km) [Gregory et al., 1999]. Between 8-10 km chemical signatures are less dissimilar and cross-zonal flow seems to occur. The fact that the most important barrier to tropospheric interhemispheric exchange prefers to reside in the NH has major implications for the distribution of those chemical species that have an asymmetric source distribution between the hemispheres. Consider for example, anthropogenic emissions of aerosols or carbon monoxide due to biomass burning, fossil fuel combustion and the use of biofuel [Lelieveld et al., 2001]. These compounds are largely emitted from the NH continents and affect the radiation balance and the chemistry (especially the atmospheric oxidizing capacity) of the tropical troposphere. The contamination of the SH with these species largely depends on the permeability and the location of the ITCZ. However, part of the pollution is directly emitted into the SH by those parts of the NH continents that are frequently south of the ITCZ. The fact that the dynamical SH is larger than its northern counterpart could therefore greatly increase the chemical effects of man-made pollution. This is an important consequence of the tropical circulation. 1.3 Stratosphere-troposphere exchange Although the stratosphere and troposphere are inseparable in a dynamical sense [Hoskins et al., 1985] they are very different with respect to their vertical transport timescales and in a chemical
∗ For clarity: the terms ‘southern hemisphere’ and ‘northern hemisphere’ in this study do not mean south or north of the equator but south and north of the ITCZ. The terms ‘dynamical’ southern and northern hemisphere may also be used.
7

Chapter 1
sense. The tropopause separates the troposphere from the stratosphere (typically at 17-20 km in the tropics and at 12 km at midlatitudes). The World Meteorological Organization (WMO) defines the tropopause as the lowest pressure level at which the temperature lapse rate decreases to 2 K/km or less, provided that the average lapse rate between this level and all higher levels within 2 km does not exceed 2 K/km. In the tropics the tropopause more or less coincides with a temperature minimum, the so-called cold point (Figure 1.5). Above the tropopause the temperature (and thus the static stability) increases again in the stratosphere. This is due to absorption of solar radiation by ozone (O3) molecules in the ozone layer centered at approximately 25 km. The source of this natural ozone layer is the photolysis of oxygen molecules by solar radiation [Chapman, 1930]. The increase of temperature with height in the stratosphere corresponds to a stable stratification, i.e. vertical motions are hampered. The timescale for vertical transport will therefore be large. The troposphere where the temperature decreases with height, on the other hand, is prone to instabilities. Once convection is triggered warm bubbles of air can ascend to the upper troposphere in less than an hour. As soon as the temperature minimum at the tropopause is reached the bubbles are no longer buoyant and further upward motion is prohibited by the stable lapse rate of the stratosphere. Thus the tropopause forms a transport barrier between the these atmospheric layers. The transport barrier corresponds to a steep gradient in the potential vorticity (PV) from the troposphere to the stratosphere. The vertical component of the PV is defined as
PV = -g (f + ς) ∂θ⁄∂p where g denotes the acceleration of gravity, f = 2 Ω sinφ the Coriolis parameter, ς the relative vorticity, θ the potential temperature, and p the pressure. The strong gradient of the PV at the tropopause can (partly) be understood as due to the difference in lapse rate ∂θ⁄∂p between the troposphere and stratosphere. The extratropical tropopause is thus often defined in terms of a specific PV contour (often 1-2 PVU = 2*10-6 m2 s-1 K kg-1), the so-called ‘dynamical tropopause’, instead of the ‘thermal’ WMO definition (heavy contour in Figure 1.5).
Figure 1.5. Latitude-altitude cross section of zonal mean θ (solid contours) and temperature (dashed contours) for January 1993. The heavy solid contour (cutoff at the 380K isentrope (surface of constant θ)) denotes the 2 PVU PV contour. Shaded areas denote the ‘lowermost stratosphere’ where isentropes cross the tropopause [Holton et al., 1995].
8

Introduction
The PV is conserved in adiabatic frictionless flow. This is a powerful tool to analyze the large-scale motions of the atmosphere. The PV therefore serves as a dynamical tracer of stratospheric air [Haynes and McIntyre, 1986]. Over the equator the term (f + ς) changes sign and PV is less useful. In the tropics the 380 K contour of θ can be used (Figure 1.5). Figure 1.5 shows that the tropopause height is highest in the tropics and crosses isentropic surfaces toward the poles. Strong PV gradients prevail at these stratosphere-troposphere intersections. The troposphere and stratosphere have a different chemical signature. Stratospheric air for example, has high ozone and odd nitrogen concentrations, whereas tropospheric air has large concentrations of radon, total water (vapor, liquid and ice crystals), and of anthropogenic trace gases such as carbon monoxide. The barrier between the troposphere and stratosphere is permeable. Cross-tropopause exchanges frequently occur and can be detected by their chemical signature. Such stratosphere-troposphere exchanges (STE) can be caused by various processes at different space- and timescales. STE can influence the radiation balance in the troposphere and lower stratosphere [Ramaswamy et al., 1992; Toumi et al., 1994] and therefore plays a significant role in the global climate system. A simple model that describes STE as exchange between two well-mixed boxes has only limited applicability due to the stratified nature of the stratosphere and the associated long vertical transport times [Holton et al., 1995]. Rather STE must be placed in the framework of the general circulation. Figure 1.6 gives a conceptual model of the global-scale circulation in the upper troposphere-stratosphere. The figure discerns three regions: the troposphere, the ‘lowermost’ extratropical stratosphere (grey shading) and the rest of the stratosphere. The isentropic surfaces in the lowermost stratosphere also lie partly in the troposphere. This facilitates so-called quasi-horizontal or isentropic STE (depicted by wavy arrows in the figure), as air masses can move freely on isentropic surfaces without the need for additional energy sources. Hence this is adiabatic transport. Quasi-horizontal STE can be significantly faster than STE across isentropic surfaces, which does require an energy source such as radiational heating (diabatic transport). The cross-isentropic diabatic large-scale meridional overturning circulation is depicted by the thick arrows in Figure 1.6, and is known as the Brewer-Dobson circulation (BD-circulation) [Brewer, 1949]. The BD-circulation is thought to be controlled by the non-local response to breaking gravity- and Rossby waves in the extratropical stratosphere [Haynes et al., 1991]. The wave-driven force induces a pumping action where air is sucked up from the tropical lowermost stratosphere, transported meridionally toward the poles, where it is pushed downward again. The BD-circulation is strongest in the NH winter. Upward transport in the uppermost tropical troposphere is also controlled by local processes such as radiational heating and incidental overshooting convection. Figure 1.6 differs from the original figure from Holton et al. [1995] in that it contains a ‘tropical transition layer’. Studies [i.e. by Folkins et al., 1999] have shown that convection generally does not reach the tropopause. Rather there is a transition layer from tropospheric to stratospheric trace gas concentrations. The precise connection between upward transport in the tropical upper troposphere/lower stratosphere and the mid-latitudinal wave-driven pump is still under investigation. Apart from this global-scale STE, finer details in STE are provided by smaller-scale processes. For example, the isentropic exchange between the lowermost extratropical stratosphere and the tropical upper troposphere and vice versa mentioned earlier (the region depicted by the wiggly arrows in Figure 1.6). The strong increase in height of the tropopause in the subtropics coincides with the axis of an upper-tropospheric subtropical jet stream (STJ). This jet stream is strongest in the winter
9

Chapter 1
hemisphere. On the poleward side of the STJ stratospheric high PV values can be found. Isentropic exchange due to tropopause deformations at the tropopause break can lead to thin ‘filaments’ or ‘streamers’ in the strong shear-zone near the STJ. Filamentation is basically quasi-horizontal chaotic mixing on isentropic surfaces. Shear-induced differential advection can cause tracer surfaces to stretch and leads to elongated laminae-like tracer structures [Appenzeller and Holton, 1997; Ambaum, 1997]. Deformations of the tropopause associated with the STJ can also cause more vertically oriented filamentary structures, the so-called ‘tropopause folds’. This STE mechanism causes high PV, ozone-rich air to penetrate into the lower troposphere [Shapiro, 1980; Baray et al., 1998]. Much of the ozone transport from the lowermost stratosphere to the troposphere is believed to be associated with such folds. Finally, at even smaller-scales, clear-air turbulence (CAT) is another mechanism of STE when the Richardson number in the strong shear zone near the STJ reaches a critical value [Shapiro, 1978; Kennedy and Shapiro, 1980; Pepler et al., 1998]. After some initial mixing by CAT further transport of the ozone-enhanced layers into the tropics would again be differential advection.
Figure 1.6. Schematic of dynamical aspects of STE. The tropopause is shown by the thick line. Thin lines are isentropic surfaces (in Kelvin). Heavily shaded region is the ‘lowermost stratosphere’ where isentropic surfaces span the tropopause and isentropic exchange by tropopause folding occurs. In the region above the 380K surface isentropes lie entirely in the stratosphere. Light shading denotes wave-induced forcing (the extratropical ‘pump’). The wiggly double headed arrows denote meridional isentropic transports. The broad arrows show transport by the global-scale circulation, which is driven by the extratropical pump. This global-scale circulation is the primary contribution to exchange across isentropic surfaces (e.g. the 380K surface) that are entirely in the stratosphere. Note that the convection does not reach the tropopause on average. Rather, there is a ‘transition layer’ from tropospheric to stratospheric values of trace gas concentrations [adapted from Holton et al., 1995].
10

Introduction
Upper-tropospheric extremely ozone-rich layers have been measured in the vicinity of tropical convection [Suhre et al., 1997]. Suhre et al. proposed several possible mechanisms for explaining these layers, however the most likely explanation at this point is that these extremely high ozone concentrations are due to measurement errors. Intimately connected to STE is the problem of explaining the H2O content of the stratosphere. Two decades ago there has been considerable interest in the process of mass exchange from the troposphere to the stratosphere in the so-called stratospheric fountain [Newell and Gould-Stewart, 1981; Danielsen, 1982; Doherty et al., 1984]. Newell and Gould-Stewart proposed that air enters the stratosphere only in limited areas and at specific times of the year corresponding to the regions of most active convection (the ‘stratospheric fountains’). Only in these regions, the tropopause temperature is low enough to dry the air to the observed 3-4 parts per million by volume water vapor mixing ratios at 100 hPa. The fountain is located over Indonesia during winter and over the Bay of Bengal in summer. In spite of a lack of consensus on the specific cause, there are indications that air mainly enters the stratosphere in regions with the lowest tropopause temperatures at times of strong convection [Jackson et al., 1998]. Again it must be stressed that this is not the driving force for the large-scale BD-circulation. Transport of stratospheric air into the troposphere by the large-scale Brewer-Dobson circulation was once thought to be the primary source of tropospheric ozone [Junge, 1962]. Presently it is well known that photochemical ozone formation is a much more important source for tropospheric ozone [Crutzen, 1973], although there is still uncertainty in the relative contribution of each source. STE by smaller-scale processes is believed to play a minor role [Holton and Lelieveld, 1996]. However, several studies have indicated stratospheric influences in the mid-latitude troposphere by many of the mechanisms discussed above. To what extent such intrusions contribute to the tropical tropospheric ozone budget was largely unknown at the beginning of this thesis work. 1.4 Atmospheric general circulation models and trajectory models Atmospheric scientists have various sophisticated tools at their disposal to study the transport of air masses and chemical compounds through the atmosphere. Examples of such tools are chemistry transport models, general circulation models, trajectory models, and meteorological analyses from numerical weather prediction models. Each of them has merits and disadvantages in certain circumstances. 1.4.1 General circulation models The development of atmospheric general circulation models (AGCMs) started in the fifties by founding fathers like Philips, Charney, Smagorinsky and Manabe. Nowadays advanced GCMs are used by a large community for numerical weather prediction (NWP) and for studying fundamental processes in the global climate system. AGCMs also play an important role in providing factual information for policy decisions. The Intergovernmental Panel on Climate Change (IPCC), for example, depends largely on numerical simulations for predictions of future climate change.
11

Chapter 1
AGCMs are numerical representations of the internal state of the Earth’s atmosphere, which is described by the basic fluid mechanical equations of motion and of mass and energy conservation. AGCMs solve the full three-dimensional (3D) equations themselves to calculate the evolution of wind, temperature and pressure, contrary to chemistry transport models that use wind fields from NWP models as input. AGCMs often solve the basic equations in spectral space. After calculating the new state of the model by integrating the equations over one time step the variables are transformed back to grid point space where physical processes are evaluated. The finite size of the grid cells implies that the model does not explicitly resolve processes at the smallest scales. These so-called subgrid-scale processes need to be treated in a special way known as ‘parameterization’. Most AGCMs have their own set of parameterizations of physical processes such as turbulence, radiation, cumulus convection, planetary boundary layer processes, vertical diffusion and cloud microphysics. Some models also have chemistry modules attached to them in which real or artificial tracers and their sources and sinks can be evaluated. These chemistry routines allow for quantification of the effects of certain transport processes or chemical reactions on, for example, the ozone budget. They are especially useful for studies related to anthropogenic climate change and for studying trends in greenhouse gases or stratospheric ozone. Most AGCMs can be directly coupled to other components of the Earth system (ocean, biosphere, cryosphere, etc.) or function in ‘stand-alone mode’, where the interactions with the other components are specified at their boundaries. For example, stand-alone AGCMs use prescribed SSTs at their lower boundary. Such temperatures may either be climatological or actual. The difference between climate models and NWP models is that NWP models assimilate observations, whereas the meteorological state in climate models is solely determined by the model itself. Coupling an AGCM with actual archived meteorology from NWP models is called ‘nudging’ [Jeuken et al., 1996]. The strength of this coupling can be varied. The advantage of this relaxation technique is that model results can be directly compared with instantaneous chemical measurements rather than chemical climatologies. The disadvantage is that by relaxing the circulation calculated by the model to the somewhat different circulation of the NWP model, small imbalances are introduced. Even though the added relaxation is several orders of magnitude smaller than the other terms in the dynamical equations, it causes small inconsistencies in the mass balance and may affect convection. 1.4.2 Trajectory models Trajectory models can be used to follow the motion of air masses in three dimensions. By doing so the origin of interesting air masses can be determined (backward trajectories) as well as their fate (forward trajectories). A trajectory model uses wind fields (either analyses or forecasts) from a NWP model to compute the horizontal and vertical displacement of air parcels within a time step of the model. Usually interpolation in space and time is required to match the resolution of the input fields to the grid points and time step of the trajectory model. For different applications different types of trajectories can be used. Even for tracking air parcels the choice is not always evident: isobaric, isentropic, 3D, or isopycnic (constant density) trajectories. Differences between these are related to the choice of the vertical wind component. Vertical motions are not routinely observed but rather intrinsic products of NWP models. The isobaric, isentropic and isopycnic trajectories neglect vertical motions perpendicular to planes of constant pressure, potential temperature, and density respectively. Vertical motions are assumed to be adiabatic for isentropic trajectories, and explicitly
12

Introduction
accounted for in the 3D trajectories [Stohl and Seibert, 1998]. To find out which type of trajectory is most accurate for a certain application, assessment studies have been carried out using balloons, conserved meteorological quantities (PV, specific humidity or θ) and tracers (i.e. Saharan dust, radioactive emissions from Chernobyl, smoke from the Kuwait oil fires during the Gulf war). It has been found that for air mass tracking in the troposphere 3D trajectories are most accurate, whereas in the stratosphere isentropic trajectories may be of similar or better accuracy [Stohl and Seibert, 1998]. The trajectory model that is used in this thesis, the KNMI trajectory model TRAJKS, can calculate all of the above mentioned types of trajectories [Scheele et al., 1996]. For 3D trajectories the 3D displacement during time interval (t, t+dt) is computed with the iterative scheme after Petterssen [1940]:
Xn+1 = X0 + 1/2 [ v(X0, t) + v(Xn, t+dt)] dt Here X0 is the position vector of the parcel at time t, Xn is the nth iterative approximation of the position vector at time t+dt, where dt is the time step. v(X,t) is the 3D wind vector at position X and time t. The iteration stops when the horizontal distance between subsequent position vectors Xn and Xn+1 is less than 300 m and the relative (vertical) pressure difference is less than 1:10 000 [Scheele and Siegmund, 2001]. The model uses 6 hourly wind fields from the ECMWF, which were available at 50 hybrid sigma-pressure (σ-p) levels during INDOEX, and at 31 levels during the pre-INDOEX campaigns. A 1°x1° horizontal resolution is used. 1.5 Outline of the thesis The work in this thesis has been performed within the framework of INDOEX. The purpose of INDOEX was to study how anthropogenic emissions affect the chemistry of the tropical marine troposphere and how this in turn affects climate. This thesis focuses on the influence of transport processes on the chemical composition of the tropical troposphere. This is an important issue because an accurate simulation of the tropical tropospheric trace gas distribution is required for evaluating the climatic effects of future emissions. Model simulations of tropical tropospheric trace gas distributions are hampered by a lack of knowledge of a number of basic transport processes such as deep convection, stratosphere-troposphere exchange, and interhemispheric exchange across the ITCZ. The aim of the thesis can be summarized by the following questions:
1. What role do transport processes play in shaping the vertical O3 profiles over the Indian Ocean during the winter monsoon?
2. How do differences in climatological conditions affect these transport processes and in particular the exchange between the stratosphere and the troposphere?
3. How well do models simulate the transport processes that affect the tropical O3 profiles?
4. How much air is exchanged between the northern and southern hemisphere in a year?
13

Chapter 1
5. Where and how does interhemispheric exchange occur?
The main theme of this thesis can thus tentatively be summarized as follows:
stratosphere
SH
tropics
NH
How do transport processes between the three reservoirs, the stratosphere and the NH and SH troposphere, affect the distribution of tropical tropospheric trace gases, in particular O3? The thesis consists of a collection of four papers (Chapters 2-5). The first two papers, published in the J. Geophys. Res. [Zachariasse et al., 2000, 2001], aim at understanding how measured trace gas distributions can be explained in terms of transport. In Chapter 2 vertical profiles of O3 and relative humidity (RH), measured during a pre-INDOEX campaign in 1998, are analyzed using the KNMI trajectory model and meteorological analyses from the ECMWF. It was found that STE plays an important role in the O3 budget over the Indian Ocean during the winter monsoon. The aim of Chapter 3 was to perform the same analysis for the 1999 INDOEX data as for the 1998 data. This was done to investigate how differences in climatological conditions, such as La Nina (1999) versus El Niño (1998) and the different phase of the Quasi-Biannual Oscillation (QBO), affect the O3 profiles, in particular stratospheric intrusions. It will be demonstrated that the tropospheric O3 budget over the Indian Ocean during the winter monsoon is during all investigated years strangely influenced by STE, even though they had widely different climatological regimes. In Chapter 4 the tropospheric O3 budget is further analyzed and evaluated with a chemistry-climate model. The measurements are from another pre-INDOEX campaign in 1995. The ECHAM4 model was nudged toward actual meteorological fields for comparison with the measurements. This enabled the analysis of the O3 profiles on a one-by-one basis. At the same time it allowed for a validation of the model. In addition to stratospheric influences, distinct signatures of convective outflow in the ITCZ were present in the upper troposphere (13-16 km). The model reproduced the large-scale advection processes and the associated tracer transport well. This yields confidence in the meteorological formulation of the ECHAM4 model. The chapter is based on a paper written together with Jos de Laat from the University of Utrecht (IMAU) [de Laat et al., 1999]. The parts of the paper dealing with CO and NOx have been omitted here, so that only those parts of the paper pertaining to the O3 distribution have been included. The simulations with the ECHAM4 chemistry GCM have been performed by Jos de Laat.
14

Introduction
Chapter 5 describes experiments with ECHAM4 designed to gain further understanding of interhemispheric transport. A tracer-based approach is used to study interhemispheric transport across the ITCZ as a function of space and time. It is demonstrated that convection is an important mechanism of interhemispheric transport. This chapter has been submitted to Tellus. The thesis concludes in Chapter 6 with answers to the questions posed above and an outlook to further research.
15

16

Influence of STE on tropospheric O3
2
Influence of stratosphere-troposphere exchange on tropospheric O3 over the tropical Indian Ocean during the winter monsoon∀
Ozone (O3) and relative humidity (RH) soundings, launched over the Indian Ocean during the 1998 winter monsoon (February-March), were analyzed. In the marine boundary layer (MBL), O3 mixing ratios were relatively low (10-20 ppbv) except close to the Indian subcontinent (40-50 ppbv) where profiles were strongly influenced by pollution. Sometimes, relatively low O3 levels were observed in the upper troposphere. These were associated with deep convection in regions where MBL O3 levels were also low. In the mid-troposphere (500-300 hPa,5.5-9 km), O3 maxima (60-90 ppbv) were often found with low RH. A remarkable new finding of this study is that in more than a third of the profiles, thin quasi-horizontal laminae with very high O3 mixing ratios (up to 120 ppbv) were observed just below the tropical tropopause (between 200-100 hPa, 12-16 km). Back trajectory analyses showed that these layers originated in the vicinity of the subtropical jet stream (STJ). It is hypothesized that stratosphere-troposphere exchange (STE) near the subtropical jet by either shear-induced differential advection or clear-air turbulence caused the mid-tropospheric maxima (STE followed by descent) and the upper-tropospheric laminae. Another new finding is that stratospheric intrusions were not only found near the STJ but also deep within the tropics. Given the thickness of the mid-tropospheric intrusions (typically 3-5 km) and the very high O3 mixing ratios of the upper-tropospheric laminae, it seems that STE plays an important role in the tropical tropospheric O3 budget, at least over the Indian Ocean during the winter monsoon.
∀ Published as : Zachariasse, M., P.F.J. van Velthoven, H.G.J. Smit, J. Lelieveld, T.K. Mandal, and H. Kelder, J. Geophys. Res., 105, 15.403-15.416, 2000.
17

Chapter 2
2.1 Introduction O3 plays a key role in controlling the chemistry and climate of the tropical troposphere. Since it absorbs ultraviolet solar radiation it is an important source for hydroxyl (OH) radicals. It is also an important greenhouse gas. Human activities increase the O3 concentration of the troposphere through emissions from fossil fuel combustion and biomass burning [Crutzen, 1979, 1985; Logan et al., 1981]. This will especially be the case in the future in the tropics where the economic activity is growing strongly with possible strong impact on chemistry and climate [IPCC, 1995, p.109]. Simulations of the tropical tropospheric O3 distribution are hampered by a lack of knowledge of basic transport processes such as deep convection, stratosphere-troposphere exchange (STE), and long-range transport from the source regions. The aim of this chapter is to study how transport processes affect the tropospheric O3 distribution over the Indian Ocean. An important factor in transport studies is the lifetime of O3. O3 is photodissociated by short-wave solar radiation (<340 nm) into electronically excited O(1D) atoms. Reaction of these with water vapor forms OH radicals. Thus the lifetime of O3 is basically determined by the amount of water vapor and solar radiation. The lifetime of O3 increases from 2-5 days in the moist tropical marine boundary layer (MBL) to approximately 90 days in the free troposphere [Fishman et al., 1991]. Thus, once O3 is lifted from the boundary layer, it can be transported far away from its source regions. The tropical continental boundary layer (CBL) is an important source region of photochemically produced O3. Biomass burning and fossil fuel combustion generate carbon monoxide (CO), methane (CH4), and non-methane hydrocarbons. In a nitrogenoxides (NOx)-rich environment the oxidation of these compounds produces O3 [Crutzen, 1974; Chameides, 1978; Fishman et al., 1979; Crutzen et al., 1979, 1985; Logan et al., 1981; Greenberg et al., 1984; Koppmann et al., 1997; Chatfield et al., 1998]. Once it is vented from the CBL, this O3 can be transported over large distances, as is shown by satellite and sounding measurements [Krishnamurti et al., 1993; Fishman et al., 1990, 1991; Piotrowicz et al., 1989; Baldy et al., 1996; de Laat et al., 1999; Thompson et al., 1996; Chatfield et al., 1998; Taupin et al., 1999]. The tropical MBL, on the other hand, is a sink region for O3. Kley et al. [1996] have measured very low O3 mixing ratios over the equatorial Pacific, both in the MBL and in the upper troposphere. Lifting of O3-poor MBL air, with additional O3 depletion that may occur in clouds, may have caused these minima [Kley et al., 1996]. Similar minima have been found over the Indian Ocean due to lifting of O3-poor MBL air by convective cells of the ITCZ [de Laat et al., 1999; Taupin et al. 1999]. Another important source of O3 in the tropics is lightning. Since lightning produces a NOx-rich environment in the atmosphere, O3 production can occur [Pickering et al., 1991; Price and Rind, 1994]. Lightning activity is mainly concentrated over the summer hemisphere landmasses in the tropics [Price and Rind, 1994]. Some photochemical ozone production also takes place in the tropical uppermost troposphere [Folkins et al., 1999]. The stratosphere is a third source region through STE by, for example, tropopause folds [Shapiro, 1980]. Exchange can also occur due to filamentation around the subtropical jet (STJ) [Appenzeller et al., 1996; Appenzeller and Holton, 1997]. Shear-induced differential advection can cause tracer surfaces to stretch which leads to quasi-horizontal laminae-like tracer structures [see Figure 1 of Appenzeller and Holton, 1997; Ambaum, 1997]. The mechanisms causing a tropopause fold and filamentation are, in principle, the same. The reason that a distinction is made between the two STE
18

Influence of STE on tropospheric O3
exchange mechanisms is because in foldings vertical tilting is important, whereas for the filaments stretching is more important so that they stay close to the tropopause. The mechanism described as filamentation is quasi-horizontal, chaotic mixing on a potential temperature (θ) surface, which, in principle, conserves both θ and PV. Lastly, vertical shear in the strong shear zone near the STJ, by exceeding the Richardson number, can lead to clear-air turbulence (CAT), which is the third mechanism that is distinguished [Pepler et al., 1998; Shapiro, 1978; Kennedy and Shapiro, 1980]. The transport into the tropics is again differential advection. STE is so far believed to play only a minor role in the tropical tropospheric O3 budget [Holton and Lelieveld, 1996]. However, stratospheric intrusions have been found near the edges of the tropics, associated with tropopause folds in the vicinity of the STJ [Fabian and Pruchniewicz, 1977; Randriambelo et al., 1999; Baray et al., 1998]. Apart from the studies from PEM-West and MOZAIC [Newell et al., 1996, 1999; Browell et al., 1996; Wu et al., 1997] and PEM-Tropics [Fenn et al., 1999], other studies also indicated stratospheric influences in the tropical troposphere [Krishnamurti et al., 1993; Kley et al., 1996; Cammas et al., 1998; Taupin et al., 1999]. Taupin et al. [1999] found stratospheric intrusions into the upper troposphere near the edge of the tropics over the southern Indian Ocean during March and the austral winter (JJA). How far such stratospheric influences extend in the deep tropics needs to be studied in more detail. To study the influence of transport on tropical tropospheric O3 profiles, we analyzed O3 and relative humidity (RH) profiles from the 1998 Indian Ocean Experiment First Field Phase (INDOEX FFP). To analyze air mass origins we used back trajectories and meteorological data from the ECMWF. 2.2 Measurements During February-March 1998 fourteen O3- and radiosondes were launched from the Indian research vessel ‘Sagar Kanya’ over an extensive area of the Indian Ocean. A preliminary overview of the data is given by Mandal et al. [1999]. The ship track and location of the soundings are shown in Figure 2.1. The date and location of each sounding is presented in Table 2.1.
Figure 2.1. Ship track with the positions of the O3 soundings. The first and last soundings were launched on February 23 and March 28, 1998, respectively.
19

Chapter 2
The sondes that were used are balloon-borne ECC (Electrochemical Concentration Cell) O3 sondes (Model 1z, En-Sci Corp., Boulder, Colorado) coupled to Väisälä radiosondes (Model RS80-15 H, Väisälä Finland). The uncertainties in the temperature and pressure measurements below 20 km are ± 0.3ºC and ± 0.5 hPa respectively. The accuracy of the humidity sensor (HUMICAP-H) varies from ± 2% near the surface to ± 15-30% between 5-15 km altitude [Kley et al., 1997]. Above 15 km altitude the performance of the sensor is not reliable anymore [Kley et al., 1997]. The accuracy of the O3 sensor varies from ± 1-2 ppbv below 5 km to ± 5 ppbv at 10 km and ± 20 ppbv at 20-km altitude [Smit et al., 1994, 1998]. Profiles are categorized according to their distance from the ITCZ (Table 2.1). The ITCZ position is estimated from the ECMWF vertical wind analyses at 500 hPa at a 1ºx1º horizontal resolution. The latitude range given for the ITCZ reflects its width and not the uncertainty in its determination. The categories are:
I) Far from the ITCZ (10º or more) II) Just north of the ITCZ (approximately 2-5º) III) Just south of the ITCZ (approximately 2-5º) IV) In or close to the ITCZ (within 1º)
Sounding Date (1998) Latitude Longitude ITCZ Category 1 February 23 8.0ºN 74.0ºE 3º-6ºS I 2 March 2 0.2ºS 73.5ºE 2º-5ºS II 3 March 4 4.3ºS 70.2ºE 8º-12ºS II 4 March 6 8.1ºS 67.3ºE 12º-17ºS II 5 March 8 11.1ºS 64.5ºE 12º-15ºS IV 6 March 10 16.1ºS 61.0ºE 12º-14ºS III 7 March 13 20.1ºS 57.3ºE 6º-8ºS I 8 March 18 12.4ºS 62.5ºE 4º-8ºS III 9 March 19 11.0ºS 63.3ºE 2º-7ºS III
10 March 20 7.1ºS 65.2ºE 3º-10ºS IV 11 March 22 3.0ºS 67.3ºE 5ºS-2ºN IV 12 March 24 2.4ºN 68.5ºE 2º-10ºS II 13 March 27 11.4ºN 68.8ºE 0º-5ºS I 14 March 28 14.1ºN 68.3ºE 0º-9ºS I
Table 2.1. Locations and dates of the soundings. The soundings were launched either at the beginning of the afternoon or in the evening (local time). Also indicated is the position of the ITCZ and the different categories.
2.3 Trajectory model Trajectories were calculated with the KNMI trajectory model, TRAJKS [Scheele et al., 1996]. The model uses ECMWF 6-hour forecast wind fields to calculate the displacement of an air parcel over a 1-hour model time step. Forecast data is used instead of analyzed data in order to rule out
20

Influence of STE on tropospheric O3
imbalances due to data assimilation in the model analyses. The data is available at 31 hybrid σ-p model levels at a 1ºx1º horizontal resolution. For more details we refer to the User Guide to ECMWF Products 2.1 [1995, available from ECMWF]. For all calculations clustered 5-day backward kinematic trajectories are applied. Trajectories start from 8 corners and 19 midpoints of the edges of a 3D box around the air mass of interest. The length, width and height of the box are 1°, 1° and 40-80 hPa respectively. To illustrate, say that a profile shows an O3-rich layer of thickness dp (with the boundaries also within the layer) at pressure p, latitude y and longitude x: p
(x,y,p)dp = 40-80 hPa
1˚ ˚
y The box surrounding this layer, from which the cluster of trajectories is calculate0.5°, x+0.5°>, <y-0.5°, y+0.5°>, <p-½dp, p+½dp>. This cluster technique gives areliability of the trajectories. It cannot be excluded that the ECMWF analyses are inaccurate. The tropics is aespecially over the oceans, where the dynamics calculations are difficult due toscale dynamical balance (such as the geostrophic balance for the extratropicECMWF data postprocessing, as well as conversion from spherical harmonics space, can also introduce errors. Nevertheless, the ECMWF provides one of tfinest resolution analyses available. In this study the resolution of the data is simodel. At this resolution, the model resolves the larger convective cells of theprobably underestimates the vertical motions herein. Subgrid-scale convection isthe actual path of an air parcel becomes unreliable if the trajectory passes througThis becomes important close to the ITCZ since individual turrets in the ITCZ amodel resolution. NOAA infrared satellite images coincident with the trajectory to rule out the influence of convection as much as possible. 2.4 Analyses and discussion of the O3 profiles 2.4.1 Description of the profiles Figure 2.2 shows the categorized profiles. In general, the profiles consist characterized by distinct maxima and minima. Interesting features are: very dry m
x
1
d, extends from <x-n impression of the
data-sparse region, a lack of a large-
s) [Heckley, 1985]. space to grid point he best quality and milar to that of the ITCZ, although it not captured. Thus h a convective area. re smaller than the
locations were used
of multiple layers id-tropospheric O3
21

Chapter 2
maxima (profiles 6, 7 and 12), upper-tropospheric O3-rich laminae (profiles 10-14) and upper-tropospheric O3 minima (e.g. in profiles 6 and 12).
Figure 2.2. O3, relative humidity (RH), and temperature profiles. Solid lines: O3 (in ppbv), dotted lines: RH (in %), dashed lines: temperature (in K) offset by 170 K to fit into the plot. The horizontal axis runs from 0 to 150 (units: ppbv, %, and K). The vertical axis denotes the pressure from 1010 to 50 hPa. The profiles are classified into four categories depending upon their position relative to the ITCZ: (I) far from the ITCZ, (II) just north of the ITCZ, (III) just south of the ITCZ, (IV) in the ITCZ. The tropopause is indicated by the temperature minimum.
In profiles just north of the ITCZ, the lower troposphere has a layered structure superimposed on a 20-ppbv O3 background. O3 and RH are strongly anti-correlated. These layers are similar to those
22

Influence of STE on tropospheric O3
found in the MOZAIC and PEM datasets [Newell et al., 1996, 1999; Browell et al., 1996]. The average altitude of these layers was 5-6 km, whereas in this study layers were found from just above the MBL to 7-8 km. The layer thickness is similar (about 1 km). The MBL O3 mixing ratios are generally low (10-20 ppbv), although slightly higher than those observed in 1995 [de Laat et al., 1999]. Values as low as those over the equatorial Pacific [Kley et al., 1996] are not observed here. MBL mixing ratios are enhanced to 40-50 ppbv close to India (profiles 1, 13 and 14). Trajectory analysis (for example Figure 2.3a) shows that these elevated O3 mixing ratios are due to photochemical O3 production from Indian pollution outflow. A second outflow layer (800-900 hPa) overlies the MBL as shown by the trajectories of profile 13 in Figure 2.3b. The O3 mixing ratios in this layer are even higher (70 ppbv) due to the longer lifetime of O3 once it is in the free troposphere. The ‘background’ free tropospheric O3 mixing ratios are highest in the profiles close to the Indian subcontinent (50-80 ppbv). This is consistent with previous studies, which showed that the free troposphere can be influenced by CBL pollution as a result of deep convective mixing [Thompson et al., 1996; Baldy et al., 1996; Randriambelo et al., 1999; Taupin et al., 1999; De Laat et al., 1999]. The lowest MBL O3 mixing ratios appear in the profiles just south of the ITCZ and in the ITCZ itself, reaching near-zero levels in profiles 4 and 8.
a
b
Figure 2.3. Five-day back trajectories from the MBL and just above the MBL of profile 13. The back trajectories start on March 27 at the following levels: (a) 920, 940, 960 hPa (in the MBL), and (b) 800, 820, 840, 860, 880 hPa (just above the MBL). The vertical bar denotes the height of the trajectories in terms of pressure.
23

Chapter 2
2.4.2 Dry, mid-tropospheric O3 maxima The mid-tropospheric maxima in the profiles close to or in the ITCZ (5, 10 and 11) are a result of convective activity. The lifetime of O3 is short in the MBL. Convection vents O3-poor air from the MBL to the upper troposphere [Lelieveld and Crutzen, 1994; Roelofs et al., 1997; Smit et al., 1991]. This O3-poor air at upper levels is only slowly mixed back to lower levels by subsidence in the cloud-free part of the ITCZ. At mid-tropospheric levels, the convective detrainment is often small. Thus O3-poor air can develop in the upper troposphere and in the MBL, while the middle troposphere remains relatively unaffected. This results in a relative O3 maximum in the middle troposphere. The maxima in profiles 6, 7 and 12, which were released outside the ITCZ, have a different origin. These O3 maxima are superimposed on background values of 20 ppbv and are extremely dry (RH < 5 %). This dryness is also found in the ECMWF specific humidity analyses, of which a representative example is shown in Figure 2.4 for profile 6. The dry layer is part of a synoptic structure that slopes upward toward the STJ. The specific humidity analyses for profiles 7 and 12 are similar, with a dry layer at the location of the mid-tropospheric maximum. The fact that the model simulates a layer similar to that measured lends extra confidence to the back trajectory analyses, which are based on wind fields from this model.
Figure 2.4. ECMWF specific humidity cross section (in g/kg) for profile 6 on March 10, 0600 UTC at 61°E. The location of the profile is indicated by the vertical line.
The combination of high O3 and low RH points to either a stratospheric origin or to convectively lifted CBL air that has subsided. Back trajectories show that the air masses in the maxima in profiles 6 and 7 (Figures 2.5a-c) originated from the upper troposphere at 30-40ºS. Those for profile 12 originated from 20-30ºN. These are exactly the locations of the STJ according to the horizontal wind analyses at 200 hPa (for example Figure 2.6). A large vertical and horizontal shear zone surrounds
24

Influence of STE on tropospheric O3
this STJ, thus creating a favored region for STE. Therefore, the maxima are most likely due to STE near the STJ. The influence of convective lifting of CBL air over India in profile 12 was ruled out by comparison with NOAA IR satellite pictures. These showed no convective events during the period that the trajectories passed over India. India was still in the dry monsoon during that period and large-scale subsidence prevailed. The extreme dryness of the layer in profile 6 makes it highly unlikely that this air mass comes from the polluted CBL. As described in the introduction, the STE can be induced by tropopause folds, shear-induced filament stripping from the STJ, or CAT followed by shear-induced differential advection. No evidence of tropopause folds was found in the ECMWF data in the sense of a deep vertically inclined frontal layer with high O3 and PV and low RH. The explanation for the O3 maxima is therefore probably one of the latter two STE mechanisms.
a
b
c
Figure 2.5. Five-day back trajectories from the O3 maxima of profiles 6, 7, and 12. The back trajectories start on the following days and levels: (a) March 10 (profile 6) at 360-480 hPa at 20 hPa intervals, (b) March 13 (profile 7) at 380-460 hPa at 20 hPa intervals, and (c) March 24 (profile 12) at 410-490 hPa at 20 hPa intervals.
25

Chapter 2
During anticyclonic descent towards the deep tropics the RH decreases. During this descent the air has most likely mixed with tropospheric air since the O3 values in the maximum are not purely stratospheric (70-90 ppbv compared to lower stratospheric values typically above 100 ppbv). A stratospheric PV signature along the trajectory could not be found for these O3 maxima.
Figure 2.6. ECMWF horizontal wind and wind speed on March 10 (profile 6) at 200 hPa. The NH STJ is stronger than the SH STJ.
In profiles 6 and 12, O3 minima, with mixing ratios similar to near-surface values, overlie the mid-tropospheric maxima. Back trajectories from profile 6 (Figure 2.7) indicate that these air masses were lifted from the O3-poor MBL. The ECMWF horizontal wind analysis (not shown) indicates that this vertical transport is caused by a cyclone-like perturbation, which involves rapid upward transport due to latent heat release. De Laat et al. [1999] show that these kind of upward motions are resolved (but probably underestimated) by the ECMWF data.
Figure 2.7. Five-day back trajectories from the upper-tropospheric O3 minimum of profile 6. The back trajectories start on March 10 at 160, 180, 200, 220, and 240 hPa.
26

Influence of STE on tropospheric O3
2.4.3 Upper-tropospheric O3 laminae Trajectory analyses (of which a representative example is shown for profile 12 in Figure 2.8) indicate that most laminae originate near the STJ. After spending some time near the STJ, the trajectories curve anticyclonically toward the equator. Similar to the mid-tropospheric maxima, it is therefore expected that the O3-rich laminae are the result of STE around the STJ.
Figure 2.8. Five-day back trajectories from the upper-tropospheric O3 laminae of profile 12. The back trajectories start on March 24 from 100-160 hPa at 10 hPa intervals.
The analysis of the potential temperature along one of the trajectories of Figure 2.8 (at 110 hPa) corroborates the hypothesis of a stratospheric origin of these laminae (Figure 2.9). Since the tropical tropopause more or less coincides with the 380 K surface, the analysis shows that θ overshoots the tropopause value during the first few days. It must be kept in mind, however, that the ECMWF vertical velocity field may have errors, which influence the θ-evolution along the trajectory. Although the absolute change in θ (>10K in <10 hours) is rather large, there is some confidence in the general trend of θ to decline over several days. Part of the temporal variations in θ is due to vertical interpolation errors of θ to the trajectory position.
Figure 2.9. Evolution of θ along a trajectory from the cluster of profile 12 starting in a layer at 100 hPa. Time equal to 0 is the starting point of the trajectory (March 24), and time equal to –120 is the endpoint of the trajectory (March 19).
27

Chapter 2
Another indication of a stratospheric origin of the laminae of profile 12 is found in the PV map at 100 hPa (Figure 2.10a). A patch of typically stratospheric PV values is shown near the measurement site (the tropopause is defined by the 1-2 PVU contour). Laminae with stratospheric PV (and O3) values appear to be stripped off the STJ (indicated also by following the filament a few days back, not shown) and transported anticyclonically along the trajectory paths over Sri Lanka and S-India to the measurement location. This stripping followed by transport toward the deep tropics is also observed in PV maps pertaining to other laminae. An example is profile 7. Although not as pronounced as in the other profiles, a layer with elevated O3 mixing ratios (70 ppbv) is observed between 100-150 hPa. The corresponding PV map at 100 hPa (Figure 2.10b) shows a strongly meandering STJ. This meandering is accompanied by laminae stripping, evidenced by several tongues of stratospheric PV values (1.5-2 PVU) penetrating into the deep tropics and to the measurement site. Comparing the O3 mixing ratios in laminae in the deep tropics to those close to the STJ, it seems that during transport mixing was not as important as for the mid-tropospheric O3 maxima. The layers can probably retain their identity for a long time because photochemical O3 destruction is small in the dry upper troposphere and there may even be some O3 production. In view of the evidence for STE presented above it is not likely that local production plays a major role in causing these layers.
a
b
Figure 2.10. ECMWF potential vorticity (in 0.1 PVU. 1 PVU = 10-6m2 K kg-1 s-1) at 100 hPa. The location of the profiles is given by a symbol. (a) March 24, 0600 UTC (profile 12 – 2.4°N/68.5°E), and (b) March 13, 1200 UTC (profile 7 – 20.1°S/57.3°E).
28

Influence of STE on tropospheric O3
Another explanation for O3-rich laminae might have been transport from the polluted CBL. However, it is most unlikely that low-level pollution creates stable layers with O3 mixing ratios up to 120 ppbv in the upper troposphere. None of the trajectories showed any indication of recent contact with the polluted CBL, since the entire cluster originates from the region of the STJ. The cluster remains in the upper troposphere during the 5-day period. Moreover, NOAA IR satellite pictures showed no convective events during the period that the trajectories passed over source regions such as India. This points to a stratospheric rather than a continental origin of the laminae. Only a few of the trajectories from the laminae do not originate near the STJ. Instead, these seem to originate from the ITCZ. Yet also for these layers there are indications in the PV maps (not shown) that the air masses originate, at least partly, from the stratosphere. 2.5 Conclusions and discussion The picture that emerges from the analysis presented above is that O3 profiles over the Indian Ocean are often comprised of several distinct air masses that cause alternating maxima, minima and laminae in O3. The observed profiles display the following features:
1. MBL mixing ratios are enhanced to 40-50 ppbv close to India due to outflow of pollution from the continent.
2. MBL mixing ratios away from the Asian continent are relatively low (10-20 ppbv) consistent with efficient photochemical O3 destruction. Convective lifting from the MBL can cause upper-tropospheric O3 minima.
3. Elevated O3 mixing ratios (50-80 ppbv) above the MBL originating from low-level outflow of polluted air from the Asian continent.
4. Very dry mid-tropospheric maxima (60-90 ppbv) in the middle troposphere. Evidence has been presented that this air most likely has a stratospheric origin.
5. High to very high O3 mixing ratios (up to 120 ppbv) in laminae just below the tropopause. Also for these layers evidence has been presented of a stratospheric origin, with the STJ playing a central role in the exchange mechanism.
Stratospheric inputs have also been found in the tropics by Newell et al. [1996, 1999], Browell et al. [1996], Wu et al. [1997] and Fenn et al. [1999], but the repeated presence of stratospheric laminae just below the tropopause is a remarkable new finding of this study. Similar laminae are present in profiles over the central Pacific [Kley et al., 1996] but they were not discussed by the authors. The laminae appear in more than a third of the profiles. Back trajectory analyses have shown that the laminae originate from the vicinity of the STJ. It is hypothesized that the STJ plays a central role in this STE mechanism either directly shear-induced differential advection, which causes filamentation, or by CAT followed by differential advection. In principle, tropopause folds could also play a role but no evidence for these was found in the ECMWF data. Although the ECMWF data have a limited vertical and horizontal resolution, observed tropopause folds are often well captured by the ECMWF model. We therefore believe it is more likely that STE has taken place due
29

Chapter 2
to either shear-induced differential advection possibly preceded by CAT. ECMWF PV maps illustrate the stripping of laminae from the STJ in several cases. However, stratospheric PV signatures along the trajectories were not always found. This does not necessarily imply that the air can not be of stratospheric origin. There can be other reasons for a lack of conservation of a PV signal along the trajectory. If stratospheric air is mixed into the troposphere by CAT, then a pronounced PV signal would be lacking. Furthermore, even if the trajectory is perfect, one should realize that the PV is a gridbox value. Thus even if high PV laminae are present in the gridbox the PV signal will probably be suppressed by gridbox averaging. Another reason could be that during transport the PV signature disappears rapidly due to absorption of solar radiation. In this case the chemical signature would remain unaffected. This may be especially important for thin layers in the tropics. Only a few of the laminae do not seem to originate from the STJ but rather from the ITCZ. Yet also for these layers there are indications of a stratospheric origin in the PV maps. This implies that either the trajectories are wrong, which is likely near convection, or the exchange mechanism involves the ITCZ rather than the STJ. Overshooting clouds in the ITCZ can entrain stratospheric air into the turret [Danielsen, 1982]. Radiative and evaporative cooling cause the mixed air mass to sink back to the troposphere. Overshooting clouds also generate buoyancy waves in regions around the ITCZ [Potter and Holton, 1995; Danielsen et al., 1993]. These can cause STE, although this does not explain the observed horizontal orientation of the laminae. Finally, O3 production due to lightning associated with deep convection may also play a role. Further analyses will be needed in the future. The results in this study do not point to preferred latitudes for these stratospherically influenced layers. Rather, upper-tropospheric laminae can be transported quasi-horizontally quite far away from the STJ and into the deep tropics. To our knowledge, stratospheric influences in the form of thin layers with high O3 concentrations close to the tropical tropopause have not been discussed in the literature before. The O3 mixing ratios in the laminae close to the equator were as high as those close to the STJ, suggesting that mixing is not as important as for the mid-tropospheric O3 maxima, in which mixing ratios were lower than those of the upper-tropospheric laminae. Probably the mid-tropospheric maxima undergo stronger influences from convection and turbulence. Future work should concentrate on the frequency and distribution of these intrusions into the tropical troposphere and on aspects such as seasonal variability and interannual variability. Statistical analysis and chemistry-transport simulations should be performed in order to estimate the magnitude of the contribution of these intrusions to the total tropospheric O3 budget in the tropics.
30

31

32

Cross-tropopause and interhemispheric transports
3
Cross-tropopause and interhemispheric transports into the tropical free troposphere over the Indian Ocean∞
O3 and RH profiles over the Indian Ocean, obtained during the 1999 Indian Ocean Experiment, were analyzed. Upper-tropospheric O3 mixing ratios were generally very high (varying from 100 ppbv up to 150 ppbv at the (upper) tropopause). Maxima were observed as laminae (between 14-16 km) and as O3-rich layers between the chemopause in O3 and the tropopause (between 15-18 km), resembling a transition zone between tropospheric and stratospheric O3 mixing ratios. Very dry, O3-rich air is observed in the mid-troposphere (between 5-8 km). The 1999 laminae are similar to those observed in 1998 in a pre-INDOEX campaign, although they appear older. This complicates the attribution of an origin but there are indications, i.e., by back trajectory analyses, that the air in all these O3 maxima originates in the STJ. This is a favored region for STE. A new feature is that the transition zone is supplied with air from both the northern and the southern STJ. A pair of anticyclones located over the W-Pacific/Australia directs this interhemispheric transport (IHT). IHT also occurs in the mid-troposphere where a flow channel along the east coast of Africa connects the upper troposphere of both hemispheres. Although our analysis, involving the O3 profiles, trajectories, and ECMWF model data, supports the idea that all O3 maxima have sources similar to 1998, the upper-tropospheric flow is anomalously easterly in 1999. This is probably associated with the La Nina phase of the tropospheric quasi-biennial oscillation as opposed to the 1998 El Niño. Thus, although climatological conditions are very different, the tropospheric O3 budget over the Indian Ocean during the winter monsoon is still largely influenced by stratospheric intrusions.
∞ Published as: Zachariasse, M., H.G.J. Smit, P.F.J. van Velthoven, and H. Kelder, J. Geophys. Res., 106, 28.441-28.452, 2001.
33

Chapter 3
3.1 Introduction O3, RH, temperature and wind profiles were measured over the Indian Ocean during the 1999 winter monsoon (February-March) as part of INDOEX. INDOEX is a major international field experiment, primarily designed to investigate the role of natural and anthropogenic aerosols in the global energy balance [Crutzen and Ramanathan, 2001]. INDOEX also provided an opportunity to collect information on O3 and water vapor concentrations in the data-sparse tropics, one of the Earth’s regions most influenced by convection. Pre-INDOEX campaigns in 1998 and 1995 have shown large O3 variability over the Indian Ocean in the winter monsoon season [Zachariasse et al, 2000; de Laat et al., 1999]. Close to India O3 concentrations are enhanced due to pollution. Once in the marine boundary layer (MBL), O3 concentrations drop due to efficient O3 destruction. These O3-poor air masses were sometimes lifted to the upper troposphere by convection. In 1998, O3 maxima were often found in the middle and upper troposphere, the latter shaped as shallow layers (1-2 km), called laminae, with very high mixing ratios (up to 120 ppbv). The analyses showed strong indications that the O3 maxima originated from the stratosphere, with the STJ playing a central role in the exchange mechanism. It was hypothesized that STE near the STJ by either shear-induced differential advection (filament stripping from the STJ) or CAT, resulting from vertical wind shear instabilities, caused the mid-tropospheric maxima (STE followed by descent) and the upper-tropospheric laminae. These stratospheric intrusions were even found deep within the tropics. Similar filament stripping has also been observed near the polar vortex [Tuck et al., 1997], resulting in elongated layers extending over thousands of kilometers. The purpose of this chapter is to perform the same analyses as in 1998 and to investigate how differences in climatological conditions, such as La Nina (1999) versus El Niño (1998) and the different phases of the QBO, affect the O3 profiles (especially the laminae). This chapter concentrates on the mid- and upper troposphere. An elaborate description of the meteorological conditions during INDOEX is given by Verver et al. [2001]. Since O3 changes are most effective in forcing climate change when they occur in the upper troposphere/lower stratosphere region [Lacis et al., 1990], it is important to carefully document O3 behavior in those regions. A previous study by Tuck et al. [1997] showed that the tropical upper troposphere often contained mid-latitude stratospheric air masses resulting from isentropic transport. Other research on upper-tropospheric O3 concentrations in the tropics are, for example, studies by Newell et al. [1996, 1999], Browell et al. [1996], Wu et al. [1997], and Fenn et al. [1999]. Folkins et al. [1999] found that O3 mixing ratios usually start increasing toward stratospheric values already a few kilometres below the tropopause. According to Folkins et al. this is mainly due to slow upward ascent in this so-called transition zone, associated with radiative warming, together with in situ O3 production. In addition, they argue that some of the O3 originates from the stratosphere. It is interesting to see if this transition zone shows up in the 1999 profiles and if the same conclusions follow from the analyses in this chapter. Another topic that is relevant for the tropical tropospheric O3 distribution is transport from one hemisphere to the other. The transport across the equator of pollutants emitted by man mostly on the northern hemisphere continents mainly determines the concentrations of those pollutants in the southern hemisphere troposphere. Not much is known about the meteorological processes leading to interhemispheric exchange. A model intercomparison study [van Velthoven et al., 1997] focusing on aircraft emissions gave indications that pollutants emitted in the NH flight corridors preferably enter
34

Cross-tropopause and interhemispheric transports
the SH in the upper troposphere (above roughly 500 hPa). Since there are 61 profiles over an extensive area of the Indian Ocean (from 15ºS to 17ºN), it is interesting to investigate this interhemispheric exchange. The same analysis technique as in 1998 is applied. This means that meteorological data from the ECMWF model will be used, and back trajectories, based on data from the same model, will be calculated to determine the origin of the air masses. 3.2 Measurements From February 23 to March 30, 1999, 61 combined ozone- and radiosondes were launched from the NOAA research vessel ‘Ronald H. Brown’ over an extensive area of the Indian Ocean. Profiles were obtained twice a day from 15ºS near Mauritius to 17ºN in the southeastern Arabian Sea. The frequency of sampling increased when the ship approached the southwestern Bay of Bengal. An overview of the data will be given as a technical report by H.G.J. Smit et al. [manuscript in preparation, 2002]. The sondes used were balloon-borne Electrochemical Concentration Cell (ECC) ozone sondes (Model SPC-6A, Science Pump Corporation, New Jersey, United States) coupled to Väisälä radiosondes (Model RS80-15 H, Väisälä Finland). The accuracy of the ECC ozone sensor varies from ±1-2 ppbv below 5 km to ±5 ppbv at 10 km and ±20 ppbv at 20 km altitude [Smit et al., 1994, 1998]. The response time of the ozone sensor is within 25-30 s, which gives an altitude resolution of about 125-150 m for an average ascent velocity of about 5 m/s. The uncertainties in the temperature and pressure measurements below 20 km are ±0.3ºC and ±0.5 hPa, respectively. The accuracy error of the humidity sensor (HUMICAP-H) increases from ±2% near the surface to ±15-30% between 5-15 km altitude [Kley et al., 1997]. At low temperatures the response time of the sensor increases from about 200 s at -60ºC to 400 s at –70ºC [Antikainen et al., 1994]. Above 15 km altitude the performance of the sensor is not reliable anymore [Kley et al., 1997]. 3.3 Trajectory model Trajectories were calculated with the KNMI trajectory model, TRAJKS, as described in Chapter 2, section 2.3 and in Scheele et al. [1996]. The data are available at 50 hybrid σ-p model levels at a 1ºx1º horizontal resolution. For all calculations clustered 5 or 10-day (depending on whether the trajectories pass through convection) backward and forward kinematic trajectories were applied. A cluster consists of multiple trajectories starting from 8 corners and 19 midpoints of a three-dimensional (3D) box around the air mass of interest. The length and width of the box are 1°, and the height varies from 10-80 hPa (see Chapter 2, section 2.3 for more details). This cluster technique gives an impression of the accuracy of the trajectories related to spatial gradients in the wind. For two reasons a maximum of 10 days for trajectory calculations is chosen. First, in the tropics long calculations are not recommended due to a lack of a dynamical balance. This may create small imbalances in the analyzed wind fields, which grow substantially with time. Ten days is an upper limit as experience and testing has showed. Second, if STE had taken place more than 10 days prior to observation time, the dynamical, and perhaps even chemical, signatures would almost certainly have disappeared.
35

Chapter 3
Various steps in the trajectory calculations can produce errors. The largest error source is caused by the wind fields [Stohl, 1998]. It cannot be excluded that the ECMWF analyses are inaccurate, since the tropics, especially over the oceans, are a data-sparse region where the dynamics calculations are difficult due to the absence of a large-scale dynamical balance (such as the geostrophic balance for the extratropics) [Heckley, 1985]. ECMWF data postprocessing as well as conversion from spherical harmonics space to grid point space for trajectory calculations can also introduce some errors. Moreover, the vertical resolution of the used 50-layer model (20 hPa in the tropopause region) may also introduce difficulties when dealing with small-scale features. It is believed that the ECMWF provides the best quality and finest resolution analyses available. Comparison of ECMWF temperature profiles with temperatures from the soundings showed few deviations. Generally, tropopause heights, as determined by the temperature minimum, matched to within 5-10 hPa (although one should keep in mind the 20 hPa resolution of the ECMWF analyses), with no more than 2 K difference between tropopause temperatures from sondes and analyses. A study by Simmons et al. [1999] also illustrates a good mean fit of the recent operational ECMWF analyses to radiosonde temperatures at 100 hPa. In the same study the authors affirm that the humidity analyses contain some significant remaining flaws near the tropical tropopause but they appear realistic enough both in overall amount of water vapor and in its geographical and seasonal distributions. In addition, ECMWF analyses of cloud parameters and convection (total column water, convective precipitation, cloud cover) are compared to actual Meteosat5 satellite observations. Small-scale features were not represented by the coarser analyses but the main features were captured. These comparisons yielded confidence in the ECMWF analyses. Furthermore, the KNMI trajectory model has been intercompared with two other state-of-the-art trajectory models, and it has been found that all models agreed very well [Stohl et al., 2001]. In this study data with a resolution of 1ºx1º is used, which is similar to that of the model simulations. At this resolution the model resolves the larger convective cells of the ITCZ, although it probably underestimates the vertical motions therein. Smaller-scale convection is not captured. Thus the actual path of an air parcel becomes unreliable if the trajectory passes through a convective area. Close to the ITCZ this becomes important since many turrets in the ITCZ are smaller than the model resolution. Meteosat5 satellite images provided a useful tool to determine when trajectories passed through convection. Animations were made consisting of hourly plots of a combination of trajectories plotted over these images with the location of the trajectory at that time highlighted. The height of the trajectory was indicated by interpolating ECMWF temperature analyses to the trajectory latitude/longitude and pressure. At the same time, brightness temperatures of the satellite images were calculated to indicate the height of the clouds. From the temperatures of the trajectory and the corresponding satellite image it can be determined whether the trajectory is at that point in space and time below, in or above the clouds and convection. This has proven to be a useful tool in determining the reliability of a trajectory. Once it passes through clouds, the trajectory was not used in the analyses for earlier times. 3.4 Results Before discussing the O3 maxima of the profiles measured during INDOEX, the description of a reference O3 profile merits some attention. It is rather difficult to define such a profile for the tropics since vigorous localized dynamics and active chemistry interplay in a complex manner to form a
36

Cross-tropopause and interhemispheric transports
profile. However, when studying tropical profiles over the Indian Ocean during pre-INDOEX campaigns in 1995 and 1998 and over Atlantic Oceans [Smit et al., 1989], the following rough description of a “background” or reference profile over the tropical ocean can be obtained. It must be kept in mind that profiles over land can differ quite substantially. At the surface, background O3 concentrations are usually low (less than 10-20 ppbv) due to efficient photochemical destruction during long-range transport from sources. Background concentrations in the free troposphere increase up to 40-50 ppbv, depending on the amount of vertical mixing. Toward the tropopause these concentrations increase up to 70-80 ppbv in absence of active recent transport from the stratosphere. In the light of this description O3 deviations in the INDOEX 1999 profiles will be described. It must be kept in mind that the influence of dynamics on the O3 profiles is studied so the differences between the slopes of the reference profile and individual measured profiles are interesting.
Figure 3.1. O3 (solid line, in ppbv), RH (dashed line, in %), and temperature (dotted line, offset by 170K) profiles as examples of (a) upper-tropospheric laminae, (b) upper-tropospheric transition zones, and (c) mid-tropospheric maxima.The tropopause (T minimum) is indicated by the dotted line. The latitude/location and the date of each profile is: 2.5°S/66°E/February 26, 1999 (a); 0.2°S/73.7°E/March 22, 1999 (b); 7.5°N/69.6°E/March 6, 1999 (c).
Figure 3.1 shows three typical profiles. Nearly all of the 61 observed O3 profiles [H.G.J. Smit et al., manuscript in preparation, 2002] showed enhanced O3 mixing ratios in the upper troposphere. Sometimes these take the form of very thin layers at pressures between 110-160 hPa (14-16 km)
37

Chapter 3
with a typical thickness of 1-3 km and mixing ratios up to 120 ppbv (Figure 3.1a). The thin, O3-rich layers will be called laminae. Other profiles (Figure 3.1b) did not show this layered structure, but rather a steep increase toward the tropopause (defined as the minimum in temperature), which was typically found between 80-100 hPa (17-18 km). In most cases the O3 increase in these profiles was not smooth but occurred in a stepwise manner coincident with small irregularities in the temperature profile. Often a double tropopause was observed. O3 mixing ratios in these so-called transition zones (the region bounded by the double tropopause where there is a transition from tropospheric to stratospheric O3 values) increased up to over 150 ppbv at the (upper) tropopause level. Only a minor fraction of the profiles (<10%) showed a relatively O3-poor upper troposphere (approximately 70 ppbv or less) compared to the other profiles. The mid-troposphere also exhibits O3-enhanced layers (Figure 3.1c). In almost a third of the profiles a dry, mid-tropospheric O3 maximum is visible, with O3 mixing ratios varying between 60-100 ppbv and with RH sometimes as low as 10% or less. These layers are usually thicker than those in the upper troposphere, i.e., about 2-5 km. The origins and characteristics of all these O3-enhanced layers, both in the mid-troposphere as well as in the upper troposphere, will be investigated in the subsections below. The investigations will be based on trajectory calculations and ECMWF analyses. Throughout the discussion, the findings of this study are often compared to those of measurements from the 1998 pre-INDOEX campaign as described in Chapter 2. 3.4.1. Upper-tropospheric O3 laminae At first sight the laminae just below the tropopause are very similar (in thickness, height at which they occur, maximum concentrations, shape and meteorological location) to those found in 1998 (compare Figure 3.1a to Figure 2.2 in Chapter 2). They appear as distinct layers and are typically found between roughly 110-160 hPa, with high O3 mixing ratios indicating a stratospheric origin. Five-day backward trajectories from all laminae are presented in Figure 3.2, together with the trajectories from laminae from pre-INDOEX campaigns.
Figure 3.2. 5-day back trajectories from 3D-boxes surrounding all the O3 laminae of 1995 and 1998 (black) and 1999 (colored). The vertical bar indicates the pressures of the trajectories.
38

Cross-tropopause and interhemispheric transports
Contrary to the findings of 1998 (e.g., Figure 2.8 in Chapter 2), none of the trajectories for 1999 originate in or near the STJ (an example of the STJ is shown in Figure 3.6), where CAT or shear-induced differential advection could bring stratospheric air to the upper troposphere. In fact, while residing in the upper troposphere for a large part, almost all trajectories come from the Indonesia/New Guinea area and are transported by upper-tropospheric easterlies to the INDOEX domain. This is in sharp contrast to the eastward transport that usually occurred in the upper troposphere during February and March 1998 over the INDOEX area. Analysis of the difference in winds between 1999 and 1998 at 200 hPa in March (Figure 3.3) shows that during the entire 1999 INDOEX measurement period the flow in the upper troposphere is anomalously easterly compared to 1998, with wind speed anomalies of 5-10 m/s or more.
Figure 3.3 Wind and wind speed difference between March 1999 and March 1998 at 200 hPa from ECMWF analyses. The vertical bar denotes the wind speed.
The flow is not only anomalously easterly compared to 1998 but also in the climatological sense. When compared to the 10-year mean flow at 200 hPa from 1990-1999, anomalous easterlies prevail as well. This easterly flow in the upper troposphere is probably associated with the tropospheric quasi-biennial oscillation (QBO). It has long been observed that winds over the W-Pacific and eastern Indian Ocean change sign with a quasi-biennial period [Arkin, 1982: Gutzler and Harrison 1987; Yasunari, 1987, 1989; Ropelewski and Halpert, 1988]. The lower and upper troposphere are negatively correlated. This is consistent with the flow in March 1999 where anomalous westerlies prevail in the lower troposphere [Verver et al., 2001]. While the exact nature of the tropospheric QBO is uncertain, it seems to correlate quite well with the QBO mode of El Niño-Southern Oscillation (ENSO) indices [Barnett, 1991; Yasunari, 1987, 1989; Ropelewski et al., 1992; Kane, 1992]. For additional references see Trenberth [1975] and Kane [1992]. Observations [Arkin, 1982; Gutzler and Harrison, 1987] show that during La Nina the wind at 200 hPa is anomalously easterly while lower tropospheric winds are westerly. The same is observed during INDOEX, which corresponds well considering that 1999 was a La Nina year. The laminae are transported by the easterly winds from the convectively active area from Indonesia/New Guinea to the Indian Ocean, apparently without having been in contact with the STJ
39

Chapter 3
in either the NH or SH. However, the similarity of the laminae to those of 1998 suggests that the layers do eventually originate in the STJ but 5-day backward trajectories are too short. Unfortunately, longer backward trajectory calculations are not reliable since the trajectories pass through convection in 5 days. The following, however, supports the presumption of an origin from the STJ. First, a slight shift upward of say, 10-20 hPa, often showed trajectories typical for the laminae as seen in 1998 (for example those shown in section 3.4.2). Since this shift is of the order of the vertical resolution of the wind data, it is believed that these slightly higher trajectories might be representative for those from the laminae. Second, enhanced potential vorticity (PV) structures in the ECMWF PV maps are present at the locations of the laminae in some cases (see Chapter 2 for a more elaborate discussion on the use of PV maps to investigate stratospheric influences). Laminae with enhanced PV values appear to be stripped off the STJ although they are less pronounced than in 1998. This absence of a pronounced PV signature points toward older laminae in 1999 than in 1998. This is further supported by a lack of a dynamical signature (wind shear) of the laminae in the wind data of the profiles. Another indication that the upper-tropospheric O3 maxima (also those described in section 3.4.2) are of stratospheric origin is presented in Figure 3.4.
Figure 3.4. Equivalent potential temperature (θe in K) of the tropopause (vertical axis) versus that of the MBL (horizontal axis). Pluses indicate profiles with an O3-enhanced upper troposphere, and the squares indicate profiles with a not-so-enhanced upper troposphere. The 1:1 line is also shown.
This figure depicts the equivalent potential temperature (θe, [Reid and Gage, 1981]) of the MBL of all profiles plotted against the θe of the upper troposphere. Purely based on its moist static energy, an air parcel could not be lifted to a level beyond its equilibrium level (tropopause), which is based on its surface θe. This does not take into account overshooting of the tropopause level which occurs in the real tropical atmosphere [Selkirk, 1993]. A large positive deviation of the upper-tropospheric θe from that of the MBL points to a stratospheric influx [Reid and Gage, 1996]. Small positive differences can be caused by radiative heating in the upper troposphere (above roughly 150 hPa),
40

Cross-tropopause and interhemispheric transports
which is of the order of 0.2 K/day in the tropics [Folkins et al., 1999]. Figure 3.4 has been split into O3 enhanced layers (plusses) and profiles with less enhanced O3 (relative to the reference profile) in the upper troposphere (squares). The profiles with a large O3 enhancement in the upper troposphere exhibit the largest θe difference between the upper troposphere and the MBL. It is interesting to investigate the fate of the laminae. Ten-day forward trajectories (not shown) indicate that a large part of the air masses in the laminae is pulled into the STJ of either the NH or SH. The trajectories remain close together and follow the latitudinal meandering of the STJ (10-20º). There is no variation with latitude, that is trajectories starting close to the equator were just as likely to get pulled into the STJ as those from the edges of the tropics. In 10 days the air masses can be transported as far away as the E-Pacific or even the Caribbean by the strong westerlies of the STJ. 3.4.2 The upper troposphere in profiles with a double tropopause In almost a third of the profiles the height of the chemopause in O3 (steep increase of O3) and the lapse-rate tropopause do not match. The temperature profile in those cases shows two inversions (“double tropopause”) in the upper troposphere, one below and one above 100 hPa. The chemopause matches with the lower inversion, from here O3 increases to stratospheric mixing ratios at the upper tropopause. A clear maximum or minimum in the form of a thin layer is not present. Figure 3.5 depicts the 10-day backward trajectories from the transition zone.
Figure 3.5. Examples of 10-day back trajectories from 3D-boxes surrounding the upper-tropospheric O3-rich transition zones.
Apparently, in most cases the air between the temperature inversions consists of air masses coming from the STJ in the NH or SH, or even both. If transport from both STJs takes place then for all cases trajectories show that the upper part of the transition zone is fed by the northern STJ and the
41

Chapter 3
lower part is fed by the southern STJ. This transport from two regions about 50º apart with different tropopause temperatures could explain the existence of the double temperature inversion. Often a pronounced maximum in the wind shear coincides with the O3-rich transition zone, pointing to the relatively recent formation of the feature. In Figure 3.6 the ECMWF wind field at 200 hPa is presented for March 4.
Figure 3.6. ECMWF horizontal wind and wind speed at March 4, 1999, at 200 hPa. The vertical bar indicates the wind speed. The subtropical jet streams are indicated by the wind speed maxima (dark shading) in the NH and SH.
This wind field is representative for the other cases with a double tropopause where both STJs feed the transition zone. A pair of anticyclones, one over northern Australia and one just east of the Philippines, determines the inflow into the eastern Indian Ocean upper troposphere. These anticyclones transport air from the STJ, where STE can take place. The region in the eastern Indian Ocean where the air from both anticyclones converges seems a preferred region for interhemispheric mixing. A slight shift of the anticyclones and one or both of the branches will disappear. Even when one branch of the STJ disappears, there is still transport from two separate regions. This double branch transport contrasts with the trajectories from the laminae discussed in section 3.4.1, which only have a single branch. This may contribute to the different character of the upper-tropospheric laminae, especially since a double tropopause is present when transport from two separate regions takes place. Unfortunately, due to the problems with convection discussed in the previous section it cannot be stated without doubt what causes the difference in character between these laminae and those discussed in section 3.4.1 Despite the difference in character, it is believed that the underlying process of STE most likely is the same. Forward trajectories show that, similar to the laminae, a large part of the air in the transition zones is pulled back into the STJ, followed by eastward transport. Others show transport in the direction of Africa and the mid-Atlantic. There is no difference between trajectories started from the edges of the tropics and the deep tropics.
42

Cross-tropopause and interhemispheric transports
3.4.3 Dry, mid-tropospheric O3 maxima Profile 3.1c shows a layer of enhanced O3 with peak mixing ratios of almost 100 ppbv at 400-500 hPa. This type of O3 maximum is frequently observed in profiles over the Indian Ocean and coincides with a minimum in the RH. In Chapter 2 it has been shown that this combination of high O3 and low RH is due to STE in the upper troposphere near the STJ. The mechanism most likely is either shear-induced filament stripping from the STJ or CAT followed by shear-induced differential advection. Transport toward the mid-troposphere and the deep tropics is channeled by anticyclones. While descending, mixing with tropospheric air dilutes the O3-enriched air mass. As in 1998, most of the mid-tropospheric maxima originate in the upper troposphere near the STJ (Figure 3.7).
Figure 3.7. Examples of 10-day back trajectories starting from 1°x1° boxes surrounding the mid-tropospheric O3 maxima.
In the mid-troposphere (300 hPa and below) there is a transport belt from the vicinity of the northern STJ into the tropics (eastward from Saudi Arabia over the Arabian Sea to the west coast of India where it turns to the southwest). This belt transports O3-rich air from the upper troposphere over Arabia to the mid-troposphere of the deep tropics. This belt was also responsible for the 1998 mid-tropospheric maxima. This transport belt is not present at 200 hPa, the level previously discussed. For all maxima, ECMWF vertical RH cross sections (such as shown in Figure 3.8) depict the dry layers sloping upwards to the STJ region. This descending branch from the upper to the middle troposphere is part of a synoptic structure and explains the extremely low RH in the maxima. O3 mixing ratios are not entirely stratospheric (i.e., 100 ppbv or more), indicating that mixing along the way possibly plays a more important role for the mid-tropospheric maxima than for the upper-tropospheric laminae. Another interesting new feature, which was not present in the 1998 data, is that several of the trajectories show interhemispheric exchange in the upper to middle troposphere. Some trajectories,
43

Chapter 3
mainly from the higher-altitude maxima around 450-400 hPa, move from the STJ at roughly 35ºS to as far north as 10ºN. They remain in the upper troposphere for the largest part of this journey and descend to the mid-troposphere (approximately 400 hPa) only during the last few days. Some mid-tropospheric maxima are even fed by both the northern and the southern STJ (Figure 3.7). The interhemispheric flow regime from the SH to the NH along Madagascar and the east coast of Africa is quite pronounced on several days. From the ECMWF wind analyses at 200 hPa (Figure 3. 6) it can be seen that this flow regime is the result of anticyclonic motion between Madagascar and the east coast of Africa. This particular feature extended down below 300 hPa. This (transient) channel is very pronounced in 1999 and shows up in deviations of the 200-hPa wind from 1998 (Figure 3.3) and the 10-year mean 1990-1999.
Figure 3.8. ECMWF RH cross section (in %) for profile 3.1c on March 6, 1200 UTC at 70°E. The location of the profile is indicated by the vertical line at 7.5°N.
A minor fraction of the trajectories shown in Figure 3.7 originates from 600-900 hPa. These were released from the corners of the 3D box surrounding the maximum, thus being farthest away (in latitude/longitude/pressure) from the actual location of the maximum. Therefore they probably represent air just outside the maxima and not that part of the maxima comes from the CBL over or near E-Africa. Forward trajectories show that the maxima remained at mid-tropospheric levels. Some were transported eastward almost around the Earth back to the western Indian Ocean. The trajectories starting close to the equator are more likely to remain over the Indian Ocean/W-Pacific warm pool during the 10 days. 3.5 Conclusions and discussion It is remarkable that even if the climatological regime is so different between 1998 and 1999 (tropospheric QBO in the La Nina (1999) versus El Niño (1998) phase), the O3 profiles still show very similar characteristics. The repeated presence of stratospheric layers just below the tropopause appears to be a permanent feature. The general picture that emerges from the analyses is that the
44

Cross-tropopause and interhemispheric transports
extratropical stratosphere feeds O3 to the tropical mid-and upper troposphere from both the NH and SH. This process takes place over almost the entire north-south cross section of the Indian Ocean as sampled during the 1999 measurement phase. Interhemispheric transport occurs in preferred channels depending on the location of transient anticyclones and cyclones. These synoptic systems usually remain in the same region long enough to channel this interhemispheric flow for some time. This “transport by channels” concept is described by Verver et al. [2001]. Nearly all O3 profiles of the 1999 INDOEX campaign displayed an O3-enhanced upper troposphere, most often in the form of thin laminae just below the tropopause or in the form of an O3-rich layer in between a double temperature inversion (the chemopause in O3 is lower than the upper tropopause). This latter layer is consistent with the description of the upper troposphere in the tropics by Folkins et al. [1999]. These authors found that O3 mixing ratios usually start increasing toward stratospheric values a few kilometers below the tropopause. According to Folkins et al. this is mainly due to slow upward ascent in this so-called transition zone, associated with radiative warming, together with in-situ O3 production. In addition, they argue that some of the O3 originates from the stratosphere. The analyses presented here for 1999 and in Chapter 2 for 1998 indicate that STE plays a prominent role in the tropical upper troposphere. It is unlikely that the O3-rich layers are related to convective activity since the layers are directly below the tropopause, an altitude rarely reached by convection [Folkins et al., 1999]. Furthermore, the locations of the laminae are far away from the locations of the major areas of convection. With spatial scales of 80 km it is very unlikely that streamers that are related to convection could spread over such a large area of the Indian Ocean while remaining in the upper troposphere uninfluenced by anvil descent. Moreover, the layers seem to be fairly stable and spread over large distances while retaining (most of) their identity. It seems unlikely that such a continuous supply of stable, O3-rich layers is related to convection. The laminae just below the tropopause are very similar to those measured in 1998, with O3 mixing ratios indicating a stratospheric origin. The trajectories, on the other hand, are not similar. In 1999, they all originate from the convective area over Indonesia/New Guinea, apparently not from the STJ as in 1998. However, slightly higher trajectories, which passed over the convection, do come from the STJ. We believe these to be representative of the laminae since the vertical difference between the starting points from the trajectories in the laminae and the higher trajectories is on the order of the vertical resolution of the wind fields. PV maps also show enhanced filaments stripped from the STJ at the locations of the laminae. PV and θe sometimes took nearly stratospheric values. These PV signatures are less pronounced than in 1998, and stratospheric PV values were not found in all cases. This indicates that the laminae in 1999 are older than the 1998 laminae. Tuck et al. [1997] also found that the ECWMF analyses had difficulty in representing filaments correctly. During transport the PV signature disappears rapidly due to diabatic processes. If this is the case, the chemical signature remains unaffected. This may be especially important for thin layers in the tropics. Upper-tropospheric layers can probably preserve their chemical identity for a long time because photochemical O3 destruction is small in the dry upper troposphere and there may even be some O3 production. There can also be several reasons for a lack of conservation of a PV signal. If stratospheric air is mixed into the troposphere by CAT, then a pronounced PV signal would be lacking. Furthermore, even if the trajectory is perfect, one should realize that the PV is a grid box value. Thus, even if high PV laminae are present in the grid box the PV signal will probably be suppressed by grid box averaging.
45

Chapter 3
Although some trajectories and PV maps indicate air origins near the STJ, it cannot be excluded that convection or local photochemical O3 production might also play a role. It should be noted, however, that the O3 mixing ratios are too high to be caused by local production alone. For the same reason, we do not think that photochemically produced O3 from the polluted CBL can create the observed stable, O3-rich layers in the upper troposphere. In addition, the prevailing large-scale subsidence over India and SE-Asia associated with La Nina inhibited vigorous convective lifting. Forward trajectories demonstrated that a large part of the O3 intrusions is transported back to the STJ. Without mixing, this would imply that at least part of the O3 transport is reversible. Deformations of the STJ would regularly extend into the deep tropics and after some time are pulled back into the STJ. Part of the intrusions remains in the upper troposphere and part descends to the middle troposphere. However, during the time interval between leaving and re-entering the STJ exchange between the filament and the troposphere could occur due to turbulent mixing, differential radiative heating, or interaction with clouds. The relative importance of the reversible versus irreversible transports remains uncertain. Model studies, done with high-resolution regional meteorological models, could perhaps provide an estimate. Many cases of mid-tropospheric maxima were observed. In most cases the trajectories showed that the mid-tropospheric O3 maxima are supplied with air from the STJ. Usually, only one flow channel from the STJ is active, but in a few cases interhemispheric transport took place, and both the northern and the southern STJ supplied the air in the maxima. This sometimes also occurred in the upper troposphere, in which case the O3-rich layer is shaped as a transition zone instead of a lamina. The mid-tropospheric O3 maxima have lower O3 mixing ratios than the upper-tropospheric maxima, suggesting that dilution of stratospheric air is more important when descent to the mid-troposphere follows the STE near the STJ. The ECMWF model reproduced the dryness of the layers. Similar to the 1998 analyses, the dry layer is part of a synoptic structure that slopes upward toward the STJ again indicative of a stratospheric origin. This lends extra confidence to the back trajectory analyses, which are based on wind fields from this model. The O3 maxima might also have originated from the polluted CBL. However, this is contradicted by the trajectory analyses. Furthermore, convection was inhibited over India and SE-Asia, and the extreme dryness of the layers makes it highly unlikely that these air masses come from the polluted CBL. The tropical upper and middle troposphere is a location where many different air masses (from the troposphere and the stratosphere, from the NH and SH mid-latitudes and tropics) converge. The chemical consequences of this should be further explored. For example, simple box models of the tropical troposphere, such as the one presented by Prather and Jacob [1997] should include a stratospheric influx of trace gases to correctly represent the photochemistry of the upper-tropical troposphere.
46

47

48

Model evaluation of tropospheric O3
4
Tropospheric O3 distribution over the Indian Ocean during spring 1995 evaluated with a chemistry-climate model°
An analysis of tropospheric O3 over the Indian Ocean during spring 1995 is presented based on O3 soundings and results from the chemistry-general circulation model ECHAM (Hamburg climate model). The ECHAM model is nudged towards actual meteorology using ECMWF analyses, to enable a direct comparison between model results and in situ observations. The model simulates the general O3 tendencies as seen in the sonde observations. Tropospheric O3 profiles were characterized by low surface concentrations (< 10 ppbv), mid-tropospheric maxima (60-100 ppbv, between 700-250 hPa) and upper-tropospheric minima (< 20 ppbv, between 250-100 hPa). Large-scale upper-tropospheric O3 minima were caused by convective transport of O3-depleted boundary layer air in the Intertropical Convergence Zone (ITCZ). Similarly, an upper-tropospheric O3 minimum was caused by cyclone Marlene south of the ITCZ. The mid-tropospheric O3 maxima were caused by transport of polluted African air. The ECHAM model appears to overestimate surface O3 levels, and does not reproduce the diurnal variations very well This could be related to unaccounted multiphase O3 destruction mechanisms involving low level clouds and aerosols, and missing halogen chemistry.
° This chapter is based on: A.T.J. de Laat, M. Zachariasse, G.J. Roelofs, P. van Velthoven, R.R. Dickerson, K.P. Rhoads, S.J. Oltmans, and J. Lelieveld, J. Geophys. Res., 104, 13.881-13.893, 1999.
49

Chapter 4
4.1 Introduction During the NH winter large scale cooling of the Tibetan Plateau is associated with the development of a high-pressure area over the Asian continent. In the boundary layer northeasterly outflow from this high-pressure area transports polluted air masses from Asia to the Indian Ocean and further towards the ITCZ. The air masses can reach the central and south Indian Ocean, and the important question is to what extent the growing S-Asian pollutant emissions impact the composition of this relatively pristine atmosphere and the local radiation balance [Moorthy et al., 1997; Rhoads et al., 1997; Krishnamurti et al., 1997; Lal et al., 1998; Krishnamurti et al., 1998; Jayaraman et al., 1998]. During transport in the marine boundary layer south of India the air masses encounter different cloud regimes, from low-level stratus to shallow convection and, ultimately, the deep convective clouds of the ITCZ. These different cloud regimes likely affect the chemical composition of the air masses and vise versa. Furthermore, the deep convective clouds in the ITCZ may penetrate the tropopause and inject pollutants directly into the stratosphere. Stratospheric air can also enter the troposphere, for example, near the subtropical jet stream. This large variety of meteorological and chemical processes makes the Indian Ocean a complex and interesting region to study. Unfortunately, to date there have been few measurements of chemical species over the Indian Ocean [Savoie et al., 1987; Johnson et al., 1990; Chester et al., 1991; Baldy et al., 1996]. To investigate these processes over the Indian Ocean in more detail a major measurement campaign, the Indian Ocean Experiment (INDOEX), has taken place during the 1999 Indian winter monsoon. As a preparation to INDOEX several pre-INDOEX ship cruises have been carried out. In this paper some results from the pre-INDOEX cruise of the NOAA R/V Malcolm-Baldrige are discussed. This cruise took place from March 21 (Julian Day 80, JD 80) to April 22 (JD 112), 1995, when the ship sailed from Durban, South Africa (29.8°S, 26.1°E) to Colombo, Sri Lanka (6.7°N, 79.6°E). During this cruise, near-surface measurements of chemical species were made continuously and O3 sondes were launched approximately once per day. For a detailed discussion see Rhoads et al. [1997] and Dickerson et al. [1998] for the surface data. In this paper a simulation for this period with the Hamburg climate model ECHAM4 [Roeckner et al., 1996] extended with a chemistry scheme is presented and comparison is with the observations is made. This provides and ideal opportunity to evaluate the model in a tropical environment. A more detailed presentation of the model follows in section 4.2. The Newtonian relaxation technique is described in section 4.3, a brief summary of the measurements is presented in section 4.4, and a description of the trajectory model follows in section 4.5. The results for O3 are presented in section 4.6, starting with the discussion of the surface data, followed by a presentation of the vertical profiles.
4.2 The ECHAM4 model The General Circulation Model (GCM) used in this study is the 19 layer European Center Hamburg Model, version 4 (ECHAM4). In this study the T30 version of the model with a horizontal resolution of about 3.75°x3.75° and a time resolution of 1800 seconds is used. The model uses a hybrid σ-p coordinate system from the surface to 10 hPa. Tracer transport is calculated using a semi-Lagrangian advection scheme [Rasch and Williamson, 1990]. Vertical transports are included through parameterizations of vertical diffusion and convection [Roeckner et al., 1996; Tiedtke, 1989]. An elaborate description of ECHAM4 and the simulated climate can be found in Roeckner et al. [1995],
50

Model evaluation of tropospheric O3
Chen and Roeckner [1996], and Haskins et al. [1995]. In this study, ECHAM4 is coupled to a tropospheric chemistry model that considers background CH4-CO-NOX-HOX chemistry, emissions of NO and CO, dry deposition of O3, NOX, HNO3 and H2O2, and wet deposition of HNO3 and H2O2. A detailed description and analysis of the coupled chemistry GCM is given in Roelofs and Lelieveld [1995, 1997]. The model considers a biomass-burning source for NO and CO distributed according to Hao and Liu [1994]. NO emissions from soils and from lightning play an additional role in the tropical tropospheric O3 budget. These sources in the model are distributed according to Yienger and Levy [1995], and parameterized according to Price and Rind [1992]. Further, the model considers global NO emissions from fossil fuel burning [Benkovitz et al., 1996], and CO emissions from fossil fuel burning, vegetation, formation from natural and anthropogenic higher hydrocarbons, oceans and wildfires. CO emissions are distributed according to Lelieveld and Van Dorland [1995]. The total NO and CO emissions considered in the model are consistent with IPCC [1994]. In view of the relatively long lifetime of CH4, the CH4 surface concentrations are prescribed. The parameterization for dry deposition of O3, NOX, and HNO3 is described in Ganzeveld and Lelieveld [1995, 1998]. Stratospheric O3 concentrations are prescribed between 1 to 2 model layers above the tropopause up to 10 hPa, the top level of the GCM. Transports of O3 across the tropopause depend directly on the air motions simulated by the GCM. The simulated tropopause is marked by a potential vorticity of 3.5·10-6 K m2 kg-1 s-1 poleward of 20° latitude [Hoerling et al., 1993], and by a -2 K km-1 temperature lapse rate equatorward of 20° latitude. The model realistically represents the seasonal variability of the O3 photochemical production and of O3 transport from the stratosphere [Roelofs and Lelieveld, 1995 and 1997]. Surface O3 concentrations as measured in remote and relatively clean conditions are also reproduced, but the model appears to underestimate O3 concentrations in some polluted regions due to the neglect of higher hydrocarbon chemistry [Roelofs et al., 1997].
4.3 Newtonian relaxation In this study a four-dimensional assimilation technique (nudging) is used to relax the ECHAM4 model towards an observed state, in this case ECMWF analyses. Originally, this technique was used to improve numerical weather prediction by nudging the model towards observations during a spin-up period, after which the model produced a prediction. Nowadays, nudging is a very useful technique for validation of cloud and chemistry schemes in GCMs for which long time series of measurements are not available. The technique can be used to adjust the ECHAM4 model towards an observed state for a longer period of time. Observations made during that period can then be compared directly with the model. A more detailed description of the Newtonian relaxation is given by Jeuken et al. [1996]. The model is nudged toward the observed state by the addition of a non-physical relaxation term to the model equations:
Xt = Fm (X) + G(Xobs -X)
With X representing a prognostic model variable, Fm is the model forcing, (Xobs -X) represents the difference between model state and observed state and G is a relaxation coefficient (s-1). At every time step the model is relaxed towards ECMWF analyses. Since the timestep of the model does not correspond to the availability of the analysis in the data archive (6 hours), the ECMWF data are interpolated to match the model time step. Such an interpolation was proposed by Brill et al. [1991].
51

Chapter 4
The divergence, vorticity, temperature, surface pressure and sea-surface temperature are nudged as in Jeuken et al. [1996]. The choice of the relaxation coefficient G is rather arbitrary. However, G cannot be chosen too small as the observations will have little effect on the model output. On the other hand, if G is too large the model will be nudged too strongly to the observed field and possible imbalances can be amplified. The value of G can also have a spatial distribution because the accuracy of the observations has a wide range [Hoke and Anthes, 1976]. More accurate observations should have more influence on the model than less accurate observations. This can be achieved by using the adjoint of the numerical model [Zou et al., 1992], which calculates G for each gridpoint separately. The ECMWF analysis is already adjusted towards numerous observations using an extensive four-dimensional data assimilation scheme [Heckley, 1990]. Furthermore, the model output is only weakly dependent on the choice of G in the extratropics [Jeuken et al., 1996; Krishnamurti et al., 1991], so the relaxation coefficients can be chosen to have a constant value (experiment 5 from Jeuken et al. [1996], given in Table 4.1).
Coefficient Value (s-1) GT 1 x 10⁻⁵ GD 0.5 x 10⁻⁴ GVO 1 x 10⁻⁴ GSPR 1 x 10⁻⁴
Table 4.1. Relaxation coefficients used GT - GD - GVO - GSPR are relaxation coefficients for temperature, divergence, vorticity, and surface pressure, respectively.
The humidity field is not nudged. Using the humidity field from the ECMWF analysis as a nudging variable would require a different approach. The modeled humidity field is strongly dependent on the parameterizations of, for example, clouds, ice, snow, rainfall, etc. The dependence on the parameterizations should be taken into account if the ECMWF humidity fields are used as errors could be created by the different parameterizations in the ECMWF and ECHAM4 models. A method to nudge the humidity field is proposed by Krishnamurti et al. [1988, 1991]. This method uses observed rainfall rates to calculate a corresponding humidity field with the use of an inverse modeling technique. However, this kind of inverse modeling is currently not available for the ECHAM4 model. It is also important to note that the ECMWF data that is used in this study do account for the effects of the humidity on the circulation in the tropics, so that these effects are indirectly included in the nudging of the ECHAM model. Therefore, it can be expected that including the humidity field in the nudging process does not have a large effect on the model output. A comparison between observed humidity profiles and the model shows that the model indeed is capable of simulating the observed profiles very well (unpublished data). It can also be noted that the aim of the nudging is to reproduce the observed circulation patterns without affecting the physical properties of the model. To what extent the nudging affects these properties is difficult to say, but, the more model parameters are nudged towards the ECMWF analysis, the mode likely it becomes that one is not comparing the ECHAM model with the observations but the ECMWF model. For the current model simulations ECHAM4 was integrated without nudging for the period of September to February to allow time for the spin-up of tracer fields. After the spin-up period Newtonian relaxation was applied for the period from 16 March to 30 April 1995. Although there
52

Model evaluation of tropospheric O3
was also a spin-up because of the onset of the nudging procedure, the spin-up period turned out to be less than a day and was therefore not important for the model output.
4.4 Measurements On March 21, 1995, the R/V Malcolm-Baldrige departed from Durban, sailing toward Sri Lanka following the cruise track shown in Figure 4.1.
Figure 4.1. Track of the R/V Malcolm-Baldridge. The triangles show the sites and dates that the sondes were launched. The campaign started on March 12, 1995, in Durban, South Africa. It ended on April 22, 1995, in Colombo, Sri Lanka.
During this voyage near-surface measurements of trace gases, e.g. CO, O3, NOX , aerosols and of meteorological variables were made. For a detailed description of these measurements see Rhoads et al. [1997] and Dickerson et al. [1998]. Rhoads et al. [1997] showed that along the cruise track from south to north four distinct meteorological air masses or regimes were encountered, i.e. SH marine extratropical air (SHmX), SH marine equatorial air (SHmE), NH marine equatorial air (NHmE) and NH continental tropical air (NHcT). These different regimes are distinguished by sharp increases in the surface trace gas and aerosol concentrations measured on days 91, 101, and 107 [Rhoads et al., 1997]. O3-, humidity and temperature measurements aloft were obtained using balloon-borne electrochemical concentration cell (ECC) O3 sondes (Model 1z, En-Sci Corp., Boulder, Colorado) coupled to Väisälä radiosondes (Model RS80, Väisälä USA, Woburn, Massachusetts). The Väisälä sensors for temperature, pressure and humidity measurements were factory calibrated and have reported accuracy’s of 0.3 °C, 0.5 hPa and 2 % respectively. The O3 sensor has an accuracy of ± 7 % in the troposphere, with a detection limit of 1-2 ppbv [Komhyr et al., 1995]. The uncertainty at
53

Chapter 4
concentrations less than 10 ppbv is of the order of 10 %. The sondes were typically launched in the early afternoon at intervals of approximately 2 degrees of latitude.
4.5 Trajectory model Trajectory analyses were performed in order to determine the origin of the air masses of interest. The trajectory model used in this study is the KNMI trajectory model [Scheele et al., 1996]. Three-dimensional ECMWF first-guess (6 hour forecast) wind fields are used to calculate the displacement of an air parcel for each model time step of the trajectory model. The use of first-guess data instead of analyses ensures that the wind fields and mass distribution fields are in physical balance. The first-guess wind data are available at 31, hybrid σ-p, model levels. For more details, see Chapters 2 and 3.
4.6 Results 4.6.1 Surface data A comparison is made between model and measurements for O3. Since the location and time of the observations generally do not coincide with those of the ECHAM4 model, interpolation of the model output in space and time is performed for both sonde and surface observations. Table 4.2 lists the average O3 concentration for the four different air mass regimes as indicated in section 4.4. Figure 4.2 shows the observed and modeled O3 concentration at the surface. The most striking feature of Figure 4.2 is the low O3 concentration (7.5 ppbv on average) for the NHmE air compared to the high concentrations close to India on JD 107-111 (15-20 ppbv). Similar or even lower concentrations have been measured in the equatorial Pacific [Routhier et al., 1980; Fishman et al., 1987; Piotrowicz et al., 1986; Singh et al., 1996; Kley et al., 1996]. Such low O3 concentrations appear to be a common feature of remote equatorial marine environments. They are associated with clean, NOx-depleted O3 destruction conditions, although the exact mechanisms by which the very low concentrations are caused are still a subject of debate [Singh et al., 1996].
SHmX SHmE NHmE NHcT Measured 17.0 (±1.8) 11.5 (±2.5) 7.5 (±1.2) 15.7 (±2.9) Modeled 20.8 (±3.2) 16.9 (±2.0) 14.1 (±1.0) 24.6 (±4.7)
Table 4.2. Average measured and model O3 mixing ratios at the surface for the four different air mass regimes. Standard deviations are shown in brackets. Measurements are from Rhoads et al. [1997].
Figure 4.2 shows that the model is capable of producing the same observed latitudinal trend, but it produces higher O3 concentrations during most of the period, except for JD 88-91. Note that for this period only a few observations were available. The mean difference between observed O3 and
54

Model evaluation of tropospheric O3
modeled O3 is 6 ppbv (± 3 ppbv). The model overestimation of O3 in the Indian Ocean boundary layer is not caused by an overestimation of photochemical O3 production, but rather by some O3 destruction mechanism that is not well represented by the model. It is not likely that the O3 mismatch is caused by a problem in the model representation of transport and mixing. A possible explanation could be the neglect of multiphase chemical processes in low-level clouds of aqueous aerosols.
Figure 4.2. Comparison between measured and O3. The thin dashed line with circles shows the model calculated O3 for which the O3 destruction through the reaction O(‘D) + H2O in the marine boundary layer has been doubled over the Indian Ocean. The different air mass regimes are: SHmX (JD 82-92), SHmE (JD 92-101), NHmE (JD 101-107), and NHcT (JD 107-112).
Cloud and aerosol chemistry could lead to enhanced destruction of peroxy radicals that form O3, to O3-loss in the aqueous phase [Lelieveld and Crutzen, 1990], or to the release of reactive halogens from dissolved sea salt and subsequent O3 destruction [Vogt et al., 1996]. A first estimate has been obtained by increasing the O3 destruction in the marine boundary layer of the model. The reaction rate of O(1D) + H2O is multiplied by a factor of 2. Figure 4.2 shows that this strongly improves the agreement. A remarkable feature, which can be seen in Figure 4.2, was the strong diurnal cycle present in the O3 measurements (JD 93-107). This diurnal cycle could have been caused by photochemical O3 destruction during the day, and nighttime replenishment by mixing. A diurnal cycle with a minimum during the day is discernible in the model results (JD 93-107), consistent with the measurements, but the amplitude is smaller then the observed one. The observed amplitude of the diurnal cycle has a value of about 4 ppbv while the amplitude in the model is about 0.5-1.0 ppbv. Rhoads et al. [1997] noted that O3 destruction started after sunrise and that the lowest O3 levels were found just after solar noon. The model also shows a minimum during daytime caused by daytime photochemical destruction of O3, mostly through photodissociation of O3 and the subsequent reactions of O(1D) with H2O. Enhanced daytime photochemical O3 destruction would be consistent
55

Chapter 4
with the mechanisms proposed by Lelieveld and Crutzen [1990], Vogt et al. [1996] or Dickerson et al. [1998].
4.6.2 O3 profiles Figure 4.3 shows the O3 contour plot for all profiles.
Figure 4.3. Latitude-time versus height contour plot for O3 for all profiles during the 1995 campaign. Contour values are in parts per billion by volume.
Two remarkable features in the upper air data are the relative ozone minimum at 175 hPa, near 18ºS, and O3 maximum at 300 hPa, around 13ºS. The minimum was observed over the course of 5 days in four consecutive profiles. These upper-tropospheric layers showed ozone levels ranging from 20 to less than 10 ppbv. Although the region of minimum ozone is not associated with high RH, large-scale rising motion may have lifted low ozone air up from the boundary layer and lower free troposphere. Mixing ratios at the minimum are in line with those observed in the lower free troposphere, and a more humid layer appears at the bottom of low ozone strata in several of the profiles. The region of high ozone coincides with quite low RH (~5%), suggesting that the air is stratospheric in origin. Figure 4.4 shows the comparison between eight O3 profiles and the ECHAM4 model results. The positions of the sondes as well as the dates at which they were released can be seen in Figure 4.1. The eight profiles show some common features. At the surface the O3 concentrations are relatively low due to photochemical destruction. The O3 concentrations increase with height, and the highest
56

Model evaluation of tropospheric O3
O3 levels are found between 400 and 200 hPa (7-12 km). Directly above these maxima very distinct minima appear. The ECHAM4 model is capable of capturing most of these general features, i.e. the low surface concentrations, the gradual increase of O3 concentrations with height and the upper-tropospheric minimum. The model also captures the tropopause height, indicated by the sharp increase in O3 concentrations above 100 hPa.
Figure 4.4. Comparison of O3 profiles and the modeled O3 profiles. Location and time of release of the sondes are given in Figure 4.1. Observations are denoted by the solid lines, and model output is shown by the dashed lines.
57

Chapter 4
The upper-tropospheric minimum is the result of the ITCZ outflow at this height. The convective cells at the ITCZ ventilate boundary layer air all the way up to the tropopause. The boundary layer air has O3 concentrations of about 20 ppbv or less, and in some cases the upper-tropospheric minima also approach 20 ppbv. Figure 4.5 shows the model results at the 190 hPa level on April 4.
Figure 4.5. Simulated O3 concentrations for April 4 at 0500 UTC at a pressure altitude of 190 hPa. Also shown are the wind fields (arrow length in arbitrary units). The asterisk denotes the position of the ship.
A distinct minimum covers the entire Indian Ocean. To the west, the O3 depleted air is bordered by O3 rich continental African air. To the south the minimum is delimited by the subtropical jet, which transports O3 rich African air eastward. The subtropical jet is also associated with transport of stratospheric air into the troposphere. This is illustrated in Figure 4.6, which shows the ECMWF analysis at 61° E on April 3.
Figure 4.6. ECMWF analyses at 61°E on April 3 (1800 UTC)> The thin lines show the specific humidity (g/kg), with shaded regions showing air dryer than 0.1 g/kg. The thick dashed line shows the zonal wind velocity (m/s). The thick solid line shows the potential vorticity (0.1 PVU).
58

Model evaluation of tropospheric O3
At a height between 300 and 100 hPa (10-18 km, near 30° S) a tongue of high potential vorticity descents into the troposphere. At this location stratospheric O3 was transported into the troposphere. At the locations where the O3 depleted marine air and O3 rich continental air meet, sharp gradients occur (Figure 4.5). Figure 4.7 shows that the mid-troposphere is generally O3-richer than the marine boundary layer as well as the upper troposphere. Relatively low O3 levels occur in a relative small corridor at about 75ºE. It appears that this area is affected by cyclone Marlene which was present at 65° E, 15 S°.
Figure 4.7. Simulated O3 concentrations for April 6 at 0700 UTC at 580 hPa. Also shown are the wind fields (arrow length in arbitrary units). The asterisk denotes the location of the profile.
To investigate the origin of the high tropospheric O3 minimum observed in profile 7 (April 4), a trajectory study was performed. Figure 4.8 shows 5-day back trajectories starting at 150, 180 and 210 hPa, representing the air in the O3 minimum, and at 305, 17 325 and 345 hPa, representing the air mass just below the minimum.
Figure 4.8. Back trajectories from April 4 (1000 UTC) to March 30 (1000 UTC), starting at 55°E, 18.02°S. The trajectories are marked by their starting pressure, i.e. 150, 180 (upper two trajectories in figure), 210 (middle trajectory), 305, 325, and 345 (lowest three trajectories) hPa.
59

Chapter 4
The air in the O3 minimum clearly originates from the east, where O3-depleted air is present according to the model (Figure 4.5). Figure 4.9 shows the vertical displacement of the trajectories. As the trajectory model is not capable of capturing individual convective cells, the trajectories mainly remain in the upper troposphere. The trajectory at 210 hPa, however, originates from the boundary layer. This can be traced back to the tropical cyclone Marlene. The strong vertical motion is caused by organized upward flow in cyclone Marlene.
Figure 4.9. Pressure evolution with time of back trajectories from April 4 (1000 UTC) to March 30 (1000 UTC). On April 4 the trajectories started at the following pressure levels: 150, 180, 210, 305, 315, and 345 hPa.
The model is generally capable of matching the observed O3 minimum in the upper troposphere. However, for profile 6 the model cannot capture the minimum. The reason is probably that the vertical extent of the minimum is comparable to the size of a gridbox, which makes it difficult to model. For profile 7 the model does produce a minimum, but the modeled O3 concentrations are too high. According to Figure 4.5, the location of the profile at that moment is within a sharp O3 gradient. A relatively small shift within this gradient can strongly influence calculated O3 concentrations, especially considering the size of the model grid cells. Due to the coarse vertical resolution the model cannot capture most of the small-scale features apparent in the observations. The model does reproduce the general shape of the O3 profiles although it somewhat underestimates the mid-tropospheric O3 maximum. This might be related to the absence of higher hydrocarbon chemistry, which can cause an increase in the O3 concentrations of 10-20 ppbv in air that is affected by pollution emissions [Roelofs et al., 1997]. The model does not reproduce the O3 maximum at 300 hPa observed in profile 9. Back trajectories calculated for this location (Figure 4.10) show that the air above 160 hPa originates from the east while below 180 hPa the air originates from the west. If the back-trajectories are representative for the meteorological situation, O3 rich air would be found
60

Model evaluation of tropospheric O3
in the observations of profile 9 at 180 and 200 hPa. This is definitely not the case at 180 and 200 hPa as can be seen in Figure 4.4. The inconsistency between the observed profile and the back-trajectories (the back-trajectories start close to each other but have a completely different origin) is indicative of the uncertainties involved in reproducing the meteorological situation. The resolution of the ECHAM model is much lower than that of the trajectory model, and it cannot be expected that ECHAM4 reproduces such small-scale meteorological features.
Figure 4.10. Back trajectories from April 6 (1000 UTC) to April 1 (1000 UTC). The trajectories start at 55°E, 13.56°S. The trajectories are marked by their starting pressure, i.e. 130, 140 (trajectories ending near 10ºS/80ºE), 160 (ending near 2ºS/55ºE), 180, 200, 270 (ending near 0º/30ºE), 380, and 520 (ending near 20ºS/20ºE) hPa. The trajectories starting at 380 and 520 hPa are representative for all trajectories starting at pressure levels between 380 and 520 hPa.
At lower levels (520-380 hPa) the trajectories for profile 9 are very consistent. They all originate from the southern part of Africa. The trajectories move eastward over the southern tip of Madagascar and then curve around to the measurement site. The trajectories suggest transport of O3 rich African air. This is consistent with the findings of Piketh et al. [1996], Tyson et al. [1996, 1997], and Bremaud et al. [1998], who all reported transport of polluted (O3 rich) southern African air onto the southern Indian Ocean. The ECHAM4 model reproduces the observed O3 concentrations at this altitude, and Figure 4.7 shows south-easterly winds around 60°E, 15ºS, consistent with the curved trajectories at this location. The model analysis suggest that this mid-tropospheric O3 maximum is caused by African biomass burning emissions of O3 precursors, possibly somewhat underestimated by the model due to the neglect of higher hydrocarbon chemistry.
4.7 Conclusions A description of the tropospheric O3 distribution over the Indian Ocean during spring 1995 is presented, and compared to the observations with the nudged ECHAM4 model. This is the first (successful) application of the nudging technique in a chemistry GCM. A number of features present in the O3 distribution stand out:
61

Chapter 4
1. Relatively O3-deficient air occurs in the marine boundary layer due to efficient photochemical O3 destruction
2. Relatively high O3 levels occur close to the Indian continent (~ 20 ppbv) in low-level outflow of polluted air. This is consistent with relatively high CO levels in these air masses [see section on CO in de Laat et al., 1999].
3. Relatively high O3 levels (~ 15-20 ppbv) are also found at about 20°-30°S, e.g. compared to the central Pacific boundary layer, probably influenced by biomass burning effluents from the African continent.
4. Convective outflow in the upper troposphere in the ITCZ causes large-scale O3 minima over the central Indian Ocean. The vertical extent of the outflow and the O3 minima is fairly narrow, mostly confined to the 250-100 hPa region.
5. At mid-tropospheric levels (750-250 hPa) high O3 concentrations are apparent, often in confined layers. These high O3 levels are likely caused by mid-tropospheric outflow of polluted African air, in addition to O3 that has been transported from the stratosphere.
The ECHAM4 model reproduces the large-scale advection processes and the associated tracer transports [section on CO in de Laat et al., 1995]. The model reproduces both the overall tendencies and the diurnal variations of the surface pressure, another indication that it simulates the correct meteorology [de Laat et al., 1999]. Although the model reproduces the spatial O3 tendencies and relatively low O3 concentrations compared with O3 concentrations in the free troposphere, it overestimates O3 in the marine boundary layer and it underpredicts the diurnal variation in O3. It is hypothesized that the discrepancy between the modeled and observed diurnal cycle is caused by the neglect of multiphase chemistry in clouds or aerosols in the marine boundary layer. Accounting for these processes, e.g. in a future model version, is expected to increase the calculated photochemical O3 destruction. The ECHAM4 model reproduces both the upper-tropospheric O3 minima and mid-tropospheric maxima. The model also capable of reproduces the transport of O3–depleted MBL air to the upper troposphere by tropical cyclone Marlene. The upper-tropospheric O3 minimum stretches out over large parts of the Indian Ocean. However, the modeled upper-tropospheric O3 levels are generally too high, consistent with the overestimated surface O3 levels. On the other hand, the mid-tropospheric O3 maxima are somewhat underestimated, which could be related to missing higher hydrocarbon chemistry. The mid-tropospheric O3 maxima are caused by transport of polluted air from the southern part of Africa. Tropical cyclones (e.g. Marlene) influence vertical trace gas distributions over large areas. Organized convection associated with these cyclones enhances vertical exchange between the boundary layer and the free troposphere. Cyclone Marlene caused extended O3 minima in the middle troposphere and substantially increased the extent of the upper-tropospheric O3 minima. Future improvements of the model will include implementation of a higher hydrocarbon chemistry scheme to study the role of pollution chemistry in more detail. The model will also be applied at T63 resolution (~ 1.1˚ x 1.1˚) to improve representations of synoptic scale weather systems.
62

63

64

Tracer experiments with ECHAM4
5
Interhemispheric exchange and the Intertropical Convergence Zone in tracer experiments with the ECHAM4 model◊
Simulations have been performed with the ECHAM4 general circulation model using passive transport tracers. In a first experiment we use a contour ‘area variation’ method to determine the location of the Intertropical Convergence Zone (ITCZ). A second experiment was carried out to compute the flux of air across this ITCZ. On an annual mean basis about 115-120 x1010 kg of air crosses the ITCZ from each hemisphere into the other. The annual zonal mean location of the ITCZ is approximately 4°N, corresponding to a difference in surface area between the hemispheres of 8%. With similar annual mean fluxes in both directions across the ITCZ this leads to a somewhat larger interhemispheric exchange time for the southern hemisphere (SH) than for the northern hemisphere (NH), 0.95 years and 0.74 years respectively. The seasonal cycles of the exchange times are anticorrelated, with maximum cross-ITCZ exchange at the solstices (boreal summer for southward fluxes and austral summer for northward fluxes). Exchange at the surface is consistent with the existence of three distinct regions separated by equivalent potential temperature barriers: The ‘inner tropics’, and the NH and SH subtropics. The first region is characterized by strong surface mixing, whereas in the subtropics interhemispheric mixing occurs through outflow of tropical convection in the middle-upper troposphere. Convection appears to be an important mechanism of interhemispheric transport, with outflow occurring between 350-200 hPa (8-12 km). On the whole, the three-dimensional tracer distribution exemplifies the overall dominance of the global monsoon circulation in the transport of tracers.
◊ This chapter has been submitted as: Zachariasse, M., P.F.J. van Velthoven, J.W.M. Cuijpers, J. Lelieveld, and P.J. Crutzen, Tellus, 2002.
65

Chapter 5
5.1 Introduction Trace gases play important roles in the Earth’s eco- and climate system by affecting atmospheric chemistry and the radiation balance. Human activities such as industry, biomass and fossil fuel burning and the use of biofuels lead to increasing emissions of anthropogenic trace gases. Developing countries in the tropics, such as India and southeast (SE) Asia, are expected to strongly enhance the emissions of these trace gases in the future [Lelieveld et al., 2001]. Anthropogenic emissions have an uneven source distribution over the hemispheres; they are primarily emitted from the northern hemisphere (NH) continents. Interhemispheric exchange therefore plays a crucial role in controlling the atmospheric loading of man-made pollutants in the relatively cleaner atmosphere of the southern hemisphere (SH). The Intertropical Convergence Zone (ITCZ) in the tropics is a region of major upwelling due to convergence of warm, moisture-laden trade winds at the surface. It often shows up in satellite imagery as a collection of deep convective cloud clusters, with relatively clear patches in between. As such it is a marked manifestation of the boundary between the hemispheres. Chemical measurements across the ITCZ [Rhoads et al., 1997; Gregory et al., 199; Wagner et al., 2001] show that the ITCZ is an exchange barrier in the troposphere. Satellite observations have shown that the annual zonal mean ITCZ is displaced north with respect to the equator, to approximately 6°N [Waliser and Gautier, 1993]. The reason for this lies in the complex interplay between the atmosphere, the ocean, and the geographical distribution of the landmasses [Waliser and Somerville, 1994; Philander et al., 1996; Li, 1997; Wang and Wang, 1999]. The preferred NH latitude of the ITCZ has an important implication. Part of the pollutant emissions in SE-Asia and India can take place south of the ITCZ, hence directly in the SH. This could play an important role in perturbing the tropical climate with continuously increasing pollutant emissions. Although the ITCZ is a barrier to interhemispheric exchange, it is a leaky one [Gregory et al., 1999]. Many studies have shown that the main transport pathway between the hemispheres is via the middle and upper troposphere in the ITCZ [Hartley and Black, 1995; van Velthoven et al., 1996; Gilliland and Hartley, 1998; Gregory et al., 1999; Lu et al., 2000; Holzer and Boer, 2001]. This permeability of the ITCZ has been a topic of interest for some time. Tracer simulations have been performed with models of varying complexity, from simple models to full three dimensional (3D) general circulation models (GCMs). The most frequently used tracers are the long-lived CFCl3 (F11) [Prather et al., 1987; Hartley et al., 1994; Pyle and Prather, 1996; Gilliland and Hartley, 1998; Rind et al., 2001], CF2Cl2 (CFC-12) [Bowman and Cohen, 1997], and SF6 [Denning et al., 1999; Kjellström et al., 2000; Rind et al., 2001; Land et al., 2001]. Global emissions of the tracers are implemented in the models after which the model simulates the transport of tracers throughout the global atmosphere. From these studies the timescale for interhemispheric exchange appears to be roughly one year. In spite of all the model studies focusing on the role of the ITCZ as a transport barrier, little is known about how and where air crosses the ITCZ during a year. In the present chapter a tracer-based approach is used in combination with a 3D GCM (the Hamburg climate model, ECHAM4) to study the interhemispheric exchange as a function of space and time. The difference with other studies is that instead of using a particular tracer, an artificial passive tracer is used in part of the atmosphere. The tracer has an infinite lifetime and an initial mixing ratio of 1 kg/kg. The advantage of this tracer is that we are not hampered by an imperfect knowledge of the distribution of the
66

Tracer experiments with ECHAM4
sources and sinks of the tracer and that transport information is not entangled with the decay of the tracer. Instead, the evolution of the tracer distribution is solely determined by transport processes. This will mark the ITCZ most clearly and greatly simplifies budget calculations. Another difference with previous tracer studies of interhemispheric transport is the method that is used to define the ITCZ. The method of ‘area variation’, proposed by McIntyre and Palmer [1984] and used by Teitelbaum et al. [1998], to determine the polar vortex edges is adapted for the determination of the ITCZ. It is not the objective of this paper to simulate real atmospheric tracer distributions. Rather a method for determining how much air is exchanged between the hemispheres during a year is presented. This approach allows an unambiguous study of the seasonal and regional variations of the fluxes as well as the determination of the major regions of exchange. First order estimates of real tracer fluxes, such as SF6, can be obtained from the interhemispheric fluxes of air by multiplying them with the mean hemispheric mixing ratio of the tracers. The organization of the chapter is as follows. In section 5.2 the model and the experimental setup is discussed. In a first experiment the location of the ITCZ is determined. Through a subsequent experiment the flux through this ITCZ is calculated and a more precise definition of the ITCZ developed. The presentation of the results starts with examples of the occurrences of interhemispheric exchange during the seasons in section 5.3. This is followed by calculations of the interhemispheric flux in section 5.4, starting with the zonal mean vertically integrated mass fluxes, after which the regional variations are discussed. Section 5.5 discusses the findings in the light of other studies. In section 5.6 the geographic tracer distributions are discussed in terms of the global monsoon circulation [Webster et al., 1998; Trenberth et al., 2000]. In section 5.7 the conclusions are presented. 5.2 Model and experimental setup To investigate how much air is exchanged between the hemispheres§ two types of experiments have been designed. The first experiment is used to determine the ITCZ location and in the second the flux through this ITCZ is calculated. The determination of the ITCZ is based on tracer transport calculations. In both experiments passive tracers are released north and south of the ITCZ at the beginning of every month. After this initialization the model is run for a month. The model meteorology determines the evolution of the tracer distribution. The ECHAM4 model The model used is the Hamburg climate model ECHAM4. This is a general circulation model based on the numerical weather prediction model of the European Centre for Medium-range Weather Forecasts (ECMWF). It has a new physics package adapted for climate studies. The model has 19 hybrid σ-p layers in the vertical with the top level at 10 hPa. In this study the T30 version is used, which corresponds to a horizontal resolution of 3.75°x3.75°. A time step of half an hour is used for integration. A semi-lagrangian advection scheme [Rasch and Williamson, 1990] is applied to
§ For clarity: throughout the paper the terms ‘southern hemisphere’ and ‘northern hemisphere’ do not mean south or north of the equator, but south and north of the ITCZ.
67
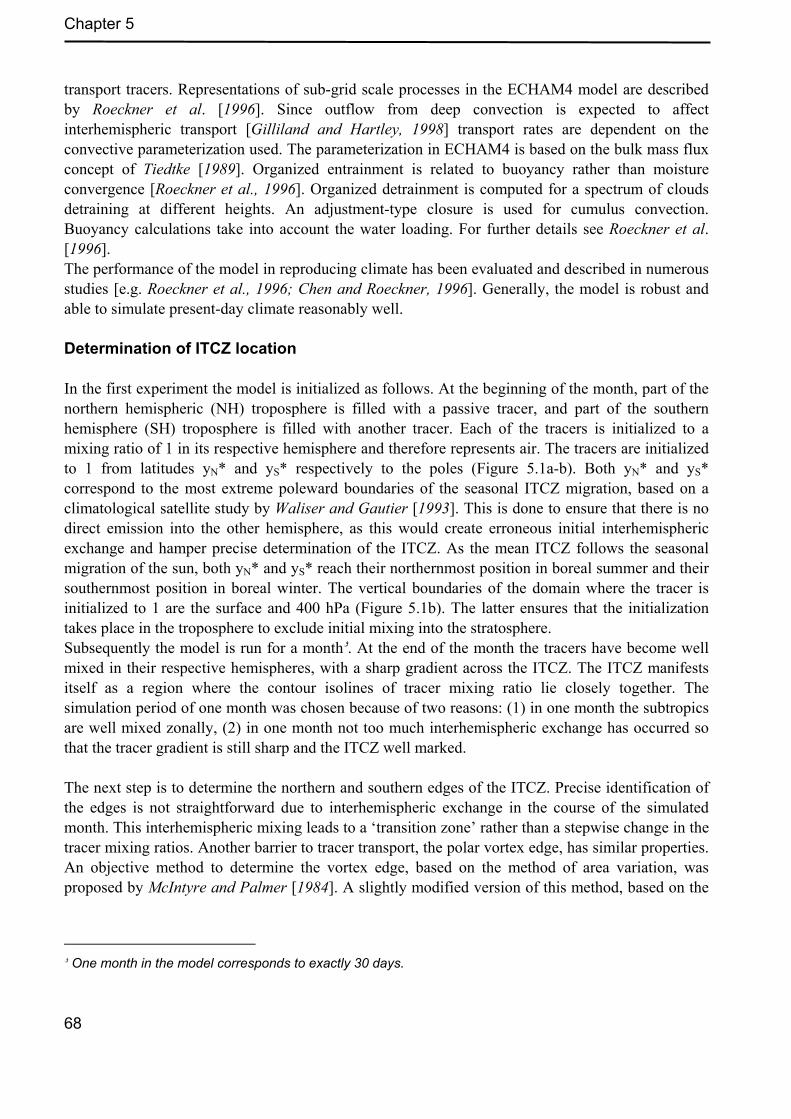
Chapter 5
transport tracers. Representations of sub-grid scale processes in the ECHAM4 model are described by Roeckner et al. [1996]. Since outflow from deep convection is expected to affect interhemispheric transport [Gilliland and Hartley, 1998] transport rates are dependent on the convective parameterization used. The parameterization in ECHAM4 is based on the bulk mass flux concept of Tiedtke [1989]. Organized entrainment is related to buoyancy rather than moisture convergence [Roeckner et al., 1996]. Organized detrainment is computed for a spectrum of clouds detraining at different heights. An adjustment-type closure is used for cumulus convection. Buoyancy calculations take into account the water loading. For further details see Roeckner et al. [1996]. The performance of the model in reproducing climate has been evaluated and described in numerous studies [e.g. Roeckner et al., 1996; Chen and Roeckner, 1996]. Generally, the model is robust and able to simulate present-day climate reasonably well. Determination of ITCZ location In the first experiment the model is initialized as follows. At the beginning of the month, part of the northern hemispheric (NH) troposphere is filled with a passive tracer, and part of the southern hemisphere (SH) troposphere is filled with another tracer. Each of the tracers is initialized to a mixing ratio of 1 in its respective hemisphere and therefore represents air. The tracers are initialized to 1 from latitudes yN* and yS* respectively to the poles (Figure 5.1a-b). Both yN* and yS* correspond to the most extreme poleward boundaries of the seasonal ITCZ migration, based on a climatological satellite study by Waliser and Gautier [1993]. This is done to ensure that there is no direct emission into the other hemisphere, as this would create erroneous initial interhemispheric exchange and hamper precise determination of the ITCZ. As the mean ITCZ follows the seasonal migration of the sun, both yN* and yS* reach their northernmost position in boreal summer and their southernmost position in boreal winter. The vertical boundaries of the domain where the tracer is initialized to 1 are the surface and 400 hPa (Figure 5.1b). The latter ensures that the initialization takes place in the troposphere to exclude initial mixing into the stratosphere. Subsequently the model is run for a monthو. At the end of the month the tracers have become well mixed in their respective hemispheres, with a sharp gradient across the ITCZ. The ITCZ manifests itself as a region where the contour isolines of tracer mixing ratio lie closely together. The simulation period of one month was chosen because of two reasons: (1) in one month the subtropics are well mixed zonally, (2) in one month not too much interhemispheric exchange has occurred so that the tracer gradient is still sharp and the ITCZ well marked. The next step is to determine the northern and southern edges of the ITCZ. Precise identification of the edges is not straightforward due to interhemispheric exchange in the course of the simulated month. This interhemispheric mixing leads to a ‘transition zone’ rather than a stepwise change in the tracer mixing ratios. Another barrier to tracer transport, the polar vortex edge, has similar properties. An objective method to determine the vortex edge, based on the method of area variation, was proposed by McIntyre and Palmer [1984]. A slightly modified version of this method, based on the
.One month in the model corresponds to exactly 30 days و
68

Tracer experiments with ECHAM4
vortex study by Teitelbaum et al. [1998], is applied here to define the edges of the ITCZ transition region. Let A(XH*) be the total area enclosed by the isolines with tracer mixing ratio XH larger than a constant value of XH* (XH >= XH*) at the surface level. Here H represents either the NH or the SH. A(XH*) always contains the pole and is larger for small mixing ratios XH* than for large ones. A(XH*) has a maximum value for XH* = 0. For large XH* the total area is small, whereas for small XH* the area is large. The ITCZ will manifest itself as a transition region of finite width where A(XH*) shows little variation as a function of XH. The first derivative dA(XH*)/dXH* has a maximum in the middle of the transition zone and the second derivative d2A(XH*)/dXH*2 will be zero there (Figure 5.2). The equatorward edge of the transition zone (EE in Figure 5.2) is represented by a maximum in d2A(XH*)/dXH*2, whereas the poleward edge of it coincides with a minimum (PE in Figure 5.2). The edges of the ITCZ to be used in the second experiment are now defined as the XNH* and XSH* corresponding to the poleward edges of the transition zone in the NH and SH, respectively. This is a conservative definition of the ITCZ to rule out erroneous initial interhemispheric exchange at the beginning of the second experiment described in the next paragraph.
Figure 5.1. Setup of the experiments. (a) Horizontal initialization at the surface of experiment 1, day 1 of month 1. (b) Vertical initialization of experiment 1, day 1 of month 1. (c) Horizontal initialization at the surface of experiment 2, day 1 of month 2. (d) Vertical initialization of experiment 2, day 1 of month 2.
69

Chapter 5
Figure 5.2. Typical distribution of surface area of tracer contours at the end of experiment 1, A(XH
*), first derivative (A’ (XH*)), and second derivative (A’’(XH
*)). Also indicated are the resulting poleward (PE) and equatorward (EE) edges of the tracer transition zone.
Interhemispheric exchange calculations With the ‘tracer ITCZ’ in terms of mixing ratios XNH* and XSH* at the end of a month the actual run to evaluate the fluxes across the ITCZ can now be started. In the second experiment the following month is initialized by again filling up both hemispheres with the hemispheric tracers as in the first experiment but now the horizontal and vertical boundaries are determined by the XNH* and XSH* from the first experiment (Figure 5.1c+d). The conservative definition of the ITCZ, i.e. the poleward edge, still causes a small gap between the tracers of both hemispheres, however, the volume of this region is small compared to that occupied by the tracers and was found not to affect the flux estimates significantly. The model is again run for a month. From experiment 2 it is possible to determine the ITCZ even more accurately. The difference between the NH and SH tracer mixing ratio (XD = XNH - XSH) at the end of the month is a measure of the relative influence of both hemispheres at that grid box in the model. XD > 0 implies that the grid box is in the NH whereas XD < 0 implies a SH location. XD = 0 will be used as the most refined definition of poleward edge of the ITCZ transition region at the end of the month. The amount of air that has crossed the ITCZ in a month can now be calculated. Owing to the infinite lifetime of the tracers these budget calculations are greatly simplified. The initializations in both experiments are conservative in the sense that erroneous initial transport is prevented. However, in experiment 2 an entire hemispheric troposphere is filled with an air tracer while in experiment 1 this is only partly the case. Both experiments have been performed for all months of the year. 5.3 Where does the interhemispheric exchange occur? This section presents examples of the tracer distribution in both hemispheres at the end of the month of the second experiment. Horizontal and vertical cross sections will be used to investigate where the interhemispheric exchange takes place in the course of a year.
70

Tracer experiments with ECHAM4
First the surface distribution is discussed.
a
b
c
d
Figure 5.3. The distribution of the difference in tracer mixing ratios of NH and SH tracers, XD=XNH-XSH, at the surface at the end of the month of experiment 2. Positive values (green/blue colors) indicate that the NH tracer prevails, negative values (red/yellow colors) that the SH tracer prevails. (a) Winter (December-January-February); (b) Spring (March-April-May); (c) summer (June-July-August) and (d) autumn (September-October-November). The ITCZ (XD=0) is indicated by the black line separating the yellow from the green colors.
71

Chapter 5
Figure 5.3 depicts the horizontal distribution of the tracers at the surface at the end of the month in terms of the difference in the mixing ratios of the NH and SH tracer, XD=XNH-XSH. In the SH XD is approximately –1 and in the NH approximately 1. The tracer ITCZ, defined as XD=0 (see section 5.2), is indicated by the black line. South and north of the tracer ITCZ there are patches of air from the other hemisphere. It will be shown that this is due to a combination of interhemispheric mixing and vertical transport within the troposphere.
a b
c d
Figure 5.4. Latitudinal vertical cross sections of (a) XN and (b) θe (in K) at 90°E for February 30. Horizontal cross sections of (c) XD and (d) θe (in K) at the surface (1009 hPa). The black line indicates the ITCZ.
Winter (December-January-February) In boreal winter the ITCZ reaches its southernmost position. In the major monsoon regions (America, Africa, India/SE-Asia) this can be as far south as 20°S. Over the E-Pacific and Atlantic Oceans on the other hand, the ITCZ barely reaches the SH and remains close to the equator. At the surface a substantial exchange of air masses between the hemispheres occurs over the Pacific warm pool (130-180°W) but also over S-America (indicated by yellowish and greenish shading in Figure 5.3a). Less transport, mainly from north to south, takes place over Africa. Over the Indian Ocean, on the other hand, there is a large influx of southern hemispheric air into the NH. It is especially large
72

Tracer experiments with ECHAM4
in February when the ITCZ quickly moves southward. In the course of the month there are many rapid changes in the ITCZ position that cause considerable instantaneous interhemispheric exchange. When the ITCZ rapidly moves to the north or south one hemisphere grows at the expense of the other so interhemispheric exchange must occur. A vertical cross section of the NH tracer mixing ratio through this area at 90°E (Figure 5.4a) shows large interhemispheric exchange in the upper troposphere (south of the ITCZ near 200 hPa). This main outflow at upper-tropospheric levels occurs at all longitudes throughout the year. The tracers are transported far into the upper troposphere in chimney-like structures associated with convection. The outflow at 200 hPa corresponds to a strong gradient in the equivalent potential temperature, θe (Figure 5.4b). Since the θe of an air parcel is conserved during ascent it is a measure of the maximum height it can reach during convection. Therefore, an air parcel rising from the boundary layer with a θe of 350-355 K in Figure 5.4b will reach its level of neutral buoyancy near 200 hPa as shown by the figure. Thus, the majority of the outflow will take place in that region. Figure 5.4c and d show that the regions with the largest tracer exchange coincide with regions of maximum θe at the surface. Usually, maxima of convective precipitation and surface convergence lie within this vertically unstable region. It thus turns out that the regions of maximum exchange around the ITCZ are collocated with deep convection, which readily mixes both tracers at the surface. Gradients in tracer correspond to gradients in θe. There are three major regions at the surface: the ‘inner tropics’, and the northern and southern subtropics. The ‘inner tropics’ represent a region of intense interhemispheric mixing at the surface. The three regions are separated by θe barriers, i.e. strong θe gradients (cf. Figure 5.4d). In the upper troposphere, on the other hand, interhemispheric mixing occurs through outflow of tropical convection into the subtropics. Spring (March-April-May) During boreal spring the ITCZ starts its northward migration related to the heating of the NH continents. Over S-America and Africa this is associated with abrupt and large movements of almost 20° to 40° in less than 3 months. Over the oceans the migration is more gradual. The Central Pacific ITCZ shifts somewhat to the south to 10°S in March but follows the northward migration of the rest of the Pacific about two months later. In May the ITCZ has moved well into the NH over all oceans and continents, except the Indian Ocean region. This leads to considerable exchange of NH air into the SH (yellowish shading in Figure 5.3b). The Indian Ocean region seems exceptional. From February to March there is a large northward shift in the ITCZ location over this sector, with exchange from the NH to the SH (greenish shading in Figure 5.3b). During the other months, however, the ITCZ remains near the equator, while there are large northward movements on either side of the Indian Ocean. Summer (June-July-August) In the summer season the ITCZ reaches its northernmost position. In JJA the sun is overhead the northern tropics at noon. The large heating over the continents (Africa, America and SE-Asia) then pulls the ITCZ further northward over land than over the oceans. The average location over the oceans is approximately 10°N, with a peak up to 25°N over the W-Pacific warm pool in August.
73

Chapter 5
This corresponds to a patch of high equivalent potential temperatures in the model, corresponding to a region with vigorous convective activity. A vertical cross section through the western warm pool area (not shown) again reveals a narrow “pipe” of upward transport, typical of strong convection. Substantial tracer exchange is associated with the upper-tropospheric outflow where θe gradients are vertical rather than horizontal. Over the Central Pacific (150°W) there is strong interhemispheric exchange from the SH to the NH in the middle-upper troposphere (Figure 5.5a), corresponding to a patch of elevated θe in the NH subtropical upper troposphere facilitating the exchange (Figure 5.5b). Figure 5.5a also shows that part of the SH tracer is transported to the SH lowermost stratosphere of the mid-latitudes (south of 40ºS). This is associated with isentropic transport through the subtropical tropopause break located at 30ºS. Figure 5.5b shows that isentropes of θe slope upward from the upper tropical troposphere to the mid-latitude lowermost stratosphere. However, this is not the subject of the present study.
a b
Figure 5.5. Latitudinal vertical cross sections of (a) XS and (b θe (in K) at 150°W for June 30. The black line indicates the ITCZ.
In July the ITCZ over the Indian Ocean leaps from its location close to the equator to the Indian continent, followed by a second leap in July to almost 30°N when the warming of the Tibetan Plateau is strong enough and the monsoon circulation reaches its maximum strength. Generally it appears, however, that the flux from the NH to the SH at the surface is somewhat smaller than during DJF. It seems to be mostly due to exchange of NH air to the SH related to northward movement of the monthly mean ITCZ. The flux from the SH on the other hand, is larger than in DJF at all longitudes, especially over S-America (greenish shading in Figure 5.3c). Autumn (September-October-November) This season is characterized by rapid southward displacement of the ITCZ, particularly over India/SE-Asia in September and over the other continents a month later. This creates a flux of SH air into the NH. Exchange from the NH to the SH increases over the Pacific warm pool and the Central Pacific, as well as over S-America. Footprints of the monsoon circulation are visible over India/SE-
74

Tracer experiments with ECHAM4
Asia as patches of SH air enclosed north of the ITCZ by a sudden build up of the ITCZ much further south. These patches remain in the north for the winter season. Generally the major exchange areas correspond closely to convectively active regions. In these areas, θe maxima occur, coinciding with maxima in surface temperature and convective precipitation. The convection transports the air upward up to a level where the θe of the environment becomes greater than that of the air parcels. At this level (approximately 250-200 hPa) the convective outflow and the majority of interhemispheric exchange takes place. 5.4 Flux calculations In this section the results of the flux calculations are discussed. The discussion starts with the global interhemispheric air mass fluxes, followed by a description of the regional variations. The advantage of the use of a tracer with a mixing ratio of 1 is that rough estimates of interhemispheric transport of a variety of other tracers can be made by simply multiplying the tracer distribution at the end of the month by the mixing ratio of the tracer of interest. 5.4.1 Global interhemispheric mass fluxes Figure 5.6 depicts the vertically integrated global interhemispheric mass fluxes across the tracer ITCZ and the difference between them as a function of time.
Figure 5.6. Southward (S, solid line) and northward (N, long-dashed line) mass flux, and the difference (D = S-N) (dashed line) during the year. Mass flux given in 1010 kg/month.
The southward mass flux is roughly in phase with the northward return flux. The southward flux peaks in May with a mass exchange of 13x1010 kg. This corresponds to the large northward movement of the ITCZ, where grid boxes that were first in the NH suddenly become part of the SH. Maxima in northward tracer fluxes occur in February, in phase with southward fluxes, and in June, a month later than the maximum in the southward tracer flux. The magnitudes of southward and northward fluxes are similar in December, April and at the end of September/beginning of October. The total mass transported from the NH to the SH in one year is
75

Chapter 5
almost equal to the return flux and is of the order of 115-120x1010 kg. The annual mean total mass in the NH, i.e. north of the ITCZ, is 85x1010 kg. The monthly mean mass flux is approximately 10x1010 kg, i.e. 10-12% of the NH mass is transported across the ITCZ every month. This means that in 8-9 months the entire NH can be transported across the ITCZ. The annual mean total mass in the SH, i.e. south of the ITCZ, is larger than that of the NH, 104x1010 kg. The monthly mean mass flux of approximately 10x1010 kg then amounts to a mean monthly exchange of 9-10% of the SH mass. This means that it would take a little longer to transport the atmospheric mass of the SH over the ITCZ, namely 10-11 months. This concept of interhemispheric exchange timescales is illustrated by Figure 5.8, which shows the evolution of the interhemispheric exchange times of the NH and SH during the year. This will be further discussed at the end of this section. The annual mean size of the SH is not equal to that of the NH. If we consider the area of both hemispheres, defined as the area north and south of the line XD = XNH – XSH = 0, at the model surface (Figure 5.7a) it is clear that the hemispheres are asymmetrical.
a b
Figure 5.7. (a) Variation of the area (in km2) occupied by the NH (solid) and SH (dashdot) during the year. Also indicated are the annual mean areas: 2.3x10⁸ km2 (NH, solid line) and 2.7x10⁸ km2 (SH, dashdotted line). (b) The monthly and zonal mean location of the ITCZ. The annual mean location is approximately 4°N.
The NH is largest in January when the SH is smallest. At the end of March/beginning of April the hemispheres are about equal, followed by an expanding SH as the ITCZ enters the NH. The SH attains its maximum area in July/August. As the ITCZ migrates southward both hemispheres again become equal in size in November. The average area occupied by the SH atmosphere is 54% of the Earth’s surface. The NH thus occupies 46%. The average SH atmosphere is 8% larger than the NH on an annual mean basis. This corresponds to a mean location of the ITCZ at 4°N (see also Figure 5.7b).
The interhemispheric exchange time can be defined as the time it would take to empty an entire hemisphere, given a certain interhemispheric exchange flux [cf. Prather et al., 1987]:
76

Tracer experiments with ECHAM4
TNH = MNH/FNS (NH) and TSH = MSH/FSN (SH)
MNH and MSH are the total NH and SH mass and FNS and FSN are the vertically integrated fluxes from NH to SH and from SH to NH respectively. The monthly mean interhemispheric exchange times for the NH and SH are shown in Figure 5.8. The interhemispheric exchange times for the two hemispheres are nearly out of phase. In other words, when the ITCZ is most leaky to transports from one hemisphere, it is most impermeable with respect to the return flux from the other hemisphere. In summer, NH air masses are readily transported to the SH as is illustrated by the minimum in exchange time in August (4.5 months). SH air masses encounter a fairly impermeable barrier at the ITCZ at this time leading to an interhemispheric exchange time of almost 19 months. The situation is reversed during winter when the SH exchange time drops to 6.4 months and the NH exchange time increases to a maximum in November of 12.8 months and a second maximum in April of exactly one year.
Figure 5.8. The interhemispheric exchange time (in months) for the NH (TNH - solid) and SH (TSH - dashdot) during the year. Annual averages for TNH and TSH are respectively 8.9 months (0.74 years) and 11.4 months (0.95 years).
The annual mean interhemispheric exchange time is 8.9 months (0.74 years) for the NH and 11.4 months (0.95 years) for the SH. The latter is slightly larger, which is readily understood by recalling the definition of the SH interhemispheric exchange time, being the time needed for the entire SH mass to be transported across the ITCZ in a year given the annual mean northward flux. A larger SH
77

Chapter 5
(Figure 5.7a) compared to the NH with equal annual mean total exchange (115-120 x1010 kg) leads to a larger TSH. 5.4.2 Regional variations in the interhemispheric mass flux Table 5.1 lists the monthly mean southward and northward mass. These fluxes are calculated for different longitude bands of 30° width centered at 150°W, 70°W, 30°W, 0°, 30°E, 60°E, 90°E and 140°E. These longitudes are chosen because they correspond closely to the major monsoon regions and the oceans.
150°W 70°W 30°W 0° 30°E 60°E 90°E 140°E November 0.9
(0.79) 0.64 (1.29)
0.77 (0.77)
0.76 (0.8)
0.65 (0.82)
0.54 (1.03)
0.98 (1.06)
0.91 (1.26)
December 0.97 (0.49)
0.89 (1.27)
1.17 (0.96)
1.15 (0.93)
0.93 (0.97)
0.86 (1.02)
0.77 (1.11)
0.79 (0.85)
January 1.1 (0.82)
0.46 (1.06)
0.95 (1.05)
0.79 (1.03)
0.59 (1.03)
0.99 (1.19)
0.76 (1.1)
0.82 (0.92)
February 1.3 (0.86)
0.87 (1.38)
1.1 (0.94)
1.0 (1.01)
0.79 (1.17)
1.11 (1.43)
1.1 (1.64)
1.06 (0.97)
March 0.8 (1.21)
1.04 (1.39)
1.0 (1.13)
0.92 (1.29)
0.9 (1.02)
0.79 (0.96)
0.98 (1.02)
0.88 (0.93)
April 0.79 (0.95)
0.84 (0.82)
0.9 (0.7)
0.62 (1.01)
0.85 (0.69)
0.91 (0.65)
0.66 (0.73)
0.62 (0.73)
May 1.16 (0.63)
1.21 (1.02)
1.18 (1.33)
1.75 (0.89)
1.34 (1.05)
1.24 (1.03)
1.31 (0.75)
1.04 (0.99)
June 0.84 (1.31)
1.26 (1.37)
1.21 (1.23)
1.37 (1.02)
1.48 (0.76)
1.39 (0.72)
1.1 (1.14)
1.31 (0.96)
July 0.68 (0.6)
1.58 (0.77)
1.19 (0.7)
1.05 (0.7)
0.96 (0.46)
1.01 (0.38)
0.93 (0.23)
0.75 (0.57)
August 1.12 (0.84)
0.91 (0.71)
1.12 (0.77)
1.12 (0.64)
0.86 (0.64)
0.95 (0.5)
1.21 (0.39)
1.22 (0.82)
September 0.97 (0.87)
1.1 (0.69)
1.32 (0.78)
1.14 (0.52)
0.83 (0.61)
0.79 (0.68)
0.99 (0.95)
1.13 (0.73)
October 0.68 (1.05)
0.9 (0.76)
0.67 (0.67)
0.82 (0.56)
0.59 (0.7)
0.71 (0.59)
0.7 (0.76)
0.55 (0.89)
Annual mean
0.94 (0.87)
0.98 (1.04)
1.05 (0.92)
1.04 (0.87)
0.90 (0.83)
0.94 (0.85)
0.96 (0.91)
0.92 (0.89)
Table 5.1. Southward fluxes and northward fluxes (in brackets) across the ITCZ as a function of longitude band (±15° centered at the given longitude) and time. Fluxes are in 1010 kg/month.
From the table it can be seen that the maximum in the southward flux in May has a large contribution from the longitude band centered on 0° longitude, coinciding with large warming over
78

Tracer experiments with ECHAM4
this area (Figure 5.9a). The exchange does not take place at the surface (see Figure 5.3b) but mainly in the middle-upper troposphere. This is caused by convection related to the monsoon over W-Africa. The convection occurs in a region with elevated θe (Figure 5.9b). A maximum in convective precipitation (Figure 5.9c) coincides with the exchange region. Smaller peaks in the southward flux occur in February and August with exchange again occurring mainly at upper-tropospheric levels (see for example Figure 5.4a). Also most of the northward flux maxima in February and June are associated with convective areas with ‘chimney like’ vertical tracer distributions. Maxima in θe and in the convective precipitation confirm this. Annual mean fluxes in Table 5.1 show that the southward fluxes are roughly the same for all longitudes with a small maximum at 0 and 30°W (mainly in May and September, respectively) and a minimum at 30°E (mainly in January and October). The range of SH fluxes is slightly larger and peaks at 70°W (in February, March and June) with a minimum over the Indian Ocean (in July). The largest monthly mean flux occurs at 0° longitude in May for the NH and at 90°E in February for the SH, the latter being coincident with the Indian winter monsoon. The smallest fluxes are found in January at 70°W for the NH and at 90°E in July for the southern fluxes. Minima are a factor of 4 to 7 smaller than the maxima of the southward and northward fluxes respectively.
a b c
Figure 5.9. (a) Monthly mean surface temperature (in K) in May. (b) θe (in K) at the surface on 30 May. (c) Convective precipitation (in m/s) on 30 May.
5.5 The timescales for interhemispheric exchange On an annual mean basis approximately 1010 kg air crosses the ITCZ in a month in both directions. Given that the annual zonal mean ITCZ is located approximately 4° north of the equator in our model, the size of the SH is about 8% larger than that of the NH. Satellite observations of ITCZ cloudiness indicate a somewhat larger mean northward displacement of 6°N [Waliser and Gautier, 1993]. Our results, however, indicate that the ITCZ is not a straight vertical so that our ITCZ definition, pertaining to the surface, may deviate from that of Waliser and Gautier [1993]. Our coarse grid resolution of about 3.75º may also contribute to the discrepancy. The annual mean interhemispheric exchange time is defined as the total hemispheric mass divided by the vertically integrated hemispheric flux [Prather et al., 1987]. It is important to note that the interhemispheric exchange times (TSH for the SH and TNH for the NH) are calculated from the full three dimensional
79

Chapter 5
(3D) tracer distributions and not just from the surface distributions since an important part of the interhemispheric exchange takes place in the middle-upper troposphere. Given that the SH is larger than the NH and that annual mean fluxes are equal for both hemispheres (1010 kg/month), this leads to a larger annual mean TSH compared to TNH (0.95 years vs. 0.74 years). This annual mean interhemispheric exchange time of slightly less than a year is comparable to that found in studies based on other tracers. Annual mean exchange times based on 3D mass fluxes from an SF6 model intercomparison study (TransCom2) ranged from 0.55-1.26 years [Denning et al., 1999]. Values at the lower end of this range corresponded to models with strongest vertical mixing. Kjellström et al. [2000], using the ECHAM4 model with SF6 tracers, found an interhemispheric exchange time of 0.9 years. This was slightly lower than previous estimates based on SF6 tracers, which, together with the too weak interhemispheric gradient in SF6 in the model, indicated that the tropospheric interhemispheric exchange in ECHAM4 is slightly too strong. On the other hand, ECHAM4 did reproduce the main features of the observed SF6 pattern, both in space and time. This gives confidence in the overall performance of the model. Rind et al. [2001] used the Goddard Institute for Space Studies (GISS) Global Climate Middle Atmosphere Model and computed exchange times of 1.19 years for SF6 and 1.07 for CFC-11. Earlier experiments with CFC-11 [Gilliland and Hartley, 1998] yielded exchange times of 0.6 years with the Community Climate Model Version 2 (CCM2) of the National Center for Atmospheric Research (NCAR) and 1 year with a more recent version of that model (CCM3). The seasonal cycles of TSH and TNH show a distinct anticorrelation. A leaky ITCZ for the southward mass flux (small TNH) corresponds to an impermeable barrier for the northward flux (large TSH) and vice versa. Air masses from each hemisphere most easily cross the ITCZ during the solstices (i.e. in JJA for the southward flux and DJF for the northward flux). The results for the NH tracer (TNH) can be compared with the SF6 results from Kjellström et al. [2000] since SF6 is predominantly emitted on the NH. The seasonal cycles of the interhemispheric exchange time in both studies agree very well, both in range of minimum and maximum exchange times and in timing of these events. Kjellström and co-workers calculate a maximum in TNH in April and October and a minimum in June. 5.6 Discussion Approximately as much air crosses the ITCZ from the NH to the SH as the other way around. Some of this exchange takes place at the surface as shown in Figure 5.3. In boreal winter substantial interhemispheric exchange of air masses occurs over the Pacific warm pool (130-180°W) and over S-America. Over the Indian Ocean there is a large northward flux into the NH associated with rapid southward migrations of the ITCZ that cause considerable instantaneous exchange. The boreal spring season is characterized by an overall northward migration of the ITCZ associated with the seasonal cycle in solar heating. Over the oceans this migration is more gradual than over the continents. In May the ITCZ has moved well into the NH at all longitudes except over the Indian Ocean where the meridional propagation has a different pace. Corresponding to the northward ITCZ displacement, large influxes of NH air into the SH take place at the surface throughout spring. In boreal summer the ITCZ reaches its northernmost position. Large northward shifts of the Indian Ocean ITCZ during this season make it “catch up” with the ITCZ at other longitudes, and subsequently it passes further north. Surface fluxes from the SH are relatively large at all longitudes,
80

Tracer experiments with ECHAM4
especially in July. The vertically integrated SH mass flux, however, is at minimum in July (Figure 5.6). Also, interhemispheric exchange times of the southern atmosphere are longest during summer (Figure 5.8), indicating a relatively strong ITCZ barrier. Apparently, this impermeability applies predominantly to the middle-upper troposphere and not to the surface. Northward surface fluxes further increase during boreal autumn in line with the rapidly retreating ITCZ toward the SH. At the same time, southward fluxes over the Pacific warm pool and S-America increase again. Gradients of tracer generally correspond to gradients in θe at the surface. It thus seems that there are three major regions at the surface: the ‘inner tropics’ and the NH and SH subtropics. The ‘inner tropics’ characterize a sector of strong interhemispheric mixing at the surface. In the middle-upper troposphere, on the other hand, interhemispheric mixing takes place through outflow of tropical convection in the subtropics. The importance of the middle to upper troposphere in the interhemispheric exchange is exemplified by vertical cross sections of the tracer distributions. Generally it seems that the regions of maximum interhemispheric exchange (for example over the Pacific warm pool) at the surface are collocated with deep convection, which readily mixes the tracers between the hemispheres. Maxima in θe coincide with maxima in the surface temperature and convective precipitation. Convection carries the tracers upwards until the level of neutral buoyancy is reached, which is usually at 350-200 hPa (approximately 8-12 km). At this level quasi-horizontal transport away from the convective core takes place, creating an extensive anvil cloud. Turbulence by differential radiative and evaporative cooling and by a variety of cloud/environment interactions in these high clouds will detrain the air masses further into the upper troposphere. The largest fraction of the outflow and thus interhemispheric exchange is thus centered in the middle-upper troposphere at 8-12 km, corresponding to a strong vertical and a weak horizontal gradient in θe. This agrees with the findings by Folkins et al. [1999] who report that tropical convection rarely penetrates deeper than 14 km, several km below the local tropopause. Other studies also indicate that the main transport path between the hemispheres is via the so-called mid- to upper-tropospheric ‘tracer fountain’ [Holzer and Boer, 2001] at the ITCZ [Hartley and Black, 1995; Gilliland et al., 1998; Gregory et al., 1999; Lu et al., 2000]. Gregory et al. [1999] found that the ITCZ and the South Pacific Convergence Zone (SPCZ) are most effective as barriers at low altitudes (below 5 km). Between 8 and 10 km cross-equator flow was found to occur. An interhemispheric exchange ‘channel’ in the middle-upper troposphere also shows up from trajectory studies where air masses are traced backwards in time to their origin [Zachariasse et al., 2001]. The presented 3D tracer distribution highlights the important role of the global monsoon circulation in the transport of tracers. Footprints of the monsoon circulation are visible, particularly over India/SE-Asia, as patches of SH (NH) air enclosed in the NH (SH) by a sudden build up of the ITCZ much more to the south (north). Webster et al. [1998] and Trenberth et al. [2000] have presented overviews of the global monsoon in terms of a persistent large-scale overturning of the entire tropical and subtropical atmosphere that varies with season. In the model the exchange takes place at the surface and in the middle-upper troposphere associated with rapid migrations of the ITCZ into the summer hemisphere. Differential heating of land and ocean causes the monsoon circulation to pull the ITCZ further onto the NH over the continents than over the ocean [Trenberth et al., 2000]. This seasonal migration is well represented by the model; the large northward shift takes place in April/May and the large southward migration in September/October. The Indian/SE-Asian monsoon is strongest, with a northward migration of almost 50° (from 20°S to 30°N) during the course of a
81

Chapter 5
year. The Chinese/E-Asian monsoon, which is also more east-west oriented [Trenberth et al., 2000], is not strong enough to pull the W-Pacific ITCZ as far northward as the Indian monsoon in July and August. It does create a zone of surface wind convergence (Figure 5.10) that coincides with a distinct θe maximum (not shown) in the NH but this does not trigger a strong ITCZ in the model. Further east, the model simulates the SPCZ stretching southeastward from New Guinea to 150 W. This zone is most active during austral summer [Vincent, 1994] when it also influences the tracer distribution (Figure 5.3). Although tropical deep convection is the dominant interhemispheric exchange process, other mechanisms may also cause some interhemispheric transport. Prinn et al. [1992] first noted that synoptic-scale Rossby waves propagating through the tropical upper-tropospheric westerly winds of the Walker circulation could be responsible for interhemispheric transport. This mechanism is modulated by El Niño and La Nina phases. Hartley and Black [1995] used the CCM2 model with CFC-11 to study the importance of this mechanism for interhemispheric exchange relative to convective divergence in the upper troposphere. They concluded that Rossby-wave propagation between the hemispheres contributed significantly less to cross-equatorial transport than convection. Tropical cyclones formed within tropical disturbances in the ITCZ caused by easterly waves may lead to ITCZ breakdown and therefore to interhemispheric transport. If the ITCZ moves away from the equator the Coriolis force becomes more important. This may cause other synoptic disturbances such as cyclones to play a more important role in the interhemispheric exchange process. The position of the ITCZ relative to the equator is thus important, which is in turn modulated by the global monsoon.
Figure 5.10. Monthly mean wind divergence at the surface for November. Blue shading indicates convergence.
The cause of the asymmetry in the preferred NH latitude of the E-Pacific and Atlantic ITCZ found in this study has been the subject of several studies [Waliser and Somerville, 1994; Philander et al., 1996; Xie, 1996; Li, 1997; Wang and Wang, 1999]. Observations have shown that the ITCZ generally resides over the warmest surface waters. These do not occur at the equator, as would be expected from the symmetric solar radiation cycle, but on average north of the equator. In fact, in
82

Tracer experiments with ECHAM4
the E-Pacific there is a strong cold tongue at and south of the equator due to upwelling caused by the prevailing easterlies. According to numerical experiments by Li [1997] the key to the problem lies in the complex ocean-atmosphere interactions with the geographical distribution of continents (especially the tilt of the western coast of the Americas) playing a crucial role. Three types of positive feedback processes convert a symmetric state to an asymmetric one. These are: (1) the meridional wind-SST feedback, (2) the evaporation-wind feedback, and (3) the low-level stratus cloud-SST feedback. It is beyond the scope of this paper to discuss this at length, and we refer to Li [1997] and aforementioned authors for more details. The northward displacement with respect to the equator of the annual mean ITCZ (about 4°N) has major implications for the interhemispheric exchange of pollutants that are mainly emitted on the NH continents. The major upwelling regions of the ITCZ limit tropospheric mass transport between the hemispheres at low altitudes [Gregory et al., 1999]. Consider for example anthropogenic emissions of gases and aerosols by biomass burning, fossil fuel combustion and the use of biofuels in India and SE-Asia [Lelieveld et al., 2001]. Largely emitted on the NH, they affect the radiation balance and the chemistry of the tropical troposphere. The transport of these species into the more pristine SH largely depends on the permeability of the ITCZ. However, the fact that part of the NH pollution is directly emitted into the SH atmosphere (i.e. south of the ITCZ) could greatly affect the effects of man-made pollution. This must be taken into account, especially since anthropogenic emissions are strongly increasing in this part of the world. According to this study the vertically integrated southward fluxes from the major emission areas in Africa, India and SE-Asia are maximum in May at 0°W and 90°E and a month later at 30, 60 and 140°E. Smaller maxima occur toward the end of summer for 90 and 140°E. In winter, as the overall TNH increases, the southward flux of NH air decreases at all longitudes to approximately half of the maximum fluxes. It is during the winter season that the pollution loading in the continental boundary layer is largest due to the threefold effect of the monsoon anticyclones (especially over the Tibetan Plateau), the onset of the biomass burning season and the trapping of pollutants in the continental boundary layer. In conclusion, the model simulation of hemispheric air tracers reproduces many of the observed characteristics of the tropical circulation. The seasonal migration of the ITCZ, the monsoon influence on the tracer distribution, and the main transport via deep convection associated with the ITCZ are captured. The latter stresses the importance of the parameterizations of convection and subgrid-scale vertical transport. Studies on the robustness of the results to the choice of the convection scheme and the resolution are therefore important topics for future research. Another interesting topic is to extend the simulation to realistic tracers such as SF6. In that case meteorology should be used through nudging to enable comparison with measurements. 5.7 Conclusions A methodology for determining the amount of air that is exchanged between the hemispheres has been presented. Two experiments have been performed with the ECHAM4 general circulation model, one to determine the ITCZ location and a second one to compute the flux of air across this ITCZ. A precise definition of the ITCZ has been developed in terms of the difference between the NH and SH tracer mixing ratios at the surface (XD = XNH-XSH = 0). The present study does not
83

Chapter 5
attempt to simulate the structure of any particular, real constituent. Artificial tracers have been used with infinite lifetimes and initial mixing ratios of 1. This ensures that the tracer distributions are solely determined by transport processes so that the ITCZ is most clearly marked. It also simplifies the budget calculations. The main conclusions are:
1. The method to evaluate interhemispheric transport enables accurate definition of the ITCZ.
2. Approximately 115-120x1010 kg air crosses the ITCZ in a year in both directions.
3. The annual mean interhemispheric exchange time is 0.95 years for the SH and 0.74 years for the NH.
4. The average location of the ITCZ in our model is at 4°N. This implies an 8% larger size of the SH atmosphere compared to the NH.
5. Air masses from one hemisphere cross the ITCZ most easily during the solstices (boreal summer for the southward flux and austral summer for the northward flux).
6. Convection is an important mechanism of interhemispheric transport, with outflow of tropical convection occurring between 350-200 hPa (8-12 km) in the subtropics associated with strong vertical and weak horizontal θe gradients.
7. Interhemispheric mixing at the surface appears to be restricted to a region of maximum θe. This region (‘inner tropics’) is bounded by strong θe gradients at the subtropics.
84

85

86

Summary and outlook
6
Summary and outlook In this thesis the effects of transport from the stratosphere to the troposphere and between the hemispheres, on the tropospheric trace gas distribution were studied. A combination of measurements of O3, trajectory calculations and meteorological fields was used to study stratosphere-troposphere exchange. Interhemispheric exchange was studied by performing tracer simulations with the ECHAM4 model. The conclusions from these studies will be summarized below. An outlook on future research concludes the thesis. 6.1 Summary The following five main questions were addressed:
1. What role do transport processes play in shaping the vertical O3 profiles over the Indian Ocean during the winter monsoon?
2. How do differences in climatological conditions affect these transport processes and in particular the exchange between the stratosphere and the troposphere?
3. How well do models simulate the transport processes that affect the tropical O3 profiles?
4. How much air is exchanged between the northern and southern hemisphere in a year?
5. Where and how does interhemispheric exchange occur? 1 What role do transport processes play in shaping the vertical O3 profiles over the Indian Ocean during the winter monsoon? The picture that emerges from analyzing O3 measurements from three (pre) INDOEX campaigns is that O3 profiles over the Indian Ocean are determined by a complex interplay between different transport processes. Overall, there appears to be a large vertical variation in the direction and speed of the prevailing winds, which results in an atmosphere that consists of distinct layers, in terms of chemical composition, that are transported over large distances. This leads to alternating maxima and minima in the O3 profiles.
87

Chapter 6
Lower troposphere Outflow from the polluted boundary layer over India/SE Asia by the monsoon northeasterlies causes O3 maxima (40-50 ppbv) in regions close to the continents. This is consistent with the relatively high CO levels measured in 1995, pointing to a continental source of the air masses. O3 enhancement was also found in outflow regions from the African continent, indicative of biomass burning influences. The large-scale subsidence brought about by the Asian monsoon high-pressure area leads to a very stable boundary layer over southern Asia and the northern Indian ocean. If the low level outflow of pollution remains above the MBL, O3 maxima can retain their signature over fairly long distances. However, if the pollution outflow is trapped in the marine boundary layer (MBL1) the O3 concentration decreases rapidly during transport over the ocean due to efficient photochemical O3 destruction. Moreover, exchange with the relatively O3-richer free troposphere is suppressed by the large-scale subsidence. During its southward transport over the ocean the air mass encounters different cloud regimes, from low level boundary layer clouds to deep cumulus clouds associated with cyclones and the ITCZ. Destruction mechanisms involving low level clouds and aerosols further lower the O3 concentration to 10-20 ppbv. Once this O3-poor MBL air encounters tropical cyclones or the cumulus towers in the ITCZ, large-scale O3 minima are created in the upper-tropospheric convective outflow. The outflow is fairly narrow and confined to roughly the 13-16 km region. The rapid upward transport occurs without much mixing with free-tropospheric air. Such O3 minima in the upper troposphere were first observed during the Central Equatorial Pacific Experiment [Kley et al., 1996]. Middle troposphere The transport processes that influence the O3 concentration in the middle troposphere are mainly mid-tropospheric outflow of polluted African air and intrusions from the stratosphere. Often confined layers of enhanced O3 concentration in combination with low relative humidity were found between 5-8 km. Probable mechanisms to bring stratospheric air to the troposphere are shear-induced differential advection and clear air turbulence (CAT) near the subtropical jet stream (STJ) in the upper troposphere. Evidence for tropopause folds was not found. These O3-rich air masses near the STJ can be transported downward into the mid-troposphere by subtropical anticyclones. This downward transport dries the air. Since O3 concentrations in the mid-tropospheric maxima do not have purely stratospheric values, it is likely that considerable mixing with tropospheric air occurred during long-range transport from the STJ. In addition, local photochemical O3 production may also play a role in these dry mid-tropospheric layers. In a few cases interhemispheric transport was observed, which led to a supply of air from both the northern STJ and the southern STJ in the mid-tropospheric maxima. The interhemispheric transport took place mostly in the upper troposphere.
1 The MBL extends from the surface to roughly 3 km. The MBL height increases southward where large-scale subsidence from the monsoon high-pressure area fades and the moist static energy of the air mass has increased during the transport over the ocean.
88

Summary and outlook
Upper troposphere The upper troposphere is influenced even stronger by the stratosphere. In this region O3 concentrations were generally very high (varying from 100 ppbv up to 150 ppbv). Maxima in the form of thin layers (laminae) were observed just below the tropopause (between 14-16 km). These laminae also originate from STE near the STJ and are likely caused by shear-induced differential advection possibly accompanied by CAT. In the absence of subsidence these laminae can be transported quasi-horizontally quite far away from the STJ into the deep tropics. The O3 concentrations in laminae close to the equator are as high as those close to the STJ. This suggests that mixing is not as important as for the more diluted mid-tropospheric maxima, which undergo stronger influences from convection and turbulence during transport. Dynamical stratospheric signatures, such as elevated PV and θ, were found for several laminae. Horizontal PV maps in the upper troposphere illustrate the stripping of laminae from the STJ. Stratospheric inputs have been found in the tropics by others [Newell et al., 1996, 1999; Browell et al., 1996; Wu et al., 1997; Fenn et al., 1999], but the frequently occurring presence of stratospheric laminae just below the tropopause up to the equator is a new finding of this study. 2 How do differences in climatological conditions affect these transport processes and in particular the exchange between the stratosphere and the troposphere? It appears that upper-tropospheric O3 maxima and minima are a permanent feature of the tropical troposphere over the Indian Ocean, even under widely different climatological regimes such as El Niño and La Nina, or the different phases of the QBO. However, the character of these maxima differs somewhat. Most often O3 enhancements take the form of laminae but in another climatological state they can also be shaped like ‘transition zones’ between tropospheric and stratospheric values. These transition zones are frequently associated with a double tropopause in the form of two temperature minima. The chemopause in O3 is then well below the upper tropopause. The existence of such a layer is consistent with findings by Folkins et al. [1998]. These authors argue that the O3-rich transition zone is mainly caused by in-situ O3 production associated with slow upward diabatic ascent from the mean outflow level of convection at 14 km altitude. The analysis presented in this thesis points to a more prominent role for the stratosphere. The STE mechanism is found to be similar for both types of upper-tropospheric ozone maxima, namely STE associated with the shear zone around the STJ. The difference between the laminae and the transition zones is that the O3-rich air in the transition zones is supplied by two separate regions, the northern and the southern STJ, whereas the laminae are only fed by one region. This double branch transport is regulated by anticyclones over the Pacific Ocean. A slight shift in their position and one or both of the branches will be cut off. In conclusion, the extratropical stratosphere appears to feed O3 to the tropical upper and middle troposphere from both the northern and the southern hemisphere. Deformations of the STJ regularly extend into the deep tropics and after some time are pulled back into the STJ. This transport is modulated by mesoscale systems. Part of the intrusions remain in the upper troposphere and part descends to the middle troposphere. Evidence was found that during the time interval between
89

Chapter 6
entrance and exit from the troposphere mixing of the laminae with tropospheric air occurs. This implies that at least part of the O3 transport is irreversible. 3 How well do models simulate the transport processes that affect the tropical O3 profiles? The ECHAM4 model was nudged toward ECMWF meteorological fields in Chapter 4 to enable comparison with measurements of O3 on a day-to-day basis. The horizontal resolution of the model was 3.75ºx3.75º with 15 vertical layers up to 100 hPa (roughly 19 km). Comparison with near-surface measurements from a ship crossing the western part of the Indian Ocean demonstrated that the model was capable of producing the observed latitudinal trend in the MBL O3, although concentrations were overestimated by 6 (± 3) ppbv on average. This is probably caused by a missing destruction mechanism. Halogen chemistry is a candidate for this [de Laat et al., 1999]. Comparison with observed vertical profiles showed that ECHAM4 is capable of simulating general features such as low surface concentrations, increasing concentrations with height and upper-tropospheric O3 minima caused by large-scale ITCZ outflow and tropical cyclones. The tropopause height is also well represented. Small-scale features in the upper troposphere, such as laminae and thin minima, are not captured by the model. In regions of large O3 gradients the results are very sensitive to the resolution of the model. Small shifts due to the size of the grid cells can create large over- or underestimations of the concentrations. In the polluted middle troposphere ECHAM4 underestimates the O3 concentrations. This might be related to missing higher hydrocarbon chemistry [Roelofs et al., 1997] or underestimated sources. Overall it can be concluded that ECHAM4 is able to simulate the large-scale transport processes and the related tracer transports. Improved chemistry in the model could remove the over- and underestimations of O3 in the MBL/upper troposphere and the middle troposphere. The strong small-scale vertical gradients require an ultra fine vertical model resolution, which is not presently available from the ECMWF meteorological fields and the trajectories that are based on it. In the strong shear zone around the STJ, a small vertical displacement on the order of the model resolution can result in very different trajectories. Therefore, in some cases it was difficult to attribute a distinct origin to the thin laminae based on trajectory analyses. For the same reason (strong gradients of PV associated with the tropopause break at the STJ) stratospheric PV signatures were not always found along the trajectories. 4 How much air is exchanged between the northern and southern hemisphere in a year? Tracer simulations have been performed with the ECHAM4 general circulation model. The tracers were chosen so that they represent air. They have no sources and sinks so that their evolution is determined solely by transport processes. On an annual mean basis roughly 115-120x1010 kg air crosses the ITCZ from each hemisphere. Maximum cross-ITCZ exchange occurs during the solstices (boreal summer for the southward flux and austral summer for the northward flux). The annual and
90

Summary and outlook
zonal mean ITCZ is located at about 4ºN in the model. This implies that the size of the SH atmosphere is roughly 8% larger than that of the NH. The interhemispheric exchange time is defined as the time it would take to exchange the atmosphere of an entire hemisphere given a certain interhemispheric exchange flux. With similar annual mean fluxes in both directions across the ITCZ the larger size of the SH atmosphere leads to a somewhat larger interhemispheric exchange time for the SH (0.95 years) than for the NH (0.74 years). This new estimate is well within the range obtained from real tracer simulations with various models. 5 Where and how does interhemispheric exchange occur? The transport of the tracers is dominated by the global monsoon circulation where rapid migrations of the ITCZ take place in April-May (northward) and September-October (southward), especially over the continents. The exchange of air between the hemispheres occurs primarily in the middle to upper troposphere (8-12 km), namely in the convective outflow regions of the model ITCZ. This is consistent with the observation of large-scale O3 minima in the upper troposphere during the INDOEX campaigns. These could be attributed to convective lofting of O3-poor MBL air, with convective outflow confined between roughly 13-16 km height. Trajectories also showed interhemispheric exchange occurring in the upper-tropospheric layer between the top of the convection and the tropopause. Exchange at the surface is consistent with the existence of three distinct regions separated by θe barriers: The ‘inner tropics’, and the NH and SH subtropics. The first region is characterized by strong mixing near the surface, whereas in the subtropics interhemispheric mixing occurs through outflow from tropical convection in the middle to upper troposphere. The latter region is associated with strong vertical and weak horizontal θe gradients. 6.2 Outlook Towards the end of a thesis one is always left with more ideas than time, and the realization that the work is far from finished. A number of interesting directions for future research have become apparent, some as a direct continuation of this research, and some with a broader tropical perspective. One such direction would be to explore the chemical implications of the blending of all the different air masses in the tropics. A simple way to do this would be to apply box models with extensive chemistry. Another option is to quantify the total influx of the stratospheric O3 intrusions in the tropics and to compare this to contributions from other sources. This might be done with model calculations in which stratospheric O3 is labeled. Unfortunately, most atmospheric models do not have sufficient vertical resolution to simulate the very thin stratospheric intrusions just below the tropopause. Unless techniques such as vertical ‘zooming’, in which part of the model domain is treated at higher resolution, become available in regional or global models with chemistry, this approach will probably not be feasible in the near future. Another approach is to start back trajectories from the upper troposphere in the entire tropical band and to calculate the percentage that passed near the STJ regions. Assuming that the air in this region is strongly influenced by the stratosphere either by
91

Chapter 6
CAT, filamentation, or by isentropic transport from the subtropical stratosphere, this would give an estimate of the frequency of stratospheric intrusions. It may also indicate preferred areas that are likely to be affected by stratospheric intrusions. In combination with forward trajectories, computed from the same starting points as the back trajectories, this can provide a conservative estimate of the frequency of total irreversible transport from the stratosphere to the entire tropical troposphere as a function of time. Combining this with measurements of the amount of stratospheric O3 in these intrusions yields an estimate of the relative importance of stratospheric intrusions to the total tropical tropospheric O3 budget. Seasonal and interannual variability due to the QBO and ENSO, for example, may also be studied in more detail. To ensure an unambiguous attribution to a stratospheric origin, measurements of trace gases other than O3, such as CO, odd nitrogenoxides, radon, specific humidity or 14C, are needed. Initiatives for frequent measurements of the tropical upper troposphere, such as CARIBIC [Brenninkmeijer et al., 1999], where O3-, aerosol and a multitude of other instruments are incorporated in a cargo container on board of a civil aircraft, are therefore very valuable. Also, high resolution satellite measurements of O3 in combination with water vapor could provide information on STE. Occasionally, trajectories also showed interhemispheric exchange in the upper troposphere. A flow channel along the east coast of Africa connects the transition layer of both hemispheres. It would be interesting to investigate how much of the air in the upper troposphere of one hemisphere originates from the STJ of the other hemisphere. As far as the tracer study with ECHAM4 is concerned, once everything was working properly new ideas for investigations kept popping up. The present study has been kept as simple as possible to test the method and to make a first order estimate of how much air is exchanged between the hemispheres in a year and to identify preferred areas. The tracer run was performed for only one year. Extending the study to multiple-year runs would be useful for an investigation of the year-to-year variability. Also, the transport to the stratosphere was not studied, whereas this is an interesting topic in the light of the stratosphere-troposphere exchange discussed above and in the light of the global-scale wave-driven pump. After all, trace gases injected into the stratosphere are eventually sucked up into this circulation. Also, isentropic transport to the lowermost stratosphere at mid-latitudes could be studied. Another topic for future research would be to study the effects of using finer vertical model resolutions. For example: what is the effect of incorporating smaller-scale processes on the annual mean flux of interhemispheric transport? What happens to the preferred areas of exchange? Does the annual and zonal mean location of the ITCZ change (now at 4ºN)? The large-scale circulation features are well captured at T30 (~3.8º) and increasing the resolution to T42 (~1.8º) or T63 (~2.8º) will probably not induce great changes. However, convection was found to be a key process. At T106 (~1.1º) the resolution is on the order of the scales of tropical cyclones and the large cloud clusters in the ITCZ. A refinement to this resolution can be expected to lead to changes in the simulations and estimates. Along the same lines it is recommendable to test the sensitivity of the results to the choice of convection scheme. Coupling ECHAM4 to a slab ocean model instead of fixed climatological SSTs may also influence convection and is therefore worth studying. More sophisticated studies are also possible. For example, different tracers for land and sea could be introduced. Or the model could be nudged toward actual meteorology. In combination with higher resolution, realistic tracers (i.e. SF6, CO, OH) and chemistry routines, this would allow for evaluation of the tracer transport by comparison with measurements. At the same time, the influence
92

Summary and outlook
of nudging on the fluxes through the tropopause might be studied. The work in this thesis was intended as a contribution to the understanding of the tropical circulation. It showed that the tropical upper and middle troposphere is a location where many different air masses (from the troposphere and the stratosphere, from the northern and the southern hemisphere midlatitudes and tropics) converge. Further studies are needed to explore all the aspects of the tropical circulation and its implications for the chemistry and climate of the tropical troposphere. Integrated studies with both measurements and models, such as INDOEX, provide both the detail and the large-scale framework that is needed for this kind of studies.
93

94

Bibliography
Bibliography A
Ambaum, M.H.P., Large-scale dynamics of the tropopause. Ph.D. thesis, Eindhoven University, 1997. Antikainen,V., and Paukkunen, A., Studies on improving humidity measurements in radiosondes, in Instruments and Observing Methods, WMO Global Atmos. Watch Rep. Ser., Rep. 57 (Tech. Doc. 588), P. 137-141, World Meteorol. Org., Geneva, 1994. Appenzeller, C., H.C. Davies and W.A Norton, Fragmentation of stratospheric intrusions. J. Geophys. Res., 101, 1435-1456, 1996. Appenzeller, C. and J. R. Holton, Tracer lamination in the stratosphere: a global climatology. J. Geophys. Res., 102, 13.555-13.569, 1997. Arkin, P.A., The relationship between interannual variability in the 200 mb tropical wind field and the Southern Oscillation, Mon. Weather Rev., 110, 1393-1404, 1982.
B Baldy, S., G. Ancellet, M. Bessafi, A. Badr and D. Lan Sun Luk, Field observations of the vertical distribution of tropospheric ozone at the island of Reunion (southern tropics). J. Geophys. Res., 101, 23.835-23.849, 1996. Baray, J.L., G. Ancellet, F.G. Taupin, M. Bessafi, S. Baldy and P. Keckhut, Subtropical tropopause break as a possible stratospheric source of ozone in the tropical troposphere. J. Atmos. Terr. Phys., 60, 27-36, 1998. Barnett, T.P., The interaction of multiple time scales in the tropical climate system, J. Clim., 4, 269-285, 1991. Benkovitz, C.M., M.T. Scholtz, J. Pacyna,L. Tarrason, J. Dignon, E.C. Voldner, P.A. Spiro, J.A. Logan, and T.E. Graedel, Global gridded inventories of anthropogenic emissions of sulfur and nitrogen. J. Geophys. Res., 101, 29.239-29.254, 1996. Bowman, K.P., and P.J. Cohen, Interhemispheric exchange by seasonal modulation of the Hadley circulation. J. Atmos. Sci., 54, 2045-2059, 1997. Bremaud, P., J.F. Taupin, A.M. Thompson and N Chaumerliac: Ozone nighttime recovery in the marine boundary layer: Measurement and simulation of the ozone diurnal cycle at Reunion Island. J. Geophys. Res., 103, 3463-3473, 1998. Brenninkmeijer, C.A.M. and 15 others, CARIBIC – Civil aircraft for global measurement of trace gases and aerosols in the tropopause region. J. Atmos. Oceanic Technol., 16, 1373-1383, 1999. Brewer, A.W., Evidence for a world circulation provided by the measurements of helium and water vapour distribution in the stratosphere. Q. J. R. Meteorol. Soc., 75, 351-363, 1949.
95

Bibliography
Brill, K.F., L.W. Uccellini, J. Manobianco, P.J. Kocin and J.H. Homan, The use of successive dynamic initialization by nudging to simulate cyclogenesis during GALE IOP 1. Meteorol. Atmos. Phys., 45, 15-40, 1991. Browell, E.V., and 21 others, Large-scale air mass characteristics observed over western Pacific during summertime. J. Geophys. Res., 101, 1691-1712, 1996.
C Cammas, J.-P., S. Jacoby-Koaly, K. Suhre, R, Rosset and A. Marenco, Atlantic potential vorticity barrier as seen by Measurements of ozone by Airbus In-Service Aircraft (MOZAIC) flights. J. Geophys. Res., 103, 25.681-25.693, 1998. Chameides, W.L., The photochemical role of tropospheric nitrogen oxides. Geophys. Res. Lett., 5, 17-20, 1978. Chapman, A theory of upper-atmospheric ozone. Memoirs Roy. Meteorol. Soc., III, 103, 1930. Charlson, R.J., S.E. Schwartz, J.M. Hales, R.D. Cess, J.J.A. Coakley, J.E. Hansen, and D.J. Hofmann, Climate forcing by anthropogenic aerosols. Science, 255, 423-430, 1992. Chatfield, R.B., J.A. Vastano, L. Li, G.W. Sachse and V.S. Connors, The great African plume from biomass burning: Generalizations from a three-dimensional study of TRACE A carbon monoxide. J. Geophys. Res., 103, 28.059-28.077, 1998. Chen, C.T., and E. Roeckner, Validation of the earth radiation budget as simulated by the Max Planck Institute for Meteorology general circulation model ECHAM4 using satellite observations of the Earth Radiation Budget Experiment. J. Geophys. Res., 101, 4269-4287, 1996. Chester, R., A.S. Berry and K.J.T. Murphy: The distribution of particulate trace metals and mineral aerosol over the Indian Ocean. Marine Chemistry, 43, 261-290, 1991. Crutzen, P.J., A discussion of the chemistry of some minor constituents in the stratosphere and troposphere. Pure Appl. Geophys., 106-108, 1385-1399, 1973. Crutzen, P.J., Photochemical reactions initiated by and influencing ozone in unpolluted tropospheric air. Tellus, 26, 47-57, 1974. Crutzen, P.J., L.E. Heidt, J.P. Krasnec, W.H. Pollock and W. Seiler, Biomass burning as a source of atmospheric gases CO, H2, N2O, CH3Cl and COS. Nature, 282, 253-256, 1979. Crutzen, P.J., A.C. Delany, J. Greenberg, P. Haagenson, L. Heidt, R. Lueb, W. Pollock, W. Seiler, A. Wartburg and P. Zimmerman, Tropospheric chemical composition measurements in Brazil during the dry season. J. Atmos. Chem., 2, 233-256, 1985. Crutzen, P.J., My life with O3, NOx, and other YZOx compounds (Nobel Lecture). Angew. Chem. Int. Ed. Engl., 35, 1758-1777, 1996. Crutzen, P.J. and V. Ramanathan, Foreword. J. Geophys. Res., 106, 28.369-28.370, 2001.
D Danielsen, E.F., A dehydration mechanism for the stratosphere. Geophys. Res. Lett., 9, 605-608, 1982. Danielsen, E.F., In situ evidence of rapid, vertical, irreversible transport of lower tropospheric air into the lower tropical stratosphere by convective cloud turrets and by larger-scale upwelling in tropical cyclones. J. Geophys. Res., 98, 8665-8681, 1993. Denning, A.S., and 13 others, Three-dimensional transport and concentration of SF6, a model intercomparison study (TransCom2). Tellus, 51B, 266-297, 1999. Dickerson, R.R., K.P. Rhoads, T.P. Carsey, S.J. Oltmans and P.J. Crutzen: Ozone in the remote marine boundary layer: A possible role for halogens. J. Geophys. Res., in press, 1999.
96

Bibliography
Doherty, G.M., R.E. Newell, and E.F. Danielsen, Radiative heating rates near the stratospheric fountain. J. Geophys. Res., 89, 1380-1384, 1984.
F Fabian, P. and P.G. Pruchniewicz, Meridional distribution of ozone in the troposphere and its seasonal variations. J. Geophys. Res., 82, 2063-2073, 1977. Fenn, M.A., and 20 others, Ozone and aerosol distributions and air mass characteristics over the South Pacific during the burning season, J. Geophys. Res., 104, 16,197-16,212, 1999. Fishman, J., S. Solomon and P.J. Crutzen, Observational and theoretical evidence in support of a significant in situ photochemical source of tropospheric ozone. Tellus, 31, 432-446, 1979. Fishman, J, G.L. Gregory, G.W. Sachse, S.M. Beck and G.F. Hill, Vertical profiles of ozone, carbon monoxide and dewpoint temperature obtained during GTE/CITE 1, October-November 1983. J. Geophys. Res., 92, 2083-2094, 1987. Fishman, J., C.E. Watson, J.C. Larsen and J.A. Logan, The distribution of tropospheric ozone determined from satellite data. J. Geophys. Res., 95, 3599-3617, 1990. Fishman, J., K. Fakhruzzaman, B. Cros and D. Nganga, Identification of widespread pollution in the southern hemisphere deduced from satellite analyses. Science, 252, 1693-1696, 1991. Folkins, I., M. Loewenstein, J. Podolske, S.J. Oltmans, M. Proffitt, A barrier to vertical mixing at 14 km in the tropics: Evidence from ozonesondes and aircraft measurements. J. Geophys. Res., 104, 22.095-22.102, 1999.
G Ganzeveld, L.N., and J. Lelieveld, Dry deposition parameterization in a chemistry - general circulation model and its influence on the distribution of chemically reactive trace gases. J. Geophys. Res., 100, 20,999-21,012, 1995. Ganzeveld, L.N., and J. Lelieveld and G.J. Roelofs, A dry deposition parameterization for sulfur oxides in a chemistry and general circulation model. J. Geophys. Res., 103, 5679-5694, 1998. Gilliland, A.B., and D.E. Hartley, Interhemispheric transport and the role of convective parameterizations. J. Geophys. Res., 103, 22.039-22.045,1998. Greenberg, J.P., P.R. Zimmerman, L. Heidt and W. Pollock, Hydrocarbon and carbon monoxide emissions from biomass burning in Brazil. J. Geophys. Res., 89, 1350-1354, 1984. Gregory, G.L., D.J. Westberg, M.C. Shiphamn, D.R. Blake, R.E. Newell, H.E. Fuelberg, R.W. Talbot, B.G. Heikes, E.L. Atlas, G.W. Sachse, B.A. Anderson, and D.C. Thornton, Chemical characteristics of Pacific tropospheric air in the region of the Intertropical Convergence Zone and the South Pacific Convergence Zone. J. Geophys. Res., 104, 5677-5696, 1999. Gutzler, D.S., and D.E. Harrison, The structure and evolution of seasonal wind anomalies over the near-equatorial eastern Indian and western Pacific Oceans, Mon. Weather Rev., 115, 169-192, 1987.
H Hao, W.M. and M.H. Liu, Spatial and temporal distribution of tropical biomass burning. Global Biogeochem. Cycles, 8, 495-503, 1994. Hartley, D.E., D.L. Williamson, P.J. Rasch, and R. Prinn, An examination of tracer transport in the NCAR CCM2 by comparison of CFCL3 simulations with ALE/GAGE observations. J. Geophys. Res., 99, 12.885-12.896, 1994. Hartley, D.E., and R.X. Black, A mechanistic analysis of interhemispheric transport. Geophys. Res. Lett., 22,2945-2948, 1995.
97

Bibliography
Haskins, R.D., T.P. Barnett, M.M. Tyree, and E. Roeckner, Comparison of cloud fields from atmospheric general circulation model, in situ and satellite measurements. J. Geophys. Res., 100, 1367-1378, 1995. Haynes, P.H., and M.E. McIntyre, On the evolution of vorticity and potential vorticity in the presence of diabatic heating and frictional or other forces. J. Atmos. Sci., 44, 828-841, 1986. Haynes, P.H., C.J. Marks, M.E. McIntyre, T.G. Sheperd, and K.P. Shine, On the ‘downward control’ of extratropical diabatic circulations by eddy-induced mean zonal forces. J. Atmos. Sci., 48, 651-678, 1991. Heckley, W.A., Systematic errors of the ECMWF operational forecasting model in tropical regions, Q. J. R. Meteorol. Soc., 11, 709-738, 1985. Heckley, W.Z., Data assimilation in the tropics. Tropical-extratopical interactions, ECMWF seminar proceedings, pp. 303-352, 1990. Hoerling, M.P., T.K. Schaack, and A.J. Lenzen, A global analysis of stratospheric-tropospheric exchange during northern winter. Mon. Wea. Rev., 121, 162-172, 1993. Hoke, J.E. and R.A. Anthes, The initialization of numerical models by a dynamic-initialization technique. Mon. Weather Rev., 104, 1551-1556, 1976. Holton, J.R. and J. Lelieveld, Stratosphere-troposphere exchange and its role in the budget of tropospheric O3. NATO ASI Series (‘Clouds, chemistry and climate’), 135, 173-190, 1996. Holton, J.R., P.H. Haynes, M.E. McIntyre, A.R. Douglass, R.B. Rood, and L. Pfister, Stratosphere-troposphere exchange. Rev. Geophys., 33, 403-439, 1995. Holzer, M., and G.J. Boer, Simulated changes in atmospheric transport climate. J. Clim., 14, 4398-4420, 2001. Hoskins, B.J., M.E. McIntyre, and A.W. Robertson, On the use and significance of isentropic potential vorticity maps. Q. J. R. Meteorol. Soc., 111, 877-946, 1985. Hoskins, B.J., Toward a PV-theta view of the general circulation. Tellus, 43AB, 27-35, 1991. Hsu, H.H. and B.J. Hoskins, Tidal fluctuations as seen in ECMWF data. Q. J. R. Meteorol. Soc., 115, 247-264, 1989.
I IPCC (Intergovernmental Panel on Climate Change), Climate Change, edited by J.T. Houghton, L.G. Meira Filho, J. Bruce, H. Lee, B.A. Callander, E.Haites, N. Harris, and K. Maskell, Cambridge University Press, Cambridge, 1994. IPCC, Climate change 1994-Radiative forcing of climate change and an evaluation of the IPCC IS92 emission scenarios. Houghton, J.T., L.G. Meira Filho, J. Bruce, Hoesung Lee, B.A. Callander, E. Haites, N. Harris and K. Maskell (eds.). Cambridge University Press, pp. 339, 1995.
J Jackson, D.R., S.J. Driscoll, E.J. Highwood, J.E. Harries, and J.M. Russell III. Q. J. R. Meteorol. Soc., 124, 169-192, 1998. Jayaraman, A., D. Lubin, S. Ramachandran, V. Ramanathan, E. Woodbridge, W. Collins and K.S. Zalpuri: Direct observations of aerosol radiative forcing over the tropical Indian Ocean during the Jan-Feb 1996 Pre-Indoex cruise, J. Geophys. Res., 103, 13827-13836, 1998. Jeuken, A.B.M., P.C. Siegmund, L.C. Heijboer, J. Feichter, and L. Bengtsson, On the potential of assimilating meteorological analyses in a global climate model for the purpose of model validation. J. Geophys. Res., 101, 16.939-16.950, 1996.
98

Bibliography
Johnson, J.E., R.H. Gammon, J. Larsen, T.S. Bates, S.J. Oltmans and J.C. Farmer: ozone in the marine boundary layer over the Pacific and Indian Oceans: Latitudinal gradients and diurnal cycles. J. Geophys. Res., 95, 11.847-11.856, 1990 Junge, C.E., Global ozone budget and exchange between stratosphere and troposphere. Tellus, 14, 363-377, 1962. Jury, M.R., B. Parker, and D. Waliser, Evolution and variability of the ITCZ in the SW Indian Ocean: 1988-90. Theor. Appl. Climatol., 48, 187-194, 1994.
K Kane, R.P., Relationship between QBOs of stratospheric winds, ENSO variability and other atmospheric parameters, Int. J. Climatol., 12, 435-447, 1992. Kennedy, P.J. and M.A. Shapiro, Further encounters with clear air turbulence in research aircraft. J. Atmos. Sci., 37, 986-993, 1980. Kjellström, E., J. Feichter, and G. Hoffman, Transport of SF6 and 14CO2 in the atmospheric general circulation model ECHAM4. Tellus, 52B, 1-18, 2000. Kley, D., P.J. Crutzen, H.G.J. Smit, H. Vömel, S.J. Oltmans, H. Grassl and V. Ramanathan, Observations of near-zero ozone concentrations over the convective Pacific: Effects on air chemistry. Science, 274, 230-233, 1996. Kley, D., H.G.J. Smit, H. Vömel, H. Grassl, V. Ramanathan, P.J. Crutzen, S. Williams, J. Meywerk, and S. Oltmans, Tropospheric water-vapour and ozone cross-sections in a zonal plane over the central equatorial Pacific Ocean, Q. J. R. Meteorol. Soc., 123, 2009-2040, 1997. Komhyr, W.D., R.A. Barnes, G.B. Brothers, J.A. Lathrop and D.P. Opperman: Electrochemical concentration cell O3sonde performance evaluation during STOIC 1989. J. Geophys. Res., 100, 9.231-9.244, 1995. Koppmann, R., A. Khedim, J. Rudolph, D. Poppe, M.O. Andrea, G. Helas, M. Welling and T. Zenker, Emissions of organic trace gases from savanna fires in southern Africa during the 1992 Southern African Fire Atmosphere Research Initiative and their impact on the formation of tropospheric ozone. J. Geophys. Res., 102, 18.879-18.888, 1997. Krishnamurti, T.N., H.S.Bedi, W. Heckley and K. Ingles, Reduction of the spinup time for evaporation in a spectral model. Mon. Weather Rev., 116, 907-920, 1988. Krishnamurti, T.N., J. Xue, K. Ingles and D. Oosterhof, Physical initialization for numerical weather prediction over the tropics, Tellus, 43 AB, 53-81, 1991. Krishnamurti, T.N., H.E. Fuelberg, M.C. Sinha, D. Oosterhof, E.L. Bensman and V.B. Kumar, The meteorological environment of the tropospheric ozone maximum over the tropical south Atlantic Ocean. J. Geophys. Res., 98, 10.621-10.641, 1993. Krishnamurti, T.N., B. Jha, P.J. Rasch and V. Ramanathan: A high-resolution global reanalysis highlighting the winter monsoon. Meteorol. Atmos. Phys, 64, 123-171 1997. Krishnamurti, T.N., B. Jha, J.M. Prospero, A. Jayaraman and V. Ramanathan: Aerosol and pollutant transport over the tropical Indian Ocean during the 1996 northeast monsoon and the impact on radiative forcing. Tellus, 50B, 521-542, 1998.
L de Laat, A.T.J., M. Zachariasse, G.J. Roelofs, P. van Velthoven, R.R. Dickerson, K.P. Rhoads, S.J. Oltmans, and J. Lelieveld, Tropospheric O3 distribution over the Indian Ocean during spring 1995 evaluated with a chemistry-climate model, J. Geophys. Res., 104, 13,881-13,893, 1999. Lacis, A.A., A.J. Wuebbles, and J.A. Logan, Radiative forcing of climate by changes in the vertical distribution of ozone, J. Geophys. Res., 95, 9971-9981, 1990.
99

Bibliography
Lal, S. M. Naja and A. Jayaraman, Ozone in the marine boundary layer over the tropical Indian Ocean. J. Geophys. Res., 103, 18.907-18.917, 1998. Land, C., J. Feichter, and R. Sausen, Impact of the vertical resolution on the transport of passive tracers in the ECHAM4 model. Rep. 321, Max Planck Inst. for Meteorology, Hamburg, Germany, 2001. Lelieveld, J., and P.J. Crutzen, influences of cloud photochemical processes in tropospheric ozone. Nature, 343, 227-233, 1990. Lelieveld, J. and P.J. Crutzen, Role of deep cloud convection in the ozone budget of the troposphere. Science, 264, 1759-1761, 1994. Lelieveld, J., and R. van Dorland, ozone chemistry changes in the troposphere and consequent radiative forcing of climate. In: Atmospheric ozone as a climate gas, edited by W.C. Wang and I.S.A. Isaksen, pp. 227-258, Springer-Verlag, Berlin, 1995. Lelieveld, J., and 26 others, The Indian Ocean Experiment:Widespread air pollution from south and southeast Asia. Science, 291, 1031-1036, 2001. Li, T., Air-sea interactions of relevance to the ITCZ: Analysis of coupled instabilities and experiments in a hybrid coupled GCM. J. Atmos. Sci., 54, 134-147, 1997. Logan, J.A., J.J. Prather, S.C. Wofsy and M.B. McElroy, Tropospheric chemistry: A global perspective. J. Geophys. Res., 86, 7210-7254, 1981. Lu, R., C. Lin, R. Turco, and A. Arakawa, Cumulus transport of chemical tracers 1. Cloud-resolving model simulations. J. Geophys. Res., 105, 10.001-10.021, 2000.
M Mandal, T.K., D. Kley, H.G.J. Smit, S.K. Srivastav, S.K. Peshin and A.P. Mitra, Vertical distribution of ozone over the Indian Ocean (15ºN-15ºS) during First Field Phase INDOEX-1998. Current Science, 76, 938-943, 1999. McIntyre, M.E., and T.N. Palmer, The ‘surf zone’ in the stratosphere. J. Atmos. Terr. Phys., 46, 825-849,1984. Moorthy, K.K., S.K. Satheesh and D.V. Murthy: Investigations of marine aerosol over the tropical Indian Ocean. J. Geophys. Res., 102, 18.827-18.842, 1997.
N Newell, R.E., and S. Gould-Stewart, A stratospheric fountain? J. Atmos. Sci., 38, 2789-2796, 1981. Newell, R.E., Z.-X. Wu, Y. Zhu, W. Hu, E.V. Browell, G.L. Gregory, G.W. Sachse, J.E. Collins Jr., K.K. Kelly, and S.C. Liu, Vertical fine-scale atmospheric structure measured from NASA DC-8 during PEM-West A, J. Geophys. Res., 101, 1943-1960, 1996. Newell, R.E., V. Thouret, J.Y.N. Cho, P. Stoller, A. Marenco, and H.G.J. Smit, Ubiquity of quasi-horizontal layers in the troposphere, Nature, 398, 316-319, 1999.
P Pepler, S.J., G. Vaughan and D.A. Cooper, Detection of turbulence around jet streams using a VHF radar. Q. J. R. Meteorol. Soc., 124, 447-462, 1998. Pettersen, S., Weather analysis and forecasting. McGraw-Hill, 221-223, 1940. Philander, S.G.H., D. Gu, D. Halpern, G. Lambert, G. Lau, T. Li, and R.C. Pacanowski, Why the ITCZ is mostly north of the equator. J. Clim., 9, 2958-2972, 1996. Pickering, K.E., A.M. Thompson, J.R. Scala, W.-K. Tao, J. Simpson and M. Garstang, Photochemical ozone production in tropical squall line convection during NASA Global
100

Bibliography
Tropospheric Experiment/Amazon Boundary Layer Experiment 2A. J. Geophys. Res., 96, 3099-3114, 1991. Piketh, S.J., H.J. Annegarn and M.A. Kneen: Regional scale impacts of biomass burning emissions over South Africa. In: Biomass Burning and Global Change, J.S. Levine (ed.), Vol 1, pp. 320-326, MIT Press, Cambridge, Mass., 1996. Piotrowicz, S.R., D.A. Boran and C.J. Fischer, ozone in the boundary layer of the equatorial Pacific Ocean. J. Geophys. Res., 91, 13113-13119, 1986. Piotrowicz, S.R., R.A. Rasmussen, K.J. Hanson and C.J. Fischer, ozone in the boundary layer of the equatorial Atlantic Ocean. Tellus B, 41, 314-322, 1989. Piotrowicz, S.R., H.F.Bezdek, G.R. Harvey and M. Springer-Young, On the ozone minimum over the equatorial Pacific Ocean. J. Geophys. Res., 96, 18679-18687, 1991. Potter, B.E. and J.R. Holton, The role of monsoon convection in the dehydration of the lower tropical stratosphere. J. Atmos. Sci., 52, 1034-1050, 1995. Prather, M., M. McElroy, S. Wofsy, G. Russell, and D. Rind, Chemistry of the global troposphere: Fluorocarbons as tracers of air motion. J. Geophys. Res., 92, 6579-6613, 1987. Prather, M.J., and D.J. Jacob, A persistent imbalance in HOx and NOx photochemistry of the upper troposphere driven by tropical deep convection, Geophys. Res. Lett., 24, 3189-3192, 1997. Price, C. and D. Rind, A simple lightning parameterization for calculating global lightning distributions. J. Geophys. Res., 97, 9919-9933, 1992. Price, C. and D. Rind, Modeling global lightning distributions in a general circulation model. Mon. W. Rev., 122, 1930-1939, 1994. Prinn, R. et al., Global average concentration and trend for hydroxyl radicals deduced from ALE/GAGE trichloroethane (methyl chloroform) data for 1978-1990. J. Geophys. Res., 97, 2445-2461, 1992. Pyle, J., and M. Prather (eds.). Global tracer transport models. Report of a scientific symposium, World Climate Research Programme, Report No. 24, 186 pp., 1996.
R Ramaswamy, V., M.D. Schwarzkopf, and K.P. Shine, Radiative forcing of climate from halocarbon-induced global stratospheric ozone loss. Nature, 355, 810-812, 1992. Randriambelo, T., J.L. Baray, S. Baldy, P. Bremaud and S. Cautenet, A case study of extreme tropospheric ozone contamination in the tropics using in-situ, satellite and meteorological data. Geophys. Res. Lett., 26, 1287-1290, 1999. Rasch, P.J., and D. Williamson, Computational aspects of moisture transport in global models of the atmosphere. Q. J. R. Meteorol. Soc., 116, 1071-1090, 1990. Reid, G.C., and K.S. Gage, On the annual variation in height of the tropical tropopause, J. Atmos. Sci., 38, 1928-1938, 1981. Reid, G.C., and K.S. Gage, On the annual variation in the height of the tropical tropopause over the western Pacific: Wave driving, convection, and the annual cycle, J. Geophys. Res., 101, 21,233-21,241, 1996. Rhoads, K.P., P. Kelley, R.R. Dickerson, T.P. Carsey, M. Farmer, D.L. Savoie, and J.M. Prospero, Composition of the troposphere of the Indian Ocean during the monsoonal transition. J. Geophys. Res., 102, 18.981-18.995, 1997. Rind, D., J. Lerner, and C. McLinden, Changes in tracer distributions in the doubled CO2 climate. J. Geophys. Res., 106, 28.061-28.079, 2001.
101

Bibliography
Roeckner, E., T. Siebert, and J. Feichter, Climatic response to anthropogenic sulfate forcing simulated with a general circulation model. In: Aerosol forcing of climate, edited by R.J. Charlson and J. Heintzenberg, pp. 349-362, John Wiley and Sons, New York, 1995. Roeckner, E., K. Arpe, L. Bengtsson, M. Christoph, M. Claussen, L. Dümenil, M. Esch, M. Giorgetta, U. Schlese, and U. Schulzweida, The atmospheric general circulation model ECHAM-4: Model description and simulation of present-day climate. Rep. 218, Max Planck Inst. for Meteorology, Hamburg, Germany, 1996. Roelofs, G.J. and J. Lelieveld, Distribution and budget of O3 in the troposphere calculated with a chemistry - general circulation model. J. Geophys. Res., 100, 20,983-20,998, 1995. Roelofs, G.J. and J. Lelieveld, Model study of the influence of cross-tropopause O3 transports on tropospheric O3 levels. Tellus, 49B, 38-55, 1997. Roelofs, G.-J., J. Lelieveld, H.G.J. Smit and D. Kley, Ozone production and transports in the tropical Atlantic region during the biomass burning season. J. Geophys. Res., 102, 10.637-10.651, 1997. Ropelewski, C.F., and M.S. Halpert, Precipitation patterns associated with the high index phase of the Southern Oscillation, J. Clim., 2, 268-284, 1988. Ropelewski, C.F., M.S. Halpert, and X. Wang, Observed tropospheric biennial variability and its relationship to the Southern Oscillation, J. Clim., 5, 594-614, 1992. Routhier, F, R Dennett, D.D. Davis, A. Wartburg, P. Haagenson and A.C. Delany, Free tropospheric and boundary-layer airborne measurements of ozone over the latitude range of 58°S to 70°N. J. Geophys. Res., 85, 7307-7321, 1980.
S Savoie, D.L., J.M. Prospero and R.T. Nees: Nitrate, non-sea-salt sulfate and mineral dust over the northwest Indian Ocean. J. Geophys. Res., 91, 933-942, 1987. Scheele, M.P., P.C. Siegmund, and P.F.J. van Velthoven, Sensitivity of trajectories to data resolution and its dependence on the starting point: In or outside a tropopause fold, Meteorol. Appl., 3, 267-273, 1996. Scheele, M.P., and P.C. Siegmund, Estimating errors in trajectory forecasts using ensemble predictions. J. Appl. Meteorol., 40,1223-1232, 2001. Selkirk, H.B., The tropopause cold trap in the Australian monsoon during STEP/AMEX 1987, J. Geophys. Res., 98, 8591-8610, 1993. Shapiro, M.A., Further evidence of the mesoscale and turbulent structure of upper level jet stream-frontal zone systems. Mon. W. Rev., 106, 1100-1111, 1978. Shapiro, M.A., Turbulent mixing within tropopause folds as a mechanism for the exchange of chemical constituents between the stratosphere and troposphere. J. Atmos. Sci., 37, 994-1004, 1980. Simmons, A.J., A. Untch, C. Jakob, P. Kållberg, and P. Undén, Stratospheric water vapour and tropical tropopause temperatures in ECMWF analyses and multi-year simulations, Q. J. R. Meteorol. Soc., 125, 353-386, 1999. Singh, H.B., G.L. Gregory, B. Anderson, E. Browell, G.W. Sachse, D.D. Davis, J. Crawford, J.D. Bradshaw, R. Talbot, D.R. Blake, D. Thornton, R. Newell and J. Merill, Low O3 in the marine boundary layer of the tropical Pacific Ocean: Photochemical loss, chlorine atoms and entrainment. J. Geophys. Res., 101, 1907-1917, 1996. Smit, H.G.J., D. Kley, S. McKeen, A. Volz, and S. Gilge, The latitudinal and vertical distribution of tropospheric ozone over the Atlantic Ocean in the southern and northern
102

Bibliography
hemispheres, in Ozone in the Atmosphere, edited by R.D. Bojkov and P. Fabian, P. 419-422, A. Deepak, Hampton, Va., 1989. Smit, H.G.J., S. Gilge and D. Kley, Ozone profiles over the Atlantic Ocean between 36ºS and 52ºN in March/April 1987 and September/October 1988. Jül. Ber. 2567, Forsch. Jülich, West Germany, 1991. Smit, H.G.J., W. Sträter, D. Kley, and M.H. Profitt, The evaluation of ECC-ozone sondes under quasi flight conditions in the environmental simulation chamber at Jülich, in Proceedings of Eurotrac Symposium 1994, edited by P.M. Borell et al., Academic, San Diego, Calif., 1994. Smit, H.G.J., and D. Kley, Jülich Ozone Sonde Intercomparison Experiment (JOSIE), WMO Global Atmos. Watch Rep. Ser., Rep. 130 (Tech. Doc. 926), World Meteorol. Org., Geneva, 1998. Stohl, A., and P. Seibert, Accuracy of trajectories as determined from the conservation of meteorological tracers. Q. J. R. Meteorol. Soc., 124, 1465-1484, 1998. Stohl, A., Computation, accuracy and applications of trajectories- A review and bibliography, Atmos. Environ., 32, 947-966, 1998. Stohl, A., L. Haimberger, M.P. Scheele, and H. Wernli, An intercomparison of results from three trajectory models, Meteorol. Appl., 8, 127-135, 2001. Suhre, K., J.-P. Cammas, P. Nédelec, R. Rosset, A. Marenco, and H.G.J. Smit, Ozone-rich transients in the upper equatorial Atlantic troposphere, Nature, 388, 661-663, 1997.
T Taupin, F.G., M. Bessafi, S. Baldy and P.J. Bremaud, Tropospheric ozone above the southwestern Indian Ocean is strongly linked to dynamical conditions prevailing in the tropics. J. Geophys. Res., 104, 8057-8066, 1999. Teitelbaum, H., M. Moustaoui, P.F.J. van Velthoven, and H. Kelder, Decrease of total ozone at low latitudes in the southern hemisphere by a combination of linear and nonlinear processes. Q. J. R. Meteorol. Soc., 124, 2625-2644, 1998. Thompson, A.M., R.D. Diab, G.E. Bodeker, M. Zunckel, G.J.R. Coetzee, C.B. Archer, D.P. McNamara, K.E. Pickering, J. Combrink, J. Fishman and D. Nganga, Ozone over southern Africa during SAFARI-92/TRACE A. J. Geophys. Res., 101, 23.793-23.807, 1996. Tiedtke, M., A comprehensive mass flux scheme for cumulus parameterization in large-scale models. Mon. Weather Rev., 117, 1779-1800, 1989. Toumi, R., S. Bekki, and K.S. Law, Indirect influence of ozone depletion on climate forcing by clouds. Nature, 372, 348-351, 1994. Trenberth, K.E., A quasi-biennial standing wave in the southern hemisphere and interrelations with sea surface temperature, Q. J. R. Meteorol. Soc., 101, 55-74, 1975. Trenberth, K.E., D.P. Stepaniak, and J.M. Caron, The global monsoon as seen through the divergent atmospheric circulation. J. Clim., 13, 3969-3993, 2000. Tuck, A.F., et al., The Brewer-Dobson circulation in the light of high altitude in situ aircraft observations, Q. J. R. Meteorol. Soc., 123, 1-69, 1997. Twomey, S.A., M. Piepgrass, and T.L. Wolfe, An assessment of the impact of pollution on global cloud albedo. Tellus, 36, 356-366, 1984. Tyson, P.D., M. Garstang, R.J. Swap, E.V. Browell, R.D.Diab and A.M. Thompson: Transport and vertical structure of ozone and aerosol distributions over southern Africa. In: Biomass Burning and Global Change, J.S. Levine (ed.), Vol 1, pp. 403-421, MIT Press, Cambridge, Mass., 1996.
103

Bibliography
Tyson, P.D., M. Garstang, A.M. Thompson, P.D. Abreton, R.D. Diab and E.V. Browell: Atmospheric transport and photochemistry of ozone over south central southern africa during SAFARI. J. Geophys. Res., 102, 10,623-10,635, 1997.
V van Velthoven, P.F.J., et al., The passive transport of NOx emissions from aircraft studied with a hierarchy of models, Atmos. Environ., 31, 1783-1799, 1997. Verver, G.H.L., D.R. Sikka, J.M. Lobert, G. Stossmeister, and M. Zachariasse, Overview of the meteorological conditions and atmospheric transport processes during INDOEX 1999, J. Geophys. Res., 106, 28.399-28.413, 2001. Vincent, D.G., The South Pacific Convergence Zone (SPCZ): A review. Mon. Weather Rev., 122, 1949-1970, 1994. Vogt, R., P.J. Crutzen and R. Sander: A mechanism for halogen release from sea-salt aerosol in the remote marine boundary layer. Nature, 383, 327-329, 1996.
W Wagner, V., C. Schiller, and H. Fischer, Formaldehyde measurements in the marine boundary layer of the Indian Ocean during the 1999 INDOEX cruise of the R/V Ronald H. Brown. J. Geophys. Res., 106, 28.529-28.538, 2001. Waliser, D.E., N.E. Graham, and C. Gautier, Comparison of the highly reflective cloud and outgoing longwave radiation datasets for use in estimating tropical deep convection. J. Clim., 6, 331-353, 1993. Waliser, D.E., and C. Gautier, A satellite-derived climatology of the ITCZ. J. Clim., 6, 2162-2174, 1993. Waliser, D.E. and R.C.J. Somerville, Preferred latitudes of the Intertropical Convergence Zone. J. Atmos. Sci., 51, 1619-1639, 1994. Wang, B., and Y. Wang, dynamics of the ITCZ-equatorial cold tongue complex and causes of the latitudinal climate asymmetry. J. Clim., 12, 1830-1847, 1999. Webster, P.J., The elementary monsoon. In: Monsoons (Eds. J.S. Fein and P.L. Stephens) – J. Wiley and Sons Publ., pp. 3-32, 1986. Webster, P.J., V.O. Magana, T.N. Palmer, J. Shukla, R.A. Tomas, M. Yanai, and T. Yasunari, Monsoons: Processes, predictability, and the prospects for prediction. J. Geophys. Res., 103, 14.451-14.510, 1998. Wu, Z., R.E. Newell, Y. Zhu, B.E. Anderson, E.V. Browell, G.L. Gregory, G.W. Sachse, and J.E. Collins Jr., Atmospheric layers measured from the NASA DC-8 during PEM-West B and comparison with PEM-West A, J. Geophys. Res., 102, 28,353-28,365, 1997.
Y Yasunari, T., Global structure of the El Niño/Southern Oscillation, part II, Time evolution, J. Meteorol. Soc. Japan, 65, 81-102, 1987. Yasunari, T., A possible link of the QBOs between the stratosphere, troposphere and sea surface temperature in the tropics, J. Meteorol. Soc. Japan, 67, 483-493, 1989. Yienger, J. J. and H. Levy II, Empirical model of global soil-biogenic NOx emissions. J. Geophys. Res., 100, 11,447-11,464, 1995.
Z Zachariasse, M., P.F.J. van Velthoven, H.G.J. Smit, J. Lelieveld, T.K. Mandal, and H. Kelder, Influence of stratosphere-troposphere exchange on tropospheric ozone over the tropical Indian Ocean during the winter monsoon, J. Geophys. Res., 105, 15,403-15,416, 2000.
104

Bibliography
Zachariasse, M., H.G.J. Smit, P.F.J. van Velthoven, and H. Kelder, Cross-tropopause and interhemispheric transports into the tropical free troposphere over the Indian Ocean. J. Geophys. Res., 106, 28.441-28.452, 2001. Zahn, A., C.A.M. Brenninkmeijer, M. Maiss, D. Scharffe, P.J. Crutzen, M. Hermann, J. Heintzenberg, H. Fischer, J.W.M. Cuijpers and P.F.J. van Velthoven, Identification of extratropical troposphere-stratosphere mixing based on CARIBIC measurements of O3, CO, and ultrafine particles. Accepted in J. Geophys. Res., 1999. Zou, X., I.M. Navon and F.X. Ledimet, An optimal nudging data assimilation scheme using parameter estimation. Q. J. R. Meteorol. Soc., 118, 1163-1186, 1992.
105

106

Curriculum Vitae
Curriculum Vitae Ik ben op 25 augustus 1973 geboren in Utrecht. In 1991 behaalde ik mijn VWO diploma aan College Blaucapel in Utrecht. In datzelfde jaar begon ik met mijn studie Natuurkunde aan de Universiteit Utrecht. Al snel bleek mijn interesse meer te liggen bij klimaatonderzoek en ben ik Meteorologie en Fysische Oceanografie gaan studeren, wat toen nog een bovenbouw studie van Natuurkunde was. Ik studeerde dan ook af op een onderwerp uit de klimaatfysica bij de afdeling Atmosferische Samenstelling van het KNMI. Aangezien ik het gevoel had dat mijn afstudeeronderzoek nog maar het topje van de ijsberg van ‘onderzoeker-zijn’ was ben ik ook meteen achter een promotieplaats binnen deze groep aan gegaan. Ik heb het hier geweldig naar mijn zin gehad, niet alleen was de sfeer goed maar het onderwerp was ook nog eens erg interessant. Na 4 jaar met veel plezier hieraan gewerkt te hebben heb ik nu een aardig beeld van het leven als wetenschapster. Mijn leven als ‘Dr’ kan beginnen!
107


Let’s start a brand new day
Sting

Stellingen
1 De uitwisseling tussen de troposfeer en de stratosfeer heeft een belangrijke invloed op de hoeveelheid troposferisch ozon boven de Indische Oceaan tijdens de winter moesson. [Hoofdstuk 2 en 3]. 2 Het oplossend vermogen in verticale richting van klimaatmodellen is niet afdoende om de dunne stratosferische ozon lagen die net onder de tropische tropopauze zijn gevonden te representeren. Wel zijn klimaatmodellen in staat om de meeste andere belangrijke processen die de verticale verdeling van ozon bepalen te simuleren. [Hoofdstuk 4]. 3 In termen van de chemische samenstelling aan het aardoppervlak lijkt het nuttiger om de scheiding van halfronden te definiëren ten opzichte van de Intertropische Convergentie Zone in plaats van ten opzichte van de evenaar. In dat geval is het zuidelijk halfrond op jaarbasis zo’n 8% groter dan het noordelijk halfrond. [Hoofdstuk 5]. 4 Het duurt ongeveer 0.7 jaar om de troposfeer van het noordelijk halfrond te verversen en iets langer voor die van het zuidelijk halfrond (0.9 jaar). De uitwisseling tussen de halfronden vindt vooral plaats in het middelste deel van de troposfeer door convectie. [Hoofdstuk 5]. 5 Het feit dat de tropische circulatie in oost-west richting sterk varieert, heeft als gevolg dat dynamica bestuderen met behulp van zonale gemiddelden niet altijd afdoende is. 6 Meetcampagnes zoals INDOEX onderstrepen het mondiale effect van lokale emissies. Geld dat door westerse landen uitgegeven wordt aan reductie van antropogene emissies zou dan ook effectiever besteed kunnen worden aan het treffen van reductiemaatregelen in ontwikkelingslanden. 7 Het presenteren en verdedigen van resultaten op internationale conferenties is een essentieel onderdeel van onderzoek. Als deel van de onderzoeksopleiding zouden conferentieorganisatoren jonge onderzoekers dan ook positief moeten discrimineren ten opzichte van de gevestigde wetenschappers als het gaat om mondelinge presentaties. 8 Om een mens op waarde te schatten is een uitgebreide analyse van de tekortkomingen niet aan te raden. Bij een model is dat juist wel wenselijk. 9 Jarenlang was de Stelling verboden terrein voor de gewone burger. [Website VVV Noord- Holland]. 10 Het enorme succes van maaltijdvervangers doet vermoeden dat maar weinig mensen de kunst van het genieten verstaan. 11 Gezien de consumptie van enorme hoeveelheden alcohol in het uitgaansleven lijkt het er op dat spontaniteit gebotteld kan worden. 12 Toeval is logisch. [Johan Cruijff].


![Re#analysis*of*tropospheric*aerosols*for*the*period*1980#2005* … · 2018-12-03 · atmospheric,chemistry., GAS-PHASE TROPOSPHERIC CHEMISTRY MOZART2.4 [O3-NOx-CO-CH4-NMHC] Temperature,](https://static.fdocuments.in/doc/165x107/5ec725f88da7136c5f6fb38d/reanalysisoftroposphericaerosolsfortheperiod19802005-2018-12-03-atmosphericchemistry.jpg)