The Impact of Alternative Market Orientation …ageconsearch.umn.edu/bitstream/61738/2/Micheels and...
34
The Impact of Alternative Market Orientation Strategies on Firm Performance: Customer versus Competitor Orientation Eric T. Micheels Graduate Research Assistant Department of Agricultural and Consumer Economics University of Illinois at Urbana-Champaign 326 Mumford Hall, MC-710 1301 W. Gregory Drive Urbana, IL 61801 [email protected] Hamish R. Gow Professor of Agribusiness Director, Center for Agribusiness Policy and Strategy College of Business Massey University Palmerston North, New Zealand [email protected] Tel: +64 6 350 5799 Ext. 5514 Selected Paper prepared for presentation at the Agricultural & Applied Economics Association’s 2010 AAEA, CAES & WAEA Joint Annual Meeting, Denver, Colorado, July 25-27, 2010. Copyright 2010 by Micheels and Gow. All rights reserved. Readers may make verbatim copies of this document for non-commercial purposes by any means, provided this copyright notice appears on all such copies.
Transcript of The Impact of Alternative Market Orientation …ageconsearch.umn.edu/bitstream/61738/2/Micheels and...

The Impact of Alternative Market Orientation Strategies on Firm Performance: Customer versus Competitor Orientation
Eric T. Micheels Graduate Research Assistant
Department of Agricultural and Consumer Economics University of Illinois at Urbana-Champaign
326 Mumford Hall, MC-710 1301 W. Gregory Drive
Urbana, IL 61801 [email protected]
Hamish R. Gow Professor of Agribusiness
Director, Center for Agribusiness Policy and Strategy College of Business Massey University
Palmerston North, New Zealand [email protected]
Tel: +64 6 350 5799 Ext. 5514 Selected Paper prepared for presentation at the Agricultural & Applied Economics Association’s 2010 AAEA, CAES & WAEA Joint Annual Meeting, Denver, Colorado, July 25-27, 2010. Copyright 2010 by Micheels and Gow. All rights reserved. Readers may make verbatim copies of this document for non-commercial purposes by any means, provided this copyright notice appears on all such copies.

2
Agricultural producers are often thought of as manufacturers of undifferentiated
homogeneous products and thus, price takers. Within homogeneous markets, producers’
often focus on improving production efficiency as they see this as their only means of
improving financial performance. In these environments, where competition is based on
the firm’s ability to be the low-cost provider of undifferentiated goods and services,
Porter (1985) posits sustained success will depend on cost drivers such as economies of
size, capacity utilization, technology adoption and organizational learning. Within
agricultural commodity markets, however, economies of size and scope are not easily
achieved. Due to these facts, many firms may find themselves stuck in the middle,
possibly caused by capital constraints that hinder the implementation of a low-cost
strategy, and therefore weakening its effectiveness.
Conversely, within differentiated markets, firms strive to deliver superior value by
providing augmented products and services more efficiently than rivals. Competitive
advantage within such markets is based on the firm’s capability in the discovery and
delivery of value added products that support a specific consumer experience. Firms
achieving a differentiation advantage are those that are able to create positive difference
between the value of the augmented product and the costs associated in delivering it.
Within these markets superior value can be provided in several ways. Treacy and
Wiersema (1993; 1997) quantified these methods into three singular value disciplines,
operational excellence, product leadership and customer intimacy.1 Combined with
1 The operational excellence value discipline is similar to the cost leadership strategy of Porter (1985) and is the dominant strategy in commodity markets such as agriculture. As producers are generally unable to affect the price they receive, increasing efficiency is seen as the only method to earn higher profits in this market. Customer intimacy and product leadership would seem to fall into the differentiation strategy of Porter (1985) with a customer intimacy value discipline focusing on providing the exact product to meet a specific customer’s needs. A product leadership value discipline searches for sources of product innovations and markets them quickly to become the first-mover in the market.

3
commodity production, direct marketing of farm production and producer alliances, it
appears all three value disciplines are present in the agricultural context.
Furthermore, it has been suggested that market oriented firms are better able to
define their own value discipline, which allows them to allocate resources more
efficiently and to focus on appropriate consumer segments (Narver et al., 1998).
Recently, Micheels and Gow (2009) found that extreme levels of market orientation,
along with organizational learning and innovation, led to increased value discipline
clarity. Treacy and Wiersema (1993) posit that the choice of customers and value
disciplines is simultaneous. That is, operationally excellent firms are likely going to have
a hard time marketing their production to customers who value close relationships with
suppliers and vice versa. If this suggestion is indeed the case, are the individual
components of a market orientation equally important across value discipline strategies?
The objective of this study is to determine if the relative level of customer and
competitor orientation affect firm performance across various value disciplines. Using a
sample of Illinois beef producers, we empirically measure the farmer’s choice of value
discipline as well as their level of market orientation and relative emphasis on a customer
or competitor orientation. While Slater and Narver (1994) have shown that a general
market orientation is important determinant of firm performance in any business
environment, this study will attempt to further define and clarify these findings.
Specifically, we suggest that the means by which the market orientation resource is
developed may affect firm performance across various value discipline strategies. If the
ideas brought forward by Day and Wensley (1988) are correct, we hypothesize that the

4
relative importance of customer and competitor orientation will differ based on the
chosen value discipline of the firm.
Theoretical Foundations
Porter (1985) argues that superior value can be created by being either the lowest
cost producer of an undifferentiated product or the most efficient producer of a
differentiated product. Within agricultural livestock markets, specifically the cow-calf
sector, many firms have sought to become the low-cost producer, often by striving to
achieve economies of scale, with varying rates of success (Jones, 2000). Confounding
the analysis is the fact that within the U.S. cow-calf sector, economies of scale were
observed as herd sizes approach 250 head (Lamb and Beshear, 1998), and while a
majority of producers have herd sizes under this threshold, low cost producers were
found among all size groups (Jones, 2000). Firms operating within such markets may
find a market orientation to be a valuable resource in discovering market opportunities
based on unexpressed needs or the failure of competitors to meet expressed needs, or
both.
A market orientation is broadly defined as the culture of the firm which focuses
on the creation of superior value for customers (Narver, Slater and Tietje, 1998).
Defining a market orientation within a behavioral context, Jaworski and Kohli (1993)
identified several activities that are present within market oriented cultures, such as
intelligence generation, intelligence dissemination, and finally the response to new
information. Similarly, Narver and Slater (1990) suggest that a market orientation
consists of three inter-related components, namely a customer orientation, a competitor

5
orientation, and interfunctional coordination. Through behaviors within the respective
orientations, firms seek to gather and disseminate pertinent market information relating to
customer needs and competitor actions in the search for opportunities to provide superior
value to the market. Firms with a highly developed market orientation may be able to
discover opportunities before rivals and thus establish customer loyalty and market share
which may improve firm performance. Across a variety of markets and cultures, a
market orientation has been found to be an important driver of firm performance (Narver
and Slater, 1990; Hult and Ketchen, 2001; Micheels and Gow, 2008; Verhees and
Meulenberg, 2004).
Within segmented and fragmented markets, Pelham (1997, 1999) found a market
orientation was a significant contributor to superior firm performance. In commodity
markets, however, the results regarding the importance of a market orientation in
determining firm performance have thus far been mixed (see Narver and Slater, 1990;
Pelham, 1997; Verhees and Meulenberg, 2004). While a market orientation may be an
important resource for all firms regardless of competitive environment and competitive
hostility (Slater and Narver, 1994), the relative emphasis of customer versus competitor
orientation may be equally important depending on the choice of value discipline.
The relative emphasis on customers or competitors has been tested across a
variety of industries and cultures with mixed results. Slater and Narver (1994) examined
the importance of a market orientation and the relative emphasis using a sample of
strategic business units (SBUs) in a forest products firm and a diversified manufacturing
firm and found that a market orientation was a significant driver of performance, but
relative importance was not significant, even when accounting for competitive intensity,

6
buyer power, and market growth. The results from Slater and Narver (1994) would seem
to suggest that there is no benefit to being relatively more competitor or customer
oriented; a market orientation is an important determinant of firm performance and
changing the emphasis given market conditions may not be prudent. However, the
results from Slater and Narver (1994) were observed using data from various SBUs of
only two firms. This fact certainly limits the confidence researchers have in any
generalizations that can be drawn from this research.
To that end, several published research reports have examined the importance of
the relative emphasis of customer and competitor orientation within a market orientation
across a wider spectrum of industries and settings. Using data from a sample of 393
marketing executives from a wide range of U.S. businesses, Gatignon and Xuereb (1997)
found evidence to suggest for firms operating within uncertain markets a customer
orientation may provide greater returns than would a competitor orientation and vice
versa.
Furthermore, Tajeddini (2010) suggests that within the Switzerland hotel industry
a customer orientation is an important contributor to firm performance, but not firm
innovativeness. In a research study utilizing a sample of managers of hotels located in
both developed and developing economies, Dev et al. (2009) found similar results. Lukas
and Ferrell (2000) further suggest that the relative emphasis on customer (competitor)
orientation leads to greater (less) innovativeness. Firms that are more acutely aware of
unarticulated needs may be better positioned to develop more radical innovations as
opposed to the incremental innovations which are developed following awareness of
articulated needs.

7
Narver and Slater’s (1990) description of a market orientation as a one-
dimensional theoretical construct consisting of three behavioral components (customer
orientation, competitor orientation and coordination) suggests that each component is
equally important in determining firm performance. Some scholars have suggested this
may not always be the case (Lukas and Ferrell, 2000). Day and Wensley (1988) posit
that firms operating under different strategies (low-cost, differentiation) would likely
develop different resources to succeed within their chosen strategy. Therefore, when
developing a market orientation, should firms develop a customer orientation at the same
rate as they develop their competitor orientation? The answer to this question likely
depends on their choice of value discipline.
Testable Hypothesis
Market orientation
Market oriented firms are thought to achieve superior performance vis-à-vis their
less market oriented rivals as a market orientation allows the firm to become aware of
opportunities to provide superior value to consumers. As a firm discovers consumers’
latent needs and translates this knowledge into new products, performance measures
should improve as revenues increase due to premium prices and/or increased sales. In
either commodity or non-commodity channels, higher beef prices can be earned by
providing downstream users with the specific product attributes they value. A market
orientation has been found to be a significant driver of firm performance across a variety
of industries and cultures (Deshpande et al., 1993; Narver and Slater, 1990; Verhees and
Meulenberg, 2004).

8
While not a traditional agricultural market, Slater and Narver (1994) found a
statistically significant relationship between market orientation and performance in their
research on several SBU’s of a forest product firm, even when accounting for
competition. Similar results displaying the performance implications were found in
several business environments including large UK firms (Greenley, 1995), small to
medium sized enterprises in the UK food sector (Tregear, 2003), UK manufacturing firms
(Liu, 1995) as well as in buyer-supplier relationships (Bigne and Blesa, 2003).
H1a: An increase in the market orientation of the firm will lead to an increase in firm performance. H1b: An increase in the market orientation of the firm will lead to an increase in
firm performance for customer intimacy producers. H1c: An increase in the market orientation of the firm will lead to an increase in
firm performance for operational excellence producers.
Relative emphasis
While a low-cost strategy is widely deployed in production agriculture systems, it does
have its limitations. One major limitation is its lack of ex post barriers to competition
(Peteraf, 1993). That is, the use of a low-cost strategy does not preclude other firms from
employing the same strategy. Kim and Mauborgne (2005) deem these competitive
environments ‘red oceans’ as many firms are competing based on similar strategies and a
war of attrition ensues. Perhaps not surprisingly, strategy imitation has been shown to
lead to mediocre performance for many firms (Porter, 1991; Teece, Pisano, and Shuen,
1997). Perhaps as a result, an increasing number of innovative and entrepreneurial
producers are forgoing the commodity route, and are instead attempting to produce a non-

9
commodity product based on the various attributes demanded by heterogeneous
consumers.
Within such segmented markets, the decision regarding how the firm actually
chooses to provide value is especially important. Porter (1985) has posited that firms
who fail to focus on one specific strategy, either low-cost provision or differentiation,
risk becoming ‘stuck in the middle’ which can lead to mediocre performance vis-à-vis
rivals with a clear vision of their value discipline. To be sure, the specific strategic
choice would likely depend on the opportunities available to the firm as well as the
specific resources and capabilities available internally and externally to the firm.
Extending the work of Porter (1985), Treacy and Wiersema (1993) developed three value
disciplines, operational excellence, customer intimacy, and product leadership, to explain
different strategies firms can use to provide value for the consumer. Within an
agricultural context, commodity producers may be better served by focusing on buyers or
consumers as the sheer number of competitors puts a limit on the accuracy and the
amount of competitor monitoring that can be conducted.
H2: An increase in the relative emphasis of a customer orientation will lead to an increase in firm performance for firms within a customer intimacy value discipline. H 3: An increase in the relative emphasis of a customer orientation will lead to a decrease in firm performance for firms within an operational excellence value discipline.
Organizational learning
Using a survey of business executives of both large and small firms, Baker and
Sinkula (1999a) find support for a learning orientation to directly affect both innovation
and firm performance. In a similar study, Baker and Sinkula (1999b) found support for

10
direct affects of market orientation and learning orientation on performance, but no
significant affect for the mediating relationship of learning on market orientation. In the
beef industry, we feel market sensing capabilities brought about by organizational
learning would increase a firm’s ability to innovate as well as increasing their market
orientation while also allowing for an improved cost focus of the firm. Being efficient is
a superior quality in many industries, but is of great importance for firms who participate
in commodity markets. In this case, firms who are participating in a commodity
marketing channel would increase their efficiency through their learning orientation.
H4: An increase in the firm’s learning orientation will lead to an increase in firm performance.
Innovativeness
Market oriented firms are thought to gather information concerning consumer’s current
and future needs, but what happens following the gathering and dissemination of this
information? Provided a firm has the capacity to innovate, it is likely this market
information is transformed into product innovations to meet consumer needs. These
innovations do not need to be frame-breaking, however. Increased communication with
downstream partners would be considered an innovation if communication is not typical
of the business relationship. While meeting a goal of the 2005 NBQA, increased channel
communication can aid producers in modifying production practices or in altering the
genetic make-up of the herd as a means of improving quality and efficiency.
In our study we conceptualize innovation as the willingness to use new ideas to
improve the cattle operation, but leave what exactly that new idea is to the respondent. In
this instance, the innovation could be a means of improving efficiency through a

11
technological innovation or by improving the product offering though an externally
focused innovation. In their study of a sector of the U.S. government, Hurley and Hult
(1998) found innovation to be an important driver of performance. Similar results were
found in studies using large Japanese firms (Deshpande, Farley, and Webster, 1993), U.S.
banks (Han, Kim, and Srivastava, 1998), and New Zealand firms, (Darroch and
McNaughton, 2003). In all cases market knowledge was the primary driver of the
innovation. Increased market knowledge allows firms to modify routines in a way that
provides the consumer with the attributes which they desire.
H5: An increase in the level of innovativeness will lead to an increase in firm performance.
Cost focus
A market orientation is an inherently external view of the current environment in which
the manager operates. Market information is gathered, processed and implemented to
modify routines in order to improve the product offering and, in turn, earn a premium
price for doing so. However, it is still important to maintain a balance between the
external and internal focus of the firm. In fact, once an innovation has caught on in the
marketplace, the entrepreneurial rent from the innovation is likely to have already
disappeared as increased competition has removed the premium price. Therefore, we
also model the manager’s cost focus as a determinant of firm profitability.
Ritchie (2000) argued increased efficiency in beef production is a necessary
condition for high net income. Ritchie (2000) suggests that in order to increase income,
the producer needs to increase output efficiency or increase prices received. Higher
prices could be earned by producing products with desired attributes, but being able to

12
efficiently provide an augmented product may be more important in the long-run. In
some sectors of the beef industry, efficiency may be more important than a market
orientation in the short-run, provided the market is stable and not undergoing rapid
change. A producer operating in the commodity beef sector may still feel increasing
efficiency is their only method of improving performance. Support for this mind-set is
given in Narver and Slater’s (1990) study of the commodity SBUs of the forest product
firm they studied in their seminal article. They found performance to have a U-shaped
relationship to the level of market orientation in the commodity SBUs; that is, on average
an SBU with a low level of market orientation outperformed those with a medium level
of market orientation.
H6: An increase in the cost focus of a firm will lead to an increase in firm performance for firms within the operational excellence value discipline. H7: An increase in the cost focus of the firm will lead to a decrease in firm performance for firms within the customer intimacy value discipline.
Data
Utilizing a sample of 269 Illinois cow-calf producers, we empirically measure the level of
market orientation and subjective performance. A questionnaire was designed to ask
Illinois beef producers for their responses on various latent constructs, including market
orientation and innovativeness. The questionnaire also asked producers to determine
their value discipline by allocating points among various phrases relating to production,
pricing, relationships, and quality. Before the survey was mailed, questions were
examined by University of Illinois extension specialists to verify question clarity and
scale relevance. Following slight rephrasing, the survey instrument was mailed to a small
sample of Farm Business Farm Management Association (FBFM) cooperators to allow

13
them to comment on question clarity and relevance. Following the instrument pilot
testing, changes were made to the survey to improve the readability while also increasing
the response rate relative to a less user-friendly survey.
A mailing list was obtained from the Illinois Beef Association containing names
and addresses of 1569 beef producers in the state. An initial wave of the survey was
mailed out to half of the survey population in June 2007 with a reminder card following 2
weeks later. Four weeks after the initial mailing, a second survey was sent to non-
respondents. Respondents were asked to provide answers to survey questions using a 6-
point Likert scale. A neutral choice was omitted in order to force respondents to either
agree/disagree with the statement in question. Previous studies have shown 6-point
scales to be of similar quality to 5-point and 7-point scales (Chang, 1994; Green and Rao,
1970; Preston and Colman, 2000).
Following the first wave of mailings, a total of 170 completed surveys were
returned. In November 2007, the survey was sent to the second half of the mailing list in
an attempt to increase the sample size. In total, 347, complete usable surveys were
returned resulting in a 22.1% response rate2. However, this analysis will be conducted
using a sample of 269 cow-calf producers.
As late respondents have been shown to be similar to non-respondents, the sample
was tested for differences as outlined in Armstrong and Overton (1977). No significant
differences were found between early and late respondents.
2 In surveys where only a few responses were missing, responses were imputed through a regression. This method attenuated the loss of sample size that would otherwise occur had listwise deletion been employed.

14
Respondent characteristics
Table 1 provides some information about the demographic characteristics of the
respondents, as well as other pertinent characteristics. The results presented here refer to
the 269 cow-calf producers who participated in the 2007 survey of Illinois beef producers
conducted by the authors. In general, the respondents are over 41 years of age, have
greater than 16 years experience in the beef industry and are highly educated.
The most respondents fell between the ages of 41-50, with a distinct majority over
the age of 41. Furthermore, a plurality of respondents had a college degree, while a
majority had attended some post secondary schooling. The majority of the producers
operate herds with fewer than 75 head of brood cows, which is similar to the results from
Illinois in the most recent (2007) Census of Agriculture (USDA-NASS).

15
Table 1. Characteristics of Illinois cow-calf producers (n=269)
Measures
Whenever possible, measurement scales were drawn from previously published research.
A new scale was developed to measure value discipline clarity.3 The concept of a firm’s
market orientation was measured using the scale first developed by Narver and Slater
3 See Micheels and Gow (2009) for a discussion of scale development and reliability estimates of the value discipline scale.
Characteristics Relative Frequency (%) Frequency
Agea
< 30 3.3 931-40 7.8 2141-50 24.9 6751-60 35.7 96 > 60 27.5 74
Experience < 10 11.2 3011-15 8.6 2316-20 7.8 2121-25 6.7 17> 25 65.8 177
EducationSome HS 0.7 2HS Grad 22.3 60Some College 17.8 48Tech Grad 12.6 34College Grad 39.8 107Post graduate degree 6.7 18
Size of herd < 30 35.7 9631-75 36.8 9976-150 16.4 44 > 150 11.2 30
a For the age category, n=267 as two respondents did not complete
this section of the survey.

16
(1990). In this manner, a firm’s market orientation is comprised of their customer and
competitor focus as well as the coordination of market knowledge within the firm. As
with all the measures we used, we modified the verbiage to fit with production
agriculture and pre-tested the scales with extension personnel so construct meaning was
not lost in translation. To measure organizational learning, four items from Farrell and
Oczkowski (2002) were used. These items sought to measure the ‘learning culture’ of
the farm business. Innovation was measured using a scale tested by Hurley and Hult
(1998). Similar to the entrepreneurship scale, the innovation scale measured the penchant
for managers to utilize innovative strategies to solve problems on the farm. The final
independent variable measures the cost focus of the firm. This was measured using a
combination of scales developed by Homburg, Workman and Krohmer (1999) and Kotha
and Valdamani (1995). The scale measured the manager’s focus on production
efficiency and cost reduction as a means of improving performance.
The independent latent variables were used to measure subjective performance on
beef farms in Illinois. Seven subjective performance indicators were included in this
study to measure both the producers’ satisfaction with individual and comparative
performance. Respondents were asked, using a 6-point Likert scale, to rate their
satisfaction with their return on assets, cash flow, production and marketing investments,
and overall performance. To assess comparative performance, respondents were asked to
rate the overall performance of the farm business as well as prices received relative to
their competitors. Subjective performance was used as our sample consisted of small,
privately held businesses which are generally unwilling to share confidential financial
data, even in an anonymous setting. While objective measures of performance would be

17
preferred, Dess and Robinson (1984) showed a strong correlation between subjective and
objective measures of performance.
Controls
Age of operator, experience, and farm size were all included as control variables.
Experience was measured as the number of years that the producer has been producing
beef cattle. Farm size was indicated by the number of brood cows on the farm.
Common method variance
Single informants were used in this study, so some bias may be introduced due to ‘halo
effects,’ which occur when indicators measuring dependent constructs are biased by the
independent variables (Liu et al., 2002). However, this bias could not be eliminated as
these firms are generally one-farmer operations. To check for common method variance,
all variables used in the analysis examined using an unrotated factor analysis. If a
significant amount of explained variance can be attributed to one factor, common method
variance may be a problem. In the study, the combined factor analysis resulted in 11
factors with eigenvalues greater than 1.0, which accounted for 65.71% of the variance.
Factor one accounted for 20.70% of the explained variance, therefore common method
variance is unlikely to be an issue with our data.

18
Methodology
Construct reliability
Reliability is an important concept in the development of accurate and valid measurement
scales. When testing for unobservable theoretical constructs, it is important that the
scales reliably measure what they are intended to measure. Specifically reliability refers
to the repeatability of individual test performance described by the individual propensity
distribution (Lord and Novick, 1968). Sitjsma (2009) suggests using 2 proposed by
Guttman (1945) as well as the more stringent measure of reliability, greatest lower bound
(glb). Sitjsma (2009) goes on to show that for a given glb, the true reliability can be
found on the interval [glb, 1], while alpha lies outside of this interval. For the purposes
of this dissertation, construct reliability will be measured using two different measures,
Cronbach’s alpha (1951) and Guttman’s 2 (1945). While the glb has been shown to
provide a more accurate estimate of reliability, Socan (2000) suggests that the glb only
exhibits these qualities when sample sizes are large. Further, it is important to note that
reliability is a necessary, but not sufficient condition for validity.
The purified measurement scales along with their means, standard deviations,
item-to-total correlations, factor loadings, extracted variances, and coefficient alphas are
shown in Appendix A. Cronbach alphas and Guttman 2 are all shown to be greater than
0.70 cutoff recommended by Nunnally (1978), showing that construct reliability is
present in our sample.

19
Construct validity
Construct validity was examined using factor analytic techniques available through SPSS
16.0, a statistical software package. Objective measures of validity include internal
consistency, inter-item correlation, as well as discriminant validity. Fornell and Larcker
(1981) suggest that if the average variance extracted (AVE) of the scale is greater than 50
percent, internal validity is present as a greater portion of variance is explained by the
scale than by random error. Inter-item correlation examines whether items within a scale
are correlated with each other. Worthington and Whittaker (2006) suggest to only retain
those items where factor loadings are greater than 0.32, as these scales are likely not
measuring what they are intended to measure. Streiner and Norman (1995) find that
items which do not have inter-item correlations greater than 0.20 are likely measuring a
different construct from the rest of the items. This cutoff ensures that items which remain
are highly correlated with each other as uncorrelated items could suggest an attenuation
of scale validity.
In addition, Table 2 reports the pair-wise correlations between latent factor scores
and the square root of average variance extracted along the diagonal. This is done to test
for discriminant validity as suggested by Fornell and Larcker, 1981). Discriminant
validity is shown as the square root of average variance extracted is higher than all the
pair-wise correlations. Therefore, discriminant validity is shown, and multi-collinearity
does not seem to pose any significant problems within our sample.

20
Table 2. Correlations among latent and observed variables
Results
Hypothesis testing
Using SPSS 16.0, retained measurement items from Appendix A were used to develop
factor scores that were subsequently used in the analysis. Specifically, the retained factor
scores were used as variables in the ordinary least squares (OLS) regressions conducted
to test the hypotheses presented earlier. Several models are tested to assess the
performance implications of a market orientation and its component development within
various value disciplines. Using factor scores, we measure relative orientation as the
ratio of customer orientation to competitor orientation. First, the model is tested using
the entire sample of 269 cow-calf firms, while subsequent models are tested using firms
operating within different value discipline strategies. Firm performance within each
value discipline strategy is modeled in the following manner.
Performance = f (Market orientation, Relative customer orientation, Innovation, Organizational learning,
Cost focus, Size, Experience, Age)
Construct/Variable 1 2 3 4 5 6 7 8 91. Market orientation 0.7242. Innovation 0.162 0.8513. Organizational learning 0.325 0.427 0.7294. Cost focus 0.326 0.455 0.403 0.7145. Performance 0.346 0.217 0.244 0.198 0.8316. Relative emphasis -0.045 0.001 -0.176 -0.056 -0.0557. Herd size 0.146 0.083 0.064 0.196 -0.019 0.0658. Experience 0.078 -0.093 -0.145 0.104 0.052 0.076 0.0499. Producer age 0.032 0.017 0.053 0.085 0.119 -0.014 -0.011 0.000
Note: Diagonal shows square root of average variance extracted for latent variables.
21
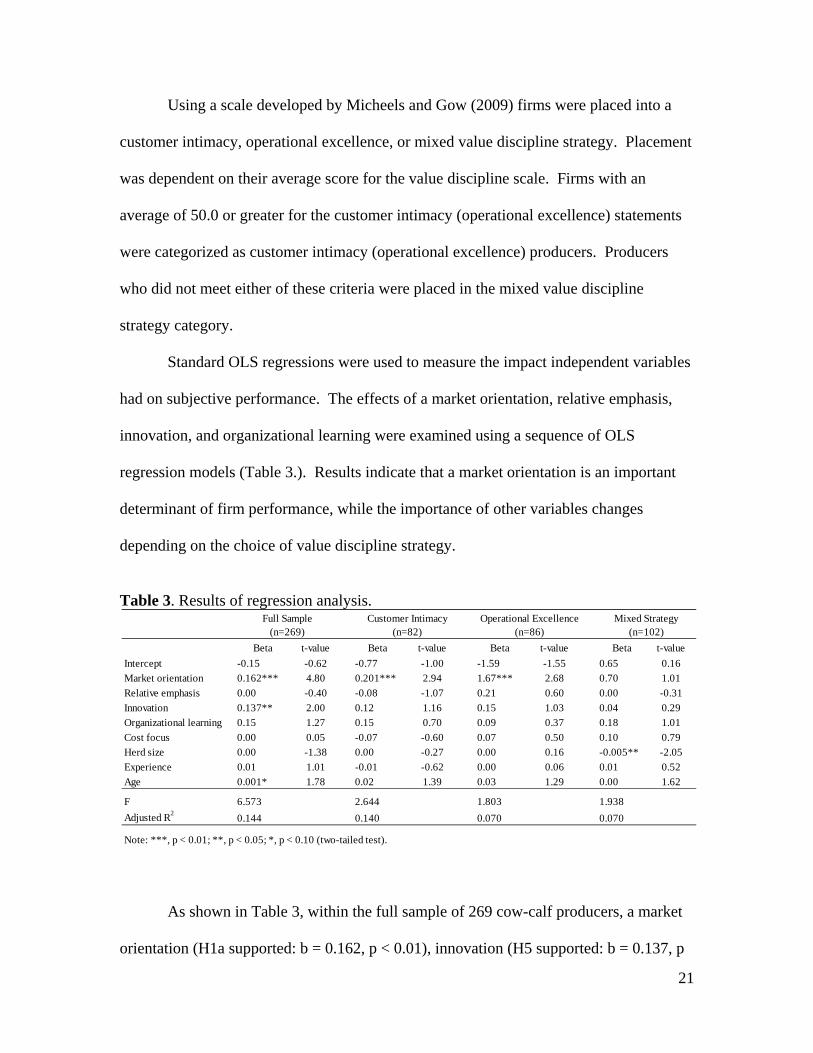
Using a scale developed by Micheels and Gow (2009) firms were placed into a
customer intimacy, operational excellence, or mixed value discipline strategy. Placement
was dependent on their average score for the value discipline scale. Firms with an
average of 50.0 or greater for the customer intimacy (operational excellence) statements
were categorized as customer intimacy (operational excellence) producers. Producers
who did not meet either of these criteria were placed in the mixed value discipline
strategy category.
Standard OLS regressions were used to measure the impact independent variables
had on subjective performance. The effects of a market orientation, relative emphasis,
innovation, and organizational learning were examined using a sequence of OLS
regression models (Table 3.). Results indicate that a market orientation is an important
determinant of firm performance, while the importance of other variables changes
depending on the choice of value discipline strategy.
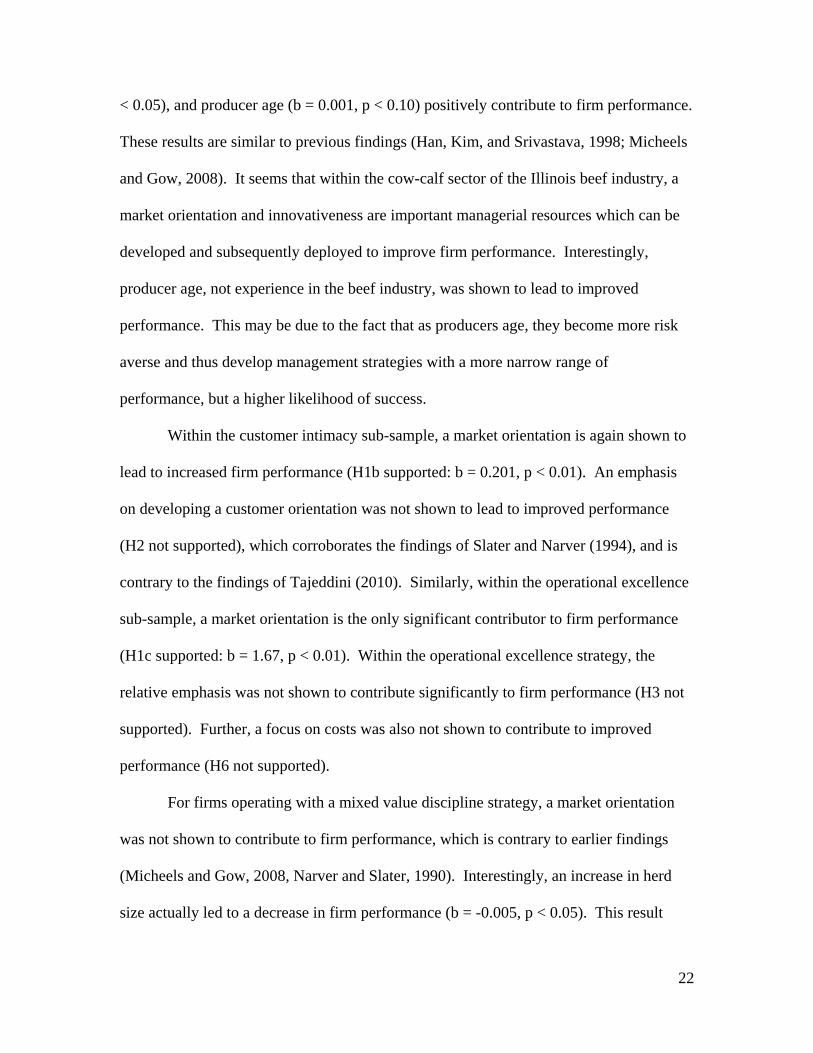
Table 3. Results of regression analysis.
As shown in Table 3, within the full sample of 269 cow-calf producers, a market
orientation (H1a supported: b = 0.162, p < 0.01), innovation (H5 supported: b = 0.137, p
Beta t-value Beta t-value Beta t-value Beta t-value
Intercept -0.15 -0.62 -0.77 -1.00 -1.59 -1.55 0.65 0.16
Market orientation 0.162*** 4.80 0.201*** 2.94 1.67*** 2.68 0.70 1.01
Relative emphasis 0.00 -0.40 -0.08 -1.07 0.21 0.60 0.00 -0.31
Innovation 0.137** 2.00 0.12 1.16 0.15 1.03 0.04 0.29
Organizational learning 0.15 1.27 0.15 0.70 0.09 0.37 0.18 1.01
Cost focus 0.00 0.05 -0.07 -0.60 0.07 0.50 0.10 0.79
Herd size 0.00 -1.38 0.00 -0.27 0.00 0.16 -0.005** -2.05
Experience 0.01 1.01 -0.01 -0.62 0.00 0.06 0.01 0.52
Age 0.001* 1.78 0.02 1.39 0.03 1.29 0.00 1.62
F 6.573 2.644 1.803 1.938
Adjusted R20.144 0.140 0.070 0.070
Customer Intimacy (n=82)
Operational Excellence (n=86)
Mixed Strategy (n=102)
Full Sample (n=269)
Note: ***, p < 0.01; **, p < 0.05; *, p < 0.10 (two-tailed test).
22
< 0.05), and producer age (b = 0.001, p < 0.10) positively contribute to firm performance.
These results are similar to previous findings (Han, Kim, and Srivastava, 1998; Micheels
and Gow, 2008). It seems that within the cow-calf sector of the Illinois beef industry, a
market orientation and innovativeness are important managerial resources which can be
developed and subsequently deployed to improve firm performance. Interestingly,
producer age, not experience in the beef industry, was shown to lead to improved
performance. This may be due to the fact that as producers age, they become more risk
averse and thus develop management strategies with a more narrow range of
performance, but a higher likelihood of success.
Within the customer intimacy sub-sample, a market orientation is again shown to
lead to increased firm performance (H1b supported: b = 0.201, p < 0.01). An emphasis
on developing a customer orientation was not shown to lead to improved performance
(H2 not supported), which corroborates the findings of Slater and Narver (1994), and is
contrary to the findings of Tajeddini (2010). Similarly, within the operational excellence
sub-sample, a market orientation is the only significant contributor to firm performance
(H1c supported: b = 1.67, p < 0.01). Within the operational excellence strategy, the
relative emphasis was not shown to contribute significantly to firm performance (H3 not
supported). Further, a focus on costs was also not shown to contribute to improved
performance (H6 not supported).
For firms operating with a mixed value discipline strategy, a market orientation
was not shown to contribute to firm performance, which is contrary to earlier findings
(Micheels and Gow, 2008, Narver and Slater, 1990). Interestingly, an increase in herd
size actually led to a decrease in firm performance (b = -0.005, p < 0.05). This result
23
does not corroborate previous results from the agricultural economics literature (Ramsey
et al., 2005). These contrary findings may be driven more so by the mixed value
discipline strategy than by a lack of economies of scale. If firms are not able to clearly
define how they provide value for downstream channel partners, an increase in herd size
may not be the appropriate strategic response. In situations such as these, firms that are
unable to focus on one singular value discipline and are therefore unable to efficiently
develop the appropriate resources and capabilities, are going to find it difficult to improve
performance simply by increasing herd size.
In general, our results indicate that a market orientation and innovation are
important determinants of firm performance in this sample of Illinois beef producers.
These important results corroborate and clarify earlier studies which examined the
relationship between market orientation and performance within food and agriculture
settings (Slater and Narver, 1994; Tregear, 2003; Verhees and Meulenberg, 2004;
Micheels and Gow, 2008). When examining these relationships within separate value
disciplines, we find a customer focus to not be important in terms of its impact on
profitability. This result corroborates the findings of Slater and Narver (1994) who find
that a market orientation is an important resource in any environment.
Conclusions
Implications
The purpose of this research was to examine the importance of a market orientation and
the relative emphasis of a customer orientation across various value discipline strategies
within the Illinois beef industry. Overall, our findings support previous research which

24
found that a market orientation and innovativeness contributed to firm performance (Han,
Kim, and Srivastava, 1998; Narver and Slater, 1990; Slater and Narver, 1994). We were
not able to find evidence to suggest that the relative emphasis on a customer or
competitor orientation was an important determinant of firm performance.
These findings are important as an increasing number of innovative and
entrepreneurial agricultural firms are operating outside of the traditional commodity
framework. Within such markets, a market orientation is a powerful resource as it
enables the firm to become aware of opportunities to provide superior value for
consumers. These findings further show that within different value disciplines, the
specific manner by which resources are allocated in the development of the market
orientation is important. These results are similar to the findings of Slater and Narver
(1994) who suggest that continually changing the relative emphasis of customer versus
competitor orientation may not be prudent given the time and financial resources used in
the development of a market orientation. That is, the development of a market
orientation or customer orientation is not instantaneous so by the time the orientation is
adjusted to the competitive environment, the conditions may have already changed.
While the results of Tajeddini (2010) suggest that the relative emphasis on the
components of a market orientation is important, those results were found using Swiss
hotel data. It may be that the Illinois beef industry is more comparable to SBUs of a
forest products firm (Slater and Narver, 1994) than that of Swiss hotels (Tajeddini, 2010).
Cow-calf producers often do not sell their production directly to the consumer, which
would be drastically different than the situation faced by hotel managers, but may be
similar to forest products firms. As firms move closer to the consumer interface,

25
modifying the relative emphasis may be an important strategic decision, but for firms
located further upstream in the value chain, a focus on developing a balanced market
orientation might be the more prudent decision.
Furthermore, Slater and Narver (1998) suggest that a customer orientation and a
market orientation are two vastly different constructs. Firms who focus solely on
consumers run the risk of developing competitive blind spots as they are focusing only on
the needs of current expressed needs of consumers and not scanning the competitive
landscape to determine consumers’ underlying latent needs. Hamel and Prahalad (1991)
term this condition the ‘tyranny of the served market’. By focusing only on current
consumers (or current competitors) firms may turn the core competencies of market
awareness and responsiveness into core rigidities (Leonard-Barton, 1992).
Limitations and future research
While our results point to some interesting implications for agricultural managers,
the nature of our sample may limit the ability to generalize the results. Our sample
focused on the Illinois beef industry, so further research could examine these results
across beef producing areas and across both crops and livestock producers. Further, the
use of cross sectional data only allows us to see that the variables are related, not
necessarily the direction of causation. Finally, the use of subjective performance limits
the ability to interpret the results. Future research could use panel data to overcome some
of these limitations.
Previous findings have shown that a market orientation is an important resource in
agricultural markets (Grunert et al., 2005; Micheels and Gow, 2008; Verhees and

26
Meulenberg, 2004). This research study found a market orientation to be an important
determinant of firm performance across value discipline strategies in the Illinois cow-calf
sector. Future research could examine the relationships between market orientation,
relative emphasis, and innovation across crops and livestock and across cultures to clarify
these results. Also, other variables could be incorporated into future models to account
for channel trust and commitment as well as perceived environmental turbulence. As
channel choices for agricultural and other producers continue to expand, further research
is needed to determine the appropriate managerial responses for each strategic choice.
Acknowledgements
Eric Micheels would like to acknowledge the Robert Ferber Dissertation Award at the
University of Illinois for financial support.
References
Armstrong, J.S and T.S. Overton. 1977. Estimating Nonresponse Bias in Mail Surveys.
Journal of Marketing Science. 16 (3): 369-402.
Baker, W.E. and J.M. Sinkula. 1999a. Learning Orientation, Market Orientation and
Innovation: Integrating and Extending Models of Organizational Performance.
Journal of Market Focused Management. 4 (4):295-308.
---------- and ----------. 1999b. The Synergistic Effect of Market Orientation and Learning
Orientation on Organizational Performance. J. Academy Marketing Sci. 27 (4): 411-
427.

27
Bigne, E. and A. Blesa. 2003. Market Orientation, Trust and Satisfaction in Dyadic
Relationships: A Manufacturer-Retailer Analysis. International Journal of Retail &
Distribution Management. 31 (11): 574-590.
Chang, L. 1994. A Psychometric Evaluation of 4-Point and 6-Point Likert-Type Scales
in Relation to Reliability and Validity. Applied Psychological Measurement. 18 (3):
205-215.
Cronbach L. 1951. Coefficient Alpha and the Internal Structure of Tests. Psychometrika.
16 (3):297–334.
Day, G.S. and R. Wensley. 1988. Assessing Advantage: A Framework for Diagnosing
Competitive Superiority. The Journal of Marketing. 52 (2): 1-20.
Darroch, J. and R. McNaughton. 2003. Beyond Market Orientation: Knowledge
Management and the Innovativeness of New Zealand Firms. Eur. J. Marketing. 37
(3/4): 572-593.
Deshpande, R. and J.U. Farley, and F.E. Webster, Jr. 1993. Corporate Culture, Customer
Orientation, and Innovativeness in Japanese Firms: A Quadrad Analysis. Journal of
Marketing. 57 (1): 23-37.
Dess, G.G. and R.B. Robinson, Jr. 1984. Measuring Organizational Performance in the
Absence of Objective Measures: The Case of the Privately-Held Firm and
Conglomerate Business Unit. Strategic Management Journal. 5 (3): 265-273.
Dev, C., K.Z. Zhou, J. Brown, and S. Argawal. 2009. Customer Orientation or
Competitor Orientation: Which Marketing Strategy Has a Higher Payoff for Hotel
Brands? Cornell Hospitality Quarterly. 50 (1): 19-28.

28
Farrell, M.A. and E. Oczkowski. 2002. Are Market Orientation and Learning Orientation
Necessary for Superior Organizational Performance? Journal of Market Focused
Management. 5 (1): 197-217.
Fornell, C. and D.F. Larcker. 1981. Evaluating Structural Equation Models with
Unobservable Variables and Measurement Error. Journal of Marketing Research.
18(1): 39-50.
Gatignon, H. and J-M. Xuereb. 1997. Strategic Orientation of the firm and New Product
Performance. Journal of Marketing Research. 34 (1): 77-90.
Green, P.E. and V.R. Rao. 1970. Rating Scales and Information Recovery – How Many
Scales and Response Categories to Use? Journal of Marketing. 34 (3): 33-39.
Greenley, G.E. 1995. Market Orientation and Company Performance: Empirical
Evidence from UK Companies. British J. Manage. 6 (1): 1-13.
Guttman, L. 1945. A Basis for Analyzing Test-Retest Reliability. Psychometrika. 10 (4):
255-282.
Hamel, G. and C. Prahalad. 1991. Corporate Imagination and Expeditionary Marketing.
Harvard Business Review. 69 (4): 81-92.
Han, J.K., N. Kim, and R.K. Srivastava. 1998. Market Orientation and Organizational
Performance: Is Innovation a Missing Link? Journal of Marketing. 62 (4): 30-45.
Homburg, C., J.P. Workman, Jr. and H. Krohmer. 1999. Marketing’s Influence within the
Firm. Journal of Marketing. 63 (2): 1-17.

29
Hult, G.T.M. and D.J. Ketchen, Jr. 2001. Does Market Orientation Matter?: A Test of the
Relationship Between Positional Advantage and Performance. Strategic Management
Journal. 22(9): 899-906.
Hurley, R.F. and G.T.M. Hult. 1998. Innovation, Market Orientation, and Organizational
Learning: An Integration and Empirical Examination. Journal of Marketing. 62 (3):
42-54.
Jaworski, B.J. and A.K. Kohli. 1993. Market Orientation: Antecedents and
Consequences. Journal of Marketing. 57 (3): 53-70.
Jones, R. 2000. Costs, Distribution of Costs, and Factors Influencing Profitability in
Cow-Calf Production. Research Bulletin 3-2000 Research Institute on Livestock
Pricing, Agricultural and Applied Economics, Virginia Tech.
Kim, W.C. and R. Mauborgne. 2005. Blue Ocean Strategy. Boston, MA. Harvard
Business School Press.
Kotha, S., and Vadlamani, B. 1995. Assessing generic strategies: An empirical
investigation of two typologies in discrete manufacturing industries. Strategic
Management Journal. 16 (1): 75-83.
Lamb, R.L., and M. Beshear. 1998. From the Plains to the Plate: Can the Beef Industry
Regain Market Share? Economic Review. Federal Reserve Bank of Kansas City.
Third Quarter. Available at:
http://www.kc.frb.org/publicat/ECONREV/PDF/4q98lamb.pdf.
Liu, H. 1995. Market Orientation and Firm Size: An Empirical Examination in UK
Firms. European Journal of Marketing. 29 (1): 57-71.

30
Liu, S., X. Luo, and Y-Z Shi. 2002. Integrating Customer Orientation, Corporate
Entrepreneurship, and Learning Orientation in Organizations in Transition: An
Empirical Study. International Journal of Research in Marketing. 19 (4): 367-382.
Leonard-Barton, D. 1992. Core Capabilities and Core Rigidities: A Paradox in Managing
New Product Development. Strategic Management Journal. 13 (S1): 111-125.
Lord, F.M. and M.R. Novick. 1968. Statistical Theories of Mental Health Scores.
Reading: Addison-Wesley.
Lukas, B.A. and O.C. Ferrell. 2000. The Effect of Market Orientation on Product
Innovation. Journal of the Academy of Marketing Science. 28 (2): 239-347.
Micheels, E.T. and H.R. Gow. 2008. Market Orientation, Innovation and
Entrepreneurship: An Empirical Examination of the Illinois Beef Industry.
International Food and Agribusiness Management Review. 11 (3): 31-56.
---------- and ----------. 2009. Do Market Oriented Firms Demonstrate Clarity on Their
Value Discipline: Evidence from Illinois Beef Producers. International Food and
Agribusiness Management Review. 13 (3): 127-152.
Narver, J.C. and S.F. Slater. 1990. The Effect of a Market Orientation on Business
Profitabiltiy. Journal of Marketing. 54 (4): 20-35.
----------, ----------, and B. Tietje. 1998. Creating a Market Orientation. Journal of
Market Focused Management. 2 (1): 241-255.
Nunnally, J.C. 1978. Psychometric Theory, 2nd Ed. New York: McGraw Hill, Inc.
Pelham, A.M. 1997. Market Orientation and Performance: The Moderating Effects of
Product and Customer Differentiation. Journal of Business and Industrial Marketing.
12 (5): 276-296.

31
----------. 1999. Influence of Environment, Strategy, and Market Orientation on
Performance in Small Manufacturing Firms. Journal of Business Research. 45 (1):
33-4.
Peteraf, M.A. 1993. The Cornerstones of Competitive Advantage: A Resource-Based
View. Strategic Management Journal. 14 (3): 179-191.
Porter, M.E. 1985. Competitive Advantage. New York: Free Press.
----------. 1991. Towards a Dynamic Theory of Strategy. Strategic Management Journal.
12 (Special Issue): 95-117.
Preston, C.C. and A.M. Colman. 2000. Optimal Number of Response Categories in
Rating Scales: Reliability, Validity, Discriminating Power, and Respondent
Preferences. Acta Psychologica 104 (1): 1-15.
Ramsey, R., D. Doye, C. Ward, J. McGrann, L. Falconer, and S. Bevers. 2005. Factors
Affecting Beef Cow Herd Costs, Production, and Profits. Journal of Agricultural and
Applied Economics. 37 (1): 91-99.
Ritchie, H.D. 2000. Why is Efficiency So Important to the Beef Industry? Limousin
Focus 2000 Symposium. Nov. 30, 2000. Stillwater, OK.
Sitjsma, K. 2009. On the Use, the Misuse, and the Very Limited Usefulness of
Cronbach’s Alpha. Psychometrika. 74 (1): 107-120.
Slater, S.F. and J.C. Narver. 1994. Does Competitive Environment Moderate the Market
Orientation-Performance Relationship? J. Marketing. 58 (1): 46-55.
---------- and ----------. 1998. Customer-Led and Market Oriented: Let’s Not Confuse the
Two. Strategic Management Journal. 19 (10): 1001-1006.
32
Socan, G. 2000. Assessment of Reliability when Test Items are not Essentially -
Equivalent. Developments in Survey Methodology. Ed. A. Ferligoj and A. Mrvar.
Ljubljana: FDV
Streiner D.L. and G.R. Norman. 1995. Health Measurement Scales: A Practical Guide
to their Development and Use. New York: Oxford University Press.
Tajeddini, K. 2010. Effect of Customer Orientation and Entrepreneurial Orientation on
Innovativeness: Evidence from the Hotel Industry in Switzerland. Tourism
Management. 31 (2): 221-231.
Teece, D.J., G. Pisano, and A. Shuen. 1997. Dynamic Capabilities in Strategic
Management. Strategic Management Journal. 18 (7): 509-533.
Treacy, M. and F. Wiersema. 1993. Customer Intimacy and other Value Disciplines.
Harvard Business Review. 71 (1): 84-93.
---------- and ----------. 1997. The Discipline of Market Leaders: Choose Your Customers,
Narrow Your Focus, Dominate Your Market. Reading, MA: Addison-Wesley.
Tregear, A. 2003. Market Orientation and the Craftperson. European Journal of
Marketing. 37 (11/12) 1621-1635.
United States Department of Agriculture, National Agricultural Statistic Service. 2007
Census of Agriculture. Last modified 2/3/2009. Available online at
http://www.agcensus.usda.gov/Publications/2007/Full_Report/Volume_1,_Chapter_1
_US/index.asp
Verhees, F.J.H.M. and M.T.G. Meulenberg. 2004. Market Orientation, Innovativeness
Product Innovation, and Performance in Small Firms. Journal of Small Business
Management 42 (2): 134-154.

33
Worthington R.R. and T.A. Whittaker. 2006. Scale Development Research: A Content
Analysis and Recommendations for Best Practices. The Counseling Psychologist. 34
(6): 308-338.

34
Appendix A. Scale reliability and validity
Measurement Items (only retained items are displayed)Guttman's
2
Cronbach's Alpha
Variance Extracted
Factor Loadings
Corrected Item-to-Total Correlation
Customer Orientation (based on Narver, Slater, and MacLachlan, 2004) 0.769 0.762 57.63%
We continuously try to discover additional needs of our customers of which they are unaware 0.846 0.634
We incorporate solutions to unarticulated customer needs in our new products and services. 0.826 0.614
We innovate even at the risk of making our own products obsolete. 0.527 0.332
We work closely with lead customers who try to recognize their needs months or even years before the majority of the market may recognize them. 0.794 0.580
Competitor Orientation (based on Narver and Slater, 1990) 0.865 0.861 52.44%
Employees on our farm share information concerning competitor’s activities. 0.656 0.536
Top management regularly discusses competitor’s strengths and weaknesses. 0.660 0.543
We target customers where we have an opportunity for competitive advantage. 0.615 0.494
Members of our farm collect information concerning competitor’s activities. 0.758 0.643
We diagnose competitor’s goals. 0.802 0.699
We identify the areas where the key competitors have succeeded or failed. 0.758 0.633
We evaluate the strengths and weaknesses of key competitors. 0.797 0.679
Interfunctional Coordination (based on Narver and Slater, 1990) 0.758 0.757 57.57%
We generally regularly visit our current and prospective customers. 0.718 0.503
We freely communicate information about our successful and unsuccessful customer experiences across all business functions.
0.725 0.509
All of our business units (marketing, production, research, finance/accounting) are integrated in serving the needs of our target markets
0.817 0.616
People on our farm understand how everyone in our business can contribute to creating customer value.
0.772 0.557
Learning Orientation (based on Farrel and Oczkowski, 2002) 0.778 0.77 53.15%
The basic values of this farm include learning as key to improvement 0.786 0.596
Our take is that learning is an investment, not an expense 0.844 0.653
Learning on my farm is seen as a key commodity necessary to guarantee survival.
0.840 0.661
There is little commonality of purpose in my farm/marketing channel.* 0.619 0.452
Personnel in this farm realize that the very way they perceive the marketplace must be continually questioned
0.487 0.339
Innovation Orientation (based on Hurley and Hult, 1998) 0.747 0.736 72.43%
Technical innovation based on research results is readily accepted. 0.852 0.480
We seldom seek innovative ideas.* 0.753 0.565
Innovation is readily accepted in project management. 0.842 0.554
Individuals are penalized for new ideas that don’t work. 0.887 0.342
Innovation in our organization is perceived as too risky and is resisted. 0.840 0.567
Cost Focus/Internal Orientation (based on Homburg, Workman and Krohmer (1999) and Kotha and Valdamanni (1995)) 0.734 0.726 50.99%
Improving the operating efficiency of the business is a top priority. 0.847 0.653
We have a continuing goal to lower operating costs. 0.808 0.581
We hardly ever seek to improve production practices so that we can lower costs. 0.621 0.389
Achievement of economies of scale or scope is an important element of our strategy. 0.516 0.333
We closely monitor the effectiveness of key production practices. 0.727 0.573
Overall Firm Performance (based on Jaworski and Kohli, 1993) 0.832 0.818 68.98%
The return on farm assets did not meet expectations last year.* 0.819 0.637
We were very satisfied with the overall performance of the farm last year. 0.827 0.688
The return on production investments met expectations last year. 0.849 0.753
The cash flow situation of the farm was not satisfactory.* 0.779 0.553
The return on marketing investments met expectations last year. 0.712 0.657
The prices we receive for our product is higher than that of our competitors. 0.863 0.285
The overall performance of the farm last year exceeded that of our major competitors. 0.802 0.524