The Impact of Agile. Quantified. - CA Technologies · The second group is doing Full Scrum. ... 8 |...
16
These insights give you real-world numbers to make an economic case for getting the resources you need and getting your people to commit to change. Background About the findings Though people have made agile recommendations for many years, we’ve never been able to say how accurate they actually are or how much impact a particular recommendation might make. The findings in this document were extracted by looking at nonattributable data from more than 160,000 projects, 50,000 agile teams, and 13,000 active teams using the CA Agile Central application lifecycle management (ALM) platform. CA Technologies is in the unique position to mine this wealth of SaaS (cloud-based) data and uncover metrics-driven insights. These insights give you real-world numbers to make an economic case for getting the resources you need and getting your people to commit to change. That’s the underlying motivation of this work. Agile and lean are built on a foundation of continuous improvement: You need to inspect, learn from and adapt your performance to keep improving. Enhancing performance begins with having accurate, comprehensive data. The multitenant architecture of CA Agile Central is uniquely positioned to provide access to anonymized industry benchmarking data from tens of thousands of agile teams. CA Agile Central Insights capabilities, part of a CA Agile Central Unlimited Edition subscription, provide performance metrics and benchmarking data for individual teams, teams of teams and even whole business units, departments and organizations. The Impact of Agile. Quantified.
Transcript of The Impact of Agile. Quantified. - CA Technologies · The second group is doing Full Scrum. ... 8 |...

These insights give you real-world numbers to make an economic case for getting the resources you need and getting your people to commit to change.
BackgroundAbout the findingsThough people have made agile recommendations for many years, we’ve never been able to say how accurate they actually are or how much impact a particular recommendation might make.
The findings in this document were extracted by looking at nonattributable data from more than 160,000 projects, 50,000 agile teams, and 13,000 active teams using the CA Agile Central application lifecycle management (ALM) platform. CA Technologies is in the unique position to mine this wealth of SaaS (cloud-based) data and uncover metrics-driven insights.
These insights give you real-world numbers to make an economic case for getting the resources you need and getting your people to commit to change. That’s the underlying motivation of this work.
Agile and lean are built on a foundation of continuous improvement: You need to inspect, learn from and adapt your performance to keep improving. Enhancing performance begins with having accurate, comprehensive data. The multitenant architecture of CA Agile Central is uniquely positioned to provide access to anonymized industry benchmarking data from tens of thousands of agile teams.
CA Agile Central Insights capabilities, part of a CA Agile Central Unlimited Edition subscription, provide performance metrics and benchmarking data for individual teams, teams of teams and even whole business units, departments and organizations.
The Impact of Agile. Quantified.

ca.com2 | THE IMPACT OF AGILE QUANTIFIED
The Software Development Performance IndexThe Software Development Performance Index (SDPI) is a balanced measurement framework researched and developed in cooperation with the Software Engineering Institute (SEI) at Carnegie Mellon University. The SDPI measures performance across the key dimensions of Quality, Productivity, Predictability, and Responsiveness. The framework’s data and surveys include a formula for calculating performance measurements and guidance for how to use the metrics based on your context.
Correlation: not necessarily causationThe findings in this document are extracted by looking for correlations between decisions or behaviors (keeping teams stable, setting your team sizes to between five and nine, keeping your work in process—WiP—low, etc.) and outcomes as measured by the dimensions of the SDPI. As long as the correlations meet certain statistical requirements,* we report them here. However, correlation does not necessarily mean causation. For example, just because we show that teams with low average WiP have one-quarter as many defects as teams with high WiP, doesn’t necessarily mean that if you lower your WiP, you’ll reduce your defect density to one-quarter of what it is now. The effect may be partially or wholly related to some other underlying mechanism.
About the four dimensions of performanceResponsivenessBased on time in process (or time to market): The amount of time that a work item spends in process.
QualityBased on defect density: The count of defects divided by man days.
ProductivityBased on throughput/team size: The count of user stories and defects completed in a given time period.
PredictabilityBased on throughput variability: The standard deviation of throughput for a given team over three monthly periods divided by the average of the throughput for those same three months.

ca.com3 | THE IMPACT OF AGILE QUANTIFIED
Double Your ProductivityIf people are dedicated to only one team rather than multiple teams or projects, they stay focused and get more done, leading to better performance. But which aspect of performance is impacted most?
The answer is Productivity. We can see that there is almost a two to one difference in throughput between teams that are 95 percent or more dedicated compared with teams that are 50 percent or less dedicated.
Dedicating people to one team also has an impact on Predictability and Quality, but mostly in the extreme. You can see from the charts showing the variability of throughput and defect density, the effect is most prominent for the group that is less than 50 percent dedicated.
Rele
ased
def
ects
Team dedication vs. defect densityLower is better
Percent dedicated
< 50 (n = 12092)
50 - 70 (n = 10053)
70 - 85 (n = 10812)
85 - 95 (n = 12712)
≥ 95 (n = 29360)
0
5
10
15Ti
me
in p
roce
ss fo
r sto
ries
Team dedication vs. time in processLower is better
Percent dedicated
< 50 (n = 12092)
50 - 70 (n = 10053)
70 - 85 (n = 10812)
85 - 95 (n = 12712)
≥ 95 (n = 29360)
0
5
10
15
20
Coun
t of s
torie
s
Team dedication vs. throughputHigher is better
Percent dedicated
< 50 (n = 12092)
50 - 70 (n = 10053)
70 - 85 (n = 10812)
85 - 95 (n = 12712)
≥ 95 (n = 29360)
0
80
20
40
60
CoV
on th
roug
hput
Team dedication vs. variation of throughputLower is better
Percent dedicated
< 50 (n = 12092)
50 - 70 (n = 10053)
70 - 85 (n = 10812)
85 - 95 (n = 12712)
≥ 95 (n = 29360)
0
1.25
0.25
0.5
0.75
1
Quality
Responsiveness
Productivity
Predictability

ca.com4 | THE IMPACT OF AGILE QUANTIFIED
We can see that there is almost a 2:1 difference in throughput between teams that are 95 percent or more dedicated compared with teams that are 50 percent or less dedicated.
On a positive note, the recommendation that we dedicate people to one team is widely followed. You can see in the histogram that the highest spike is in the far right. This is the count of the number of team quarters where 99 percent or better of the work was done by people who are dedicated to this one team. The next bar to the left is the 98 to 99 percent group, and it’s the second highest. This histogram shows that we are consistently dedicating people to one team.
However, the story is not so good for the agile recommendation of keeping teams stable. The stability metric measures how many of the team members stay the same from one quarter to the next. This histogram shows that very few teams actually have 100 percent stability. The median of this data is at 74.8 percent, which means that roughly one out of four people on these teams changes every three months. Teams are very unstable.
Key Findings
Stable teams are associated/correlate with:
• 60% better Productivity.
• 40% better Predictability.
• 60% better Responsiveness.
Coun
t
Percent dedicated work
0 10 20 30 40 50 60 70 80 90 1000
1,000
2,000
3,000
4,000
5,000
6,000
7,000
Coun
t
Team Stability
0 10 20 30 40 50 60 70 80 90 1000
500
1,000
1,500
2,000
2,500
3,000
People are mostly dedicated to one team.
One out of four team members changes every three months.

ca.com5 | THE IMPACT OF AGILE QUANTIFIED
Unnstable teams are associated with lower performance, which makes sense. If we shift the teams around, we have to train new team members. While we are ramping them up, we’re not getting work done. Again, Productivity (throughput effect of up to 60 percent) is most impacted. But Predictability (variability of throughput effect of up to 40 percent) and Responsiveness (time-in-process effect of up to 60 percent) also show a significant effect.
Recommendations
• Dedicate people to a single team.
• Keep teams intact and stable.
Rele
ased
def
ects
Team stability vs. defect densityLower is better
Team stability
< 60 (n = 10921)
60 - 70 (n = 9499)
70 - 80 (n = 12730)
80 - 90 (n = 12863)
≥ 90 (n = 7214)
0
10
2.5
5
7.5
12.5Ti
me
in p
roce
ss fo
r sto
ries
Team stability vs. time in processLower is better
Team stability
< 60 (n = 10921)
60 - 70 (n = 9499)
70 - 80 (n = 12730)
80 - 90 (n = 12863)
≥ 90 (n = 7214)
0
5
10
15
20
Coun
t of s
torie
s
Team stability vs. throughputHigher is better
Team stability
< 60 (n = 10921)
60 - 70 (n = 9499)
70 - 80 (n = 12730)
80 - 90 (n = 12863)
≥ 90 (n = 7214)
0
100
25
50
75
CoV
thro
ughp
ut
Team stability vs. variation of throughputLower is better
Team stability
< 60 (n = 10921)
60 - 70 (n = 9499)
70 - 80 (n = 12730)
80 - 90 (n = 12863)
≥ 90 (n = 7214)
0
1
0.25
0.5
0.75
Quality
Responsiveness
Productivity
Predictability

ca.com6 | THE IMPACT OF AGILE QUANTIFIED
Improve Quality by 250 PercentWe looked at teams that followed four different estimating processes. The first group, which is only three percent of our teams, did no estimating, even though 90 percent or more of their work was put into iterations.
The second group is doing Full Scrum. They are consistently putting story points on their stories before adding them to iterations, and they are also consistently breaking those stories down into tasks and making task-hour estimates. This group represents the vast majority of our teams: 79 percent.
The third group we have labeled Lightweight Scrum, and it represents 10 percent of the teams in the study. Some agile coaches suggest that mature teams may be able to skip task breakdown and task-hour estimating without hurting performance. Let’s see if the data bears this out.
The fourth and last group is teams that are not doing story point estimation but are doing task-hour estimates. They do all of their estimating in hours. We were a bit surprised to see that eight percent of the teams in the study were doing this, because we know of no agile coaches who recommend this process. We believe that these are teams that have come from a pre-agile world and started to use CA Agile Central with little or no coaching. They did their estimates in hours before they started using CA Agile Central, and that’s what they’re used to.
Key Findings
• Teams doing Full Scrum have 250 percent better Quality than teams doing no estimating.
• Lightweight Scrum performs better overall, with better Productivity, Predictability and Responsiveness.
Process Type Percent of Teams
No estimates 3%
Full Scrum Story points and task hours
79%
Lightweight Scrum Story points only
10%
Hour-oriented Task hours only
8%
Teams that follow the Full Scrum process perform better than most alternatives, but Lightweight Scrum is actually better overall.

ca.com7 | THE IMPACT OF AGILE QUANTIFIED
What we found when we compared these various process choices is that teams that follow the Full Scrum process perform better than most alternatives, but Lightweight Scrum is actually better overall. This chart shows a score for each of the four dimensions added together.�
It’s interesting to note that the group that we believe has received the least coaching (task-hour estimates only) performs the worst, and the coaching recommendation for mature teams (Lightweight Scrum) performs best.
There is one dimension where Full Scrum outperforms Lightweight Scrum, and that is the dimension of Quality. There is a 250-percent difference in defect density between the best and worst process choices, so that’s pretty dramatic.*
Recommendations
• Experienced teams may get best results from Lightweight Scrum.
• If new to agile or most strongly focused on Quality, choose Full Scrum.
Perfo
rmac
e in
dex
tota
l
Scrum Practice Relationship to Performance
Predictability Productivity Quality Responsiveness
No Estimates (n = 2596)
Full Scrum (n = 44870)
Lightweight Scrum (n = 6406)
Hour-oriented (n = 6157)
0
50
10
20
30
40
60
Rele
ased
def
ects
Defects by process choice
Process choice
No Estimates (n = 2596)
Full Scrum (n = 44870)
Lightweight Scrum (n = 6406)
Hour-oriented (n = 6157)
0
5
10
15
20
25
Quality

ca.com8 | THE IMPACT OF AGILE QUANTIFIED
Cut Time to Market in HalfCoaches tell you that lower WiP is always better. Is that really true?
WiP is the measure of the number of simultaneous work items that are in process at the same time.
Let’s look at the relationship between WiP per team member and time in process (TiP). The group on the far left is very good at controlling their WiP. They have, on average, less than one work item per team member in process. The group on the far right is not controlling WiP very well at all. They have seven or more work items per team member in process at the same time. So a team of five would have a WiP of 35 or more.
Queuing theory (Little’s Law in particular) predicts that there will be a linear relationship between WiP and TiP, and sure enough, we see these results. The TiP for teams that poorly control their WiP is up to two times as long as teams that control their WiP very well. This makes intuitive sense. The more focused you are on a few things, the quicker you’ll get each one done.
Tim
e in
pro
cess
for s
torie
s
WiP per team member vs. time in processLower is better
WiP per team member
0 - 1 (n = 9857)
1 - 2 (n = 21712)
2 - 3 (n = 14590)
3 - 5 (n = 13646)
5 - 7 (n = 5588)
> 7 (n = 7697)
0
5
10
15
20
Responsiveness
Fewer things in process means that each gets done faster.
Key Findings
Teams that aggressively control WiP:
• Cut time in process in half.
• Have one quarter as many defects.
• But have 34 percent lower Productivity.

ca.com9 | THE IMPACT OF AGILE QUANTIFIED
Rele
ased
def
ects
WiP per team member vs. defect densityLower is better
WiP per team member
0 - 1 (n = 9857)
1 - 2 (n = 21712)
2 - 3 (n = 14590)
3 - 5 (n = 13646)
5 - 7 (n = 5588)
> 7 (n = 7697)
0
5
10
15
20
Coun
t of s
torie
s
WiP per team member vs. throughputHigher is better
WiP per team member
0 - 1 (n = 9857)
1 - 2 (n = 21712)
2 - 3 (n = 14590)
3 - 5 (n = 13646)
5 - 7 (n = 5588)
> 7 (n = 7697)
0
20
40
60
80
CoV
on th
roug
hput
WiP per team member vs. variation of throughputLower is better
WiP per team member
0 - 1 (n = 9857)
1 - 2 (n = 21712)
2 - 3 (n = 14590)
3 - 5 (n = 13646)
5 - 7 (n = 5588)
> 7 (n = 7697)
0
1
0.25
0.5
0.75
Quality
Productivity
Predictability
We discovered a huge effect on Quality for teams that have low WiP. Teams with the lowest WiP have four times better Quality than teams with the highest WiP.*
Queuing theory also predicts that if you lower WiP too much, you’ll have a negative impact on Productivity. This too makes sense. If some work gets blocked, there isn’t enough other work to do. The two groups on the left of the productivity chart have pushed their WiP so low that they’ve negatively impacted their throughput. In fact, teams with very low WiP have 34 percent lower Productivity.
In summary, if your WiP is already high, then by all means drive it lower. However, if your WiP is already low, consider your economic model before you decide to drive it lower. If you’re at risk for missing a market window, then drive your WiP as low as possible by focusing on just a few things. But if Productivity is the primary driver of your economic model, don’t push your WiP to extremely low levels because if work gets blocked, you won’t have any Productivity.
Teams with the lowest WiP have four times better Quality than teams with the highest WiP.
More work in process = more defects
Recommendations
• If your WiP is high, reduce it.
• If your WiP is already low, consider your economic drivers:
• If Productivity drives your bottom line, don’t push WiP too low.
• If time to market drives your bottom line, push WiP as low as it will go.

ca.com10 | THE IMPACT OF AGILE QUANTIFIED
Balance Your Team PerformanceAgile recommends that the ideal team size is seven, plus or minus two. How ideal is this, when we actually look at the data?
Teams that are smaller than the recommended size tend to have better Productivity, but also tend to have worse Quality. There is little effect on Responsiveness.
Does organization size matter?Yes and no. It turns out that organizations of different sizes tend to make different choices. Smaller organizations tend to have a higher proportion of smaller teams, which makes sense.
Larger organizations tend to choose Full Scrum more than smaller organizations. These choices explain most of the differences we see in the variation in performance between larger and smaller organizations.
Recommendations
• Set up teams of 7, plus or minus 2 people, for the most balanced performance.
• If you are doing well with larger teams, there’s no evidence that you need to change.
Key Findings
Compared to teams of the recommended size (5–9), small teams of 1–3 people have:
• 40 percent less Predictability.
• 17 percent lower Quality.
• But 17 percent more Productivity.
Teams larger than the recommended size have better Predictability and little effect on other dimensions.
Perfo
rmac
e in
dex
scor
e
Team Size Relationship to Performance
Productivity Quality Responsiveness
Most Balanced
< 3 (n = 3821)
3 - 4 (n = 14275)
5 - 9 (n = 27606)
9 - 15 (n = 18609)
50
20
30
40
60
70
ca.com11 | THE IMPACT OF AGILE QUANTIFIED
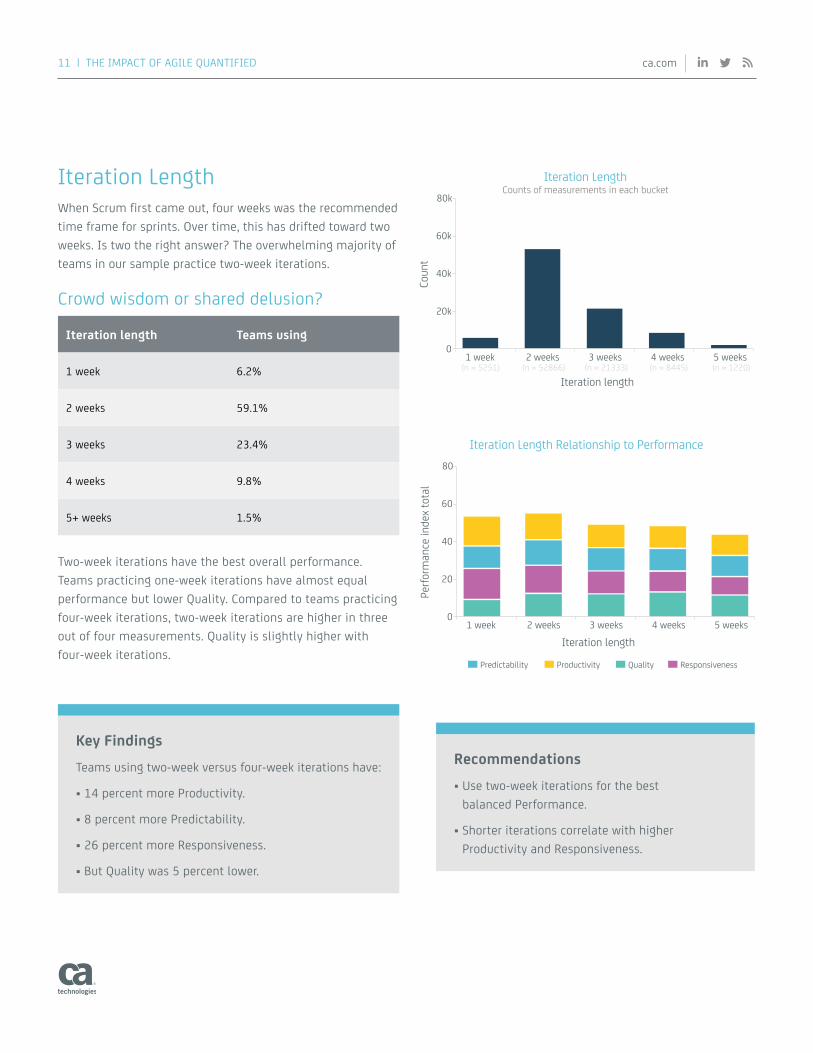
Iteration LengthWhen Scrum first came out, four weeks was the recommended time frame for sprints. Over time, this has drifted toward two weeks. Is two the right answer? The overwhelming majority of teams in our sample practice two-week iterations.
Crowd wisdom or shared delusion?
Iteration length Teams using
1 week 6.2%
2 weeks 59.1%
3 weeks 23.4%
4 weeks 9.8%
5+ weeks 1.5%
Two-week iterations have the best overall performance. Teams practicing one-week iterations have almost equal performance but lower Quality. Compared to teams practicing four-week iterations, two-week iterations are higher in three out of four measurements. Quality is slightly higher with four-week iterations.
Key Findings
Teams using two-week versus four-week iterations have:
• 14 percent more Productivity.
• 8 percent more Predictability.
• 26 percent more Responsiveness.
• But Quality was 5 percent lower.
Recommendations
• Use two-week iterations for the best balanced Performance.
• Shorter iterations correlate with higher Productivity and Responsiveness.
Coun
t
Iteration LengthCounts of measurements in each bucket
Iteration length
1 week (n = 5251)
2 weeks (n = 52866)
3 weeks (n = 21333)
4 weeks (n = 8445)
5 weeks (n = 1220)
0
80k
20k
40k
60k
Perfo
rman
ce in
dex
tota
l
Iteration Length Relationship to Performance
Iteration length1 week 2 weeks 3 weeks 4 weeks 5 weeks
0
80
20
40
60
Predictability Productivity Quality Responsiveness

ca.com12 | DOCUMENT TITLE
Ratio of Testers to DevelopersDo you know if you have enough testers? What is the impact to overall Quality?
We looked at ratios of testers to developers that range from no dedicated testers up to one-to-one testers to developers.
Our conclusion is that more testers lead to better Quality but lower Productivity and Responsiveness.
RetrospectivesOur research indicates that effective retrospectives result in teams with 20 percent higher balanced performance than teams that don’t conduct retrospectives.
Key Findings
• Teams with up to 1 tester per developer have 20 percent higher Quality than those with less than .3 testers per developer.
• But they had 12-percent less Productivity and 15 percent less Responsiveness.
Interestingly, teams with no testers have:
• The best Productivity.
• Almost as good Quality.
• But much wider variation in Quality.
Key Findings
Teams that strongly agree that they have sprint retrospectives have 24 percent more Responsiveness and have 42 percent higher Quality with less variability.
Recommendations
Testing practices, regardless of testers-to-developers ratio, still support overall performance.
Recommendations
Consistent and effective retrospectives where learnings are applied for future improvement can significantly impact teams’ performance in future sprints.
Perfo
rman
ce in
dex
tota
l
Sprint Retrospective Relationship to Performance
Stonglydisagree (1)
Disagree (2) Neutral (3) Agree (4) Stonglyagree (5)
0
80
20
40
60
Predictability Productivity Quality Responsiveness

ca.com13 | THE IMPACT OF AGILE QUANTIFIED
MotiveWe compared performance with the main reason to adopt agile. Interestingly, those people who indicated this was an organizational decision (versus simplifying the development process or increasing productivity, for example) performed the best. This is probably because more coaching and training was involved for those people whose organization as a whole supported the move to agile.
Key Findings
• Motive has a small but statistically significant impact on performance.
• Extrinsic motivation does not have a negative impact on performance.
• Although teamwork is selected four times more than talent, skills and experience, the latter correlate with higher overall performance.
Recommendations
Executive support is critical for success with agile— identify and invest in developing team members for higher overall performance.
Perfo
rman
ce in
dex
tota
l
Reason for Adopting Agile Relationship to Performance
Predictability Productivity Quality Responsiveness
Organizationaldecision
Enhancesoftwarequality
Simplifydevelopment
process
Better alignIT/Business
IncreaseProductivity
Acceleratetime tomarket
0
80
20
40
60
Coun
t
Reason for Adopting Agile
Organizationaldecision
Enhancesoftwarequality
Simplifydevelopment
process
Better alignIT/Business
IncreaseProductivity
Acceleratetime tomarket
0
200
50
100
150
Counts of measurements in each bucket
(n = 198) (n = 36) (n = 25) (n = 22) (n = 59) (n = 163)

ca.com
CA Agile Central InsightsSupport smart decisions across your enterpriseWe found that customers using CA Agile Central Insights on an ongoing basis increased their balanced team performance by 9 percent after 25 weeks.
CA Agile Central Insights Analytics Workshop helps you understand how to select and use software development performance metrics that fit your business context and provide relevant feedback to you and your teams.
14 | THE IMPACT OF AGILE QUANTIFIED
Key Findings
Teams using CA Agile Central Insights for more than 25 weeks have 30 percent faster average TiP.
Recommendations
Continue to inspect and adapt using CA Agile Central Insights to continually improve performance, cross-pollinate learnings and see which teams need more investment.
Contact us at [email protected] or visit ca.com/agile

ca.com15 | THE IMPACT OF AGILE QUANTIFIED
Appendix: Useful Definitions
Time buckets Each metric is calculated for a particular time bucket. The charts in this document are all shown for time periods of three months in length.
Percentile scoring Each raw metric has a unique distribution, and for some metrics higher is better, whereas lower is better for others. To make it easier to interpret the metric and enable the aggregation of dissimilar units into a single index, raw metrics are converted into a percentile score across the entire distribution of all similar metrics. Higher is always better for percentiles.
Calculating the Index The SDPI is made up of several dimensions. Each raw metric is percentile scored, and one or more of those are averaged to make up a particular dimension. To calculate the overall SDPI, we take the average of the contributing dimensions’ scores.
Team size We heuristically extract the team membership by looking at who is working on what items and who is the owner of those work items, along with which CA Agile Central project/team those work items are in. We then determine what fraction of each team member’s time is dedicated to each team. The team size is the sum of these fractions.
Responsiveness score from Time in Process (TiP)
TiP is the amount of time (in fractional days) that a work item spends in a particular state. Weekends, holidays and nonwork hours are not counted. We attribute a work item to the bucket where it left that state. You can think of this as the time bucket where work was completed. We then take the median TiP of all the work items in that time bucket. While other parameters are possible, we only look at the TiP of user stories and we define “in Process” as ScheduleState equals “In-Progress” or “Completed.”
Quality score from defect density
Defect density is the count of defects divided by man days, where man days is team size times the number of workdays in that time bucket. This results in a metric that represents the number of defects per team member per workday.
We look at both the defects found in production as well as those found in test and other areas as indicated by the “Environment” field in CA Agile Central. We sense whether or not defects are typically being recorded in CA Agile Central for each of these types for each team over a time period and only use it if it passes this test. We’ll take either as the Quality score or the average of the two if both are reliably recorded.
Productivity score from throughput/team size
Throughput is simply the count of user stories and defects completed in a given time period. The Productivity score is the percentile scoring of this throughput normalized by the team size. While defects are shown in the drill-down charts, currently only user stories contribute to the Productivity score.
Predictability score from throughput variability
Throughput variability is the standard deviation of throughput for a given team over three monthly periods divided by the average of the throughput for those same three months. This is referred to as the coefficient of variance (CoV) of throughput. Again, we only look at user stories for this Predictability score.

ca.com16 | THE IMPACT OF AGILE QUANTIFIED
Copyright © 2017 CA. All rights reserved. All trademarks, trade names, service marks and logos referenced herein belong to their respective companies.. CS200-246623_0117
As of July 2015, Rally Software was acquired by CA Technologies.
* Our data set is made up from the change records recorded from users working in the CA Agile Central application lifecycle management platform. We conduct this research by extracting three types of higher-level measurements from these low-level change records: 1) context (example: is this “Project” entity a real team or meta-team or a project), 2) decisions or behaviors (team size, estimating process, WiP, etc.), and 3) outcomes (the SDPI dimensions from defect density, time in process, etc.). We then use a technique called “analysis of variation” (ANOVA) to determine if differences in the mean of an outcome measurement (type 3) for various alternative decisions (type 2) under a particular context (type 1) are statistically significant. If the ANOVA p-value is less than 5 percent, then it is highly unlikely that the effect of the decision upon the outcome is due to chance, and as long as a few other requirements are met, the finding is included in this report. We have such a large data set that in most cases the p-value for these findings is much less than 1 percent indicating a very low likelihood that the finding is from chance.
� In course of doing this research, we had two particularly dramatic findings, both correlations with high Quality, which led us to wonder if the correlation we were seeing was not causal: 1) the correlation of high Quality with the process choice of Full Scrum, and 2) the correlation of high Quality with low WiP. One plausible theory is that there could be some underlying mechanism (high discipline, for example) that both leads to higher Quality and causes people to choose Full Scrum and low WiP. However, if this were true, then we should see a correlation between the choice of Full Scrum and low WiP, so we took a look at that. We did not find a strong correlation. So, while it’s still possible that there is some underlying mechanism that causes both high Quality and choosing Full Scrum… and another underlying mechanism that causes both high Quality and low WiP, the lack of a correlation between low WiP and Full Scrum is evidence that it is not the same underlying mechanism. That largely rules out, “high discipline” as the underlying mechanism for both findings.
CA Technologies (NASDAQ: CA) creates software that fuels transformation for companies and enables them to seize the opportunities of the application economy. Software is at the heart of every business, in every industry. From planning to development to management and security, CA is working with companies worldwide to change the way we live, transact and communicate—across mobile, private and public cloud, distributed and mainframe environments. Learn more at ca.com.
Connect with CA Technologies at ca.com