The Impact of Act 10 on Wisconsin Education · PDF fileThe Wisconsin Institute for Law &...
25
The Wisconsin Institute for Law & Liberty The Impact of Act 10 on Wisconsin's Education Workforce A comprehensive statewide analysis of Act 10’s effect on students per teacher and teacher experience, salary, and benefits Dr. Marty Lueken, Director of Fiscal Policy and Analysis Friedman Foundation Dr. Will Flanders, Education Research Director Wisconsin Institute for Law & Liberty CJ Szafir, Vice President of Policy Wisconsin Institute for Law & Liberty June 2016
Transcript of The Impact of Act 10 on Wisconsin Education · PDF fileThe Wisconsin Institute for Law &...

The Wisconsin Institute for Law & Liberty
The Impact of Act 10 on Wisconsin's Education Workforce
A comprehensive statewide analysis of Act 10’s effect on students per teacher and teacher experience, salary, and benefits
Dr. Marty Lueken, Director of Fiscal Policy and AnalysisFriedman Foundation
Dr. Will Flanders, Education Research DirectorWisconsin Institute for Law & Liberty
CJ Szafir, Vice President of PolicyWisconsin Institute for Law & Liberty
June 2016

Wisconsin Institute for Law & Liberty
The Impact of Act 10 on Wisconsin’s Education Workforce June 2016
1
The Impact of Act 10 on Wisconsin’s Education Workforce
A comprehensive statewide analysis of Act 10’s effect on students per teacher and teacher experience, salary, and benefits
Dr. Marty Lueken, Director of Fiscal Policy and Analysis, Friedman Foundation
Dr. Will Flanders, Education Research Director, WILL
CJ Szafir, Vice President of Policy, WILL

Wisconsin Institute for Law & Liberty
The Impact of Act 10 on Wisconsin’s Education Workforce June 2016
2
"Views expressed in this report are solely those of the individual authors and the Wisconsin Institute for Law & Liberty"

Wisconsin Institute for Law & Liberty
The Impact of Act 10 on Wisconsin’s Education Workforce June 2016
3
TABLE OF CONTENTS
Executive Summary...………………………..............…………...4
Existing Research on Act 10 ……...…...……………...6
Descriptive Comparisons of Teachers Pre- and Post- Act 10…………………………………..…..........…...…8
Main Analysis: Comparisons with Neighboring States….....…….……………………………………...12
Conclusions.…………..……………………………....20
Appendices..………………………………………..…22
The Impact of Act 10 on
Wisconsin’s Education Workforce
A comprehensive statewide analysis of Act 10’s effect on
students per teacher and teacher experience, salary, and benefits
June 2016

Wisconsin Institute for Law & Liberty
The Impact of Act 10 on Wisconsin’s Education Workforce June 2016
4
I. Executive Summary
Background: The passage and implementation of Act 10 – Governor Walker’s signature collective bargaining reform law – was one of the most controversial events in the history of Wisconsin. Over 100,000 protestors filled the state capitol, fearful that passage of the law would have a devastating effect on their lives. U.S. Congressman Mark Pocan concisely summed up many of the concerns of Act 10 opponents: “Cutting teachers ability to bargain for fair wages + Reducing teacher pensions + Increased class sizes and demands on teachers + Damaging anti-teacher rhetoric= LESS TEACHERS.1”
Nearly 5 years since the effective date of Act 10, June 29, 2011, have these fears been realized?
Our Study: The fiscal effects of Act 10 have been well documented; the MacIver Institute estimated that Act 10 has saved taxpayers over $5 billion. What has not been adequately addressed is the impact of Act 10 on the education workforce in Wisconsin. Our study attempts to fill that void by conducting the most comprehensive examination of the effects of Act 10 to date.
We seek to answer the following questions:
1. What impact has Act 10 had on the number of students per teacher and the number of students per administrator?
2. Do we observe a different impact in different geographic locations – urban, suburban, or rural – with respect to number of students per teacher?
3. What impact has Act 10 had on school districts’ expenditures on teacher compensation? In particular, what is the impact on pay for regular certified teachers and gross pay for all teaching personnel?
4. What differences do we observe during the periods before and after Act 10 was enacted in the number of public school teachers and their characteristics such as years of experience, salary, fringe benefits, and makeup along race/ethnicity and degree earned?
We use two datasets in our analysis. Using teacher-level data from the Wisconsin Department of Public Instruction (DPI), we examine the relationship of Act 10’s implementation to teacher experience, salary, and fringe benefits. For the main analysis, we use school district level data from the U.S. Department of Education to estimate difference-in-differences models that compare teacher data in Wisconsin to all states that neighbor Wisconsin.
While it is certainly useful to simply compare pre- and post- Act 10 Wisconsin on measures such as student-teacher ratio, salaries, experience, etc., that approach is less helpful when the question turns to whether Act 10 may have caused changes in these measures. For that reason, it is important to compare how these outcomes changed in Wisconsin in comparison to other states. In other words, is there any way in which changes in Wisconsin’s education workforce may have been a result of national or regional trends, rather than Act 10? This “difference in differences” approach may give us better
1 Pocan, Mark. “Where have all the teachers gone?” November 3, 2015. Madison 365.

Wisconsin Institute for Law & Liberty
The Impact of Act 10 on Wisconsin’s Education Workforce June 2016
5
insight into whether any relative changes observed in the data are caused by Act 10, or whether they are simply the result of factors beyond Wisconsin. We examine the impact of Act 10 to student-teacher ratio and other staffing ratios as well as gross salary for teaching personnel.
Results: Based on our analysis, we are able to make the following conclusions regarding Act 10’s impact on Wisconsin’s education workforce:
1. Act 10 had no significant effect on the number of students per public school teacher. When compared to surrounding states, Act 10 is shown to not have impacted the student-teacher ratio in Wisconsin. In other words, our analysis suggests that changes in teacher-student ratios in Wisconsin did not differ significantly from the changes in neighboring states.
2. Act 10 did not increase the number of students per school administrator and school-district administrative support staff. In fact, district-level administrative support staff and school administrators have increased relative to students since Act 10. Act 10 had no statistically significant effect on school administrative support staff ratios.
3. We found little evidence of different impacts by Act 10 between urban, suburban, and rural school
districts on student-teacher ratios, student-district administrative support staff ratios, or student-administrative support staff ratios.
4. When compared to surrounding states, we did not find any significant effect by Act 10 on school
district spending on teacher personnel gross salaries (including compensation above base pay, such as bonuses). In other words, Act 10 does not seem to have caused a reduction in the amount of money spent to pay teaching personnel. We did find evidence that Act 10 reduced district expenditures on base salaries for certified teachers. However, we believe that gross salaries better reflects the new teaching marketplace post-Act 10, where districts are moving towards pay-for-performance, bonuses, and stipends.
5. There was little difference in overall teacher experience before and after Act 10. On average, teachers in Wisconsin have 0.76 year less teaching experience than prior to the implementation of Act 10. While this change was statistically significant, there is no evidence to indicate that such a small shift should have an impact on student achievement.
6. There was little change in the racial makeup of the teaching workforce before and after Act 10.
There has been a very small increase in the share of Hispanic teachers (0.3%) and a very small decrease in the share of white teachers (-0.3%)
7. Wisconsin’s teacher decline began before the implementation of Act 10 in June 2011. The number of fully licensed teachers declined by 2.2 percent during the four years leading up to Act 10. After Act 10 went into effect, the number declined by 0.1 percent during the next four years. This shows that the rate of the decline of teachers actually slowed after Act 10. In addition, the teacher decline has, roughly, followed the decline of student enrollment.

Wisconsin Institute for Law & Liberty
The Impact of Act 10 on Wisconsin’s Education Workforce June 2016
6
Conclusion: As it was designed to do, Act 10 has resulted in substantial cost savings to taxpayers. Our study shows that those savings to school districts had, at worst, a relatively modest impact on the teaching and educational workforce in Wisconsin.
The demographic make-up of the teaching workforce – measured by experience and race - has changed little since the implementation of Act 10.
Our main analysis shows that, when compared to other states, Act 10 did not have a significant effect on the number of students per teacher. It had a significant effect on the number of students per administrator showing that there are more administrators relative to students. It did not have a significant effect on school district spending on gross salaries for teaching personnel - although it may have shifted such spending away from base salaries. Changes to these measures were largely indistinguishable from those that have occurred in neighboring states without Act 10.
Opponents were loud and consistent in their arguments that Act 10 was a death knell for Wisconsin education. This study has shown that these claims were greatly exaggerated and failed to materialize.
II. Existing Research
Despite the significant public attention that Act 10 has received, few systematic studies have been conducted on its effects. The existing research can generally be classified into two areas: fiscal effects and teacher-level effects.
Fiscal Effects
The first step in understanding the impact of Act 10 on finances is to understand what the law actually does. Ford (2015)2 described in detail the additional powers provided to the school board by the law, and the ways in which school boards have exercised that additional power to control spending. Ford found that the chief effect of Act 10 has been to reduce the bargaining space between unions and school boards and to increase the importance of “highly-functional school boards” as a key to school improvement. He highlighted a number of qualitative examples of how school boards have utilized their additional powers including implementing merit pay, and providing bonuses for teachers willing to take on additional class responsibilities.
Perhaps the most well studied aspect of the law are Act 10’s fiscal impacts. Analysis by the MacIver Institute found that Act 10 has saved the state more than $5 billion dollars since enactment, and other research has added more depth to where these savings come from. Biggs and Richwine (2012)3 conducted a quantitative analysis of Wisconsin educator salaries and benefits shortly after the passage of Act 10. They found that, post-Act 10, salaries for state employees were approximately on par with the salaries of private sector workers with similar years of experience and occupations. Despite concerns about the effect of Act 10 on pension benefits, the authors found that public-sector pensions
2 Ford, M. 2015. Governing for Results on a Post-Collective Bargaining Wisconsin School Board. Journal of School Choice: 9: 529-550 3 Biggs, Andrew and Jason Richwine. 2012. The Impact of Act 10 on Public Sector Compensation in Wisconsin. American Enterprise Institute.

Wisconsin Institute for Law & Liberty
The Impact of Act 10 on Wisconsin’s Education Workforce June 2016
7
were still 4.5 times more valuable than the pensions of similarly-qualified private sector workers in Wisconsin.
While Act 10 still seems to allow for fairly lucrative pensions, it was intended to make them less costly for taxpayers. Costrell and Maloney (2013)4 examined the potential savings of the law in Milwaukee as part of a broader study on school finance reform in major cities throughout the country. Based on yearly trends observed since the passage of the Act, they predicted that by 2020 the amount of per-pupil expenditure devoted to teacher pensions and health care would decline by 45%. Relative to other similarly-sized districts with similar existing financial burdens throughout the country, Costrell and Maloney concluded that Act 10 has put the Milwaukee Public Schools on a - relatively - better path towards financial sustainability.
These findings were echoed in preliminary survey research of municipal officials. Ford (2016)5 conducted an opinion poll of municipal managers in small cities throughout southeast Wisconsin. In this working paper, he found moderately high levels of agreement with the statement, “ACT 10 has strengthened the financial health of my municipality.” Moderately high levels of support were also found for the statement, “Act 10 has led to cost-savings for my municipality that are UNRELATED to increased employee pension and health insurance contributions.” It should be noted that these are preliminary results, and are not focused specifically on teachers, for whom the results may vary to some extent.
Teacher-level Effects
The greatest concerns about Act 10 prior to its passage had to do with potential deleterious effects on the teaching workforce. Concerns involved a number of areas, including an increase in the hiring and firing of teachers and reductions in teacher morale. Despite the preeminence of these concerns during Act 10 debates, little systematic research has investigated these claims. The few exceptions are discussed below.
Yeado and Henken (2015)6 examined the impact of Act 10 on teacher age, mobility, education levels and the number of teachers employed through a look at DPI data on full-time equivalent teachers from the 2009-10 school year to the 2013-14 school year. This paper represented an important first step in research on the effect of Act 10 on teachers.
The authors found that the number of teachers in the Milwaukee metro region has declined by approximately 700 in the years following the implementation of the law, but they noted that the vast majority of this decline was attributable to a sizable drop in the teaching workforce in the Milwaukee Public Schools. They also found that there has been little change in the overall age or overall experience level of the teaching workforce. Yeado and Henken also examined whether teacher mobility changed markedly in the years since the passage of the law. They find that the vast majority of teachers remained in the same school district each year and little evidence that Act 10 has had an impact on the extent to which teachers changed schools.
4 Costrell, Robert and Larry Maloney. 2013. “The Big Squeeze: Retirement Costs and School District Budgets Milwaukee: Saved by Act 10…For Now.” Thomas Fordham Institute 5 Michael Ford. “The State of Wisconsin Communities with Under 10,000 Residents.” Working Paper. 6 Yeado, Joe and Rob Henken. 2015. “Taking Attendance: An Analysis of Greater Milwaukee’s Teaching Workforce.” Public Policy Forum.

Wisconsin Institute for Law & Liberty
The Impact of Act 10 on Wisconsin’s Education Workforce June 2016
8
Another study by Yeado (2016)7 looked into the extent of exits from the teaching profession in four Milwaukee-metro area counties. He observed a spike in teacher exits during the period following Act 10’s enactment, but was hesitant to link this change to Act 10 without any control groups, stating, “We cannot say that the sharp increase in teachers leaving prior to the 2013-14 school year was caused by the application of Act 10 provisions in these districts, but there is an unmistakable break in the trend line immediately following the legislation.” (p. 8). Other research on the effect of laws like Act 10 around the country has been conducted, but is not focused on Wisconsin.8
Summary
The body of existing research on Act 10, though small, varies in both depth and scope. This paper will expand on the current literature by examining the impact of Act 10 on both fiscal and non-fiscal outcomes. It addresses some of the shortcomings present in recent work. For starters, by employing a national data set from the National Center for Education Statistics, we are able to create a comparison group that consists of Wisconsin’s bordering states. This allows us to use a difference-in-differences approach and boosts our confidence that what we observe in these data is attributable to Act 10. This report arguably provides the most rigorous analysis on non-fiscal outcomes to date.
III. Methods, Data, and Results
We begin by analyzing DPI data on the characteristics of the teachers in Wisconsin before and after the implementation of Act 10. Unfortunately, the lack of a comparison group allows for limited inference that Act 10 caused these changes. While we account for the effects of a number of control variables, any observed differences before and after Act 10 could be due to other factors that we have not accounted for. Therefore, our main analysis estimates difference-in-differences models by comparing Wisconsin to surrounding states – Michigan, Minnesota, Iowa, and Illinois. Because we are able to make interstate comparisons, our empirical study is based on a natural experiment. This increases our confidence that what we observe is due to Act 10.
A. Descriptive comparisons of teachers pre- and post- Act 10
Number of teachers: A common claim by many critics of Act 10 is that it led to significantly fewer teachers in the workforce. We can examine this on the surface by looking at trends before and after Act 10’s enactment. Figure 1 reports the number of full-time equivalent licensed staff and number of teachers for every school year between SY2007-08 and SY2013-14. The period gives us four years before and four years after Act 10’s enactment in 2011. During the period before Act 10, the number of
7 Yeado, Joe. 2016. “Help Wanted: An Analysis of the Teacher Pipeline in Metro Milwaukee.” 8 Han (2016) tested the prediction of a two-period job model on the effects of unions on teacher outcomes such as turnover and salary. This analysis suggested that high levels of unionization increased the removal of poor teachers, and the retention of high quality teachers. Her analysis included a difference-in-differences model that examined the effect of changes to collective bargaining laws in four states on teacher turnover, including Wisconsin. However, this study was not focused exclusively on Wisconsin and did not include other outcomes that are of interest, many of which are examined in this study. We cannot generalize her conclusions to Act 10 itself.
Wisconsin Institute for Law & Liberty
The Impact of Act 10 on Wisconsin’s Education Workforce June 2016
9
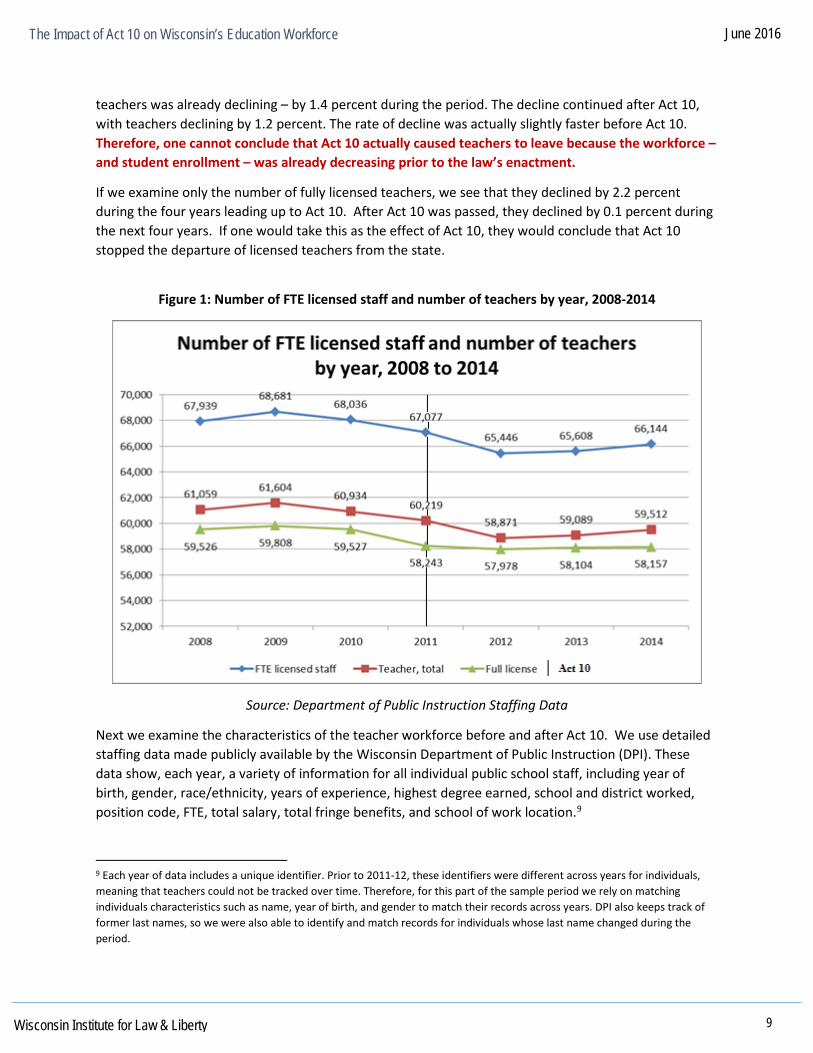
teachers was already declining – by 1.4 percent during the period. The decline continued after Act 10, with teachers declining by 1.2 percent. The rate of decline was actually slightly faster before Act 10. Therefore, one cannot conclude that Act 10 actually caused teachers to leave because the workforce – and student enrollment – was already decreasing prior to the law’s enactment.
If we examine only the number of fully licensed teachers, we see that they declined by 2.2 percent during the four years leading up to Act 10. After Act 10 was passed, they declined by 0.1 percent during the next four years. If one would take this as the effect of Act 10, they would conclude that Act 10 stopped the departure of licensed teachers from the state.
Figure 1: Number of FTE licensed staff and number of teachers by year, 2008-2014
Source: Department of Public Instruction Staffing Data
Next we examine the characteristics of the teacher workforce before and after Act 10. We use detailed staffing data made publicly available by the Wisconsin Department of Public Instruction (DPI). These data show, each year, a variety of information for all individual public school staff, including year of birth, gender, race/ethnicity, years of experience, highest degree earned, school and district worked, position code, FTE, total salary, total fringe benefits, and school of work location.9
9 Each year of data includes a unique identifier. Prior to 2011-12, these identifiers were different across years for individuals, meaning that teachers could not be tracked over time. Therefore, for this part of the sample period we rely on matching individuals characteristics such as name, year of birth, and gender to match their records across years. DPI also keeps track of former last names, so we were also able to identify and match records for individuals whose last name changed during the period.

Wisconsin Institute for Law & Liberty
The Impact of Act 10 on Wisconsin’s Education Workforce June 2016
10
We examine only full-time teachers during the period three years prior to Act 10 and three years after (or 2009-2014). We exclude subcontracted teachers and substitute teachers and keep teachers with full information on the variables of interest. We end up with 244,786 total teacher-by-year observations. We observe between about 37,500 and 44,000 teachers each year.10
Table 1 displays summary statistics for our sample of teachers. It presents means for the overall sample, pre-Act 10 sample, and post-Act 10 sample. The second-to-final column computes the difference between pre- and post-Act 10 periods. The final column indicates if the pre/post differences are statistically significantly different at the 95 percent confidence level. Significant differences are highlighted in grey.
We also estimated OLS models that includes an indicator for post-Act 10 years, controls for teacher and district characteristics, and district-level and year indicators. The results were similar to those in Table 1. They can be found in Appendix Table B.
Experience: The post-Act 10 mean for total experience was 0.76 years lower, on average, than the pre-Act 10 mean.
Table 1: Summary statistics for sample of Wisconsin Teachers, 2009-2014
Overall sample
(n=244,786) pre-Act 10
(n=127,677) post Act 10
(n=117,109)
diff (post-
pre)
T-test, significant
at 95% confidence
level? Total experience 14.55 14.91 14.15 -0.76 Yes Total Salary (adj for inflation) 56,074 57,076 54,981 -2,095 Yes Fringe benefits (adj for inflation) 26,201 28,870 23,291 -5,580 Yes Age 43.28 43.74 42.79 -0.95 Yes Asian 0.7% 0.7% 0.7% 0.0% No Black 2.1% 2.1% 2.0% -0.1% No Hispanic 1.5% 1.4% 1.7% 0.3% Yes White 95.3% 95.4% 95.1% -0.3% Yes Male 25.8% 25.8% 25.8% -0.1% No Female 74.2% 74.2% 74.2% 0.1% No Bachelors degree 46.1% 46.3% 45.9% -0.4% Yes Masters degree 53.1% 52.9% 53.3% 0.4% No Doctoral degree 0.2% 0.2% 0.2% 0.0% No Special education teacher 15.8% 15.7% 16.0% 0.3% Yes General education teacher 84.2% 84.3% 84.0% -0.3% Yes Source: Based on data from Wisconsin Department of Public Instruction Note: Age is estimated by subtracting an individual’s year of birth from the school year.
10 This reliance on complete data accounts for the smaller number of teachers in Table A relative to Figure 1.

Wisconsin Institute for Law & Liberty
The Impact of Act 10 on Wisconsin’s Education Workforce June 2016
11
Salary and Fringe Benefits: The average salary and fringe benefits were $2,095 and $5,580 lower, respectively, on average, than before Act 10.
Observing a decline in fringe benefits after Act 10 is not surprising because the law limited the ability of school districts to pick up employee contributions for pension and health benefits. In addition, districts were no longer obligated to enroll their employees in teacher-sponsored health plans. Therefore, districts could shop around for other plans, which allowed many districts to lower costs. It is possible that some districts provided different plans with the same level of benefits or different provisions, though that analysis is beyond the scope of this paper.
While the decline in teachers’ salaries may seem substantial, it is important to note two things. First, Wisconsin still ranks in the top half of states in teacher pay. Figure 2 displays teacher pay in Wisconsin relative to the other states. Note that every fifth state from the lowest paid state (South Dakota) to the highest paid state (New York) is included in this table to save space. Second, NCES data permits us to compare Wisconsin teacher salary decline relative to other states. Our main analysis enables a more sophisticated discussion about the impact of Act 10 on teacher salary.
Figure 2. Average Teacher Pay States, Lowest to Highest Pay (2014-15 school year)
Source: National Education Association
Note: Table represents the average salary for 2013-14 for every fifth state from the lowest paid state (South Dakota) to the highest paid state (New York). Data gathered form the Census Bureau’s fiscal survey.
Race: Another interesting note from the summary statistics is that there has been virtually no change in the racial makeup of Wisconsin’s teachers post Act-10. While there has been a very small increase in the number of Hispanic teachers (.3%) and a similarly small decrease in the number of white teachers (-.3%), these differences are negligible. Only the increase in Hispanic teachers reaches statistical significance. Figure 3 presents a pie chart of the composition of Wisconsin’s teaching workforce before and after Act 10. One can see that the overall percentages change in a very small way.

Wisconsin Institute for Law & Liberty
The Impact of Act 10 on Wisconsin’s Education Workforce June 2016
12
Figure 3. Racial Composition of the Teaching Workforce, Pre- and Post-Act 10
However, this approach of examining data from a single state has a shortcoming. There is no “untreated” group of teachers who are not subject to Act 10 that we can compare Wisconsin teachers to. It could be the case that observing something that significantly differs before and after Act 10 may actually be due to something other than Act 10 itself. Put another way, there could be national factors that are affecting Wisconsin’s teacher workforce that are masked in a single state analysis. Thus, anyone should exercise a degree of caution in attributing any observation solely to the impact from an intervention without having anything to compare the target group to.
To better account for this, our main analysis analyzes Act 10’s impact on variables such as student-teacher ratio, student-administrator ratio, salary, and fringe benefits, by utilizing data from the National Center for Education Statistics at the U.S. Department of Education for Wisconsin and bordering states of Illinois, Iowa, Michigan, and Minnesota. From the National Center for education statistics, we know that student-teacher ratios have been on the rise since 200811, and that teacher salaries have slightly declined once inflation is taken into account.12 This analysis allows us to determine whether Act 10 had any differential effect while accounting for these broader trends, i.e. did Act 10 either accelerate or slow these trends?
B. Main analysis: Comparisons with Neighboring States i. Model
The main analysis uses a more robust model to estimate Act 10 impact on variables such as student-teacher ratio, student-administrator ratio, and teacher compensation and district urbanicity.13 We make comparisons with neighboring states because, while simply looking at outcomes between pre-Act
11 National Center for Education Statistics, May 2016. "Teachers and Pupil/Teachers Ratio." http://nces.ed.gov/programs/coe/indicator_clr.asp 12 National Center for Education Statistics, May 2016. "Fast Facts." http://nces.ed.gov/fastfacts/display.asp?id=28 13 District urbanicity is based on definitions from the National Center for Education Statistics. Including independent charter schools as their own school districts, there are 50 urban districts in Wisconsin and 242 rural districts.

Wisconsin Institute for Law & Liberty
The Impact of Act 10 on Wisconsin’s Education Workforce June 2016
13
10 and post-Act 10 periods is informative, it may not account for important factors affecting the outcome. For example, a treatment state with unfavorable economic conditions might experience a more rapidly rising increase in pupil-to-teacher ratio than a control state with more favorable economic conditions.
With that in mind, we estimate a series of difference-in-differences with the following model:
[1] Yist=α + βWisis + θTit Act10 + δ(Wisis*Tit
Act10) + πXist + ψs + λi + ηt + εist
where Yist is the outcome for district i in state s during year t; Wisis is a binary indicator that equals 1 if the observation occurs in Wisconsin and 0 if in a control state; Tit
Act10 is an indicator that takes on 1 if the observation occurs post-Act 10 (i.e. during or after school year 2011-12) and 0 if before; Wisis*Tit
Act10 is an interaction term that takes on 1 if an observation occurs in Wisconsin post-Act 10 and 0 if otherwise; Xist represents a vector of district characteristics that include student enrollment characteristics and urbanicity; ψs, λi, and ηt are, respectively, state, district, and year indicators; and εist is a random error term. We study outcomes related to staffing and teacher compensation. Our control group consists of Wisconsin’s bordering states: Illinois, Iowa, Michigan, and Minnesota.14 As a robustness check, we estimate models that include each state individually as a control group – it may very well be the case that some states are not appropriate comparisons for Wisconsin. We also estimate models with and without controls.
This model accounts for permanent differences between Wisconsin and the control group as well as trends common to both Wisconsin and the control group. The coefficient of interest is δ and depicts the treatment effect: the observed impact of Act 10 on the outcome. To check for consistency in our estimates, we also estimate models that compare Wisconsin to each of these states individually as it’s plausible that some states are significantly different from Wisconsin so as to yield unreliable estimates. For inference, we use robust standard errors clustered at the district level throughout the analysis.
ii. Data
We use publicly available data from the National Center for Education Statistics in the U.S. Department of Education. The data used in this analysis are reported at the district level. Appendix A provides a glossary for the outcome variables analyzed.
We seek to answer the following questions:
1. What was Act 10’s impact on the following staffing outcomes:a. The ratio of the number of students for each full-time equivalent (FTE) teacherb. The ratio of the number of students for each district administrative support staff
memberc. The ratio of the number of students for each school administrator
14 We are aware of changes Michigan has made to its public sector union laws. In 2011, they passed several laws that made it illegal to collectively bargain over teacher evaluation and layoff policies. The Mackinac Center for Public Policy has raised concerned that up to 60% of school districts are still collectively bargaining over such topics. http://www.mackinac.org/19840 In addition, in 2012, Michigan passed “right-to-work,” which enables teachers, among other employees, to opt out of their public union. None of these reforms went nearly as far as Act 10, which significantly curtailed collective bargaining, only permitting discussions over base pay up to inflation. Nonetheless, we ran models without Michigan in the control group and the results were similar as the models with Michigan in the control group.

Wisconsin Institute for Law & Liberty
The Impact of Act 10 on Wisconsin’s Education Workforce June 2016
14
d. The ratio of the number of students for each school administrative support staff member
e. The ratio of the number of students for every staff member
2. What was Act 10’s impact on salaries and benefits for the following groups: a. All teaching personnel (including regular and part-time teachers, teacher aides,
homebound teachers, hospital-based teachers, and substitute teachers) b. Certified teachers only
3. Can we observe any differential impacts in staffing outcomes by Act 10 with respect to district
urbanicity? iii. Results
Students per teacher and administrator: We begin by examining the impact of Act 10 on the following staffing outcomes: the number of students for each full-time equivalent (FTE) teacher, the number of students for each district administrative support staff member, the number of students for each school administrator, the number of students for each school administrative support staff member, and the number of students for each staff member of any kind. Table 2 reports the results.15 The first panel includes estimates from our baseline difference-in-differences specification (equation [1]). It includes the first four right hand side terms in [1] and does not include any control variables. The comparison group includes Wisconsin’s four bordering states. The second panel reports results for models that include indicators for year and state. The third panel includes indicators for year, state, and districts. The fourth, most comprehensive, panel includes indicators for year, state, and district plus a set of district characteristics including percent of English language learner (ELL) students, percent of students with an individual education plan (IEP), percent of students enrolled in a free-reduced lunch (FRL) program, percent of students that are minority, an indicator for charter schools, and a set of indicators for whether a district is located in a city, a town, a rural area, or a suburb.
Despite widespread claims that Act 10 reduced the teaching workforce in such a way as to hurt students, we did not find evidence that Act 10 significantly changed the number of students for each teacher relative to neighboring states. The first column of Table 2 presents the main estimates for the impact of Act 10 on the pupil-to-teacher ratio. We find no statistically significant effect of Act 10 on the ratio of students to teachers relative to other states. The coefficient in the first panel is marginally significant and positive. When we include other control variables that account for trend and state- and district-specific factors, however, the estimate loses statistical significance and switches signs, suggesting that Act 10 actually reduced the pupil-to-teacher ratio.16 This means that we cannot rule out zero or a positive impact estimate.
15 We also estimated models that estimated the impact of Act 10 on outcomes one year in the future, two years in the future, and three years in the future. Overall, most of the point estimates retain the same sign, though nearly all become statistically insignificant. This reflects the tradeoff with statistical power from these models – lagging the explanatory variables causes one year’s worth of data to be dropped. 16 Wisconsin Department of Public Instruction, May 2016, "Public Schools at a Glance." https://dpi.wi.gov/sites/default/files/imce/eis/pdf/schools_at_a_glance.pdf

Wisconsin Institute for Law & Liberty
The Impact of Act 10 on Wisconsin’s Education Workforce June 2016
15
Table 2: Results from difference-in-differences models that estimate the impact of Act 10 on staffing outcomes (1) (2) (3) (4) (5)
VARIABLES Students to
teacher ratio
Students to district
administrative support staff
ratio
Students to school
administrators ratio
Students to school
administrative support staff
ratio
Students to total staff
ratio 1. Baseline results (no control variables) Act10 x Wisconsin 1.81* 64.34 184.14*** 12.88** 2.90*** standard error (0.98) (57.23) (43.69) (5.30) (0.67) Observations 17,949 10,122 15,463 12,480 18,420 R-squared 0.00 0.01 0.00 0.01 0.00 2. State and year fixed effects Act10 x Wisconsin -1.50 -133.86** -231.05*** -10.22 -2.70*** standard error (1.03) (63.34) (53.97) (21.06) (0.68) Observations 17,949 10,122 15,463 12,480 18,420 R-squared 0.00 0.06 0.01 0.01 0.01 3. State, year, and district fixed effects Act10 x Wisconsin -1.73 -119.24** -232.53*** -7.40 -2.73*** standard error (1.35) (57.52) (69.20) (24.48) (0.76) Observations 17,949 10,122 15,463 12,480 18,420 R-squared 0.21 0.53 0.29 0.64 0.19 *** p<0.01, ** p<0.05, * p<0.1 Notes: Standard errors in parentheses account for clustering on state. Sample period is SY2008-09 to SY2013-14. Each estimate reported is from a difference-in-differences model's coefficient on an indicator for Wisconsin interacted with an indicator for post-Act 10 years. Models that control for district factors include variables for percent of English language learner students, percent of students with an IEP, percent of students enrolled in FRL, percent of students that are minority, and a set of indicators for whether a district is located in a city, a town, a rural area, or a suburb.
Figure 4 compares student-teacher ratios to Wisconsin’s neighbors over the past eight years. The figure supports the evidence from the difference-in-differences that Wisconsin has not undergone extreme changes relative to neighboring states.

Wisconsin Institute for Law & Liberty
The Impact of Act 10 on Wisconsin’s Education Workforce June 2016
16
Figure 4. Student-Teacher Ratios by State, 2007-08 to 2013-14
Source: Data from the National Center for Education Statistics
Some may wonder how to reconcile the decline in teachers with relatively little change in student-teacher ratios. Figure 5 below shows that the decline in Wisconsin teachers has roughly tracked with declines in enrollment, offering at least a partial explanation for this result.
Figure 5. Student Enrollment and Number of FTE Teachers in Wisconsin, 2008-09-2014-15
Source: Data from the WI Department of Public Instruction
We find some evidence that Act 10 reduced the number of students for each district administrative support staff member (including secretarial and other clerical staff) relative to neighboring states. The point estimates in our baseline models are not statistically significant. When we include indicators for year, states, and districts, coefficients become statistically significant, indicating that the relative number of students to administrative support staff member declined by roughly 120 students.

Wisconsin Institute for Law & Liberty
The Impact of Act 10 on Wisconsin’s Education Workforce June 2016
17
There is evidence that Act 10 reduced the ratio of students for each school administrator relative to neighboring states. Estimates in column 3 are negative and statistically significant, implying that Act 10 reduced the number of students to each school administrator by about 230 students. This is suggestive that growth in administrators outpaced growth in the student population.
The final column reports estimates for the impact of Act 10 on the number of students to each staff member (this includes all FTE teachers and staff positions). Our baseline estimates indicate that Act 10 reduced the number of students to each staff member by about three students for each staff member.17 This is a small impact.
Salaries and Benefits: We next examine the impact of Act 10 on district expenditures for compensation in terms of benefits and salaries for teachers in Wisconsin relative to other states. Benefits and salaries are reported in aggregate for each district in the NCES data. They are not reported on an individual level or as an overall average. Therefore, to facilitate comparability, we converted all district figures into per-pupil terms. Table Z reports impact estimates of Act 10 on these variables.
As before, we report estimates for a baseline model and models with different sets of control variables. Our estimates suggest that Act 10 reduced per-pupil spending on fringe benefits for teaching personnel by roughly 400 to 600 dollars.
We found evidence that Act 10 reduced district spending on base salaries for regular teachers relative to neighboring states. Column 2 reports impact estimates on per-student expenditures on base salaries for regular certified teacher salaries. Overall, estimates indicate that Act 10 reduced expenditures per student for base salaries paid to certified teachers of regular instructional programs by roughly 150 dollars.
But as an earlier WILL report indicated, some superintendents in Wisconsin have used Act 10 to pay their teachers based on merit (Szafir, Flanders, & Hudson, 2016). It may be the case that Act 10 had a significant impact on increasing pay for performance or changed districts’ reliance on or use of salary schedules based on years worked and credentials. The prior analysis does not take into account alternative methods for compensating teachers. Therefore, we conducted additional analysis using gross salary estimates that include compensation above base salaries (i.e. bonuses and merit pay). We did not find evidence that Act 10 changed spending on gross salaries for all teacher personnel relative to neighboring states.
The last column in Table 3 below looks at expenditures on gross salaries for all teacher personnel, including regular and part-time teachers, teacher aides, homebound teachers, hospital-based teachers, substitute teachers and teachers on sabbatical leave. Most of the estimates are positive, indicating that Act 10 induced districts to increase spending relative to districts in other states on gross salaries. None of the estimates, however, are statistically significant, indicating that these data do not provide enough information to detect a significant impact by Act 10 on districts’ expenditures on gross salaries for teacher personnel.
17 Estimates in panels 4 and 6 of Table A.1 are positive and significant, implying that Act 10 increased the ratio.by 0.16 to 0.41. All point estimates are quite small.

Wisconsin Institute for Law & Liberty
The Impact of Act 10 on Wisconsin’s Education Workforce June 2016
18
Table 3: Results from difference-in-differences models that estimate the impact of Act 10 on personnel compensation (1) (2) (3)
VARIABLES
District spending per pupil on benefits for teaching personnel
District spending per pupil on base salaries for regular certified
teachers
District spending per pupil on gross salaries
for teaching personnel
1. Baseline results (no control variables) Act10 x Wisconsin 210.26 21.27 -640.80 standard error (203.33) (16.40) (756.80) Observations 14,126 9,480 14,110 R-squared 0.00 0.06 0.00 2. State and year fixed effects Act10 x Wisconsin -548.30*** -132.14*** 660.99 standard error (208.36) (19.66) (777.76) Observations 14,126 9,480 14,110 R-squared 0.00 0.06 0.00 3. State, year, and district fixed effects Act10 x Wisconsin -426.25** -146.50*** 795.47 standard error (215.07) (19.99) (847.83) Observations 14,126 9,480 14,110 R-squared 0.38 0.86 0.31 4. State, year, and district fixed effects plus district characteristics Act10 x Wisconsin -634.82*** -141.10*** -74.16 standard error (88.64) (20.07) (334.74) Observations 13,930 9,327 13,914 R-squared 0.38 0.87 0.32 *** p<0.01, ** p<0.05, * p<0.1 Notes: Standard errors in parentheses account for clustering on state. Sample period is SY2008-09 to SY2013-14. Each estimate reported is from a difference-in-differences model's coefficient on an indicator for Wisconsin interacted with an indicator for post-Act 10 years. Models that control for district factors include variables for percent of English language learner students, percent of students with an IEP, percent of students enrolled in FRL, percent of students that are minority, and a set of indicators for whether a district is located in a city, a town, a rural area, or a suburb.
Impact on urban, suburban, and rural school districts: Next, we run analyses to detect if Act 10 had differential effects on school districts with respect to urbanicity. There are anecdotes that Act 10 had particularly strong effects on teacher employment in Milwaukee18 and other urban districts. To address this question, we estimate fully-specified difference-in-differences models by subsetting the data to include urban districts only, suburban districts only, and rural districts only. This allows us to evaluate the impact of Act 10 in urban districts relative to urban districts in states around Wisconsin.
Table 4 reports the estimates for the same outcomes as in Table 2.
18 Doro, Paul M. 2015. “Will Teachers Desert Wisconsin?” Urban Milwaukee

Wisconsin Institute for Law & Liberty
The Impact of Act 10 on Wisconsin’s Education Workforce June 2016
19
Table 4: Results from difference-in-differences models that estimate the impact of Act 10 on staffing outcomes, districts grouped by urbanicity type (1) (2) (3) (4) (5)
VARIABLES
Students to FTE teacher
ratio
Students to district
administrative support staff
ratio
Students to school
administrators ratio
Students to school
administrative support staff
ratio
Students to total
staff ratio 1. Urban school districts only Act10 x Wisconsin 1.02* -224.97 -851.16** 33.50 0.28 standard error (0.53) (217.81) (412.26) (43.00) (0.25) Observations 1,887 775 1,491 1,531 1,911 R-squared 0.45 0.49 0.23 0.86 0.74 2. Suburban school districts only Act10 x Wisconsin -5.68 -91.68 -335.01* -82.90 -4.88** standard error (4.57) (220.78) (185.23) (129.69) (2.10) Observations 4,553 2,054 3,964 2,737 4,723 R-squared 0.21 0.61 0.37 0.59 0.18 3. Rural school districts only Act10 x Wisconsin -0.63 -162.06 -173.08 16.74 -3.35** standard error (0.82) (124.78) (107.63) (12.83) (1.50) Observations 4,967 3,155 4,422 3,720 5,161 R-squared 0.27 0.34 0.23 0.67 0.19 *** p<0.01, ** p<0.05, * p<0.1 Notes: Standard errors in parentheses account for clustering on state. Sample period is SY2008-09 to SY2013-14. Each estimate reported is from a difference-in-differences model's coefficient on an indicator for Wisconsin interacted with an indicator for post-Act 10 years. Models include year, state, and district indicators plus district factors that include variables for percent of English language learner students, percent of students with an IEP, percent of students enrolled in FRL, and percent of students that are minority. Comparison states include Illinois, Iowa, Michigan, and Minnesota.
We found little evidence of differential impacts by Act 10 between urban, suburban, and rural school districts on pupils-to-district administrative support staff ratios, or pupils-to-school administrative support staff ratios relative to similar urban, suburban, and rural districts in neighboring states. Panels 1-3 report results for urban school districts, suburban school districts, and rural school districts, respectively. The point estimates in columns 1 and 2 are noisy, suggesting that we do not have enough data to detect any significant differences (that is, we cannot rule out zero impact or impacts in the opposite direction of the estimates). We find a statistically significant increase in the student teacher ratio in urban areas, but this is at the lowest level of statistical significance generally accepted in scientific research, and the actual effect (an increase of 1 student) is substantively small.
We found evidence that the number of students for each school administrator in urban districts decreased at a faster rate relative to suburban and rural school districts relative to neighboring states. We also found evidence that the number of students to each staff member declined faster in suburban districts than rural and urban districts. In column 3, for urban and suburban school districts,

Wisconsin Institute for Law & Liberty
The Impact of Act 10 on Wisconsin’s Education Workforce June 2016
20
Act 10 reduced the number of students for each school administrator by about 850 students (p<0.05) and 335 students (p<0.1), respectively. The impact estimate on rural school districts is not significant and much smaller in size. The estimate suggests that Act 10 reduced the number of students per administrator by about 135, though we cannot rule out zero or a positive number. These patterns could suggest a greater increase in the number of school administrators in urban school districts relative to suburban and rural school districts, or they could also imply a greater decline in student enrollment in urban districts relative to suburban and rural school districts. It may be the case that urban districts are more susceptible to “administrative bloat” than districts in suburban or rural areas.
The point estimates in column 4 are not significant and vary in sign. Therefore, we cannot rule out zero impact on student to administrative support staff ratio, relative to similar districts in other states.
Column 5 examines the impact of Act 10 on the number of students for each staff member. The estimate in the first panel is quite small and not statistically insignificant – we do not detect a significant effect on urban districts, though we detect stronger effects on suburban and rural districts. The estimates in panels 2 and 3 are negative and significant. They suggest that Act 10 had a slightly stronger impact in suburban school districts than rural districts. That is, Act 10 reduced the number of students for each staff member in suburban districts by about five students, while it reduced the number of students in rural districts for each staff member by three. These estimates could be indicative of a greater increase in staff members in suburban school districts, a decline in student enrollment, or a combination of both.
IV. Conclusions
Opponents were loud and consistent in their arguments that the savings resulted from Act 10 would be a death knell proposal for Wisconsin education and its workforce. This study has shown that forecasts of the destruction of Wisconsin’s teacher workforce were greatly exaggerated. Many of the changes that have occurred in Wisconsin in recent years are indistinguishable from those that have occurred in neighboring states without Act 10, and even the instances where there were significant impacts have been relatively small.
Wisconsin’s public education system remains competitive nationwide by many measures. Wisconsin’s class of 2014 ranked second nationally in ACT test scores.19 Wisconsin’s graduation rate of 88.6% is ranked third in the nation.20
While this study adds to our limited knowledge about the non-fiscal impacts of Act 10 to date, a few directions for future research on outcomes not covered in our analysis present themselves. First, Act 10 may have an impact on the overall mix of teachers’ assignments. Education reformers commonly cite the shortage of STEM teachers to make the case for market-oriented teacher compensation. Did Act 10 change the flows of STEM teachers across schools? Second, future analysis can be conducted on teacher
19 Richards, Erin, Milwaukee Journal Sentinel, August 26, 2015, "Wisconsin ACT scores hold steady", http://www.jsonline.com/news/education/wisconsin-act-scores-hold-steady-at-no-2-for-class-of-2015-b99564647z1-322972401.html 20 Wisconsin Department of Public Instruction, October 2015, "Wisconsin Graduation Tops Nation," http://dpi.wi.gov/news/releases/2015/wisconsin-graduation-rate-among-tops-nation

Wisconsin Institute for Law & Liberty
The Impact of Act 10 on Wisconsin’s Education Workforce June 2016
21
entry, exit, and mobility. This was beyond the scope of this report. Finally, there are some school districts that implemented Act 10 more slowly than others. To our knowledge, no comprehensive data base exists at the school district level on Act 10 implementation. If those data can be gathered, a far richer picture of Act 10’s effect may be painted.

Wisconsin Institute for Law & Liberty
The Impact of Act 10 on Wisconsin’s Education Workforce June 2016
22
Appendix A: Glossary for data from the National Center for Education Statistics Staffing Data
FTE Teachers
This is the Full Time Equivalent count of teachers as reported by the school district. This count is not the same as the total of teachers from individual schools. This count includes teachers not assigned to specific schools.
District administrative support staff
The count of Staff members who provide direct support to LEA administrators, including secretarial and other clerical staff.
School Administrators
This is the Full Time Equivalent (FTE) count of principals and other staff concerned with directing and managing the operation of a particular school as reported by the school district.
School Administrative Support Staff
The count of persons whose activities are concerned with support of the teaching and administrative duties of the office of the principal or department chairpersons, including clerical staff and secretaries.
Total Staff
This value is the sum of all FTE Teacher and Staff positions.
Employee compensation
Employee Benefits - Teaching personnel
Expenditures for fringe benefits such as group insurance, social security and retirement contributions, tuition reimbursement, unemployment and workers compensation. Benefits are expenditures made in addition to gross salary and not paid directly to employees. These data are taken from the CCD LEA Finance (F-33) survey.
Salary - Regular certified teachers
Expenditures for base salaries paid to certified teachers of regular instructional programs. These data are taken from the CCD LEA Finance (F-33) survey.
Salary - Teacher personnel
Expenditures for gross salaries paid to regular and part-time teachers, teacher aides, homebound teachers, hospital-based teachers, substitute teachers and teachers on sabbatical leave. These data are taken from the CCD LEA Finance (F-33) survey.
Urban-centric Locale The urban-centric locale code (NCES assigned, based on 2000 Census geography) is based on the

Wisconsin Institute for Law & Liberty
The Impact of Act 10 on Wisconsin’s Education Workforce June 2016
23
agency's physical address (or mailing address if the physical address is not reported) and is a measure of an agency's location relative to populous areas.

Wisconsin Institute for Law & Liberty
The Impact of Act 10 on Wisconsin’s Education Workforce June 2016
24
Appendix B: Econometric Regressions Using DPI Data
Table D. Effect of Act 10 on Teachers, Wisconsin Only Analysis
Table D: OLS Regression results with fixed effects Model (1) (2) (3) (4) VARIABLES Age Act 10 -0.951*** -0.868*** -1.202*** -1.713*** standard error (0.178) (0.171) (0.189) (0.209) R-squared 0.002 0.086 0.086 0.110 total experience Act 10 -0.759*** -0.625*** -0.672*** -1.190*** standard error (0.237) (0.208) (0.227) (0.273) R-squared 0.002 0.130 0.130 0.161 salary Act 10 -2,095*** -2,312*** -3,480*** -4,486*** standard error (613.1) (575.0) (360.2) (707.1) R-squared 0.007 0.383 0.384 0.460 fringe benefits Act 10 -5,580*** -6,413*** -7,572*** -5,402*** standard error (272.7) (292.3) (807.7) (667.7) R-squared 0.081 0.224 0.226 0.299 Observations 244,786 244,786 244,786 244,786 Controls included NO YES YES YES year indicators NO NO YES YES district indicators NO NO NO YES Robust standard errors in parentheses; *** p<0.01, ** p<0.05, * p<0.1 Notes: dollars are adjusted for inflation using CPI-U index from the Bureau of Labor Statistics; sample includes full-time teachers observed over period 2009-2014; control variables include teacher- and district-specific factors.


![Cranberries of Wisconsin1].pdf · Cranberries of Wisconsin Analyzing the Economic Impact university of wisconsin whitewater Fiscal and Economic Research Center](https://static.fdocuments.in/doc/165x107/5ab180eb7f8b9ad9788c5f4a/cranberries-of-1pdfcranberries-of-wisconsin-analyzing-the-economic-impact-university.jpg)