The Impact Of Academic Vocabulary Instruction On Reading ...
146
University of Central Florida University of Central Florida STARS STARS Electronic Theses and Dissertations, 2004-2019 2009 The Impact Of Academic Vocabulary Instruction On Reading The Impact Of Academic Vocabulary Instruction On Reading Performance Of Sophomore Students On The Florida Performance Of Sophomore Students On The Florida Comprehensive Assessme Comprehensive Assessme Margaret McMillen University of Central Florida Part of the Educational Leadership Commons Find similar works at: https://stars.library.ucf.edu/etd University of Central Florida Libraries http://library.ucf.edu This Doctoral Dissertation (Open Access) is brought to you for free and open access by STARS. It has been accepted for inclusion in Electronic Theses and Dissertations, 2004-2019 by an authorized administrator of STARS. For more information, please contact [email protected]. STARS Citation STARS Citation McMillen, Margaret, "The Impact Of Academic Vocabulary Instruction On Reading Performance Of Sophomore Students On The Florida Comprehensive Assessme" (2009). Electronic Theses and Dissertations, 2004-2019. 3882. https://stars.library.ucf.edu/etd/3882
Transcript of The Impact Of Academic Vocabulary Instruction On Reading ...

University of Central Florida University of Central Florida
STARS STARS
Electronic Theses and Dissertations, 2004-2019
2009
The Impact Of Academic Vocabulary Instruction On Reading The Impact Of Academic Vocabulary Instruction On Reading
Performance Of Sophomore Students On The Florida Performance Of Sophomore Students On The Florida
Comprehensive Assessme Comprehensive Assessme
Margaret McMillen University of Central Florida
Part of the Educational Leadership Commons
Find similar works at: https://stars.library.ucf.edu/etd
University of Central Florida Libraries http://library.ucf.edu
This Doctoral Dissertation (Open Access) is brought to you for free and open access by STARS. It has been accepted
for inclusion in Electronic Theses and Dissertations, 2004-2019 by an authorized administrator of STARS. For more
information, please contact [email protected].
STARS Citation STARS Citation McMillen, Margaret, "The Impact Of Academic Vocabulary Instruction On Reading Performance Of Sophomore Students On The Florida Comprehensive Assessme" (2009). Electronic Theses and Dissertations, 2004-2019. 3882. https://stars.library.ucf.edu/etd/3882

THE IMPACT OF ACADEMIC VOCABULARY INSTRUCTION ON READING PERFORMANCE OF SOPHOMORE STUDENTS ON
THE FLORIDA COMPREHENSIVE ASSESSMENT TEST FROM 2008 AND 2009
by
MARGARET McMILLEN B.A. University of Florida, 1971
M.Ed. University of Central Florida, 1974
A dissertation submitted in partial fulfillment of the requirements for the degree of Doctor of Education
in the Department of Educational Research, Technology and Leadership in the College of Education
at the University of Central Florida Orlando, Florida
Fall Term 2009
Major Professor: Rosemarye Taylor

ii
© 2009 Margaret McMillen

iii
ABSTRACT
This study investigated the change in sophomore reading scores on the
Florida Comprehensive Assessment Test after the implementation of an
academic vocabulary program and the change in teacher knowledge and
professional practice after a program of staff development in academic
vocabulary. The purpose was to determine if the impact of the professional
development on student reading performance.
The study analyzed student data from 2008 and 2009 gathered from the
Florida Department of Education, and teacher data collected from a survey used
as a pretest/posttest. Variables used in the analysis of student data included
demographic subgroups of white, African-American, Hispanic and students with
disabilities, English language learners, and economically disadvantaged
students. Teacher variables used were years of teaching experience and
curriculum area.
Both an ANCOVA and a multiple logistical regression were used to
analyze change in student reading performance. Student reading score
performance dropped for subgroups and overall. Several intervening variables
could explain this downward change: budget cuts resulting a change in
instructional day from six to seven-period day with loss of instructional time,

iv
reduction in number of teachers, increase in student population, and change in
start time for school day (from 7:15 a.m. to 2:30 p.m. to 9:30 a.m. to 4 p.m.).
An ANOVA and independent t-test were used to analyze teacher
pretest/posttest data. The data indicated a positive change in teacher knowledge
and instructional practice, though not statistically significant.
It should not be concluded from the reading scores that the program of
academic vocabulary was not successful, but rather that vocabulary instruction is
only one of the essential components of any plan to improve secondary student
reading performance.
Further research should be conducted to replicate this study during a time
period without intervening variables experienced during the span of this study.
Additionally, students should be matched to their teachers to examine the
relationship between individual teacher and student performance. This study
should be replicated in a high school with different demographics and different
level of student achievement.

v
ACKNOWLEDGMENTS
Several individuals have been especially helpful in the completion of this
research. Dr. Rosemarye Taylor, Chair of my dissertation committee, was a
constant source of help and encouragement. Her enthusiasm for the project and
my efforts are greatly appreciated.
In addition to Dr. Taylor’s support, the time and support of my committee
is appreciated as well. The members are Dr. Jeffrey Kaplan, Dr. Janet McGee,
and Dr. George Pawlas. Additionally, many thanks go to Elayne Reiss for her
statistical guidance.
During my career, I have learned so much from my students and
colleagues. They provided the impetus for me to continue learning. My friends,
faculty, study group, and family provided encouragement and support
throughout my journey, and I am grateful to them for their confidence in me.
Lastly, my mom and my children, Betsy and Brian, have been my biggest
cheerleaders. This degree would not have been attempted without their love and
support.

vi
TABLE OF CONTENTS
LIST OF TABLES ............................................................................................................. xi
CHAPTER ONE: INTRODUCTION ............................................................................ 1
Literature Review ......................................................................................................... 2
Vocabulary Instruction................................................................................................ 2
Professional Development .......................................................................................... 6
Statement of the Problem ............................................................................................ 8
Purpose of the Study ................................................................................................... 8
Significance of the Study ............................................................................................. 9
Research Questions ...................................................................................................... 9
Methodology .............................................................................................................. 10
Population ................................................................................................................. 10
Procedures ................................................................................................................. 11
Data Collection ......................................................................................................... 15
Instrumentation ......................................................................................................... 16
Delimitations of the Study ........................................................................................ 17
Limitations of the Study ............................................................................................ 18
Definitions of Terms .................................................................................................. 18
Summary ..................................................................................................................... 20
CHAPTER TWO: REVIEW OF LITERATURE ......................................................... 22

vii
Introduction ................................................................................................................ 22
Instructional Leadership ........................................................................................... 22
Vocabulary Instruction .............................................................................................. 26
English Language Learners ...................................................................................... 37
Professional Development ........................................................................................ 39
Summary ..................................................................................................................... 41
CHAPTER THREE: METHODOLOGY ..................................................................... 42
Introduction ................................................................................................................ 42
Research Questions .................................................................................................... 42
Population ................................................................................................................... 43
Professional Development Treatment and Procedures ........................................ 44
Instrumentation .......................................................................................................... 49
Data Collection ........................................................................................................... 50
Summary ..................................................................................................................... 52
CHAPTER FOUR: ANALYSIS OF DATA ................................................................. 53
Introduction ................................................................................................................ 53
Research Question One ............................................................................................. 54
Research Question Two ............................................................................................ 60
Research Question Three .......................................................................................... 78
Research Question Four ............................................................................................ 87
Summary ..................................................................................................................... 88

viii
CHAPTER FIVE: SUMMARY, CONCLUSIONS, AND RECOMMENDATIONS 89
Summary and Discussion of Findings .................................................................... 90
Conclusions ................................................................................................................. 94
Recommendations for Further Research ................................................................ 99
Summary ................................................................................................................... 101
APPENDIX A: TEACHER PERCEPTIONS OF VOCABULARY INSTRUCTION
......................................................................................................................................... 102
APPENDIX B: ACADEMIC VOCABULARY TERMS ........................................... 104
Foreign Language Academic Vocabulary Terms ................................................ 105
Spanish I.................................................................................................................. 105
Spanish II ................................................................................................................ 105
Spanish III ............................................................................................................... 106
Spanish IV ............................................................................................................... 106
French I ................................................................................................................... 106
French III & IV ....................................................................................................... 107
Language Arts Academic Vocabulary Terms ...................................................... 107
English I .................................................................................................................. 107
English II ................................................................................................................. 108
English II Gifted ..................................................................................................... 109
English III ............................................................................................................... 109
English IV ............................................................................................................... 110
AP Literature & Composition ................................................................................. 110

ix
Journalism ............................................................................................................... 111
Reading ................................................................................................................... 112
Mathematics Academic Vocabulary Terms ......................................................... 113
Algebra I ................................................................................................................. 113
Geometry................................................................................................................. 114
Algebra II ................................................................................................................ 114
Analytic Geometry .................................................................................................. 115
Trigonometry .......................................................................................................... 116
Pre-Calculus ............................................................................................................ 116
Statistics .................................................................................................................. 117
AP Calculus AB ...................................................................................................... 117
AP Calculus BC ...................................................................................................... 118
Science Academic Vocabulary Terms ................................................................... 119
Anatomy and Physiology ........................................................................................ 119
Physics Honors........................................................................................................ 119
AP Physics AB ........................................................................................................ 120
Physics C ................................................................................................................. 121
AP Environmental Science ..................................................................................... 122
Social Studies Academic Vocabulary Terms ........................................................ 122
American History .................................................................................................... 122
World History ......................................................................................................... 123
APPENDIX C: INSTITUTIONAL REVIEW BOARD ............................................. 125

x
APPENDIX D: PERMISSION TO USE DATA ........................................................ 127
LIST OF REFERENCES ............................................................................................... 129

xi
LIST OF TABLES
Table 1 Demographic Variables by Academic Year for 10th Grade FCAT
Reading Scale Scores ...................................................................................................... 55
Table 2 Descriptive Statistics for 10th Grade FCAT Reading Scale Scores .......... 56
Table 3 Analysis of Covariance for 10th Grade Mean Scale Score Analysis ........ 59
Table 4 Estimated Marginal Means for 10th Grade Mean Scale Score Analysis 60
Table 5 Learning Gains by Demographic Type for 2007-2008 and 2008-2009 10th
Grade Cohorts ................................................................................................................ 63
Table 6 Summary Information for Logistic Regression Models............................. 65
Table 7 Logistic Regression Coefficients and Significance Tests ........................... 69
Table 8 Analysis of Covariance for 10th Grade Mean Scale Score Analysis -
Economically Disadvantaged ....................................................................................... 71
Table 9 Estimated Marginal Means for 10th Grade Mean Scale Score Analysis -
Economically Disadvantaged ....................................................................................... 71
Table 10 Analysis of Covariance for 10th Grade Mean Scale Score Analysis -
Students with Disabilities ............................................................................................. 72
Table 11 Estimated Marginal Means for 10th Grade Mean Scale Score Analysis -
Students with Disabilities ............................................................................................. 73

xii
Table 12 Analysis of Covariance for 10th Grade Mean Scale Score Analysis –
English Language Learners .......................................................................................... 74
Table 13 Estimated Marginal Means for 10th Grade Mean Scale Score Analysis –
English Language Learners (ELL) ............................................................................... 74
Table 14 Analysis of Covariance for 10th Grade Mean Scale Score Analysis –
African-American Students .......................................................................................... 75
Table 15 Estimated Marginal Means for 10th Grade Mean Scale Score Analysis –
African-American Students .......................................................................................... 76
Table 16 Analysis of Covariance for 10th Grade Mean Scale Score Analysis –
Hispanic Students .......................................................................................................... 77
Table 17 Estimated Marginal Means for 10th Grade Mean Scale Score Analysis –
Hispanic Students .......................................................................................................... 77
Table 18 Factor Loading for Academic Vocabulary Survey Scale ......................... 79
Table 19 Teacher Demographics - Gender ................................................................ 80
Table 20 Teacher Demographics - Ethnicity .............................................................. 80
Table 22 Teacher Demographics – Years of Experience .......................................... 81
Table 23 Teacher Demographics – Highest Degree Earned .................................... 81
Table 24 Descriptive Statistics for Time x Curriculum Analysis ........................... 83
Table 25 Analysis of Variance for Time x Curriculum Analysis ............................ 84
Table 26 Descriptive Statistics for Time x Experience Analysis ............................. 85
Table 27 Analysis of Variance for Time x Experience Analysis ............................. 86

1
CHAPTER ONE: INTRODUCTION
In the era of high-stakes testing and accountability, improving student
achievement for all learners is a focus for educators. Effective school leadership
is documented as having a significant impact on student learning. Marzano,
Waters, & McNulty, (2005), conducted a meta-analysis that reviewed 30 years of
research and found a correlation of .25 between principal leadership and student
achievement. Improving student achievement in reading as measured by the
Florida Comprehensive Assessment Test (FCAT) has been a challenge since the
inception of this assessment in 1998. By the time a student reaches high school,
most students are able to recognize words and decode text. The bigger challenge
is the comprehension of text that becomes increasingly more complex in high
school as the gap in background knowledge widens (Marzano, 2004).
Commercial reading programs asserting research-based results are readily
available for schools to purchase, but they vary in price and success.
Additionally, in light the school funding crises, spending money to
purchase a program may not be prudent from either a financial or educational
viewpoint when a method exists that is both relatively free and effective.
Improvement of student vocabulary within academic disciplines is an area of
study that shows promise not only for reading improvement, but also for
mastery of content area knowledge.

2
In his work on school effectiveness, Marzano (2003) identified “a
guaranteed and viable curriculum” as a critical factor in student achievement
(p. 22). In addition to the Sunshine State Standards written by the Florida
Department of Education (FLDOE) and benchmarks established by the local
school district, the development and implementation of an academic vocabulary
program could provide a guaranteed curriculum at the school level. These
guaranteed terms that students explain and describe more than define, provide
students with academic language. Much of the theoretical basis and
instructional design for academic vocabulary is the work of Marzano and
Pickering (2005).
Literature Review
Vocabulary Instruction
Kenny (2004) found that student vocabularies expanded through the use
of recognition exercises more than when students used paper and pencil practice.
Lesley Marwood’s Classroom Performance System, as cited in Kenny, enhanced
group performance and improved educational achievement in vocabulary using
the prescribed vocabulary recognition strategies (Kenny).
Direct vocabulary instruction has a strong impact on student achievement.
Marzano (2004) found that students who had no vocabulary instruction scored

3
lower than those who had direct vocabulary instruction. Students with no
instruction scored at the 50th percentile, but students with instruction scored at
the 62nd percentile (effect size = .32). The direct method described involved
students learning 10 to 12 new words a week from a high-frequency list. When
students received vocabulary instruction on specific words essential to the
content, however, their scores increased by 33 percentile points. Clearly, “direct
vocabulary instruction has an impressive track record of improving students’
background knowledge and the comprehension of academic content “(p. 69).
Silverman (2005) knew that vocabulary is an important prerequisite to
literacy and investigated the efficacy of storybook reading in improving
vocabulary in young children. Her work found that analytical and
multidimensional vocabulary practice tied to literature was a more effective
practice than standard pedagogy of memorizing definitions. Relating essential
terms to literature enhanced both short and long-term knowledge of words. This
practice especially served English language learners (ELL) in catching up with
their non-ELL peers.
Marzano and Pickering (2005) developed a six-step method of vocabulary
instruction designed to develop students’ academic language. This language, or
academic vocabulary, originated with terms identified by subject-area teachers as
essential to the understanding of a course or class, improved background
knowledge and enhanced students’ capacity to learn when the six-step process

4
was used. Rather than memorize definitions of lists of terms, students described
and explained new terms in their own words, reviewed them frequently in
activities and games, and focused on terms important to the course content.
In Ward’s study (2006), Bethan Marshall of King’s College in London
opined that there is no substitute for what books do in terms of helping students
expand their world and extend their vocabularies. The effectiveness of
information and communication technologies to increase student achievement
was compared to books. Ward’s research showed that 100 English pounds spent
on books per upper grades pupil had a greater impact on average test scores in
English, mathematics, and science when compared to the same amount spent on
technology. The average score rose from 27.5 to 27.9 or a 15% increase per
student.
In seven Title I schools, 15 third grade teachers were randomly assigned a
vocabulary intervention method or to a control group in a study by Helen
Apthorp (2006). Trained examiners conducted pretests and posttests of oral and
sight vocabulary. At one school, students in the treatment group compared to
the control group showed improvement. Contextual factors and student
characteristics appeared to affect the results more than the methodology.
How teachers use instructional time and its influence on student
achievement was examined by Miller (2006). Using direct classroom instruction,
trained examiners tabulated best practice methodology in vocabulary, reading

5
comprehension, and word study. Arizona state reading tests were used to
measure student performance. Teaching students how and when to use
comprehension strategies and the allocation of time had a positive effect on
student achievement.
The unexpected, and large, gains in average intelligence quotient (IQ)
gains in the last ten years presented a paradox according to Flynn (2007). The
Wechsler Intelligence Scale for Children (WISC) is a collection of subtests
measuring, among other items, vocabulary, arithmetic, and subjects who score
above average on one subtest tend to excel in all categories. The vocabulary
portion measures the words people have accumulated in everyday life. The
unexpected score gains in thirty countries are the source of speculation. Flynn
posited that either the tests are no longer a valid measure of IQ, or kids are
getting smarter. He believed the explanation is more complex than just kids
getting smarter. Students and teachers intentionally studied vocabulary which
had a direct impact on performance on the WISC or other methods of assessing
ability.
Doherty and Hilberg (2007) examined the relationship between pedagogy
and student achievement. Twenty-three teachers and their 344 students
participated in the year-long study which began with pretests and concluded
with posttests. Teachers reliably predicted performance on year-end assessments
in reading comprehension, vocabulary, and spelling using the standards for

6
effective pedagogy. The greatest gains occurred in classrooms in which the
standards for vocabulary were practiced in diversified activity settings.
Two college students wondered why they could so easily learn all the
words to rap songs, but struggled with challenging vocabulary words found on
standardized tests. They began an academic rap company named Flocabulary
which produced a CD entitled, A Dictionary and a Microphone. Menchville High
School in Newport News, Virginia used the Flocabulary CD with juniors, and the
students’ average Scholastic Aptitude Test writing score rose from 420 to 477
after using the method of learning vocabulary words rap style for one year
(Harrison & Rappaport, 2007).
Tredwell (2007) investigated the impact of peer tutoring on vocabulary
growth. The study measured vocabulary growth over a six-week period and
used a pre- and posttest to gather data. Students were assigned a peer tutor who
had been trained to model the correct use of specific target vocabulary words.
Professional Development
The effects of professional development for experienced teachers in
vocabulary instruction in a critical content area were studied by Armstrong
(2000). Secondary science teachers participated in ten hours of professional
development in specific vocabulary instruction and then their practices were
observed. Students in both the control and the experimental group took

7
vocabulary pretests before the ten-week regimen of prescribed activities began.
Students in the experimental group performed better on the posttest. Both
teachers and students were interviewed at the culmination of the project and
both groups responded favorably to the activities and the results.
Teacher participation in professional development activities explained
significant amounts of variation in mathematics and science achievement
(Weglinsky, 2000). His research with 7,500 eighth graders found that teacher
involvement in professional development had as much influence on the variance
in student achievement as did student background.
In an extensive research on the effects of professional development, Garet,
Porter, Desmone, Birman, and Yoon (2001) surveyed over 1000 teachers. Their
findings show that if professional development is to change teacher behavior,
then it should focus on content knowledge in an atmosphere of active learning.
The research on effective schools points directly to the principal being
recognized as an instructional leader in schools that succeed (Terry, 1996).
Marzano, Waters, and McNulty (2005) asserted that the successful school is one
that is lead by a principal who has knowledge of curriculum, instruction, and
assessment. That knowledge provides the “guaranteed and viable curriculum”
to ensure that teachers address the essential content (p. 110).

8
Statement of the Problem
This study sought to determine if there was a relationship in the changes
in available data (FCAT reading developmental scale scores) and teacher
knowledge and skill in vocabulary instruction. The hypothesis used in this study
was that if teachers participated in professional development provided by the
principal (also the researcher) that there would be an improvement in student
achievement as measured FCAT reading scores.
Purpose of the Study
The work of an instructional leader is to help teachers help students learn.
How to help high school teachers help their students improve reading
achievement is a complex issue. Working with teachers to develop a guaranteed
curriculum, such as a program of academic vocabulary, was the impetus of this
study. The goal was to guide teachers to implement such a program which could
result in significant improvement in student reading. The researcher was the
principal of the study school. In 2008 and 2009, the researcher conducted a pre-
test and posttest assessment as well as personally provided the professional
development in academic vocabulary.

9
Significance of the Study
The importance of academic vocabulary is reflected in the following
statement by Marzano (2004):
Enhancing students’ academic knowledge…is a worthy goal of public
education from a number of perspectives. In fact, given the relationship
between academic background knowledge and academic achievement,
one can make the case that it should be at the top of any list of
interventions intended to enhance student achievement. (p. 4)
Research Questions
The study was guided by the following Research Questions:
1. What relationship, if any, existed between the Florida
Comprehensive Assessment Test reading scores of sophomore
students from 2008 to 2009 after teachers implemented the academic
vocabulary program?
2. To what extent, if any, did different demographic student sub-groups
(white, African-American, Hispanic, economically disadvantaged,
English language learners, and students with disabilities) benefit from
teacher participation in the academic vocabulary professional
development program according to change in FCAT reading scores?

10
3. To what extent did teachers report changes in their knowledge and
implementation of research-based vocabulary instruction as a result of
participation in professional development?
4. What relationship, if any, existed between FCAT reading change and
change in knowledge and skill in vocabulary teaching reported by
teachers?
Methodology
Population
The population used for this study was the 1600 sophomore students and
the 175 teachers of a high school located in Central Florida over the course of the
2008 and 2009 school years.
The student population of the study school was disaggregated into sub-
groups of students on this school campus identified as white (59%), African-
American (12%), Hispanic (26%), economically disadvantaged (28%), English
language learners (ELL) (14%), and students with disabilities (SWD)(22%) for an
analysis of learning gains. All classroom teachers in the school participated in a
program of professional development for academic vocabulary, but the possible
impact of academic vocabulary on student learning for the purposes of this study
was measured by FCAT reading scores of sophomore students in 2008 and 2009.

11
The entire classroom teacher population participated in the pretests and posttests
(Appendix A) for the purposes of data collection.
Procedures
A program of professional development for teachers was designed and
conducted to present the theoretical framework for an academic vocabulary
program, the process of creating academic vocabulary lists, and the instructional
strategies required for the implementation of an academic vocabulary program
within each content area. A pretest was administered to all teachers as the first
segment of the professional development activities to determine faculty baseline
knowledge and opinions.
Training the teachers to develop the lists of academic vocabulary terms
was the necessary first step for the implementation of an academic vocabulary
program. Teachers worked within their content areas (English, mathematics,
science, social studies, fine arts, business and computer education, physical
education, performing arts, and foreign language) to identify the academic
vocabulary of their courses; i.e., the terms, dates, names, places, processes,
concepts, and phrases critical to the understanding of each content area course.
These terms were gleaned from national and state standards as well as local
benchmarks and goals. The lists of academic vocabulary terms were first
developed horizontally by teachers for each specific course within each subject

12
area (e.g., world history academic vocabulary within the social studies
department; algebra II academic vocabulary within the mathematics
department). The number of academic vocabulary terms selected for each course
was managed by determining if a term in question was critical to the
understanding of the content, useful to the understanding of the content, or an
interesting additional term in the content (Marzano & Pickering, 2005). In order
for students to learn the academic vocabulary identified as critical, teachers
controlled the number of terms introduced over time by considering both the
number of terms deemed critical as well as the length of the school term in which
students had to master them.
The second phase in the development of course-specific academic
vocabulary terms was the vertical alignment of the terms by teachers to ensure
that the sequence of the terms was appropriate and logical within the scope and
sequence of each curricular area. The overlapping of key terms, people, events,
processes, concepts, and dates was both acceptable and unavoidable, though not
ideal. The target number of terms for each course was thirty; however, that
number was a recommendation and not binding.
After the teachers completed and agreed upon their academic vocabulary
lists for their courses within each curriculum area (Appendix B), the
implementation began in the classroom. The process of teaching the academic
vocabulary terms was not what was previously expected in terms of vocabulary

13
instruction. Implementation of academic vocabulary required student mastery
of identified key academic vocabulary terms over time. It did not necessitate the
rote memorization of lists of words with specific definitions assigned in long
lists, but rather a six-step teaching process designed by Marzano and Pickering
(2005).
Step 1: Provide a description, explanation, or example of the new term.
Step 2: Ask students to restate the description, explanation, or example in
their own words.
Step 3: Ask students to construct a picture, symbol, or graphic
representing the term.
Step 4: Engage students periodically in activities that help them add to
their knowledge of the terms in their notebooks.
Step 5: Periodically ask students to discuss the terms with one another.
Step 6: Involve students periodically in games that allow them to play
with terms. (pp. 14-5)
The first teaching step in the process was for an academic vocabulary term
to be introduced to the students through explanation, with examples and non-
examples presented and discussed. At this point teachers were able to determine
prior knowledge, provide an example, or share an historical event. The second
step required the students to write and maintain a list of academic vocabulary
terms – similar to a glossary – in which they wrote definitions or explanations in

14
their own words throughout their course of study. Students often resisted this
step and requested instead that teachers provide a definition, but it was
important that students construct their own meaning for the critical terms. It
was essential at this point that teachers check for understanding and monitor the
accuracy of student work to ensure that students were learning correct
information. It was also important for these lists of words/notebooks/glossaries
belong to the students so that they were portable and able to be updated. For
step three, students made graphic or non-linguistic representations of each term
to reinforce their understanding and provide another method of reinforcing the
term’s meaning or significance. Modeling this step for students was important,
and allowing students to work together on this step was also encouraged. The
fourth step in the process of teaching academic vocabulary required teachers to
provide opportunities for students to use their academic vocabulary terms
regularly to deepen their understanding. The fifth and sixth steps both involved
the purposeful and frequent referencing and reviewing of the essential academic
vocabulary terms determined for each specific course. Using games, graphs,
charts, and inconsequential competition to review the terms as well as provide
opportunities for students to discuss and use the terms allowed the words to
become part of students’ long-term memories through the numerous and
frequent use. These activities used to reinforce and expand on students’
understanding of academic vocabulary terms occurred throughout each course

15
of study until the completion of the semester or school year. Rather than asking
students to memorize a dictionary definition and/or use words in a sentence, the
academic vocabulary terms identified by teachers as being critical and essential
to the understanding of a subject area were learned and reviewed over time to
improve student understanding and retention (Marzano, 2003).
Data Collection
In the spring of 2008 and 2009, ninth and tenth grade students took the
Florida Comprehensive Assessment Test (FCAT) and data from this assessment
were collected. Student performance on FCAT Reading was compared to
previous year’s scores with a focus on learning gains. Appropriate statistical
procedures were used to calculate the difference in mean scores and to determine
if the results were statistically significant. For Research Question One which was
determine the relationship, if any, between FCAT reading scores of sophomore
students from 2008 to 2009 after teachers implemented the academic vocabulary
program, the researcher conducted a linear regression with the dependent
variable (y) was grade 10 reading mean scale score, and the independent variable
was the year. In determining if year was a statistically significant predictor of
mean scale score, the relationship, if any, between the two variables was
determined. Additionally, a one-way analysis of covariance (ANCOVA) was
performed to examine performance of cohort group scale scores. To look at the

16
performance of student subgroups (Research Question Two), a multiple logistic
regression was performed which yielded the likelihood of a student making a
learning gain in reading based on a variety of predictors including the year and
the subgroup. To further examine the performance of the different student
subgroups, a one-way analysis of covariance (ANCOVA) was conducted to focus
on the different levels of performance.
Instrumentation
A survey entitled Teacher Perceptions of Vocabulary Instruction
(Appendix A) was conducted both prior to and at the conclusion of the treatment
to assess teacher knowledge of vocabulary instruction, reading comprehension,
and academic vocabulary. The instrument designed by the researcher collected
data through a Likert-type survey distributed to teachers of the study school. The
items represented a variety of 5-point Likert scale statements with a range of
responses including the following: (1) strongly agree, (2) agree, (3) neither agree
or disagree, (4) disagree, (5) strongly disagree, and (6) not applicable.
Demographic questions were included to identify teachers’ areas of content
specialization, years of the teaching experience, and highest degree of education
earned. To answer Research Question Three which sought to determine the
extent to which teachers reported changes in their knowledge and
implementation of research-based vocabulary instruction as a result of

17
participation in professional development, a factor analysis was performed on
the survey items, and independent T-tests were conducted to determine the
differences in pretest and posttest surveys. Two-way factorial analyses were run
to examine the results of teacher responses based on years of teaching experience
and subject area taught.
The fourth question addressed the relationship between FCAT reading
score change and change in knowledge and skill in vocabulary teaching reported
by teachers. This question was answered by determining the change, if any,
between the change in FCAT reading scores and change in teacher survey scores.
Since no common measure was used, only inferential and anecdotal data was
obtained.
Delimitations of the Study
The factors which delimited of this study included the following:
1. The study included the sophomore populations of one high school.
2. The effectiveness of the academic vocabulary program was only
evaluated in terms of student success in FCAT Reading.

18
Limitations of the Study
The factors which limited the validity of this research included the
following:
1. Unidentified factors including student motivation to perform,
development growth, and impact of reading instruction may have
influenced student scores on FCAT reading.
2. The implementation of the academic vocabulary program was
dependent on individual teacher participation, cooperation and/or
self-reporting.
3. Although the use of FCAT results was appropriate for the purposes
of this study, the use of this assessment and its scaling procedures
makes the information Florida specific.
Definitions of Terms
The following definitions are provided for terms that will be referenced
throughout this study.
Academic vocabulary: Terms, names, dates, concepts, dates, and
processes identified as essential to the mastery of individual academic subjects
(Marzano & Pickering, 2005).

19
Developmental Scale Scores: These FCAT scores allow student progress
within a subject area (reading and mathematics) to be tracked over time and
across grade levels. They indicate growth and provide the scores to determine
learning gains (FLDOE).
Florida Comprehensive Assessment Test: The Florida Comprehensive
Assessment Test (FCAT) is administered annually to public school students in
grades 3 through 11 by the Florida Department of Education. The FCAT sought
to measure student achievement on the Sunshine State Standards in the areas of
reading, writing, mathematics, and science. Student scale scores ranged from 100
to 500 and were reported in achievement levels: level 5 was the highest score,
level 3 indicated on grade level and high performing, and levels 1 and 2 indicate
poor performance and the need for remediation. Student achievement was also
reported in developmental scale scores which range from 0 to 3000. Individual
student progress in reading and mathematics was also reported as learning gains
each year (Florida Department of Education).
Learning gains: Students can demonstrate a learning gain in one of three
different ways: (1) improve by achievement level from 1 to 2, 2 to 3, 3 to 4, or 4 to
5; (2) maintain a high performing level of 3, 4, or 5; or (3) demonstrate at least
one year’s growth in developmental scale scores within levels 1 or 2 (Florida
Department of Education).

20
Student subgroups: Student performance on FCAT is disaggregated and
analyzed by subgroups. These subgroups of students have been determined by
the federal No Child Left Behind Act of 2001 and include white, African-
American, Hispanic, economically disadvantaged (ED) as determined by
participation in the federal free and/or reduced lunch program, English
Language Learners (ELL), and students with disabilities (SWD) (United States
Department of Education).
Summary
This first chapter of five contained a literature review, the statement of the
problem, and the purpose and significance of the study. The research questions,
methodology, delimitations, limitations, and definitions of terms were included.
The second chapter will focus on the Review of Literature. In addition to
an introduction and summary, reviews of the following topics are included:
instructional leadership, vocabulary instruction, English language learners, and
professional development.
The third chapter contains the research questions, the population, an
explanation of the professional development treatment, and instrumentation.
The data collection process is explained, and the statistical procedures used in
the study related to student FCAT performance in reading, the results of the

21
teacher survey, and the relationship that can be inferred between the student
scores and the teacher results are presented.
Chapter Four will include a discussion of the Analysis of Data, and
Chapter Five will focus on the Summary, Conclusions, and Recommendations.

22
CHAPTER TWO: REVIEW OF LITERATURE
Introduction
This researcher’s study centered on professional development provided
by an instructional leader, the change in teacher knowledge and practice, and the
effect of professional development on student achievement in reading. The
hypothesis used in this study was that if teachers participated in professional
development provided by the principal (also the researcher) that there would be
an improvement in student achievement as measured by Florida Comprehensive
Assessment Test (FCAT) reading scores. This chapter is divided into the
following sections: (1) instructional leadership, (2) vocabulary instruction, and
(3) professional development and concludes with a summary.
Instructional Leadership
Cawelti’s (1987) research identified patterns of behavior among effective
principals including vision, organization, instructional support, and the
monitoring of student learning. He found that many principals spent a majority
of their time in administrative and operational tasks. His explanation of
instructional support required that a school leader have knowledge and expertise
in designing staff development programs.
23
In his work on the relationship between leadership and student
achievement, Williamson (1995) examined how principals function in different
roles to promote community engagement and student learning. He found that
successful principal characteristics included the ability to inspire, to develop
people, and to lead change focused student achievement.
Hallinger and Heck (1996) looked for a direct effect between student
learning educational leadership by reviewing numerous studies. Their findings
suggest that the broader category of effective schools research ties back to
instructional leaders. Principals, in their roles as instructional leaders, can shape
the environment of the school to create a culture of teaching and learning. The
sharing of vision and responsibility for student learning are important in
establishing this culture. When this occurs, the conditions and processes in a
school building, has an effect on student achievement (Hallinger & Heck).
The research on effective schools points directly to the principal being
recognized as an instructional leader in schools that succeed (Terry, 1996).
Marzano, Waters, and McNulty (2005) asserted that the successful school was
one that was lead by a principal who had knowledge of curriculum, instruction,
and assessment. That knowledge provides the “guaranteed and viable
curriculum” to ensure that teachers address the essential content (p. 110).
Leithwood, Louis, Anderson, and Wahlstrom (2004) found in their work
with the Wallace Foundation that “leadership is second only to classroom

24
instruction among all school-related factors that contribute to what students
learn at school” (p.5). The total effects of instructional leadership on student
achievement can account for approximately 25% of the total school effects
(Hallinger & Heck, 1996; Leithwood, & Jantzi, 2000).
Fullan (2004) described of the role of the principal as a staff developer in
the context of a moral imperative. The function of the principal as instructional
leader rather than a manager as being important in breaking barriers to effective
school reform. He identified the ability to facilitate and lead staff development as
playing a crucial role in the changing framework of school leadership.
In a meta-analysis of 27 studies of instructional leadership, Robinson,
Lloyd, and Rowe (2008) concluded that the impact of instructional leadership
was almost four times that of transformational leadership. Their five sets of
leadership practices that comprise instructional leadership included establishing
goals and expectations, resourcing strategically, evaluating teaching and
curriculum, promoting and participating in teacher learning, and the
establishment of an orderly and supportive environment. They concluded that
“a school’s leadership is likely to have more positive impacts on student
achievement and well-being when it is focused on the quality of learning,
teaching, and the teacher learning” (p.668).
If the goal in education is student achievement, then teachers and
principals must be able to set high expectations for all students. Essential to the

25
achievement of those expectations is that teachers have the skills, knowledge,
strategies to help students achieve them (Cross, 2008). Principals must be able to
provide training for teachers that includes making expectations clear, spending
time with students of all performance levels, and making sure students
understand the relationship between effort and achievement.
The knowledge of content area standards is essential for principals in their
roles as instructional leaders (Church, 2009). This knowledge is required to place
teachers in appropriate schedules, assign mentors, and selecting instructional
materials. Evidence supports a strong relationship between a strong library
program and student achievement. Principals who know curriculum and
standards are best equipped to support a strong library media programs that in
turn support the needs of students and teachers with adequate and appropriate
resources and services.
Based on data from interviews and surveys, Graczewski, Knudson, and
Holtzman (2009) found a connection principals’ involvement in instructional
improvement and effective staff development focused on content and
curriculum. This study supports the idea that for school reform to occur,
principals must expand their roles beyond that of administering and managing
schools to that of instructional leadership.
Frey and Fisher (2009) asserted that what teachers do in their classrooms
was important in terms of student learning, but that it was the principals who

26
play a most important part in improving student performance from year to year.
Classroom lessons must be designed to include focused lessons, guided
instruction, and collaborative projects to independent learning. Principals must
be able to observe classrooms and notice the presence or absence of quality
instruction. The role of the principal then becomes that of guiding and training
teachers to grow in their professional practice.
Vocabulary Instruction
The work of Youngs (1980) examined the effects of special vocabulary
teaching and learning techniques on students of diverse academic abilities and
their occupational interests. Using a vocabulary program entitled Exciting
Words for Active Minds and Building Blocks for the Future (EWAM), teachers
introduced a 1000-word list of terms identified as useful and frequently used in
business that had been validated by managers and executives. Two experimental
and two control groups of students who were of equal scholastic ability were
created. The experimental group received EWAM lessons, and the control group
received no special vocabulary instruction. Youngs found that the mean
achievement difference between the two groups on vocabulary tests was
insignificant, but that the experimental group maintained superior performance
on achievement tests and earned higher grade point averages (GPAs). Higher

27
and lower ability students made similar gains with a correlation between GPA
and vocabulary knowledge of .64.
In a study of 55 seventh graders from an urban school, Clark (1984)
examined the effect of three different vocabulary instruction methodologies: (1)
students studied a list of words with definitions, (2) students studied the identical
words in context, and (3) students studied the same list of words with definitions
and contextual sentence examples. Using the results of t-tests, Clark found that all
three methods improved vocabulary knowledge and that there was not a
preferred method.
Graham (1985) found that vocabulary instruction facilitated reading
comprehension. In a study of 161 sixth graders, the significance of vocabulary
knowledge on students’ ability to understand inference in reading passages was
explored. The students participated in pretests and posttests. The test group (TG)
had twenty minutes of vocabulary instruction, and the control group had no
vocabulary instruction. The TG scores showed a significant mean effect on
inference questions.
Cregan (1989) investigated the importance of depth of word meaning for
content area reading. An examination of 10 upper elementary history texts revealed
that a substantial portion of content consisted of multiple-meaning words. Students
were tested on those words, and the most frequently missed incorrect answers were
the most familiar meanings. His findings supported his position that depth of

28
vocabulary knowledge was essential for students to have access to their content
area reading.
Marmolejo (1990) investigated the relationship between vocabulary
acquisition and reading experiences from a variety of sources. The study
examined evidence that poor readers had difficulty learning from context since they
did not have the vocabulary to understand the reading. The findings supported the
position that different students had different needs for vocabulary instruction. The
students who learned through direct instruction in vocabulary yielded a significant
mean effect size. The tests of those students who learned through an incidental
vocabulary approach did not yield significant results.
In a study that looked at the influence of vocabulary study on reading
proficiency, Grimason-Lowewenthal (1990) worked with nine undergraduate
students at an inner city community college. These students had been identified as
not meeting minimum reading comprehension and projected to face extreme
academic challenges in their college classes. Students were divided into four
groups - three vocabulary groups and one control group. They were pre and post
tested in vocabulary knowledge and reading comprehension. An analysis of the
results showed strong gains in both vocabulary knowledge and reading
comprehension in all three groups. Though the three vocabulary groups each used
a different approach to vocabulary instruction, the findings showed similar gains
with each of the three methods.

29
Vocabulary was presented as a major determinant of reading success for
students in grades K-12 by Biemiller (2003). He cited the need for direct
instruction for vocabulary growth rather than incidental acquisition. The
methods for promoting vocabulary instruction were not as important as the
actual teaching of vocabulary. The amount of vocabulary needed for successful
learning was viewed as too large to rely on chance exposures with essential
terms.
Time and access to a wide variety of reading materials was the most
effective tool to improving reading (Shin, 2004). His study was to determine the
role played by books in increasing vocabulary. He found that student vocabulary
acquisition rates increased faster through reading than through direct instruction.
Two methods of systematic word study (workbook and words learned
through context) were the basis for work done by Taliaferro (2004). Forty-eight
students in grades 6-9 participated and took pretests and posttests. Taliaferro
found that both methods of vocabulary instruction worked equally well as
indicated by student performance on posttests.
Kenny (2004) found that student vocabularies expanded through the use
of recognition exercises more than when students used paper and pencil practice.
Lesley Marwood’s Classroom Performance System, as cited in Kenny, enhanced
group performance and improved educational achievement in vocabulary using
the prescribed vocabulary recognition strategies (Kenny).

30
Moseley (2004) examined the quality of writing among 87 eighth grade
students. Half the students had intensive vocabulary and writing instruction, and
the other half had intensive vocabulary but no writing instruction. All students
took the Test of Written Language 3rd edition (TOWL: 3) at the end of the
instructional period. Moseley found no significant difference in scores of students
in the vocabulary only group or the writing group. Students in the vocabulary with
writing instruction group used the target vocabulary words in their writings three
times more than the students who had only vocabulary instruction.
Direct vocabulary instruction has a strong impact on student achievement.
Marzano (2004) found that students who had no vocabulary instruction score
lower than those who had direct vocabulary instruction. Students with no
instruction scored at the 50th percentile, but students with instruction scored at
the 62nd percentile (effect size = .32). The direct method described involved
students learning 10 to 12 new words a week from a high-frequency list. When
students received vocabulary instruction on specific words essential to the
content, however, their scores increased by 33 percentile points. Clearly, “direct
vocabulary instruction has an impressive track record of improving students’
background knowledge and the comprehension of academic content “(p. 69).
Marzano and Pickering (2005) developed a six-step method of vocabulary
instruction designed to develop students’ academic language. This language, or
academic vocabulary, originated with terms identified by subject-area teachers as
31
essential to the understanding of a course or class, improved background
knowledge and enhanced students’ capacity to learn when the six-step process
was used. Instruction should focus on words that have a high probability of
making and impact on student achievement, and that those words should be
treated differently (Marzano, 2003). Rather than memorize definitions of lists of
terms, students described and explained new terms in their own words,
reviewed them frequently in activities and games, and focused on terms
important to the course content.
In a study of two vocabulary instruction methods, Postell (2006) found no
major difference in the performance of the participants. The test group had a
variety of intensive daily vocabulary instruction. The students in the control group
completed exercise in a traditional vocabulary workbook one day a week. All
students showed improvement in vocabulary knowledge, but neither group out-
performed the other.
Rountree (2006) sought to confirm the significant and direct relationship
between reading vocabulary and reading comprehension. He found a correlation
between four standardized tests with statistical significance between reading level
and vocabulary scores, vocabulary scores and overall comprehension, and
between ready level and comprehension scores. His findings reinforced the need
growing students’ vocabularies, and emphasized the need for effective vocabulary
instruction.

32
In seven Title I schools, 15 third-grade teachers were randomly assigned a
vocabulary intervention method or to a control group (CG) in a study by Helen
Apthorp (2006). Trained examiners conducted pretests and posttests of oral and
sight vocabulary. At one site, students in the treatment group compared to the
control group showed improvement. Contextual factors and student
characteristics appeared to affect the results more than the methodology.
How teachers use instructional time and its influence on student
achievement was examined by Miller (2006). Using direct classroom instruction,
trained examiners tabulated best practice methodology in vocabulary, reading
comprehension, and word study. Arizona state reading tests were used to
measure student performance. Teaching students how and when to use
comprehension strategies and the allocation of time had a positive effect on
student achievement.
In Ward’s study (2006), Bethan Marshall of King’s College in London
opined that there was no substitute for what books do in terms of helping
students expand their world and extend their vocabularies. The effectiveness of
information and communication technologies to increase student achievement
was compared to books. Ward’s research showed that 100 English pounds spent
on books per upper grades pupil had a greater impact on average test scores in
English, mathematics, and science when compared to the same amount spent on

33
technology. The average score rose from 27.5 to 27.9 or a 15% increase per
student.
Contemporary education author and critic Edward Hirsch (2006) posited
that more exposure to a broad range of knowledge was the defining factor in
student achievement. He suggested that there is too much emphasis on reading
skills rather than on reading itself. For students to acquire the exposure to essential
knowledge in the classroom, the recommendation was for reading from a broad
variety of sources and more intentional vocabulary instruction.
Teaching fewer words well, but better, was the recommendation of
Bromley (2007). He believed that having a sufficient content vocabulary was
essential to reading comprehension. Direct instruction of key terms, word
associations, multiple meanings, and multi-syllabic word parts were essential
elements of vocabulary teaching. Bromley recognized the importance of the
vocabulary teacher as salesperson of new words and language.
Doherty and Hilberg (2007) examined the relationship between
pedagogical instructional practices and student achievement. Twenty-three
teachers and their 344 students participated in the year-long study which began
with pretests and concluded with posttests. Teachers reliably predicted
performance on year-end assessments in reading comprehension, vocabulary,
and spelling using the standards for effective pedagogy. The greatest gains

34
occurred in classrooms in which the standards for vocabulary were practiced in
diversified activity settings.
Harrison and Rappaport (2007), two college students, wondered why they
could so easily learn all the words to rap songs, but struggled with challenging
vocabulary words found on standardized tests. They began an academic rap
company named Flocabulary which produced a compact disc entitled, A
Dictionary and a Microphone. Menchville High School in Newport News, Virginia
used the Flocabulary CD with juniors, and the students’ average Scholastic
Aptitude Test writing score improved from 420 to 477 after using the method of
learning vocabulary words rap style for one year.
The unexpected, and large, gains in average intelligence quotient (IQ)
gains in the last ten years presented a paradox according to Flynn (2007). The
Wechsler Intelligence Scale for Children (WISC) is a collection of subtests
measuring, among other items, vocabulary, arithmetic, and subjects who score
above average on one subtest tend to excel in all categories. The vocabulary
portion measures the words people have accumulated in normal life experiences.
The unexpected score gains in thirty countries are the source of speculation.
Flynn posited that either the tests are no longer a valid measure of IQ, or kids are
getting smarter. He believed the explanation is more complex than just students
getting smarter. Students and teachers intentionally studied vocabulary which

35
had a direct impact on performance on the WISC or other methods of assessing
ability.
Tredwell (2007) investigated the impact of peer tutoring on vocabulary
growth. The study measured vocabulary growth over a six-week period and
used a pre- and posttest to gather data. Students were assigned a peer tutor who
had been trained to model the correct use of specific target vocabulary words.
In a study on the impact of the use of a graphic organizer (Frayer Model),
LaBrosse (2007) supported the learning of vocabulary in other than the traditional
memorization of definitions approach. Four chemistry classes were divided into a
treatment group (TG) and a control group (CG). Two TGs studied chemistry
vocabulary with meaningful definitions in context using the Frayer Model. The two
CGs studied the same vocabulary words without using a graphic organizer. Both
the TGs and the CGs took multiple pre and posttests. A Chi square analysis showed
students in the TGs had learned more chemistry content.
Researchers Taylor, Mraz, Nichols, Rickelman, and Wood (2009) asserted
that research supports direct vocabulary instruction across content areas and
grade levels to support reading comprehension of varied texts. In light of the
emphasis on comprehension and decoding, vocabulary instruction has been
reduced. Direct vocabulary instruction strategies enhance reading
comprehension and should be a main focus of any reading program.

36
A leading factor contributing to the achievement gap was limited
background and vocabulary knowledge (Winter, 2009). This was true
particularly for students in the subgroups recognized by NCLB: African-
American, Hispanic, English language learners (ELL), and students with
disabilities (SWD). Winter supports vocabulary instruction that approaches
language in each classroom as essential knowledge for word consciousness.
In Marzano (2009) on the subject of vocabulary instruction , he advised
that simply using a strategy that some have found effective would not guarantee
a positive result. Rather, it was how a strategy was used that determined the
extent of student achievement. In a review of one district with 24 elementary
teachers using his six-step vocabulary instruction process with one group of
students but not the other, he found that teachers who substituted their own
definitions rather than directing students to develop their own descriptions of
words did not get strong results (p. 84). The use of games and engaging students
at a high level in activities that reviewed words in a non-threatening way
produced a strong effect. The third step, which asks students to produce their
own symbolic or nonlinguistic representations of the terms, produced soaring
results, but was the step he found most often skipped.

37
English Language Learners
Mansaray (1997) examined the effect of vocabulary methodology for
English language learners. The TG had thirty-three students and the CG had 36.
Both groups took pre and posttests. The TG had teacher-directed lessons on
vocabulary strategies, and the CG had no formal vocabulary instruction. The TG
showed significant gains in vocabulary on teacher-made tests. There was no
significant difference between the scores of the two groups on the Metropolitan
Achievement Test (MAT) vocabulary subtest. Mansaray found that direct
instruction in vocabulary for second language learners did improve student
performance on the reading subtest of the MAT and recommended direct
instruction as part of the overall reading program for second language learners.
In a longitudinal study to determine if vocabulary instruction helped
English language learners acquire language faster than students left on their own,
La Piana (2001) made no significant finding in student achievement in language.
The number of participants was small; therefore, La Piana recommended further
study with a larger number of participants.
In a study of English language learners, Martin (2004) conducted both a
quantitative and a qualitative study of standardized test scores and of GPAs. He
placed 50% of the English language learner population in an intensive academic
vocabulary program for their freshmen and sophomore years. Though all the
students were considered unprepared for college level work, the standardized test

38
scores for the experimental groups improved. He further noted that the
improvement was observed in test scores more than in student GPAs. A follow-up
questionnaire given during the junior or senior year found that the students
approved of the vocabulary experience. Because the grade improvement did not
match test score improvement, Martin suggested further study of vocabulary used
in content area classrooms.
Wang (2005) also researched vocabulary instruction for English language
learners. In his study, 99 Chinese university ELL learners joined two groups. The
first group studied vocabulary before reading, and the second groups studied
vocabulary instruction after reading. Both groups took pretests and posttests.
Wang found that the group with focused vocabulary instruction before reading
made greater gains in the number of words learned and in depth of understanding.
Silverman (2005) knew that vocabulary is an important prerequisite to
literacy and investigated the efficacy of storybook reading in improving
vocabulary in young children. Her work found that analytical and
multidimensional vocabulary practice tied to literature was a more effective
practice than standard pedagogy of memorizing definitions. Relating essential
terms to literature enhanced both short and long-term knowledge of words. This
practice especially served English language learners (ELL) in catching up with
their non-ELL peers.

39
Professional Development
The effects of professional development for experienced teachers in
vocabulary instruction in a critical content area were studied by Armstrong
(2000). Secondary science teachers participated in ten hours of professional
development in specific vocabulary instruction and then their practices were
observed. Students in both the control and the experimental group took
vocabulary pretests before the ten-week regimen of prescribed activities began.
Students in the experimental group performed better on the posttest. Both
teachers and students were interviewed at the culmination of the project and
both groups responded favorably to the activities and the results.
Teacher participation in professional development activities explained
significant amounts of variation in mathematics, and science achievement
(Weglinsky, 2000). His research with 7,500 eighth graders found that teacher
involvement in professional development had as much influence on the variance
in student achievement as did student background.
In an extensive research on the effects of professional development, Garet,
Porter, Desmone, Birman, and Yoon (2001) surveyed over 1000 teachers. Their
findings show that if professional development is to change teacher behavior,
then it should focus on content knowledge in an atmosphere of active learning.
DuFour (2001) recognized the importance of the principal as instructional
leader and staff developer. He supported the idea of professional development

40
be embedded at the worksite and stressed that “the primary arena for
professional development moves from workshops to the workplace” (p. 14).
Professional development should be selected by the context of the school setting
and be tailored to match the needs of the adult learners. DuFour also asserted
that the role of the principal is that of being the primary staff developer, and
ensuring that professional growth becomes part of the school culture (1995).
In research funded by the Wallace Foundation, Leithwood, Louis,
Anderson, and Wahlstrom (2004) found that school leaders had an impact on
student learning in three ways: by creating a vision and monitoring progress
toward that end, by developing teachers through training and support, and by
creating conditions that support teaching and learning. Developing people
requires the instructional leadership to focus on the improvement of classroom
practices as the focus of the school (p. 6).
Jenkins (2009) found that since 1980, the role of the school principal has
been influenced by the research on effective schools and the principals who led
them. Instructional leadership was described as both the actions and behaviors
of the principal that promote student learning. Making student achievement a
top priority also demands that instructional quality be the main concern to
realize the vision of student achievement. The challenge for principals would
then be to make certain that teachers receive both the training and support to
challenge all students to learn to their highest potential.

41
Summary
This chapter presented a review of literature that addressed the role of the
instructional leader in terms of impact on student achievement. The findings
suggest that the presence of an instructional leader has a positive impact on
student achievement. The effectiveness of different methods of vocabulary
instruction was described, and studies supported that direct vocabulary
instruction and reading from a wide range of material were the best way to
improve learning and academic language. Several studies of English language
learners (ELL) and vocabulary instruction were reviewed which found that
vocabulary instruction helped ELL students catch up to their peers. The third
section of this chapter explored the role of an instructional leader as a
professional developer, and supported the idea that school-based professional
development focused on curriculum and instruction and presented by a school
leader had a positive impact on student achievement.

42
CHAPTER THREE: METHODOLOGY
Introduction
This chapter contains a description of the methodology used in the study.
The problem studied was whether sophomore student reading scores on the
Florida Comprehensive Assessment Test (FCAT) would improve after a specific
program of professional development was provided by the researcher. The
hypothesis of this research was that if teachers participated in professional
development provided by the principal there would be an improvement in
student achievement as measured by FCAT reading scores.
Research Questions
The study was guided by the following Research Questions:
1. What relationship, if any, existed between the Florida
Comprehensive Assessment Test reading scores of sophomore
students from 2008 to 2009 after teachers implemented the academic
vocabulary program?
2. To what extent, if any, did different demographic sub-groups (white,
African-American, Hispanic, economically disadvantaged, English
language learners, and students with disabilities) of students benefit

43
from teacher participation in the academic vocabulary professional
development program according to change in FCAT reading scores?
3. To what extent did teachers report changes in their knowledge and
implementation of research-based vocabulary instruction as a result of
participation in professional development?
4. What relationship, if any, existed between FCAT reading change and
change in knowledge and skill in vocabulary teaching reported by
teachers?
Population
The population used for this study was the 1600 sophomore students and
the 175 teachers of a high school located in Central Florida over the course of the
2008 and 2009 school years. Institutional Review Board approval was obtained
(Appendix C) to conduct the study.
The student population was disaggregated into sub-groups of students on
this school campus identified as white, African-American, Hispanic,
economically disadvantaged, English language learners (ELL), and students with
disabilities (SWD) for an analysis of learning gains. A student learning gain was
defined as (1) improvement in achievement level, (2) the maintenance of a high
level of performance, or (3) the demonstration of at one year’s growth in
developmental scale scores within low-performing scores. All classroom teachers

44
in the school participated in professional development for academic vocabulary,
but the possible impact of academic vocabulary on student learning for the
purposes of this study was only measured by FCAT reading scores of
sophomores in 2008 and 2009. The entire teacher population participated in the
pretest and posttest (Appendix A) for the purposes of data collection.
Professional Development Treatment and Procedures
A program of professional development for teachers was designed and
conducted to present the theoretical framework for an academic vocabulary
program, the process of creating academic vocabulary lists, and the instructional
strategies required for the implementation of an academic vocabulary program
within each content area. Marzano asserted that when teachers focused on the
same academic language and that language was presented in the same way, that
the school had a consistent and powerful approach (2004). The pretest, “Teacher
Perceptions of Vocabulary Instruction,” (Appendix A) was administered to all
teachers as the first segment of the professional development activities to
determine a baseline of faculty knowledge, opinions, and vocabulary instruction
professional practice.
Training the teachers to develop the lists of academic vocabulary terms
was the necessary first step to the implementation of an academic vocabulary
program. As academic language is the key to all content areas (Marzano, 2004),

45
teachers worked within their content areas (English, mathematics, science, social
studies, fine arts, business and computer education, physical education,
performing arts, and foreign language) to identify the academic vocabulary of
their courses; i.e., the terms, dates, names, places, processes, concepts, and
phrases that are critical to the understanding of each content area course. These
terms were gleaned from national and state standards as well as local
benchmarks and goal. The lists of academic vocabulary terms were developed
horizontally by teachers for each specific course within each subject area (e.g.,
world history academic vocabulary within the social studies department; algebra
II academic vocabulary within the mathematics department). The number of
academic vocabulary terms selected for each course was determined by deciding
if a term in question was critical to understanding of the content, useful to the
understanding of the content, or an interesting additional term in the content
(Marzano & Pickering, 2005). In order for students to learn the academic
vocabulary identified as critical, teachers managed the number of terms
introduced over time by considering both the number of terms deemed critical as
well as the length of the school term in which students must master them.
The second phase in the development of course-specific academic
vocabulary terms was the vertical alignment of the terms by teachers to ensure
that the sequence of the terms is appropriate and logical within the scope and
sequence of each curricular area. The overlapping of key terms, people, events,

46
processes, concepts, and dates was both acceptable and unavoidable, though not
ideal. The target number of terms for each course was set at thirty; however, that
number was a recommendation and not binding.
After the teachers completed and agreed upon their academic vocabulary
lists for their courses within each curriculum area (Appendix B), the
implementation began in the classroom. The process of teaching the academic
vocabulary terms was not what may be commonly expected in terms of
vocabulary instruction. Effective teaching of academic vocabulary required
student mastery of identified key academic vocabulary terms over time. It did
not necessitate the rote memorization of lists of words with specific definitions
assigned in long lists, but rather a six-step teaching process designed by Marzano
and Pickering (2005).
Step 1: Provide a description, explanation, or example of the new term.
Step 2: Ask students to restate the description, explanation, or example in
their own words.
Step 3: Ask students to construct a picture, symbol, or graphic
representing the term.
Step 4: Engage students periodically in activities that help them add to
their knowledge of the terms in their notebooks.
Step 5: Periodically ask students to discuss the terms with one another.

47
Step 6: Involve students periodically in games that allow them to play
with terms. (pp. 14-15)
The first teaching step in the process was for an academic vocabulary term
to be introduced to the students through explanation, with examples and non-
examples presented and discussed. At this point, classroom teachers determined
prior knowledge, gave an example, or shared an historical event. The second step
required that students write and maintain a list of academic vocabulary terms –
similar to a glossary – in which they wrote definitions or explanations in their
own words throughout their course of study. Some resisted this step and
requested instead that teachers provide a definition, but it was important that
students construct their own meaning for the critical terms. It was essential at
this point in the process that teachers checked for understanding and monitored
the accuracy of student work to ensure that students were learning correct
information. It was also essential for these lists of words/notebooks/glossaries
belong to the students so that they were portable and able to be updated. For
step three, students made graphic or non-linguistic representations of each term
to reinforce their understanding and provide another method of reinforcing the
term’s meaning or significance. Modeling this step for students was important,
and allowing students to work together on this step was also encouraged. Powell
(1980) conducted a meta-analysis on the use of nonlinguistic strategies and

48
reported that these strategies produced a vocabulary learning gain of 34
percentile points with an average effect size of 1.00.
The fourth step in the process of teaching academic vocabulary required
teachers to provide opportunities for students to use their academic vocabulary
terms regularly to deepen their understanding. The fifth and sixth steps both
involved the purposeful and frequent referencing and reviewing of the essential
academic vocabulary terms determined for each specific course. The use of
games, graphs, charts, and inconsequential competition to review the terms as
well as provide opportunities for students to discuss and use the terms provided
sufficient practice of the terms to allow them to become part of students’ long-
term memories through the numerous and frequent use of the terms. These
activities to reinforce and expand on students’ understanding of academic
vocabulary terms occurred throughout each course of study until the completion
of the semester or school year. Rather than requiring students to memorize a
dictionary definition and/or use words in a sentence, the academic vocabulary
terms identified by teachers as being critical and essential to the understanding
of a subject area were learned and reviewed over time to improve student
understanding and retention (Marzano, 2003).

49
Instrumentation
The survey used for the teacher pretest and posttest was developed by the
researcher with guidance from the researcher’s program advisor. “Teacher
Perceptions of Vocabulary Instruction” (Appendix A) was reviewed for
reliability using Cronbach’s alpha. The test was run in several iterations on the
pilot run of the survey, removing items one by one to increase the Cronbach’s
Alpha value to its maximum. The final scale included seven questions with a
Cronbach’s Alpha value of α = 0.87.
Furthermore, a confirmatory factor analysis was run to ensure that this
scale indeed reflected a series of questions that belong together. The factor
analysis was used via Maximum Likelihood extraction with a Promax rotation
and a minimum eigenvalue of 1.
The Florida Comprehensive Assessment Test is given to all Florida public
school students each spring. The sections on the test assess student performance
on the Florida Sunshine State Standards in reading, mathematics, writing, and
science in grades three through eleven. The results of this statewide test
provides the basis not only for school and districts grades, but also for adequate
yearly progress (AYP) data required by the federal Department of Education.
Each item on the Florida Comprehensive Assessment Test was included on the
test based on its connection to a specific Sunshine State Standard benchmark
(Florida Department of Education, 2005). Test items were reviewed not only by

50
item writers, but also by a review committee and the Florida Department of
Education (FDOE). In terms of test reliability, the FDOE evaluated statistical
characteristics based on three indicators of reliability: conditional standard error
of measurement, marginal reliability, and Cronbach’s alpha (p. 106). For the
purpose of this study, results of sophomore FCAT reading scores from 2008 and
2009 were used.
Data Collection
In the spring of 2008 and 2009, tenth grade students took the Florida
Comprehensive Assessment Test (FCAT) and data from this assessment were
collected. Orange County Public Schools approved the use of the student data
(Appendix D). Student performance on 2009 FCAT reading in the tenth grade
was compared to 2008 tenth grade scores with a focus on learning gains.
Appropriate statistical procedures were used to calculate the difference in mean
scores and to determine if the results were significant.
For Research Question One, what relationship, if any existed between the
Florida Comprehensive Assessment Test reading scores of sophomore students
from 2008 to 2009 after teachers implemented the academic vocabulary program,
the researcher conducted a linear regression with the dependent variable (y)
being the grade 10 reading mean scale score, and the independent variable was
the year. In determining if year was a statistically significant predictor of mean

51
scale score, the relationship, if any, between the two variables was determined.
Additionally, a one-way analysis of covariance (ANCOVA) was performed to
further examine student performance.
To look at the performance of student subgroups (Research Question
Two) which examined student reading proficiency by subgroups after teacher
participation in academic vocabulary professional development), a multiple
logistic regression was conducted which yielded the likelihood of a student
making a learning gain in reading based on a variety of predictors including the
year and the subgroup. A one-way analysis of covariance (ANCOVA) was
performed to focus on different levels of student performance.
A survey for teachers entitled “Teacher Perceptions of Vocabulary
Instruction” (Appendix A) was administered both prior to and at the conclusion
of the treatment to assess their knowledge of vocabulary instruction, reading
comprehension, and academic vocabulary. The instrument designed by the
researcher collected data through a Likert-type survey distributed to teachers of
the study school. The items represented a variety of 5-point Likert scale
statements with a range of responses including the following:
(1) strongly agree, (2) agree, (3) neither agree or disagree, (4) disagree, (5)
strongly disagree, and (6) not applicable. Demographic questions were included
to identify teachers’ areas of content specialization, years of the teaching
experience, and highest degree of education earned. To answer Research

52
Question Three, a factor analysis was performed on the survey items for content
validity. Cronbach’s alpha was used to establish reliability. Independent T-tests
were conducted to determine the change in teacher scores on the pretest and
posttest survey “Teacher Perceptions of Vocabulary Instruction” (Appendix A).
A two-way factorial analysis (ANOVA) was conducted to examine teacher
responses based on years of teaching experience and subject area taught.
Because there was no common measure, no statistical measure could be
used for Research Question Four to analyze the change in FCAT performance
and change in teacher scores. In addition to anecdotal evidence, inferences were
drawn from Research Question One through Research Question three to address
the educational significance of Research Question Four which looked at the
relationship between FCAT reading score change and change in knowledge and
skill in vocabulary teaching reported by teachers.
Summary
This chapter presented the methodology used in the program of
professional development focused on academic vocabulary. The parameters of
both the student and teacher population in the sample were provided. The
procedures used to determine statistical significance in reading score change
were described, and the procedures used to measure change in the teacher
pretest and posttest were presented.

53
CHAPTER FOUR: ANALYSIS OF DATA
Introduction
The purpose of this study was to determine if there was a statistically
significant relationship between a professional development program in
academic vocabulary and sophomore reading performance on the Florida
Comprehensive Assessment Test (FCAT) from 2008 to 2009. Additionally, the
knowledge and professional practice in vocabulary instruction of the teachers in
the study school was studied. Four research questions were introduced in
Chapter One: (1) What relationship, if any, exists between the Florida
Comprehensive Assessment Test reading scores of sophomores from 2008 to
2009, after teachers implemented the academic vocabulary program? (2) To what
extent, if any, do demographic subgroups of students benefit from teacher
participation in the academic vocabulary professional development program
according to change in FCAT reading scores? (3) To what extent do teachers
report changes in their knowledge and implementation of research-based
instruction as a result of participation in professional development? and (4) What
relationship, if any, exists between FCAT reading scale score change and change
in knowledge and skill in vocabulary teaching reported by teachers? Chapter
Four will present the findings associated with the research questions.

54
The data sources were the 2008 and 2009 sophomore reading scores on
FCAT provided by the Florida Department of Education and the survey
instrument “Teacher Perceptions of Vocabulary Instruction” (Appendix A)
developed by the researcher to determine teacher knowledge and professional
practice in vocabulary instruction. The survey was completed by all teachers in
the school at the time of the pretest and the posttest. Because of funding cuts,
fewer teachers were still employed by the school and present to complete the
posttest.
Research Question One
What relationship, if any, exists between the Florida Comprehensive Assessment
Test reading scores of sophomores from 2008 to 2009 after teachers implemented the
academic vocabulary program?
A simple linear regression was utilized to analyze the relationship
between these two variables. The dependent variable was represented by FCAT
Scale Scores. This continuous value ranges from 100 to 500. The independent
variable was a binary indicator of year, 2008 or 2009. Since the first full year of
implementation of the academic vocabulary program among teachers was 2008-
2009, the March 2008 tenth graders represented a class of students who were not
instructed under the academic vocabulary teachers, while the March 2009 tenth
graders were instructed under the fully-trained teachers for the whole year.

55
Demographic variables showing similarities in the two tenth grade
populations are presented in Table 1.
Table 1 Demographic Variables by Academic Year for 10th Grade FCAT Reading Scale Scores
Tenth Grade 2007-2008 (n = 631)
Tenth Grade 2008-2009 (n = 715)
Demographic n % n % Economically 147 23.3% 201 28.1% Disadvantaged Students with Disabilities 63 10.0% 77 10.8% English Language Learners 38 6.0% 54 7.6% White 291 62.0% 445 62.2% African-American 80 12.7% 81 11.3% Hispanic 135 21.4% 166 23.2% Total 754 1024
Note: Students may count in more than one subgroup. Number of economically disadvantaged students increased in 2008-2009.
Descriptive statistics for the dependent variable for each academic year
are presented in Table 2.

56
Table 2 Descriptive Statistics for 10th Grade FCAT Reading Scale Scores Year n Min Max M SD 2007-08 631 100 500 332.98 53.462 2008-09 715 100 500 320.08 55.261
Note: Increase in 10th Grade population in 2008-2009.
The simple linear regression was performed. The model, F(1, 1344) =
18.83, p < 0.001, was indicated as significant at α = 0.05. However, the R-square
value of 0.013 indicated that academic year only explained 1.4% of the variability
in FCAT score. This result regarding variability was not surprising, as differences
in FCAT performance in any group of students can often be attributed to
demographic factors. It was worth noting that Table 1 displayed a portrait of two
demographically similar classes between years, though.
As the mean scores are reflected in Table 2, tenth grade students in 2007-
2008 (M = 332.98, s = 53.46) significantly out-performed their successors in terms
of growth in 2008-2009 (M = 320.08, s = 55.26). This result does not weigh in the
hypothesized direction, as it would be expected to have students in the 2008-2009
year out-perform their predecessors. The significant model can be written as
Reading Scale Score = 332.98 – 12.90*(Year), where 2008 is coded as 0 and 2009 is
coded as 1. The statistic indicated that the relationship was significant, but not in
the expected direction. Therefore, the hypothesis that student reading scores

57
would go up after the teachers participated in academic vocabulary professional
development was rejected.
Additionally, to measure whether the vocabulary instruction program had
a positive influence on student achievement in the form of increased FCAT
Reading scores, a one-way Analysis of Covariance (ANCOVA) analysis was
employed. The dependent variable was the Grade 10 Mean Scale Score, while the
independent variable was the membership in either the 2007-08 or 2008-09 10th
grade cohorts. Students must have had two complete years’ worth of scores to
have been included in this analysis.
The covariate, Grade 9 Mean Scale Score, was employed as a way to
control for prior year (ninth grade) FCAT performance among all participants in
the analysis. A one-way ANOVA measuring the arithmetic difference between
the average scale scores in ninth and tenth grades was not utilized since the
scales for this variable, despite having the same ranges (100-500) for each grade
level, are not equivalent from year to year. Instead, the analysis of covariance
was utilized to control for the starting point. Theoretically, if students in each
cohort showed similar tenth grade scores, while accounting for ninth grade
scores, it can be said with more certainty that there was no difference in
performance by either cohort.
The ANCOVA was first run with ninth grade scale score as a covariate. In
order for a variable to be considered a good covariate, it should not have a

58
significant interaction effect with the independent variable. In this case, ninth
grade scale score did interact significantly, so an alternative was sought.
Covariates, if not continuous, should be either binary or dummy-coded. The next
measure of prior performance with a reasonable degree of specificity was
achievement level (1-5) in ninth grade. This categorical variable was dummy-
coded (Level 5 was the reference group). Interactions were not significant, so
they were removed. The final ANCOVA analysis, located in Table 3, included
the independent variable of year and the covariate consisting of the dummy
variables that comprise ninth grade achievement level. It should be noted that
this ANCOVA did meet requirements for equality of variances in group, as
indicated by Levene’s test.
The covariate was highly significant with large eta values, collectively.
Year, which represents the cohort, was also highly significant – F (1, 1229) =
50.24, p < .001 – but had a much smaller eta value. When this value is squared, it
represents the variability of the dependent value (tenth grade scale score)
described by the independent variable. In this case, when prior performance is
accounted for, year only describes 4% of the variability in scores. Collectively,
when the covariate is included, 61% of the variability in 10th grade score is
described by the model.

59
Table 3 Analysis of Covariance for 10th Grade Mean Scale Score Analysis Source df F η p
Year 1 50.24 0.04 < .001**
Gr9 L1 1 1391.07 0.53 < .001**
Gr9 L2 1 736.45 0.38 < .001**
Gr9 L3 1 355.39 0.22 < .001**
Gr9 L4 1 98.6 0.07 < .001**
S within-group error 1229 (1101.52) Note. Value enclosed in parentheses represent mean square error. S = subjects. Prior year achievement level was covariate. R-squared value = .61. *p < .05. ** p < .01.
Since there was a significant result, it was important to determine the
direction in which the results were significant. Table 4 presents the covariate-
adjusted and the unadjusted means. These two sets of means were somewhat
close to each other, but showed that the 2007-2008 cohort clearly outperformed
the 2008-2009 cohort, even when controlling for prior test performance.

60
Table 4 Estimated Marginal Means for 10th Grade Mean Scale Score Analysis
Covariate-Adjusted Unadjusted
Cohort M SE M SE
2007-08 (n = 576) 335.6 1.38
336 2.18
2008-09 (n = 659) 322.1 1.29 321.8 2.04 Note. Covariates evaluated at Gr9 L1 = .12; Gr9 = .27; Gr9 L3 = .31; Gr9 L4 = .19
Research Question Two
To what extent, if any, do demographic subgroups of students benefit from teacher
participation in the academic vocabulary professional development program according to
change in FCAT reading scores?
To determine if teachers were better able to assist their students in raising
their reading performance during the school year when the teachers were
equipped with the full academic vocabulary knowledge than in the year before a
a multiple logistic regression was performed. This regression was most
appropriate when the dependent variable (in this case, whether or not the
students made learning gains in reading) was binary and there were multiple
independent variables. The variables and their coding are as follows: (1)
Learning Gains (Dependent): 0 = No Learning Gain Made, 1 = Learning Gain

61
Made, (2) Economically Disadvantaged Status: 0 = Not ED, 1 = ED, (3) Student
with Disabilities Status = 0 = No Disability, 1 = Disability,
(4) English-Language Learner Status: 0 = Not ELL, 1 = ELL, and (5) Ethnicity
(White: 0 = Not White, 1 = White; African-American: 0 = Not African-American,
1 = African-American; Hispanic: 0 = Not Hispanic, 1 = Hispanic; Other: no
variable). When the other three variables have a value of 0, it means student is
classified as “Other.”
Descriptive statistics regarding the population are located in Table 5. Note
that some of the population percentages (e.g., percentage of students classified as
economically disadvantaged) may not match the percentages in Table 3. In
Research Question 1, the population consisted of all students who took the test in
tenth grade in the given year. In this research question, a student must have had
two years’ worth of scores to demonstrate a measured learning gain.
Learning gains could be made in the following ways: (1) raising an
achievement level (Levels 1 through 5) from Grade 9 to Grade 10, (2) maintaining
the same reading level for students who were levels 3-5 in Grade 9, or (3) having
a developmental scale score gain greater than 77 points between Grade 9 and
Grade 10 for students who were considered Level 1 and 2 readers in the previous
year (ninth grade).
Students identified as students with disabilities (SWD) are those with any
disability code listed other than gifted. Students identified as English language

62
learners (ELL) are all students coded as LY (currently receiving ELL services) or
LF (currently in follow-up from the ELL program).

63
Table 5
Learning Gains by Demographic Type for 2007-2008 and 2008-2009 10th Grade Cohorts
Total Population Made Learning
Gains Demographic 2007-08 2008-09 2007-08 2008-09 Total School n 576 677 393 342 % 68.2% 50.5% Economically Disadvantaged n 122 183 76 72 % 21.2% 27.0% 62.3% 39.3% Students with Disabilities n 58 72 26 19 % 10.1% 10.6% 44.8% 26.4% English-Language Learners n 33 48 21 24 % 5.7% 7.1% 63.6% 50.0% White Students n 374 427 269 230 % 64.9% 63.1% 71.9% 53.9% African-American Students n 68 79 34 30 % 11.8% 11.7% 50.0% 38.0% Hispanic Students n 113 150 76 75 % 19.6% 22.2% 67.3% 50.0%
Note: Students may count in more than one cell. Percentages reflect portion of total population.

64
Five successive models were run. In each, the dependent variable was
whether a student made or did not make a learning gain on the tenth grade
Reading FCAT over their ninth grade score. The models consisted of the
following independent variables: (1) Model 1: Year, (2) Model 2: Year, ED, (3)
Model 3: Year, ED, SWD, (4) Model 4: Year, ED, SWD, ELL, and (5) Model 5:
Year, ED, SWD, ELL, Ethnicity.
Table 6 presents a summary of the various test statistics for each model to
illustrate the degree to which each additional factor helped better explain the
likelihood of a student making a learning gain.

65
Table 6 Summary Information for Logistic Regression Models
Model
1 Model
2 Model
3 Model
4 Model
5
New Variable Year ED SWD ELL Ethnicity Total Model χ2 40.66** 54.66** 86.05** 86.53** 99.80** Δ χ2 14.00** 31.40** 0.48 13.27** -2 Log 1658.6 1644.6 1613.2 1612.7 1599.5 Likelihood Nagelkerke R2 0.043 0.057 0.089 0.09 0.103 Classification % 58.7% 61.8% 63.4% 63.4% 63.8% Correct Hosmer- 1.048 0.552 0.468 0.789 Lemeshow Test Note: ED – economically disadvantaged, SWD – students with disabilities, ELL – English Language Learners.
The first variable presented in Table 6 is a Total Model χ2 which was an
overall indicator of whether the model was significant. This was comparable to
the F-test in a linear regression. Each full model in its entirety was significant.
Double asterisks indicate that the model was highly significant at p < 0.01. A
single asterisk would indicate the model was significant at p < 0.05. No asterisk
would indicate the absence of statistical significance.

66
Δ χ2 (delta chi-square or change in chi-square) shows the difference in chi-
square values between each successive model when each new independent
variable was added. Each new variable was a highly significant addition, with
the exception of the new Model 4 variable, ELL status. In the interest of
controlling for these demographics, it still remained in the model for Model 5.
The -2 Log Likelihood statistic measures how poorly a model predicts the
dependent variable. The smaller this variable is the better. The difference
between each of these values from model to model is essentially equivalent to the
Δ χ2. This value steadily shrinks, with, of course, the exception of Model 4.
Nagelkerke R2 has the same interpretation as the R2 value in a linear
regression, which represents the percentage of variability in the dependent
variable that can be explained by the independent variable(s). The higher this
value, the better the model is in explaining unexplained sources of variability. As
expected, Model 4 has the smallest amount of change (8.9% in Model 3 to 9.0% in
Model 4), but between Model 1 and Model 5, there is an overall increase in
variability explained of 6% (from 4.3% to 10.3%).
Classification % Correct shows the accuracy of the model in predicting the
value of the dependent variable. By default, trying to predict a binary variable
with no model at all would yield a 50% probability of being correct. The goal is
to move this percentage up above 50% as much as possible to warrant even
having a model at all. In this case, Model 1 provides a baseline of 58.7% as it is

67
important to specify the year in which students were in tenth grade, 2008 or 2009.
The percentage slowly moves up and by Model 5, the classification percentage is
raised 5.1% to 63.8%. These results are informational rather than evaluative as
the Δ χ2 provides a better indication if the variable made a difference.
The Hosmer-Lemeshow statistic tests for overall fit of the model. It is not
present unless there are more than two independent variables, which is why
there is no value for Model 1. A chi-square statistic is technically used for this
one, and an insignificant p-value indicates that the data fit the model well. In
other words, an insignificant result is desired, and each model indicates an
insignificant value for this test.
The results of Model 5 contain the predictor variables of year,
economically disadvantaged status, disability status, English-language learner
status, and ethnicity. As shown in Table 6, this full model as opposed to no
model at all was shown to be statistically significant – χ27 = 99.799, p < 0.001. The
model correctly classified 63.8% of the student as having made or not made a
learning gain.
Table 7 indicates the regression coefficient, Wald test, and odds ratio for
each of the predictors. Regression Coefficient is comparable to linear regression
in that there is an equation containing numbers and variable names.
The Wald Test (with p-value) is similar to an individual Chi-Square for
each variable in the model. In other words, when included in the model with all

68
of the other independent variables, does it show significance? In this case, year,
ED, and SWD were all significant, while ELL and the dummy variables for
ethnicity are not. These variables were kept in the model, however, due to their
particular interest in the research question.
Holding all of the other variables constant, the Odds Ratios shows how
much more likely it is for students to make a learning gain if they fall into the
category of this variable. For example, the odds ratio of ED is 0.715. Therefore,
holding all other independent variables constant, students who were on free or
reduced lunch, the factor that labels students as ED, were about 29% less likely to
make a learning gain as students who are not ED.
Holding ED, SWD, ELL, and ethnicity constant, tenth grade students in
2009 were 53% less likely to make learning gains than tenth grade students in
2008. Holding academic year, SWD, ELL, and ethnicity constant, ED students
were 29% less likely to make learning gains than students not classified as ED.
Holding academic year, ED, ELL, and ethnicity constant, students with
disabilities were 67% less likely to make learning gains than students without
disabilities. When holding academic year, ED, SWD, and ethnicity constant,
English-language learners were 13% more likely to make learning gains than
students who were English-proficient based upon the odds ratio.
Ethnicity was coded with “Other” as the reference group, so the odds are
all in comparison to this group. Holding academic year, ED, SWD, and ELL

69
status constant white students were 61% more likely to make learning gains than
students of “Other” ethnicities. African-American students were 18% less likely
to make learning gains than students of “Other” ethnicities. Hispanic students
were 50% more likely to make learning gains than students of “Other”
ethnicities.
Table 7 Logistic Regression Coefficients and Significance Tests
B Wald χ2 p Odds Ratio
Constant 0.598 3.244 0.072 1.818 Year -0.759 39.109 < 0.001 0.468 ED -0.336 4.487 0.034 0.715 SWD -1.107 30.537 < 0.001 0.33 ELL 0.12 0.205 0.651 1.128 Ethnicity White 0.48 2.074 0.15 1.616
African American -0.192 0.275 0.6 0.825
Hispanic -0.408 1.356 -0.244 1.504
Note. The model can be written as the following: P(Learning gain = 1) = exp(0.598 – 0.759*Year – 0.336*FRL – 1.107*SWD + 0.120*ELL + 0.480*White – 0.192*African-American – 0.408*Hispanic)/(1 + exp(0.598 – 0.759*Year – 0.336*ED – 1.107*SWD + 0.120*ELL + 0.480*White – 0.192*African-American – 0.408*Hispanic)) where p = the probability of a learning gain occurring. Exp represents the number e, the inverse of the natural log.

70
Additional analyses for this research question followed the same format as
those described above for Research Question One, but for specific subgroups.
Each population of adequate yearly progress (AYP) subgroups had a different
record of performance on which to focus. Therefore, several one-way ANCOVA
models were performed where, once again, tenth grade mean scale score was the
dependent and cohort year was the independent variable, with some measure of
prior year performance as the covariate. As with Research Question One, the first
choice of covariate was ninth grade mean scale score, but if that variable was
inappropriate among any subgroup due to interaction with the independent
variable, ninth grade achievement level was used instead.
In examining the performance of economically disadvantaged (ED)
students, there was interaction between cohort and ninth grade mean scale score,
so ninth grade achievement level was used (Table 6). The covariate was
significant, which justifies it remaining in the model. The independent variable
of cohort year was also significant – F(1, 291) = 17.35, p < .001. However, it only
described 6% of the variability in scores. The covariate described much more of
the variability, because the overall R-squared value was .51 (51% of the
variability in tenth grade scale score was described by a combination of the
independent variable and the covariate).

71
Table 8 Analysis of Covariance for 10th Grade Mean Scale Score Analysis - Economically Disadvantaged Source df F η p
Year 1 17.35 0.06 < .001**
Gr9 L1 1 111.28 0.28 < .001**
Gr9 L2 1 56.76 0.16 < .001**
Gr9 L3 1 25.36 0.08 < .001**
Gr9 L4 1 8.17 0.03 0.01**
S within-group error 291 (1324.99) Note. Value enclosed in parentheses represent mean square error. S = subjects. Prior year achievement level was covariate. R-squared value = .51. *p < .05. ** p < .01.
The means were significantly different, and show that among
economically disadvantaged students, the 2007-2008 cohort outperformed the
2008-2009 cohort (Table 9).
Table 9 Estimated Marginal Means for 10th Grade Mean Scale Score Analysis - Economically Disadvantaged Covariate-Adjusted Unadjusted
Cohort M SE M SE
2007-08 (n = 122) 314.4 3.32
313.93 4.6
2008-09 (n = 175) 296.3 2.77 296.65 3.84 Note. Covariates evaluated at Gr 9 L1 = .24; Gr 9 L2 = .35; Gr 9 L3 = .31; Gr 9 L4 = .08

72
The results of the analysis for students with disabilities (SWD) shows that
there was no significant interaction between cohort and ninth grade mean scale
score, so ninth grade mean scale score was usable as a covariate. The covariate
was significant, which justified it remaining in the model. The independent
variable of cohort year was also significant – F(1, 126) = 4.28, p = .04. However, it
only described 3% of the variability in scores. The covariate described much
more of the variability, because the overall R-squared value was .59 (59% of the
variability in 10th grade scale score was described by a combination of the
independent variable and the covariate) in Table 10.
Table 10 Analysis of Covariance for 10th Grade Mean Scale Score Analysis - Students with Disabilities Source df F η p
Year 1 4.28 0.03 .04*
Gr 9 Scale 1 176.58 0.58 < .001**
S within-group error 126 (1846.18) Note. Value enclosed in parentheses represent mean square error. S = subjects. Prior year achievement level was covariate. R-squared value = .59. *p < .05. ** p < .01.
The mean scores for students with disabilities are significantly different
(Table 11), and show that among students with disabilities, the 2007-2008 cohort
outperformed the 2008-2009 cohort.

73
Table 11 Estimated Marginal Means for 10th Grade Mean Scale Score Analysis - Students with Disabilities Covariate-Adjusted Unadjusted
Cohort M SE M SE
2007-08 (n = 58) 275.5 5.64
273.67 8.71
2008-09 (n = 71) 259.7 5.1 261.2 7.87 Note: Covariate evaluated at Prior Scale = 282.62.
There was no significant interaction between cohort and ninth grade mean
scale score of English language learners, so ninth grade mean scale score was
usable as a covariate (Table 12). The covariate was significant, which justifies it
remaining in the model. The independent variable of cohort year was also
significant – F(1, 78) =26.65, p = .001. This was a somewhat reasonable variable in
terms of descriptive value, as it described 13% of the variability in the dependent
variable. The covariate described much more of the variability, because the
overall R-squared value was .39 (39% of the variability in 10th grade scale score
was described by a combination of the independent variable and the covariate).

74
Table 12 Analysis of Covariance for 10th Grade Mean Scale Score Analysis – English Language Learners Source df F η p
Year 1 26.65 0.13 .001**
Gr 9 Scale 1 40.41 0.34 < .001**
S within-group error 78 (1511.68) Note. Value enclosed in parentheses represent mean square error. S = subjects. Prior year achievement level was covariate. R-squared value = .39. *p < .05. ** p < .01.
The means for this subgroup of students are significantly different (Table
13), and showed that among English Language Learners (ELL), the 2007-2008
cohort outperformed the 2008-2009 cohort.
Table 13 Estimated Marginal Means for 10th Grade Mean Scale Score Analysis – English Language Learners (ELL) Covariate-Adjusted Unadjusted
Cohort M SE M SE
2007-08 (n = 33) 301.6 6.78
299.39 8.29
2008-09 (n = 48) 271.4 5.62 272.92 6.88 Note. Covariate evaluated at Prior Scale = 281.43.
The data analysis for African-American students showed that there was no
significant interaction between cohort and ninth grade mean scale score, so ninth

75
grade mean scale score was usable as a covariate. The covariate was significant,
which justified it remaining in the model. The independent variable of cohort
year was not significant – F(1, 144) =0.24, p > .05. The variable of cohort year
described less than 1% of the variability in tenth grade score. The covariate
described much more of the variability, because the overall R-squared value was
.67 (67% of the variability in 10th grade scale score was described by a
combination of the independent variable and the covariate) shown in Table 14.
Table 14 Analysis of Covariance for 10th Grade Mean Scale Score Analysis – African-American Students Source df F η p
Year 1 0.24 0.002 .59
Gr 9 Scale 1 286.15 0.67 < .001**
S within-group error 144 (878.65) Note. Value enclosed in parentheses represent mean square error. S = subjects. Prior year achievement level was covariate. R-squared value = .67. *p < .05. ** p < .01.
As with previous subgroups of students, the means are not significantly
different and show that among African-American students, neither cohort
outperformed one another. It was also apparent in Table 15 that the use of the
covariate certainly adjusted the means.

76
Table 15 Estimated Marginal Means for 10th Grade Mean Scale Score Analysis – African-American Students Covariate-Adjusted Unadjusted
Cohort M SE M SE
2007-08 (n = 68) 308.5 3.60
312.54 6.19
2008-09 (n = 79) 305.9 3.34 302.42 5.74 Note. Covariate evaluated at Prior Scale = 315.46.
There was interaction between the Hispanic cohort and ninth grade mean
scale score, so ninth grade achievement level was used. The covariate was
significant among almost all dummy variable values, which justified it remaining
in the model. The independent variable of cohort year was also significant – F(1,
253) = 7.98, p < .001. However, it only described 3% (Table 16) of the variability
in scores. The covariate described much more of the variability, because the
overall R-squared value was .59 (59% of the variability in 10th grade scale score
was described by a combination of the independent variable and the covariate)

77
Table 16 Analysis of Covariance for 10th Grade Mean Scale Score Analysis – Hispanic Students Source df F η p
Year 1 7.98 0.03 < .001**
Gr9 L1 1 118.52 0.32 < .001**
Gr9 L2 1 49.03 0.16 < .001**
Gr9 L3 1 18.82 0.07 < .001**
Gr9 L4 1 1.20 0.27 0.27
S within-group error 253 (1076.77) Note. Value enclosed in parentheses represent mean square error. S = subjects. Prior year achievement level was covariate. R-squared value = .59. *p < .05. ** p < .01.
The means again were significantly different (Table 17), and showed that
among Hispanic students, the 2007-2008 cohort outperformed the 2008-09 cohort.
Table 17 Estimated Marginal Means for 10th Grade Mean Scale Score Analysis – Hispanic Students Covariate-Adjusted Unadjusted
Cohort M SE M SE
2007-08 (n = 113) 319.6 3.09
319.27 4.61
2008-09 (n = 146) 308.0 2.72 308.31 4.06 Note. Covariates evaluated at Gr9 L1 = .22; Gr9 L2 = .29; Gr9 L3 = .29; Gr9 L4 = .15

78
Research Question Three
To what extent do teachers report changes in their knowledge and implementation
of research-based instruction as a result of participation in professional development?
This question was addressed using a survey “Teacher Perceptions of
Vocabulary Instruction” (Appendix A) designed to gather teachers’ opinions on
this topic. A 12-question survey was delivered before and after instruction in the
vocabulary teaching method. All 12 non-demographic questions were positively
worded and measured via Likert scale ranging from 1 (strongly disagree) to 5
(strongly agree), with 3 representing neutral. It was intended to have all 12
questions combined to form a scale addressing the same construct, so Cronbach’s
Alpha was run first to address the reliability of this proposed scale. The test was
run in several iterations on the pilot run of the survey, removing items one by
one to increase the Cronbach’s Alpha value to its maximum. The final scale
included seven questions with a Cronbach’s Alpha value of α = 0.87.
Furthermore, a confirmatory factor analysis was run to ensure that this
scale indeed reflected a series of questions that belong together. The factor
analysis was used via Maximum Likelihood extraction with a Promax rotation
and a minimum eigenvalue of 1. Table 18 presents the factor loading.

79
Table 18 Factor Loading for Academic Vocabulary Survey Scale
Question Factor
Loading I know what the research says about teaching vocabulary to students. 0.719 Vocabulary instruction is an essential part of my curriculum. 0.769 Knowledge of vocabulary enables students to understand my textbook. 0.722 Students learn vocabulary best in context. 0.799 Before planning a lesson, I identify essential subject-specific terms. 0.783 I review essential vocabulary terms with students throughout the school year. 0.589 Students in my classes create symbols or graphic representations of words. 0.774
These seven questions, combined into a scale, had a minimum score of 7
(respondent answered all 1’s) and a maximum score of 35 (respondent answered
all 5’s). The higher the score on this dependent variable, the greater the skill and
utilization held by the teachers in the area of vocabulary instruction. Prior to
running the t-test, demographics were summarized for the respondents in the
pretest and posttest. The results of this summarization are provided in Tables 19
through 23 and indicate the number and percentage of responses.

80
Table 19 Teacher Demographics - Gender Pretest (n = 153) Posttest (n = 98) Demographic n % n % Male 44 28.8% 25 25.5% Female 109 71.2% 73 74.5%
Note: The change in number from 2008-2009 reflects a reduction in teaching positions due to budget cuts. Table 20 Teacher Demographics - Ethnicity Pretest (n = 151) Posttest (n = 96) Demographic n % n % African-American 11 7.3% 6 6.2% Caucasian 124 82.1% 80 83.3% Hispanic 8 5.3% 4 4.2% Asian 1 0.7% 0 0.0% Native American 1 0.7% 0 0.0% Other 6 4.0% 6 6.2%
Note: Some teachers chose not to respond. Number of 0-5 year experienced teachers from pretest to posttest reflected budget-related reduction in teaching positions.

81
Table 21 Teacher Demographics – Years of Experience Pretest (n = 151) Posttest (n = 99) Experience n % n % 0-5 Years 40 26.5% 17 17.2% 6-10 Years 23 15.2% 23 23.2% 11-15 Years 21 13.9% 13 13.1% 16-20 Years 21 13.9% 12 12.1% 21-25 Years 13 8.6% 10 10.1% 25+ Years 33 21.9% 24 24.2% Note: Number of teachers with 0-5 years experience reflected budget-related loss of teaching positions. Table 22 Teacher Demographics – Highest Degree Earned Pretest (n = 148) Posttest (n = 96) Degree n % n % Bachelor's 78 52.7% 52 54.2% Master's 62 41.9% 39 40.6% Specialist's 4 2.7% 2 2.1% Doctorate 4 2.7% 3 3.1%
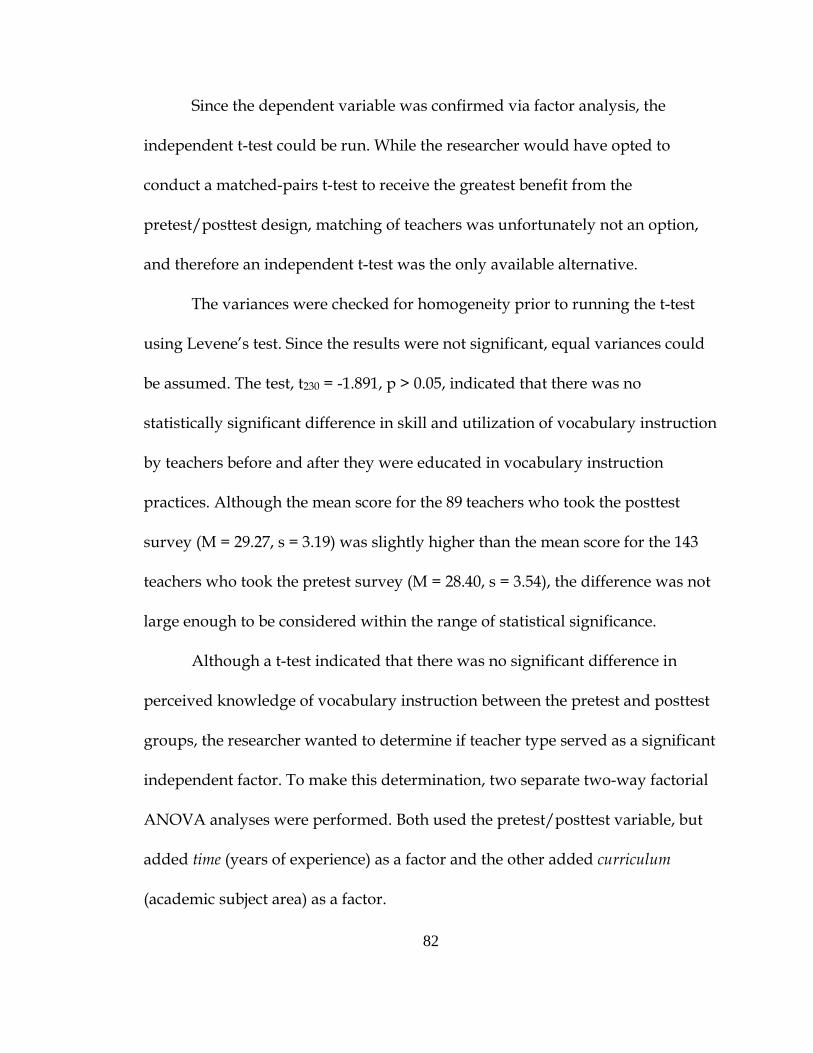
82
Since the dependent variable was confirmed via factor analysis, the
independent t-test could be run. While the researcher would have opted to
conduct a matched-pairs t-test to receive the greatest benefit from the
pretest/posttest design, matching of teachers was unfortunately not an option,
and therefore an independent t-test was the only available alternative.
The variances were checked for homogeneity prior to running the t-test
using Levene’s test. Since the results were not significant, equal variances could
be assumed. The test, t230 = -1.891, p > 0.05, indicated that there was no
statistically significant difference in skill and utilization of vocabulary instruction
by teachers before and after they were educated in vocabulary instruction
practices. Although the mean score for the 89 teachers who took the posttest
survey (M = 29.27, s = 3.19) was slightly higher than the mean score for the 143
teachers who took the pretest survey (M = 28.40, s = 3.54), the difference was not
large enough to be considered within the range of statistical significance.
Although a t-test indicated that there was no significant difference in
perceived knowledge of vocabulary instruction between the pretest and posttest
groups, the researcher wanted to determine if teacher type served as a significant
independent factor. To make this determination, two separate two-way factorial
ANOVA analyses were performed. Both used the pretest/posttest variable, but
added time (years of experience) as a factor and the other added curriculum
(academic subject area) as a factor.

83
A two-way factorial ANOVA was run to determine if pretest/posttest
status and/or curricular area taught yielded significant differences in mean score
on the survey used to measure perceived vocabulary knowledge. Levene’s Test
for Equality of Variances was run to determine if this test was appropriate, and
the insignificant result indicated that the equality of variances assumption was
met. In Table 24, the means and standard deviations for the survey was
separated by pretest and posttest status as well as whether the teacher is
responsible for academic core courses (Language Arts, Mathematics, Reading,
Science, Social Studies, Foreign Language) or an elective course (Technology,
Performing/Visual Arts, Physical Education/Health, or Other).
Table 23 Descriptive Statistics for Time x Curriculum Analysis
Pretest Posttest
n M SD n M SD
Core 108 28.76 3.57
76 29.37 3.17
Elective 33 27.18 3.07
13 28.69 3.43
Total 141 28.39 3.52 89 29.27 3.19
The Analysis of Variance results indicate that pretest/posttest status of
Time (experience) was not a significant predictor in survey score – F (1, 226) =
3.06, p > .05. Mean results did not significantly change between the pretest and

84
posttest. Only 1% of the variability in score could be described by this variable.
Additionally, curricular area did not yield significant results, either – F(1, 226) =
3.46, p > .05. Only 2% of the variability in score could be described by this
variable. Finally, there was no significant interaction effect between time and
curriculum – F(1, 226) = 0.55, p > .05. Less than 1% in the variability in score
could be described by the interaction between these two variables. The overall R2
value of 0.04 indicates that only 4% of the variability in score could be described
by the entire model.
Referring to Table 25, it can be noted that the elective teachers scored
slightly lower than the core teachers on both the pretest and posttest (lower
levels of knowledge), but each group did increase slightly from pretest to
posttest. These differences were not found to be statistically significant.
Table 24 Analysis of Variance for Time x Curriculum Analysis Source df F η p
Time (T) 1 3.06 0.01 0.08
Curriculum (C) 1 3.46 0.02 0.06
T x C 1 0.55 < .01 0.46
S within-group error 226 (2559.10) Note. Value enclosed in parentheses represents mean square error. S = subjects. R2 = .04. *p < .05. ** p < .01.

85
A two-way factorial ANOVA was run to determine if pretest/posttest
status and/or teaching experience yielded significant differences in mean score
on the survey used to measure perceived vocabulary knowledge. Levene’s Test
for Equality of Variances was run to determine if this test was appropriate, and
the insignificant result indicated that the equality of variances assumption was
met. Table 26 presents means and standard deviations for the survey separated
by pretest and posttest status as well as a teacher’s years of experience (0-10
years, 11-20 years, or 20+ years).
Table 25 Descriptive Statistics for Time x Experience Analysis Pre-Test Post-Test
n M SD n M SD
0-10 Yrs 57 28.18 3.08
38 29.5 2.43
11-20 Yrs 40 28.72 4.26
23 29.91 3.32
21+ Yrs 44 28.39 3.32
28 28.43 3.88
Total 141 28.4 3.51 89 29.27 3.19
The Analysis of Variance results indicate that pretest/posttest status
(time) was not a significant predictor in survey score – F (1, 224) = 3.32, p > .05.
Mean results did not significantly change between the pretest and posttest. Only
2% of the variability in score could be described by this variable. Additionally,

86
years of experience did not yield significant results, either – F(2, 224) = 1.14, p >
.05. Only 1% of the variability in score could be described by this variable.
Finally, there was no significant interaction effect between time and years of
experience – F(2, 224) = 0.78, p > .05. Only 1% in the variability in score could be
described by the interaction between these two variables. The overall R2 value of
0.03 indicates that only 3% of the variability in score could be described by the
entire model.
Referring to Table 27, it is shown that the 11-20 years of experience group
scored the highest in both the pretest and posttest compared to the other groups,
and the 21+ year experience group changed extremely little from pretest to
posttest. Each group did increase slightly from pretest to posttest, but these
differences were not statistically significant.
Table 26 Analysis of Variance for Time x Experience Analysis Source df F η p
Time (T) 1 3.32 0.02 0.07
Experience (E) 2 1.14 0.01 0.32
T x E 2 0.78 0.01 0.46
S within-group error 224 (11.51) Note. Value enclosed in parentheses represent mean square error. S = subjects. R2 = .03. *p < .05. ** p < .01.

87
Research Question Four
What relationship, if any, exists between FCAT reading score change and change
in knowledge and skill in vocabulary teaching reported by teachers?
Because no procedure could be identified which would provide a
statistical measurement between these two factors, inferences of the findings are
presented. The hypothesis of FCAT reading performance improvement after the
professional development treatment has been rejected. Other factors which may
have contributed to the drop in student performance in reading in spite of the
academic vocabulary program will be discussed in Chapter Five. The mean
score on the teacher posttest does reflect a gain, but not one of statistical
significance.
Teachers provided anecdotal evidence of a shift in instructional practice
by adding comments about their vocabulary instruction strategies on their
posttest surveys which include the following: vocabulary games, word
mapping, academic vocabulary sections in student notebooks, pictures and
diagrams of words, graphic organizers, students rating their understanding of
words, word walls, word games, and flash cards.
Additionally, observations of research-based vocabulary instruction was
observed and reported by administrators during informal classroom
walkthroughs. During the 2008-2009 school year, twenty-five groups of teachers
met together to discuss and develop their lists of essential academic vocabulary.

88
The educational significance of the professional development treatment will be
presented in Chapter Five.
Summary
Chapter Four presented the analyses of data used to address the four
research questions and included twenty-seven tables. The data indicate that
there was not a statistically significant improvement in student reading
performance after the professional development treatment in academic
vocabulary. Additionally, change in teacher knowledge and performance was
found, but not at a statistically significant level. Much of the lack of change
could be attributed to a larger number of students than in the previous year
coupled with a smaller number of teachers working under different conditions.

89
CHAPTER FIVE: SUMMARY, CONCLUSIONS, AND RECOMMENDATIONS
The purpose of this study was to determine if sophomore reading scores
on the Florida Comprehensive Assessment Test (FCAT) would improve after
implementation of a professional development program in academic vocabulary.
Additionally, teacher knowledge and practice in vocabulary instruction was
surveyed.
FCAT data were collected from the Florida Department of Education to
analyze student reading performance from 2008 to 2009. The researcher
developed a survey that was completed by all teachers at the study school. This
survey was given before and after the professional development treatment in
academic vocabulary.
Four research questions directed the focus of this study. Each research
question and results will be discussed along with conclusions and
recommendations for further study. Educational significance will be addressed
in addition to the statistical significance found.

90
Summary and Discussion of Findings
Research Question One: What relationship, if any, exists between the Florida
Comprehensive Assessment Test reading scores of sophomores from 2008 to 2009 after
teachers implemented the academic vocabulary program?
The relationship between reading scores of sophomores on the Florida
Comprehensive Assessment Test (FCAT) after teachers implemented a program
of academic vocabulary was found to be statistically significant. The
significance, however, was not in the expected direction. Mean FCAT reading
scores of sophomores went down from 2008 to 2009. This drop could be
attributed to intervening variables.
The first variable was related to a reduction in school funding which
resulted in the study school moving from a six-period school day to a seven-
period school day to adjust for the reduction in the number of teachers. During
the 2008 school year, students received 10,080 minutes of instruction in each
class. In the 2009 school year when the seven-period day was instituted,
students received 8,820 minutes of instruction per class. The net loss of
instructional time was 1,260 minutes or the equivalent of twenty-two days of
instruction per class when compared to the instructional time in the previous
school year. This loss of time could have been a factor in the drop in student
FCAT scores.

91
The reduction in instructional personnel coupled with an increase in
student population resulted in an increase in the student/teacher ratio. As
shown in Table 22, those teachers just beginning their careers suffered the largest
reduction in staff. Because of contractual protocol, teachers with tenure retained
their positions. Teachers who were newer to the school district and on annual
contract were not reappointed. Many of these teachers were the ones who had
been hired by the researcher and had been implementing the academic
vocabulary program with fidelity and enthusiasm.
Another contributing factor was a substantial change in school hours. As
another cost-saving measure, the high school day moved from 7:20 a.m. to 2:20
p.m. in 2008 to 9:30 a.m. to 4:30 p.m. in 2009. This controversial shift in time was
a source of frustration to students, teachers, and parents who tried to manage the
busy academic and extra-curricular schedule of a large comprehensive high
school with fewer daylight hours at the end of the school day.
Research Question Two: To what extent, if any, do demographic subgroups of
students benefit from teacher participation in the academic vocabulary professional
development program according to change in FCAT reading scores?
The reading performance of all identified subgroups of sophomore
students (white, African-American, Hispanic, economically disadvantaged,
English language learners, and students with disabilities) dropped as measured
92
by FCAT reading scores from 2008 to 2009. This drop in scores could be
explained by other outside factors which include the loss of instructional minutes
due to a move to a seven-period day, a change in the student/teacher ratio, and
the change in the hours of the school day.
Each subgroup of sophomore student scores for 2009 was lower than in
year 2008. The population of students considered economically disadvantaged
(ED) grew in 2009 from 21% of the total enrollment of the school to 27%.
Students from every other subgroup were represented in this growing category
which typically struggles with achievement. Two subgroups of students often
considered to be populations “at risk” presented interesting results.
The first subgroup of note was the performance of English language
learners (ELL) as indicated by the Odds Ratio in Model 4. This statistic showed
that this subgroup was 13% more likely to make a learning gain than the other
groups. This factor could also be attributed to the fact that these students began
at a low level, and the growth was not necessarily an indication of proficiency.
The FCAT reading scores of African-American students also were lower in
2009 than 2008. Although these scores were lower than the previous year, they
were not significantly different as shown in Table 14. This finding could be an
indication that the program of academic vocabulary helped these students
maintain their level of performance in the face of intervening variables that
negatively impacted student performance in the other subgroups.

93
Research Question Three: To what extent do teachers report changes in their
knowledge and implementation of research-based instruction as a result of participation
in professional development?
There was an obvious difference in the number of teachers who completed
the pretest (153) and the number who completed the posttest (98). The difference
is attributed to two factors: (1) a reduction in the number of teachers (thirty-five)
because of budget cuts, and (2) a number of teachers who returned their surveys
after the requested submission date and too late to be included in the data
tabulation, and (3) fewer inexperienced teachers with more to learn.
Though the change from pretest to posttest was not statistically
significant, there was a change in the expected direction in teacher knowledge
and instructional performance as reported on their surveys. Anecdotal evidence
provided by teacher comments on their surveys support that teacher
instructional practice in terms of vocabulary instruction changed toward
research-based methods. Teacher comments on the pretest survey indicated wide
use of the practice of having students memorize dictionary definitions of words
chosen on the basis of their appearance in text.
Comments on the posttest surveys supported the use of the research-
based method in the classrooms of the study school. Although not quantified,
administrative team members reported observations of teacher use of the

94
academic vocabulary terms and the utilization of the research-based instructional
method of vocabulary instruction.
Research Question Four: What relationship, if any, exists between FCAT reading
score change and change in knowledge and skill in vocabulary teaching reported by
teachers?
Though the answer to this question was not quantifiable, anecdotal
evidence supported a change in teacher knowledge and practice that was
educationally significant. Through observation of teacher instructional practice
and from the inclusion of comments on the posttest survey, the research-based
method of vocabulary instruction continued to be utilized in the study school.
During the 2008-2009 school year, twenty-five teacher groups met to develop
their lists of essential academic vocabulary terms to use in their curriculum areas.
The process of collaboration among these teacher groups influenced the
professional relationships within the study school that continues and applies to
other professional issues.
Conclusions
Though the academic vocabulary program presented at the study school
did not produce the expected results in student FCAT scores, several outside
factors which could have negatively impacted student performance in the 2009

95
school year were presented. The reading performance of sophomore students as
measured by FCAT in 2008 to 2009 after the professional development program
in academic vocabulary indicates a drop in reading proficiency between the two
groups of sophomore students. The demographics of the two groups of
sophomores whose scores were compared were well matched by subgroup
category; however, no consideration was given to matching the incoming
reading proficiency of the two groups of sophomore students.
Furthermore, the study school tenth grade students in 2008 had a high
level of reading proficiency. Therefore, the reduction may be attributed to
regression toward the mean. Even with this regression, the students were high
performing as an overall group. It is more difficult to show improvement with
students who are already high performing than with low performing students.
The school’s population may have made it more difficult to show positive
change.
All members of the staff, not just core curriculum teachers, were included
in the research-based training in vocabulary instruction. All members of the
administrative team, including teacher curriculum leaders, had roles and
responsibilities in the implementation of the academic vocabulary program. This
provided opportunities for each member of the administration to perform as an
instructional leader and staff developer.

96
Every teacher in the school was included in the vocabulary training; not
only those involved in preparing students for FCAT. This school-wide approach
helped support the academic focus of every course offered at the study school,
not just the major curricular subjects of English, mathematics, science, social
studies, and foreign language.
The additional benefit to the introduction of the academic vocabulary
program at the study school was the change in the culture of the school.
Teachers have continued to plan instruction together rather than in isolation, and
the time provided for these planning sessions has become standard practice at
this school. Additionally, professional working relations have continued to
develop among the teaching staff with curriculum, instruction, and assessment
serving as the foundation for department, course, or team meetings.
This program also afforded teacher leaders the opportunity to take on
additional responsibilities for advancing the educational mission of the school
while growing in their capacity for leadership. These responsibilities included
facilitating the curriculum meetings to develop individual course academic
vocabulary lists as well as serving as moderators for the discussions of which
words to include or exclude. Additionally, teacher leaders worked with teachers
in their curriculum areas to ensure that the lists provided a logical scope and
sequence of the academic vocabulary terms. The responsibility for the
publication and updating of the lists of academic vocabulary terms by course
97
was shared by the teacher curriculum leaders and the administrator for each
curricular area.
Each assistant principal in the study school was responsible for
curriculum areas or departments, and it was the responsibility of each assistant
principal to ensure that teachers were developing the requisite lists of
critical/essential terms for each course within each course and then sequenced
within the department. Assistant principals also observed classrooms to ensure
that the research-based vocabulary instruction strategies were being
implemented with fidelity. These visits provided assistant principals
instructional coaching opportunities as part of their development as instructional
leaders.
A core belief of the researcher, who was also the principal of the study
school, was that students should be able to speak, read, and write about the
specifics of the courses taken. The program of staff development provided all
teachers with vocabulary strategies to advance the skills of speaking, reading,
and writing across the curriculum.
Because of changes in student and teacher population size, as well as
significant changes in the instructional day, no conclusion should be drawn that
vocabulary professional development was not helpful in improving reading
comprehension. Vocabulary instruction, especially the research-based method

98
presented, was essential, but perhaps not sufficient alone to improve reading
comprehension as measured by FCAT.
Though the results of the sophomore reading performance were not as
hoped for, the program of academic vocabulary continued at the study school. It
provided the point of departure in department meetings in determining what
was essential for student mastery in each course and subject area. The lists of
critical/essential academic vocabulary terms remained a living document at the
school and was revised and updated as state curriculum standards were revised
and updated by the Florida Department of Education.
Of educational significance was the overall benefit to the study school,
FCAT reading scores notwithstanding. Through the process of identifying
essential terms and then the implementation of the research-based vocabulary
instruction process, teacher collegiality emerged. Rather than working in
isolation, teacher groups developed into planning teams to design instructional
focus calendars for each subject area. The notion of high school teachers meeting
to plan together became part of the culture of the study school. This shared
ownership of the curriculum elevated the instructional practice of all teachers in
the school. The end result was that the students in the school reaped the benefits
of curriculum and instructional practices that were well thought out and
strategically implemented.

99
The author believes that the research-based vocabulary instruction
program that was been implemented at the study school was a successful
addition to the instructional practice of all the teachers. Even though FCAT
reading scores during the implementation phase did not reflect a positive
change, other contributing factors intervened negatively. Reading scores of
sophomores dropped in 2009 from 2008, but their performance remained strong
enough for the study school to be considered a high-performing school by the
Florida Department of Education. Though many secondary teachers planned
their lessons in isolation, the development of the academic vocabulary lists for
each course provided an initial focus for teachers who teach the same course to
work and plan together for the academic success of their students.
Recommendations for Further Research
Results of this study and the findings of related literature demonstrate
that it is worthwhile to continue the program of academic vocabulary in the
study school. Recommendations for further research are provided as follows:
1. The study should be replicated with tighter controls on the data
including using matched groups of student scores that are not only
demographically comparable, but also comparable in incoming
reading proficiency level.

100
2. The study should be replicated at a time in which no major
contributing factor could skew the results of the analysis (such a loss of
instructional time from one school year to the next).
3. To look at teacher change, it would be useful to replicate the study
with matched teacher pretests and posttests which was not done for
this study (for the sake of anonymity since the researcher was the
principal of the study school). This would allow for a clearer analysis
of change in knowledge and practice reported by the teachers.
4. While looking at student score change and teacher practice change
were interesting, this study could be replicated and expanded by
matching teachers with students. This would allow a more thorough
comparison of teacher-reported knowledge and practice with student
performance after the professional development program in
vocabulary instruction.
5. A study that monitors teacher instructional practice through collection
of classroom walkthrough data could provide more than anecdotal
evidence of instructional change.
6. Because there was an indication this program made a difference with
students typically labeled “at risk,” this study should be replicated in
schools with a large at-risk student population.

101
7. This study should be replicated using the lists of academic vocabulary
terms for each course as a pretest/posttest to assess student learning
rather than FCAT reading scores.
8. This study should be replicated at a school where the staff developer is
someone other than the principal who assess instructional personnel to
determine if fidelity to the program is affected by the nature of the
professional relationship between teacher and presenter.
Summary
Chapter Five has presented the findings of the data analysis described in
Chapter Four. Conclusions, recommendations, and recommendations for further
research were also presented. The results of this study may be helpful to school
leaders who are interested in working with teachers on instructional practices in
vocabulary instruction. It would also be worth considering as a vehicle to
improve teacher collegiality and curriculum planning.

102
APPENDIX A: TEACHER PERCEPTIONS OF VOCABULARY INSTRUCTION

103
This instrument is not to be reproduced in part nor entirety without written permission of the author, ©2009, Margaret McMillen.

104
APPENDIX B: ACADEMIC VOCABULARY TERMS

105
Foreign Language Academic Vocabulary Terms
Spanish I
vocabulary adverb cognate direct object noun indirect object gender culture number formal agreement informal/familiar subject stem pronoun stem-changing verb verb comparative infinitive ordinal conjugate personal a tense possession adjective interrogative definite article affirmative indefinite article imperative/command
Spanish II
present indicative imperfect preterite context present progressive compound present participle superlative reflexive demonstrative irregular verbs negative/negation past participle preposition

106
Spanish III
subjunctive conditional impersonal past progressive conjuction future clause reciprocal
Spanish IV
present perfect future perfect pluperfect/past perfect conditional perfect passive/passive voice
French I
subject negation verb inversion noun definite articles adjective indefinite articles adverb possessive adjectives infinitive agreement conjugation preposition stem imperative ending cognate helping verb formal vs. familiar regular verb interrogative expressions irregular verb partitive liaison stress pronouns tense contraction 3rd person invariable pronoun indirect object gender direct object

107
French III & IV
le passé composé une république l'imparfait un siècle agreement le roi order of pronouns 1066 le futur la Guerre de Cent Ans le conditionnel la Normandie reflexive verbs la Provence le passé simple gothique the subjunctive mood les châteaux relative pronounds les cathédrales compound tenses la Renaissance "if" clauses Versailles imperative les arrondissements une fable la poésie la Gaule le romantisme une province une pièce francophone un roman le Moyen Age le 20e siècle la monarchie
Language Arts Academic Vocabulary Terms
English I
alliteration main idea allusions metaphor/simile analysis organizational patterns author's purpose persuasive devices cause and effect relationship plagiarism character development plot development

108
comparison/contrast point of view conclusions (commentary) pun conflict resolution reference/research vocabulary diction (word choice) relevant supporting details epic satire foreshadowing setting grammar vocabulary Shakespeare Homer sonnet Homeric simile theme idiom thesis imagery tone inferences works cited page irony Write Traits
English II
allegory lyric poem allusion MLA format anecdote ode assonance onomatopoeia author's bias parable consonance plagiarism connotation point of view context rhetorical question conventions sarcasm couplet soliloquy credible sources symbolism denotation thesis statement figurative language theme genre tone Holocaust Write Traits irony

109
English II Gifted
expository analysis perusasive tragedy descriptive comedy rhetoric modernism diction existentialism syntax history play sentence fragment v. run on Globe theater/Wooden O clause genre parts of speech TP-CASTT method of poetic verbals - gerunds, participles, analysis infinitives surrealism figurative language science fiction Bloom's taxonomy - non-fiction comprehension to synthesis lyric v. narrative poetry metaphor and simile
English III
analogy Romanticism connotative meaning Fireside Poets emotional appeal/pathos Irving literary criticism/analysis Realism nuance Crane literary theme Douglas foil naturalism paradox trancendentalism conceit Emerson extended metaphor Thoreau phrases/clauses modernism symbolism Hemingway Puritans Faulkner Southern Planters Fitzgerald American Renaissance Harlem Renaissance

110
Hawthorne Hughes Melville Johnson Poe McKay
English IV
allusion diction alliteration connotation assonance antithesis consonance tone critical perspectives (archetypal, imagery historical, feminist, cultural) aside epic atmosphere ballad frame story couplet heroic types irony (verbal, situational, dramatic) characterization (direct, indirect, romance static character, dynamic paradox character, round character) comic relief figuative language soliloquy satire parody literary analysis parallel structure
AP Literature & Composition
synthesize sonnet forms - Petrarchan, analyze Elizabethan, Spenserian trope point of view/perspective motif scansion verisimilitude lyric poetry metaphor comparison/contrast diction personification alliteration pathos, logos, ethos TP-CASTT existentialism

111
"assess the validity" naturalism inventiveness neoclassicism depth of understanding the unreliable narrator style/voice symbolism exposition allusion narrative
Journalism
active voice verb gray space angle grid system (also called a ascender block system) attribution gutter authority headline balance hot foil stamping baseline ID beat impartial black space index bleed integrity body copy internal spacing (also called body type internal margin) boldface inverted pyramid butt isolated element byline justify camera ready (photo ready) kerning COB (cut out background, also kicker called knockout) label head caption (also called cutline) ladder diagram center of interest layer CMYK layout colophon lead-in columnar design leading (pronounced ledding) conflict of interest logo contrast masthead copy matte finish copy alignment mini-mag crop PDF

112
cut-off test reverse type deadline rule line deboss rule of thirds descender sans serif die cut secondary story (also called display type a sidebar) divider (also known as division serif page) signature dominance silk screen downstyle (also called sentence slammer style) spin-off phrase dummy spine duotone spot color editorialize spread emboss style endsheet subhead (also called a deck) ethics theme external margin tip-in eyeline title page feature tool line flat(also called a multiple) trapped white space folio trim size font typography four-color process white space ghosted photo widow gill clear wraparound (also called a graphics textwrap)
Reading
alliteration idiom analogy imagery assessment irony author's bias italics author's purpose main idea or essential message author's tone making an inference bold print nonfiction

113
break in text phonics cause & effect relationship plot development character development point of view comparison & contrast pre/during/post reading comprehension strategies conflict & resolution prediction connecting text to other text(s) preview connecting text to self prior knowledge connecting text to world reference materials content rubric context clues schema drawing conclusions sequence of events fact & opinion setting fiction stamina figurative language summary flashback supporting details fluency text genre text feature hyperbole theme fixators vascular flaccid ventral
Mathematics Academic Vocabulary Terms
Algebra I
algebraic function matrix addition base matrix subtraction binary system monomial Cartesian coordinates multiply radical expressions compound event natural number direct function negative exponent direct measure number subsystem divide radical expressions polynomial addition equivalent forms of equations polynomial division

114
equivalent forms of inequalities polynomial function exponent polynomial multiplication factorial notation polynomial subtraction fraction inversion radical expression independent trials reciprocal matrix systems of inequalities
Geometry
angle of depression proof paragraph arc protractor central angle radius chord reflection in space circle without center right triangle geometry cosine rotation in plane dilation of object in a plane surface area cone geometric function surface area cylinder indirect measure surface area sphere isometry theorem line segment theorem direct proof line segment congruence theorem indirect proof line segment similarity three-dimensional point of tangency vector postulate vector addition
Algebra II
absolute error logarithm absolute function logarithmic function asymptote of function matrix equation complex number matrix inversion compound interest matrix multiplication correlation monitor progress of problem decibel natural log

115
density rational function domain of function recursive equation exponential function Richter Scale Fibonacci sequence series function composition sigma notation imaginary number step function inverse function total distance graph log function vertex edge graph
Analytic Geometry
Polynomial function half-life quadratic compound interest cubic conic section quartic midpoint formula quintic distance formula Factor Theorem circle Fundamental Theorem of ellipse Algebra hyperbola Remainder Theorem parabola synthetic division degenerate conic long division standard form zeros of a function general form roots of a polynomial focus quadratic formula foci complete the square directrix end behavior vertex x-intercepts vertices factors conjugate axis vertical asymptote transverse axis horizontal asymptote major axis oblique asymptote minor axis removable discontinuity eccentricity non-removable discontinuity axis of symmetry rational function center exponential decay parametric equation exponential growth parameter

116
Trigonometry
Angles: range initial side amplitude terminal side period standard position phase shift Coterminal angles vertical shift Radian Measure asymptotes Degree Measure inverse trigonometric function revolution trigonometric ratios reference angle right angle trigonometry Unit Circle trigonometric identities vectors pythagorean identities magnitude quotient identities component reciprocal identities resultant half-angle formula trigonometric functions double angle formula sine polar coordinates cosine polar form of complex number tangent Heron's formula secant DeMoivre's Theorem cosecant Law of Sines cotangent Law of Cosines domain
Pre-Calculus
acceleration polar coordinates circular function polynomial solution by classes of functions sign change curve fitting median method polynomial solution successive finite graph precision of estimation force relative error formal mathematical induction sinusoidal function

117
global/local behavior speed inflection trigonometric relation limit truth table proof maximum of function univariate data minimum of function univariate distribution parameter variance parameter estimate vector addition/ parametric equation multiplication/division periodic function velocity phase shift
Statistics
Bivariate data transformation parallel box plot Bivariate distribution population Categorical data probability distribution continuity probability random sampling technique distribution recurrence relationship control group regression coefficient discrete probability representativeness of sample discrete probability distribution sample statistic empirical verification sampling distribution experimental design smallest set of rules experimental probability spurious correlation law of large numbers standard deviation law of probability statistical experiment Monte Carlo simulation statistical regression normal curve treatment group
AP Calculus AB
acceleration indeterminate form area integral concavity limit continuity optimization problems

118
derivative maximum of a function differentials minimum of a function fundamental theorem of point of inflection Calculus rate of change Functions: related rates Algebraic Riemann Sum Transcendental (exponential, velocity logarithmic, & trigonometric) volume
AP Calculus BC
acceleration optimization problems area polar equations concavity ratio test continuity root test derivative sequences differentials vector fundamental theorem of work Calculus maximum of a function arc length minimum of a function convergent point of inflection divergent rate of change improper integrals related rates integral test Riemann Sum parametric equations velocity partial fractions volume Functions: series: Algebraic alternating Transcendental (exponential, P-series logarithmic, & trigonometric) power indeterminate form Taylor integral Maclaurin

119
Science Academic Vocabulary Terms
Anatomy and Physiology
alimentary foramen antagonist gonads auditory gastration autonomic histology brachial homologous capillary hypotonic cleavage inguinal cortex lumen cranial mastication cutaneous metabolism defacation mictruition digestion occipital distal olfaction dorsal otic efferent parietal epidermis prone excretion reflex expiration renal fibrillation sphincter fissure systemic fixators vascular flaccid ventral
Physics Honors
displacement torque velocity Coulumb's Law acceleration electric field free-fall charge vector magnetic field

120
scalar magnetic flux projectile motion simple harmonic motion force period gravitational force amplitude free-body diagram wavelength inertia frequency friction transverse wave centripetal force longitudinal wave work Doppler Effect kinetic energy pitch potential energy superposition power standing wave conservative force resonance non-conservative force diffraction momentum refraction impulse photoelectric effect conservation laws
AP Physics AB
displacement isothermal velocity isochoric acceleration isobaric free-fall latent heat vector Coulomb's Law scalar electric field projectile motion charge force magnetic field gravitational force magnetic flux free-body diagram simple harmonic motion inertia period friction amplitude centripetal force wavelength work frequency kinetic energy transverse wave potential energy longitudinal wave power Doppler Effect

121
conservative force pitch non-conservative force superposition momentum standing wave impulse resonance conservation laws diffraction torque refraction adiabatic photoelectric effect
Physics C
displacement torque velocity Coulumb's Law acceleration electric field free-fall charge vector magnetic field scalar magnetic flux projectile motion simple harmonic motion force period gravitational force amplitude free-body design wavelength inertia frequency friction transverse wave centripetal force longitudinal wave work Doppler Effect kinetic energy pitch potential energy superposition power standing wave conservative force resonance non-conservative force diffraction momentum refraction impulse photoelectric effect conservation laws

122
AP Environmental Science
adaption environmental degradation affluenza eutrophication biodiversity exponential growth biomagnifications global warming biome pollution carrying capacity (K) recycling developed country renewable resource developing country rule of 70 ecological diversity species diversity ecological footprint sustainability ecology tragedy of the commons environment wildlife management
Social Studies Academic Vocabulary Terms
American History
George Washington migrations self-determination imperialism Thomas Jefferson Theodore Roosevelt (American) Revolution yellow journalism James Madison nationalism Constitution reparations Bill of Rights Harlem Renaissance Andrew Jackson Great Depression slavery Franklin Delano Roosevelt sectionalism appeasement abolition/emancipation propaganda Abraham Lincoln Cold War Reconstruction Red Scare suffrage civil rights

123
Manifest Destiny civil disobedience Native Americans Martin Luther King immigration Brown v. Board of Education industrialization space race labor unions Watergate Social Darwinism Vietnam War
World History
apartheid mercantilism appeasement naturalism aristocracy oligarchy atheism parliamentary government assimilation proletariat autocracy propaganda bureaucracy reformation movement capitalism renaissance city-state republic civilization scientific revolution Communism separation of powers commercial revolution socialism conservatism sovereignty constitutional government technology coup d'etat theocracy culture totalitarian democracy Gautama Budha dictator Confucius divine rights Jesus dynasty Julius Caesar ethnic cleansing Mohammed empire Karl Marx enlightenment Mohammed fascism Michelangelo feudalism Leonardo da Vinci

124
genocide Joan of Arc guerilla warfare Socrates Holocaust Gandhi humanism Columbus imperialism Cleopatra industrialism Genghis Khan liberalism

125
APPENDIX C: INSTITUTIONAL REVIEW BOARD

126
sert IRB Approval Letter here

127
APPENDIX D: PERMISSION TO USE DATA

128

129
LIST OF REFERENCES
Apthorp, H. S. (2006). Effects of a supplemental vocabulary program in third- grade reading/language arts. Journal of Educational Research, 100 (2), 67-79.
Armstrong, J. C. (2000). The integration of reading vocabulary techniques with
scientific terminology in a sixth-grade classroom. Dissertation Abstracts International, 61 (03), 602.
Biemiller, A. (2003). Vocabulary: Needed if more children are to read well. Reading Psychology, 24, 323-35.
Bromley, K. (2007). Nine things every teacher should know
about words and vocabulary instruction. Journal of Adolescent and Adult Literacy, 50, 528-537.
Cawelti, G. (1987, February 21). How effective instructional leaders get results.
(ERIC Document Reproduction Service No. ED328935) Retrieved September 10, 2009, from ERIC database.
Church, A. (2009, May 1). The Principal Factor. Library Media Connection, 27(6),
40-41. Clark, D. B. (1984). A comparison of the effects of three methods of vocabulary
instruction on vocabulary acquisition and reading comprehension. Dissertation Abstracts International, 45(08), 2462A.
Cregan, A. M. (1989). Depth of vocabulary knowledge and content area reading. Dissertation Abstracts International, 51(03), 804A. Cross, N. (2008, November 1). The Power of Expectations. Principal Leadership,
9(3), 24-28. Doherty, R. W., & Hilberg, R. S. (2007). Standards for effective pedagogy,
classroom organization, English proficiency, and student achievement. Journal of Educational Research, 101(1), 24-34.
DuFour, R. (2002). In the right context. Journal of Staff Development, 22 (1), 14-17.

130
DuFour, R., & Berkey, T. (1995, September 1). The Principal as Staff Developer. Journal of Staff Development, 16(4), 2-6.
Florida Department of Education. (2005). FCAT handbook – A resource for
Educators. Retrieved September 9, 2009, from the Florida Department of Education Web site: http://fcat.fldoe.org/handbk/covermemofcat.pdf.
Flynn, J. R. (2007). Solving the IQ puzzle. Scientific American Mind, 18(5), 52-58. Frey, N., & Fisher, D. (2009, February 1). The Release of Learning. Principal
Leadership, 9(6), 18-22. Fullan, M. (2004). Facilitator's Guide to the Moral Imperative of School Leadership. Thousand Oaks, CA: Corwin Press. Garet, M., Porter, A. C., Desmone, L., Birman, B. F., & Yoon, K. S. (2001). What
makes professional development effective? Results from a national sample of teachers. American Educational Research Journal, 38(4), 115-145.
Graczewski, C., Knudson, J., & Holtzman, D. (2009). Instructional Leadership in
Practice: What Does It Look Like, and What Influence Does It Have? Journal of Education for Students Placed at Risk (JESPAR), 14(1), 72-96.
Graham, L. J. (1985). The effects of vocabulary instruction on text comprehension. Dissertation Abstracts International, 46(06), 1576A. Grimason-Loeventhal, G. (1990). A comparison of the effects of different methods
of vocabulary instruction on vocabulary knowledge and reading comprehension. Dissertation Abstracts International, 51(103), 794A.
Gutkoska, J. P. (1967). The influence of the
“Supplemental Vocabulary Program” on the improvement of reading vocabulary. Dissertation Abstracts International, 28(07), 2441A.
Hallinger, P., & Heck, R.H. (1996). Reassessing the principal’s role in school
effectiveness: A review of empirical research, 1980-1995. Educational Administration Quarterly, 32(1), 5-44.
Harrison, B., & Rappaport, A. (2007). Rap and learn. Writing, 29(4), 4. Hirsch, E. D., Jr. (2006). The Knowledge Deficit: Closing the Shocking Education Gap for American Children. Boston: Houghton Mifflin.

131
Jenkins, B. (2009, January 1). What It Takes to Be an Instructional Leader.
Principal, 88(3), 34-37. Kenny, J. (2004). Keeping it real. Times Educational Supplement, 4574, 8. LaBrosse, P. (2007). Analysis of the effect of specific vocabulary instruction on
high school chemistry students’ knowledge and understanding. Dissertation Abstracts International, 68(02),167A.
LaPiana, N. M. (2001). Testing the effectiveness of vocabulary instruction. Masters Abstracts International, 39(07), 102A. Leithwood, K., & Jantzi, D. (2000). The effects of transformation leadership on
student engagement with school. Journal of Educational Administration, 38(2), 112-129.
Leithwood, K., Louis, K.S., Anderson, S. & Wahlstrom, K. (2004). How
leadership influences student learning. Center for Applied Research and Educational Improvement and Ontario Institute for Studies in Education.
Mansaray, H. A. (1997). The effects of vocabulary instruction of English-as-a-
Second Language and bilingual learners. Dissertation Abstracts International, 58(03), 801A.
Marmolejo, A. (1990). The effects of vocabulary instruction with poor readers:
a meta-analysis. Dissertation Abstracts International, 51(03), 807A. Martin, A. P. (2004). The impact of an academic language curriculum on high school sophomores. Dissertation Abstracts International, 65(06), 2125A. Marzano, R. J., (2003). What works in schools: translating research into action.
Alexandria, VA: Association for Supervision and Curriculum Development.
Marzano, R. J., (2004). Building background knowledge for academic achievement:
research on what works in schools. Alexandria, VA: Association for Supervision and Curriculum Development.
Marzano, R.J., (2009). Six steps to better vocabulary instruction. Educational
Leadership. September 2009 (67), 1. ASCD Alexandria: VA.

132
Marzano, R. J., & Pickering, D. J. (2005). Building academic vocabulary. Alexandria, VA: Association of Supervision and Curriculum Development.
Marzano, R.J., Waters, T., & McNulty, B. (2005). School leadership that works:
from research to results. Alexandria, VA: Association for Supervision and Curriculum Development.
Miller, S. S. (2006). How teachers spend instructional time in the primary grades
and how this influences student achievement. The University of Utah. 67/10.
Moseley, D. S. (2004). Vocabulary instruction and its effects on writing quality.
Dissertation Abstracts International, 64(08), 2767A.
Postell, L. S. (2006). A comparison of two vocabulary instructional methods for postsecondary learning support students. Dissertation Abstracts International, 66(07), 2514A.
No Child Left Behind Act, P.L. 107-110 (2001). Powell, G. (1980, December). A meta-analysis of the effects of “imposed” and
“induced” imagery upon word recall. Paper presented at the annual meeting of the National Reading Conference, San Diego, CA.
Robinson, V.M.J., Lloyd, C.A., & Rowe, K.J. (2008). The impact of leadership in
student outcomes: an analysis of the differential effects of leadership types. Educational Administration Quarterly. Vol. 44 (5), December 2008, 635-674.
Rountree, D. E. K. (2006). Correlation analysis between reading level and text
vocabulary, and overall comprehension. Dissertation Abstracts International, 67(09), 122A.
Shin, F. (2004). Books, not direct instruction are the key to vocabulary development. Library Media Connection. 22, 20-1. Silverman, R. (2005). Teaching words to young children: investigating the
effectiveness of early vocabulary instruction during read-alouds. Dissertation Abstracts International, 66 (05), 1695.

133
Taliaferro, C. M. A. (2004). Vocabulary instruction for the secondary student. Masters Abstracts International, 43(02), 389. Taylor, D., Mraz, M., Nichols, W., Rickelman, R., & Wood, K. (2009, April 1).
Using Explicit Instruction to Promote Vocabulary Learning for Struggling Readers. Reading & Writing Quarterly, 25, 205-220.
Terry, M.T. (1996). The principal and instructional leadership. National Council of Professors of Educational Administration. Austin, TX: Texas A & M University. Tredwell, C. T. (2007). The Impact of peer tutoring sessions on oral language
vocabulary in early childhood inclusive settings. Dissertation Abstracts International, 61 (04), 156.
Wang, Y. (2005). Approaches to enhancing vocabulary learning in an EFL
context: A comparative study. Masters Abstract International, 44(01), 45A.
Ward, H. (2006). Goodbye computer chips. Times Educational Supplement. 4686, 4. Weglinsky, H. (2000). How teachers matter: bringing the classroom back into discussions of teacher quality. Princeton, NJ: Educational Testing Service. Williamson, R. (1995, January 1). Leadership: A Focus on Leadership for Student
Achievement. Schools in the Middle, 5, 17-22.
Winters, R. (2009, May 1). Interactive Frames for Vocabulary Growth and Word Consciousness. Reading Teacher, 62(8), 685-690.
Youngs, R. R., IV. (1980). A study of selected vocabulary emphasis and concomitant achievement scores of high school marketing students. Dissertation Abstracts International, 420(01), 64A.