The impac oft welfar one th economie c status of ...library.bsl.org.au/jspui/bitstream/1/145/1/CAEPR...
31
Transcript of The impac oft welfar one th economie c status of ...library.bsl.org.au/jspui/bitstream/1/145/1/CAEPR...

The impact of welfare on the economicstatus of Aboriginal women
A.E. Daly
No.7/1991
ISSN 1036-1774ISBN 0 7315 1260

SERIES NOTE
The Centre for Economic Policy Research (CAEPR) was established inMarch 1990 under an agreement between the Australian National Universityand the Commonwealth of Australia (Aboriginal and Torres Strait IslanderCommission). In accordance with the Agreement, CAEPR operates as anindependent research unit within the University's Faculty of Arts. CAEPR'sprinciple objectives are to undertake research with the following aims:
• to investigate issues relating to Aboriginal employment andunemployment;
• to identify and analyse the factors affecting Aboriginal participation inthe labour force; and
• to assist in the development of government strategies aimed at raisingthe level of Aboriginal participation in the labour force and at thestimulation of Aboriginal economic development.
The Director of the Centre is responsible to the Vice-Chancel lor of the ANUand receives assistance in formulating the Centre's research agenda from anAdvisory Committee consisting of senior ANU academics nominated by theVice-Chancellor and Aboriginal representatives nominated by the ChiefExecutive Officer of the Aboriginal and Torres Strait Islander Commissionand the Secretary of the Department of Employment, Education andTraining.
CAEPR DISCUSSION PAPERS are intended as a forum for thedissemination of refereed papers on research that falls within the CAEPRambit. These papers are produced for discussion and comment within theresearch community and Aboriginal affairs policy arena. Copies ofdiscussion papers are available from Bibliotech, ANUTECH Pty Ltd, GPOBox 4, Canberra, ACT, 2601 (Phone: 06 249 2479 FAX 06 257 5088).
As with all CAEPR publications, the views expressed inthis DISCUSSION PAPER are those of the author(s) and
do not reflect an official CAEPR position.
Jon AltmanDirector, CAEPRAustralian National University

ABSTRACT
Despite the relatively low levels of employment among Aboriginalwomen, their average income, according to the 1986 Census, was notsubstantially lower than the average income of Australian women ingeneral. The Census does not distinguish sources of income, but otherevidence suggests that welfare payments are important in raising theaverage income of individual Aboriginal women to a level not verydifferent from that of all Australian women.
The Aboriginal Employment Development Policy (AEDP) has the statedgoal of reducing Aboriginal welfare dependency and this paper considerssome of the problems that will be associated with this goal for Aboriginalwomen. Expected earnings from full-time employment are predicted forAboriginal and non-Aboriginal women based on individual characteristicssuch as education, potential labour market experience, marital status andlocation of residence. These are compared with welfare entitlements inthe calculation of a replacement ratio. The replacement ratio measures theextent to which income from welfare compensates for lack of incomefrom employment. These calculations, which are a conservative estimate,show that the replacement ratio for Aboriginal women in 1986 washigher than for non-Aboriginal women. The results suggest that it will bedifficult to reduce the welfare dependence of Aboriginal women and theimplications of these findings for policy are discussed in the final section.
Acknowledgements
Earlier versions of this paper were presented at a Centre for AboriginalEconomic Policy Research seminar and at the Social Policy ResearchCentre's 1991 National Social Policy Conference, 'Social Policy inAustralia: Options for the 1990's' held at the University of New SouthWales in July, 1991. I have benefitted from the comments and discussionof the issues on each of these occasions. I would especially like to thankJon Altman, Bill Arthur, George Fane, Bob Gregory, Diane Smith andJohn Taylor for their comments.
Dr Anne Daly is a Research Fellow at the Centre for AboriginalEconomic Policy Research, Australian National University.


Evidence from the Population Censuses since 1971 shows a relativelysmall percentage of Aboriginal women, compared with the total femalepopulation of Australia, employed in the formal labour market. Studies offamily poverty suggest that this fact is of concern to policy makers, aslack of employment among the adults in a family (both among couplesand sole parent families) has been shown to be related to a higherincidence of family poverty (see, for example, Ross and Whiteford 1990).This relationship is especially marked for sole parent families and, asalmost a third of Aboriginal families at the time of the 1986 Census weresole parent families, the low levels of employment among Aboriginalwomen are of particular significance. The Royal Commission intoAboriginal Deaths in Custody (Commonwealth of Australia 1991) alsoemphasised the importance of low levels of employment in explaining theover-representation of Aboriginal people in the criminal justice system.
Although the incidence of poverty among Aboriginal families wasestimated at about three times the level of non-Aboriginal families in1986 (Ross and Whiteford 1990), income figures for individual womentaken from the 1986 Census do not suggest a substantial differencebetween the median income of Aboriginal and non-Aboriginal women.Lack of employment may be associated with low incomes but the averageincome of Aboriginal women was not substantially different from that ofnon-Aboriginal women. The Population Census does not distinguishsources of income but other evidence (Fisk 1985; Miller 1985) suggeststhat welfare payments are an important factor in explaining the similaraverage levels of income for Aboriginal and non-Aboriginal women. Itwould appear that the welfare system has been successful in guaranteeinga certain minimum level of income for individuals.
The Aboriginal Employment Development Policy (AEDP) has the statedgoal of achieving 'a reduction of Aboriginal welfare dependency to alevel commensurate with that of other Australians' (AustralianGovernment 1987: 4) and it pays particular attention to the dependence ofAborigines on unemployment benefits.1 This paper will argue that forAboriginal women, there are features of the relationship betweenpotential employment income and actual income from welfare whichoperate to reduce incentives for Aboriginal women to enter the labourmarket. Earnings equations are estimated from the 1 per cent sample ofthe 1986 Census which show that on average, Aboriginal women couldhave expected to earn about 80 per cent of the full-time weekly earningsof a non-Aboriginal woman, given their average characteristics (such aslevel of education and experience). The estimates presented are anillustration of the point made in the economics literature about povertytraps: for those with limited earnings power in the labour market, the

incentives to enter the labour market and give up a reliable source ofincome from welfare are relatively small. For this reason, it is likely tobe difficult for the AEDP to reduce both Aboriginal poverty and welfaredependency.
The paper will begin by describing the employment and income levels ofAboriginal women and all women using 1986 Census data beforepresenting some preliminary calculations of the relationship for womenbetween earnings from employment and income from the welfare system.
The employment and income levels of Aboriginal women
Like all Australian women, Aboriginal women have increased theirparticipation in the formal labour market since the early 1970s(Tesfaghiorghis and Altman 1991), but their participation rate remainswell below that of the total female population. In 1986, 56 per cent ofAustralian women aged 15-64 years were in the work force, comparedwith 38 per cent of Aboriginal women. Aboriginal employment rateswere also much lower. While 50 per cent of Australian women in this agegroup were employed, only a quarter of Aboriginal women were inemployment. The unemployment rate among Aboriginal women wasmore than twice the level for the total female population (13 per centcompared with 5.4 per cent), and there was also a much largerproportion of Aboriginal women who were outside the labour market.2
These much lower levels of employment among Aboriginal women werenot associated, as might be expected, with very much lower averageincomes. Some evidence from the 1986 Census is presented in Table I.3
Although only 22.7 per cent of Aboriginal women over 15 years of agewere employed compared with 42.3 per cent of all women, the averageincome of Aboriginal women was 80 per cent of that for all women. Thefigures presented here show quite clearly that employment is associatedwith higher average incomes. However, not being employed did notreduce the incomes of Aboriginal women to the same extent as it did forthe total female population. Aboriginal women who were not employedhad incomes about 40 per cent of those in employment, while thecorresponding figure for the total female population was 30 per cent.
The Aboriginal women who were in employment had a mean incomewhich was 88 per cent of the mean income for all employed women. Thismay reflect differences in the number of hours worked per year and inthe types of jobs held by Aborigines, as well as any racial discriminationwhich may exist in the labour market. The mean incomes of Aboriginal

women who were unemployed or not in the labour force were higherthan for the total female population; 23 per cent higher in the case ofunemployed Aboriginal women and 17 per cent higher for those not inthe labour force. The explanation of these differences is presumablyrelated to the calculation of welfare benefits which include loadings fordependents, marital status and location of residence in a remote area. Onaverage, Aboriginal women had more of the characteristics likely to raisetheir benefit entitlement such as a larger number of dependents.
It is important to note, when considering these figures, that the mean is asummary measure which may hide quite different distributions of incomeamong Aboriginal women and the total female population. Some evidencefor a distinct Aboriginal income distribution is presented in Figure 1.While a similar percentage of each group had no measured annualincome, a much larger percentage of women in the general population(11 per cent) had incomes above $15,000 (income category 7) thanamong Aboriginal women (3.7 per cent). Fifty-three per cent ofAboriginal women had incomes in the range $4,001 to $12,000 comparedwith 43 per cent of all women, so the distribution of income amongAboriginal women was more concentrated in the lower income rangesthan among women in the general population.
The relationship between earnings and welfare
Some calculations using 1986 data are now presented which represent aninitial attempt to compare the potential incomes from employment andwelfare for Aboriginal women. As such they should be taken asestimates. The figures as presented are before tax; adjustments will bemade in future work for the incidence of tax on earnings fromemployment and on welfare payments. Most pensions and benefits weresubject to income tax in 1986, but a special pensioner tax rebate ensuredthat pensioners with little or no other source of income did not pay tax.
The replacement ratio measures the extent to which income from welfarecompensates for loss of income from employment. As people arerequired to give up leisure in order to gain the higher income fromemployment, the replacement ratio can be thought of as an inversemeasure of the additional gains in income from sacrificing leisure. Ifincome from welfare equalled earnings from employment then thereplacement ratio would equal one and there would be no benefits interms of higher income associated with employment. A replacement ratioof zero means that an individual has the choice of either working for anincome or having leisure but no income at all. There are a number of

Table 1. Real mean annual incomes by labour force status,women aged 15 and over, 1986 (1980-81 dollars).
Aborigines% in each category% mean incomeof employed
Total population% in each category% mean incomeof employed
Employed
7,96622.7
8,99942.3
Ratio Aborigines/total (%) 88.5
Unemployed
3,10711.8
39
2,5214.5
28
123.2
Not in thelabour force
3,28465.5
41
2,81453.2
31
116.7
Total
4,467100
5,572100
80.2
Source: Treadgold (1988) Tables 4 and 8; Tesfaghiorghis and Altman (1991) Table 6.
ways of calculating a replacement ratio. Ideally all the benefits includingpayments-in-kind should be included, but the simple replacement ratio isusually defined as :
= ( B - T i ) / ( E - T 2 ) (D
where RR is the replacement ratio, B is the estimated benefit entitlement,E is full-time earnings and TI and T/2 are income tax liabilities while notemployed and employed respectively. T2 will be greater than TI under aprogressive income tax system such as that found in Australia where themarginal tax rate increases with income. (Foran example of these typesof calculations for the whole Australian population see Saunders,Bradbury and Whiteford 1989.)
The option for some Aboriginal people of 'working for unemploymentbenefit' under the Community Development Employment Projects(CDEP) scheme adds an additional choice for these individuals. Thisscheme offers Aboriginal people the choice of working part-time incommunity-based employment projects for the equivalent of their socialsecurity entitlements.4 The choice now becomes one between working inan ordinary job for a wage, working part-time for the community underthe CDEP scheme or receiving a benefit with no work requirementattached. The number of women working under the CDEP scheme in1986 is not known, but data for later years show that women were under-represented in the scheme.5 The replacement ratios discussed below focus

Figure 1. The income distribution of Aboriginal and allAustralian women, 1986.
<u
Aborigines
non-Aborigines
3 4 5 6 7 8 9 10 11 12 13 14
income category
The income categories are as follows- 1 = $0; 2 = $1-2,000; 3 = $2,001-4,000; 4 =$4,001-6,000; 5 = $6,001-9,000; 6 = $9,001-12,000; 7 = $12,001-15,000; 8 =$15,001-18,000; 9 = $18,001-22,000; 10 = $22,001-26,000; 11 = $26,001-32,000; 12= $32,001-40,000; 13 = $40,001-50,000; 14 = $50,000+.
Source: The full count of the 1986 Population Census.
on the relationship between income from employment and income fromthe standard welfare benefits.
Most married women are not entitled to welfare benefits in their ownright. For obvious reasons they do not qualify for sole or supportingparents benefits or for widow's pension. In the case of unemploymentbenefit, either their spouse is employed and this income makes themineligible for benefit or their spouse is unemployed and collecting themarried person's unemployment benefit therefore making the womanineligible in her own right.6 Evidence suggests that when the twopartners in the marriage are unemployed, the male tends to collect thebenefit (see Smith forthcoming). As 74 per cent of the total female

population aged 15-64 were married or in a de facto 'marriage-like'relationship and were therefore unlikely to be eligible for unemploymentbenefit, the calculations of the replacement ratio presented below basedon the unemployment benefit should be thought of as illustrative ratherthan of great empirical relevance.7 Department of Social Security (DSS)showed that there were 160,103 women receiving unemployment benefit,accounting for 28 per cent of unemployment benefit recipients (DSS1986).
Pensions such as the invalid, widowed and supporting parents benefitwere of much greater importance to women. DSS (1986) included395,195 women in these categories. It was not possible at that time toidentify Aboriginal women in the total, but information currently beingcollected on new recipients of all DSS pensions and benefits includes anAboriginal identifier. The information collected in the Census does notenable the identification of potential invalid pensioners but it does enablethe identification, in conjunction with the DSS eligibility rules, of thebroad group eligible to receive supporting parents benefit (being thosewho did not work full-time, were not married or in a de factorelationship, and had children). In addition, those entitled to the widow'spension (women who were over 50, widowed and not working full-time),can also be identified. Twenty-two per cent of the Aboriginal womenaged 15-64 included in the 1 per cent sample of the 1986 Census wouldhave qualified for sole parent or widow's pension according to thesebroad criteria compared with 9 per cent of the female non-Aboriginalpopulation. It is important to remember that these criteria do not exactlyencompass DSS eligibility requirements; for example, some individualsincluded here in the pool of potential benefit recipients may have hadincomes from sources other than full-time employment that made themineligible for the pension owing to the income test.
As already noted, since 1976 the Census has not asked a question aboutsources of income so there is no direct information on any individual'searnings from employment. The 1986 Census also did not seek detailedinformation on the number of hours worked each week, but includedbroad categories of hours worked. This makes it very difficult toestimate an hourly income where the categories cover a broad range ofhours (for example, 1-15 hours of work per week). In an attempt toreduce the problems associated with these two sources of measurementerror, the estimation presented here has been restricted to full-timeemployees (those working 35 or more hours per week). The Income andHousing Survey conducted by the Australian Bureau of Statistics in1985/86 showed that 85 per cent of the income of those employed full-time came from employment, so the Census income figures for this

group are probably a fairly good indicator of earnings (AustralianBureau of Statistics, 1989). The predicted earnings from full-time workhave been calculated from an earnings regression, using the 1 per centsample in which weekly earnings depend on age, years of schooling,educational qualifications, marital status, number of dependents, locationand Aboriginality.
The explanatory variables include some of the important determinants ofearnings suggested by the human capital model, education and potentialexperience, represented here by age.8 In addition, a variable to captureany specific effect of Aboriginality on earnings is included. If thecoefficient on this variable is statistically significant, it suggests that thereis an additional effect of Aboriginality on earnings even after all theother determinants of earnings such as education, age, marital status andnumber of dependents have been taken into account. A negativecoefficient may measure both the effects of racial discrimination onearnings and the choice by some Aboriginal women not to maximise theirmoney income for social or cultural reasons. There has been no attempthere to assess which of these possible sources of difference in earnings ismost important due to the limitations of the data available in the Census.
Location of residence has been measured by section-of-State variables(major urban, other urban or rural residence), as this geographicalbreakdown was the only one available in the 1 per cent sample held at theAustralian National University. It has therefore not been possible toestimate different earnings equations for remote and non-remote areas asdefined by the Australian Tax Office and used by DSS for thedetermination of eligibility for remote area allowance (see Table 2).
The regression results are presented in Appendix Table AI. They showthat earnings increased with education and initially with age. Marriage,dependent children, poor English and residence outside major urbanareas were all associated with lower earnings, but these coefficients werenot always statistically significant. Aboriginality in itself was alsoassociated with lower earnings. There are several possible explanations ofthis result. Aboriginal women may face discrimination in the labourmarket and do not earn the same as otherwise identical non-Aboriginalwomen, or they may choose not to be employed in as highly paid jobs asotherwise identical non-Aboriginal women for some non-pecuniaryreason. An example of this might be a nurse or teacher who acceptedlower pay and less chance of promotion in order to work in a sociallyfamiliar remote Aboriginal community rather than in a large urbancentre. A third possibility is that the broad definitions used for the otherexplanatory variables do not fully capture differences between the
Aboriginal and non-Aboriginal women in the sample. For example, yearsof schooling as a measure of educational attainment do not measure anydifferences in the quality of education received by the two groups.
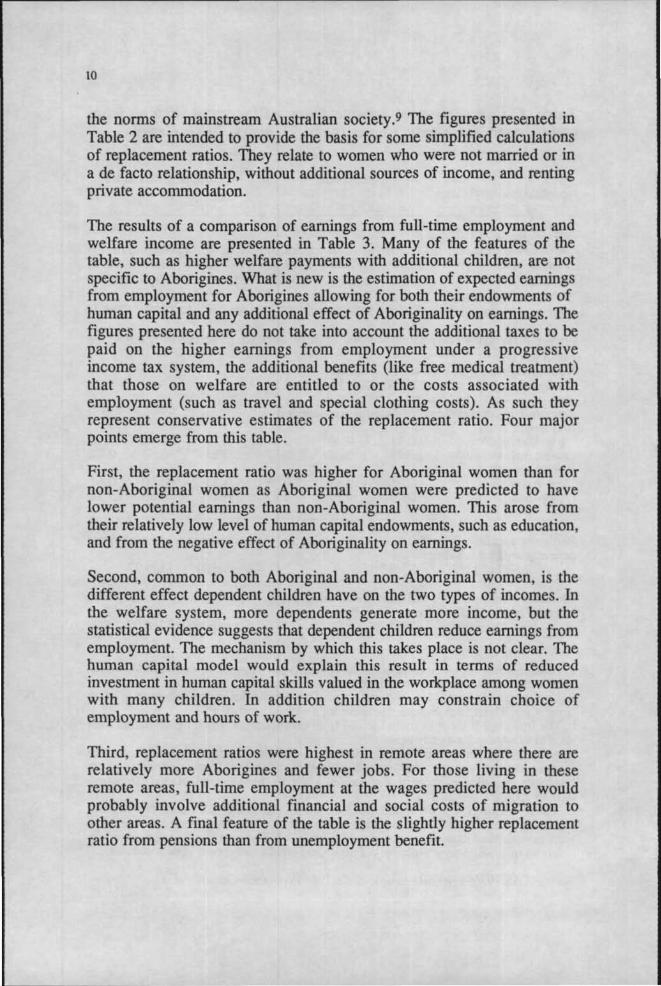
There are important methodological problems in calculating replacementratios. The only observations of actual earnings are for the groupcurrently employed. This group may differ from those not in employmentin ways which may be difficult to measure. For example, the levels ofmotivation and natural ability may differ between the employed and thosenot working even after observable characteristics such as education andage have been taken into account. There is an econometric technique, theHeckman correction (see Heckman 1979), which makes an adjustment forthis problem and the results reported in Table 3 include the necessarycorrection. These estimates of potential full-time earnings for those whoare both currently employed full-time and those who are not, can then becompared with income from benefits. The detailed headings under whichpension and unemployment benefits are paid are set out in Table 2. Thereis a large amount of detailed calculation involved in arriving at anindividual's welfare entitlement. These calculations can be furthercomplicated in the case of Aborigines by the application of rules based on
Table 2. Pension and benefit rates applicable to an unmarriedwomen, 1986.
Invalid, age.widow andsupporting parent pension ($)
Basic rateAddition/childMother/ guardian allowance3
Rent allowance15
Remote area allowance0
Remote area allowance/child0
102.1016.0012.0015.007.003.50
Unemploymentbenefit ($)
95.4016.0012.0010.007.003.50
a. Paid to mothers or guardians on pensions or benefits.b. Rent allowance was not paid for public housing.c. This allowance was paid to those living in specified remote areas (most of Income TaxZone A which covers most of the northern part of Australia).
Source: DSS 1986.

Table 3. Comparison of income from welfare and income fromemployment for single women over 21 years, 1986 Census.
Pensioner3 Unemp. beneficiariesb
N o . o f dependent children 0 2 4 0 2 4
Full welfare benefitNon-remote areas $117.10 $161.10 $193.10 $105.40 $149.40 $181.40Remote areas $124.10 $175.10 $214.10 $112.40 $163.40 $202.40
Freelimitc $30.00 $42.00 $54.00 $30.00 $30.00+ $30.00+No benefit paid whenother income exceededd $234.20 $334.20 $410.20 $145.40 $224.10 $256.10
Predicted average weekly earnings from full-time work for those currently not in thelabour force6
Non-Aboriginal $341.15 $328.04 $315.43Aboriginal $270.96 $260.55 $250.53
Ratio welfare benefit income/predicted average earningsNon-remote areasNon-AboriginalAboriginal
Remote areasNon-AboriginalAboriginal
0.340.43
0.360.46
0.490.62
0.530.67
0.610.77
0.680.85
0.310.39
0.330.41
0.460.57
0.500.63
0.580.72
0.640.81
Predicted earnings from full-time work using the average characteristics of thosecurrently working full-time:
Non-Aboriginal $303.10 Aboriginal $239.27
Predicted earnings from full-time work using the average characteristics of thosecurrently not in the labour force:
Non-Aboriginal $338.75 Aboriginal $265.02
a. Pensioner includes recipients of the following types of pension; age, invalid, wife's,carer's and widow's pension and supporting parents benefit.b. Unemployment benefit for single people with no dependents varied with the age of thebeneficiary. The figures presented here are for a woman aged over 21.C. The free limit is the maximum income from other sources which beneficiaries wereentitled to without losing any benefit.d. Above the free limit, beneficiaries lose some welfare income for every dollar receivedfrom an alternative source. At the weekly incomes shown in this row, individuals wereno longer entitled to any benefit. For married women, other income included the incomeof their spouse.e. These earnings are predicted from equation (2) Table AI using the averageendowments of education, age, language ability and location of residence of women whowere outside the labour force presented in Table A2. The earnings were predicted forsingle women with varying numbers of dependent children as shown in each column.
Source: DSS 1986; 1 percent sample of the 1986 Population Census.
10
the norms of mainstream Australian society.9 The figures presented inTable 2 are intended to provide the basis for some simplified calculationsof replacement ratios. They relate to women who were not married or ina de facto relationship, without additional sources of income, and rentingprivate accommodation.
The results of a comparison of earnings from full-time employment andwelfare income are presented in Table 3. Many of the features of thetable, such as higher welfare payments with additional children, are notspecific to Aborigines. What is new is the estimation of expected earningsfrom employment for Aborigines allowing for both their endowments ofhuman capital and any additional effect of Aboriginality on earnings. Thefigures presented here do not take into account the additional taxes to bepaid on the higher earnings from employment under a progressiveincome tax system, the additional benefits (like free medical treatment)that those on welfare are entitled to or the costs associated withemployment (such as travel and special clothing costs). As such theyrepresent conservative estimates of the replacement ratio. Four majorpoints emerge from this table.
First, the replacement ratio was higher for Aboriginal women than fornon-Aboriginal women as Aboriginal women were predicted to havelower potential earnings than non-Aboriginal women. This arose fromtheir relatively low level of human capital endowments, such as education,and from the negative effect of Aboriginality on earnings.
Second, common to both Aboriginal and non-Aboriginal women, is thedifferent effect dependent children have on the two types of incomes. Inthe welfare system, more dependents generate more income, but thestatistical evidence suggests that dependent children reduce earnings fromemployment. The mechanism by which this takes place is not clear. Thehuman capital model would explain this result in terms of reducedinvestment in human capital skills valued in the workplace among womenwith many children. In addition children may constrain choice ofemployment and hours of work.
Third, replacement ratios were highest in remote areas where there arerelatively more Aborigines and fewer jobs. For those living in theseremote areas, full-time employment at the wages predicted here wouldprobably involve additional financial and social costs of migration toother areas. A final feature of the table is the slightly higher replacementratio from pensions than from unemployment benefit.

11
An additional benefit of pension income over unemployment benefit is thegreater reliability of this source of income. The receipt of unemploymentbenefit may involve work tests, job interviews and regular attendance atthe Commonwealth Employment Service (CES). In contrast, once deemedto have satisfied the necessary criteria, it is much easier to retain thepension. Pension income is also more easily portable as cheques can beforwarded on to new addresses while more forms need to be completedbefore unemployment benefit can be collected from a CES office otherthan the initial point of contact. A further advantage of a pension overunemployment benefit was the larger amount of income from othersources which was permitted before welfare income was withdrawn (seeTable 3).
The figures presented in Table 3 are averages for the Aboriginal and non-Aboriginal populations. Each individual has a replacement ratio based onher particular circumstances and these can be summarised by thedistribution of replacement ratios across the Aboriginal and non-Aboriginal female populations. Every individual has potentially a positivereplacement ratio either from unemployment benefit or from supportingparent or widow's pensions. Married women can change their maritalstatus and women can move in and out of de facto relationships. Inaddition, the DSS may enforce eligibility criteria with varying degrees ofrigour so that status may change without loss of benefit. Table 4 columns1 and 3, show the distribution of replacement ratios from supportingparent or widow's pensions based on the information on marital statusprovided in the 1986 Census and making no allowance for possiblechanges in this status. Therefore, women who were married or living in ade facto relationship and single women without children, in thesecalculations had a replacement ratio of zero. Columns 2 and 4 of Table 4show the distribution of replacement ratios among women if all womenchanged their marital status in order to qualify for either of thesebenefits.
As columns 1 and 3 of Table 4 show, on the basis of their existing maritalstatus the majority of women did not qualify for either supporting parentor widow's pension. This group accounted for 78 per cent of Aboriginalwomen and about 89 per cent of non-Aboriginal women. In other words,the availability of these pensions offered no incentive for these women toremain outside the labour force.
A larger percentage (22 per cent) of Aboriginal women of working agewere eligible for these benefits compared with the rest of the population(11 per cent). Of the 22 per cent of Aboriginal women who would havebeen entitled to benefit, two-thirds (14.5 per cent of all Aboriginal

12
women) had a replacement ratio greater than 50 per cent compared withonly 2.3 per cent of women in the rest of the population. As these areconservative estimates of the replacement ratio, these results suggest thatfor a substantial number of Aboriginal women, the incentives to leavewelfare and take up any available paid employment were small.
Columns 2 and 4 of Table 4 present replacement ratios calculated on theassumption that women changed their marital status but not their numberof children. The focus here is on the replacement ratio from supportingparent and widow's pension so women who did not have children or weretoo young to qualify for widow's pension without a dependent child (thatis under 50 years of age) had replacement ratios from these benefits ofzero. These women would have been entitled to apply for unemploymentbenefit and therefore have some income support from the welfare system.While about a third of Aboriginal women were in this category, almosthalf of non-Aboriginal women belonged here. High replacement ratiosfrom supporting parents and widow's pension were potentially muchmore important for Aboriginal women than for non-Aboriginal women.Fifty-five per cent of Aboriginal women had a replacement ratio greaterthan 50 per cent compared with 20 per cent of non-Aboriginal women.These calculations further emphasise the disincentive effect these welfarepayments may have on searching for full-time employment.
Table 4. The distribution of replacement ratios from soleparent and widows pensions for women, 1986.
Replacementratio(per cent)
0-1010.1-2020.1-3030.1-4040.1 -5050.1 -6060.1-7070.1 - 8080.1-9090.1 - 100100+
Aboriginal
marital statusunchanged
(D
78.100
1.55.77.04.01.01.30.80.5
women
marital statuschanged
(2)
30.900
1.512.521.214.07.25.52.74.0
Non-Aboriginal women
marital status marital statusunchanged
(3)
89.20
1.33.93.11.40.30.40.2
00
changed(4)
47.50
1.57.8
21.913.83.12.11.0
00
Source: Table AI and Table 2.

13
Conclusion and policy implications
The paper shows that despite a lower level of employment than amongthe general female population, the average income of Aboriginal womenin 1986 was not very different from that of other Australian women. Theevidence is consistent with the hypothesis that this is due to the greateraverage welfare income of Aboriginal women than for women in thetotal population. This reflects the larger number of dependent children,the lower marriage rates and the relatively large numbers of Aboriginalwomen living in the remote areas where benefits were higher. However,better information on the sources of Aboriginal income is required toconfirm this result. While not suggesting that the abolition of all welfarepayments is the appropriate policy response, the calculations presented inTable 3 and Table 4, showing high replacement ratios for a substantialpercentage of Aboriginal women, have certain implications for theFederal Government's objective of reducing both welfare dependence andpoverty among Aborigines.10
First, it will be difficult to reduce welfare dependency when thereplacement ratios for some Aboriginal women are so high; howeverreducing replacement ratios will raise poverty. The figures presentedhere do not take into account the additional taxes to be paid on the higherearnings from employment under a progressive income tax system, theadditional benefits (for example medical treatment) that those on welfareare entitled to or the costs associated with employment (such as travel andclothing costs). In the case of remote Aborigines, there may be thefurther costs of employment associated with migration. All these factorswould tend to raise the ratio and make the estimates presented hereconservative. Welfare payments also have the advantage of reliability forthose individuals whose employment opportunities may be restricted toseasonal work. For seasonal workers, coming off unemployment benefitfor short-term employment has substantial costs in terms of the waitingperiod between the completion of a job and the time when they are onceagain eligible for unemployment benefit. These disincentive effects onthose marginally attached to the work force need to be recognised.Sanders (1985), presents evidence that at least in some instances in thepast, the DSS has continued to pay unemployment benefit even whensome casual and seasonal work was being undertaken.
Second, the CDEP scheme may be one way of reducing the dependence ofAborigines on unemployment benefit but, as it currently stands, it willhave little effect on Aboriginal dependence on other types of welfarepayments which are more important for women. This raises a policyissue: should the CDEP scheme be used more widely as an alternative to

14
all kinds of welfare benefits? There are important horizontal equity issuesin such an idea of broadening the CDEP scheme to include all recipientsof welfare, as other invalid, age and supporting parent beneficiaries arenot expected to work for their pensions.
Third, the existence of the CDEP notionally linked to Job SearchAllowance and Newstart (formerly unemployment benefits) forAborigines, changes the nature of the calculation of replacement ratios.For the general population, the replacement ratio reflects the trade-offbetween work and leisure, but for Aborigines participating in the CDEPscheme, the replacement ratio reflects a trade-off between earnings fromtwo different types of employment, ordinary full-time work andcommunity-based part-time employment.
Finally, the replacement ratio can be altered either by lowering the levelof welfare payments or by increasing the earnings Aboriginal womencould expect from employment. One way of encouraging Aboriginalwomen into the work force might be to raise their earnings power (forexample, with more education) but this is only likely to have any effectwhere Aboriginal women are already residing in areas where there areemployment opportunities or when they are willing to migrate to areas ofemployment. It is also a policy direction which would take a very longtime to have any effect.
Notes
1. In July 1991 unemployment benefit was replaced by a Job Search Allowance andNewstart. As this discussion relates to 1986, the terminology applicable at thetime has been used.
2. See Daly (1991) for a fuller description of female Aboriginal employment andunemployment rates.
3. Although it is possible to find information about the Aboriginal population inpublished tables from the 1986 Population Census, published data do notdistinguish the non-Aboriginal population from the total population. It hastherefore been necessary, for comparative purposes, to use the figures for the totalpopulation. As Aborigines accounted for about 1.5 per cent of the total Australianpopulation, their inclusion in the total should not produce different conclusionsfrom a more accurate comparison with the non-Aboriginal population. WhereCensus data are presented from the 1 per cent sample, the more accuratecomparison between the Aboriginal and non-Aboriginal population has beenmade.
4. For a description of the scheme see Sanders (1988), Altman and Sanders (1991)and Morony (1991).

15
5. A review of the funding and administration of the CDEP, conducted in 1990,noted that there were no comprehensive data on the participation of women inCDEP but 'Of 50 of a total of 129 CDEP communities for which data wasavailable from the P3 forms, the percentage of female workers on CDEP (asopposed to participants) ranges on average between 20% to 36%. Someparticipation rates were as low as 4%' (their emphasis, CDEP Working Party1990: 48).
6. If each spouse is over the age of 21, they are not entitled to a separately assessedbenefit. It is possible, however, by agreement between the parties, for thepayment of the married person's unemployment benefit to be split between them.This is just a way of allocating the married person's benefit between them if theyare both unemployed.
7. The DSS considers a de facto 'marriage-like' relationship to be a marriage, sounmarried women with children living in a de facto relationship would not beeligible for benefit.
8. Age has been used here rather than potential experience (age minus age leftschool) because of the presentation of age data in five year categories in the 1 percent sample of the Census. The estimation of potential experience using these agecategories would introduce additional measurement error in the explanatoryvariable. Age is very closely correlated with potential experience (r = 0.98) so theuse of age category dummy variables seemed most appropriate. Earningsregressions using data from the full Census without these restrictions on the agevariable are currently being estimated on my behalf (on a consultancy basis) by theAustralian Bureau of Statistics.
10. For an example of some of the difficulties faced in applying DSS rules establishedon the assumption of a monogamous society, see the discussion of the DSS'streatment of Aboriginal polygyny and tribal marriage in Sanders (1987). Therewas also considerable debate surrounding the applicability of unemploymentbenefit to remote communities without a formal labour market (see Sanders 1985).
11. For a discussion of this issue in the context of the Torres Strait see Arthur (1991).

16
Appendix
Table AI. Weekly earnings of women working full-time, 1986.
OLS regression(D
Heckman correction(2)
ConstantHighPost-secondaryGraduateYears of primary andsecondary schoolingAge 20-24Age 25-29Age 30-34Age 35-39Age 40-44Age 45-49Age 50-54Age 55-59Age 60-64MarriedWidowed, separated, divorcedNumber dependentsPoor EnglishOther urbanRuralAboriginalLambdaR2Mean of dependent variablesStandard error of regressionNumber of observations
4.7735 (88.60**)-0.0845 (-3.50**)
0.1253 (8.66**)0.3691 (16.63**)
0.0453(8.68**)
0.3843 (16.64**)0.5237 (22.18**)0.5927 (22.59**)0.6193 (23.44**)0.6229 (22.56**)0.5275 (17.57**)0.5150(15.71**)0.5084 (12.98**)0.6408 (9.74**)-0.0073 (-0.47)-0.0363 (1.70)
-0.0355 (-5.27**)-0.0826 (-1.97*)
-0.0413 (-2.75**)-0.0484 (-2.32**)-0.0936 (-2.39**)
0.415.70850.3045
2922
4.8564 (18.22**)-0.0826 (-3.34**)
0.1168(3.82**)0.3553 (7.29**)
0.0409(2,78**)
0.3868 (17.60**)0.5344 (13.00**)0.6078 (11.22**)0.6199 (23.48**)0.6279 (19.78**)0.5435 (9.26**)0.5453 (5.40**)0.5579 (3.47**)0.7284 (2.57**)-0.0089 (-0.17)
0.0419 (1.52)-0.0196 (-0.39)
-0.0873 (-1.97*)-0.0308 (-0.85)-0.0307 (-0.85)-0.0761 (-1.13)-0.0660 (-0.32)
0.415.70850.3034
2922
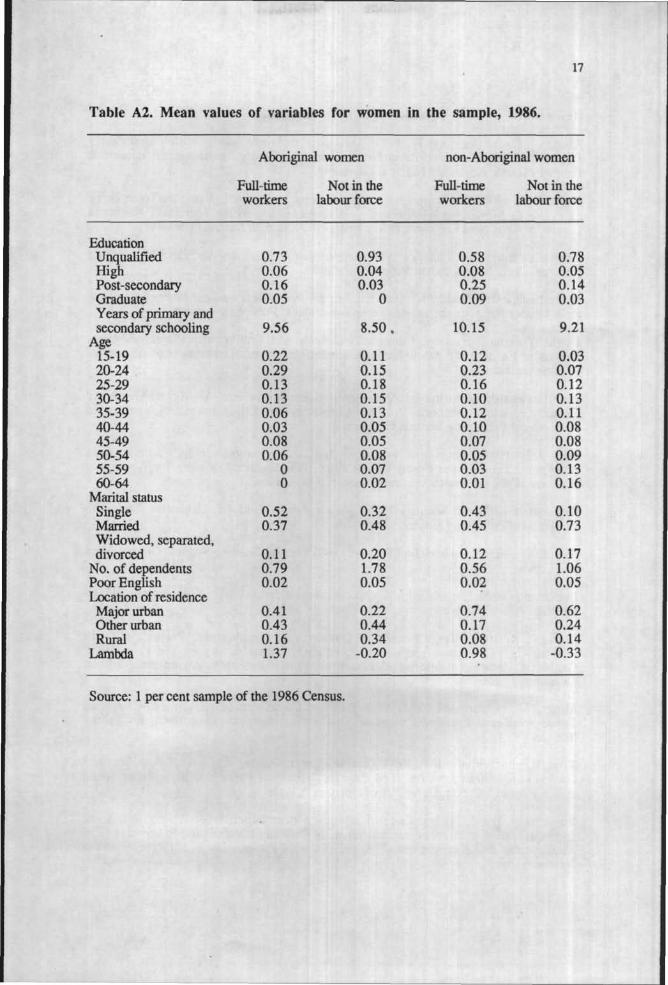
't' statistics are in brackets. The constant term relates to a single unqualified woman withno dependents living in a major urban area who was proficient in English. The variablesare defined as follows: There were 10 age categories defined, 15-19, 20-24, 25-29, 30-34, 35-39, 40-44, 45-49, 50-54, 55-59, 60-64; years of primary and secondary schoolwere calculated as age left school minus 5 with a maximum value of 12; high school tooka value of 1 for those who had completed high school, post-secondary for those who hadsome post-secondary qualification and graduate for those with either a bachelor's orpostgraduate degree; married took a value of 1 for those who were married and widowed,separated or divorced took a value of 1 for those with one of these marital statuses;number of dependent children in the family recorded the number of children with amaximum of 8; poor English took a value of 1 for those who registered an inability tocommunicate easily in English; other urban took a value of 1 for those living in urbansettlements of between 1,000 and 99,999 inhabitants and rural took a value of 1 for thoseliving in smaller settlements; Aborigine took a value of 1 for those who identifiedthemselves as Aborigines or Torres Strait Islanders.
17
Table A2. Mean values of variables for women in the sample, 1986.
Aboriginal women
Full-time Not in theworkers labour force
EducationUnqualifiedHighPost-secondaryGraduateYears of primary andsecondary schooling
Age15-1920-2425-2930-3435-3940-4445-4950-5455-5960-64
Marital statusSingleMarriedWidowed, separated,divorced
No. of dependentsPoor EnglishLocation of residence
Major urbanOther urbanRural
Lambda
0.730.060.160.05
9.56
0.220.290.130.130.060.030.080.06
00
0.520.37
0.110.790.02
0.410.430.161.37
0.930.040.03
0
8.50.
0.110.150.180.150.130.050.050.080.070.02
0.320.48
0.201.780.05
0.220.440.34
-0.20
non-Aboriginal women
Full-time Not in theworkers labour force
0.580.080.250.09
10.15
0.120.230.160.100.120.100.070.050.030.01
0.430.45
0.120.560.02
0.740.170.080.98
0.780.050.140.03
9.21
0.030.070.120.130.110.080.080.090.130.16
0.100.73
0.171.060.05
0.620.240.14
-0.33
Source: 1 per cent sample of the 1986 Census.

18
References
Altman, J.C. and Sanders, W. 1991. The CDEP Scheme: Administrative and PolicyIssues, CAEPR Discussion Paper No. 5. Canberra: Centre for Aboriginal EconomicPolicy Research, Australian National University.
Arthur W.S. 1991. 'The prospect of employment equity in remote areas: the Torres Straitcase', in J.C. Altman (ed.) Aboriginal Employment Equity by the Year 2000. Canberra:Centre for Aboriginal Economic Policy Research, Australian National University.
Australian Bureau of Statistics 1989. Income and Housing Survey, 1985-86 - PersonRecords. Canberra: Australian Bureau of Statistics.
Australian Government 1987. Aboriginal Employment Development Policy Statement:Policy Paper No. 1. Canberra: Australian Government Publishing Service.
CDEP Working Party 1990. Community Development Employment Projects Scheme:Review of Funding and Administration, unpublished report, Department of AboriginalAffairs, Canberra.
Commonwealth of Australia 1991. Royal Commission into Aboriginal Deaths inCustody, National Report, Vol. 4. (Commissioner Elliot Johnston), AustralianGovernment Publishing Service, Canberra.
Daly A.E. 1991. 'Aboriginal women in the labour market', in J.C. Altman (ed.)Aboriginal Employment Equity by the Year 2000. Canberra: Centre for AboriginalEconomic Policy Research, Australian NationalUniversity.
Department of Social Security 1986. Annual Report 1985-86. Canberra: AustralianGovernment Publishing Service.
Fisk, E.K. 1985. The Aboriginal Economy in Town and Country. Sydney: George Allenand Unwin.
Heckman J. 1979. 'Sample selection bias as a specification error', Econometrica, 47(1):153-62.
Morony, R. 1991. The Community Development Employment Projects (CDEP)scheme', in J.C. Altman (ed.) Aboriginal Employment Equity by the Year 2000.Canberra: Centre for Aboriginal Economic Policy Research, Australian NationalUniversity.
Miller, M. (Chairman) 1985. Report of the Committee of Review of AboriginalEmployment and Training Programs. Canberra: Australian Government PublishingService.
Ross, R. and Whiteford, P. 1990. Income Poverty Among Aboriginal Families withChildren: Estimates from the 1986 Census, Discussion Paper No. 20. Sydney: SocialPolicy Research Centre, University of New South Wales.
Sanders W. 1985. The politics of unemployment benefits for Aborigines: someconsequences of economic marginalisation,1 in D. Wade-Marshall and P. Loveday (eds)Employment and Unemployment: A Collection of Papers. Darwin: North AustraliaResearch Unit.
19
Sanders W. 1987. The Department of Social Security's treatment of Aboriginalpolygyny and tribal marriage: a saga of administrative debate', Australian Journal ofPublic Administration, XLVI(4): 402-20.
Sanders, W. 1988. 'The CDEP scheme: bureaucratic politics, remote community politics,and the development of an Aboriginal 'workfare1 program in times of risingunemployment', Politics, 23(1): 32-47.
Saunders, P., Bradbury, B. and Whiteford, P. 1989. 'Unemployment benefitreplacement rates', Australian Bulletin of Labour, 15(2): 223-44.
Smith D.E. (forthcoming). Aboriginal Unemployment Statistics: Policy Implications ofthe Divergence Between Official and Case Study Data, CAEPR Discussion Paper No. 13.Canberra: Centre for Aboriginal Economic Policy Research, Australian NationalUniversity.
Tesfaghiorghis, H. and Altman, J.C. \99l.Aboriginal Socio-economic Status: Are thereany Evident Changes?, CAEPR Discussion Paper No. 3. Canberra: Centre for AboriginalEconomic Policy Research, Australian National University.
Treadgold, M. 1988. 'Intercensal change in Aboriginal incomes, 1976-86', AustralianBulletin of Labour, 14(4): 592-609.


CENTRE FOR ABORIGINAL ECONOMIC POLICYRESEARCH (CAEPR) DISCUSSION PAPERS:
1. 'From exclusion to dependence: Aborigines and the welfare state inAustralia' by J.C. Altman and W. Sanders (March 1991).
2. 'Geographic variations in the economic status of Aboriginal people: apreliminary investigation' by H. Tesfaghiorghis (March 1991).
3. 'Aboriginal socio-economic status: are there any evident changes?'by H. Tesfaghiorghis and J.C. Altman (March 1991).
4. Indigenous economic development in the Torres Strait: possibilitiesand limitations' by W.S. Arthur (March 1991).
5. 'The CDEP scheme: administrative and policy issues' by J.C. Altmanand W. Sanders (September 1991).
6. 'The participation of Aboriginal people in the Australian labourmarket' by A.E. Daly (September 1991).
7. 'The impact of welfare on the economic status of Aboriginal women'by A.E. Daly (September 1991).
8. 'Geographic location and Aboriginal economic status: a census-basedanalysis of outstations in the Northern Territory' by J. Taylor(September 1991).
9. 'Aboriginal expenditure patterns: an analysis of empirical data andits policy implications' by D.E. Smith (September 1991).
10. 'Toward an Aboriginal household expenditure survey: conceptual,methodological and cultural considerations' by D.E. Smith(September 1991).


![The Sun. (New York, N.Y.) 1910-01-22 [p 10].chroniclingamerica.loc.gov/lccn/sn83030272/1910-01-22/ed-1/seq-10.pdf · earningn 10ell23 PRWIC 11-1 Aursburr4s NevadaUtah 8o-TestDnTel](https://static.fdocuments.in/doc/165x107/5ac221187f8b9a5a4e8dec2b/the-sun-new-york-ny-1910-01-22-p-10-10ell23-prwic-11-1-aursburr4s-nevadautah.jpg)

![[Gosta Esping-Andersen] the Three Worlds of Welfar(BookZZ](https://static.fdocuments.in/doc/165x107/577c86f41a28abe054c33ec2/gosta-esping-andersen-the-three-worlds-of-welfarbookzz.jpg)


![The Sun. (New York, N.Y.) 1905-11-24 [p 9].chroniclingamerica.loc.gov/lccn/sn83030272/1905-11-24/ed-1/seq-9.pdf · earningn JOIIIIKH-lioi iIiIItImuus llrlfilinm flieirnof miuny iiiduilii](https://static.fdocuments.in/doc/165x107/5ac221187f8b9a5a4e8dec31/the-sun-new-york-ny-1905-11-24-p-9-joiiiikh-lioi-iiiiitimuus-llrlfilinm.jpg)