
THE IMPA T OF REIM URSEMENT POLI IES AND PRA TI ES ON ...
104
THE IMPACT OF REIMBURSEMENT POLICIES AND PRACTICES ON HEALTHCARE TECHNOLOGY INNOVATION FINAL REPORT | FEBRUARY 2016 Brian Bruen A Elizabeth Docteur B Ruth Lopert A Joshua Cohen C Joseph DiMasi C Avi Dor A Peter Neumann D Regina DeSantis A Chuck Shih A A George Washington University B Elizabeth Docteur Consulting C Tufts Center for the Study of Drug Development D Tufts Medical Center This project was supported by the U.S. Department of Health and Human Services, Office of the Assistant Secretary for Planning and Evaluation (Contract No. HHSP23320095635 Order No. WCHHSP23337014T). The authors are solely responsible for the content of this document, and any statements or conclusions should not be attributed to the U.S. Department of Health and Human Services, George Washington University, Tufts Center for the Study of Drug Development, Tufts Medical Center, or any other organizations with which the authors are affiliated.
Transcript of THE IMPA T OF REIM URSEMENT POLI IES AND PRA TI ES ON ...

THE IMPACT OF REIMBURSEMENT POLICIES AND PRACTICES ON HEALTHCARE TECHNOLOGY INNOVATION
FINAL REPORT | FEBRUARY 2016
Brian Bruen A Elizabeth Docteur B Ruth Lopert A Joshua Cohen C Joseph DiMasi C Avi Dor A Peter Neumann D Regina DeSantis A Chuck Shih A A George Washington University B Elizabeth Docteur Consulting C Tufts Center for the Study of Drug Development D Tufts Medical Center This project was supported by the U.S. Department of Health and Human Services, Office of the Assistant Secretary for Planning and Evaluation (Contract No. HHSP23320095635 Order No. WCHHSP23337014T). The authors are solely responsible for the content of this document, and any statements or conclusions should not be attributed to the U.S. Department of Health and Human Services, George Washington University, Tufts Center for the Study of Drug Development, Tufts Medical Center, or any other organizations with which the authors are affiliated.

[This page intentionally left blank for two-sided printing.]

TABLE OF CONTENTS
Executive Summary ........................................................................................................................................ i
Introduction .................................................................................................................................................. 1
Research Objective and Questions ........................................................................................................... 3
Organization of the Report ....................................................................................................................... 3
Methods & Analytical FrameWork................................................................................................................ 4
Defining Key Terms ................................................................................................................................... 4
Development of an Analytic Framework .................................................................................................. 8
Analysis of Key Characteristics of Reimbursement Methods ................................................................... 8
Expert Consultations ................................................................................................................................. 9
Case Studies .............................................................................................................................................. 9
Results ......................................................................................................................................................... 11
Tracing the Link from Reimbursement to Innovation ............................................................................. 12
Key Characteristics of Reimbursement Methods ................................................................................... 13
How Reimbursement Characteristics Affect Components of ROI and Incentives to Innovate .............. 22
The Reimbursement Decision-Making Process................................................................................... 22
Product Categorization and Differentiation........................................................................................ 29
Method of Payment ............................................................................................................................ 36
Defining the Payment Amount ........................................................................................................... 41
Patient Cost Sharing ............................................................................................................................ 47
Conclusion ................................................................................................................................................... 54
Suggestions for Future Research ........................................................................................................ 57
Appendix A: A Standard Reimbursement Decision-Making Process .......................................................... 60
Appendix B: hi HealthInnovations Case Study ............................................................................................ 62
Appendix C: Premera Value-Based Formulary Case Study ......................................................................... 72
Appendix D: NICE (UK) Performance-Based Reimbursement for Velcade® ............................................... 83
Appendix E: Expert Panelists ....................................................................................................................... 93

[This page intentionally left blank for two-sided printing.]
Executive Summary | i
EXECUTIVE SUMMARY
It is widely accepted that reimbursement policies and practices are important considerations in the
research and development (R&D) decisions of potential innovators of healthcare technologies, and the
investors who finance them. Experts broadly concurred that reimbursement is one of the factors that
determines which products in development eventually make it to market, as well as the level of access
to those products and use by care providers and patients. This, in turn, can affect product development
and innovation. However, reimbursement is not necessarily among the most important drivers in every
circumstance and likely plays different and evolving roles with respect to drugs and devices. Scientific
discoveries and perceptions of clinical need may be the most important factors influencing innovation.
It is also widely held that decentralized decision-making, the absence of government-regulated pricing,
and lack of restrictions on reimbursement create an environment that is generally conducive to greater
R&D expenditure. Without price controls and reimbursement limits, firms are able to invest in drug
development with fewer concerns about future market access and reimbursement levels once their
product is approved. But, more expenditure on R&D does not necessarily give rise to more innovation
that improves consumer welfare (as defined in this project), as more spending in the drug and device
development pipeline may not yield products offering value concurrent with the benefits conferred. The
appropriate question, therefore, is not how much is spent on R&D (i.e., the enterprise), but how to
measure the benefits to patients, payers, and society of the resultant drugs and devices that are brought
to market.1
Payers account for a large share of the purchases of healthcare technologies.2 Consequently, the
decision by a public program or health plan to subsidize use of a technology (often referred to as a
coverage decision) is a critical determinant of expected, and actual, return on investment (ROI) for
developers and investors. The level and method of payment selected and any policies or practices
defining the circumstances under which the healthcare technology is reimbursed serve as (lesser)
determinants. In making these reimbursement decisions, payers make formal and informal evaluations
of the value that drugs and devices confer. By doing so, they may establish a market that is more
conducive to rational, value-based consumer decisions.
It is thus important to understand how reimbursement affects actual or expected ROI, and by extension,
how ROI may impact innovation, as developer and investor assessments of the market viability of a new
1 Schaeffer, S., & McCallister, E. (2014, September 1). Paying the piper. BioCentury. Retrieved from
http://www.biocentury.com/biotech-pharma-news/coverstory/2014-09-01/22nd-biocentury-back-to-school-
issue-time-to-try-new-pricing-schemes-a1 2 An estimated 75-80% of the costs of biopharmaceuticals are borne by payers, according to Kaiser Family
Foundation calculations (2008) using National Health Expenditure historical data from the Centers for Medicare
and Medicaid Services (https://www.cms.gov/Research-Statistics-Data-and-Systems/Statistics-Trends-and-
Reports/NationalHealthExpendData/index.html?redirect=/NationalHealthExpendData); unfortunately, there is
relatively little data available pertaining to insurance cost share for medical devices.

Executive Summary | ii
product take into account payers’ potential actions (e.g., would it be covered, at what payment level,
and with which conditions?). It is also important to identify any potential downstream effects that
reimbursement may have on innovation over the long-term, as use of specific reimbursement
approaches grows or fades. The objective of this research project was to describe current
reimbursement methods and analyze their impacts (if any) on drug and device use and innovation. Our
findings incorporate assessments of the effects of reimbursement on innovation based on economic
theory, literature reviews, and consultation with experts.
We identified key characteristics of reimbursement methods and selected five of these for closer
analysis to determine how they affect factors that contribute to ROI such as pricing, utilization, and
provider and patient decision-making. These characteristics were:
The reimbursement decision-making process: how payers make decisions on which drugs,
devices, and other healthcare technologies to make available to patients, at what price, and for
whom;
Product categorization and differentiation: how payers distinguish between the drugs or devices
that they cover;
Method of payment: the terms under which a payer makes reimbursement to a provider;
Method of defining the payment amount: the methods used to establish the amount the third-
party payer will reimburse a provider or supplier furnishing a healthcare technology to a patient,
and;
Patient cost sharing: out-of-pocket costs borne by consumers, net of insurance coverage, when
they obtain services or purchase prescription drugs, durable medical equipment (DME), or other
health technologies.
Key drivers of the use of different reimbursement methods include state and federal statutes and
regulations for public payers such as Medicare and Medicaid; availability of detailed reimbursement
information and methodologies for public plans – but generally not private payers – as potential
benchmarks; and competition among private payers. Cost containment also appears to be an important
factor driving payer choices.
We then assessed whether and, if so, how the aforementioned characteristics of reimbursement
methods affect incentives to innovate in drugs and devices in qualitative (direction and relative
magnitude of impact) terms. We classify innovations as incremental, substantial, or radical, depending
on the significance of the unmet need addressed and the extent of additional benefit (comparative
effectiveness) offered relative to existing treatments. Incremental innovations offer small gains in one or
both of these areas. Radical innovations address significant unmet needs and provide significant
additional benefits, while substantial innovations either address significant unmet needs or provide
significant additional benefits – but not both.
The analytical framework that we developed for this purpose posits that reimbursement policies and
practices can impact product developers’ ROI directly in three ways. The first is by establishing a specific
payment level, which in turn affects average sales price. The second is by setting a volume of sales at

Executive Summary | iii
that payment level. The third is by influencing seller costs associated with development, manufacture, or
sale of a healthcare technology. Our framework also posits that reimbursement policies indirectly
influence ROI by establishing different incentives for key actors, including patients/consumers,
dispensers, providers, sellers, and payers. In turn, these incentives impact effective sales price, sales
volume, and in some cases, sellers’ costs of development, manufacturing, and sales. Together these
factors determine the revenues and profits to be derived from the product, important determinants of
the ROI for the developer and investors.
Prospective innovators take into account expectations of the impact of current and anticipated
reimbursement policies and practices when deciding to invest in R&D, and in directing investments to
particular products. A positive ROI rewards successful innovators and will, in theory, spur the next
generation of investment. We assume that larger expected returns on investment provide more
incentives to invest in development of novel healthcare technologies, as well as development of new
evidence supporting novel uses of existing healthcare technologies.
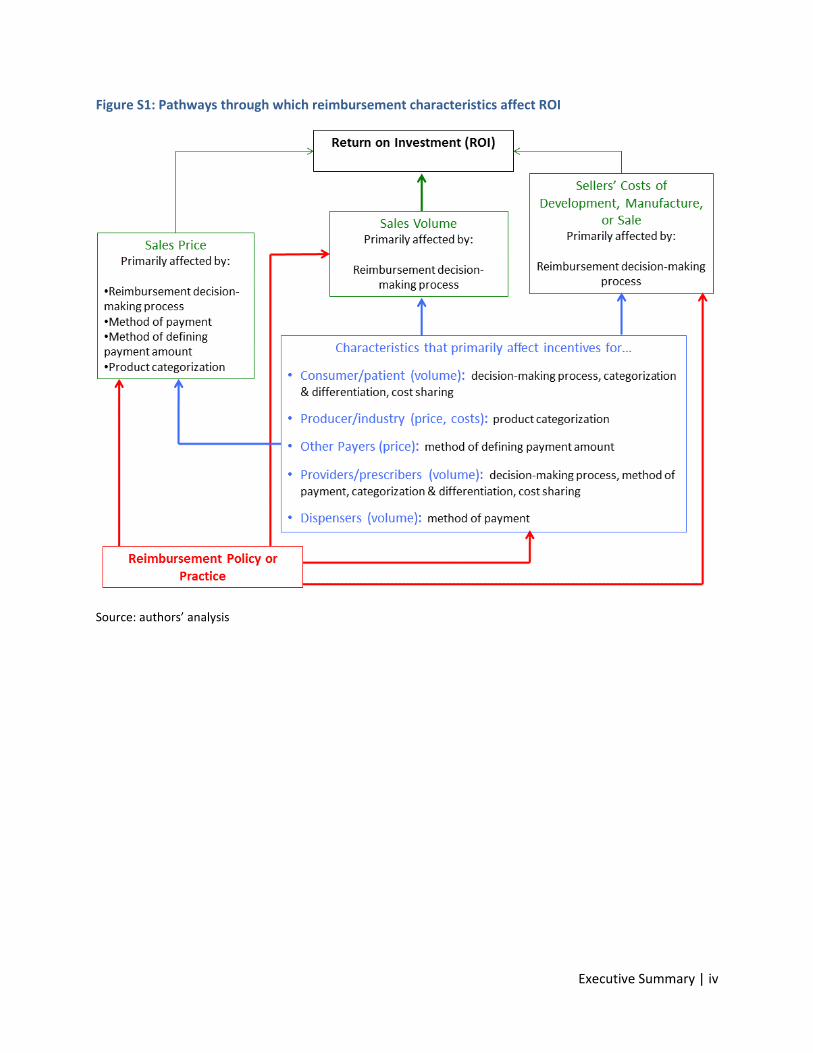
Figure S1 identifies the primary pathways through which the five aforementioned characteristics of
reimbursement policies and practices influence ROI. Although there are direct paths of influence, the
connections are not direct in most cases. The distribution systems for healthcare technologies involve
many actors and intermediaries whose actions affect ROI for manufacturers, and influence the
reimbursement policies and practices used by payers. This complexity makes effects harder to
determine and often ambiguous.
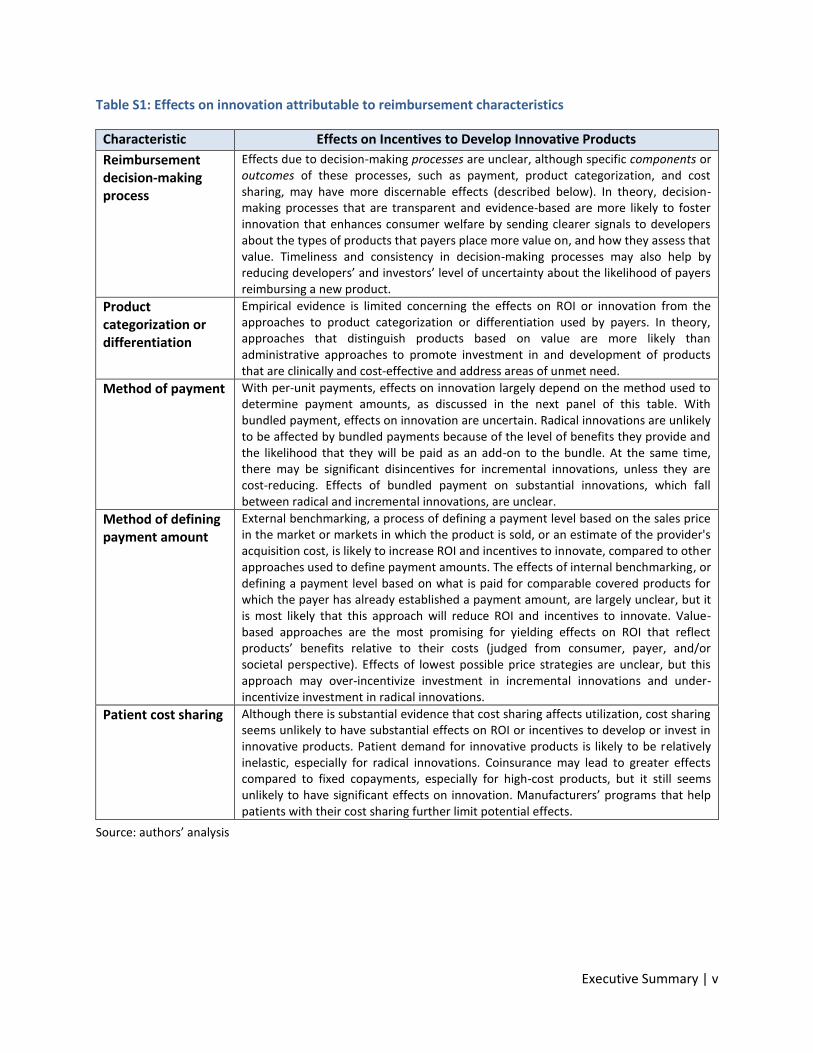
Table S1 summarizes our assessments of the direction and magnitude of effects on innovation from
each reimbursement characteristic. The primary takeaway is that it remains unclear precisely how
reimbursement policies and practices ultimately affect innovation. We found no empirical evidence to
directly connect reimbursement policies and practices with the quantity or quality of healthcare
technology innovation produced, so our conclusions are frequently drawn from economic theory.
The U.S. retains a pluralist framework with regard to the reimbursement decision-making process –
hundreds of payers use their own assessment approaches to reach their judgments, leading to
considerable variation. The lack of uniform decision-making weakens the ability of all but the largest
payers to motivate developers. The effects of different decision-making processes are hard to trace.
Theoretically, processes that are transparent and evidence-based will provide the clearest signals to
developers and favor development of products that address unmet needs and/or provide added value
over existing therapies.
Executive Summary | iv
Figure S1: Pathways through which reimbursement characteristics affect ROI
Source: authors’ analysis
Executive Summary | v
Table S1: Effects on innovation attributable to reimbursement characteristics
Characteristic Effects on Incentives to Develop Innovative Products
Reimbursement decision-making process
Effects due to decision-making processes are unclear, although specific components or outcomes of these processes, such as payment, product categorization, and cost sharing, may have more discernable effects (described below). In theory, decision-making processes that are transparent and evidence-based are more likely to foster innovation that enhances consumer welfare by sending clearer signals to developers about the types of products that payers place more value on, and how they assess that value. Timeliness and consistency in decision-making processes may also help by reducing developers’ and investors’ level of uncertainty about the likelihood of payers reimbursing a new product.
Product categorization or differentiation
Empirical evidence is limited concerning the effects on ROI or innovation from the approaches to product categorization or differentiation used by payers. In theory, approaches that distinguish products based on value are more likely than administrative approaches to promote investment in and development of products that are clinically and cost-effective and address areas of unmet need.
Method of payment With per-unit payments, effects on innovation largely depend on the method used to determine payment amounts, as discussed in the next panel of this table. With bundled payment, effects on innovation are uncertain. Radical innovations are unlikely to be affected by bundled payments because of the level of benefits they provide and the likelihood that they will be paid as an add-on to the bundle. At the same time, there may be significant disincentives for incremental innovations, unless they are cost-reducing. Effects of bundled payment on substantial innovations, which fall between radical and incremental innovations, are unclear.
Method of defining payment amount
External benchmarking, a process of defining a payment level based on the sales price in the market or markets in which the product is sold, or an estimate of the provider's acquisition cost, is likely to increase ROI and incentives to innovate, compared to other approaches used to define payment amounts. The effects of internal benchmarking, or defining a payment level based on what is paid for comparable covered products for which the payer has already established a payment amount, are largely unclear, but it is most likely that this approach will reduce ROI and incentives to innovate. Value-based approaches are the most promising for yielding effects on ROI that reflect products’ benefits relative to their costs (judged from consumer, payer, and/or societal perspective). Effects of lowest possible price strategies are unclear, but this approach may over-incentivize investment in incremental innovations and under-incentivize investment in radical innovations.
Patient cost sharing Although there is substantial evidence that cost sharing affects utilization, cost sharing seems unlikely to have substantial effects on ROI or incentives to develop or invest in innovative products. Patient demand for innovative products is likely to be relatively inelastic, especially for radical innovations. Coinsurance may lead to greater effects compared to fixed copayments, especially for high-cost products, but it still seems unlikely to have significant effects on innovation. Manufacturers’ programs that help patients with their cost sharing further limit potential effects.
Source: authors’ analysis

Executive Summary | vi
There is limited evidence concerning the effects of different approaches to product categorization and
differentiation. Theoretically, evidence-based and value-based approaches offer the potential to have a
positive impact on innovation, and interest in value-based insurance designs continues to grow. The
unique nature of the U.S. healthcare system, with its multitude of payers and lack of central decision-
making, offers challenges for implementation of value-based approaches, such as reaching agreement
on what constitutes “value.” Our case study of the Premera Blue Cross value-based formulary pilot
program highlights some additional challenges, including difficulties in getting access to information
needed to assess value and measuring benefits to patients.
While payment methods vary, the fundamental distinction is whether payers compensate providers or
suppliers of healthcare technologies on a per-unit basis or as part of a bundled payment for a package of
goods and services used for a clinically-defined episode of care. Per-unit payments seem unlikely to
favor development of any particular type of innovation, but may also be ineffective at discouraging
development of non-innovative products. A shift to bundled payments from per-unit payments may
incentivize development of cost-reducing products (from the perspective of the payer), but may
discourage incremental innovations.
Payers currently are more likely to rely on external and internal price benchmarking, rather than value-
based pricing, to establish payment amounts. Experts consulted for this project also noted that unit
costs and budget impact play a role in other policies, such as patient cost sharing and use of utilization
management tools (e.g., prior authorization). Theoretically, broader use of value-based or outcomes-
based reimbursement would lead to lower returns on products and services offering little value added,
higher returns for products with higher value, and greater clarity about where the value-added is
uncertain. Our case study of the performance-based risk-sharing agreement for Velcade in the U.K.
illustrates some of the administrative and measurement challenges in establishing performance-based
payment.
The effects of reimbursement policies and practices on innovation may also be muted by the ability of
developers to strategically price their products. Manufacturers’ pricing models take into account
expectations about lost sales due to higher costs or cost sharing; complex and secretive rebate and
discounting mechanisms favor high list prices; and cost sharing offset programs reduce the negative
effects on demand when payers apply patient cost sharing. Patient cost sharing does not appear to be
an important barrier to innovation at present, at least for substantial or radical innovations. However,
with growing levels of patient cost sharing, broader use of coinsurance, and very high list prices for new
products, the balance may tip if utilization drops more than manufacturers anticipate or can
compensate for with cost-sharing offset programs, or if manufacturers lose pricing power.

Page | 1
INTRODUCTION
There is a long-standing belief that the extent and nature of product reimbursement is a significant
factor in the development decisions of potential innovators of healthcare technologies such as drugs,
biologics, vaccines, and medical devices, and of the investors who finance them. Analysts posit that
payers influence the entry of new products into the market, and their policies have a substantial impact
on research and development (R&D) decisions and whether companies choose to advance a technology
to market.3 Experts consulted during this project not only agreed that reimbursement is an important
factor in R&D and investment decisions, but also that its influence is growing in importance as the unit
costs of many new products exceed the point at which third-party coverage is essential for individual
affordability. They also noted that developers approach payers – especially CMS, but also private
insurers – during development of new products to try to understand how (or if) a product would be
covered, and how payments would be structured.
It is less clear how reimbursement affects innovation. In setting out a conceptual model linking
reimbursement and innovation, drawing on economic theory and relevant material from the literature,
we established that reimbursement policy is one of many influences that affect the expected return on
investment (EROI) for developers, investment decisions, and choices about how to direct research and
development (R&D) resources (Figure 1).4 It is not necessarily among the most important drivers in
every circumstance and may play different, and evolving, roles with respect to drugs and devices. Other
measures, such as the concentration or volume of venture capital directed at specific developers or
particular product areas, may be partial proxies for the amount and type of innovation being
supported.5
In most product markets, sellers set prices in response to perceived demand and willingness to pay by
consumers. Two key problems confound healthcare technology markets. One is third-party payment,
which makes consumers less sensitive to price. It also has an inflationary effect on both utilization and
price. The second problem is that the physicians or health care organizations who act as decision makers
on patients’ behalf may be insensitive to price at the point of prescribing or dispensing the product.
They are also likely to be less sensitive to price than a consumer spending his or her own money. These
market distortions can lead to excess consumption, as well as to consumption decisions that are
inconsistent with the benefits or value a product offers in relation to available alternatives. For these
3 Chambers, J., May, K., & Neumann, P. (2013). Medicare covers the majority of FDA-approved devices and Part B
drugs, but restrictions and discrepancies remain. Health Affairs 32(6):1109-1115. 4 Bruen, B., Cohen, J., DiMasi, J., Docteur, E., Dor, A., Lopert, R., …, Shih, C. (2014).Task 3a deliverables: conceptual
model, recommended characteristics for analysis, and analytical framework. Interim report for the Impact of
Reimbursement Policies and Practices on Healthcare Technology Innovation project (Department of Health
and Human Services' Contract# HHSP23320095635) 5 Ackerly, D.C., Valverde, A.M., Diener, L.W., Dossary, K.L., & Schulman, K.A. (2009).Fueling innovation in medical
devices (and beyond): Venture capital in health care. Health Affairs, 28(1): w68-w75.

Page | 2
reasons, it falls to payers, through reimbursement policies, to offset market distortions by encouraging
use of healthcare technologies in cases where the benefits justify the costs.
Figure 1: Determinants of EROI in healthcare technology innovation
Source: authors’ analysis
While drug and device expenditures account for a relatively small share of health care expenditures, the
absolute amounts are large, and their use can impact other health care costs. Reimbursement strategies
and policies directly impact the amount spent on these new technologies, and so it is important to
understand their impact on both the allocation of scarce national resources and the incentives that
developers and investors have to invest in innovation.
It is also important to understand the incentives that reimbursement policies and practices create,
because they can differentiate rewards for products on the basis of assessed value, making them
instrumental levers for encouraging valued types of innovation. Conversely, payers may use certain
reimbursement policies and practices to limit use of novel technologies that fail to provide health
benefits exceeding those offered by existing products (for example, by making them non-preferred
products on a formulary). Or, they may set payment levels for these products that make them less
expensive than existing products and therefore improve consumer welfare by reducing treatment costs.
Experts consulted during this study agreed that reimbursement is one way payers signal what they value
to potential innovators. There was a general sense that reimbursement is still a relatively “crude” signal,
but it has (still largely untapped) potential to become more nuanced.

Page | 3
RESEARCH OBJECTIVE AND QUESTIONS
The objective of this research project was to describe current reimbursement methodologies and
analyze their impacts on drug and device use and innovation, based on economic theory, review of
literature, and expert consultation. The following research questions form the basis for this inquiry:
• What are the key characteristics of reimbursement methods and how do they affect pricing,
utilization, healthcare spending, and provider and patient decision-making?
• What are the key drivers (statutes, social consensus, cost containment, etc.) of the use of
different reimbursement methods? Do different payers have different goals?
• How do the key characteristics of reimbursement methods affect innovation in drugs and
devices?
In addition, this research effort examined three specific reimbursement programs identified by experts
consulted during this project as not widely used, but worthy of closer examination to see if they have
the potential to encourage (or discourage) future innovation. These brief case studies address a final
research question:
• What are promising emerging reimbursement strategies to foster useful innovation that
improves societal wellbeing?
ORGANIZATION OF THE REPORT
This report describes the findings from our analyses of key reimbursement characteristics and case
studies. The methods section that follows describes our approach to the project, including definitions
for key terms, development of a conceptual framework and analytic framework, and our approaches to
gathering information through reviews of the literature, expert consultations, and studies of specific
reimbursement approaches that experts viewed as potential drivers of incentives to innovate. The
results section begins with a discussion of our framework, outlining the pathways through which
reimbursement may influence innovation. This discussion is followed by a short introduction to five
characteristics of reimbursement methods selected for analysis; further detail on these characteristics
and factors that contribute to the use of different reimbursement methods is included in Appendix A.
The majority of the results section focuses on how reimbursement strategies and policies may impact
innovation through financial incentives, pricing, and multiplier effects. The results section includes key
findings from our case studies; complete write-ups of each case are included as appendices B-D. The
conclusion section highlights important takeaways from our analysis.

Page | 4
METHODS & ANALYTICAL FRAMEWORK
DEFINING KEY TERMS
The project team developed working definitions of key project terms by assessing alternatives, based on
definitions in common use in research and policy domains.
REIMBURSEMENT
For the purposes of the study, reimbursement is an umbrella term for the policies and practices that
define the terms of coverage and payment for a healthcare technology. More specifically,
reimbursement policies or practices encompass the implicit or explicit decisions of a health plan or
public program that provides health insurance coverage (e.g., Medicare, Medicaid) – or actors, such as
pharmacy benefit managers (PBMs), authorized to act on behalf of the plan or program with respect to
healthcare technology decision-making – that:
Establish whether or not a healthcare technology is a benefit covered by the health plan or
public program;
Define the terms under which a healthcare technology is covered;
Define the method of payment to the provider, dispenser or supplier of a healthcare
technology;
Set or limit the amount the third-party payer will pay to the provider, dispenser or supplier of a
healthcare technology, as well as the terms of any discounts or rebates supplied, or;
Set or limit any cost-sharing to be incurred by patients using the healthcare technology.
PAYERS
We use the term payers to refer to public health coverage programs and private health insurance plans.
Payers are distinguished from purchasers in that they do not take possession of a drug or device, but
instead compensate those who have purchased health-care technologies used by their beneficiaries or
enrollees through the reimbursement policies and practices they adopt. PBMs that operate their own
mail-order pharmacy services act as purchasers, as do hospitals and health systems like Kaiser
Permanente and the Veterans Health Administration, which integrate the provision of coverage with the
provision of care.
Payers in the United States often employ subsidiaries to serve as managers of some or all health
benefits. Examples include Medicaid managed care plans; Medicare Advantage plans; stand-alone
Medicare prescription drug plans (PDPs); and PBMs. PBMs help design and administer drug benefits for
public payers, private health plans, and self-insured groups (e.g., employers and organizations). The role
of subsidiaries is important to take into account when analyzing the implications of reimbursement
practices and policies employed by payers. Importantly, their widespread presence introduces

Page | 5
complications in analyzing the impact of payment methods on outcomes, in that subsidiaries tend to
face incentives that differ from those of payers.
Subsidiaries are often well-equipped and motivated to make decisions leading to savings in areas for
which they are contractually responsible (e.g., pharmacy benefits), although the extent to which the
savings are shared with, or passed on to, payers and consumers varies, depending on factors such as
contractual terms and extent of competition among subsidiaries. Furthermore, depending on the terms
of their contracts, subsidiaries may not benefit from any savings that accrue on the medical benefit side
because of their decisions, and may be less motivated to make decisions that may involve higher up
front expenditure but deliver downstream savings. A growing awareness of problems associated with
subsidiary incentives have led to the creation of so-called “transparent model” PBMs that purport to
pass through to the sponsor all negotiated discounts. These PBMs were estimated to account for 10% of
the market in 2013.6
INNOVATION
The analytical focus of this study is healthcare technology innovation that enhances consumer welfare.
Drawing upon a review of the relevant policy and research literature, we define an innovative healthcare
technology as a new product that (a) meets a previously unmet or inadequately met health need and
that (b) offers enhanced effectiveness in comparison with existing therapeutic alternatives. We describe
a way to classify innovations as incremental, substantial, or radical, depending on the significance of the
unmet need addressed and the extent of additional benefit (comparative effectiveness) offered. We
further stipulate that healthcare technologies, innovative or not, can be said to enhance consumer
welfare when they are offered at a price that is below the maximum price consumers would be willing
to pay. In so doing, we take an approach that is consistent with the traditional economic concept of
consumer surplus.
Experts consulted during this project noted that the issue of who defines “innovation” is significant, as
what is considered to be “innovative” can vary between the payer and the developer, and among
payers. For example, one expert noted that payers may not view once-per-day drug dosing as
innovative compared to twice-per-day dosing unless health outcomes are better with the single dose,
although some payers may view the once-per-day product as innovative if it reduces costs.
Starting from a definition of innovation as “(the) development of new drugs or devices or evidence
related to drugs or devices that improve consumer welfare,” we defined innovative products (drugs and
devices) as those able to address diseases and conditions for which there is a substantive (i.e., non-
trivial) unmet or inadequately met need. We also defined a classification scheme for differentiating
innovations in terms of the level and/or type of innovation they represent (Table 1). To arrive at this
arrangement, we reviewed and assessed innovation classification schemes currently in use in drug and
6 Eban, K. (2013, October 23). Painful prescription: Pharmacy benefit managers make out better than their
customers. Fortune.

Page | 6
device regulation, pricing and reimbursement schemes, and in the academic literature. We designed the
scheme to be consistent with our definition of innovation, reflective of the social welfare perspective
adopted for this project, and to be useful in distinguishing the impact of various types of reimbursement
characteristics and methods/strategies on motivations to innovate.
Table 1: Classification schema for innovative healthcare technologies, with examples
Extent of Comparative Benefit
Gravity of Unmet Need
Addresses Lesser Unmet Need
Addresses Greater Unmet Need
Negative net health benefit compared to existing alternatives
Not Innovative Not Innovative
Comparable net health benefit compared to existing alternatives
Not Innovative Not Innovative
Modest net health benefit compared to existing therapies
Incremental Innovation
(Example: dopamine agonists for restless legs syndrome)
Substantial Innovation
(Example: tissue plasminogen activator [t-PA] vs. streptokinase
for acute MI)
Significant net health benefit compared to existing therapies
Substantial Innovation
(Example: Viagra for erectile dysfunction)
Radical Innovation
(Example: sofosbuvir vs. interferon for Hepatitis C)
Source: Authors’ analysis
We consider a healthcare technology to be a consumer welfare-enhancing innovation only if it meets
our definition of an innovation and generates consumer surplus. A product offers consumer surplus
where consumers’ willingness to pay exceeds the transaction cost, which we consider synonymous with
enhancing social welfare for the purposes of this study.
While our conceptual approach to consumer welfare is consistent with the notion of consumer surplus,
it is broader and more nuanced than the standard one-product/one-period framework. Total social
surplus is the sum of consumer and producer surplus. Producer surplus (the difference between the
effective price obtained by a developer and the marginal cost of producing and distributing the product)
cannot be ignored in this case, as it is highly relevant to innovation incentives. As commonly defined,
producer surplus will include, in addition to profits, the R&D expenditures that are used to fund
development of future products. Maximizing consumer surplus for a new product in a given period
leaves no room for current and future R&D. Thus, in a dynamic context, producers must appropriate
some of the social surplus created by new products to maintain incentives to continue to innovate.
In practice, the share of social surplus counted as producer surplus can seem low. For example, Philipson
and Jena found that producers of HIV/AIDS drugs were able to appropriate only 5% of the social surplus

Page | 7
generated by these products.7 Expanding on this work, Philipson and Jena examined more than 200
technologies in a cost-effectiveness registry and found that, in the case of the median technology,
producers captured only 15% of the social surplus.8 The modeling did not account for factors such as
public funding of R&D and the interpretation of cost-effectiveness analysis in a non-monopoly context
that can impact whether there is under- or over-investment in R&D, so further research is needed
before such conclusions can be reliably made.
On a conceptual level, however, we do need to account for incentives for future innovation. Thus, we
consider consumer surplus for a new product to be the present discounted value of the product’s
consumer surplus for all periods over its product lifecycle, plus the present discounted value of the
share of consumer surplus generated by all future new products whose R&D is funded in part by the
producer surplus of the original new product. Additionally, positive social benefits can be generated by
the introduction of a new product through effects on pricing and on the economies where R&D and
manufacturing are conducted. In general, our notion of social welfare is dependent on the following
factors:
Dynamic innovation (consumer surplus from additional new products developed with funding
from a new product’s producer surplus);
General equilibrium effects on demand and pricing (consumer surplus created from competitive
pricing within the drug class in both static and dynamic contexts [over time for the class and
from the production of new products in newer classes]), and;
Economic multiplier effects from R&D, manufacturing, and distribution.
The last effect is not unique to investment in this sector, and it may be small in relation to consumer
surplus created by the introduction of new products. Thus, our analyses focus on the impacts that
reimbursement methods and policies have on the introduction of new innovative products that create
positive consumer surplus.
7 Philipson, T.J., & Jena A.B. (2006). Who benefits from new medical technologies?: estimates of consumer and
producer surpluses for HIV/AIDS drugs. Forum for Health Economics & Policy, 9(2), ISSN (Online) 1558-9544. 8 Philipson, T.J., & Jena A.B. (2008). Cost-effectiveness analysis and innovation. Journal of Health Economics,
27:1224-1236.
Page | 8
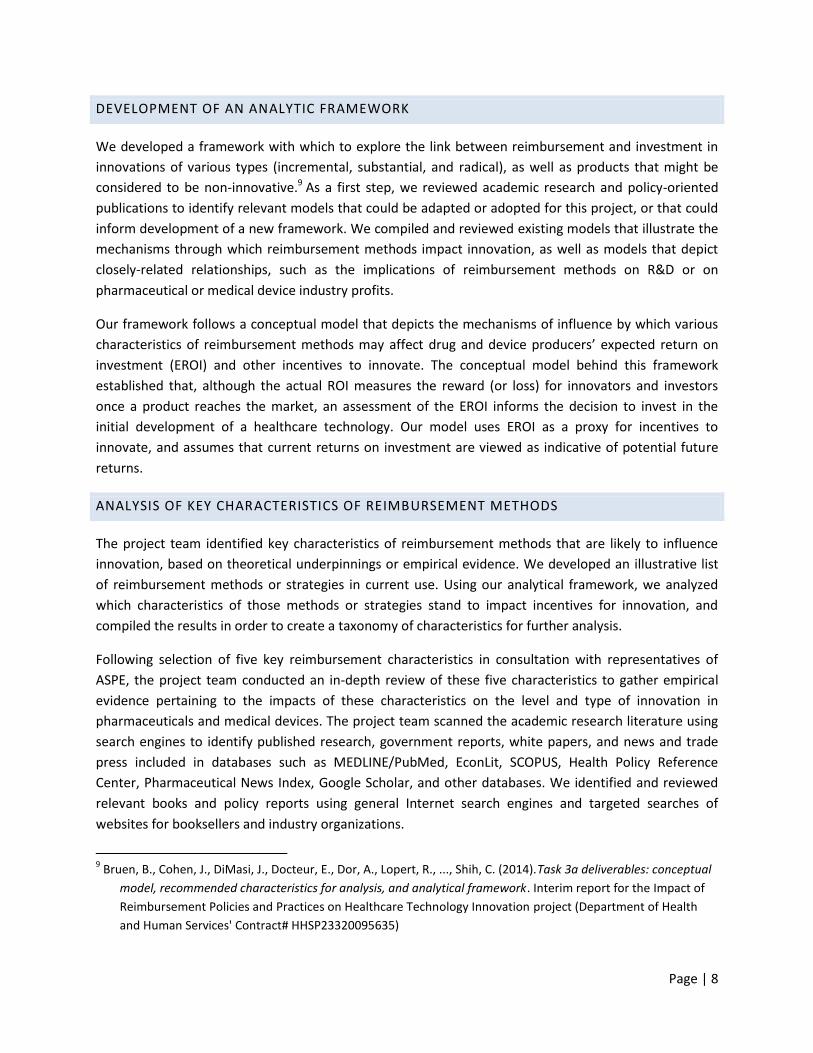
DEVELOPMENT OF AN ANALYTIC FRAMEWORK
We developed a framework with which to explore the link between reimbursement and investment in
innovations of various types (incremental, substantial, and radical), as well as products that might be
considered to be non-innovative.9 As a first step, we reviewed academic research and policy-oriented
publications to identify relevant models that could be adapted or adopted for this project, or that could
inform development of a new framework. We compiled and reviewed existing models that illustrate the
mechanisms through which reimbursement methods impact innovation, as well as models that depict
closely-related relationships, such as the implications of reimbursement methods on R&D or on
pharmaceutical or medical device industry profits.
Our framework follows a conceptual model that depicts the mechanisms of influence by which various
characteristics of reimbursement methods may affect drug and device producers’ expected return on
investment (EROI) and other incentives to innovate. The conceptual model behind this framework
established that, although the actual ROI measures the reward (or loss) for innovators and investors
once a product reaches the market, an assessment of the EROI informs the decision to invest in the
initial development of a healthcare technology. Our model uses EROI as a proxy for incentives to
innovate, and assumes that current returns on investment are viewed as indicative of potential future
returns.
ANALYSIS OF KEY CHARACTERISTICS OF REIMBURSEMENT METHODS
The project team identified key characteristics of reimbursement methods that are likely to influence
innovation, based on theoretical underpinnings or empirical evidence. We developed an illustrative list
of reimbursement methods or strategies in current use. Using our analytical framework, we analyzed
which characteristics of those methods or strategies stand to impact incentives for innovation, and
compiled the results in order to create a taxonomy of characteristics for further analysis.
Following selection of five key reimbursement characteristics in consultation with representatives of
ASPE, the project team conducted an in-depth review of these five characteristics to gather empirical
evidence pertaining to the impacts of these characteristics on the level and type of innovation in
pharmaceuticals and medical devices. The project team scanned the academic research literature using
search engines to identify published research, government reports, white papers, and news and trade
press included in databases such as MEDLINE/PubMed, EconLit, SCOPUS, Health Policy Reference
Center, Pharmaceutical News Index, Google Scholar, and other databases. We identified and reviewed
relevant books and policy reports using general Internet search engines and targeted searches of
websites for booksellers and industry organizations.
9 Bruen, B., Cohen, J., DiMasi, J., Docteur, E., Dor, A., Lopert, R., ..., Shih, C. (2014).Task 3a deliverables: conceptual
model, recommended characteristics for analysis, and analytical framework. Interim report for the Impact of
Reimbursement Policies and Practices on Healthcare Technology Innovation project (Department of Health
and Human Services' Contract# HHSP23320095635)

Page | 9
EXPERT CONSULTATIONS
The project team identified and consulted with a range of experts to complement our review of the
research and other evidence. These experts, listed in Appendix E, included:
• Faculty, researchers, and consultants;
• Representatives of firms engaged in drug and device development;
• Investors specializing in healthcare technologies, and;
• Representatives of commercial payers, PBMs, and government agencies that pay for healthcare
technologies.
Consultations occurred via teleconferences and individual telephone calls. The questions for each
session varied according to the panel’s expertise, but covered topics such as:
• Factors that influence how developers/investors target investments to develop new healthcare
technologies, or to find new applications for existing technologies;
• How a product's future market environment, including reimbursement prospects and
uncertainty, affects product development or investment decisions;
• Which components or characteristics of reimbursement are most important in influencing how
much and what kind of new healthcare technologies are developed;
• How more widespread use of particular reimbursement methods in the United States might
change product development or investment decisions;
• Factors that influence payers’ reimbursement decisions;
• How payers determine the reimbursement amount for a given healthcare technology;
• Actions by payers that may foster (or inhibit) future drug and device innovation, and;
• How reimbursement policies or practices that are emerging or becoming more widespread
might foster or inhibit investment in consumer welfare-enhancing healthcare technologies.
Each session was recorded and transcribed for reference by project staff. Summaries of each meeting
were reviewed and approved by the project team and ASPE representatives.
CASE STUDIES
Based on our review of the literature and expert consultations, the project team identified examples of
reimbursement methods and programs in private and public markets as candidates for case studies.
Candidates included emerging models, as well as older methods that appeared to be gaining interest.
ASPE representatives selected three examples for further analysis. These case studies sought to answer
the following questions:
• What are the objectives/rationale of the method or program?
• What are the key characteristics of the method or program?
• Is the approach novel or is it a variation of an already established program or method used
elsewhere?
• What is the stated or implied theoretical basis of the approach/method?

Page | 10
• How might broader use of the method or program influence innovation in drugs or medical
devices?
Using the list of characteristics of reimbursement methods with the greatest potential to impact
incentives to innovate, and applying the framework for analyzing how reimbursement affects drug and
device innovation that we developed, we qualitatively analyzed the potential impacts of the selected
examples on incentives to develop innovations that improve consumer welfare.
We examined three specific examples of reimbursement policies and practices, each identified by
experts consulted during this project as not widely used, but worthy of closer examination to see if they
have the potential to encourage (or discourage) future innovation: an advance market commitment, a
value-based drug formulary, and a performance-based funding arrangement.

Page | 11
RESULTS
Consistent with our conceptual model, the experts consulted in
this project cited human curiosity, investment in
science/research (public and private), and assessments of
clinical need as important factors in fostering initial investment
in discoveries, but there was broad agreement that
reimbursement is a critical factor in determining which
products reach the market. Experts noted that attractive
candidates for investment require positive assessments of
clinical need and anticipated reimbursement, and that
potentially innovative products still may not make it to market
if assessments fail to justify the continued investment to
develop them. They noted that investors may look for products
that offer significant improvements compared to the current
standard of care, or are otherwise differentiated from
technologies likely to appear in the near term, as this
competitive advantage usually translates into more “durable”
pricing and stronger reimbursement.
Experts interviewed for this project noted that developers
approach CMS, private insurers, and other payers during
development of new products to try to understand how (or if)
a product would be covered, and how payments would be
structured. For drugs, discussions between payers and
developers may occur as early as Phase II, to determine the
endpoints of interest to payers for later trials. A popular
guidebook for device developers puts “payer advocacy”
approximately one year prior to expected launch and
“conduct[ing] payer education” roughly eight months prior to
launch. However, the authors note that timelines vary
considerably depending on the type of device, whether it fits
under an existing reimbursement code or needs a new one,
and other factors.10
The experts we interviewed also suggested that
reimbursement is growing in importance as the unit costs of
new products exceed the point where third-party coverage is
10
Yock, P., Zenios, S. A., & Brinton, T. J. (2015). Biodesign: the process of innovating medical technologies. 2nd
Edition. Cambridge University Press.
Quotes from experts
My general experience is that
when organizations invest in early
discovery, it’s mostly driven by
science… after the product gets
further along in its development
life cycle and larger and larger
investments are needed, that’s
when people start thinking more
about the clinical utility… the value
in the marketplace… will physicians
want to prescribe it… will payers
want to pay for it? But there is a
trend… in general to move that
marketplace insight earlier in the
development process.
[At the last few places I have
worked, investment is] primarily
driven initially by the clinical
need… You are trying to solve that
problem up front... and then the
second question usually resolves
around the business side… the
regulatory path, the
reimbursement, the market size.
We have a very formal process that
we begin very early in product
development life cycle, and we
have our reimbursement staff
across the company very involved
in assessing the reimbursement
aspects…
Page | 12
essential for individual affordability. The broad availability of reimbursement through insurance likely
contributes to higher costs for healthcare technologies. New products need reimbursement, but
reimbursement leads to new products, which creates the need for more reimbursement.
Reimbursement also decreases cost sensitivity for consumers, so manufacturers can charge higher
prices.
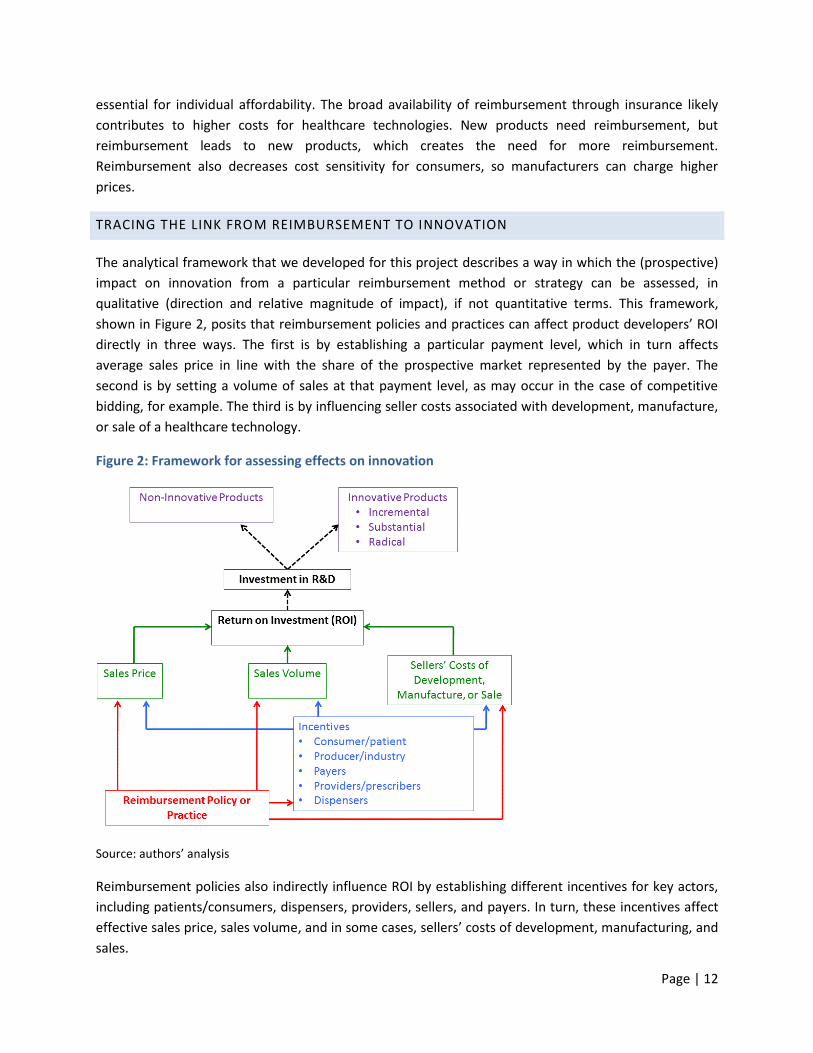
TRACING THE LINK FROM REIMBURSEMENT TO INNOVATION
The analytical framework that we developed for this project describes a way in which the (prospective)
impact on innovation from a particular reimbursement method or strategy can be assessed, in
qualitative (direction and relative magnitude of impact), if not quantitative terms. This framework,
shown in Figure 2, posits that reimbursement policies and practices can affect product developers’ ROI
directly in three ways. The first is by establishing a particular payment level, which in turn affects
average sales price in line with the share of the prospective market represented by the payer. The
second is by setting a volume of sales at that payment level, as may occur in the case of competitive
bidding, for example. The third is by influencing seller costs associated with development, manufacture,
or sale of a healthcare technology.
Figure 2: Framework for assessing effects on innovation
Source: authors’ analysis
Reimbursement policies also indirectly influence ROI by establishing different incentives for key actors,
including patients/consumers, dispensers, providers, sellers, and payers. In turn, these incentives affect
effective sales price, sales volume, and in some cases, sellers’ costs of development, manufacturing, and
sales.

Page | 13
While researchers have investigated the links between EROI, ROI, and pharmaceutical industry R&D
(see, for example, Scherer11), we found no empirical evidence that directly connects ROI with the
quantity or quality of healthcare technology innovation. In general, we assume that larger expected
returns on investment provide more incentives to invest in development of novel healthcare
technologies. We also assume that expectations and time horizons tend to differ between large,
established manufacturers and relatively small biotechnology firms and start-ups. The latter have
shorter-term horizons; the former have longer-term horizons. Innovators’ and investors’ expectations
and time horizons also vary by therapeutic class. These differences make it very difficult to draw general
conclusions about the link(s) between ROI and innovative products. The dashed lines between ROI,
investment in R&D, and the various categories of innovation illustrate this uncertainty.
We add a second level of assessment that separates each of the novel products into two groups: those
that enhance consumer welfare and those that do not. As noted earlier, we use consumer surplus – the
amount by which consumers’ willingness to pay exceeds the transaction cost – as the measure of
consumer welfare. We do not depict this assessment visually in Figure 2, but it essentially cuts each
category of novel products into two parts. For example, a non-innovative product may still enhance
consumer welfare by achieving comparable effects at lower cost, and an otherwise-innovative product
may fail to enhance consumer welfare if the opportunity costs of its acquisition and diffusion exceed the
value of the attained benefits. Similarly, a developer may view as innovative a pacemaker that offers
thousands of sophisticated monitoring options, but a payer may view the added complexity as
producing uncertainty or risks that may outweigh the benefits of the innovation, because individual
physicians can only understand a fraction of the options.
KEY CHARACTERISTICS OF REIMBURSEMENT METHODS
Different characteristics of reimbursement policies and practices serve to define payment levels, volume
of service, and seller costs. They also establish different incentives for key actors, which indirectly
influence these determinants of ROI. We selected five characteristics of reimbursement policies and
practices that appear to be important in explaining the impact of reimbursement policies and practices
in motivating and directing innovators’ efforts (Table 2).
11
Scherer, F. M. (2001). The link between gross profitability and pharmaceutical R&D spending. Health Affairs,
20(5), 216-220. doi:10.1377/hlthaff.20.5.216
Page | 14
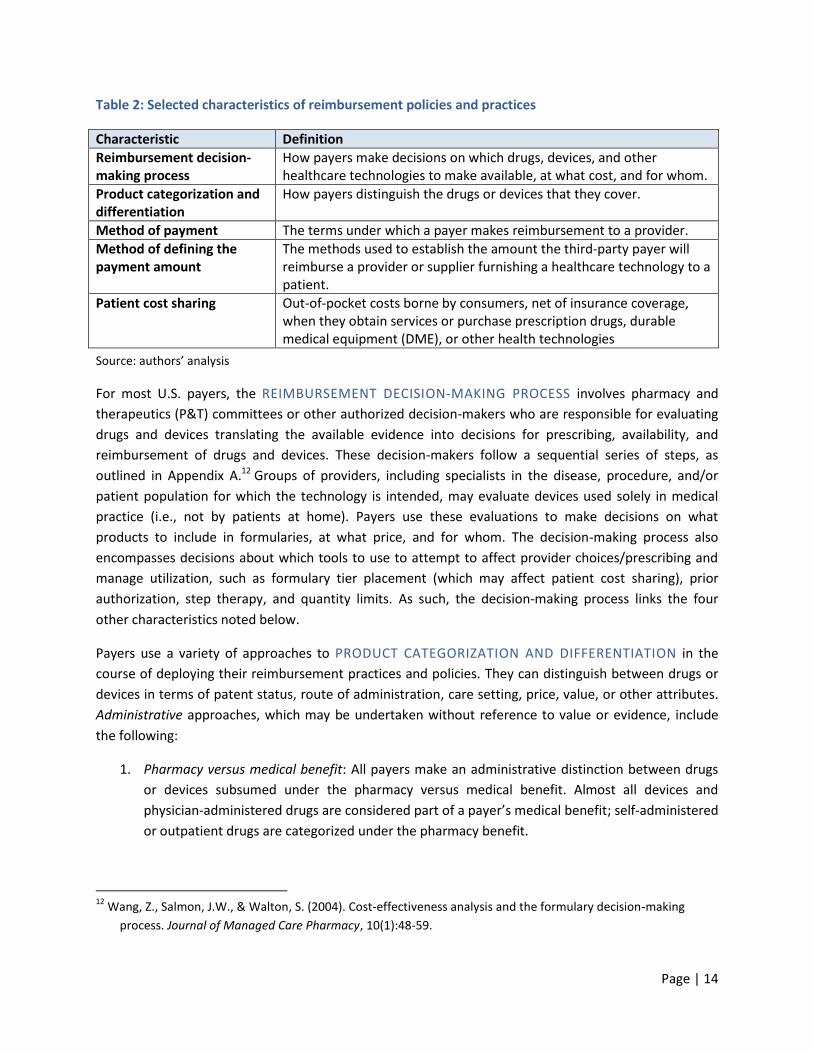
Table 2: Selected characteristics of reimbursement policies and practices
Characteristic Definition
Reimbursement decision-making process
How payers make decisions on which drugs, devices, and other healthcare technologies to make available, at what cost, and for whom.
Product categorization and differentiation
How payers distinguish the drugs or devices that they cover.
Method of payment The terms under which a payer makes reimbursement to a provider.
Method of defining the payment amount
The methods used to establish the amount the third-party payer will reimburse a provider or supplier furnishing a healthcare technology to a patient.
Patient cost sharing Out-of-pocket costs borne by consumers, net of insurance coverage, when they obtain services or purchase prescription drugs, durable medical equipment (DME), or other health technologies
Source: authors’ analysis
For most U.S. payers, the REIMBURSEMENT DECISION-MAKING PROCESS involves pharmacy and
therapeutics (P&T) committees or other authorized decision-makers who are responsible for evaluating
drugs and devices translating the available evidence into decisions for prescribing, availability, and
reimbursement of drugs and devices. These decision-makers follow a sequential series of steps, as
outlined in Appendix A.12 Groups of providers, including specialists in the disease, procedure, and/or
patient population for which the technology is intended, may evaluate devices used solely in medical
practice (i.e., not by patients at home). Payers use these evaluations to make decisions on what
products to include in formularies, at what price, and for whom. The decision-making process also
encompasses decisions about which tools to use to attempt to affect provider choices/prescribing and
manage utilization, such as formulary tier placement (which may affect patient cost sharing), prior
authorization, step therapy, and quantity limits. As such, the decision-making process links the four
other characteristics noted below.
Payers use a variety of approaches to PRODUCT CATEGORIZATION AND DIFFERENTIATION in the
course of deploying their reimbursement practices and policies. They can distinguish between drugs or
devices in terms of patent status, route of administration, care setting, price, value, or other attributes.
Administrative approaches, which may be undertaken without reference to value or evidence, include
the following:
1. Pharmacy versus medical benefit: All payers make an administrative distinction between drugs
or devices subsumed under the pharmacy versus medical benefit. Almost all devices and
physician-administered drugs are considered part of a payer’s medical benefit; self-administered
or outpatient drugs are categorized under the pharmacy benefit.
12
Wang, Z., Salmon, J.W., & Walton, S. (2004). Cost-effectiveness analysis and the formulary decision-making
process. Journal of Managed Care Pharmacy, 10(1):48-59.

Page | 15
2. Substitution: Payers use different approaches to encourage generic substitution as a cost-
containment measure. Over 80% of prescriptions dispensed in the United States are for
generics, and much of this is due to payers driving substitution of generic for originator
prescriptions.13 Generic drugs enhance consumer welfare when offered at prices below the
maximum price consumers would be willing to pay.
3. Rebate mechanism: Almost all payers and manufacturers negotiate rebates in exchange for
increased market share; a manufacturer of a particular drug rebates a certain amount to the
payer if the payer successfully increases sales of the drug. Payers influence market share by
granting a drug preferred status on the formulary. Preferred drugs are in lower patient cost-
sharing tiers, while non-preferred drugs are in higher cost-sharing tiers. More competitors in a
therapeutic class allows for larger rebates, as competition among products increases payer
leverage.
Value-based approaches include product exclusions; value based-insurance design; coverage with
evidence development; risk-sharing agreements; and other methods based on evidence or value.
1. Excluded products: A few PBMs have removed certain brand products with clinically equivalent
alternatives from the formulary entirely. One purpose of exclusions is to extract greater price
discounts and rebates. When a payer or PBM delists a drug or device, it rewards the
manufacturers of competing products with an increase in market share. Exclusions also cancel
out the value of manufacturers’ discount cards/coupons from cost-sharing offset programs.
2. Value-based insurance design (VBID): A 2010 review estimated that about one-third of payers
have adopted value-based insurance design, wherein they have reduced cost-sharing for a
number of “high-value” products and/or services in highly prevalent disease categories and
raised cost-sharing for certain “low-value” products and/or services. However, it is not always
clear what is “value-based,” most adopters only use this design for a very limited number of
therapeutic classes, and this still leaves a majority of payers (at least in 2010) who do not use
value-based insurance design at all. Value-based formularies, a form of VBID, differentiate
groups of drugs based on the disease or condition treated and the therapeutic effect of
treatment. We discuss one example, a value-based formulary pilot program run by Premera
Blue Cross, later in this report and in Appendix C.
3. Coverage with evidence development: Coverage with evidence development (CED) involves
coverage of a drug or device with the stipulation that payers and manufacturers collect post-
marketing data on the drug or device’s real-world safety and effectiveness. Given the possibility
of lags between marketing authorization and payer decisions to reimburse, as well as significant
uncertainty at launch, payers may be able to foster innovation by shifting more of the clinical
13
Kleinrock M. (2012). The use of medicines in the United States: Review of 2011. IMS Institute for Healthcare
Informatics. Parsippany, New Jersey.

Page | 16
evidence gathering to the post-marketing space while providing patients with access to the
products being evaluated. To continue to have market access, manufacturers will have to
demonstrate that their products confer added benefits.
4. Risk-sharing arrangements: Related to CED, “risk-sharing arrangements” (RSAs) between payers
and manufacturers have grown in number internationally, although there are more publicized
examples overseas than in the U.S. RSAs typically involve measurement of the performance of
a technology in a defined patient population over a specified period. They may tie
reimbursement for covered products to the measure of clinical outcomes; condition
continuation of coverage of a product on meeting specified responses to treatment or absence
of disease progression; or tie reimbursement to financial or utilization outcomes.
There has been limited experience to date in performance-based risk sharing both in the U.S.
and other countries. Challenges to broader implementation include high transaction costs; lack
of acceptable (e.g., valid, objective) outcome metrics; difficulties in determining treatment
effects; and the absence of suitable data capture systems. We examine these issues in the
context of a performance-based RSA for Velcade in the United Kingdom later in this report and
in Appendix D. Nearly all RSAs have been for drugs, but there was a well-documented United
HealthCare (UHC)/Genomic Heath (GH) performance-based RSA for the Oncotype DX diagnostic
that began in 2007, and other agreements involving diagnostics/devices have emerged in more
recent years.
In the United States, there is currently more use of administrative than value-based approaches.
In the United States, different METHODS OF PAYMENT are employed for drugs and devices used in the
care of hospital inpatients; physician-administered drugs and medical devices used in ambulatory care
settings; and prescription medicines and medical products prescribed for home use. The same payer
may use different payment methods for different plans (e.g., health maintenance organization [HMO],
preferred provider organization [PPO], point-of-service [POS]), and employers and other plan sponsors
may influence the payment method selected for a particular plan. Different payers also make different
reimbursement decisions, even when employing similar methods. The result is a complex system of
reimbursement involving many decision-makers and resulting in substantial variation among payers.
While methods vary, there is a fundamental distinction between whether payers compensate providers
or suppliers of healthcare technologies on a per-unit basis or as part of a bundled payment for a package
of goods and services used for a clinically-defined episode of care.14
In the case of prescription medicines and durable medical equipment (DME) used in the home
setting, per-unit payments are the norm; distinctions lie primarily in how per-unit payment
14
Both per-unit and bundled payments may be, and increasingly are, subject to retrospective adjustments,
withholds and/or bonuses based on meeting of performance targets (so-called pay for performance).

Page | 17
amounts are determined. For DME prescribed for home use, payers are increasingly using
competitive bidding for products judged therapeutically equivalent, while other products are
reimbursed according to a fee schedule.
Payers in the United States use bundled payments primarily for care associated with inpatient
and outpatient hospital treatment, although some are experimenting with bundled payments
for care provided in physicians’ offices and clinics.15
In general, bundled payments cover drugs provided in hospitals, and the hospital is not
permitted to bill the payer separately unless the drug exceeds a defined threshold cost.
Exceptions are often made for products designated as highly innovative and/or high cost, with
the result that default unit pricing is applied for those products.
Similar to drugs, devices and diagnostics used in inpatient and outpatient hospital care are
usually bundled, with exceptions for products subject to pass-through payments. Medicare is
working to expand the use of bundled payments for devices used in outpatient and ambulatory
care settings.16
Drugs administered by physicians in offices or clinics usually are paid on a per-unit basis.
As a rule, payers compensate pharmacies for each unit sold; however, specific payment levels
are negotiated with the pharmacies, and additional rebates or discounts may be negotiated
directly with the product manufacturers, such as part of a determination of formulary tier
placement.17
The use of similar payment methods in many areas by different payers likely reflects the influence of
Medicare, which is the largest single payer in the United States, and forged the path in developing
technical approaches and tools employed in payment methods. The up-front costs associated with
developing new methods can be significant, and private payers would likely face barriers to both
investment and deployment of novel methods.
Public and private payers use different guidelines and metrics to DEFINE THE PAYMENT AMOUNT
they will reimburse a provider or supplier furnishing a healthcare technology to a patient.18,19 In the
15
For example, Medicare tested bundled payments in the outpatient setting in the Medicare Cataract Alternative
Payment Demonstration. For further information, see: Painter, M. W., Burns, M.E., & Bailit, M.H. (2012, January).
Bundled payment across the U.S. today: Status of implementation and operational findings. Health Care Incentives
Improvement Institute Issue Brief. 16
Change is also under way on the ambulatory care front, where a move toward a more comprehensive approach
to reimbursement is being discussed because of concerns raised by medical device policy experts about code
stacking, a practice in which the payment for a diagnostic test is determined by adding up the costs of the
individual component steps. 17
Formularies are lists of reimbursable drugs or devices, which include provisions for patient cost-sharing as well
as coverage conditions. Formulary development is normally informed, in part, by evidence on the safety,
effectiveness, and/or cost of drugs and devices. 18
In the interests of clarity, we exclusively use the term “amount” to refer to how much a payer pays a provider for
a healthcare technology. Other terms in common use include payment rate and payment level.

Page | 18
case of bundled payment, payers seek to approximate the cost of drugs and devices used when defining
the bundled payment amount. Technological innovations are accounted for either through updates of
the bundle or pass-through payments, in the case of technologies considered to be highly innovative,
highly costly or both. When payers are reimbursing on a per-unit basis, there are four basic approaches:
External benchmarking, or defining a payment level based on the sales price in the market or
markets in which the product is sold, or an estimate of the provider's acquisition cost;
Internal benchmarking, or defining a payment level based on what is paid for comparable,
covered products for which the payer has already established a payment amount;
Value-based payment, or defining a payment level based on an assessment of the product's
value, such as benefits to the patient, to the payer, or to society as a whole, including cost
savings associated with use of the product in place of a therapeutic alternative, and;
Lowest possible price payment, or defining a payment level based on the lowest price that the
seller will accept.
External benchmarking is the most widespread approach in prescription drug pricing for publicly
financed health programs in the United States and most health systems in the developed world. For
example, most public programs in the U.S. benchmark payment levels for prescription drugs using
published prices from commercial vendors (e.g., average wholesale price [AWP]) or reported sales prices
between manufacturers and purchasers (e.g., average sales price [ASP] or pharmacy invoices). Because
Medicare publishes codes and payment rates, its payment levels are visible benchmarks and may
influence some payment decisions by other payers.20,21 Nevertheless, Medicare’s method of setting
payment levels for diagnostics, based on the average wholesale cost of the steps involved plus a mark-
up, is often criticized as being outdated, subject to gaming by laboratories, and not reflective of the
products’ underlying health benefits.22,23 Medicaid’s drug payment formulas are similarly criticized.24
19
This discussion focuses on the manner in which the initial payment amount is defined; a secondary question (not
addressed here) concerns how the payment amount is updated to reflect new evidence, changes in technology or
practice patterns, or other factors. 20
White, C. (2013). Contrary to cost-shift theory, lower Medicare hospital payment rates for inpatient care lead to
lower private payment rates. Health Affairs, 32(5):935-943. 21
Clemens, J., & Gottlieb, J. D. (2013, October). In the shadow of a giant: Medicare’s influence on private physician
payments. NBER Working Paper No. 19503. Cambridge, MA: National Bureau of Economic Research. 22
Carlson, B. (2010). Seeking a coding solution for molecular tests: managing the estimated 1,700 molecular tests
now on the market is impossible without a unique CPT code for each test. What’s at stake? The future of
personalized medicine. Biotechnology Healthcare, 7(4), 16–20. 23
Gass Kandilov, A. M., Pope, G. C., Kautter, J., & Healy, D. (2012). The national market for Medicare clinical
laboratory testing: implications for payment reform. Medicare & Medicaid Research Review, 2(2),
mmrr.002.02.a04. http://doi.org/10.5600/mmrr.002.02.a04 24
U.S. Department of Health and Human Services’ Office of Inspector General. (2011). Review of drug costs to
pharmacies and their relation to benchmark prices. A-06-11-00002.

Page | 19
Reimbursement methods and payment rates used by private payers are usually proprietary and
confidential. The methods used to compensate pharmacies for drugs provided under the pharmacy
benefit programs of private payers in the United States, including Medicare Advantage Plans, most
Medicaid managed care plans, and Medicare Part D standalone drug plans, are largely unknown because
payers retain proprietary interest in their payment formulas.25 Only limited details, such as average
discounts from AWP based on small samples of employer-based plans, are publicly available.26 Private
payers typically negotiate payment terms directly with hospitals, physicians, and other providers.27
Because competitive pressures motivate private health plans to minimize costs, it is likely that many
private payers employ the lowest possible price approach, in which their payment amount is
determined by the degree of leverage they have in a market transaction when facing a particular seller
of a healthcare technology.28
A relatively smaller number of payers, such as insurers in Germany, the Netherlands, and the Czech
Republic, employ a form of internal benchmarking (commonly referred to as “reference pricing” or
“therapeutic reference pricing”) to define the maximum price they are willing to pay for a product that is
a) determined to be comparable to others, and b) where the payer has pre-established a payment
amount.29 Other payers, such as the national health services of the United Kingdom and of Sweden, are
experimenting with value-based payment.30
Though internal benchmarking is seldom used in the United States, one notable exception is Medicare’s
functional equivalence and least costly alternative policies. In the early 2000s, Medicare enacted policies
for a limited number of drugs and devices where the program would only pay the cost of the least costly
drug or device in the case of two or more drugs or devices that were deemed functionally or
therapeutically equivalent. A high-profile example was CMS’ decision to reduce the payment rate for
darbepoetin alfa (Aranesp) by considering it functionally equivalent to epoetin alfa (Procrit).31 The
25
Academy of Managed Care Pharmacy. (2013). AMCP guide to pharmaceutical payment methods, Version 3.0,
executive summary. 26
Pharmacy Benefit Management Institute. (2013). 2013-2014 Prescription drug benefit cost and plan design
report. 27
Sorenson, C., Drummond, M., & Burns, L. R. (2013). Evolving reimbursement and pricing policies for devices in
Europe and the United States should encourage greater value. Health Affairs, 32(4):788-796. 28
The use of this approach was discussed by experts representing payers who were consulted as part of the
research for this project. One expert opined that neither external price benchmarking nor leverage-based pricing
offered ideal outcomes, but that appetite for moving to value-based payment was not yet primed in the U.S.
context. 29
This approach is also used by Canada’s Patented Medicine Pricing and Review Board, which sets nationally
binding price caps for patented medicines sold in Canada. Canadian payers (private plans and provincially-
administered public programs) use different approaches to define reimbursement payment levels. 30
Paris, V. & Belloni, A. (2013). Value in Pharmaceutical Pricing. OECD Health Working Paper no. 63. Paris: OECD. 31
Rubinstein E. (2006). Application of `functional equivalence’ to payment for office-administered
biopharmaceuticals. Biotechnol Healthc;3(6):64-65.

Page | 20
Medicare Prescription Drug, Improvement, and Modernization Act of 2003 (MMA) prohibited use of this
standard for other drugs, and CMS stopped applying it to Aranesp and Procrit in 2006.32 In 2008, the
U.S. District Court of the District of Columbia held in the case of Hays v. Leavitt that the least costly
alternative policy for another drug, DuoNeb (albuterol and ipratropium bromide), was not authorized
under Medicare’s statute.33 After the U.S. Court of Appeals for the District of Columbia Circuit upheld
the District Court’s decision, CMS instructed contractors to suspend and remove all least-costly
alternative provisions.34
PATIENT COST SHARING refers to out-of-pocket costs borne by consumers, net of insurance coverage,
when they obtain services or purchase prescription drugs, durable medical equipment (DME), or other
health technologies. A cost-sharing approach generally consists of two main elements: The cost-sharing
“method” refers to deductibles, fixed copayments, and variable coinsurance.35 The “level” of cost
sharing refers to the overall amount contributed by the beneficiary, such as high deductibles versus low
deductibles, or high copayment rates versus low copayment rates. Tiered cost sharing, which is closely
linked to the payer’s categorization or differentiation, adds an additional dimension.
There is substantial variation in cost sharing among different payers and plan offerings. Commercial
plans typically use a mix of deductibles, copayments, and/or coinsurance for medical services, DME, and
other devices. Deductibles and coinsurance are the main cost-sharing methods in Medicare’s Part A
(Hospital Insurance) and Part B (Medical Insurance).36 There is no annual limit on an individual’s cost-
sharing liability. Fixed copayments are much more common in Part C (Medicare Advantage; managed
care) and Part D (stand-alone Medicare prescription drug plans [PDPs]), which private carriers operate.37
Under Medicaid, states may require patient cost-sharing for many covered services, but the level is
generally limited to “nominal” fixed copayments; a beneficiary’s total annual cost-sharing is limited to a
32
Medicare Payment Advisory Commission (MedPAC). (2010, June). Enhancing Medicare’s ability to innovate.
Report to the Congress: Aligning Incentives in Medicare. Chapter 1. 33
Hays v. Leavitt, 583 F. Supp. 2d 62, 72 (D.D.C. 2008) 34
U.S. Department of Health and Human Services’ Office of Inspector General. (2012, November). Least costly
alternative policies: impact on prostate cancer drugs covered under Medicare Part B. (Report #OEI-12-12-
00210). 35
A deductible is an amount of healthcare spending that a participant must pay out-of-pocket before the health
plan pays for services. A copayment is a fixed out-of-pocket amount per service, prescription item, or device.
Coinsurance is a patient contribution set as a percentage of the price of the service, prescription item, or device. 36
In 2015, the Part A deductible is $1,260 for each hospitalization and there are copayments for extended stays in
hospitals and nursing facilities. Part B has a $147 deductible and most covered services require coinsurance equal
to 20% of the Medicare-approved payment amount. There are additional copayments for some services, such as
drugs provided with hospital outpatient services. 37
Part C plans use a mix of deductibles, copayments, and/or coinsurance, depending on the type of service and
provider. Copayments are also common in supplemental insurance plans, often called Medi-Gap plans, which
private companies offer to beneficiaries enrolled in Parts A/B. These plans may cover services that Medicare does
not pay for and make out-of-pocket costs more predictable.

Page | 21
modest percentage of family income; and federal law prohibits cost-sharing for several categories of
Medicaid beneficiaries and certain services.38 Most state Medicaid plans require cost sharing for
prescription drugs and DME.39
For prescription drugs, most commercial plans use tiered cost sharing with increasing levels on higher
tiers; fixed copayments are much more common than percentage coinsurance in these plans.40,41 Drug-
benefit specific deductibles, out-of-pocket limits, or maximum annual benefit limits for drugs are
relatively rare in commercial plans.41 In 2015, roughly 60% of Medicare Part D drug plans have a
deductible and nearly all have five cost-sharing tiers: two for generics (preferred/non-preferred), two for
brands (preferred/non-preferred), and one for specialty drugs.42 Although Part D plans use copayments
for most tiers, they are increasingly using coinsurance for non-preferred and specialty drugs.
Variations in cost-sharing approaches within the United States, and throughout the world, reflect the
diversity of payers. Within the U.S., national, regional (State) and local governments; employers; labor
unions; and other organizations make important decisions about the levels and methods of cost-sharing
in plans that they either operate directly (self-insured plans) or purchase from insurance companies
(fully-insured plans) for their employees, members, citizens, or constituents. Purchasers may have less
direct influence over the designs of fully-insured plans offered by commercial carriers, which frequently
offer a pre-determined menu of coverage options from which group purchasers select. Commercial
carriers also design plans for non-group markets, such as the insurance exchanges established by virtue
of the Affordable Care Act. All public and private insurance plans in the U.S. also operate within a web of
federal and state government laws and regulations that may influence the range of acceptable cost-
sharing levels.
38
Groups exempt from cost sharing in Medicaid include children under 18; individuals in foster care or for whom
adoption or foster care assistance is paid; terminally ill patients receiving hospice care; inpatients in hospitals,
nursing homes, and other institutions; and women eligible for breast or cervical cancer treatment. Cost sharing is
also prohibited for pregnancy-related services for pregnant women, emergency services, and family planning
services and supplies. 39
Federal regulations issued in 2013 allow state Medicaid programs to use higher cost-sharing levels for non-
preferred prescription drugs, including coinsurance of up to 20% of the cost of the drug for individuals with
incomes at or above 150% of the federal poverty level (FPL). 40
Kaiser Family Foundation & Health Research & Educational Trust (HRET). (2014). Employer health benefits: 2014
annual survey. Menlo Park, CA: Henry J. Kaiser Family Foundation. 41
Pharmacy Benefit Management Institute. (2013). 2013-2014 Prescription drug benefit cost and plan design
report. 42
Hoadley, J., Cubanski, J., Hargrave, E., & Summer, L. (2014, October 10). Medicare Part D: A first look at plan
offerings in 2015. Washington, DC: Henry J. Kaiser Family Foundation.

Page | 22
HOW REIMBURSEMENT CHARACTERISTICS AFFECT COMPONENTS OF ROI AND INCENTIVES
TO INNOVATE
As outlined in the analytic framework (Figure 2, above), reimbursement stands to affect the ROIs for
healthcare technologies, and EROIs for products in development, by influencing sales prices, sales
volumes, and sellers’ costs of development, manufacturing, and sale of these products. Prospective
innovators take into account expectations regarding the impact of current and expected future
reimbursement policies and practices when deciding to invest in R&D and directing investments to
particular therapeutic classes.43 They have greater incentives to invest in the types of innovations that
they expect will produce larger rewards; typically the desired rewards are monetary (i.e., ROI), although
some developers and investors may also attach importance to non-monetary rewards (e.g., discovering
a cure). Whether and how reimbursement occurs for a product influences its effective price and volume
of sales. These factors, in turn, determine the revenues and profits for the product, which are important
determinants of the ROI for its innovator and investors. A positive ROI rewards successful innovators
and will, in theory, spur the next generation of investment.
Drawing on economic theory, review of literature, and expert consultation, this analysis examined the
reimbursement policies and practices described in the previous section, and assessed the direction and
general magnitude of their effects on drug and device use and innovation. The findings suggest a
number of ways in which characteristics of reimbursement policies and practices can align technology
producers’ returns with the societal value of the innovations they produce. We discuss the effects of
each reimbursement policy and practice separately, below.
THE REIMBURSEMENT DECISION-MAKING PROCESS
Many outcomes of the reimbursement decision-making process have direct implications for sales prices
(through payment, rebates), sales volume (through approval or rejection, drug and device-use
conditions), and total costs to developers (through requirements for data for clinical and cost
effectiveness evaluations). Approaches used in making reimbursement decisions also impact patients
and care providers through availability of particular products, as well as payment and cost sharing for
drugs and devices, potentially leading to indirect effects on sales volume.
The U.S. retains a pluralist framework with respect to reimbursement decision-making. There are no
centralized pricing and reimbursement decisions; instead, hundreds of payers use their own assessment
approaches to reach their judgments. Although payers in the United States generally go through a
similar set of steps in the decision-making process (see Appendix A), differences in implementation lead
to many variations in the interpretation of evidence of clinical and cost-effectiveness for particular
products, and ultimately to the decisions on coverage and conditions of reimbursement. Variability in
43
Scherer, F.M. (2007, June). Pharmaceutical Innovation. AEI-Brookings Joint Center for Regulatory Studies:
Working paper No. 07-13. Retrieved from http://sacademy.cbv.ns.ca/staff/bdalzell/C1I/
Scherer%20Pharmaceutical%20Innovation%20SSRN-id902395-1.pdf

Page | 23
decisions may be appropriate, given that different employers, payers, and consumers may have
different preferences and objectives. At the same time, decentralization weakens the effect of decisions
made by all but the largest payers, in terms of ability to motivate developers. Experts consulted during
this project agreed, noting that although payers individually send signals about where developers should
invest, those signals are not coordinated and are not necessarily strong. There also may be a lag
between the signal and the industry response. Lags may be due to lack of scientific opportunity, which
contribute to waves of innovation when scientific breakthroughs occur, but may also occur when there
is significant uncertainty about how a new product would be reimbursed.
Payers also have varying levels of accountability and transparency. Public payers, namely those serving
beneficiaries in the non-commercial market, such as Medicare, Medicaid, Veterans Affairs, and Indian
Health Service, are generally expected to be more accountable and transparent than private payers. In
this respect, payers tend to reveal the general contours of their decision-making processes, though not
the specifics. For example, rebates are proprietary, so the public has no way of knowing their
magnitude. Payers have generally been hesitant to shed light on the actual evidence base and decision-
making process underlying their reimbursement decisions, so current formulary decision-making is
mostly a “black box.”44 Even when researchers attempt to pry it open, there are often unique factors
that influence each particular coverage decision. Hence, knowing the precise weights attached to factors
that figure in reimbursement decisions is difficult, if not impossible. This implies that developers must
anticipate different questions of value, depending on which payer (or set of payers) they are most
concerned with. It also means that there are less traceable and unambiguous assessments of the
direction or magnitude of effects attributable to the decision-making process itself, compared to specific
features discussed later in this section, such as product categorization, payment, and cost sharing.
During the clinical and/or economic evaluation phases, there may be disconnects between the amount
of evidence payers desire and what is available at the time decisions are made. Payers generally prefer
to review evidence from randomized clinical trials (RCTs) and other comparative effectiveness research
(CER) studies when assessing clinical and cost-effectiveness.45 Studies have noted that available data are
often inadequate or irrelevant to inform decision-making, due to the scarcity of relevant head-to-head
comparisons, a perceived lack of credibility with manufacturer-funded studies, and a paucity of available
economic information.46, 47 Comparative economic evidence is often generated post-launch in non-
randomized studies; therefore payers often seek other kinds of study designs, including retrospective
44
Dean, B.B., Ko, K.J., Graff, J.S., Localio, A.R., Wade, R., & Dubois, R.W. (2013). Transparency in evidence
evaluation and formulary decision-making. P&T, 38(8):465-483. 45
Wang, Z., Salmon, J.W., & Walton, S. (2004). Cost-effectiveness analysis and the formulary decision-making
process. Journal of Managed Care Pharmacy, 10(1):48-59. 46
Schiff, G.D., Galanter, W.L., Duhig, J., Koronkowski, M.J., Lodolce, A.E., Pontikes, P.,… Lambert, B.L. (2012). A
prescription for improving drug formulary decision making. PLoS Medicine, 9(5):1-7. 47
Neumann, P., Pei-Jung, L., Greenberg, D., Berger, M., Teutsch, S., Mansley, E.,… Rosen, A. (2006). Do drug
formulary policies reflect evidence of value? AJMC, 12:30-36.

Page | 24
claims analyses to get needed information.48 Industry experts and investors interviewed for this project
noted that manufacturers are beginning to anticipate payer data requirements before they start phase
III studies.
Payers also differ in the ways they approach the establishment of drug and device use conditions. In
certain instances, payers may not be able to employ the full array of utilization management tools,
including pricing and patient cost-sharing, due to limited treatment options, such as cases involving
orphan diseases, or owing to the sensitive nature of the disease, including life-threatening conditions
such as cancer or HIV/AIDS. Regulations may prohibit use of certain utilization management tools, such
as coverage limits and patient cost-sharing. In these instances, payers have less pricing leverage and may
be forced to manage pharmaceutical and device use through instruments such as prior authorization
and step therapy.
Ideally, there would be a correlation between preferred formulary placement (with lower patient cost
sharing) and greater cost-effectiveness, fewer safety concerns, and/or greater certainty around
evidence.49 However, evidence is mixed on the existence of an association between these factors and
preferred formulary placement. Furthermore, it is questionable whether cost-sharing tier placements
within formularies actually represent, on balance, evidence-based lists of products that reflect their
benefits, relative to costs.47 This suggests that evidence is either not being gathered, or if it is, it is not
always being applied in such a way that formularies reflect added value. 50,51,52 If a reimbursement
process rewards non-innovative products with a high ROI, this result muddles incentives for payers to
pursue more innovative products.
DESIGNING DECISION-MAKING PROCESSES TO FOSTER INNOVATION
Approaches to reimbursement decision-making force developers to anticipate questions of value in the
clinical development pipeline, not simply at or near the point of launch. Industry and investor experts
consulted for this study noted that there is a trend to start reimbursement assessments earlier in the
development process, mostly during Phase II and Phase III, although approaches vary among and within
industries. For example, one expert noted that some companies will not focus scientific research in
areas that do not fit within an existing code for reimbursement. Another noted that some companies
conduct formal reimbursement assessments very early in the product development life cycle. A third
48
Orszag, P. (2007). Addressing rising health care costs – a view from the Congressional Budget Office. NEJM
357:1885-1887. 49
Sorenson, C., Drummond, M., & Burns, L. R. (2013). Evolving reimbursement and pricing policies for devices in
Europe and the United States should encourage greater value. Health Affairs, 32(4):788-796. 50
Dean, B.B., Ko, K.J., Graff, J.S., Localio, A.R., Wade, R., & Dubois, R.W. (2013). Transparency in evidence
evaluation and formulary decision-making. P&T, 38(8):465-483. 51
Neumann, P.J., & Weinstein, M.C. (2010). Legislating against use of cost-effectiveness information. New England
Journal of Medicine 363: 1495-1497. 52
Neumann, P.J., & Greenberg, D. (2009). Is the United States ready for QALYs? Health Affairs 28(5): 1366-1371.

Page | 25
panelist noted that some companies, especially small ones, lack the expertise or resources to conduct
thorough market assessments. Discussions between developers and payers are usually proprietary,
although publicly available information indicates that payers and manufacturers discuss endpoints of
importance to the value assessment of a drug or other technology. The discussion among the experts on
our panels implied that device developers account for reimbursement earlier in the process than drug
developers, but this impression may be due to the (usually) shorter timeline for development of devices.
The discernible impact on incentives to innovate can be substantially affected by the manner in which
different reimbursement decision-making processes (by different payers) are transparent, evidence-
based, consistent, and timely. 53, 54 Theoretically, it might be expected that transparency in decision-
making would lead to a more competitive marketplace and fewer market distortions, which in turn
would lead to lower prices for products with less added value, and higher prices for those with more
added value. Patients, providers, policymakers, and manufacturers would benefit from having
information on how different formulary decisions are made, not merely what is on the formulary.
Knowing the kind of evidence used to inform formulary decisions could increase clarity with respect to
which factors are influential; consistency in understanding how other payers handle comparable
situations; and transparency by ensuring those involved in the decision-making process understand
what was decided and why.
An evidence-based process means that the rationale for decisions reflects relevant data on safety,
efficacy, cost-effectiveness, and budget impact. In theory, decisions that favor novel products aimed at
unmet needs, and which provide net benefits relative to existing therapies, should enhance consumer
welfare. Reimbursement decisions that fail to reflect the relative added value of a product will be
ineffective in establishing incentives for innovations that enhance consumer welfare. If payers do not
assess cost-effectiveness and take default “yes” decisions when data are absent, they are likely to be
creating incentives to overinvest in R&D. Ideally, lower expected ROIs for products that do not add
significant value would lead to less R&D spending on products deemed to be of less value, or that do not
address an unmet need.
Expanding data requirements for reimbursement decision-making, before and after product launch, are
a clear signal to developers of payers’ growing emphasis on better aligning their coverage and payment
decisions with outcomes and value. They also directly influence the total costs of development of new
products, to the extent that developers must conduct additional studies. Increased data requirements
carry some uncertainty for developers, to the extent that negative results may lead to less favorable
reimbursement decisions. Positive results, on the other hand, should improve a developer’s
reimbursement prospects.
53
Daniels, N., Sabin, J., & Teagarden, J. (2003). An ethical template for pharmacy benefits. Health Affairs,
22(1):125-137. 54
Luce, B., Cohen, R., Hunter, C., Cragin, L., & Johnson, J. (2008, April). The current evidence-based landscape.
Report prepared for the National Pharmaceutical Council.

Page | 26
It is unclear whether the drug development paradigm is changing in
response to increased evidence demands from payers, government
policymakers, and consumers. Anecdotal evidence suggests changes
may be under way, including the inclusion of active comparators in
clinical trials, involvement of stakeholders (e.g., patient
representatives, payers, and providers) to help define key Phase IIb
and III study design features, incorporation of patient-centered
outcome measures, and earlier planning for Phase IV studies.
However, we do not have firm evidence that this is indeed
happening.
Consistency in decision-making is desirable, although variation is to
be expected given the multitude of different payers. Patient access
may vary from one payer to another for the same drug or indication,
with the result that mixed signals are conveyed to manufacturers
regarding the relative value of their product to buyers. Transparency
and evidence-based rationales can help to explain these differences
and may encourage greater consistency, where appropriate.
Developers and investors have a dim view of uncertainty brought
about by an opaque decision-making process; they also want to
minimize delays in decision making between marketing
authorization and formulary placement, which shorten the effective
time in which a product has market exclusivity and can garner a
higher price and larger market share.55 We examined one approach
that can reduce uncertainty for developers, an advance market
commitment, in our case studies (Box 1).
55
Vernon, J., Goldberg, R., & Golec, J. (2009). Economic evaluation and cost-effectiveness thresholds. Signals to
firms and implications for R&D investment and innovation. Pharmacoeconomics, 27(10):797-806.
Expert’s quote:
Increasingly we are having to
think about what sort of
information payers are going
to demand for the product in
order to be able to list it on
formulary or provide
adequate reimbursement.
Expert’s quote:
One thing we’re really
focused on right now is…
achieving broad coverage
and reimbursement
throughout the world. The
bar is getting higher. The
evidence level is more
significant than it previously
was.
Expert’s quote:
The more uncertainty there
is in the market, the more
perceived risk there is, the
less investment.

Page | 27
Table 3: How the design of a reimbursement decision-making process may affect the marketplace and
innovation
Approach Impacts on Patients &
Providers Impact on Sellers (Manufacturers) Impact on Innovation
Transparent More understanding of the factors that drive decisions.
More understanding of the factors that drive decisions, and the types and amount of evidence required. Potential effects on sales prices if confidential discounts/rebates are exposed.
In theory, sends clearer signals to developers and investors about the types of products that payers (and patients) value. To the extent that payers value innovations, this should encourage more R&D targeted at those types of products.
Evidence-based More understanding of the evidence in favor of, or against, use of a particular product.
Could increase costs of development, if more or larger studies are required. May add some uncertainty due to the potential for negative results from additional studies, but sellers may gain pricing power if results are positive.
In theory, lower expected ROIs for products that do not add significant value would lead to less R&D spending on products deemed to be of less value, or that do not address an unmet need.
Consistent Patients and providers may prefer consistency – rather than unexplained variation – across the various formularies that they are faced with.
56
Less uncertainty in models of expected ROI for new products.
Unlikely to have a differential effect on R&D spending aimed at innovative vs. non-innovative products.
Timely More timely processes bring new treatments to patients and providers more quickly.
More timely processes get new products in use more quickly (in the case of positive decisions), or leave more time during the market exclusivity period for the developer to get more favorable placement (in the case of negative decisions).
Unlikely to have a differential effect on R&D spending aimed at innovative vs. non-innovative products.
Source: authors’ analysis
56
Landon, B.E., Reschovsky, J.D., & Blumenthal, D. (2004). Physicians’ views of formularies: Implications for
Medicare drug benefit design. Health Affairs 23(1):218-226.

Page | 28
BOX 1 | HI HEALTHINNOVATIONS: AN EXAMPLE OF REDUCING UNCERTAINTY WITH
ADVANCE MARKET COMMITMENTS
Uncertainty is a driving force behind product development and investment decisions; experts
consulted for this project agreed that a greater perceived risk is likely to be a disincentive for
investment. One method of reducing uncertainty for developers is an advance market
commitment, an agreement between the product developer(s) and potential purchaser(s) that
effectively guarantees a market for a proposed product. Although it initially took root in vaccine
development, the basic concept is applicable to other circumstances, in which a payer or group
of payers seeks to encourage development of a new product that the market does not currently
offer through direct investment or some form of prize for successful development.
Believing that meeting an unmet need for hearing aids would produce happier customers,
health benefits, and potentially lower health care costs, UnitedHealth Group invested directly in
a product and distribution model meant to fill that gap. hi HealthInnovations, an Optum
business and UnitedHealth Group company, worked with a manufacturing partner to develop
and produce hearing aids with a specific set of characteristics, at a price low enough to attract
subscribers and to make the overall cost affordable to the payer and to consumers. Initially, hi
HealthInnovations offered the hearing aids directly to the public and to people enrolled in
UnitedHealthcare’s Medicare Advantage and Part D plans, and later expanded to
UnitedHealthcare’s commercial and vision plans, as well as through programs directly to
employers and other health plans. Although we could not obtain evidence to directly measure
the success of the hi HealthInnovations program, it appears to have met its goals of filling an
unmet need for hearing aids by bringing to market advanced hearing aids at lower prices, and
improving access to hearing care.
Based on the definition of innovation used in this project, the hearing aids offered by hi
HealthInnovations might best be deemed incremental innovations. The advance market
commitment and new distribution model, rather than the devices, may be the greater
innovations, which helped to make hearing aids more affordable and accessible. The specific
approach in this case seems most appropriate for similar instances where a payer wants to
invest in a relatively low-cost device that does not require extensive testing or regulatory
approvals, and the payer has some ability to limit access to the new product. It may be less
applicable to devices requiring more extensive testing or regulatory approval or drugs, where
the costs of development may be higher or where the payer cannot control access to the new
product.
For more on hi HealthInnovations, see Appendix B.
Page | 29
PRODUCT CATEGORIZATION AND DIFFERENTIATION
The methods that payers use to categorize and differentiate products can affect innovation by
influencing pricing and utilization, creating distortions in the marketplace. Each payer categorizes and
differentiates drugs and devices. Different approaches to product categorization or differentiation
mostly have an indirect impact on EROI for innovative products, primarily by way of affecting behavioral
incentives and market competition. The degree to which product categorization and differentiation is
evidence-based is important. Ostensibly, payers establish formularies and categorize/differentiate
products on the basis of evidence of clinical efficacy and safety, the existence of treatment alternatives,
cost-effectiveness, acquisition cost, budget impact, and state and federal requirements and regulations.
As such, these reimbursement decisions are supposed to represent value as a proxy for consumer
welfare; i.e., what services, drugs, or devices a payer chooses to include in its medical benefit, or which
drugs appear on the formulary (list of covered drugs) tell manufacturers what is of value to payers and
consumers.57,58 Accordingly, prices and formulary parameters reflecting these categorizations may
impact development of new products by influencing developers’ EROI.
Differentiation can be effective in strengthening incentives to invest in valued innovation, as it may be
used to reward more clinically effective or cost-effective products with higher prices or increased
market share. Value-based approaches may reflect assessments of added effectiveness or other
benefits, but they are only used by a minority of payers in the United States. Most explicitly evidence-
based approaches are found in Europe and Australia. For example, France, Germany, and the
Netherlands, among other jurisdictions, have established so-called “premium pricing” for drugs and
devices considered to be “highly innovative,” unlike non-innovative drugs which are subject to reference
pricing. Notably, European jurisdictions have generally considered between 10% and 20% of newly
approved drugs and devices to be “highly innovative.”59
Table 4 summarizes the expected impact of numerous approaches to differentiation and categorization
on pricing, drug utilization, distortions in the marketplace, and innovation; comments on several of
these approaches follow the table. While different approaches taken to product categorization and
differentiation may offer varying incentives for future innovation, much remains uncertain because
empirical evidence is very limited. According to the experts consulted in the course of this study, many
payers in the United States presently lack sufficient incentives, data, and leverage to limit coverage,
payment, or utilization of products which offer little or no value added. There are more drugs available
57
Bouvy, J., & Vogler, S. (2013). Pricing and Reimbursement Policies: Impacts on Innovation. Background Paper 8.3.
WHO Collaborating Centre for Pharmaceutical Policy and Regulation. Retrieved from
http://www.who.int/medicines/areas/priority_medicines/BP8_3_pricing.pdf 58
Johanesson, M., Jonsson, B., Jonsson, L., Kobelt, G., & Zethraeus, N. (2009, October 1). Why should economic
evaluations of medical innovation have a societal perspective? OHE Briefing, No 51, Office of Health
Economics, London, U.K. 59
Cohen, J., Faden, L., Predaris, S., & Young, B. (2007). Patient access to pharmaceuticals: An international
comparison. The European Journal of Health Economics, 8(3):253-266.

Page | 30
on the market in the United States because of fewer restrictions, leading to more utilization and more
pharmaceutical spending.60
Table 4: Impact of different approaches to product categorization and differentiation on the
marketplace and innovation
Approach Impact on Pricing Impact on Utilization
Distortions in the Marketplace
Impact on Innovation
Administrative Approaches Pharmacy versus medical benefit designation
Market versus administrative pricing
Drugs in medical benefit not subject to formulary; drugs under pharmacy benefit are subject to formulary
Yes - due to administrative price-setting of physician-administered drugs
Negative - due to administrative price-setting of physician-administered drugs
Generic substitution
Downward pressure on prices of drugs in classes with generics, leading to more consumer welfare
More use of generics No In theory, more R&D in therapeutic areas without generics
Rebate mechanism
Unknown – savings pass-through is not revealed
Shift to preferred products on formulary
Yes – because preferred formulary placement is not evidence-based
Negative – due to rebates not being a function of value or evidence
Value-based Approaches Exclusion lists Downward pressure
on pricing of drugs in classes with excluded products
Shift to included products
Unknown; would depend on whether exclusion lists are evidence-based
In theory, more R&D in therapeutic areas without exclusions
Value-based insurance design (VBID)
Limited, given low numbers of enrollees affected; Theoretically, downward pressure on products with little value added, higher prices for products with higher value
Limited, given low numbers of enrollees affected; Theoretically, less utilization of products with little value added, more utilization for products with higher value
Not likely, except in the case of orphan drugs
In theory, more R&D towards “high-value,” “high impact” products (e.g., clinically and cost effective, targeting areas of unmet need)
60
Cohen, J., Malins, A., & Shahpurwala, Z. (2013). Compared to US practice, evidence-based reviews in Europe
appear to lead to lower prices for some drugs. Health Affairs, 32(4), 762-770.

Page | 31
Approach Impact on Pricing Impact on Utilization
Distortions in the Marketplace
Impact on Innovation
Coverage with evidence development (CED)
Limited, given low numbers of enrollees affected
Limited, given low numbers of enrollees affected
Not likely In theory, more R&D in clinically and cost-effective treatments, as well as areas of unmet need
Risk-sharing arrangement
Limited, given low numbers of enrollees affected
Limited, given low numbers of enrollees affected
Not likely In theory, more R&D in clinically and cost-effective treatments, as well as areas of unmet need
Oregon Medicaid’s prioritized list of health services
Limited, given low numbers of enrollees
Limited, given low numbers of enrollees affected
Potential spillover effect onto other Medicaid programs
In theory, more R&D in cost-effective treatments
Medicare contractor Palmetto’s MolDx program
Limited, given low numbers of enrollees; in theory, diagnostics will increasingly be priced in accordance with benefit provided to patients
Use by Palmetto of diagnostics with proven clinical utility linking diagnostic to health outcomes
Potential spillover to other Medicare contractors
In theory, more R&D towards diagnostics with improved clinical utility
Source: authors’ analysis
The choice of pharmacy versus medical benefit designation, generic substitution, and rebate
mechanisms are methods widely used by payers, and they are the only approaches that appear to have
a direct influence on sales prices. However, these three approaches are not necessarily evidence-based,
and not directed at promoting value or innovation. This also implies that they are not conducive to
bringing about investment in research targeting unmet needs.
The prevalence of generic or therapeutic substitution may serve as an incentive to steer manufacturers
away from incremental innovation and towards substantial or radical innovation, where the likelihood of
substitution is much lower. Substitution of either kind may have a significant impact on pharmaceutical
product development undertaking and focus. A recent empirical analysis found evidence of a negative
relationship between generic penetration and early-stage pharmaceutical R&D activity within
therapeutic classes; effects were stronger in classes where one might expect cross-molecular
substitution to be relatively high (e.g., anti-infectives, anti-hypertensives, anti-histamines), and not
statistically significant where substitution may be relatively low (e.g., neurological disorders).61 Low
61
Branstetter, L., Chatterjee, C., & Higgins, M. (2014). Starving (or fattening) the golden goose? Generic entry and
the incentives for early-stage pharmaceutical innovation. NBER Working Paper Series. Working Paper 20532.
Retrieved from http://www.nber.org/papers/w20532
Page | 32
levels of R&D investment may also reflect a variety of other factors, such as lack of scientific or
technological opportunities.
Rebates may introduce marketplace distortions or deviations from optimal pricing and utilization,
because it is unknown (considered proprietary information) how much of the negotiated rebate is
passed on to end-users. Also, preferred products may not be the highest value products, and are not
necessarily more cost-effective; the drugs’ preferred status is more likely to be a function of negotiating
power on the part of payers and manufacturers, than of evidence of value.
Theoretically, VBID could improve resource allocation and encourage development of high-value
products that would get preferential treatment with little or no patient cost-sharing. At the same time, it
could reduce incentives to invest in innovations to treat orphan diseases. This is because most orphan
disease treatments are often not considered cost-effective or good value for money, as manufacturers
charge high prices to offset relatively small prospective patient markets. Applications of VBID in the
United States have been relatively few in number and narrow in scope, so there is little empirical
evidence available to discern the potential impact on innovation from broader use. We looked at one
example in our case studies, a pilot program of a value-based drug formulary by Premera Blue Cross
(Box 2).
There are many examples of CED implementation in international markets. In the U.S., Medicare has
instituted CED programs for more than a dozen devices and a handful of drugs.62 The idea of only paying
for health technologies that work at least as well in real-world settings as they do in clinical trials is
intuitively attractive, and a downstream possibility with CED. With conditional access, manufacturers
know that there will be some access to their new products upon regulatory approval. Investors
anticipating this access will likely continue to invest in the products’ development. Alternatively, the use
of CED could hinder incentives to innovate, given the fear of an additional post-marketing hurdle. There
is anecdotal evidence that manufacturers may think this way.
Risk-sharing arrangements could influence innovation by establishing a pricing model in which payments
would be linked to value, as in a pay-for-performance arrangement. Firms would have to incorporate
value end-points (demonstrations of innovativeness) in development should this pricing model become
more widely used. Additionally, payments would be made over a period of time, during which health
benefits are realized and measured. For example, pricing could be set as a flat per-patient price,
regardless of the amount of the drug required to achieve the desired outcome, instead of the usual per
dosage or per unit amount. The performance-based patient access scheme (PAS) for Velcade in the U.K.,
which was the focus of our third case study (see Box 3), illustrates the promise and challenges that these
programs present.
62
Centers for Medicare & Medicaid Services. (2015, April 10). Coverage with evidence development. Retrieved
from http://www.cms.gov/Medicare/Coverage/Coverage-with-Evidence-Development/index.html

Page | 33
BOX 2 | PREMERA BLUE CROSS: A VALUE-BASED APPROACH TO PRODUCT
CATEGORIZATION & COST SHARING
The value-based insurance design (VBID) concept gained significant attention after its
introduction in the early 2000s in the form of a “benefit-based copayment.” Multiple
experts consulted during this project recommended VBID as a reimbursement strategy
worthy of further examination, in part because of its high profile. Although it has
generated much interest, applications to date have largely been limited to a few large self-
insured health plans, targeting relatively few drug classes or health conditions, and mainly
consisting of only cost-sharing reductions for “high value” drugs or conditions, rather than
increases for “low-value” ones. Limited evidence from these applications indicates that
these programs may improve use of and adherence to medications, but generally do not
produce overall savings for health plans, at least not in the short post-implementation
periods studied to date.
Premera Blue Cross, a health plan from the northwestern United States and independent
licensee of Blue Cross Blue Shield Association, recently piloted a value-based formulary
(VBRx) for the drug benefit offered to its own employees. The Premera VBRx is
comparatively novel and appears to be the broadest application of the VBID concept in the
United States. Evidence from the initial roll-out of the program suggests that it is possible
to implement VBID on a broader scale, with a design that may lead to modest savings for
the health plan, without negatively affecting adherence to drug therapies for several
common health conditions.
Largely based on theory, VBID holds some promise to shift incentives toward development
of “high-value” products. However, further evaluation of programs such as Premera’s VBRx
is needed to determine how broader use may ultimately affect incentives in the
marketplace that affect the return on investment for developers of new products,
including sales volume, sales prices, and development costs. Longer study periods may
help to tease out delayed effects on spending, health outcomes, or other factors. A
broader focus on total costs to a health plan is necessary. An assessment of spillover
effects is also important; where VBID applies to a particular category of services, such as
drugs, but not others, there may be interactions with other reimbursement systems for
other services. To date, the evidence base from Premera’s VBRx and VBID programs more
broadly – at least that available in broadly-accessible public sources – is insufficient to truly
understand how broader adoption may affect innovation for healthcare technologies.
For more on Premera’s VBRx, see Appendix C.

Page | 34
BOX 3 | NICE (UK): PERFORMANCE-BASED REIMBURSEMENT FOR VELCADE®
In its initial technology appraisal of Velcade® (bortezomib) in 2006, the National Institute
for Health and Care Excellence (NICE) in the United Kingdom (UK) found the drug to be
comparatively clinically effective, but not cost-effective vis-a-vis the usual standard of care
(high dose dexamethasone or HDD). At £31,000 per life year gained and £38,000 per
quality adjusted life year (QALY) gained, the estimated incremental cost-effectiveness
ratios (ICERs) were substantially higher than the generally accepted ICER threshold in
England of £20,000 - £30,000 per QALY.
With the expectation that final guidance from NICE would be unlikely to support the use of
Velcade in the UK National Health Service (NHS), the manufacturer (Janssen-Cilag)
proposed an arrangement in which the NHS would pay for the drug only for patients in
whom a pre-specified response to treatment was demonstrated. A ‘payment-by-results’
protocol was developed in which treatment response was gauged via a well-accepted
tumor marker - an indirect measurement of tumor shrinkage - as a surrogate endpoint. A
subsequent reconsideration of the medicine by the NICE appraisal committee, taking into
account the impact of the proposed payment-by-results arrangement, gave rise to an
anticipated ICER of less than £21,000/QALY, and the drug received a positive
recommendation.
Although not the first performance-based funding arrangement implemented in the UK,
the Velcade Patient Access Scheme (PAS) was the first reimbursement protocol to involve
rebates for treatment failure. As the NHS would be required to pay for the drug only for
those patients who demonstrated an adequate response to treatment, the PAS effectively
amounted to both a performance guarantee and a substantial price discount.
At the original price proposed, Velcade did not meet the definition of an innovation that
enhances consumer welfare in the UK. The PAS changed the effective price and allowed
Velcade to meet the definition of a substantive innovation, albeit with an effect on the
manufacturer’s expected return-on-investment (EROI). It is unclear whether performance-
based RSAs such as the Velcade PAS influence incentives to innovate, in part because of
the lack of measured evaluation of this program and because of the challenges of designing
and administering an outcome- or performance-based PAS. The vast majority of PAS in the
UK since the Velcade example have been financially based arrangements; they are
generally considered ways to reduce the price of a new technology to bring it in line with
societal “norms” regarding cost-effectiveness.
For more on the NICE PAS for Velcade, see Appendix D.

Page | 35
In the early 1990s, Oregon’s Medicaid agency established its “Prioritized List of Health Services” to set
priorities for health service expenditure. Prioritization was based on the premise that medical
interventions are not of equal value, and therefore a process is needed to decide what will be financed
with public resources. Using an explicitly evidence-based decision-making process, the Oregon Health
Evidence Review Commission (HERC) maintains the list, which ranks hundreds of condition- treatment
pairs in order of clinical effectiveness and cost-effectiveness, and taking into account patient
preferences. Treatments that prevent illness, provide maternity and newborn care, and manage chronic
diseases are emphasized. As long as the condition being treated is included in the funded region, all
associated diagnostic and ancillary services associated with it are assumed to be covered – including
prescription drugs and medical devices. Prior to each legislative session, a biennial review and update of
the Prioritized List is completed. Modifications are made at other times to issues corrections and include
recent advancements in medical technology.
The Oregon approach has received praise for its inclusive and relatively transparent decision-making
process, but has encountered resistance from multiple stakeholders. Notably, although Oregon still uses
the list, no other state or private payer has since adopted this approach, in part because of the
controversy surrounding the explicit use of cost-effectiveness to prioritize services; opposition to the
notion of not covering effective treatments because of cost, which draws on concerns about rationing;
and the implications for items excluded from coverage.63
The Medicare contractor Palmetto designed and implemented the Molecular Diagnostic Services
Program (MolDx) as an explicitly evidence-based framework for decision-making on coverage and
reimbursement of companion diagnostics. These are diagnostics used to stratify populations into those
who will likely benefit, or are at risk of suffering adverse reactions, from a particular therapeutic. In
November 2011, Palmetto instituted a payment system that assigns a unique code to molecular
diagnostics, and at the same time, Palmetto released a coverage submission checklist for new
diagnostics. Under Palmetto’s program, applicants must show that the diagnostic test has clinical utility,
such as improvement in patient outcomes or changes in physician behavior for the management of the
patient. If applicants cannot demonstrate clinical utility, then the tests are not covered. To date, no
other Medicare contractor has adopted a similar approach to diagnostic evaluation. However, some
Medicare contractors are following Palmetto’s decisions for the sake of consistency, as are some private
insurers.
63
Perry, P.A., & Hotze, T. (2011). Oregon’s experiment with prioritizing public health care services. Virtual Mentor
(renamed: AMA Journal of Ethics) 13(4), 241-247.

Page | 36
METHOD OF PAYMENT
The choice of bundled or per-unit payment by third-party payers primarily affects ROI by affecting the
price that a manufacturer of a healthcare technology charges purchasers, either directly by affecting
manufacturers’ pricing decisions, or indirectly by changing incentives for providers or other suppliers to
select particular products. When payers use per-unit payments, the effects on the manufacturer’s return
on investment and incentives to pursue innovative products are largely dependent on the method used
to establish the payment level (see “Defining the payment amount,” p. 41). Consequently, this section
mostly focuses on the question of how a shift toward bundled payments may impact incentives to invest
in the development of new healthcare technologies.
Bundled payments incentivize providers or suppliers to reduce
their per-bundle cost, thereby increasing demand for products
that reduce the cost of goods and services included in the
bundle. Economic theory indicates that manufacturers’ list
prices for these products should rise in response, although
there is insufficient evidence to determine the size of the
potential effect. Therefore, the shift to bundled payments is
likely to have an inflationary effect on the prices of novel
products that reduce costs borne by health care providers,
regardless of whether those products provide comparative
advantage in effectiveness.
Importantly, bundled payments will only have this effect on
healthcare technologies that are cost-saving from the provider
perspective. Providers’ demand for these products increases
under bundled payments because the incentive for cost minimization shifts from the payer onto the
provider. A shift to bundled payments should not affect demand for healthcare technologies that reduce
costs borne only by patients or society as a whole, such as technologies that reduce the number of days
of recuperation at home and related days of work missed.
Because bundled payments give providers incentives to clamp down on unnecessary or costly health
services that cannot be billed on an itemized basis, they also have the potential to distort provider
decision-making in favor of lower-cost technologies, even in cases where higher-cost options would be
more appropriate or effective. To some extent, quality monitoring systems and focused evaluations can
check for unintended effects on outcomes, as was done in the transition to Medicare’s prospective
payment system for hospital care in the early 1980s.
Where bundled payments are in place, exceptions are often made for products designated as highly
innovative and/or high cost, with the result that default unit pricing is applied for those products. For
example, Medicare uses “pass through” exceptions for drugs and biologics that have a cost per day in
excess of a defined threshold. One expert panelist noted that, at least for products aimed at hospital-
based care, the use of pass-through payments and other add-ons to diagnosis related groups (DRGs)
Expert’s quote:
Increased use of bundled
payment and episode-based care
payment… will require a person
to think differently in terms of
what value do you actually add to
this episode of care? Are you
[reducing] the cost of care? Are
you improving the key metrics
that will be measured as part of
this episode of care?

Page | 37
(and similar bundled systems) could help to incentivize innovation where products may not fit into the
existing reimbursement bundle, but could potentially reduce total costs of care.
On the other hand, per-unit payment systems reward excessive provision of drugs and devices; a
provider, prescriber, or supplier may have many reasons for choosing a particular product, but it is often
the case that they benefit financially from the transaction. Therefore, per-unit payment systems can also
distort provider decision-making with regard to appropriate utilization of healthcare technologies.
Neither bundled payment nor per-unit payment would be expected to distort patient decision-making,
except to the extent that they affect cost-sharing arrangements, which we discuss later (see p. 47).
Patients are rarely aware of the method of payment used to reimburse the provider.
However, a payer’s choice of payment method could affect overall availability and use of products by
patients and providers, depending on design of the payment and insurance system. For example,
research shows that the initial diffusion of magnetic resonance imaging technology in hospitals was
slowed by Medicare’s DRG-based reimbursement system.64 In this case, rather than being driven by the
extent of innovation offered by the novel product, the utilization was driven by the up-front outlay of
the purchaser, with more costly technologies facing greater barriers in uptake. When identified, such
barriers may be addressed on an ad hoc basis through payment exceptions and regulatory interventions.
Table 5 summarizes the impact of the use of bundled payments versus per-unit payments on the prices
of new healthcare technologies reflecting different levels of innovativeness. All of the described effects
are hypothetical, based on an analysis of the incentives created under alternative payment approaches.
Furthermore, without adequate information on where new products fall in terms of innovativeness and
cost-savings, payers will not respond in ways that correspond with these expectations and markets will
function less effectively and predictably.
Table 5: Effects of per-unit and bundled payment methods on pricing of new healthcare technologies
Method of Payment
Novel products that are not innovative
Innovative products
Cost-reducing Not cost reducing
Incremental innovation
Substantial innovation
Radical innovation
Per-unit payment
Price-reducing pressure potential
Potential for inflationary pressure on prices
Price-increasing potential
Uncertain effect
Uncertain effect
Bundled payment
Price-increasing pressure possible
Strong price-reducing pressure
Price-reducing pressure
Uncertain effect
Uncertain effect
Source: authors’ analysis
64
Hillman, A., & Schwartz, J.S. (1985, November). The Adoption and Diffusion of MRI and CT in the United States: A
Comparative Analysis. Medical Care 23(11).

Page | 38
Impact on pricing for products that do not qualify as innovations. Demand for novel products that are
not innovative and fail to reduce provider costs should decrease significantly under a bundled payment
system, as providers (e.g., hospitals deciding what scanners to buy) face strong financial incentives not
to buy and use them. This should result in lower prices, in comparison to an environment characterized
by per-unit payment. In the latter case, new products may be awarded a premium, presumed to be
better than existing therapeutic alternatives by virtue of their novelty, irrespective of whether improved
effectiveness can be demonstrated.65
Impact on pricing for less innovative products. In the case of products that offer no or only minimal
additional effectiveness over their marketplace competitors (i.e., non-innovations and incremental
innovations that payers or prescribers view as largely the same as existing products), bundled payments
are likely to pose downward pressure on average prices paid in the market. Buyers in these cases are
likely to consider a range of products as suitable for use, and be in a relatively strong negotiating
position. This expectation, however, has not been established empirically, and much depends on the
extent to which buyers are incentivized to obtain the best possible value for money. For such
(incrementally innovative) products, per-unit payment is less likely to exert comparable pressure. The
provider or prescriber of the drug or device does not, under this method of payment, share a stake in
the payer’s incentive to seek value, although this could be mitigated in cases where a payer utilizes a
system of reference pricing to define a maximum reimbursement amount.66
Impact on pricing for more innovative products. In the case of products that offer more-than-
incremental improvement in effectiveness over existing comparators (i.e., substantial or radical
innovations), per-unit payments may be more likely to pose indirect pricing pressure by opening the
door to negotiations with sellers, which may influence institutional purchasing and formulary
management tools. However, the impact on prices is dependent on the degree of leverage that the
payer brings to the negotiations. Furthermore, neither bundled payments nor per-unit payments can be
seen to have an edge in putting price pressure on sellers of products that represent true
“breakthroughs” or radical innovations, as buyers will have limited leverage unless empowered to reject
or narrowly constrain coverage on affordability grounds. (This practice is not common in the United
States). Per-unit payments may offer more scope to obtain price discounts, to the extent that payers are
able to use the “threat” of more (or less) restrictive utilization management as leverage in negotiations
with manufacturers or other suppliers.
Broader use of indication pricing, episodic care pricing, or bundled payment would affect patterns of
investment. The net prospective impact of a shift toward bundled payments on incentives to innovate
with respect to various types of novel products is summarized in Table 6. Overall, it appears likely that
65
An example would be an extended-release formula of an existing drug released just prior to patent expiry. 66
In a study that examined prices of anti-hypertensive drugs in Canada, researchers found that (under a pay-per-
unit scheme) prices decreased as the number of products of the same family rose, but increased as the number of
products in a competitive family increased. See: Benda, M.C., Lu, H., Mallory, C. (2004, May). An Econometric
Estimation of Pricing of Brand-Name Drugs. Health Canada Working Paper.

Page | 39
shifting toward bundled payments has the potential to increase incentives to innovate in cost-reducing
novel products, regardless of their level of innovativeness. Bundled payments should reduce incentives
to develop non-innovative products that are not cost-reducing, as well as products representing
incremental innovation. This shift is unlikely to have a meaningful impact on incentives for radical
innovation, while the effect on investment in substantial innovations is uncertain and dependent on the
strength and effectiveness of safeguards put in place to protect such innovations (e.g., pass-through
payments, such as those used in Medicare to support hospital use of innovative biologics, drugs and
other healthcare technologies).
Table 6: Impact of shift to bundled payments on incentives to invest in the development of innovative
healthcare technologies and other novel products
Novel products that are not innovative
Innovative products
Cost-reducing Not cost reducing
Incremental innovation
Substantial innovation
Radical innovation
Shift to bundled payment
Potentially increased incentives to develop new products of this type
Significant disincentives to develop new products of this type
Significant disincentives to innovate, absent targeted regulatory interventions
Uncertain impact
Little likely impact (in that radical innovations are likely to be exempt from bundles)
Source: authors’ analysis
Impact on investment in novel products that are not innovative. An attractive feature of the use of
bundled payments is the disincentives they create to invest in the development of new products that
are neither a) more effective than existing alternatives, nor b) cost saving from a provider perspective.
Whereas such products stand a good chance of obtaining a foothold in the healthcare system under a
per-unit payment scheme, they are significantly less likely to be adopted and diffused in a scenario
where a provider bears responsibility for both excess costs and for maintaining quality of care,
potentially in combination with pay-for-performance type incentives. Instead, healthcare technology
developers who cannot demonstrate increased effectiveness will need to offer “value” through reduced
costs, such as lower unit prices.
As discussed above, bundled payments exert price pressure on products that do not offer substantial
additional effectiveness over existing treatments in meeting significant health needs. While this is not
necessarily problematic, it could be viewed as undesirable in cases where new additions to a class are
sought, as in the case of antibiotics, for example.67
67
To the extent such problems arise and are identified, it may be possible to address them through special
regulatory interventions, as is done in the area of orphan drugs, for instance.

Page | 40
Impact on investment in cost-reducing technology. It is often stated that bundled payments, including
DRGs and per-capita payments, will provide health plans and providers with incentives to demand new
cost-saving technologies, and this demand will spur development of such products.68 One expert
consulted in this project gave an example of how device developers shifted resources to try to find
solutions that would reduce or avoid hospital-acquired infections in response to the announcement that
Medicare would stop paying for care attributable to these infections, illustrating that firms will target
investment to address a need identified by providers and/or payers (e.g., hospitals’ desire to reduce
costs associated with infections). However, the role of technology in driving cost is complex; a
technology that reduces the unit cost of diagnosis or treatment for an individual case may, in fact,
increase overall expenditures as the reduced unit costs encourage higher overall utilization.
Furthermore, the alignment of incentives remains a critical issue. Taking steps to reduce silos and
encourage full assessment of a product’s comparative cost-effectiveness and budget impact could help
ensure that bundled payments serve to incentivize development of new healthcare technologies that
reduce costs to both payers and consumers. In this regard, we can draw insightful lessons from
financer/purchaser models in which the incentive alignment problem is less pronounced, as is the case
for closed or integrated systems like Kaiser Permanente and the Veterans Health Administration.69
Impact on investment in innovative technologies. Perhaps the greatest uncertainty involves how a move
to bundled payments would affect incentives to invest in innovative technologies. It could be argued
that the incentives to invest in radical innovations remain unchanged, as such innovations are likely to
be exempted from a bundled payment mechanism unless they have limited impact on the cost of the
bundle. Additionally, payers are unlikely to restrict access to treatments that radically improve patient
outcomes, especially if payment (or regulatory compliance or continued network participation) hinges in
part on demonstrated performance. With respect to products that offer modest but meaningful
improvement in comparative effectiveness over alternatives, such as substantial innovations, the
prospective impact is less clear. A 2014 survey of payers sponsored by the medical device industry found
that increasing use of risk-sharing and pay-for-performance payment models stands to shift the
traditional paradigm, in which payers act as gatekeepers and providers act as patient advocates in
obtaining access to new healthcare technologies, by better aligning payer and provider incentives.70
However, only four of nine payers interviewed in that survey expressed a view that it would be more
difficult for effective yet costly innovations to obtain approval for coverage because of these changes.
68
Garber, S., Gates, S. M., Keeler, E. B., Vaiana, M. E., Mulcahy, A. W., Lau, C., & Kellermann, A. L. (2014).
Redirecting Innovation in U.S. Health Care: Options to Decrease Spending and Increase Value. Santa Monica,
CA: RAND Corporation. 69
An expert from a closed system consulted in panels convened for this study noted that her organization is able
to adopt a long-run (10 to 15 year) view of potential benefits and costs of a new healthcare technology being
considered for purchase/use that would not make sense for other payers, for example. 70
Long, G., Mortimer, R., & Sanzenbacher, G. (2014, December). Evolving Provider Payment Models and Patient
Access to Innovative Medical Technology. Journal of Medical Economics. 17(12); 883-893.

Page | 41
In any case, there are policy interventions that can serve to limit the potential of bundled payments to
stifle innovation. These interventions include frequent revisions to the content of each bundle and the
use of pass-through exemptions for innovations that meet designated criteria pertaining to effectiveness
and/or cost.71 Bundled payments that come with mandates to measure and report certain quality
metrics, possibly with bonuses/penalties tied to those metrics, might also affect incentives to innovate.
Industry and investor panelists felt that wider use of bundled and episode-based payment would require
developers to think differently about the “value” added by new technologies: for example, would a
product reduce the total cost of care, or improve key outcomes or metrics measured by the payer(s) in
conjunction with an episode of care? Although the panelists reached consensus on the importance of
value, there was little consensus in the ensuing discussion of how to measure value. While some payers
use quality-adjusted life years (QALYs), several panelists noted that this approach is full of challenges,
such as incorporating the differing views of stakeholders on what constitutes quality of life (e.g., healthy
people vs. those with serious illnesses or disabilities). Others noted that measures could focus on clinical
improvements that improved patient health at a reasonable cost without invoking quality of life, but this
approach still leaves unanswered questions about what constitutes a “reasonable” cost or even what is
an “improvement” in patient health. The lack of consensus or clarity in definitions of these key terms
highlights one of the challenges to broader adoption of bundled or episode-based payment
mechanisms.
DEFINING THE PAYMENT AMOUNT
The methods used by payers to define payment amounts stand to affect prospective innovators’
expected return on investment primarily by influencing sellers’ pricing strategies. The method that
stands to have most significant impact on consumers is therapeutic reference pricing, a form of internal
benchmarking where the payment level is capped at a defined level for all pharmaceuticals judged to be
therapeutically equivalent (or similar, in some cases). In this case, patients are required to pay out-of-
pocket to cover the difference between the price and the payment amount, which may cause
prescribers and patients to favor lower-cost alternatives. Methods that yield higher relative prices may
also have an indirect dampening effect on utilization by consumers, particularly where payers tighten
eligibility for use due to budget constraints, or pass higher prices on to consumers through cost sharing.
However, the evidence base is limited, so most of the linkages between the effects described in this
section, expected return on investment (ROI), and various types of innovation remain largely
hypothetical and uncertain.
It is an unresolved matter of policy debate which methods yield lower prices. In principle, administered
pricing, where prices are set by a policymaker or government regulator and not arrived at through
negotiation between buyer and seller, can give rise to prices that are significantly lower than those paid
71
Scheller-Kreinsen, D., Quentin, W., & Busse, R. (2011, December). DRG-based hospital payment systems and
technological innovation in 12 European countries. Value in Health 14(8), December 2011: 1166-1172.

Page | 42
by other payers.72 However, the outcome depends on factors such as the administrator’s objectives
(which may not be to obtain the lowest possible price); the formulae used to define payment amounts;
and the product manufacturer’s willingness to forego or delay sales in order to secure or protect a
desired price threshold.73 In the case of negotiated pricing, expert panels convened for this study
broadly agreed that the payer’s negotiating strength depends both on the number of covered lives
represented and the ability to employ formulary and utilization management tools to influence the
volume of products used by beneficiaries.74 Conversely, the product manufacturer’s leverage reflects
demand for the product by providers and patients, and the extent and strength of competition in the
specific market niche the product serves.
With EXTERNAL BENCHMARKING, there is a strong risk that manufacturers’ prices will be higher than
would be expected in an optimally functioning market. For example, state Medicaid programs usually
pay pharmacies based on list prices, but the amounts that manufacturers rebate back to states are
based on (much lower) prices for sales to pharmacies and wholesalers, and Medicare pays for physician-
administered drugs using a formula based on the average sales price (ASP), plus a 6% mark-up. Both of
these approaches establish incentives for manufacturers to charge high list prices, while offering
discounts to buyers as competition warrants, because a higher price offers larger margins to dispensing
physicians and pharmacies which may, in turn, affect use of particular treatments.75,76,77 Medicare’s fixed
20% coinsurance provides only a weak constraint on pricing because most beneficiaries have
supplemental insurance that covers coinsurance and often caps the patient’s financial exposure, leading
to relative price insensitivity.
72
Gellad, W.F., Schneeweiss, S., Brawarsky, P., Lipsitz, S., & Haas, J.S. (2008). What if the Federal Government
negotiated pharmaceutical prices for seniors? An Estimate of National Savings. Journal of General Internal
Medicine 23(9): 1435-1440. 73
Pharmaceutical manufacturers often delay launch in markets where administered price levels are relatively low
when they believe they will have a negative effect on the prices in other markets, due to parallel trade, the
practice of external price benchmarking, or both. See OECD. (2008). Pharmaceutical Pricing and Reimbursement in
a Global Market. 74
Research has shown that commercial insurance benefited from implementation of Medicare Part D, because the
increased number of covered lives represented by insurers gave them more leverage in pharmaceutical price
negotiations. As a result, Part D lowered drugs prices for commercially insured patients by 5.8 to 8.5%. (Source:
Lakdawalla, D.N., & Yin, W. (2010). Insurers’ negotiating leverage and the external effects of Medicare Part D.
Review of Economics and Statistics.) 75
Alpert, A., Duggan, M., & Hellerstein, J.K. (2013, August). Perverse reverse price competition: average wholesale
prices and Medicaid pharmaceutical spending. National Bureau of Economic Research (NBER) working paper
no. 19367. 76
Jacobson, M., O’Malley, A.J., Earle, C.C., Pakes, J., Gaccione, P., & Newhouse, J.P. (2006). Does reimbursement
influence chemotherapy treatment for cancer patients? Health Affairs 25(2):437-443. 77
Danzon P. (2010). Drug pricing and value in oncology. The Oncologist 15(Suppl 1):24-31.

Page | 43
External benchmarking also has significant spillover effects in terms of defining global price levels for
new healthcare technologies. For example, the widespread practice of external benchmarking in the
European Union has resulted in pharmaceutical manufacturers launching new products first in countries
that a) allow manufacturers to set their own prices, or b) in countries where relatively high launch prices
are common. This enables manufacturers to establish higher prices for their products throughout
Europe.78 Medicaid’s mandatory drug rebate program, which requires companies to provide substantial
discounts and match the “best price” given to non-governmental payers, has been similarly criticized for
reducing discounts to commercial payers.79,80,81
Higher prices tend to lead to relatively high payment levels under external benchmarking, with market
shares awarded to products on the basis of novelty alone, as opposed to value or relative effectiveness.
This occurs because sellers are adept at using techniques to obtain inflated market prices, such as
strategic sequencing of market launch and requiring confidentiality with respect to rebates. These
inflated prices are then subject to benchmarking by other payers. An example cited by experts consulted
for this project was the proton pump inhibitor (PPI) Prilosec, and its successor, Nexium. The
manufacturer of Prilosec (omeprazole) introduced Nexium (esomeprazole) after Prilosec’s patent
expired, while simultaneously taking steps to delay introduction of generic version of Prilosec to the
market. Through this launch, the manufacturer was able to establish a high sales price and market share
in the United States for the follow-on product, even though Nexium offered minimal, if any, added
benefits over Prilosec.82
LOWEST POSSIBLE PRICE STRATEGIES seem likely to produce spillover effects for payers who pay
based on external benchmarking. In the case of pharmaceutical manufacturers, a common strategy for
sellers is establishment of a narrow range of acceptable public prices on a global basis and having
confidential negotiations with purchasers over rebates or discounts. In practice, this likely means that
payment levels reflect market leverage and negotiating capacity rather than willingness and ability to
pay for products that offer a given set of benefits.
Lowest possible price methods may encourage over-investment in products that offer little or no added
value. For such products, there is often less uncertainty about the potential market for the new product,
because of observable payment amounts for close competitors and other factors, such as a clear
78
OECD. (2008). Pharmaceutical Pricing and Reimbursement in a Global Market. 79
Congressional Budget Office. (1996). How the Medicaid Rebate on Prescription Drugs Affects Pricing in the
Pharmaceutical Industry. 80
Morton, F.S. (1997). The strategic response by pharmaceutical firms to the Medicaid most- favored-customer
rules. The Rand Journal of Economics, 28(2), 269-290. doi:10.2307/2555805 81
Academy of Managed Care Pharmacy. (2009). Where we stand: the best price requirement of the Medicaid
rebate program. 82
Kesselheim, A.S., Fischer, M.A., & Avorn, J. (2006). Extensions of Intellectual Property Rights and Delayed
Adoption of Generic Drugs: Effects on Medicaid Spending. Health Affairs 25(6):1637-1647.

Page | 44
placement within the existing code sets used to determine payment amounts in inpatient, outpatient,
and other provider settings.
In cases where payers have little or no leverage, such as with highly innovative products for which there
are no therapeutic alternatives (and where payers are not empowered to reject coverage on non-clinical
grounds), the lowest possible price payment method is equivalent to external price benchmarking.
Prices are set at a common public price with no confidential discounts or rebates granted. By using
market leverage to pay the lowest possible amount for a product, payers risk fostering incentives to
under-invest in radical innovation and cost-saving technology if developers or investors fear that these
technologies will be undervalued.
By contrast, there is evidence that using INTERNAL BENCHMARKING (also called therapeutic reference
pricing) to establish payment levels can influence manufacturers to reduce the sales price of less
innovative products. In Germany, manufacturers were, until recently, free to establish prices for
pharmaceutical products sold in the country; however, social insurers’ payment levels for new products
were limited to the price of products judged to be therapeutically equivalent, including off-patent
products and their generic equivalents. Patients were required to pay out-of-pocket for any additional
cost for higher priced products. In many cases, after a product was assigned to a therapeutic reference
group, its manufacturer lowered the sales price to avoid risking reduction in the product’s market share,
due to comparatively high cost-sharing.83 Based on these observations, internal benchmarking will tend
to result in lower payment levels for products that offer little to no added value in terms of enhanced
effectiveness or cost savings associated with use. EROI for such products will be lower in an
environment where many payers, or a few payers representing significant market share, are using
internal benchmarking to establish payment levels.
Danzon and Ketcham have argued that reference pricing would “likely have a more negative effect on
prices of on-patent products because of the more competitive U.S. generic market, and on research and
development and the future supply of new drugs, because of the much larger U.S. share of global
pharmaceutical sales,” if systematically applied in the United States.84
In theory, VALUE-BASED METHODS of determining payment amounts should decrease payment
amounts (at least the payer’s share) for novel products that are not innovative or cost-reducing, while
potentially increasing payment amounts for innovative products, commensurate with the level of
additional benefit. Value-based pricing also provides the greatest potential to increase incentives to
invest in substantial and radical innovations. In principal, value-based methods that define payment
based on an assessment of benefits offered, whether in terms of added effectiveness or improved cost-
83
Paris, V., & Docteur, E. (2008, October). Pharmaceutical Pricing and Reimbursement Policy in Germany. OECD
Working Paper no. 39. OECD: Paris. 84
Danzon, P., & Ketcham, J. (2004). Reference pricing of pharmaceuticals for Medicare: Evidence from Germany,
the Netherlands, and New Zealand. Frontiers in Health Policy Research. Volume 7, 1 – 54. David M. Cutler and
Alan M. Garber, editors.
Page | 45
effectiveness, could yield the highest prices for radical innovations as a reward for furnishing new
benefits. Manufacturers may themselves price radical innovations at a level that reflects the benefits
offered.85 However, existing applications of VBID are relatively few and generally narrow in scope,
providing insufficient empirical evidence to identify effects on ROI and/or innovation (see Box 2 and
Appendix C).
With internal benchmarking and value-based pricing, any premium awarded reflects an assessment of
added effectiveness or other benefits to society, the patient, or the payer. For example, the Arkansas
State Employee Benefits Division used a reference pricing system for Nexium, which limited the
reimbursement payment level for esomeprazole to the amount it paid for generic omeprazole ($.90 in
2005). This approach accrued savings of $7.2 million over the subsequent 43 months, in comparison
with PPI costs of health insurance plans that were not using reference pricing.86 Internal benchmarking
and value-based pricing are less likely to have spillover effects, although the pricing decisions that result
from use of such methods may be referenced via external benchmarking approaches.
Value-based pricing provides potential to increase incentives to invest in substantial and radical
innovations. Payment methods that define the amount paid based on an assessment of benefit offered
are not widely used for a number of reasons, including technical challenges and the perceived risk of
adopting an approach that could result in higher payments, particularly for products offering substantial
benefits. However, some experts have noted that these value-based methods may reduce market
distortions in supply and demand for healthcare goods and services. Danzon and colleagues analyzed
alternative arrangements for establishing pharmaceutical payments in countries with universal
insurance coverage, which distorts the market and constrains the ability to attain maximum static
(short-term) and dynamic (long-term) efficiency:87
..if each payer unilaterally sets an incremental cost effectiveness ratio (ICER) threshold
based on its citizens’ willingness to pay for health; manufacturers price to that ICER
threshold; and payers limit reimbursement to patients for whom a drug is cost-effective
at that price and ICER, then the resulting price levels and use within each country and
price differentials across countries are roughly consistent with second best static and
dynamic efficiency.
85
Rankin, P.J., Bell, G.K., & Wilsdon, T. (2003). Global Pricing Strategies for Pharmaceutical Product Launches.
Pharmaceutical Pricing Compendium—A Practical Guide to the Pricing and Reimbursement of Medicines.
Chapter 2. Charles River and Associates, Urch Publishing.
86 Johnson, J.T., Neil, K.K., & Davis, D.A. (2011). Five-year examination of utilization and drug cost outcomes
associated with benefit design changes including reference pricing for proton pump inhibitors in a state
employee health plan. Journal of Managed Care Pharm. 17(3):200-212.
87 Danzon, P., Towse, A.K., & Mestre-Ferrandiz, J. (2012, December). Value-Based Differential Pricing: Efficient
Prices for Drugs in a Global Context. NBER Working Paper No. 18593.

Page | 46
Skeptics of value-based payment raise concerns about the limitations of explicit thresholds or anchor
points for value, and point out that existence of such measures would lead to pricing that gravitates
toward the threshold from levels both above and below. At present, only a handful of payers are
pursuing value-based strategies to define payment levels, although there is some experimentation in the
United States with value-based insurance design (in which benefits, rather than payments, are defined
according to an assessment of relative value).88 Sophisticated approaches, such as performance-based
risk-sharing arrangements, may allow for greater experimentation with such approaches in the future.
Table 7 summarizes the relationships between methods of defining payment amounts, expected ROI,
and incentives to research and develop innovative products.
Table 7: Impact of method used to define reimbursement amount on expected return on investment
in healthcare technologies
Novel products that are not innovative Innovative products
Cost-reducing Not cost-reducing Incremental innovation
Substantial innovation
Radical innovation
External bench-marking
Likely to increase ROI (& incentives to invest), compared with other approaches
Likely to increase ROI (& incentives to invest), compared with other approaches
Likely to increase ROI (& incentives to invest), compared with other approaches
Likely to increase ROI (& incentives to invest), compared with other approaches
Likely to increase ROI (& incentives to invest), compared with other approaches
Internal bench-marking
Impact unclear Likely to reduce ROI (& incentives to invest), compared with other approaches.
Likely to reduce ROI (& incentives to invest), compared with other approaches
Impact unclear
Impact unclear
Value-based payment
Likely to increase ROI (& incentives to invest), compared with other approaches
Likely to reduce ROI (& incentives to invest), compared with other approaches.
Most promising approach for yielding ROI that is equivalent to value (as judged from consumer, payer and/or social perspective)
Lowest possible price payment
Likely to reduce ROI (& incentives to invest), compared with other approaches.
Impact unclear Uncertain. There is significant risk that this payment method will over-incentivize investment in incremental innovations and under-incentivize investment in radical innovations.
Source: authors’ analysis
88
University of Michigan Center for Value-Based Insurance Design. (2014). The evidence for V-BID: Validating an
intuitive concept. Brief. Retrieved from http://vbidcenter.org/wp-content/uploads/2014/10/The-Evidence-for-
V-BID-Validating-intuitive-concept-Brief-Feb2014.pdf

Page | 47
PATIENT COST SHARING
Different levels and methods of cost sharing primarily change incentives for consumers to use services
and products. Despite the relative wealth of studies concerning effects on consumers, there are scant
evidence-based research or evaluation studies that make the subsequent linkages to ROI or future
innovations. Nevertheless, certain conjectures can be made from an understanding of cost-sharing
features, such as how changes in consumer demand or payer leverage might translate into changes in
sales prices and/or sales volumes, which are key components of ROI/EROI.
EFFECTS OF INCREASING/DECREASING COST-SHARING LEVELS
Economic theory predicts that increasing cost sharing (or adding it where there is none) leads to lower
demand for products and services because the patient faces more of the cost of care. Empirical
literature indicates that adding or increasing cost sharing for prescription drugs typically reduces
utilization, including appropriate use, and may lead to higher costs for other services.89,90,91 One
literature review identified a broad range of estimates of the elasticity of demand for medical services
with respect to cost sharing, including estimates of -0.1 to -0.6 for prescription drugs.92 Another review
found that increased cost sharing is associated with lower rates of drug utilization and poorer adherence
to ongoing treatments in a wide range of therapeutic areas; generally, a 10% increase in cost sharing
results in a 2% to 6% decrease in prescription drug spending, regardless of the cost-sharing method.93
Responses to changes in cost-sharing levels vary widely, depending on factors such as the underlying
medical conditions and/or socioeconomic status of users. In one study, doubling the cost sharing
amount resulted in a 23% decline in use of anti-diabetic drugs, compared with declines of 10% for
hypertension drugs and 8% for antidepressants.94 A study of statin use among Medicare beneficiaries
found that increasing out-of-pocket costs from $200 to $240 reduced the rate of adherent beneficiaries
89
Newhouse, J. P. (1993). Free for all? Lessons from the Rand health insurance experiment. Cambridge, MA:
Harvard University Press. 90
Swartz, K. (2010). Cost-sharing: Effects on spending and outcomes. (Research Synthesis Report No. 20).
Princeton, NJ: Robert Wood Johnson Foundation. 91
Eaddy, M.T., Cook, C.L., O’Day, K., Burch, S.P., & Cantrell, C.R. (2012). How patient cost-sharing trends affect
adherence and outcomes: A literature review. Pharmacy and Therapeutics. 37(1):45-55. 92
Liu, S., & Chollet, D. (2006). Price and income elasticity of the demand for health insurance and health care
services: A critical review of the literature. (Final Report, ASPE/HHS Contract No. 233-02-0086). Washington,
D.C.: Mathematica Policy Research, Inc. 93
Goldman, D. P., Joyce, G. F., & Zhang, Y. (2007). Prescription drug cost sharing associations with medication and
medical utilization and spending and health. JAMA, 298(1), 61-69. 94
Goldman D.P., Joyce G.F., Escarce J.J., Pace, J.E., Solomon, M.D., Laouri, M.,… , Teutsch, S.M. (2004). Pharmacy
benefits and the use of drugs by the chronically ill. JAMA, 291(19), 2344-2350.

Page | 48
from 67% to 56%.95 Conversely, eliminating cost sharing for medications prescribed following myocardial
infarction increased adherence and decreased patient spending without increasing overall health
costs.96 The effects of cost sharing on utilization are relatively strong among low-income populations,
who are more price sensitive.97,98,99,100,101 However, even among low-income patients, responses may
differ across drug classes.102
Economic theory suggests that increases in utilization, which result from increases in consumer demand,
imply increased pricing power for sellers, and generally exert upward pressure on prices. Put together,
these effects suggest sellers’ expected revenues increase as cost sharing falls. Except in cases where cost
offset programs are used (see Box 4), the manufacturers’ total costs of development, manufacture, or
sale of a healthcare technology are not affected by patient cost sharing. This implies that ROI also
increases as the overall level of cost sharing declines. Although increased ROI creates opportunities for
firms to increase investment in R&D, prior research suggests that cost sharing may not produce a
differential impact for R&D focused on development of innovative products, compared to novel but
non-innovative products.103
95
Karaca-Mandic, P., Swenson, T., Abraham, J. M., & Kane, R. L. (2012). Association of Medicare Part D medication
out-of-pocket costs with utilization of statin medications. Health Services Research, 48(4), 1311-1333. 96
Choudhry, N. K., Avorn, J., Glynn, R. J., Antman, E. M., Schneeweiss, S., Toscano, M., . . . Shrank, W. H. (2011). Full
coverage for preventive medications after myocardial infarction. N Engl J Med, 365(22), 2088-2097.
doi:10.1056/NEJMsa1107913 97
Ku, L., & Wachino, V. (2005). The effect of increased cost-sharing in Medicaid: A summary of research findings.
Washington, D.C.: Center on Budget and Policy Priorities. 98
Hartung, D. M., Carlson, M. J., Kraemer, D. F., Haxby, D. G., Ketchum, K. L., & Greenlick, M. R. (2008). Impact of a
Medicaid copayment policy on prescription drug and health services utilization in a fee-for-service Medicaid
population. Medical Care, 46(6), 565-572. 99
Wallace, N. T., McConnell, K. J., Gallia, C. A., & Smith, J. A. (2008). How effective are copayments in reducing
expenditures for low-income adult Medicaid beneficiaries? Experience from the Oregon health plan. Health
Services Research, 43(2), 515-530. 100
Subramanian, S. (2011). Impact of Medicaid copayments on patients with cancer: Lessons for Medicaid
expansion under health reform. Medical Care, 49(9), 842-847. 101
Lurk, J. T., DeJong, D. J., Woods, T. M., Knell, M. E., & Carroll, C. A. (2004). Effects of changes in patient cost
sharing and drug sample policies on prescription drug costs and utilization in a safety-net-provider setting.
American Journal of Health-System Pharmacy, 61(3), 267-272. 102
Blais, L., Couture, J., Rahme, E., & LeLorier, J. (2003). Impact of a cost sharing drug insurance plan on drug
utilization among individuals receiving social assistance. Health Policy (Amsterdam, Netherlands), 64(2), 163-
172. 103
Grossman, V. (2013). Do cost-sharing and entry deregulation curb pharmaceutical innovation? Journal of Health
Economics 32, 881– 894.

Page | 49
BOX 4 | COST-SHARING OFFSET PROGRAMS
Drug manufacturers have responded to recent growth of cost-sharing levels by introducing cost-
sharing offset programs, which alter financial incentives for insured patients by subsidizing their
out-of-pocket costs through coupons, rebates, or direct reimbursements. According to industry
sources, cost-offset programs are rapidly growing the United States, with 561 such programs
covering 708 brand-name drugs identified in early 2014, a 34% increase compared to mid-2012.i
These programs appear to engender opposition from third-party payers when they affect choices
between competing products on different cost-sharing tiers, such as between a preferred brand-
name drug and a non-preferred brand-name drug.ii Experts consulted during this project noted
that in such cases, the manufacturer’s discount to the consumer undermines the cost-sharing
structure (which tends to favor products that are less expensive for the payer) and negatively
affects the power of payers in negotiations with manufacturers. Moreover, the manufacturer only
offers the discount for patients who request and qualify for assistance, and not for every sale
covered by the payer (as is likely to be the case with agreements that affect tier placement). Third-
party payers may view cost offset programs more favorably when they apply to products that are
clinically effective and save money elsewhere in the system, or where they apply to high-cost
products for which payers would likely require high levels of cost sharing anyway. In these cases,
the offset programs become an indirect way of capturing discounts from manufacturers.
Notes:
i. Zitter Health Insights. (2014, March). Co-pay offset monitor. As described in: Fein, A. (2014). A new reality
check on co-pay offset programs. Retrieved from http://www.drugchannels.net/ 2014/03/co-pay-offset-
programs-are-blooming-in.html
ii. Visante, Inc. (2011, November). How copay coupons could raise prescription drug costs by $32 billion over
the next decade. Prepared for the Pharmaceutical Care Management Association.

Page | 50
Conversely, increased cost sharing reduces utilization and confers less pricing power for sellers, pushing
revenues and ROI downward. Recent growth in Part D and commercial plans with four or more tiers
reflects efforts by plans to pass on at least part of the high costs of certain drugs to insured patients. For
example, plans have been largely unable to negotiate formulary rebates and price discounts for
biologics, in part because these products cannot be replicated precisely and, until 2015, no biosimilar
products had been approved by the FDA. These products frequently end up on the highest cost-sharing
tiers, which frequently use coinsurance of 25%-40% or more of the cost of the drug.104,105,106
Industry and investor experts consulted in this study noted that increased cost-sharing levels is a
universal problem, with little room left for inflating costs to the patient, especially among the highest
cost/highest use patients. One posited that effects may differ between technologies that produce
effects the patient can feel (e.g., reduced pain), versus therapies aimed more at prevention where the
benefits are less obvious/immediate.
Although existing research focuses primarily on drug classes and not specific drugs, the variation in
effects observed across different classes suggests that cost sharing (of any type) may have smaller
effects on use and pricing of innovative products, especially substantial or radical innovations as defined
in this project. By definition, these products confer greater benefits to patients in comparison with
existing therapeutic alternatives, or they address a more significant previously unmet or inadequately
met health need, so demand for them is potentially more inelastic. Any effects on utilization are also
likely to be smaller for products that target more severe conditions, compared to those for less severe
or asymptomatic conditions, regardless of whether the product is determined to be innovative or not.
Differential cost sharing offers the potential to reward more valuable innovations over less valuable
innovations, to the extent that cost sharing is higher for products offering lower consumer welfare
enhancement and lower for products offering more consumer welfare enhancements. Experts we
interviewed noted the possibility of value-based reimbursement with lower copays for more “value” –
although this led to a discussion among several panelists of the pros and cons of QALYs and other ways
of measuring value, which highlighted that defining what constitutes value is a challenge and often
controversial. In the cases offered as examples by panelists, the payer defines and determines what
“value” is, but the process is not always transparent to outside observers.
There is also no evidence that assessments of value from a consumer or societal perspective are the
basis for most formulary placement decisions that determine cost sharing levels. Plans typically apply
lower cost-sharing amounts to incentivize use of preferred (often less expensive) services, such as
104
Kaiser Family Foundation & Health Research & Educational Trust (HRET). (2014). Employer Health Benefits: 2014
Annual Survey. Menlo Park, CA: Henry J. Kaiser Family Foundation. 105
Pharmacy Benefit Management Institute. (2013). 2013-2014 Prescription Drug Benefit Cost and Plan Design
Report. 106
Hoadley, J., Cubanski, J., Hargrave, E., & Summer, L. (2014, October 10). Medicare Part D: A first look at plan
offerings in 2015. Washington, DC: Henry J. Kaiser Family Foundation.

Page | 51
primary care physicians instead of emergency rooms for non-emergent care, or preferred products, such
as generic drugs. Higher cost-sharing levels usually apply to non-preferred products and services. For
example, most commercial plans require higher cost sharing for services and devices from non-network
providers (and may not cover such services at all). A more recent trend is that commercial, Part C, and
Part D plans are beginning to use tiered cost sharing to distinguish between preferred and non-
preferred providers within their networks.
COPAYMENTS VS. COINSURANCE
Coinsurance may have greater effects on utilization, even when configured to achieve the same cost-
sharing levels as fixed copayments. Theoretical models suggest that copayments lead to better
adherence with prescription drug regimens than variable coinsurance, by reducing patient uncertainty
with regard to out-of-pocket payments. Based on a national sample of privately-insured patients using
drugs for diabetes, adherence declined by 23% following a large increase in coinsurance, but adherence
only fell by 9% after a comparable increase in fixed copayments.107,108
Even relatively low coinsurance rates may create a financial burden for users of expensive non-preferred
and specialty drugs. To some extent, maximum out-of-pocket provisions alleviate this burden, but not
until consumers pay substantial sums out-of-pocket (usually several thousand dollars). Very high cost-
sharing levels may reduce the ROI for manufacturers of high-cost and specialty drugs, as the cost sharing
weakens demand and reduces sales.109,110 These products may not meet the definition of consumer
welfare-enhancing innovations used in this project, although they frequently target serious and chronic
conditions.
The greatest potential effects from cost sharing may occur where coinsurance (cost sharing applied as a
proportion of the price, rather than a fixed amount) applies to high-cost, yet innovative products.
However, neither copayments nor coinsurance seems likely to have significant effects on innovation.
One reason is that manufacturers are in a relatively strong position to establish initial prices for their
products in the United States, and they frequently employ sophisticated pricing models that enable
them to account for anticipated cost sharing. Manufacturers’ cost-sharing offset programs also may
mitigate effects, and the willingness of drug makers to participate in these programs on a relatively large
scale suggests they are willing to accept lower rates of return on a per-unit basis for certain transactions,
107
Dor, A., & Encinosa, W. (2010). How does cost-sharing affect drug purchases? Insurance regimes in the private
market for prescription drugs. Journal of Economic Management and Strategy, 19(4). 108
Dor, A., & Encinosa, W. (2004). Does cost sharing affect compliance?: The case of prescription drugs. NBER
Working Paper no. 10738. 109
Goldman, D. P., Joyce, G. F., & Zhang, Y. (2007). Prescription drug cost sharing associations with medication and
medical utilization and spending and health. JAMA, 298(1), 61-69. 110
Goldman D.P., Joyce G.F., Escarce J.J., Pace, J.E., Solomon, M.D., Laouri, M.,… , Teutsch, S.M. (2004). Pharmacy
benefits and the use of drugs by the chronically ill. JAMA, 291(19), 2344-2350.

Page | 52
in exchange for maintaining higher list prices for other transactions and greater sales volume to bolster
ROI.
DEDUCTIBLES & COVERAGE LIMITS
With deductibles, consumers pay the full, approved amount for any services or products to which the
deductible applies, until their out-of-pocket costs reach the deductible limit. Theory posits that
deductibles will discourage unnecessary use of services, because they expose consumers to the full
prices of these items. Empirical studies indicate that, in practice, increasing deductibles likely decreases
use of unnecessary or inappropriate services and desirable and appropriate services, such as preventive
care, until the consumer reaches the deductible limit.111,112 Studies also suggest that use of prescription
drugs decreases where prescription drugs are subject to the deductible, but effects may be tempered
for more severe conditions.113,114 These findings suggest possible reductions in utilization of drugs and
devices that patients pay for directly. Deductibles are unlikely to affect use when the cost of the drug or
device is part of an inclusive rate.
It is unclear whether deductibles affect selling prices. They may incentivize manufacturers to set higher
prices to push patients past the deductible limit more quickly. There is no evidence suggesting that any
potential effect would differ between non-innovative and innovative products, although innovative
products are more likely to command higher prices generally (with or without deductibles) due to higher
demand. Considering these potential effects, deductibles seem unlikely to have significant effects on the
ROI/EROI for innovative products relative to non-innovative products, or incentives for development of
innovative products.
Coverage limits, where insurance stops paying after a patient incurs total health care costs exceeding an
annual or lifetime threshold, are relatively rare. Patients face the full cost of drugs and services above
the limit, but people reaching the limits are likely to have serious chronic or acute conditions and little
incentive to cease treatment. Coverage limits are unlikely to affect developers’ decisions about pricing
or whether to invest in potentially innovative healthcare technologies, as the limits are rare and tend to
be quite high, relative to the cost of any single healthcare technology.
Table 8 summarizes the effects described in this section.
111
Dixon, A., Greene, J., & Hibbard, J. (2008). Do consumer-directed health plans drive change in enrollees' health
care behavior? Health Affairs (Project Hope), 27(4), 1120-1131. 112
Gupta, N., & Polsky, D. (2012). High deductible health plans: Does cost sharing stimulate increased consumer
sophistication? Health Expectations. doi:10.1111/hex.12031 113
Greene, J., Hibbard, J., Murray, J. F., Teutsch, S. M., & Berger, M. L. (2008). The impact of consumer-directed
health plans on prescription drug use. Health Affairs, 27(4), 1111-1119. doi:10.1377/hlthaff.27.4.1111 114
Reiss, S. K., Ross-Degnan, D., Zhang, F., Soumerai, S. B., Zaslavsky, A. M., & Wharam, J. F. (2011). Effect of
switching to a high-deductible health plan on use of chronic medications. Health Services Research, 46(5),
1382-1401. doi:10.1111/j.1475-6773.2011.01252.x

Page | 53
Table 8: Effects of cost-sharing approaches on ROI and incentives to invest in development of
healthcare technologies
Novel products that are not innovative Innovative products
Cost-reducing Not cost-reducing Incremental innovation
Substantial innovation
Radical innovation
Increase cost-sharing level
Likely to decrease use
Some price-reducing pressure, particularly for products that are not cost-reducing
Should reduce ROI and incentives to invest
Likely to decrease use
Some price-reducing pressure
Effects may be smaller for substantial and radical innovations if demand for those products is relatively inelastic
Unlikely to have substantial effects on ROI or incentives to invest in innovative products
Decrease cost-sharing level
Likely to increase use
Some price-increasing incentive
Should increase ROI
Unlikely to have differential effects on incentives for innovative vs. non-innovative products unless reductions are only for innovative products
Coinsurance (vs. copayment)
Likely to have larger effects on use than copayments, especially for high-cost products
Potential for price-reducing pressure, particularly for high-cost products
Price and use impact may be offset by manufacturer cost-offset programs
Net effects on ROI are unclear
Although effects may be greater than with copayments, coinsurance is still unlikely to have significant effects on incentives to invest in innovative products as long as manufacturers are able to set higher prices for these products to counteract the effects of lost sales due to cost sharing, or use cost sharing offset programs to help patients afford the out-of-pocket costs and reduce the volume of lost sales
Deductible May affect use, particularly for high-cost products
Effects on sales prices and ROI are unclear, but probably small
No clear expected effects on incentives to invest
Effects on use, pricing, or ROI are unclear, but probably smaller than for non-innovative products or incremental innovations.
Unlikely to have significant effects on incentives to invest
Coverage limit Unlikely to affect use, pricing, or ROI for individual products
No expected effects on incentives to invest in either innovative or non-innovative products (based on current prevalence and size of limits)
Source: authors’ analysis

Page | 54
CONCLUSIONS
Although it is widely accepted that the extent and nature of product reimbursement is a significant
factor in the development decisions of potential developers of novel healthcare technologies and the
investors who finance them, there is only limited empirical evidence of connections between
reimbursement and innovation per se. Analysts posit that payment policies influence the diffusion of
new products, and as a result have a substantial impact on R&D decisions and whether companies
choose to advance a technology to market.115 Experts consulted during this project agreed that
reimbursement is an important factor in R&D and investment decisions; that it is a critical factor in
determining which products in development are brought to the market; and that its influence appears
to be growing in importance. However, several experts questioned whether reimbursement policies and
practices can truly steer developers and investors toward innovative products. Reimbursement is just
one of many factors that may influence developers’ ability to innovate. Scientific opportunities are very
important – a developer cannot produce a breakthrough product if the science is not there. A focused
push by government or private organizations for new products in a particular area, such as an orphan
disease, may also carry significant weight. For example, the Orphan Drug Act of 1983 and the FDA’s 2014
guidance to industry on expedited programs for serious conditions reflect government efforts to
encourage innovation.116 Patient groups are also developing patient registries to generate data about
their diseases, and pressuring developers to focus on unmet needs.
The question of how payers can foster innovation in healthcare technologies that improve consumer
welfare could also be taken to imply that payer policies are ipso facto discouraging or impeding it.
However we did not find evidence that this is likely to be the case. On the contrary, experts consulted on
this project suggested that very few substantial or radical innovations are held back; generally, it was
hypothesized that payers are willing to pay more for these types of products (e.g., one panelist
described payers as willing to reward developers for “going into a whole new therapeutic area, and
doing something quite special”). If this is the case, the questions then become: are incremental
innovations being held back; if so, which ones; and, if they really are of value, how do we move them
forward in development and get payers to recognize their value? Although by definition substantial and
radical innovations offer greater advances relative to existing standards of care, a series of incremental
innovations can add up to significant therapeutic progress.
Our research indicates that reimbursement policies and practices affect key components of ROI for
developers and investors, such as prices and sales volumes, and change incentives for many other actors
in the marketplace that indirectly influence ROI. However it remains unclear precisely how these
impacts ultimately affect innovation. There is a dearth of empirical evidence pertinent to the links
115
Chambers, J., May, K., & Neumann, P. (2013). Medicare covers the majority of FDA-approved devices and Part B
drugs, but restrictions and discrepancies remain. Health Affairs 32(6):1109-1115. 116
U.S. Department of Health and Human Services, Food and Drug Administration, Center for Drug Evaluation and
Research (CDER), Center for Biologics Evaluation and Research (CBER). (2014, May). Guidance for Industry
Expedited Programs for Serious Conditions – Drugs and Biologics. OMB Control No. 0910-0765.

Page | 55
between reimbursement and ROI for developers (or investors). It is difficult, if not impossible, to
measure and control for all potential variables in an experimental setting. In addition, many
characteristics, such as bundled payments, are relatively new phenomena in the U.S. and therefore do
not offer much documented experience or outcomes. Long timelines for development also muddy the
effects (at least the ability to track them), particularly for drugs, biologics, and vaccines. We found no
empirical evidence to directly connect reimbursement policies and practices with the quantity or quality
of healthcare technology innovation.
Our analytic framework, shown in Figure 2 on page 12, illustrates the connections between
reimbursement policies and practices, and ROI for developers (and investors). Although there are direct
paths of influence, including impacts on manufacturers’ selling prices and/or sales volume, or the costs
associated with the development, manufacture, or sale of their products, the connections are not direct
in most cases. The distribution systems for healthcare technologies involve many actors. The actions of
providers, wholesalers, PBMs, and other intermediaries affect ROI for manufacturers, as they often
receive a portion of the reimbursement. These intermediaries can also influence the reimbursement
policies and practices used by payers; for example, healthcare providers make many decisions on behalf
of patients and thereby influence product uptake. Intermediaries also may have different views from
patients or third-party payers in terms of what constitutes value, or even the level of innovation
(incremental, substantial, or radical) offered by a particular product. This complexity makes effects
harder to determine and often ambiguous. In addition, the complexity of the U.S. healthcare system,
diversity of approaches to reimbursement around the world, and the global nature of the drug and
device industries create potential for unintended impacts from reimbursement policies and practices.
The hi HealthInnovations advance market commitment (AMC) case study illustrates the potential
effectiveness of establishing a direct link between reimbursement and a desired innovation. In this case,
UnitedHealth Group filled an unmet need for hearing aids among its patients and the broader
population by partnering directly with a manufacturer. The result was a set of devices with features the
payer valued at price points that enabled more patients to afford the technology. The hearing aids
developed in this case were relatively low-cost devices that did not require extensive testing. Broader
applications of the AMC concept may be limited because of the greater development demands for more
complex devices or drugs, and lack of ability for a single payer to control access to these types of
products.
Because the connection between reimbursement and innovation is usually not as straightforward as in
the hi HealthInnovations case, this research project examined how five characteristics of reimbursement
policies and practices may impact developers’ ROI and incentives to innovate: the reimbursement
decision-making process; approaches to product categorization and differentiation; method of payment;
methods of defining payment amounts; and patient cost sharing. The U.S. retains a pluralist framework
with regard to the reimbursement decision-making process – hundreds of payers use their own
assessment approaches to reach their judgments, leading to considerable variation. While variation may
be appropriate for the different populations they serve, the lack of uniform decision-making weakens
the ability of all but the largest payers to motivate developers to develop innovative products. The
effects of different decision-making processes are hard to trace. Theoretically, processes that are

Page | 56
transparent and evidence-based will provide the clearest signals to developers and favor development
of products that address unmet needs and/or provide added value over existing therapies.
There is limited evidence concerning the effects of different approaches to product categorization and
differentiation. Value-based approaches may reflect assessments of added effectiveness or other
benefits, but a minority of payers in the United States uses them. There is optimism about the promise
of value-based methods to align incentives for developers with the interests of patients, providers, and
payers, but there are also many challenges to overcome. For example, although the experts interviewed
in this project reached near consensus on the importance of accounting for value, there was little
consensus in the ensuing discussions of how to measure value, what constitutes a “reasonable” cost, or
even what is an “improvement” in patient health. The lack of consensus or clarity in definitions of these
key terms highlights one of the challenges to broader adoption of value-based approaches. Different
payers are likely to have varying definitions of innovation and value. Determinations of value may be
case-specific.
The case study of the Premera Blue Cross value-based formulary pilot program highlights some
additional challenges for value-based approaches. For example, even with a systematic approach to
measuring value, payers may lack access to data, research evidence, or other information necessary to
determine who should receive treatment and in what circumstances. Limited availability of evidence
may prevent optimal placement of drugs or other treatments. Quantifying the return for payers is also
challenging.
Whereas the reimbursement decision-making process sets the parameters for availability, prescribing,
and reimbursement of drugs and devices, and methods of product categorization and differentiation
help to distinguish among products, the next two characteristics – the method of payment and methods
of defining payment amounts – determine the structure and size of payments for new technologies.
While payment methods vary, the fundamental distinction is whether payers compensate providers or
suppliers of healthcare technologies on a per-unit basis or as part of a bundled payment for a package of
goods and services used for a clinically-defined episode of care. Per-unit payments seem unlikely to
favor development of any particular type of innovation, but may also be ineffective at discouraging
development of non-innovative products. A shift to bundled payments from per-unit payments may
incentivize development of cost-reducing products (from the perspective of the payer), but may
discourage incremental innovations.
Theoretically, broader use of value-based or outcomes-based reimbursement would lead to lower
returns on products and services offering little value added, higher returns for products with higher
value, and greater clarity about where the value-added is uncertain. This could potentially increase
incentives to invest in R&D aimed at products more likely to be deemed substantial or radical
innovations, or at least it could stimulate investment in the identification of biomarkers that could be
used as proxies for the clinical outcomes of interest in outcomes-based reimbursement.
The case study of the performance-based risk-sharing agreement for Velcade in the U.K. illustrates some
of the challenges in establishing performance-based payment. (Performance-based payment is closely

Page | 57
related to value-based or outcomes-based reimbursement, and involves use of a specific outcome target
that is considered a way of attaining value-for-money.) For the manufacturer, there is the uncertainty
about whether the drug will perform as expected, whether the outcomes achieved in a highly controlled
clinical trial environment can be replicated in every day clinical practice.117 It also highlights the practical
challenges, such as the identification of a clearly defined, objective metric of treatment effect
(performance) that is either a direct measure of clinical outcome (such as survival or cure) or a well-
accepted surrogate endpoint that closely corresponds to or reliably predicts the desired treatment
effect and is unaffected by other treatments. For payers, there is also a burden of measuring and
monitoring patient progress, and there may be the challenging prospect of having to withdraw coverage
of a drug either entirely, or in individual patients, depending on the nature of the risk-sharing
agreement. The vast majority of patient access schemes (PAS) in the U.K. subsequent to Velcade have
been financially-based arrangements, which are perceived as being simpler to administer than the
outcome- or performance-based PAS.118
The effects of reimbursement on innovation may also be muted by the ability of developers to
strategically price their products. Manufacturers’ pricing models take into account expectations about
lost sales due to higher costs or cost sharing; complex and secretive rebate and discounting mechanisms
favor high list prices; and cost sharing offset programs reduce the negative effects on demand when
payers apply patient cost sharing. Patient cost sharing does not appear to be an important barrier to
innovation at present, at least for substantial or radical innovations. However, with growing levels of
patient cost sharing, broader use of coinsurance, and very high list prices for new products, the balance
may tip if utilization drops more than manufacturers anticipate or can compensate for with cost-sharing
offset programs, or if manufacturers lose pricing power.
SUGGESTIONS FOR FUTURE RESEARCH
The direction and magnitude of effects on innovation resulting from most of the reimbursement
characteristics and three specific cases examined in this project remain unknown or uncertain, in part
because many of the effects reimbursement may have on innovation are indirect. Because there is no
centralized entity in the United States that establishes standards for defining what constitutes value or
that promotes investment in particular innovations, researchers focusing on the U.S. context are left
with a selection of initiatives from the private sector and public demonstration projects.
In-depth case studies that look at specific approaches to reimbursement may help to reduce some of the
uncertainty about how reimbursement acts to incentivize or deter development of products that are
117
Towse, A., & Garrison, L.P. Jr. (2010). Can’t get no satisfaction? Will pay for performance help? Toward an
economic framework for understanding performance-based risk-sharing agreements for innovative medical
products. Pharmacoeconomics 28(2):93–102. 118
National Institute for Health and Care Excellence. (2015). Patient Access Scheme Liaison Unit (PASLU) List of
technologies with approved Patient Access Schemes. Retrieved from http://www.nice.org.uk/About/What-
we-do/Patient-access-schemes-liaison-unit/List-of-technologies-with-approved-Patient-Access-Schemes

Page | 58
more likely to meet the definition of innovation used in this project. A well-designed and extensive case
study approach is the most likely to provide insights into all aspects of innovation, given the relative
scarcity of empirical evidence in the published literature. The expert panels we convened for this project
provided a rich level of insight into the diverse beliefs about the relationship between reimbursement
and innovation.
One example of a broader case study could be an extension of the value-based insurance design (VBID)
case study to include more payers. Premera is one of several private payers and employers that have
launched VBID initiatives, and the Medicare Advantage Value-Based Insurance Design Model announced
by CMS in September 2015 should provide additional opportunities. A comparison of the different
designs could provide insights into the differences and similarities between these programs, particularly
in terms of decisions concerning coverage and payment for drugs and devices. Indication-based pricing
is another concept that has recently garnered interest, for example as a way to link prices of oncology
drugs to their benefits.119 Indication-specific pricing is not yet being applied in the U.S., but a case study
could examine emerging models, such as the American Society of Clinical Oncology’s conceptual
framework to assess the value of cancer treatment options, or the Memorial Sloane Kettering Cancer
Center’s DrugAbacus (http://www.drugabacus.org/).120
There are several initiatives from the CMS Innovation Center announced or underway that may serve as
opportunities to evaluate how drug and device developers respond to bundled payments and other
reimbursement approaches focused more specifically on payment methods. These include the Health
Care Payment Learning and Action Network, and episode-based payment initiatives such as the Bundled
Payments for Care Improvements (BPCI) and the Comprehensive Care for Joint Replacement Model.
Ultimately, the impact of reimbursement on innovation hinges on the decision-making processes of drug
and device developers. A potential research study might involve a well-designed questionnaire of senior
R&D decision-makers about how their discovery and clinical development programs would differ under
various hypothetical reimbursement policies and programs, assuming they become universal or at least
widespread, and how they think that their target product profiles (TPPs) would be affected under these
scenarios. The questionnaire might be coupled with in-depth individual interviews of at least a subset of
survey respondents. The scenarios for this study could be derived from the case studies described
above. The willingness of R&D leaders to participate in such an analysis is uncertain. However, such a
study could offer a peek into the “black box” of decision-making within organizations engaged in drug
and device development.
Future research could also focus on implementation barriers related to use of comparative effectiveness
research findings. As noted in our assessment of Premera Blue Cross’ value-based formulary, several
119
Bach, P.B. (2014). Indication-specific pricing for cancer drugs. JAMA 312(16):1629-1630. 120
Schnipper, L. E., Davidson, N. E., Wollins, D. S., Tyne, C., Blayney, D. W., Blum, D.,… , Schilsky, R.L. (2015).
American society of clinical oncology statement: A conceptual framework to assess the value of cancer
treatment options. Journal of Clinical Oncology, doi:10.1200/JCO.2015.61.6706

Page | 59
people involved in that program’s roll-out were concerned by how often requests for economic data
from manufacturers were unmet, and it is resource-intensive for individual payers to assess the
available information. The Patient-Centered Outcomes Research Institute (PCORI) and other federal
programs are generating more comparative effectiveness evidence, and more private sector entities are
allocating resources towards comparative effectiveness. But, whether this is having or will have an effect
on prescribing patterns, and whether it is having or will have an effect on product development remains
to be seen.

Page | 60
APPENDIX A: A STANDARD REIMBURSEMENT DECISION-MAKING PROCESS
The approach to reimbursement decision-making is how payers make decisions on which drugs, devices,
and other healthcare technologies to make available to patients, at what price, and for whom. The
following steps are illustrative of a typical decision-making process by a P&T Committee or other
decision-making body.
1. Clinical evaluation. Typically, payers will review FDA documents providing details of efficacy and
safety of new molecules or biologics; they may also review the published literature and clinical
trial reports. Where comparative effectiveness evidence is available, this may also be considered
provided the comparisons are relevant and reflect current treatment patterns. Devices are
evaluated using a similar set of measures, although industry experts consulted during this
project noted that CMS coverage decisions are crucial for devices because other payers
frequently follow those decisions. Committee members typically seek to address the following
questions:
a. Is there compelling evidence of a need to add this drug to the formulary, or to cover the
device?
b. What is the quality of the evidence submitted for approval (and comparative evidence,
if available)?
c. Does the new product address an unmet or inadequately met need? 121
2. Coverage of the drug or device under the medical or pharmacy benefit. This administrative
decision has numerous implications for drug and device reimbursement, as payers may use
different methods of payment; different methods to establish the amounts that they will pay for
a product; or different patient cost sharing depending on the designated benefit package (we
discuss all of these characteristics in more detail later in this Appendix).
3. Potential for misuse. The committee examines the possibility for expansion of indications, which
could include supplemental approvals as well as off-label uses of new drugs, and inappropriate
use of devices. Accordingly, the payer may tag new drugs and devices with prior authorization or
other utilization controls.
4. Economic evaluation. The committee may assess a new drug or device’s total cost to the payer
and cost-effectiveness relative to existing treatment alternatives. In this context, the committee
asks whether the additional costs of the drug or device are justified by the additional benefits
expected. Industry and investor panelists viewed the increasing focus of payers/providers on
cost and health care economics as a key development, making bottom-line impact assessments
increasingly important. They noted that the expanding evidence requirements for new products
121
Wang, Z., Salmon, J.W., & Walton, S. (2004). Cost-effectiveness analysis and the formulary decision-making
process. Journal of Managed Care Pharmacy. 10(1):48-59.

Page | 61
in the U.S. and the rest of the world complicate the process of bringing technologies to market
and add cost and uncertainty to the process.
5. Approval or rejection by the committee. The committee makes the binary choice whether to
cover a drug or device.
6. Development of drug and device-use conditions. For covered items, the committee establishes
conditions of reimbursement, such as patient cost-sharing, prior authorization, quantity limits,
and step therapy requirements. Rebates are often a key driver of the development of drug-use
conditions. Payers negotiate rebates from manufacturers in exchange for their ability to move
market share. In this context, payers assign preferred status, such as lower patient cost-sharing
or fewer conditions of reimbursement, to products on the formulary in exchange for rebates.
For most payers, pricing information is confidential, but it is known that pricing decisions are
made during this phase of formulary management.
7. Drug and device-use monitoring and follow-up review. The committee reviews drug and device
claims and utilization data, in addition to medical claims where appropriate.

Page | 62
APPENDIX B: HI HEALTHINNOVATIONS CASE STUDY
BACKGROUND
The advance market commitment (AMC) concept gained traction in the early 2000s as a potential means
to encourage the development of new vaccines and treatments for neglected diseases.122,123,124 The
rationale was that diseases such as malaria and tuberculosis primarily affect developing countries, which
limits the commercial value of products targeting those diseases.123 By guaranteeing a market, or
removing at least some of the uncertainty about the size of the market, and therefore the projected
revenues, these commitments theoretically encourage more firms to invest in development of the
desired product(s). Observers note that the incentives for manufacturers may vary depending on the
structure of the agreement, such as “winner-take-all” or “multiple winners” approaches; front-loaded or
back-loaded financial incentives; and guarantees of quantity or guarantee of price only.122 Others raise
concerns that particular setups may require contributors to guarantee to pay for potentially medically
inferior products.125 “Bounties” or awards may be other, similar approaches to encourage development
of such products by providing a financial reward for production of a particular drug or device.
There are differences between the initial AMC concept and the hi HealthInnovations hearing aid model,
but both concepts are, at their core, formal agreements by a payer or other organization to guarantee a
vendor (or vendors) a viable market for a product viewed as desirable by payers, or, more broadly, by
society. Through an agreement with IntriCon Corporation, a developer and manufacturer of body-worn
medical and hearing devices, hi HealthInnovations established a line of custom hearing aids with
features it deemed necessary, at a price point that expanded the hearing aid market to many new
consumers. This case is an example of direct investment by a third-party payer to develop a device
tailored to its specifications, with a goal of improving health outcomes and reducing costs.
Experts consulted for this project noted that greater sharing with developers of information on what
items and services are being used and at what cost to payers would likely lead to new innovations
developed to reduce those costs, and target improvements on the most costly issues within particular
patient groups. However, commercial payers in the United States operate in a competitive business
environment, where it is unlikely for open sharing of cost information to take place. Current efforts to
expand all-payer databases and develop new tools to analyze “big data” sources, such as electronic
122
Berndt, E. R., & Hurvitz, J. A. (2005). Vaccine advance-purchase agreements for low-income countries: Practical
issues. Health Affairs, 24(3), 653-665. doi:10.1377/hlthaff.24.3.653 123
Berndt, E. R., Glennerster, R., Kremer, M. R., Lee, J., Levine, R., Weizsäcker, G., & Williams, H. (2007). Advance
market commitments for vaccines against neglected diseases: Estimating costs and effectiveness. Health
Economics, 16(5), 491-511. doi:10.1002/hec.1176 124
Levine, R., Kremer, M. R., & Albright, A. (2005). Making markets for vaccines: Ideas to action. Center for Global
Development, Advance Market Commitment Working Group. 125
Sonderholm, J. (2010). A theoretical flaw in the advance market commitment idea. Journal of Medical Ethics,
36(6), 339-343. doi:10.1136/jme.2009.033092

Page | 63
medical records, may make efforts to identify payers’ unmet needs more feasible in the future. In the
absence of such data sharing, developers are more reliant on payers and consumers to send signals
about the types of products they value. An advance market commitment clearly indicates a desire for a
particular innovation.
OBJECTIVES/RATIONALE OF HI HEALTHINNOVATIONS
Lisa Tseng, MD, CEO of hi HealthInnovations, offered several reasons for the development of the hearing
aid devices and related benefit program(s). One objective was to respond to a significant unmet need,
both among UnitedHealthcare health plan participants and the general U.S. population. 126 The
prevalence of hearing loss increases by age, with more than 40 percent of people age 60 or older in the
U.S. having loss in at least one ear, per World Health Organization criteria.127 The National Institute on
Deafness and Other Communication Disorders (NIDCD), part of the National Institutes of Health (NIH),
estimates that about 25 percent of the population between the ages of 65 to 74 and 50 percent of the
population aged 75 and older have disabling hearing loss. The NIDCD also estimates that just 30 percent
of adults ages 70 and older who could benefit from hearing aids, and only 16 percent of adults from ages
20 to 69 who could also benefit, have ever used them.128 Studies indicate that hearing loss leads to
lower workforce productivity and social isolation, and is associated with higher rates of depression and
cognitive decline, as well as other mental health concerns.129 Researchers have also observed a
relationship between hearing loss and increased risk of falls.130
Additional objectives for hi HealthInnovations were to improve access to hearing care and reduce the
price of hearing aids for all consumers and for people enrolled in the UnitedHealthcare’s commercial,
Medicare Advantage, and stand-alone Medicare prescription drug plans (PDPs). Along with affordable
health insurance and prescription drugs, Dr. Tseng noted that affordable hearing aids are one of the
most frequently-requested services among health care consumers.126 One reason is cost: health
insurance coverage for hearing aids is often limited, and costs for these devices can be high. Media
reports cite average out-of-pocket costs to consumers ranging from $1,000 to $4,000, and pricing for
126
Tseng, L. (2015, March 26). Personal communication. 127
Lin, F.R., Niparko, J.K., & Ferrucci L. (2011). Hearing loss prevalence in the United States. Archives of Internal
Medicine, 171(20), 1851-1853. doi:10.1001/archinternmed.2011.506 128
National Institute on Deafness and Other Communication Disorders (NIDCD). (April 20, 2015). Quick statistics.
Retrieved from http://www.nidcd.nih.gov/health/statistics/Pages/quick.aspx 129
Lin, F. R., Yaffe, K., Xia, J., Xue, Q.L., Harris, T.B., Purchase-Helzner, E.,… , Simonsick, E.M. (2013). Hearing loss
and cognitive decline in older adults. JAMA Internal Medicine, 173(4), 293-299. Retrieved from
http://dx.doi.org/10.1001/jamainternmed.2013.1868 130
Lin, F. R., & Ferrucci, L. (2012). Hearing loss and falls among older adults in the United States. Archives of
Internal Medicine, 172(4), 369-371. Retrieved from http://dx.doi.org/10.1001/archinternmed.2011.728

Page | 64
specific hearing aids may be much higher.131,132 Pricing can also be confusing, with some prices including
bundled services such as fitting, adjustment, and follow-up care, and other prices reflecting just the
purchase of the device itself. The traditional Medicare fee-for-service Medical Insurance program (Part
B) does not cover routine hearing exams, hearing aids, or exams for fitting hearing aids; coverage of
hearing aids is excluded by statute. Some Medicare Advantage (Part C) managed care plans cover them.
Hearing aids and related care are covered services in Medicaid.
In addition to making hearing aids more affordable and accessible, hi HealthInnovations wanted to offer
a line of products that gave consumers the benefit of advanced technologies, offering high-quality sound
and customizable settings for individual users, while avoiding “unnecessary” features.133 The company
wanted the hearing aids to be easy to use, particularly for older consumers and technophobes; another
objective was delivery of the hearing aids in a consumer-friendly manner.
KEY CHARACTERISTICS OF HI HEALTHINNOVATIONS
In 2011, hi HealthInnovations reached an agreement with IntriCon to develop and manufacture a set of
lower-cost hearing aids, using behind-the-ear and new (at the time) in-the-canal technologies. All of the
new hearing aids are “air conduction devices,” which are Class I medical devices and exempt from the
Food and Drug Administration’s (FDA) 510(k) submission process.134 Theoretically, such technologies
require fewer resources and time to develop because they do not need to demonstrate substantial
equivalence to an approved device, or go through a full scientific and regulatory review process.
By working with its own hearing health professionals and primary care providers in UnitedHealthcare’s
national networks to offer hearing testing, hi HealthInnovations was able to program and dispense
hearing aids custom-tailored to people via a direct-to-consumer distribution channel, removing
distribution intermediaries that may drive up costs. Moreover, in contrast to traditional hearing aids
where support was often available only from the original local supplier, UnitedHealthcare’s size made it
possible to support the devices nationwide through its care provider network or hi HealthInnovations
staff, including in-person, over-the-phone, or online.
UnitedHealthcare announced the new hearing aid program in October 2011, during the open enrollment
period for Medicare Advantage plans. The hearing aids were fully covered or offered with a low co-
payment to consumers in those plans, depending on the plan chosen by the consumer. It was not long
before the hearing aid discount was available to people enrolled in UnitedHealthcare’s commercial plans
as a fully covered or low co-payment benefit. At the time, it was a unique offering among major U.S.
131
Andrews, M. (2012, Apr 9). Unlike most insurers, UnitedHealthcare is offering big discounts on hearing aids. The
Washington Post. 132
Robertson, K. (2013, Jun 7). UnitedHealthcare now one of few insurers offering hearing aid benefit. Sacramento
Business Journal. 133
Tseng, L. (2015, March 26). Personal communication. 134
IntriCon Corporation. (2015). Form 10-K annual report filed 3/6/15 for the period ending 12/31/14. Retrieved
from http://investorrelations.intricon.com/secfiling.cfm?filingID=897101-15-290

Page | 65
Medicare and commercial payers. While other insurers provided some coverage for hearing aids, this
program stood out with its direct-to-consumer sales model and low out-of-pocket costs. The high level
of observed demand led hi HealthInnovations to expand its offerings to non-UnitedHealthcare
consumers and to develop “turn-key” programs, which enabled employers to directly adopt the discount
program, while enabling other health plans to also participate.
The hi HealthInnovations program offered relatively low out-of-pocket costs for hearing aids, compared
to traditional distribution channels. The hi HealthInnovations website listed retail prices of $799-$999
for these products in late April, while Medicare Advantage plan participants can access the devices for
cost-sharing amounts ranging from no cost to $450 per aid.
In addition to offering a selection of hearing aids for purchase online from hi HealthInnovations, the
program initially included an online hearing test. The intent of the online test was to increase access to
hearing care by enabling consumers to test their hearing at home. The test results provided information
necessary for the company to customize hearing gain levels on new hearing aids before shipping them
to customers. The online test was removed from the market shortly after launch due to regulatory
issues, discussed later in this report. hi HealthInnovations now provides hearing tests through a staff of
audiologists and hearing health professionals, and a network of contracted care providers; prospective
customers may also use hearing test results from their own care providers. hi HealthInnovations staff
noted that the company recently earned a U.S. patent for a hearing test kit that is available to health
care professionals for $179, compared to other in-office tests that retail for more than $1,000. Many
UnitedHealthcare network care providers can access the kit at no cost.
HOW MIGHT BROADER USE OF PROGRAMS SUCH AS HI HEALTHINNOVATIONS INFLUENCE
INNOVATION IN DRUGS OR MEDICAL DEVICES?
Dr. Tseng noted that achieving cost-effectiveness in developing the hearing benefit and the associated
testing and follow-up care was a significant hurdle in developing the hearing aid program. In part, it was
initially developed for individuals subscribed to UnitedHealthcare’s Medicare Advantage plans, and the
benefit needed to be affordable for those plans under their existing reimbursement levels.
Innovation, as defined for this research project, is a function of the extent to which a drug or device
addresses a disease or condition for which there is a substantive (i.e., non-trivial) unmet or inadequately
met need, and whether, and to what extent, the new product offers clinically meaningful benefits
compared to existing treatments. By this definition, the hi HealthInnovations hearing aids produced by
IntriCon may be “incremental” or even “substantial” innovations; they target a potentially significant
unmet need that can improve consumers’ quality of life and may help to reduce medical and behavioral
health expenditures. IntriCon asserts that the new hearing aids offer improved benefits over existing
technologies at comparable price points, such as better clarity and greater ability to filter out

Page | 66
background noise.135 If so, they may offer increased net health benefit compared to existing, similarly-
priced aids. The aids also appear to be consumer welfare-enhancing, by being offered at a price that
more patients are willing to pay. Payers and consumers often cite the high cost of hearing aids sold
through traditional channels as a significant barrier to broader adoption, so the lower cost of IntriCon’s
devices factors into their value-add assessments.
The conceptual model for this research project establishes expected return-on-investment (EROI) as a
proxy for incentives to innovate and posits that current returns on investment are viewed as indicative
of potential future returns. Our framework for analysis notes that reimbursement policies and practices
can affect EROI (or ROI) directly by establishing a particular payment level, which in turn affects average
sales price; by setting a volume of sales at that payment level; and/or by influencing the seller’s costs
associated with development, manufacture, or sale of a healthcare technology. Reimbursement policies
also stand to indirectly influence EROI/ROI by establishing different incentives for key actors, including
patients/consumers, dispensers, care providers, sellers, and payers. These incentives, in turn, affect
effective price, volume and, in some cases, seller costs.
The agreement between IntriCon and hi HealthInnovations is proprietary, so details are not publicly
available. IntriCon’s investor documents suggest that the agreement required a sizable ramp-up of
production to cover an anticipated surge in demand following the program’s launch and to meet
ongoing demand thereafter, with negotiated sales prices for those products.135 By pre-negotiating rates
with the developer, hi HealthInnovations provided consumers with a hearing aid benefit with little or no
out-of-pocket costs, at a much lower cost to the payer (UnitedHealthcare) than hearing aids in the
traditional channel. This type of arrangement would have directly affected IntriCon’s EROI by
establishing a sales price and offering the company assurance that a large number of potential
customers would gain access to its hearing devices and be able to afford them, virtually assuring a
substantial increase in sales. United Health Group does not disclose business unit-specific results, but Dr.
Tseng said that “large numbers” of consumers have taken up the benefit.136
IntriCon developed the hearing aids at the request of hi HealthInnovations, spurring innovation with a
promise that sales would follow. Direct investment by payers or other organizations in the development
of a potential technology is not a guarantee of successful innovation. Developers may face numerous
hurdles during research and development or commercialization, such as scientific challenges, regulatory
delays or failures, and unexpected economic costs that reduce the economic value of the new product,
relative to any clinical benefits. However, the risks of these adverse events are almost certainly lower for
Class I devices such as the hearing aids in this case.
Even if an innovative product is successfully developed and brought to market, the payer and developer
may not achieve the desired benefits/returns envisioned in the initial agreement. Depending on the
structure of the agreement, the returns may also fluctuate due to market conditions that are hard to
135
IntriCon Corporation. (2012). Form 10-K annual report filed 3/14/12 for the period ending 12/31/11. Retrieved
from http://investorrelations.intricon.com/secfiling.cfm?filingID=897101-12-440 136
Tseng, L. (2015, March 26). Personal communication.

Page | 67
predict. Adverse selection is a potential concern for payers with a unique offering in the market, as they
may attract disproportionate numbers of people who want and need the new product. Although
selection may be a minor concern with a hearing device, it could be significant with technologies
targeting expensive treatments or sicker patient groups. Another risk is that competing developers may
bring a superior – more innovative – product to market. For the payer, the agreement may lock them
into using the inferior product. For the developer, the competition may reduce the potential market for
the product developed under the advanced market commitment. In its 2015 annual report for investors,
IntriCon noted that several of the firm’s competitors “offer more standardized and less technologically
advanced products at lower prices,” and that competition negatively affected the firm’s sales and
margins.137
Sales of the innovative product may represent a large share of the developer’s revenues. Although it is
an established company, IntriCon’s most recent annual report notes that the firm depends on five
customers for about 57 percent of its net sales; the largest customer accounts for almost two-thirds of
that amount.137 Although IntriCon does not disclose that hi HealthInnovations is one of those top five
customers, it is an important one. Net sales in IntriCon’s hearing health business increased by 13.2
percent in calendar year 2012, the first full year of the hi HealthInnovations program.138 Net sales fell by
17.1 percent in 2013, which IntriCon primarily attributed to reduced purchases by hi HealthInnovations
and weak hearing device sales in conventional channels.139 Net sales rebounded in 2014, growing by
16.3 percent, because of strong sales to hi HealthInnovations and conventional channels.137
By removing at least some of the uncertainty about the size of the market, and therefore the projected
revenues, an advance market commitment theoretically encourages firms to invest in development of
the desired product(s). It is not clear how the agreement with hi HealthInnovations affected IntriCon’s
level of investment in efforts to develop new products. IntriCon’s filings for investors state that the
company conducts research and development (R&D) activities primarily to improve existing products
and proprietary technology, including technologies in the hi HealthInnovations devices, to spur long-
term revenues and margin growth.137 The manufacturer reported R&D expenditures of $4.9 million in
2011, $4.5 million in 2012, $4.2 million in 2013, and $4.8 million in 2014.137,138,139 These amounts
represent between 7 and 8 percent of total net sales over this period (Figure B1). The variation in the
ratio of R&D spending to total net sales does not align with trends in total sales, using either the same
year’s sales or sales in the preceding year. While it is reasonable to assume that the additional revenues
from hi HealthInnovations bolstered recent R&D budgets, IntriCon attributed the drop in R&D spending
in 2013 primarily to receipt of tax credits and global restructuring – not lower sales.
137
IntriCon Corporation. (2015). Form 10-K annual report filed 3/6/15 for the period ending 12/31/14. Retrieved
from http://investorrelations.intricon.com/secfiling.cfm?filingID=897101-15-290 138
IntriCon Corporation. (2013). Form 10-K annual report filed 3/13/13 for the period ending 12/31/12. Retrieved
from http://investorrelations.intricon.com/secfiling.cfm?filingID=897101-13-348 139
IntriCon Corporation. (2014). Form 10-K annual report filed 3/12/14 for the period ending 12/31/13. Retrieved
from http://investorrelations.intricon.com/secfiling.cfm?filingID=897101-14-317

Page | 68
Figure B1
Source: IntriCon Corporation 2012; 2013; 2014; 2015140,141,142,143
As noted, the incentives for manufacturers may vary depending on the structure of the agreement. An
approach similar to the design of hi HealthInnovations, which appears to be primarily a guarantee of
price only with some assurances about quantity, may work best in circumstances where a payer desires
a particular product and maintains control over access to that technology once it reaches the market. hi
HealthInnovations is the sole source for the specific hearing aids it contracted with IntriCon to produce.
This winner-take-all approach assured IntriCon of significant sales volume up front, while hi
HealthInnovations paid discounted rates. As such, this arrangement was beneficial to the payer
(UnitedHealth Group) and the developer (IntriCon). However, the arrangement carries risk for IntriCon
because it does not guarantee a minimum amount of purchases from hi HealthInnovations, those
purchases can cease at any time, and it limits the company’s ability to sell hearing aids or accessories to
another health insurer or directly to consumers.141 The risk to hi HealthInnovations appears to be low, at
least with regard to the agreement for the hearing aids, given the characteristics of the agreement
disclosed by IntriCon. The primary risk to hi HealthInnovations appears to be underutilization of the
140
IntriCon Corporation. (2012). Form 10-K annual report filed 3/14/12 for the period ending 12/31/11. Retrieved from http://investorrelations.intricon.com/secfiling.cfm?filingID=897101-12-440
141 IntriCon Corporation. (2013). Form 10-K annual report filed 3/13/13 for the period ending 12/31/12. Retrieved
from http://investorrelations.intricon.com/secfiling.cfm?filingID=897101-13-348 142
IntriCon Corporation. (2014). Form 10-K annual report filed 3/12/14 for the period ending 12/31/13. Retrieved from http://investorrelations.intricon.com/secfiling.cfm?filingID=897101-14-317
143 IntriCon Corporation. (2015). Form 10-K annual report filed 3/6/15 for the period ending 12/31/14. Retrieved
from http://investorrelations.intricon.com/secfiling.cfm?filingID=897101-15-290

Page | 69
benefit or increased competition in the “value” hearing health market, which would reduce return on
the investment in setting up the program.
Market competition and regulatory challenges are other potential hurdles that may affect the volume of
sales, either directly or by changing incentives for prescribers and consumers. Shortly after launch, hi
HealthInnovations faced opposition from hearing care providers. The American Academy of Audiology
and the Academy of Doctors of Audiology voiced concerns about the lack of intervention by professional
audiologists, the validity of the online hearing test and representation of the devices as a “cure” for
hearing loss.144,145 These and other organizations representing audiologists and hearing instrument (aid)
specialists argued that direct-to-consumer sales violated state dispensing laws and practices.145 Other
hearing-related organizations, such as the Hearing Loss Association of America which represents
consumers, were more supportive of hi HealthInnovations as a way to expand access to hearing health
care and hearing aids.146
Responding to complaints, the FDA investigated the online hearing test and determined that it was a
medical device, and it had not received FDA approval prior to marketing. hi HealthInnovations was
ordered to cease marketing the online test.147 The FDA’s decision did not prohibit marketing and sales of
the hearing aids, only the online hearing test developed by hi HealthInnovations. However, this decision
likely contributed to the drop-off in IntriCon’s hearing health sales by reducing consumers’ access to
testing that was necessary before obtaining the new devices. hi HealthInnovations eventually developed
a new hearing test kit for use by primary care physicians, nurse practitioners, physician assistants, and
other licensed medical professionals.
Although the initial opposition to this new model by hearing health provider groups focused on
consumer protection, it also reflects a common reaction when the established providers of a drug,
device, or related service see a new product or business model as a threat to their own businesses.
Opposition by provider organizations seems to have waned over time; several of the aforementioned
144
Walden, T., & Vircks, B. (2011, October 31). Letter to Lisa Tseng, CEO of hi HealthInnovations, from the American
Academy of Audiology and the Academy of Doctors of Audiology. 145
American Academy of Audiology. (2012). Academy efforts with regard to the UnitedHealthcare/hi
HealthInnovations direct-to-consumer hearing aid benefit and online hearing test. Retrieved from
http://www.audiology.org/advocacy/academy-efforts-regard-united-healthcarehi-healthinnovations-direct-
consumer-hearing-aid 146
Battat, B. (2012, April 2). Message to audiologists, hearing aid specialists, hearing aid manufacturers. HLAA
updates. Retrieved from http://www.hearingloss.org/content/message-audiologists-hearing-aid-specialists-
hearing-aid-manufacturers 147
Silverman, S. D. (2012, March 28). Letter to Lisa Tseng, CEO of hi HealthInnovations. Silver Spring, MD: Food and
Drug Administration.

Page | 70
organizations sent a joint statement to care providers in August 2012 about how to work with programs
such as hi HealthInnovations.148
The hi HealthInnovations approach, led by a single company, may be best suited to fostering innovation
in Class I medical devices. In contrast, this approach may not be as well suited to drugs. If a payer
invested directly in the development of a new drug product, it would not be possible for the payer, or a
subsidiary, to be the exclusive supplier of the drug. A large private payer might be able to get a
significant price concession, but use of external benchmarking or administrative pricing schemes by
other payers may limit the extent of discounts. For example, Medicaid’s “Best Price” provision requires
manufacturers to sell drugs to Medicaid at the lowest price offered to commercial payers, in most cases.
The private payer would therefore invest in a product that would benefit other payers and society more
broadly – including those that did not invest in the product. It is unlikely that this model is feasible for a
lone commercial payer to use to promote innovation of a new drug. Similarly, a larger coalition would
almost certainly be necessary to drive development of Class II or Class III devices that require more
extensive testing and regulatory approvals, which would generally increase research and development
costs. Other conditions would also need to be present, such as well-defined endpoints for measuring
benefits, and data and infrastructure to do so.149
Coalitions of multiple payers, social organizations, or governments may still find the AMC approach
feasible for development of products that produce social gains, as illustrated by the GAVI Alliance
(formerly, the Global Alliance for Vaccines and Immunization) and its Pneumococcal Vaccine Advance
Market Commitment Program for vaccines in developing countries. Research on a pilot program
suggests that this model accelerated the roll out of new vaccines to developing countries.150 Critics of
the GAVI program argue that programs that expand use of existing vaccines targeting more common
diseases, rather than development of new ones for less common conditions may save more lives for less
money, or that traditional discount purchasing mechanisms such UNICEF may be less expensive.151
However, the AMC approach appears to work well as a mechanism for bringing specific advances to
market, relatively quickly.
148
American Academy of Audiology, Academy of Doctors of Audiology, & American Speech-Language-Hearing
Association. (2012, August 17). Dear colleague letter. Retrieved from http://audiology-
web.s3.amazonaws.com/migrated/20120817_HearingHealthParadigmShift_letter_to_members.pdf_53a17b4
ca667d2.77577871.pdf 149
Neumann, P. J., Chambers, J. D., Simon, F., & Meckley, L. M. (2011). Risk-sharing arrangements that link
payment for drugs to health outcomes are proving hard to implement. Health Affairs. 30(12), 2329-2337. 150
Snyder, C. M., Begor, W., & Berndt, E. R. (2011). Economic perspectives on the advance market commitment for
pneumococcal vaccines. Health Affairs. 30(8), 1508-1517. doi: 10.1377/hlthaff.2011.0403 151
Scudellari, M. (2011). Are advance market commitments for drugs a real advance?. Nature medicine, 17(2), 139-
139.

Page | 71
CONCLUSION
In sum, the hi HealthInnovations hearing aid program is a case in which a payer observed a significant
unmet need among its subscribers and the general population. Believing that meeting that unmet need
would produce happier customers, health benefits, and potentially lower health care costs,
UnitedHealth Group invested directly in a product and distribution model meant to fill that gap. Based
on the definition of innovation used in this project, the hearing aids offered by hi HealthInnovations
might best be deemed incremental innovations. The advance market commitment and new distribution
model, rather than the devices, may be the greater innovations, which helped to make hearing aids
more affordable and accessible. The specific approach in this case seems most appropriate for similar
instances where a payer wants to invest in a relatively low-cost Class I device and has some ability to
limit access to the new product. A broader coalition would likely be necessary for the model to work as a
tool for encouraging investment in drug products or more complex devices.

Page | 72
APPENDIX C: PREMERA VALUE-BASED FORMULARY CASE STUDY
BACKGROUND
Originally termed the “benefit-based copay,” the intent of VBID is to align patients’ out-of-pocket costs
with the expected clinical benefits of products or services, relative to costs.152,153 With VBID, patients
who are expected to gain the greatest benefit from a product or service pay lower out-of-pocket costs
than patients expected to achieve more modest or minimal gains. Economic theory posits that insurance
coverage encourages greater consumption of health care products and services by reducing patients’
out-of-pocket costs. One of the arguments in favor of cost sharing is that it may reduce
overconsumption by incentivizing patients to avoid “low-value” services – that is, where the total costs
outweigh the clinical or health benefits. However, patients generally do not have the time, aptitude,
access to resources, or motivation to accurately weigh the benefits and costs to themselves, much less
from an insurer’s or societal perspective. Consequently, patients tend to reduce use of all types of care
when cost sharing is applied, not just “low-value” services. By reducing cost-sharing levels for “better”
or “more effective” care, and raising cost-sharing levels for less effective care, VBID theoretically steers
consumers towards these options and leads to more appropriate use and better outcomes.152
One rationale for VBID is to increase patient adherence to beneficial medications and potentially achieve
savings (or at least cost neutrality) through reductions in the use of high-cost services such as
emergency room visits and hospitalizations. As documented in other reports from this project, many
studies indicate that lower cost-sharing levels are associated with more use of medications and services
and better adherence to continuing therapies, while increases in cost sharing are associated with
reductions in use and adherence, even for “high-value” care.154
In theory, cost sharing in a VBID program should vary according to individual circumstances.155 Economic
theory also suggests that, for a given level of value, cost sharing generally should be lower if demand is
152
Chernew, M. E., Rosen, A. B., & Fendrick, A. M. (2007). Value-based insurance design. Health Affairs, 26(2),
w195-w203. Retrieved from http://content.healthaffairs.org/content/26/2/w195.abstract 153
Fendrick, A. M., Smith, D. G., Chernew, M. E., & Shah, S. N. (2001). A benefit-based copay for prescription drugs:
Patient contribution based on total benefits, not drug acquisition cost. American Journal of Managed Care,
7(9), 861-861-867. 154
Bruen, B., Cohen, J., DiMasi, J., Docteur, E., Dor, A., Lopert, R., ..., Shih, C. (2014). Task 3b deliverable: The
impact of selected characteristics of reimbursement policies on incentives to invest in the development of
innovative healthcare technologies. Interim report for the Impact of Reimbursement Policies and Practices on
Healthcare Technology Innovation project (Department of Health and Human Services' Contract #
HHSP23320095635) 155
Fendrick, A. M., Smith, D. G., Chernew, M. E., & Shah, S. N. (2001). A benefit-based copay for prescription drugs:
Patient contribution based on total benefits, not drug acquisition cost. American Journal of Managed Care,
7(9), 861-861-867.

Page | 73
inelastic, such as for chemotherapy, and higher where it is more elastic.156 Observers have noted in the
past that a cost sharing system with such a significant degree of complexity may not be practical on a
broad scale because of the high costs of setting up and maintaining the necessary administrative
systems; the paucity of information from which to assess value; and the difficulties of real-time
communication of clinical information and cost-sharing amounts between payers, care providers, and
consumers.157 These concerns still appear to be valid, although they may lessen as electronic record
systems and data sharing become more common.
Given these challenges, there are two typical approaches to VBID in practice. One approach reduces cost
sharing for products and services determined to have greater clinical value irrespective of individual
patient characteristics. For example, Pitney Bowes, a large U.S.-based employer, moved asthma inhalers,
beta blockers, and statins to its lowest cost tier in 2001. The second approach targets patients with
particular diagnoses, offering reduced cost sharing for specific services deemed likely to offer more
value. The city of Asheville, NC, and the University of Michigan used this approach in their VBID
offerings, specifically targeting employees with diabetes. Aetna operated a program that combined
elements of VBID (free or reduced cost sharing) and disease management for post-myocardial infarction
patients. Early adopters typically only reduced cost-sharing levels for products and services deemed
more valuable, and did not raise cost-sharing levels for other products to compensate.158
Regardless of the particular approach, VBID requires a clearly-defined, formal system of assessing value
– in terms of benefits relative to costs – to determine the appropriate copayment level.156 The
perspective of the benefit designer, which may be a third-party payer and/or plan sponsor, is critical
because that point of view will be a strong determinant of the definition of “value.” Although the
definition could incorporate social equity or other concerns, the interests of a third-party payer may not
align with a societal perspective.
RATIONALE AND OBJECT IVES FOR PREMERA’S VBRX
Discussing the rollout of VBRx at a 2013 conference, Prof. Louis Garrison, a health economist from the
University of Washington and member of the Premera Value Assessment Committee, noted that health
plans and their sponsors face rapidly rising drug benefit costs, with so-called “specialty drugs” a major
driver of growth.159 He noted that “typical” responses by plan sponsors include changing benefit designs
156
Fendrick, A. M., Smith, D. G., Chernew, M. E., & Shah, S. N. (2001). A benefit-based copay for prescription drugs:
Patient contribution based on total benefits, not drug acquisition cost. American Journal of Managed Care,
7(9), 861-861-867. 157
Chernew, M. E., Rosen, A. B., & Fendrick, A. M. (2007). Value-based insurance design. Health Affairs, 26(2),
w195-w203. Retrieved from http://content.healthaffairs.org/content/26/2/w195.abstract 158
Choudhry, N. K., Rosenthal, M. B., & Milstein, A. (2010). Assessing the evidence for value-based insurance
design. Health Affairs, 29(11), 1988-1994. doi:10.1377/hlthaff.2009.0324 159
Garrison, L. (2013). Are the Europeans doing a better job evaluating drugs than US P&T committees? The gap
between CER and HTA. AMCP Foundation Symposium: Transplanting European Health Technology Assessment
(HTA) to America? What's wrong with our version? San Antonio, TX.

Page | 74
to increase patients’ cost-sharing amounts and/or shift to consumer-driven models with high
deductibles or health savings accounts (HSAs). These changes put the onus on members to be more
responsible for their own health care utilization; payers may also put in place patient education, disease
management, or other programs focusing on primary or secondary prevention to support these efforts.
Prof. Garrison also noted that traditional pharmacy benefit designs use formularies based on the type of
drug, such as single source or multiple source, preferred or non-preferred.160 “Value” in this context
tended to be limited to the assessment of net unit costs.
The Premera VBRx program seeks to separate high value drugs from low value ones. A stated objective
is to develop a formulary based on incremental comparative effectiveness, where “value” incorporates
assessments of both clinical value and cost.160 Some of the guiding principles were:
The design should be evidence-based, following the guidance of a decision-making committee
made up of internal and external experts;
The process should be transparent, and take into account input from practicing physicians and
other providers, and;
It should explicitly incorporate health economic data.160
CHARACTERISTICS OF THE PREMERA VBRX PROGRAM
Two committees formally evaluate each drug to determine coverage and placement on the Premera
VBRx. The first is the Pharmacy and Therapeutics (P&T) Committee, which consists of seven physicians,
three pharmacists, a pharmacy benefit manager, and a lay member – none of whom may be Premera
associates.160 The P&T Committee examines the clinical benefit of products, including efficacy and
safety. The detailed clinical review includes synthesis of evidence from multiple sources, peer review of
the evidence, and presentation of findings during a formal P&T Committee review. Although the P&T
Committee may consider cost in cases where there are multiple therapies deemed to have comparable
clinical benefit, no formal economic evaluation occurs at this point.161
The second committee is the Value Assessment Committee (VAC), which determines a drug’s value and
tier placement. The VAC includes four economists, two practicing clinicians, a bioethicist, and one
member of the public.161 The diversity of the membership reflects the fact that the VAC considers the
quality of evidence for comparative effectiveness; effects on other medical costs and quality of
life/productivity; and societal values including patient preferences, equity, and end of life care.
160
Garrison, L. (2013). Are the Europeans doing a better job evaluating drugs than US P&T committees? The gap
between CER and HTA. AMCP Foundation Symposium: Transplanting European Health Technology Assessment
(HTA) to America? What's wrong with our Version? San Antonio, TX. 161
Sullivan, S. D., Yeung, K., Vogeler, C., Ramsey, S. D., Wong, E., Murphy, C. O., . . . Watkins, J. B. (2015). Design,
implementation, and first-year outcomes of a value-based drug formulary. Journal of Managed Care &
Specialty Pharmacy: JMCP, 21(4), 269-269-275.

Page | 75
The VAC assessments rely on “credible” sources of data and results from cost-effectiveness analyses,
such as manufacturers’ models; published economic studies and systematic reviews (e.g., Cochrane
reviews); data from the Cost Effectiveness Analysis Registry compiled by the Center for the Evaluation of
Value and Risk in Health (CEVR) at Tufts Medical Center; and reviews from assessment organizations in
other countries, including the National Institute for Health and Care Excellence (NICE) in the United
Kingdom and the Canadian Agency for Drugs and Technologies in Health (CADTH).162 To prepare for the
VAC meetings, reviewers examine the evidence; develop specifications for cost-effectiveness model(s);
build, run, and test model(s) for sensitivity to different assumptions; and then synthesize the evidence
into a monograph for peer review and presentation to the VAC.163 Premera developed assessments for
drugs in the 25 highest-volume drug classes used by its members, representing approximately 75% of
drug utilization in the plan.162 Drugs in classes that were not assessed received a tier assignment based
on their placement in the standard formulary used in Premera’s other drug plans.162
The Premera VBRx strays somewhat from the ideal VBID structure in that the amount of cost sharing
does not explicitly account for the value of the specific service for a particular patient. The latter would
be difficult and resource intensive to implement and maintain, as it would require tailored assessments
of value. Instead, the VBRx benefit has four tiers, based on each drug’s incremental cost effectiveness
ratio (ICER), which is measured as cost per quality-adjusted life year (QALY) of the drug generally, not for
a specific patient. Premera created the thresholds for each tier, shown in Table C1, based on thresholds
used internationally and cost-sharing arrangements of U.S. commercial plans.162 The “standard” QALY
thresholds are not absolute, and some products may be placed on a “preventive list.” Drugs for rare
conditions (“ultra-orphan” drugs) are subject to different, more liberal “special case” thresholds (Table
C1). Even after this assessment, a product’s placement on the VBRx may still depend on extenuating
clinical or societal circumstances.
162
Sullivan, S. D., Yeung, K., Vogeler, C., Ramsey, S. D., Wong, E., Murphy, C. O., . . . Watkins, J. B. (2015). Design,
implementation, and first-year outcomes of a value-based drug formulary. Journal of Managed Care &
Specialty Pharmacy: JMCP, 21(4), 269-269-275. 163
Garrison, L. (2013). Are the Europeans doing a better job evaluating drugs than US P&T committees? The gap
between CER and HTA. AMCP Foundation Symposium: Transplanting European Health Technology Assessment
(HTA) to America? What's wrong with our Version? San Antonio, TX.

Page | 76
Table C1
Tier Standard Thresholds Special Case Thresholds
Preventive tier -- not applicable -- -- not applicable --
Tier 1: Highly cost-effective
<$10,000 per QALY <$50,000 per QALY
Tier 2: cost-effective $10,000 to $50,000 per QALY $50,000 to $150,000 per QALY
Tier 3: somewhat cost-effective
$50,000 to $150,000 per QALY >$150,000 per QALY
Tier 4: minimally cost-effective
>$150,000 per QALY or insufficient evidence to determine cost-effectiveness
Insufficient evidence to determine cost-effectiveness
Source: Sullivan et al., 2015164
Table C2
The VBRx copayments vary by tier (Table C2). Products designated for
the preventive tier have no cost sharing. Products on the other tiers
have fixed cost sharing amounts that increase on each successive tier
– that is, as the assessed cost-effectiveness of a product decreases,
the out-of-pocket cost to the consumer increases.
Source: Sullivan et al., 2015164
For Premera, the VBRx program enabled an initial cost shift to members without affecting adherence in
high value drug classes in the first year following implementation.165 The plan’s pharmacy payments
dropped by about 3% per member per month (PMPM) compared to payments in the prior year.164
Compared to simulated PMPM amounts based on historical trends, which were intended to model a
counterfactual where the VBRx had not been implemented, the estimated savings were about 11
percent PMPM.164
The impact on member and overall health plan costs has not been determined and is unclear.164
Consumers experienced a range of effects under the VBRx. Overall, group members saw their out-of-
pocket costs increase by 12 percent for all medications, but patient with diabetes, hypertension, and
dyslipidemia experienced lower overall increases across all of their medications (5%, 8%, and 2%,
respectively).164 However, the plan increased cost-sharing levels simultaneous to the launch of the VBRx,
164
Sullivan, S. D., Yeung, K., Vogeler, C., Ramsey, S. D., Wong, E., Murphy, C. O., . . . Watkins, J. B. (2015). Design,
implementation, and first-year outcomes of a value-based drug formulary. Journal of Managed Care &
Specialty Pharmacy: JMCP, 21(4), 269-269-275. 165
Garrison, L. (2013). Are the Europeans doing a better job evaluating drugs than US P&T committees? The gap
between CER and HTA. AMCP Foundation Symposium: Transplanting European Health Technology Assessment
(HTA) to America? What’s wrong with our Version? San Antonio, TX.
Tier Co-payment
Preventive $0
Tier 1 $20
Tier 2 $40
Tier 3 $65
Tier 4 $100

Page | 77
which contributed to a cost shift: high-utilizers experienced both co-payment decreases and increases,
while low-utilizers generally paid higher out-of-pocket costs.166
Subscribers’ responses to the cost shift varied, with some shifting to lower-cost drugs, and some paying
the higher costs and continuing on original medications.166 Skipping medications, cutting tablets, or
other strategies to reduce out-of-pocket costs were purportedly rare.166 Overall use and adherence
increased among hypertension patients; effects for other groups were not statistically significant.166
Although Premera intended to convey the value of products through variation in copayment levels,
participants in focus groups convened by the organization were generally unaware or lacked
understanding regarding the VBRx.167 Members of the Premera VAC and others involved in the
development of the VBRx characterized these focus group participants as “positive” toward the use of
evidence and efforts to hold down costs and encourage consumers to take more responsibility for their
own health, but noted that they also wanted to know who determined the value of drugs.166,167
HOW MIGHT BROADER USE OF PROGRAMS LIKE VBRX INFLUENCE INNOVATION IN DRUGS
OR MEDICAL DEVICES?
VBID is a concept with significant traction among state and federal policymakers, who appear to view it
as conceptually appealing even though implementation has been limited to date. Many stakeholders
have voiced support for VBID, and Section 2713(a) of the Affordable Care Act explicitly encourages
development of guidelines for VBID programs. There has been some controversy about the attention
given to VBID, in part due to the limited evidence available for assessment of the potential effects on
clinical outcomes, other benefits, and costs from the perspective of patients, third-party payers, and
plan sponsors.168
Despite its high profile, uptake of VBID has been slow among payers and plan sponsors. To date, most
efforts in the U.S. have been limited in scope compared to the Premera VBRx program. Most payers
apply VBID programs to a very small number of therapeutic classes. One effort that was broader in
scope was a value-based formulary called RxImpact developed by Humana, where drugs were placed
into one of four groups based on the insurer’s assessment of the ability of a drug to avoid more serious
medical events (e.g., hospitalizations) and the length of time before its use might affect total medical
expenditures for the plan. The cost-sharing structure did not vary for different patients, but instead the
166
Garrison, L. (2013). Are the Europeans doing a better job evaluating drugs than US P&T committees? The gap
between CER and HTA. AMCP Foundation Symposium: Transplanting European Health Technology Assessment
(HTA) to America? What’s wrong with our Version? San Antonio, TX. 167
Sullivan, S. D., Yeung, K., Vogeler, C., Ramsey, S. D., Wong, E., Murphy, C. O., . . . Watkins, J. B. (2015). Design,
implementation, and first-year outcomes of a value-based drug formulary. Journal of Managed Care &
Specialty Pharmacy: JMCP, 21(4), 269-269-275. 168
Choudhry, N. K., Rosenthal, M. B., & Milstein, A. (2010). Assessing the evidence for value-based insurance
design. Health Affairs, 29(11), 1988-1994. doi:10.1377/hlthaff.2009.0324

Page | 78
plan paid a fixed allowance per prescription depending on the group the drug was in, and the patient
paid any difference between the allowance and the drug’s retail cost.169
Chernew and colleagues (2007) list a number of challenges and concerns that may dissuade payers and
plan sponsors from broader adoption of programs like VBRx, including:
Cost of implementation;
Cost of increased use of drugs relative to potential benefits;
Lack of access to data/information necessary to determine appropriate cost-sharing levels;
Lack of sufficiently detailed data/research evidence for all groups and/or conditions;
Human resources and ethics concerns (e.g., “favoring” certain people with lower cost sharing);
HIPAA/privacy concerns with high levels of information about specific patients changing hands
to administer the program;
Legal barriers (e.g., government program restrictions on financial incentives for patients);
Concerns about affecting incentives for patients to use products with lower total costs to the
payer or system (such as generic drugs) if cost sharing is also reduced for products with higher
total costs, and;
Possibility of adverse selection, if a benefit viewed as particularly generous for people with a
particular condition attracts those people to the employer/health plan. 170
From the perspective of a third-party payer, plan sponsor, or self-insured organization – all groups for
which total costs of care are most relevant – higher levels of churn/turnover among plan participants
may discourage use of VBID if they believe they will incur higher total costs for drug benefits without
capturing the future benefits, such as better health outcomes and cost savings.171 Payers with less
participant turnover, such as Medicare or the Veterans’ Administration, may have longer investment
horizons. Experts consulted for this study noted that private payers may also be taking longer
perspectives than may have assumed in the past.172
169
Lewis, C. (2007). Will value-based pharmacy design take off? National managed care outlook. HealthLeaders-
Interstudy. 170
Chernew, M. E., Rosen, A. B., & Fendrick, A. M. (2007). Value-based insurance design. Health Affairs, 26(2),
w195-w203. Retrieved from http://content.healthaffairs.org/content/26/2/w195.abstract 171
Choudhry, N. K., Rosenthal, M. B., & Milstein, A. (2010). Assessing the evidence for value-based insurance
design. Health Affairs, 29(11), 1988-1994. doi:10.1377/hlthaff.2009.0324 172
These experts offered several reasons why plans may be taking on longer investment horizons: (1) they may
have lower levels of expected turnover of plan participants, related to people holding onto jobs longer both during
and immediately following the recent recession; (2) consolidation in the marketplace has led to larger health plans
and increased the likelihood that people will remain in a plan operated by the insurer, even if they change jobs,
and; (3) many insurers participate in multiple markets, including employer-based, Marketplace exchanges
(individual), and Medicare Advantage, so they may cover the same person at multiple points during his/her
lifetime, even if there are gaps in coverage.

Page | 79
Studies indicate that VBID initiatives are associated with modest increases in adherence to targeted
therapies, although effects on costs and clinical outcomes are less clear.173 Consequently, for payers,
drug spending tends to increase, while effects on non-medication spending and total spending are
unclear. For example, Blue Cross, Blue Shield of North Carolina attempted a VBID plan in 2008, which
eliminated copayments for generic medications and lowered copays for brand-name drugs; though
patient adherence improved and hospital admissions decreased, there were no changes in emergency
department use or in health expenditures and early experience was not cost-neutral.174 A recent review
of empirical evidence from VBID programs found that the plans that achieved the best patient
adherence were those that targeted high-risk patient subgroups (for whom cost is a significant barrier),
had more generous reductions in out of pocket costs, offered wellness programs, and were only
available for medication ordered by mail.175
Quantifying the return for payers from VBID is challenging. Overall, for the patient and payer combined,
evidence suggests that drug spending may increase without a significant change in non-medication or
total spending.176 However, observers have noted that changes in adherence attributed to VBID
programs tend to be modest, the evidence base is small, and the methods often not very rigorous.177
Some observers have suggested that VBID plans may not achieve savings because patients in
commercial plans tend to be less price sensitive, and the high-cost events that these programs may seek
to avoid, such as emergency room visits and hospital stays, are relatively rare – so it is harder to offset
the extra costs from lower copayments.178
PBMs have sometimes expressed doubts about VBID, with some viewing it as a higher cost method to
improve adherence than other strategies.177 A 2007 Health Leaders-Interstudy report quoted Bob Craig,
an executive from Medco Health Solutions, saying that, with regard to VBID, “[e]mployers want to know
the [return on investment] as well as the time required for the healthcare payment on the
173
University of Michigan Center for Value-Based Insurance Design. (2014). The evidence for V-BID: Validating an
intuitive concept. (Brief). 174
Maciejewski, M. L., Wansink, D., Lindquist, J. H., Parker, J. C., & Farley, J. F. (2014). Value-based insurance design
program in North Carolina increased medication adherence but was not cost neutral. Health Affairs, 33(2),
300-308. doi:10.1377/hlthaff.2013.0260 175
Choudhry, N. K., Fischer, M. A., Smith, B. F., Brill, G., Girdish, C., Matlin, O. S., . . . Shrank, W. H. (2014). Five
features of value-based insurance design plans were associated with higher rates of medication adherence.
Health Affairs, 33(3), 493-501. doi:10.1377/hlthaff.2013.0060 176
Yeung, K. (2014). Design, implementation, and first-year results of a value-based formulary. ISPOR 19th Annual
International Meeting, Montreal, Quebec, Canada. 177
Fairman, K. A., & Curtiss, F. R. (2011). What do we really know about VBID? Quality of the evidence and ethical
considerations for health plan sponsors. Journal of Managed Care Pharmacy : JMCP, 17(2), 156-174.
doi:2011(17)2: 156-174 178
Melnick, S. J., & Motheral, B. R. (2010). Is “value-based” value wasted? Examining value-based insurance
designs through the lens of cost-effectiveness. Journal of Managed Care Pharmacy 16(2), 130-133.

Page | 80
investment.”179 Mr. Craig noted that how an employer or other plan sponsor or designer views VBID for
a particular set of patients may depend on the quality of the available evidence used to inform decisions
about “value,” the investment horizon of the employer or payer, and the underlying benefit philosophy
and expectations.179 He added that “[VBID] may prove to be less well suited for employers with younger
workforces or higher turnover.”179 Some of the experts consulted for this project echoed these
sentiments.
Both patients and health care providers must buy into the VBID concept.180 VBID raises difficult
questions that require value judgments. Who decides what constitutes “value” for a particular plan is
clearly important and potentially controversial. Some may disagree about which evidence is best or
conclusions based on that evidence – for example, the controversy over the U.S. Preventive Task Force’s
recommendations concerning breast cancer screening highlight that major differences of opinion are
likely to remain even in cases where decisions are evidence-based. Concerns about value judgments,
and the challenges of obtaining patient and provider buy-in, are likely to be magnified in the context of
specialty drugs.181 A systematic review of the literature on specialty drug therapies for rheumatoid
arthritis, multiple sclerosis, and breast cancer concluded that these therapies offered significant
potential benefits for patients, but achieving the best outcomes and most cost-effective use required
identifying the most effective product(s) and the most appropriate patients within each category.182
Other research indicates that specialty drugs may confer somewhat greater benefits than traditional
drugs, but at higher costs and with considerable variation in costs per QALY.183
For programs like Premera’s VBRx to succeed on a broader scale, plans and plan sponsors will require
access to data and empirical evidence about clinical benefits and costs, both monetary and non-
monetary. One potential limitation is that limited availability of evidence from cost-effectiveness
assessments may prevent optimal placement of drugs.184 Some developers such as Novartis, BMS,
Amgen, Lilly, and Sanofi-Aventis reportedly adapted European models for use in the U.S. context or
179
Lewis, C. (2007). Will value-based pharmacy design take off? National managed care outlook. HealthLeaders-
Interstudy. 180
Fendrick, A. M., Smith, D. G., Chernew, M. E., & Shah, S. N. (2001). A benefit-based copay for prescription drugs:
Patient contribution based on total benefits, not drug acquisition cost. American Journal of Managed Care,
7(9), 861-861-867. 181
Fendrick, A. M., Buxbaum, J., & Westrich, K. (2014). Supporting consumer access to specialty medications
through value-based insurance design. Washington, DC: National Pharmaceutical Council. 182
Zalesak, M., Greenbaum, J. S., Cohen, J. T., Kokkotos, F., Lustig, A., Neumann, P. J., . . . Dubois, R. W. (2014). The
value of specialty pharmaceuticals - A systematic review. Journal of Managed Care Pharmacy, 20(6) 183
Chambers, J. D., Thorat, T., Pyo, J., Chenoweth, M., & Neumann, P. J. (2014). Despite high costs, specialty drugs
may offer value for money comparable to that of traditional drugs. Health Affairs, 33(10), 1751-1760 184
Yeung, K. (2014). Design, implementation, and first-year results of a value-based formulary. ISPOR 19th Annual
International Meeting, Montreal, Quebec, Canada.

Page | 81
otherwise cooperated with the Premera VAC.185 However, the authors of a recent article describing the
program’s roll-out and early results were “concerned by the frequency with which [the VAC’s] requests
for economic data [from manufacturers] were either denied or ignored,” some of which may have been
attributable to manufacturers’ perceptions about the legality of sharing this information.186
The willingness of manufacturers to assist in value-based assessment processes may depend on the
extent to which they view the processes as transparent, fair, and, ultimately, beneficial in terms of
placement of at least some of their most important products. Given the general sentiments expressed in
studies of existing VBID programs that more and better data are needed, expansion of VBID programs
would likely lead to more pressures on developers to collect and share data. In theory, more data
requires more studies and higher costs of product development and/or sale, potentially reducing
developers’ expected return on investment (EROI). However, experts consulted during this study noted
that payers worldwide are already demanding more and better data for decision-making, so it is not
clear whether more use of VBID would dramatically increase costs of new drug and device development
for manufacturers relative to current trends. Current trends also may already reflect a growing emphasis
on value in other reimbursement approaches, not just VBID. Theoretically, if more plans explicitly
incorporate value into their assessments that determine availability of products and cost sharing for
patients, developers and manufacturers would be incentivized to invest in products that they believe
payers will view as innovative (i.e., meeting more significant unmet needs and/or providing greater net
health benefits relative to existing treatments) and potentially consumer-welfare enhancing.
In lieu of manufacturer participation in assessment processes, plans will need to develop expertise and
capacity internally to conduct value assessments, as Premera did, but that will likely raise administrative
costs for the payer. The Premera experience suggests that local champions at the plan, accompanied by
health economists and others who will provide expertise, are important for creation and sustainability of
a VBID program.
VBID explicitly implicates changes in out-of-pocket payments for patients, but it is less clear that formal
assessments of value would lead to changes in sales prices for manufacturers/developers. Rebates and
other discounts negotiated between payers and manufacturers or other sellers are almost always kept
secret, and the Premera VBRx program is no exception. In theory, value-based methods of determining
payment amounts should decrease payment amounts (at least the payer’s share) for novel products that
are not innovative or cost-reducing, while increasing payment amounts for innovative products,
commensurate with the level of additional benefit. The VBRx uses cost-effectiveness thresholds to
determine tier placement, but with the caveat that a product’s placement on the VBRx may still depend
185
Garrison, L. (2013). Are the Europeans doing a better job evaluating drugs than US P&T committees? The gap
between CER and HTA. AMCP Foundation Symposium: Transplanting European Health Technology Assessment
(HTA) to America? What’s wrong with our Version? San Antonio, TX. 186
Sullivan, S. D., Yeung, K., Vogeler, C., Ramsey, S. D., Wong, E., Murphy, C. O., ..., Watkins, J. B. (2015). Design,
implementation, and first-year outcomes of a value-based drug formulary. Journal of Managed Care &
Specialty Pharmacy: JMCP, 21(4), 269-269-275.

Page | 82
on extenuating clinical or societal circumstances. Therefore, it is unclear how closely Premera’s concept
of value aligns with the definition of innovation used in this project, which is a function of the extent to
which a drug or device addresses a disease or condition for which there is a substantive (i.e., non-trivial)
unmet or inadequately met need, and whether, and to what extent, the new product offers clinically
meaningful benefits compared to existing treatments.
Theoretically, broader use of VBID and value-based formularies also would lead to less utilization of
products and services with little value added, and more utilization for products with higher value.
Assuming payments and utilization change in this manner, VBID may potentially increase incentives to
invest in R&D aimed at products that are more likely to be deemed as substantial and radical
innovations. The modest effects on utilization in the few VBID programs assessed to date do not suggest
major changes in health plans’ negotiating power compared to manufacturers solely because of VBID,
but the existing evidence is insufficient to draw any definitive conclusions about broader applications.
CONCLUSION
Further evaluation of programs such as Premera’s VBRx is needed to determine how broader use may
ultimately affect incentives in the marketplace that affect the return on investment for developers of
new products, including sales volume, sales prices, and development costs. Longer study periods may
help to tease out delayed effects on spending, health outcomes, or other factors. A broader focus on
total costs to a health plan is necessary. An assessment of spillover effects is also important; where VBID
applies to a particular category of services, such as drugs, but not others, there may be interactions with
other reimbursement systems for other services.187 To date, the evidence base from Premera’s VBRx
and VBID programs more broadly – at least that available in broadly-accessible public sources – is
insufficient to truly understand how broader adoption may affect innovation for healthcare
technologies.
187
Fendrick, A. M., Smith, D. G., Chernew, M. E., & Shah, S. N. (2001). A benefit-based copay for prescription drugs:
Patient contribution based on total benefits, not drug acquisition cost. American Journal of Managed Care,
7(9), 861-861-867.

Page | 83
APPENDIX D: NICE (UK) PERFORMANCE-BASED REIMBURSEMENT FOR VELCADE®
BACKGROUND - NICE AND ITS ROLE
The National Institute for Health and Care Excellence (NICE) was established in 1999 as the National
Institute for Clinical Excellence, a special health authority with the explicit objectives of reducing
variation in the availability and quality of treatments and care in the UK National Health Service (NHS),
promoting the diffusion and uptake of new technologies, setting quality standards, and improving
efficiency.188 In 2005 NICE was merged with the Health Development Agency, the development of public
health guidance was added to its remit, and its name changed to the National Institute for Health and
Clinical Excellence.
Since January of that year the NHS in England and Wales has been legally obliged to provide funding for
those medicines and treatments recommended by NICE, within three months of the release of the
relevant NICE Guidance.189 This was, at least in part, the result of an effort to address well-publicized
“postcode lottery” anomalies in which certain less-common treatments were funded in some parts of
the UK but not in others, due to local decision-making and fundholding within the NHS.189
Subsequently, in April 2013 NICE was established in primary legislation, becoming a Non-Departmental
Public Body (NDPB) accountable to the Department of Health, but operationally independent of
government. At that time the name was changed again, to the National Institute for Health and Care
Excellence, reflecting the acquisition of additional responsibility for developing guidance and quality
standards in social care.190
Today NICE’s role involves developing and promulgating guidance in four areas:
the use of health technologies within the NHS (such as the use of new and existing medicines,
treatments and procedures);
clinical practice (guidance on the appropriate treatment and care of people with specific
diseases and conditions);
guidance for public sector workers on health promotion and ill-health avoidance; and
guidance for social care services and users.
NICE appraisals of medicines and other health technologies are based primarily on assessments of
comparative clinical effectiveness and cost–effectiveness in various circumstances. Importantly, while
188
Chalkidou K, Tunis S, Lopert R, Rochaix L et al. Comparative Effectiveness Research and Evidence-Based Health
Policy: Experience from Four Countries. Milbank Quarterly. 2009;87(2):339–67. 189
Sorenson C, Drummond M, Kanavos P, McGuire A (2008). National Institute for Health and Clinical Excellence
(NICE): How does it work and what are the implications for the US? (Washington: National Pharmaceutical
Council, 2008). 190
National Institute for Health and Care Excellence (2013). NICE Charter. Retrieved from
http://www.nice.org.uk/Media/Default/About/Who-we-are/NICE_Charter.pdf

Page | 84
the NICE Board sets the organization’s strategic priorities and policies, NICE guidance and other
recommendations are made by independent committees.
The status of NICE guidance is reinforced in the NHS Constitution, which states that patients have the
right to any drugs and treatments recommended by NICE for use in the NHS, if the physician responsible
for the patient’s care considers them to be clinically appropriate.191
NICE’S APPRAISAL OF VELCADE (BORTEZOMIB)
Bortezomib is an anti-neoplastic agent belonging to a novel class of drugs known as proteasome
inhibitors. In 2005 bortezomib held UK marketing authorization as monotherapy for the treatment of
progressive multiple myeloma in patients who have received at least one prior therapy, and who have
undergone, or are unsuitable for, bone marrow transplantation.
NICE’s appraisal was based largely on evidence from the APEX (Assessment of Proteasome Inhibition for
Extending Remissions) trial, at that time the largest published randomized controlled trial of the
treatment of relapsed multiple myeloma. The trial compared response rate, time to disease progression
and overall survival in patients treated with bortezomib with those treated with high dose
dexamethasone (HDD), the standard of care at the time for patients who had relapsed following initial
treatment for multiple myeloma.192 Patients in the bortezomib arm experienced statistically significant
improvements in time to disease progression and overall survival, and the NICE APPraisal Committee
concluded that bortezomib monotherapy was more clinically effective than HDD monotherapy for the
treatment of relapsed multiple myeloma.193
Bortezomib was not found to be comparatively cost effective however; for patients at first relapse, the
ICER for bortezomib over HDD was estimated at £31,000 per life year gained, or £38,000 per
QALY.193,194,195 The ICER threshold in England is generally in the range of £20,000 - £30,000,196 unless
certain ‘end-of-life criteria’ apply.197,198,199
191
National Institute for Health and Care Excellence (2013). NICE Charter. Retrieved from
www.nice.org.uk/Media/Default/About/Who-we-are/NICE_Charter.pdf 192
Richardson PG et al (2005). Bortezomib or high-dose dexamethasone for relapsed multiple myeloma. N Engl J
Med 352(24):2487-98. 193
National Institute for Health and Clinical Excellence (2006). Final Appraisal Determination Bortezomib
Monotherapy for Relapsed Multiple Myeloma. Retrieved from http://www.nice.org.uk/guidance/ta129/
resources/final-appraisal-determination-bortezomib-monotherapy-for-relapsed-multiple-myeloma3 (accessed
May 05, 2015).
194 Where treatment was limited to patients at second relapse or third relapse, the ICERs increased to £77,000 and
£107,000 per life year gained, respectively. 195
Ferrario, A., & Kanavos, P. (2015). Dealing with uncertainty and high prices of new medicines: A comparative
analysis of the use of managed entry agreements in Belgium, England, the Netherlands and Sweden. Social
Science & Medicine; 124: 39–47

Page | 85
As noted in the Task 3a report, we define a healthcare technology to be a consumer welfare-enhancing
innovation if it meets our criteria for innovation and generates consumer surplus.200 NICE’s appraisal
committee concluded that despite evidence that bortezomib was more clinically effective than HDD, the
opportunity costs of its acquisition and diffusion would exceed the anticipated value of the projected
incremental benefits of treatment. Thus in this circumstances bortezomib would not meet the definition
of a consumer welfare-enhancing innovation.
THE MANUFACTURER’S RESPONSE – A RISK SHARING PROPOSAL
Wishing to avoid a negative recommendation by NICE, Janssen-Cilag put forward a proposal to the UK
Department of Health (DoH) for a novel, performance-based, risk-sharing arrangement (referred to as a
Patient Access Scheme or PAS). The proposal included a provision for treatment cessation in patients
failing to achieve a pre-defined response (based on measuring serum levels of M-protein, a tumor
marker indicative of tumor shrinkage and an accepted surrogate measure of disease progression), and
reimbursement to the NHS for cases of treatment failure. For each patient failing to achieve sufficient
tumor shrinkage as measured by a reduction in serum M protein of 50% or more, Janssen-Cilag agreed
to provide the NHS with a refund equal to the cost of that patient’s treatment, or the same amount of
the drug for another patient, at no charge to the NHS.195,201
Following the DoH’s in-principle acceptance of the risk-sharing arrangement, the drug was reanalyzed by
NICE. After analyzing various new economic considerations brought about by the risk-sharing
arrangements, the anticipated ICER was calculated to be £20,700 and the medicine was recommended
for use within the NHS.201
196
National Institute for Health and Clinical Excellence (2004). Guide to the methods of technology appraisal.
Retrieved from http://www.nice.org.uk/page.aspx?o=201974 197
NICE’s ‘reference case’ states that all QALYs are deemed to be of equal social value, regardless of to whom they
accrue or the context in which they are enjoyed. However in January 2009, NICE issued supplementary advice
effectively allowing a higher acceptable ICER when appraising life-extending, end-of-life treatments. See (NICE,
2009a) and (NICE, 2009b): 198
National Institute for Health and Clinical Excellence (2009a). Appraising Life-extending, End of Life Treatments
(London: NICE, 2009) 199
National Institute for Health and Clinical Excellence (2009b). End of Life Treatments: Summary Response to
Consultation (London: NICE, 2009) 200
Bruen, B., Cohen, J., DiMasi, J., Docteur, E., Dor, A., Lopert, R., …, Shih, C. (2014). Task 3a deliverables:
Conceptual Model, Recommended Characteristics for Analysis, and Analytical Framework. Interim Report for
the Impact of Reimbursement Policies and Practices on Healthcare Technology Innovation project
(Department of Health & Human Services' Contract# HHSP23320095635). 201
National Institute for Health and Clinical Excellence (2007). Final Appraisal Determination Bortezomib
Monotherapy for Relapsed Multiple Myeloma. Retrieved from
http://www.nice.org.uk/guidance/ta129/resources/bortezomib-monotherapy-for-relapsed-multiple-
myeloma-final-appraisal-determination3 (accessed May 05, 2015)

Page | 86
The final guidance issued by NICE specified that:
Bortezomib monotherapy is recommended as an option for the treatment of progressive multiple
myeloma in people who are at first relapse having received one prior therapy and who have undergone,
or are unsuitable for, bone marrow transplantation, under the following circumstances:
the response to bortezomib is measured using serum M protein after a maximum of four cycles
of treatment, and treatment is continued only in people who have a complete or partial response
(that is, reduction in serum M protein of 50% or more or, where serum M protein is not
measurable, an appropriate alternative biochemical measure of response) and
the manufacturer rebates the full cost of bortezomib for people who, after a maximum of four
cycles of treatment, have less than a partial response (as defined above).
DISCUSSION
Risk-sharing arrangements (RSAs) in healthcare between payers and manufacturers are not new. Purely
financial RSAs, under which rebates are paid or prices reduced where utilization or expenditure exceed
pre-determined thresholds,202 have been part of the reimbursement landscape in a number of countries
for some time.203,204 More recent, however, is the advent of the performance-based RSA, where
payment is contingent on the benefit of a technology being monitored in individual patients within a
specified population over a pre-determined period (reflecting actual clinical use), and with the price
paid, or amount of reimbursement based on the demonstration of a pre-specified response to
treatment.
In the UK, PAS are negotiated within the framework of the general voluntary agreement between the
DoH and the pharmaceutical industry, known as the Pharmaceutical Price Regulation Scheme (PPRS).
The PPRS underwent substantial reform in 2009, following an evaluation by the Office of Fair Trading
(OFT) that recommended replacing existing profit and price controls with a more value-based approach
to pricing.205 As a result of the OFT report, the new PPRS defined a clear typology of PASs in the UK,
consisting of two main types: financially based schemes and outcome-based schemes. In the first case,
the company does not alter the list price of the medicine but offers discounts or rebates linked to
202
These may, for example, represent the anticipated size of the population with a particular disease or condition,
or in which a drug is thought to be acceptably cost effective. 203
Adamski, J., Godman, B., Ofierska-Sujkowska, G., Boguslawa, O., Herholz, H., Wendykowska, K., …, Gustafsson,
L.L. (2010). Risk sharing arrangements for pharmaceuticals: potential considerations and recommendations for
European payers. BMC Health Services Research;10:153. 204
Neumann, P.J., Chambers, J.D., Simon, F., & Meckley, L.M. (2011). Risk-sharing arrangements that link payment
for drugs to health outcomes are proving hard to implement. Health Affairs ;30(12):2329-37. 205
Office of Fair Trading (2007). The Pharmaceutical Price Regulation Scheme: An OFT market study. Retrieved
from http://webarchive.nationalarchives.gov.uk/20140402142426/http://www.oft.gov.uk/shared_oft
/reports/comp_policy/oft885.pdf

Page | 87
several variables, such as the number of patients treated, or the response of these patients to the
treatment. In the second case, the outcome-based schemes have four different subtypes: proven value,
price increase, expected value rebate, and risk sharing.206 Figure D1 illustrates that typology.
Figure D1: Typology of Performance-based Patient Access Schemes in the UK
Source: Carlson et al (2010)207
The Velcade PAS was not the first arrangement to involve performance-based risk-sharing in the UK (see
Figure D2). In 2002 an agreement was reached to facilitate access to a number of multiple sclerosis (MS)
medications within the NHS, subject to data collection to support prior estimates of cost-effectiveness.
Uncertainty about the long-term cost-effectiveness of beta interferons (Avonex, Betaferon, Rebif) and
206
The Association of the British Pharmaceutical Industry, Department of Health, et al. The Pharmaceutical Price
Regulation Scheme, 2009. Retrieved from https://www.gov.uk/government/uploads/system/
uploads/attachment_data/file/207462/dh_098498.pdf 207
Carlson, J.J., Sullivan, S.D., Garrison, L.P., Neumann, P.J., & Veenstra, D.L. (2010). Linking payment to health
outcomes: A taxonomy and examination of performance-based reimbursement schemes between healthcare
payers and manufacturers. Health Policy; 96(3): 179-190

Page | 88
glatiramer (Copaxone) for MS had led NICE to recommend against their use in the NHS.208 Under an
arrangement reached with the manufacturers, the DoH agreed to allow the prescribing of these drugs
according to the Association of British Neurologists’ 2001 guidelines, conditional on the development of
a 10-year monitoring study that would collect data on the progression of disease in treated patients. If
any product failed to show benefits consistent with projections made at the outset of the arrangement,
the subsequent price to the NHS would be reduced to restore cost effectiveness to a benchmark of
£36,000 per quality adjusted life year (QALY) evaluated over a 20-year horizon.209 Aspects of the design
of the arrangement were subsequently criticized, including the time horizon, choice of outcome
measure, and use of historical controls. Concerns were also expressed about data governance issues,
and the costs and effort involved in data collection.208,210,211,212
208
Sudlow, C.L., & Counsell, C.E. (2003). Problems with UK government’s risk sharing scheme for assessing drugs
for multiple sclerosis. BMJ; 326(7385):388–92. 209
Boggild, M., Palace, J., Barton, P., Ben-Shlomo, Y., Bregenzer, T., Dobson, C., & Gray, R. (2009). Multiple sclerosis
risk sharing scheme: two year results of clinical cohort study with historical comparator. BMJ; 339 :b4677. 210
Warlow, C. (2003). Not such a bright idea: the UK risk sharing scheme for beta interferon and glatiramer acetate
in multiple sclerosis. Pract Neurol; 3:194-5. 211
Ebers, G. C. (2010). Commentary: Outcome measures were flawed. BMJ; 340 :c2693. 212
Raftery, J. (2010). Multiple sclerosis risk sharing scheme: A costly failure. BMJ; 340 :c1672.

Page | 89
Figure D2: Different types of performance-based reimbursement
Source: Coulton et al, 2010213
The Velcade PAS was however, the first to involve a manufacturer rebate for treatment failure. Because
the NHS would pay for the drug only for those patients who demonstrated an adequate response to
treatment, the PAS effectively amounted to both a performance guarantee and a substantial price
discount.214 , 215 However, unlike a simple discount arrangement or price-volume agreement, the
manufacturer has a strong incentive to maximize the number of patients who respond, not merely the
number treated or the quantity of drug sold.214 The result is potentially positive for all stakeholders; the
manufacturer gains market access and maintains its list price, the latter being extremely valuable as
many countries reference their prices against those in the UK;216 patients gain access to a therapy that
might otherwise not be subsidized, and may also benefit from more active, protocol-driven follow-up;
and the payer benefits from reduced budgetary risk, albeit with the added effort and cost of establishing
213
Coulton, L., Annemans, L., Javier, J., Brown, R., & Keskinaslan, A. (2010). Risk-sharing Schemes Worldwide: A
Landscape Analysis of Health Outcomes-based Reimbursement Agreements. United BioSource Corporation.
Retrieved from http://www.ispor.org/research_pdfs/35/pdffiles/PHP15.pdf 214
Garber, A.M., & McClellan, M.B. (2007). Satisfaction guaranteed—“payment by results” for biologic agents. N
Engl J Med;357(16):1575–7. 215
Neumann, P.J., Chambers, J.D., Simon, F., & Meckley, L.M. (2011). Risk-sharing arrangements that link payment
for drugs to health outcomes are proving hard to implement. Health Aff ;30(12):2329-37. 216
Ruggeri, K., & Nolte, E. (2013). Pharmaceutical pricing: The use of external reference pricing. Rand Corporation.
Retrieved from http://www.rand.org/pubs/research_reports/RR240.html

Page | 90
and maintaining a suitable patient tracking system—a burden which can, depending on the nature of
the performance metric, prove to be quite substantial.215
While to date there has been no formal evaluation of the Velcade PAS, both the MS and Velcade
examples highlight the practical challenges of performance-based or “payment by results”
reimbursement schemes. To be workable there should be a clearly defined, objective metric of
treatment effect (performance) that is either a direct measure of clinical outcome (such as survival or
cure) or a well-accepted surrogate endpoint that closely corresponds to or reliably predicts the desired
treatment effect and is unaffected by other treatments. The clinical outcome measure should not be
confounded by patient characteristics or the use of concomitant treatments that would obscure the
effect of the index therapy, unless these issues can be adjusted for in an analysis. The availability of a
validated and reliable well-accepted surrogate outcome, such as the serum M-protein level in the
Velcade PAS, was a clear advantage, and limiting the arrangement to second-line treatment—patients in
whom prior treatment had failed—reduced the likelihood that the results would be contaminated by
other treatments.217
Nevertheless Neumann et al (2011) found that performance-based risk-sharing arrangements for
pharmaceuticals are “appealing in theory but hard in practice.”218 For the manufacturer there is the
uncertainty about whether the drug will perform adequately, and whether the outcomes achieved in a
highly controlled clinical trial environment can be replicated in real-life settings.219 For payers there is
burden of measuring and monitoring patient progress, and there may also be the challenging prospect
of having to withdraw coverage of a drug either entirely, or in individual patients, depending on the
nature of the RSA. Although the PAS has become an integral part of the UK pharmaceutical
environment, since the Velcade example the vast majority have been financially based arrangements.
These are perceived as being far simpler to administer than the outcome- or performance-based PAS.220
There are currently 40 drugs with 55 approved PAS in place in the UK;221 of these the Velcade PAS is the
only current performance-based scheme.220
217
Garber, A.M., & McClellan, M.B. (2007). Satisfaction guaranteed—“payment by results” for biologic agents. N
Engl J Med;357(16):1575–7. 218
Neumann, P.J., Chambers, J.D., Simon, F., & Meckley, L.M. (2011). Risk-sharing arrangements that link payment
for drugs to health outcomes are proving hard to implement. Health Aff ;30(12):2329-37. 219
Towse, A., & Garrison, L.P. Jr. (2010) Can’t get no satisfaction? Will pay for performance help? Toward an
economic framework for understanding performance-based risk-sharing agreements for innovative medical
products. Pharmacoeconomics; 28(2):93–102. 220
National Institute for Health and Care Excellence (2015). Patient Access Scheme Liaison Unit (PASLU) List of
technologies with approved Patient Access Schemes. Retrieved from http://www.nice.org.uk/About/What-we-
do/Patient-access-schemes-liaison-unit/List-of-technologies-with-approved-Patient-Access-Schemes 221
Several drugs have multiple PAS, each applying to a different indication.

Page | 91
HOW MIGHT BROADER USE OF ARRANGEMENTS SUCH AS THE VELCADE PAS INFLUENCE
INNOVATION IN DRUGS OR MEDICAL DEVICES?
Whether performance-based RSAs such as the Velcade PAS influence incentives to innovate remains
unclear. Velcade was demonstrated to offer a clinical benefit over existing treatment options for
multiple myeloma, but at a net cost deemed to represent inadequate value for money relative to the
expected health gains. By this definition, at the original price proposed, Velcade did not meet the
definition of an innovation that enhances consumer welfare in the United Kingdom. By modifying the
effective price, and by inference, the cost effectiveness of the drug, the PAS modified this calculus,
allowing Velcade to meet the definition of a substantive innovation, albeit with an effect on the
manufacturer’s expected return-on-investment (EROI). While the PAS likely reduced the EROI relative to
unrestricted coverage, the EROI would almost certainly be better with the PAS than with a negative
recommendation from NICE. The PAS also enabled the manufacturer to maintain its list price for the
drug in the UK, a country from which prices are referenced all around (and beyond) Europe, thereby
helping to preserve EROI on sales made elsewhere.
The conceptual model presented in this research project cast EROI as a proxy for incentive to innovate
and posited that current returns on investment are viewed as indicative of potential future returns. Our
analysis has shown that reimbursement policies and practices can affect EROI (or ROI) directly by
establishing a particular payment level, which in turn affects average sales price; by setting a volume of
sales at that payment level; and by influencing the seller’s costs associated with development,
manufacture, or sale of a healthcare technology. Moreover, as noted previously, reimbursement policies
can also influence EROI/ROI indirectly by establishing different incentives for the various stakeholders
which can, in turn, impact effective price, volume and, in some cases, seller costs.
A Velcade PAS-style scheme is effectively a value-based method of determining an overall payment
amount that averts payer costs for novel products that are not innovative, while increasing payment
amounts for innovative products, commensurate with the level of additional benefit.
Theoretically, broader use of outcomes-based reimbursement would lead to lower returns on products
and services offering little value added, higher returns for products with higher value, and greater clarity
where value-added is uncertain—albeit at the cost (and risk) of implementing the outcomes-based
reimbursement scheme. This could potentially increase incentives to invest in R&D aimed at products
more likely to be deemed substantial or radical innovations—at the very least it may stimulate
investment in the identification and validation of biomarkers that could be tendered as proxies for the
clinical outcomes of interest when outcomes-based reimbursement is under consideration.
In light of the lack of measured evaluation of experience to date, coupled with the previously identified
challenges in effective implementation of outcomes-based arrangements, the Velcade case provides
insufficient evidence from which to draw definitive conclusions about the impact of the approach on
incentives to innovate.

Page | 92
CONCLUSION
The Velcade PAS in the UK was the first reimbursement protocol implemented in the UK to involve
rebates for treatment failure. NICE’s appraisal committee concluded that the opportunity costs of
acquisition and diffusion would exceed the anticipated value of the projected incremental benefits of
treatment. The PAS, a performance-based, risk-sharing arrangement, included a provision for treatment
cessation in patients failing to achieve a pre-defined response, and reimbursement to the NHS for cases
of treatment failure. At the original price proposed, Velcade did not meet the definition of an innovation
that enhances consumer welfare in the UK. The PAS changed the effective price and allowed Velcade to
meet the definition of a substantive innovation, albeit with an effect on the manufacturer’s expected
return-on-investment (EROI). It is unclear whether performance-based RSAs such as the Velcade PAS
influence incentives to innovate, in part because of the lack of measured evaluation of this program and
because of the challenges of designing and administering an outcome- or performance-based PAS. The
vast majority of PAS in the UK since the Velcade example have been financially based arrangements.

Page | 93
APPENDIX E: EXPERT PANELISTS
Ben Arcand Director of the Innovation Fellows Program University of Minnesota Medical Devices Center Mohan Bala VP Health Economics Outcomes Research Sanofi Edward Black President Reimbursement Strategies, LLC John Bertko independent actuarial consultant Chief Actuary with Covered California (California’s Insurance Marketplace) Matthew Brougham Former Vice President of CADTH (Canada's health technology assessment agency) and Chief Executive of PHARMAC (New Zealand’s universal drug plan) Patricia Danzon Celia Moh Professor at The Wharton School University of Pennsylvania Richard Evans Founder and General Manager SSR Health LLC Eric Faulkner Director of Pricing & Reimbursement for Consulting Quintiles Bonnie Handke Sr. Director, Global Healthcare Economics, Policy and Payment Structural Heart division Medtronic, Inc. Marc Hartstein Director, Hospital and Ambulatory Policy Group Center for Medicare Centers for Medicare and Medicaid Services (CMS)

Page | 94
Jo Carol Hiatt Chair of the National Product Council for Kaiser Permanente Chair of Kaiser Permanente's Inter-Regional New Technologies Committee Partner in Southern California Permanente Medical Group (SCPMG) Teresa Kauf Director, Health Economics and Outcomes Research Cubist Pharmaceuticals Peter Kolchinsky Founding Partner and Portfolio Manager RA Capital Christopher McCabe Health Economist Principal Investigator on PACEOMICS Capital Health Endowed Research Chair at the University of Alberta Visiting Chair at the University of Leeds Steve Miller Express Scripts Bernard Munos Senior Fellow at FasterCures, a Center of the Milken Institute Founder of InnoThink Christina Smith Ritter Deputy Director, Hospital and Ambulatory Policy Group Center for Medicare CMS James Robinson Leonard D. Schaeffer Professor of Health Economics Director of the Berkeley Center for Health Technology (BCHT) University of California at Berkeley Jyme Schafer Director, Division of Medical and Surgical Services Coverage Group, Center for Clinical Standards and Quality Center for Medicare CMS (On detail to the Center for Medicare & Medicaid Innovation at CMS) Michael Valentino Chief Consultant, Pharmacy Benefits Management Strategic Health Care Group Department of Veterans Affairs