The Icelandic Corporate Bond Market corporate bonds - june 2007.pdf · Credit Research • June...
25
See important disclosures on page 3 of this report Icelandic Corporate Bonds Corporate bonds issuance as well as the size of listed issues have grown fast over the last few years. Bond issuance of both unlisted and listed on OMX Nordic Exchange Iceland amounted to at least ISK 103 billion for the first five months this year which is more than the issuance for the whole year 2005. Kaupthing Research has issued a publication containing coverage of five new companies which have all issued corporate bonds. In February 2007, Kaupthing Research issued a publication on six companies; Exista, FL Group, Bakkavör Group, Atorka Group, Stodir and Síminn (Iceland Telecom) which have now been updated. The publication covers the credit profile of the companies, such as the company's profile, its credit summary and debt maturity. The new companies are Landsvirkjun, Icelandair Group, Nýsir, Norvik Banka and Eyrir Invest. • Landsvirkjun (The National Power Company) produces, distributes and sells wholesale electricity mainly to local public utilities. The company produces about 82% of all Iceland's electricity. Landsvirkjun is the second largest issuer of corporate bonds on the Icelandic market, with an outstanding nominal value of ISK 25.5 billion. • Nýsir is an international group engaged in property investments and developments, PFI/PPP projects and related services. Its core business operates from offices located in Iceland, the UK and Denmark. Nýsir has issued corporate bonds with outstanding nominal value of ISK 8 billion. • Icelandair Group is a holding company with 12 subsidiaries, focused on the airline and tourism sectors. The largest subsidiary, Icelandair, is responsible for approximately 50% of the group's turnover. Icelandair Group has issued corporate bonds with outstanding nominal value of ISK 6.2 billion. • Norvik Banka is a bank which operates at the Latvian and international financial markets. About 51% of the bank's equity is held by the company Straumborg ehf. Norvik Banka has issued discounting bills with outstanding nominal value of ISK 3.6 billion. • Eyrir Invest is an international investment company with main emphasis on investments in listed companies in Europe. About 60% of Eyrir Invest's holdings are shares in two listed companies in Iceland, Marel and Össur. Eyrir Invest has issued corporate bonds with outstanding value of ISK 2.6 billion. Coverage for more Icelandic companies which have issued bonds can be expected periodically in the near future. The next companies to follow will be Straumborg (an investment company) and Century Aluminium (an aluminium manufacturer). Research in Iceland: Ásgeir Jónsson [email protected] Tel. +354 444 6957 Linda Garðarsdóttir [email protected] Tel. +354 444 6965 Svava Jóhanna Haraldsd. [email protected] Tel. +354 444 6953 Fixed Income Sales: Stefán Ákason [email protected] Tel. +354 444 7311 Gísli Hauksson [email protected] Tel. +354 444 7315 Agnar T. Möller [email protected] Tel. +354 444 7316 Bergthór Ólason [email protected] Tel. +354 444 7306 Hulda Pjetursdóttir [email protected] Tel. +354 444 7313 Stefnir Agnarsson [email protected] Tel. +354 444 7308 Editor: Ásgeir Jónsson [email protected] Tel. +354 444 6957 The Icelandic Corporate Bond Market 27 June 2007
Transcript of The Icelandic Corporate Bond Market corporate bonds - june 2007.pdf · Credit Research • June...

See important disclosures on page 3 of this report
Icelandic Corporate Bonds
Corporate bonds issuance as well as the size of listed issues have grown fast over the last few years. Bond issuance of both unlisted and listed on OMX Nordic Exchange Iceland amounted to at least ISK 103 billion for the first five months this year which is more than the issuance for the whole year 2005.
Kaupthing Research has issued a publication containing coverage of five new
companies which have all issued corporate bonds. In February 2007, Kaupthing
Research issued a publication on six companies; Exista, FL Group, Bakkavör Group,
Atorka Group, Stodir and Síminn (Iceland Telecom) which have now been updated. The
publication covers the credit profile of the companies, such as the company's profile, its
credit summary and debt maturity. The new companies are Landsvirkjun, Icelandair
Group, Nýsir, Norvik Banka and Eyrir Invest.
• Landsvirkjun (The National Power Company) produces, distributes and sells
wholesale electricity mainly to local public utilities. The company produces
about 82% of all Iceland's electricity. Landsvirkjun is the second largest issuer
of corporate bonds on the Icelandic market, with an outstanding nominal value
of ISK 25.5 billion.
• Nýsir is an international group engaged in property investments and
developments, PFI/PPP projects and related services. Its core business
operates from offices located in Iceland, the UK and Denmark. Nýsir has issued
corporate bonds with outstanding nominal value of ISK 8 billion.
• Icelandair Group is a holding company with 12 subsidiaries, focused on the
airline and tourism sectors. The largest subsidiary, Icelandair, is responsible
for approximately 50% of the group's turnover. Icelandair Group has issued
corporate bonds with outstanding nominal value of ISK 6.2 billion.
• Norvik Banka is a bank which operates at the Latvian and international
financial markets. About 51% of the bank's equity is held by the company
Straumborg ehf. Norvik Banka has issued discounting bills with outstanding
nominal value of ISK 3.6 billion.
• Eyrir Invest is an international investment company with main emphasis on
investments in listed companies in Europe. About 60% of Eyrir Invest's
holdings are shares in two listed companies in Iceland, Marel and Össur. Eyrir
Invest has issued corporate bonds with outstanding value of ISK 2.6 billion.
Coverage for more Icelandic companies which have issued bonds can be expected
periodically in the near future. The next companies to follow will be Straumborg (an
investment company) and Century Aluminium (an aluminium manufacturer).
Research in Iceland:
Ásgeir Jónsson [email protected] Tel. +354 444 6957 Linda Garðarsdóttir [email protected] Tel. +354 444 6965 Svava Jóhanna Haraldsd. [email protected] Tel. +354 444 6953
Fixed Income Sales:
Stefán Ákason [email protected] Tel. +354 444 7311
Gísli Hauksson [email protected] Tel. +354 444 7315
Agnar T. Möller [email protected] Tel. +354 444 7316
Bergthór Ólason [email protected] Tel. +354 444 7306
Hulda Pjetursdóttir [email protected] Tel. +354 444 7313
Stefnir Agnarsson [email protected] Tel. +354 444 7308
Editor:
Ásgeir Jónsson [email protected] Tel. +354 444 6957
The Icelandic Corporate Bond Market
27 June 2007

Credit Research • June 2007 • Page 2 of 25
The Icelandic corporate bond market Total issuance of bonds has increased considerably through the years. Corporate bonds issuance has grown rapidly in the last few years, as well as the size of listed issues. Bond issuance of both unlisted and listed on OMX Nordic Exchange Iceland amounted to at least ISK 103 billion from January to May 2007 which is a 20.6% growth from the first five months in 2006 and slightly more than was issued in the whole year 2005.
Bond issuance, unlisted and listed on OMX Nordic Exchange Iceland (ISKbn)
20
40
60
80
100
120
140
160
2000 2001 2002 2003 2004 2005 2006 2007*
MunicipalitiesBanks, savings banks and other loan institutionsHFF bonds, housing bonds and housing authority bondsCorporate issuersTreasury notesForeign issuers
Source: Central Bank of Iceland
At the end of May 2007, corporate bonds represented 21.6% of the total market value
of the Icelandic bond market compared to 17.7% at the end of May 2006. Only HFF
and Housing Authority bonds have more market share on the Icelandic bond market, or
33.5% at the end of May 2007. The corporate bonds' turnover has also increased
during the first five months in 2007 and the growth is 315% from the same time last
year. The turnover this year already accounts for more than the turnover from January
to September 2006. Corporate bonds have the largest market share of the total market
value on the corporate bond market or 44.1%. Bank/Savings Bank bonds come in
second place with a 41.9% market share.
Corporate bond market - % of total market value
Bank/Savings Bank bonds,
41.9%
Other Corporate Bonds, 44.1%
Municipal Bonds, 3.3%
Loan Institution Bonds, 4.5%
Leasing Company Bonds, 0.2%
Foreign Bonds, 6.0%
Source: OMX Nordic Exchange Iceland
*January - May

Credit Research • June 2007 • Page 3 of 25
Companies from various industries have issued corporate bonds through the years. Prominent industries are e.g. the fishery and fish processing industry, real-estate industry, manufacturing and energy industry. Investment and/or holding companies as well as heating utilities have also been very active in issuing bonds. A large number of companies, or 50, have listed their bonds on the OMX Nordic Exchange Iceland. The number of issues listed totalled 87 in 25 June 2007.
Issuers of corporate bonds (as of 25 June 2007) Outstanding nominal value (ISKm)
No. of issues Internet home page Industry
Exista hf. 60,000 5 http://www.exista.com Financial service company
Landsvirkjun 25,500 3 http://www.landsvirkjun.com Electricity, gas and water supply
Atorka hf. 21,520 8 http://www.atorka.is Investment company
Bakkavör hf. 20,745 2 http://bakkavor.com Food manufacturer
FL GROUP hf. 20,000 3 http://www.flgroup.is Investment company
Eimskipafélag Íslands ehf. 19,800 4 http://www.eimskip.com Transport and storage
Fasteignafélagið Stoðir hf. 18,990 4 http://www.stodir.is Real estate, renting and business activities
Síminn hf. 14,000 1 http://www.siminn.co.uk Communication
Samson eignarhaldsfélag eh 10,000 1 Holding company
Tryggingamiðstöðin hf. 8,500 1 http://www.tryggingamidstodin.is Insurance company
Nýsir hf. 8,000 4 http://www.nysir.is Real estate, renting and business activities
365 hf. 7,300 5 http://www.365.is Holding company
Hagar hf. 7,000 1 http://www.hagar.is Wholesale and retail trade
Icelandair Group hf. 6,240 1 http://www.icelandairgroup.com Transport and storage
Marel hf. 6,000 1 http://www.marel.is Manufacturing company
Mosaic Fashions hf. 6,000 1 http://mosaic-fashions.is Wholesale and retail trade
Egla hf. 5,635 1 Holding company
Straumborg ehf. 5,250 2 Investment company
Olíufélagið ehf. 5,000 1 http://www.n1.is Oil service company
Norvik Banka 3,635 2 http://www.norvik.lv Bank
Alfesca hf. 3,000 2 http://www.alfesca.is Food manufacturer
Hitaveita Suðurnesja hf. 3,000 1 Electricity, gas and water supply
Spölur ehf. 3,000 1 http://www.spolur.is Construction
Ríkisútvarpið 2,650 2 http://www.ruv.is The Icelandic National Broadcast Service
Milestone ehf. 2,635 1 Investment company
Eyrir Invest ehf. 2,600 1 http://www.eyririnvest.com Investment company
Rafmagnsveitur ríkisins 2,310 2 http://www.rarik.is/english Electricity, gas and water supply
Félagsbústaðir 2,110 2 http://www.felagsbustadir.is Real estate, renting and business activities
Smáralind ehf. 2,100 1 http://www.smaralind.is Wholesale and retail trade
Orkuveita Reykjavíkur 2,000 1 http://www.or.is Electricity, gas and water supply
Samherji 2,000 1 http://en.samherji.is Manufacturing of fish and fish products
Others 15,623 28
Total: 322,143 94
Source: OMX Nordic Exchange Iceland
Provisional release:
The content of this release has been prepared by the Research Division of Kaupthing Bank hf. The Research Division bases its
information on data information services and news services, both foreign and domestic, which it considers reliable, along with
its own interpretations and evaluations of public information. Kaupthing Bank hf. accepts no responsibility for the accuracy of
this information nor any liability for transactions based on this information. In relation to this it should be noted that any of
the Research Division's discussion may be an abridged version of more extensive analysis and research and conditions of
financial markets change rapidly. For these reasons the recommendations and forecasts of the Research Division can change
without notice, but they do reflect the opinions of the Research Division's employees at the time that they are expressed.
Those parties who are interested in initiating transactions are advised to contact an expert at Kaupthing Bank hf. before any
decision is made. It should also be noted that Kaupthing Bank hf., its employees and other parties associated with the Bank
may have vested interests concerning particular organizations, which the Research Division's published material may pertain
to at any given time.

Credit Research • June 2007 • Page 4 of 25
Landsvirkjun – Electricity, Gas and Water Supply www.landsvirkjun.com
27 June 2007
Outstanding bonds
Ticker Coupon Type Indexation Maturity Last tradedIndicative Yield
Indicative Spread Duration
Outstanding Nominal Value (ISKm)
LAND 97 1 5.0% Coupon at maturity Indexed 19.09.2012 15.02.2006 6.04% 0.20% N/A 1,000.00
LAND 98 1 4.0% Coupon at maturity Indexed 24.08.2013 19.06.2006 5.79% 0.20% N/A 2,500.00
LAND 05 1 3.5% Annual Coupon Indexed 21.03.2020 22.02.2007 4.94% 0.40% N/A 22,000.00
Company Profile
Landsvirkjun (The National Power Company) was founded on 1 July 1965, on the basis of plans to step up harnessing of hydropower through development of power-intensive industries as well as meeting rapidly growing demand from the ordinary market. As of 1 January 2007, the Icelandic State became sole owner of Landsvirkjun. Landsvirkjun produces, distributes and sells wholesale electricity mainly to local public utilities. Landsvirkjun produces about 82% of all Iceland's electricity.
Landsvirkjun may from time to time issue notes (EMTN) denominated in any currency agreed between the issuer and the relevant dealer. EMTN notes can be traded on the Luxembourg Stock Exchange's regulated market and can be listed on the Luxembourg Stock Exchange.
Credit Summary
Landsvirkjun has issued three bonds, all indexed through the Consumer Price Index (CPI). The first bond, LAND 97 1, was issued 19 September 1997 and will mature in 5 years from now or 19 September 2012. The bond bears 5% interest rate, paid at maturity. The second bond, LAND 98 1, was issued 24 August 1998 and matures 24 August 2013. The bond bears 4% interest rate, paid at maturity. The third bond, LAND 05 1, was issued 21 March 2005 and bears a fixed 3.5% annual interest rate, paid annually. The bond will mature 21 March 2020.
The Icelandic Electricity Market
With the Icelandic Electricity Act no. 65/2003, adopted on 15 March 2003, substantial changes were made on the organisation of the electricity market. The law is in conformity with the EU electricity directive from 1996. The purpose of the Act is to enable competition in the sales of power. It became effective in stages until 1 June 2006 when the full opening of the market took place. The Act stipulates that an independent TSO operates the grid and a separation between generation, transmission, distribution and supply of electricity takes place.
Further Information
OMX Nordic Exchange Iceland (www.omxgroup.com)
- LAND 97 1
- LAND 98 1
- LAND 05 1
Debt Maturity
0
5
10
15
20
25
2008 2010 2012 2014 2016 2018 2020 2022 2024 2026
ISKbn
EM TNLAND 05 1LAND 98 1LAND 97 1
Company Structure
The company is divided into six divisions: Corporate Office, Finance, Energy, Engineering and Construction, Information System and Human Resources.
The role of the Finance Division is to manage the company's finances and provide its management with services which increase operational efficiency. The role of the Energy Division is to generate electricity at optimum efficiency and deliver it into the Landsnet transmission grid in line with customer orders at the time. The Engineering Division handles project management and consultancy.
Credit Rating
Landsvirkjun has a credit rating from Moody's and Standard & Poor's.
Moody's Standard&Poor's
Short-term P-1 A-1
Long-term Aaa/Stable A+/Stable

Credit Research • June 2007 • Page 5 of 25
Key figures Date: 26.06.2007
Price (ISK): -
Market cap: -
No. of shares: -
Reuters: -
Bloomberg: -
Not listed
INCOME STATEMENT ISK million 2006 2005 2004 2003 2002 20
Operating revenues 21,298 15,552 13,701 12,863 13,577 13,009
Operating expenses -6,377 -5,913 -4,691 -4,498 -4,431 -4,290
Operating profit (EBITDA) 14,920 9,639 9,010 8,366 9,146 8,720
Depreciation -5,131 -4,904 -5,347 -5,274 -5,182 -5,391
Profit before financial income (EBIT) 9,789 4,735 3,663 3,091 3,965 3,328
Net financial income (expenses) -26,201 1,596 3,532 -1,540 1,764 -5,167
Minority interest 52 -37 0 0 0 0
Taxes* 19,863 0 0 0 0 0
Profit for the year (period) 3,503 6,294 7,195 1,551 5,729 -1,839
BALANCE SHEET
01
ISK million 2006 2005 2004 2003 2002 20
Non-current assets 231,406 174,832 147,797 129,245 116,638 126,606
Current assets 11,813 7,153 6,888 5,283 4,602 5,535
Total assets 243,219 181,985 154,685 134,528 121,240 132,141
Equity 62,775 59,723 51,377 41,180 39,979 37,696
Non-current liabilities 165,921 102,971 94,012 86,799 70,501 88,822
Current liabilities 14,523 19,291 9,296 6,549 10,760 5,623
Total equity and liabilities 243,219 181,985 154,685 134,528 121,240 132,141
CASH FLOW STATEMENT
01
Net cash from (used in) operating activities 9,643 5,927 4,622 5,601 6,432 5,542
Net cash from (used in) investing activities -45,382 -28,582 -20,897 -16,877 -5,262 -8,415
Net cash provided by financing activities 37,296 22,313 16,843 11,239 -1,927 3,541
Change in cash flow 1,557 -342 568 -36 -756 668
FINANCIAL RATIOS
Operating profit (EBITDA) 70.1% 62.0% 65.8% 65.0% 67.4% 67.0%
Profit before financial income (EBIT) 46.0% 30.4% 26.7% 24.0% 29.2% 25.6%
Return on equity (ROE) 5.7% 11.3% 15.5% 3.8% 14.8% -5.1%
Equity ratio 25.8% 32.8% 33.2% 30.6% 33.0% 28.5%
Current ratio 0.81 0.37 0.74 0.81 0.43 0.98
EBITDA interest coverage 2.42 2.73 2.43 2.92 3.10 1.98
Interest coverage ratio 1.59 1.34 0.99 1.08 1.34 0.76
Debt/Equity ratio 2.95 2.11 2.01 2.27 2.03 2.51
Long-term debt/EBITDA 11.1 10.7 10.4 10.4 7.7 10.2
Funds from Operation/Total Debt 7.7% 7.0% 9.1% 9.1% 11.6% -
Free Operating Cash Flow/Total Debt -17.6% -20.6% -15.3% -8.9% 1.8% -
*Landsvirkjun and Landsnet hf. have been tax-exempted but in accordance with law no. 50 from 2005 the two companies
became taxable from 1 January 2006.

Credit Research • June 2007 • Page 6 of 25
Outstanding bonds
Ticker Coupon Type Indexation Maturity Last tradedIndicative Yield
Indicative Spread Duration
Outstanding Nominal Value (ISKm)
NYSI 08 0319 0.0% Zero Coupon Nominal 19.03.2008 N/A 16.20% 2.10% 0.74 3,000.00
NYSI 03 1 8.5% Annual coupon Indexed 17.07.2008 23.01.2007 6.94% 2.20% 0.98 2,000.00
NYSI 05 1 5.5% Annual coupon Indexed 01.09.2010 N/A 9.07% 2.60% 2.80 1,000.00
NYSI 06 1 6.5% Annual coupon Indexed 08.02.2011 22.01.2007 8.96% 2.60% 3.20 2,000.00
Company Profile
Nýsir was established in 1991. It is an international group engaged in property investments and developments, PFI/PPP projects and related services. The group holds PFI/PPP contracts for many schools, sports centres and public buildings in Iceland and the UK. In Denmark the group is a commercial property investor.
The group offers in-house specialist services such as facilities management, mechanical and electrical design services, environmental and energy management services and construction management. The Nýsir group has specialised in the private delivery of education, health care, sports, leisure and cultural programmes. It has also participated in expansion projects, both as a consultant and an investor.
Nýsir's core business operates from offices located in Iceland, the UK and Denmark. Business opportunities are currently being pursued in other European countries and the Middle East.
Credit Summary
Nýsir has issued three listed bonds which all are linked to the Consumer Price Index (CPI) and are annual coupon bonds. As well they have listed one corporate bill. The first bond (NYSI 03 1) was issued 17 July 2003. It bears 8.5% interest rate and will mature 17 July 2008.
The second bond (NYSI 05 1) was issued 1 September 2005 and will mature 1 September 2010. The bond bears 5.5% interest rate.
The third bond (NYSI 06 1) was issued 8 February 2006. It bears 6.5% interest rate and its maturity date is 8 February 2011.
The corporate bill (NYSI 08 0319) was issued on 19 March 2007 and will mature one year later.
Further Information
OMX Nordic Exchange Iceland (www.omxgroup.com)
- NYSI 03 1
- NYSI 05 1
- NYSI 06 1
Debt Maturity
0
1,000
2,000
3,000
4,000
5,000
6,000
7,000
8,000
2007 2008 2009 2010 2011 2012*
ISKm
NYSI 03 1 NYSI 05 1 NYSI 06 1 Long-term debt
*Borrowings in 2012 will mature that year and later.
Organisational Chart 2007
Recent News
Nysir Group has acquired two very large PFI contracts that will be fully operational by the end of 2009. The first is the Icelandic National Concert and Conference Centre and surrounding waterfront development at the east harbour of Reykjavik. The second is the 3R's school project in Aberdeen, Scotland, where Nysir and partners will build and operate 10 schools and one sports centre.
Nýsir
PFI & Property
Investments Investments Operations
Land and
Property
Developments
Nýsir – Real estate, renting and business activities www.nysir.is
27 June 2007

Credit Research • June 2007 • Page 7 of 25
Key figures Date: 26.06.2007
Price (ISK): -
Market cap: -
No. of shares: -
Reuters: -
Bloomberg: -
INCOME STATEMENT ISK million 2006 2005 2004 2003 2002
Operating revenues 3,947 1,358 678 354 224
Other revenues 366 1,935 793 0 0
Operating expenses -2,888 -924 -366 -134 -115
Operating profit (EBITDA) 1,425 2,369 1,106 221 109
Depreciation -99 -40 -8 -1 -39
Profit before financial income (EBIT) 1,326 2,330 1,098 219 70
Net financial income (expenses) -2,174 -344 -71 -101 -32
Share of profit (loss) in associates 323 -5 5 0 0
Profit before taxes -526 1,980 1,033 118 37
Taxes 75 -356 -189 -18 -10
Minority interest 135 -283 -103 -32 -6
Profit for the year (period) -316 1,341 741 68 21
BALANCE SHEET ISK million 2006 2005 2004 2003 2002
Non-current assets 41,121 15,285 9,711 5,140 2,174
Current assets 3,769 1,064 285 155 71
Total assets 44,890 16,349 9,996 5,295 2,245
Equity 6,272 3,885 2,291 943 341
Non-current liabilities 22,025 10,729 6,982 3,172 1,277
Current liabilities 16,593 1,735 722 1,180 627
Total equity and liabilities 44,890 16,349 9,996 5,295 2,245
CASH FLOW STATEMENT ISK million 2006 2005 2004 2003 2002
Net cash from (used in) operating activities 435 141 -183 52 103
Net cash from (used in) investing activities -12,571 -1,895 -471 -2,233 -590
Net cash provided by financing activities 12,897 2,119 712 2,232 493
Change in cash flow 761 365 59 51 6
FINANCIAL RATIOS
Operating profit (EBITDA) 33.0% 71.9% 75.2% 62.3% 48.5%
Profit before financial income (EBIT) 30.7% 70.7% 74.6% 61.9% 31.1%
Return on equity (ROE) -7.7% 58.4% 58.4% 10.9% -
Equity ratio 11.7% 18.1% 16.4% 17.1% 14.9%
Current ratio 0.23 0.61 0.39 0.13 0.11
EBITDA interest coverage 0.70 3.68 3.97 1.58 1.59
Interest coverage ratio 0.65 3.62 3.94 1.57 1.02
Debt/Equity ratio 7.33 4.22 4.71 4.82 5.70
Long-term debt/EBITDA 15.46 4.53 6.31 14.37 11.74
Earnings (loss) per share -3.51 14.97 8.23 0.75 -
Funds from Operation/Total Debt 0.3% 0.8% 4.1% 2.8% 1.2%
Free Operating Cash Flow/Total Debt -10.7% -6.6% -5.8% -50.8% -26.0%
Not listed

Credit Research • June 2007 • Page 8 of 25
Icelandair Group – Transport and Storage
www.icelandairgroup.com
27 June 2007
Outstanding bonds
Ticker Coupon Type Indexation MaturityLast traded
Indicative Yield
Indicative Spread Duration
Outstanding Nominal Value (ISKm)
IAIR 08 0131 0.0% Zero Coupon Bond Nominal 31.01.2008 N/A 16.11% 1.80% 0.61 6,240.00
Company Profile
Icelandair Group is a holding company with 12 subsidiaries, focused on the airline and tourism sectors. The companies comprising Icelandair Group are among others: Icelandair, Loftleidir Icelandic, Bluebird Cargo, Icelandair Cargo, Icelandair Technical Services (ITS), Icelandair Ground Services (IGS), IceLease, Icelandair Hotels, Air Iceland and Iceland Travel.
The largest subsidiary Icelandair, the international airline, is responsible for approximately 50% of the group's turnover.
In October 2005, fundamental changes took place in FL Group hf. (Icelandair's largest shareholder at the time) where investments became the main focus. In the process its acquisitions and corporations were divided into groups and Icelandair Group was one of them. Although Icelandair Group has a brief history, as it was only established at the end of 2005, the company has a background of 70 years through its predecessors, the airline companies Loftleidir, Flugfélag Íslands and Flugleiðir. Icelandair Group was listed on the OMX Nordic Exchange Iceland in December 2006 as ICEAIR.
Credit Summary
Icelandair Group has one outstanding bond which was issued 31 January 2007 (IAIR 08 0131). The bond is a zero coupon bond and is non-indexed. The bond will mature 31 January 2008.
Further Information
OMX Nordic Exchange Iceland(www.omxgroup.com)
- IAIR 08 0131
Recent News
On 23 May 2007, Icelandair Cargo and Icelease, subsidiaries of Icelandair Group, signed an agreement with Avion Aircraft Trading on the lease and purchase of four new Airbus A330-200 freighter aircraft.
On 11 May 2007, Icelandair Group signed a letter of intent for acquisition of the Czech airline Travel Service, the largest private airline in Czech Republic. The turnover of Travel Service in 2006 was ISK 18 billion (EUR 190 million).
Debt Maturity
0
2,000
4,000
6,000
8,000
10,000
12,000
14,000
16,000
2007 2008 2009 2010 2011 2012 2013 2014
ISKm
IAIR 08 0131Securit iesLong-term debt
Group Structure
Icelandair Group
Aircraft Trading Airline Operations
Loftleidir
IceLease
Bluebird Cargo
Icelandair
ITS
IGS
Icelandair Cargo
Travel and Tourism
Air Iceland
Icelandair Hotels
Iceland Travel
Financial Calendar
Interim Statements 2Q 2007 – 14 August 2007
Interim Statements 3Q 2007 – 13 November 2007
Interim Statements 4Q 2007 – Week 8 2008

Share price
25
27
29
31
33
35
37
Dec-06 Jan-07 Feb-07 M ar-07 Apr-07 M ay-07 Jun-07
Credit Research • June 2007 • Page 9 of 25
ICEAIROM XI15
Key figures Date: 26.06.2007
Price (ISK): 27.55
Market cap (ISKm): 27,550.00
No. of shares (m): 1,000.00
Reuters: ICEAIR.IC
Bloomberg: ICEAIR IR Equity
INCOME STATEMENT ISK million 1Q 2007 2006 4Q 2006 1Q 2006
Operating revenues 11,905 56,143 12,590 9,595
Operating expenses -11,986 -50,085 -12,252 -9,860
Operating profit (EBITDA) -81 6,058 338 -265
Depreciation and amortisation -752 -2,732 -732 -867
Profit before financial income (EBIT) -833 3,326 -394 -1,132
Net financial income (expenses) -769 -426 -432 406
Share of profit of associates 61 160 69 9
Profit before taxes -1,541 3,060 -757 -717
Taxes 312 -445 207 129
Minority interest 1 -6 -6
Profit for the year (period) -1,228 2,609 -556 -588
BALANCE SHEET
0
ISK million 1Q 2007 2006 4Q 2006 1Q 2006
Non-current assets 54,139 65,196 - -
Current assets 21,534 11,421 - -
Total assets 75,673 76,617 - -
Equity 24,051 26,004 - -
Non-current liabilities 17,031 21,967 - -
Current liabilities 34,591 28,646 - -
Total equity and liabilities 75,673 76,617 - -
CASH FLOW STATEMENT
Net cash from (used in) operating activities 686 6,368 -25 979
Net cash from (used in) investing activities -2,626 -21,040 -17,767 3,372
Net cash provided by financing activities 439 17,320 20,464 -786
Change in cash flow -1,501 2,648 2,672 3,565
FINANCIAL RATIOS
Operating profit (EBITDA) -0.7% 10.8% 2.7% -2.8%
Profit before financial income (EBIT) -7.0% 5.9% -3.1% -11.8%
Equity ratio 31.8% 33.9% - -
Current ratio 0.62 0.40 - -
EBITDA interest coverage -0.12 5.97 0.76 -0.75
Interest coverage ratio -1.21 3.28 -0.88 -3.19
Debt/Equity ratio 2.20 1.90 - -
Long-term debt/EBITDA -210.30 3.60 0.65 -
Earnings (loss) per share -1.23 2.62 -0.54 -0.19
Funds from Operation/Total Debt -4.4% 9.7% -0.4% -
Free Operating Cash Flow/Total Debt -3.4% 4.3% -3.7% -
Icelandair Group was first established at the end of 2005.

Credit Research • June 2007 • Page 10 of 25
Outstanding bonds
Ticker Coupon Type Indexation Maturity Last tradedIndicative Yield
Indicative Spread Duration
Outstanding Nominal Value (ISKm)
NORV 07 0919 0.0% Zero coupon bond Nominal 19.09.2007 N/A 15.33% 0.55% 0.23 1,925.00
NORV 07 1219 0.0% Zero coupon bond Nominal 19.12.2007 N/A 15.15% 0.70% 0.48 1,710.00
Company Profile
Norvik Banka was established in 1992 and operates in the Latvian and international financial markets. In December 2006 the Bank obtained a new name, Norvik Banka (the previous name was Lateko Banka). It has approximately 90 offices around Latvia and its head office is in Riga. Norvik Banka also has Information Centres in Moscow and London. At year-end 2006, the bank had around 635 employees and around 80,000 clients, mostly local private individuals.
Norvik Banka's target is to be among the first five major banks of Latvia, providing universal and qualitative banking services to individuals and corporate clients at affordable rates.
About 51% of the bank's equity is held by the Icelandic company Straumborg ehf. Norvik Banka has been in cooperation with Fitch Ratings since 2001 and started cooperation with Moody's Investor Service in February 2007.
Credit Summary
Norvik Banka has two outstanding discounted bills of exchange denominated in ISK. They are both non-indexed zero coupon bonds and were issued 19.03.2007. The first one is with maturity of 6 months (19.09.2007) and the second one is with maturity of 9 months (19.12.2007).
Recent News
In April 2007, Norvik Banka became a member of the Baltic Stock Exchange, which includes Riga, Tallin and Vilnius Stock Exchange.
On 26 January 2007, Norvik Banka received a loan in the amount of EUR 50 million.
In December 2006, Norvik Banka increased its capital to LVL 22,499,928.
In December 2006, Norvik Banka changed its name from Lateko Banka to its current name.
In October 2006, Fitch Ratings upgraded the bank's outlook to positive from stable and stressed that the IDR (B+) will possibly be improved.
In 2005 and 2006 the international financial magazines, The Banker and Global Finance, named Lateko Banka the best bank in Latvia.
Liabilities and Capital Structure at 31 December 2006
Deposits 67%
Other Liabilities
2%
Total Capital 10%
Due to credit
institutions 21%
Shareholders' Structure
Further Information
OMX Nordic Exchange Iceland (www.omxgroup.com)
- NORV 07 0919
- NORV 07 1219
Norvik Banka
Straumborg ehf. 51.06%
Ice-Balt Invest ehf. 9.00%
Other 0.44%
Jurijs Šapurovs 19.75%
Andrejs Svirčenkovs 19.75%
Norvik Banka – Bank
www.norvik.lv
27 June 2007

Credit Research • June 2007 • Page 11 of 25
Key figures Date: 26.06.2007
Price (ISK): -
Market cap (ISKm): -
No. of shares (m): -
Reuters: -
Bloomberg: -
INCOME STATEMENT LVL'000 2006 2005 2004 2003 2002
Operating income 17,562 17,976 16,090 10,994 8,899
Total expenses -13,570 -11,306 -10,254 -8,135 -5,551
Profit before taxes 3,992 6,670 5,836 2,859 3,348
Taxes -584 -718 -793 -540 -617
Profit for the year (period) 3,408 5,952 5,043 2,319 2,731
BALANCE SHEET LVL'000 2006 2005 2004 2003 2002
Assets
Cash and balances with the central bank 28,094 20,380 15,053 7,556 13,695
Balances due from credit institutions 30,695 94,179 173,159 177,053 121,403
Financial assets at fair value through profit or loss 42,313 24,443 21,269 15,542 6,951
Loans to customers and receivables 189,087 110,725 75,268 40,948 37,214
Available-for-sale financial assets 5,681 7,783 19,715 18,418 -
Other assets 8,917 7,452 9,583 7,944 5,941
Total assets 304,787 264,962 314,047 267,461 185,204
Equity
Share capital 22,500 15,500 12,250 9,931 7,200
Capital reserve 7 7 7 7 7
Revaluation reserve of available-for-sale financial assets -48 -261 -27 - -
Retained earnings 5,979 27 187 - -
Profit for the year 3,408 5,952 5,043 2,319 2,731
Total equity 31,846 21,225 17,460 12,257 9,938
Liabilities
Balances due to credit institutions 65,465 59,514 64,915 26,649 823
Customer deposits 202,308 180,288 225,868 223,455 171,801
Financial liabilities at fair value through profit or loss 1,288 261 192 151 434
Subordinated debt 1,777 2,030 2,026 750 -
Other liabilities 2,103 1,644 3,586 4,199 2,208
Total liabilities 272,941 243,737 296,587 255,204 175,266
Total equity and liabilities 304,787 264,962 314,047 267,461 185,204
FINANCIAL RATIOS
Return on equity (ROE) 12.8% 30.8% 33.9% 20.9% -
Equity ratio 10.4% 8.0% 5.6% 4.6% 5.4%
Debt/equity ratio 8.6 11.5 17.0 20.8 17.6
NII/Total Assets 3.5% 3.4% 1.8% 1.1% 1.5%
Cost income ratio 77.3% 62.9% 63.7% 74.0% 62.4%
Deposits/Total Assets 66.4% 68.0% 71.9% 83.5% 92.8%
CAD 13.2% 14.2% 13.5% 12.0% 13.3%
Earnings (loss) per share 0.2 0.4 0.4 0.3 0.4
26.06.2007: EURLVL 0.696
Not listed

Credit Research • June 2007 • Page 12 of 25
Eyrir Invest – Investment Company www.eyririnvest.com
27 June 2007
Outstanding bonds
Ticker Coupon Type Indexation Maturity Last tradedIndicative Yield
Indicative Spread Duration
Outstanding Nominal Value (ISKm)
EYRI 05 1 5.5% Annual coupon Indexed 02.05.2012 23.05.2007 8.68% 2.57% 4.31 2,600.00
Company Profile
Eyrir Invest is an international investment company and was founded in July 2000. Since then the company's results have exceeded all financial targets. Its main emphasis is on investments in listed companies in Europe, especially in Scandinavia and the Baltic countries.
Eyrir Invest's mission is to increase shareholders' value by active ownership and trading of equities and other securities. Eyrir Invest places great emphasis on participating in operations and strategic planning of the business it invests in. It invests mainly in industrial companies, banks and financial institutions and tries to invest in few companies at any given time.
About 60% of Eyrir Invest's holdings are shares in two listed companies in Iceland: Marel (developer of food-processing systems) and Össur (producer of prosthetics and orthotics).
Credit Summary
Eyrir Invest has issued one bond, EYRI 05 1. The bond was issued 9 May 2005 and will mature 2 May 2012. The bond bears 5.5% annual interest, paid annually.
Further Information
OMX Nordic Exchange Iceland(www.omxgroup.com)
- EYRI 05 1
Recent News
On 3 November 2006, Eyrir Invest's equity was increased by 10%. At year-end 2006, stockholders' equity amounted to nearly ISK 12 billion compared to ISK 9.6 billion at year-end 2005.
Debt Maturity
0
1,000
2,000
3,000
4,000
5,000
6,000
2007 2008 2009 2010 2011 2012*
ISKm
EYRI 05 1 Interest-bearing debt
*Borrowings in 2012 will mature that year and later.
Group Structure
Eyrir Invest
Marel (30%) Össur (24%) Stork NV, Holland (14%)
Nordic companies (32%)
Breakdown of Investments by Stock Exchanges
Oslo3% Amsterdam
14%
OM X Helsinki4%
OM X Stockholm
21%
OM X Iceland58%

Credit Research • June 2007 • Page 13 of 25
Key figures Date: 26.06.2007
Price (ISK): -
Market cap: -
No. of shares: -
Not listed Reuters: -
Bloomberg: -
INCOME STATEMENT EUR thousand 2006 2005 2004
Investment income 24,079 65,029 30,221
Total expenses -1,348 -924 -430
Profit before taxes 22,731 64,105 29,791
Taxes -3,759 -11,401 -5,103
Minority interest 0 0
Profit for the year (period) 18,972 52,704 24,688
BALANCE SHEET
0
EUR thousand 2006 2005 2004
Assets
Securities
Shares in other companies 255,915 207,902 89,274
Derivatives 3,575 146 496
Mutual funds 0 1,629 10,309
Bonds 13,439 353 304
Receivables 331 1,151 825
Other assets 4,356 24,681 1,718
Total assets 277,616 235,862 102,926
Equity
Capital stock 6,726 6,178 108
Contributed capital in excess of par 48,154 35,842 3,654
Retained earnings 92,399 78,109 28,150
Translation difference -20,639 8,972 1,024
Total equity 126,640 129,101 32,936
Liabilities
Interest-bearing borrowings 131,338 87,618 63,720
Taxes for the year 0 98 400
Deferred income tax liability 17,758 18,182 5,685
Other liabilities 1,880 863 185
Total liabilities 150,976 106,761 69,990
Total equity and liabilities 277,616 235,862 102,926
CASH FLOW STATEMENT
Net cash from (used in) operating activities -15,585 908 3,434
Net cash from (used in) investing activities -76,034 -32,229 -43,457
Net cash provided by financing activities 75,428 51,169 41,227
Change in cash flow -16,191 19,848 1,204
FINANCIAL RATIOS
Return on equity (ROE) 14.8% 65.1% -
Equity ratio 45.6% 54.7% 32.0%
Debt/Equity ratio 1.19 0.83 2.13
Interest bearing debt/Total assets 47.3% 37.1% 61.9%

Credit Research • June 2007 • Page 14 of 25
Outstanding bonds
Ticker Coupon Type Indexation Maturity Last tradedIndicative Yield
Indicative Spread Duration
Outstanding Nominal Value (ISKm)
EXIS 07 1008 0.0% Zero coupon bond Nominal 08.10.2007 N/A 15.17% 1.00% 0.29 16,000.00
EXIS 07 1029 0.0% Zero coupon bond Nominal 29.10.2007 N/A 15.60% 1.00% 0.34 5,000.00
EXIS 08 0317 0.0% Zero coupon bond Nominal 17.03.2008 N/A 15.27% 1.20% 0.75 16,000.00
Exista 07 2 3mR+1,5% Quarterly coupon Nominal 29.05.2009 N/A N/A 1.50% N/A 10,000.00
EXISTA 04 1 5.9% Annual coupon Indexed 14.10.2011 06.03.2007 8.70% 2.00% 3.72 13,000.00
Company Profile
Exista is a financial services company with operations in the areas of insurance, asset financing and investment activities. Exista was listed on OMX Nordic Exchange Iceland (previously named The Iceland Stock Exchange) 15 September 2006.
Exista is a major shareholder in several of Iceland's largest companies, i.e. Kaupthing Bank, Bakkavör Group and Iceland Telecom.
Exista's mission is to maximize shareholders' long-term value through a diversified group of profitable businesses, and through centralised risk management, finance and communications, the group aims at building up a leading financial services company, concentrating on northern Europe as its core market.
Credit Summary
Exista has two listed outstanding bonds. The first bond (EXIS 07 1008) was issued 9 October 2006 and is a zero coupon bond. It is a non-indexed bond and will mature 8 October 2007.
The second bond (EXISTA 04 1) was issued 14 October 2004 and is linked to the Consumer Price Index. The bond bears 5.9% interest rate, paid annually and is a periodic interest payment bond. It will mature 14 October 2011.
Exista has also three unlisted bonds. The first one (EXIS 07 1029) is a zero coupon bond and will mature 29 October 2007. The second one (EXIS 08 0317) is also a zero coupon bond and will mature 17 March 2008. The third one (EXISTA 07 2) bears a liquid interest rate of 3M REIBOR + 1.5% and it will mature 29 May 2009.
Further Information
OMX Nordic Exchange Iceland (www.omxgroup.com)
- EXIS 07 1008
- EXISTA 04 1
Company Profile
Q2 interim statement - published 26 July 2007
Q3 interim statement – published 25 October 2007
Q4 interim statement – published 31 January 2008
Debt Maturity
0
15,000
30,000
45,000
60,000
75,000
90,000
105,000
120,000
135,000
150,000
2007 2008 2009 2010 2011*
ISKm
EXIS 07 1008
EXISTA 04 1
Long-term debt
*Borrowings in 2011 will mature that year or later.
Group Structure
Recent News
On 11 June 2007, Exista along with Chris Ronnie acquired a 29% stake in JJB Sports at a price of 275 pence per share, valuing the total investment at approximately GBP 190 million. JJB Sports is a UK general retailer of branded sports goods and related products.
Exista
Operating Businesses Investment Businesses
VÍS (100%)
Lýsing (100%)
Lífís (100%)
Kaupthing Bank (23%)
Iceland Telecom (44%)
Flaga (22%)
Bakkavör (40%)
Sampo Group (15,5%)
Öryggismiðstöðin (55%)
Exista – Financial Service Company www.exista.com
27 June 2007

Credit Research • June 2007 • Page 15 of 25
Share price
18
20
22
24
26
28
30
32
34
36
Sep-06 Oct-06 Dec-06 Jan-07 Feb-07 Apr-07 May-07 Jun-07
EXISTA
OMXI15
Key figures Date: 26.06.2007
Price (ISK): 33.90
Market cap (ISKm): 385,141.03
No. of shares (m): 11,361.09
Reuters: EXISTA.IC
Bloomberg: EXISTA IR Equity
INCOME STATEMENT EUR million Q1 2007 2006 2005 2004 Q1 2006
Investment income 668 700 650 227 168
Total expenses -70 -259 -61 -18 -58
Profit before taxes 597 441 589 209 110
Taxes 43 -10 56 -36 -3
Minority interest 0 0 0 0 0
Profit for the year (period) 641 431 645 173 107
BALANCE SHEET EUR million Q1 2007 2006 2005 2004 Q1 2006
Assets
Financial assests measured at fair value 850 2,273 1,906 705 -
Financial assets held for trading and sale 478 837 97 7 -
Loans and accounts receivable 773 704 0 0 -
Goodwill 465 465 0 0 -
Investments in associates 4,057 0 0 0 -
Property, plant and equipment 13 16 1 0 -
Reinsurance assets 16 12 0 0 -
Cash and equivalents 88 76 64 14 -
Other assets 22 13 6 1 -
Total assets 6,762 4,395 2,074 728 -
Equity
Share capital 121 112 111 69 -
Statutory reserves 23 23 28 17 -
Capital reserves 893 698 222 0 -
Translation reserves 24 0 -2 -7 -
Retained earnings 1,578 1,061 872 223 -
Minority interest 5 6 0 0 -
Total equity 2,643 1,900 1,232 303 -
Liabilities
Borrowings 3,668 2,183 840 361 -
Technical Provisions 279 224 0 0 -
Deferred tax liability 21 60 0 51 -
Other liabilities 151 28 2 13 -
Total liabilities 4,119 2,495 842 425 -
Total equity and liabilities 6,762 4,395 2,074 728 -
FINANCIAL RATIOS
Return on equity (ROE) 28.2% 27.6% 84.1% 79.0% 10%
Equity ratio 39.1% 43.2% 59.4% 41.6% 56.4%
Debt/Equity ratio 156.1% 131.7% 68.3% 140.4% -
Interest bearing debt/Total assets 54.2% 49.7% 40.5% 49.6% -
Earnings (loss) per share 0.06 0.04 0.11 0.03 0.01

Credit Research • June 2007 • Page 16 of 25
Atorka Group – Investment Company www.atorka.is/en
27 June 2007
Outstanding bonds
Ticker Coupon Type Indexation Maturity Last tradedIndicative Yield
Indicative Spread Duration
Outstanding Nominal Value (ISKm)
ATOR 07 1115 0.0% Zero coupon bond Nominal 15.11.2007 N/A 16.08% 1.50% 0.40 5,520.00JRDB 03 1 5.8% Semiannual coupon Indexed 30.10.2008 08.06.2008 N/A N/A N/A 500.00
ATOR 07 2 3mR+1.95% Quarterly coupon Nominal 16.01.2009 N/A N/A 1.95% N/A 2,500.00
ATOR 06 1 3mR+1.8% Quarterly coupon Nominal 26.04.2009 N/A N/A 1.80% N/A 2,000.00JRDB 04 1 5.6% Semiannual coupon Indexed 17.08.2010 06.03.2007 8.95% 2.20% N/A 1,000.00
ATOR 04 1 5.2% Annual coupon Indexed 15.10.2010 08.06.2007 8.34% 2.20% 2.99 5,000.00
ATOR 05 1 5.0% Annual coupon Indexed 15.03.2012 30.05.2007 8.51% 2.40% 4.22 3,000.00
JRDB 05 1 4.9% Semiannual coupon Indexed 01.04.2012 30.05.2007 8.52% 2.40% 4.20 2,000.00
Company Profile
Atorka Group is an international investment company. Atorka's main focus is to invest in progressive and well-managed companies that operate in growing markets. Atorka's aim is to take such companies to recognizable world leadership and support their growth. Atorka is listed on the OMX Nordic Exchange Iceland and is included in the OMXI15 index. Atorka's shareholders are around 5,000.
Credit Summary
Atorka has eight outstanding bonds. Three of them were issued by Jarðboranir, which Atorka acquired 27 November 2006. The first bond ATOR 07 1115 is a zero coupon bond and will mature 15 November 2007. The bond JRDB 03 1 was issued 30 October 2003 and bears 5.8% interest rate. The bond ATOR 07 2 was issued 16 May 2007 and bears a liquid interest rate of 3M REIBOR + 1.95%. The bond ATOR 06 1 bears a liquid interest rate of 3M REIBOR + 1.8%, which is paid quarterly. It is a non-indexed bond and will mature 26 April 2009.
The next two bonds, JRDB 04 1 and ATOR 04 1, will both mature in 2010. The bond ATOR 05 1 was issued 15 March 2005 and bears 5.0% interest rate, paid annually. The bond JRDB 05 1 was issued 1 April 2005 and bears 4.9% annual interest rate.
Recent News
On 11 June 2007, Promens announced that its subsidiary, Polimoon, acquired the business of Dekoplast in France. Dekoplast is a company producing packaging for cosmetics and medical use.
On 2 May 2007, Jardboranir signed a contract with the German company Herrenknecht Vertical GmbH concerning the purchase of and purchase rights to the large high-tech drills that are specially designed to obtain geothermal heat from great depths.
Financial Calendar
Q2 interim account – Week 34 2007
Q3 interim account – Week 47 2007
Q4 and annual statement – Week 8 2008
Debt Maturity
0
2,000
4,000
6,000
8,000
10,000
12,000
14,000
16,000
2007 2008 2009 2010 2011* 2012
ISKm
ATOR 07 1115ATOR 06 1JRDB 05 1ATOR 05 1ATOR 04 1JRDB 04 1JRDB 03 1Borrowings
*Borrowings in 2011 will mature that year and later.
Group Structure
Atorka Group
Private Equity Strategic Investments
Jarðboranir (100%)
Promens (63%)
Parlogis (100%)
Interbulk (40%)
Amiad Filtration (19%)
NWF Group PLC (20%)
Pioneer (100%)
A. Karlsson (100%)
Clyde Process Solutions (30%)
Further Information
OMX Nordic Exchange Iceland (www.omxgroup.com)
- ATOR 07 1115
- JRDB 03 1
- JRDB 04 1
- ATOR 04 1
- ATOR 07 2 - ATOR 05 1
- ATOR 06 1 - JRDB 05 1 .

Share price
0
2
4
6
8
10
12
14
16
18
Jan-01 Dec-01 Nov-02 Oct-03 Sep-04 Aug-05 Jul-06 Jun-07
Credit Research • June 2007 • Page 17 of 25
ATOR
OM XI15
Key figures Date: 26.06.2007
Price (ISK): 8.10
Market cap (ISKm): 27,326.57
No. of shares (m): 3,373.65
Reuters: ATOR.IC
Bloomberg: ATOR IR Equity
INCOME STATEMENT ISK million Q1 2007 2006 2005 2004 Q1 2006
Financial income 1,054 1,795 2,724 3,838 1,630
Financial expenses -1,579 -3,718 -1,345 -251 -686
Net financial income -525 -1,923 1,379 3,587 945
Total operating income 20,151 31,572 17,029 0 4,315
Total operating expenses -19,205 -31,073 -17,467 -211 -4,285
Net profit (loss) of disposal group held for sale 8 250 -19 0 -28
Impairment of goodwill 0 -138 302 -140 0
Profit before taxes 429 -1,313 1,223 3,236 947
Taxes 29 827 266 -344 -181
Minority interest -75 29 -4 0 0
Profit for the year (period) 384 -457 1,485 2,892 765
BALANCE SHEET ISK million Q1 2007 2006 2005 2004 Q1 2006
Non-current assets 47,237 54,000 9,887 5,498 -
Current assets 46,226 45,290 21,690 16,448 -
Assets in disposal group classified as held for sale 7,024 0 1,961 0 -
Total assets 100,487 99,290 33,538 21,946 -
Equity 10,318 12,272 9,940 8,972 -
Non-current liabilities 52,626 55,910 15,272 11,130 -
Current liabilities 34,505 31,108 6,687 1,844 -
Liabilities in disposal group classified as held for sale 3,039 0 1,639 0 -
Total equity and liabilities 100,487 99,290 33,538 21,946 -
CASH FLOW STATEMENT
Net cash from (used in) operating activities 1,845 365 350 665 -874
Net cash from (used in) investing activities -6,472 -17,854 -7,729 -3,017 334
Net cash provided by financing activities 2,576 27,605 5,787 3,551 1,760
Change in cash flow -2,051 10,117 -1,592 1,198 1,221
FINANCIAL RATIOS
Return on equity (ROE) - -4.1% 15.7% 44.3% -
Equity ratio 10.3% 12.4% 29.6% 40.9% -
Current ratio 1.34 1.46 3.24 8.92 -
Debt/Equity ratio 8.44 7.09 2.21 1.45 -
Earnings (loss) per share 0.12 -0.16 0.54 1.16 0.26

Credit Research • June 2007 • Page 18 of 25
Bakkavör Group – Food Manufacturer
www.bakkavor.com
27 June 2007
Outstanding bonds
Ticker Coupon Type Indexation Maturity Last tradedIndicative Yield
Indicative Spread Duration
Outstanding Nominal Value (ISKm)
BAKK 03 1 6.7% Coupon at maturity Indexed 15.05.2009 23.03.2007 9.10% 1.80% 1.88 11,500.00
BAKK 05 1 5.4% Coupon at maturity Indexed 01.12.2010 21.06.2007 8.20% 2.06% 3.43 9,245.00
Company Profile
Bakkavör Group is an international food manufacturing company specialising in fresh prepared foods and produce. The corporation operates 46 factories and employs over 16,000 people in seven countries. Bakkavör manufactures over 4,700 products in 17 product categories. Its turnover was £1.2 billion in 2006. The Group's Head Office is in Reykjavik, Iceland.
Bakkavör Group was founded in 1986. During this time, the business has grown significantly and today Bakkavör Group is the largest provider of fresh prepared foods and produce in the UK.
In addition to the UK and Iceland, the Group also has business operations in France, Belgium, Spain, South Africa and China and is well-positioned for further expansion.
In total, the Group makes over 4,700 products in 17 product categories, which are developed and sold predominantly under its customers' own brands. Bakkavör Group has attained leading market positions in its key market areas of ready meals, pizzas, convenience salads and leafy salads.
Credit Summary
Bakkavör Group has two outstanding bonds, both are linked to the Consumer Price Index (CPI). The former bond (BAKK 03 1) was issued 15 May 2003 and will mature 15 May 2009. The bond bears 6.7% annual interest rate, which will be paid on the maturity date.
The second bond (BAKK 05 1) was issued 1 June 2005 and will mature 1 December 2010. The bond bears 5.4% annual interest rate, which will be paid at maturity.
Further Information
Kaupthing Research
Landsbanki Research
Glitnir Research
OMX Nordic Exchange Iceland (www.omxgroup.com)
- BAKK 03 1
- BAKK 05 1
Debt Maturity
0
10,000
20,000
30,000
40,000
50,000
60,000
2007 2008 2009 2010 2011
ISKm
BAKK 05 1BAKK 03 1Borrowings
Sales by geographical market in Q1 2007
United Kingdom
93%
Continental Europe
7%
Financial Calendar
Q2 interim account – published 26 July 2007
Q3 interim account – published 25 October 2007
Q4 and annual results – published 31 January 2008
Recent News
On 2 May 2007, Bakkavör Group announced it had acquired 100% of the share capital of 4G, a French prepared salads provider. The Group's aim is to integrate the business into its existing fresh prepared salads business in France. The consideration price, which is confidential, was financed through and paid by the Group's own cash resources.

Share price
0
10
20
30
40
50
60
70
80
M ay-00 Oct-01 M ar-03 Aug-04 Jan-06 Jun-07
BAKKOM XI15
Key figures Date: 26.06.2007
Price (ISK): 69.70
Market cap (ISKm): 150,404.81
No. of shares (m): 2,157.89
Reuters: BAKK.IC
Bloomberg: BAKK IR Equity
INCOME STATEMENT GBP million 2008E 2007E 1Q 2007 2006 2005 2004 2003 2002
Operating revenues 1,488 1,378 349 1,219 722 153 138 134
Operating expenses -1,295 -1,206 -324 -1,105 -656 -129 -120 -114
Operating profit (EBITDA) 193 172 35 148 86 28 22 23
Depreciation -42 -42 -10 -34 -19 -4 -4 -3
Profit before financial income (EBIT) 151 130 25 114 67 24 18 19
Net financial income (expenses) -39 -41 -12 -47 -28 -7 -4 -4
Profit before taxes 112 89 13 67 38 17 14 1
Taxes -30.3 -23 -3 -15 -6 -4 -4 -4
Discont. operation, net of tax 0 0 0 17 0 0 3 0
Profit for the year (period) 82 66 10 68 32 13 14 11
BALANCE SHEET
5
GBP million 2008E 2007E 1Q 2007 2006 2005 2004 2003 2002
Non-current assets 955 977 1,031 1,029 840 217 130 137
Current assets 639 544 297 297 294 55 85 36
Total assets 1,594 1,521 1,328 1,326 1,135 272 215 173
Equity 344 270 247 241 127 88 72 59
Non-current liabilities 666 706 723 716 704 165 112 79
Current liabilities 584 545 358 369 303 19 31 35
Total equity and liabilities 1,594 1,521 1,328 1,326 1,135 272 215 173
CASH FLOW STATEMENT
Net cash from (used in) operating activities - - 28 132 82 16 20 14
Net cash from (used in) investing activities - - -19 -167 -446 -88 7 -16
Net cash provided by financing activities - - -4 -6 422 38 30 -5
Change in cash flow - - 5 -42 58 -33 57
FINANCIAL RATIOS
-7
Operating profit (EBITDA) 13.0% 12.5% 10.0% 12.1% 11.9% 18.4% 16.3% 17.1%
Profit before financial income (EBIT) 10.2% 9.4% 7.3% 9.3% 9.2% 15.8% 13.3% 14.5%
Return on equity (ROE) 26.6% 25.7% - 37.0% 30.0% 16.3% 20.6% 20.6%
Equity ratio 21.6% 17.8% 18.6% 18.2% 11.2% 32.4% 33.6% 34.1%
Current ratio 1.09 1.00 0.83 0.81 0.97 2.84 2.77 1.02
EBITDA interest coverage 4.95 4.17 1.94 2.29 2.77 3.01 3.61 4.23
Interest coverage ratio 3.87 3.16 1.24 1.61 2.16 2.58 2.98 3.68
Debt/Equity ratio 3.23 4.09 4.41 4.52 7.92 2.09 1.98 1.95
Long-term debt /EBITDA 3.45 4.10 28.92 6.28 8.19 5.89 4.87 3.43
Earnings (loss) per share 3.80 3.00 0.45 3.40 2.00 0.81 0.89 0.75
Funds from Operation/Total Debt 15.4% 20.5% 3.5% 15.2% 10.3% 12.3% 11.1% 13.4%
Free Operating Cash Flow/Total Debt 10.1% 15.5% 1.6% 8.6% 6.5% 7.0% 19.5% -2.0%
Credit Research • June 2007 • Page 19 of 25

Credit Research • June 2007 • Page 20 of 25
Outstanding bonds
Ticker Coupon Type Indexation MaturityLast traded
Indicative Yield
Indicative Spread Duration
Outstanding Nominal Value (ISKm)
FL 07 112 0.0% Zero coupon bond Nominal 29.10.2007 N/A 16.36% 1.70% 0.34 5,000.00
FL 08 0516 0.0% Zero coupon bond Nominal 16.05.2008 N/A 15.80% 1.90% 0.90 5,000.00
FL 05 1 5.0% Annual coupon Indexed 01.03.2012 21.06.2007 8.90% 2.75% 4.18 10,000.00
Company Profile
FL Group is an international investment company and focuses its activities primarily on two functions, private equity and capital markets. The company's geographic focus lies within Northern Europe but special emphasis has been put on the Nordic countries and the UK.
FL Group has holdings in companies in various sectors in Iceland, the UK, the Netherlands and the Nordic countries. The majority of its investments are in listed companies in the banking and financial services. Other investments are in beverages, airlines and retail. Its main listed holdings are Glitnir, Commerzbank, AMR Corp., Finnair, Royal Unibrew and Aktiv Kapital. Its unlisted holdings are e.g. Refresco, Northern Travel Holding and Geysir Green Energy among other things.
FL Group has four main divisions, i.e. Private Equity, Capital Markets, Finance and Operation Management. The Private Equity team deals with the company's investments in its operating companies, transformation projects and investments where a significant or controlling share in a company is held.
Capital Markets unit oversees the company's short term trading in listed securities and currencies as well as overseeing the company's derivative and security trading related to the company's asset portfolio.
Finance & Administration is a support function for the company and the Operation Management team helps the company to participate actively in the operations of the companies invested in. FL Group has set up offices both in Denmark and the UK.
Credit Summary
FL Group has one listed outstanding bond (FL 05 1). It was issued 1 March 2005. The bond is an index-linked interest bearing bond. It bears 5% interest rate, paid annually. The bond will mature 1 March 2012.
FL Group also has two unlisted bonds. They are both non-indexed zero coupon bonds. The first one (FL 07 112) will mature 29 October 2007 and the second one (FL 08 0516) matures 16 May 2008.
Further Information
Kaupthing Research
Landsbanki Research
Glitnir Research
OMX Nordic Exchange Iceland (www.omxgroup.com)
- FL 05 1
Debt Maturity
0
10,000
20,000
30,000
40,000
50,000
60,000
2007 2008 2009 2010 2011 2012*
ISKm
FL 05 1
Long-term debt
*Borrowings in 2012 will mature that year and later.
Organisational Structure
Financial Calendar
Q2 interim account – published 30 July to 3 August 2007
Q3 interim account – published 29 Oct. – 2 Nov. 2007
Q4 interim account – published 27 Jan. – 2 Feb. 2008
Recent News
On 8 June 2007, there were changes to the Board of Directors of FL Group. Skarphedinn Berg Steinarsson decided to step down as a chairman and Jon Asgeir Johannesson was elected as a chairman of the board.
On 30 May, 2007 FL Group sold all its shares in Bang & Olufsen A/S. The proceeds from the sale amounted to approximately ISK 10.2 billion (EUR 121 million).
On 22 May 2007, FL Group announced it had invested USD 50 million in four active US-based real estate development projects along with Bayrock Group, a US-based international real estate investment and development firm.
FL Group
Private Equity
Operation Management Finance & Administration
Asset Management
FL Group – Investment Company www.flgroup.is
27 June 2007

Credit Research • June 2007 • Page 21 of 25
Share price
0
5
10
15
20
25
30
35
Oct-96 Jun-99 Feb-02 Oct-04 Jun-07
FL
OMXI15
Key figures Date: 26.06.2007
Price (ISK): 29.40
Market cap (ISKm): 233,582.59
No. of shares (m): 7,944.99
Reuters: FL.IC
Bloomberg: FL IR Equity
INCOME STATEMENT ISK million Q1 2007 2006 2005 Q1 2006
Investment income 15,580 17,491 20,349 10,458
Total operating expenses -884 -2,771 -1,652 -485
Profit before taxes 14,696 14,720 18,697 9,973
Taxes 388 2,631 -3,292 -1,684
Profit from continuing operations 15,084 17,351 15,405 8,289
Profit from discontinued operations 0 27,208 1,846 -2,450
Minority interest 0 1 -2 2
Profit for the year (period) 15,084 44,560 17,249 5,841
BALANCE SHEET ISK million Q1 2007 2006 2005 Q1 2006
Assets
Cash, cash equivalents 30,994 47,022 10,350 -
Securities 217,602 181,161 69,138 -
Derivatives 20,833 4,309 6,341 -
Restricted cash 12,575 9,572 0
Assets classified as held for sale 0 904 0
Inventories 0 0 876 -
Loans, trade and other receivables 20,290 19,478 7,222 -
Operating assets 464 425 35,221 -
Intangible assets 0 0 3,470 -
Total assets 302,758 262,871 132,618 -
Equity
Share capital 7,763 7,763 5,802 -
Share premium 70,020 70,530 43,169 -
Reserves 493 948 434 -
Retained earnings 63,526 63,425 25,027 -
Minority interest 0 10 11 -
Total equity 141,802 142,676 74,443 -
Liabilities
Borrowings 129,423 104,955 39,668 -
Derivatives 11,147 7,021 277 -
Unpaid dividend 14,983 0 0
Deferred income tax liability 510 895 4,694 -
Current tax liability 782 782 0 -
Trade and other payables 4,111 5,908 10,895 -
Deferred income 0 0 2,641
Liabilities classified as held for sale 0 634 0 -
Total liabilities 160,956 120,195 58,175 -
Total equity and liabilities 302,758 262,871 132,618 -
FINANCIAL RATIOS
Return on equity (ROE) 10.6% 41.1% 55.2% -
Equity ratio 46.8% 54.3% 56.1% -
Debt/Equity ratio 113.5% 84.2% 78.2% -
Interest bearing debt/Total assets 42.7% 39.9% 29.9% -
Earnings (loss) per share 1.94 6.65 5.90 0.96

Credit Research • June 2007 • Page 22 of 25
Outstanding bonds
Ticker Coupon Type Indexation Maturity Last tradedIndicative Yield
Indicative Spread Duration
Outstanding Nominal Value (ISKm)
STOD 08 0125 0.0% Zero coupon Nominal 25.01.2008 N/A 15.94% 1.60% 0.59 1,050.00
STOD 03 1 7.4% Annual coupon Indexed 05.02.2011 08.06.2007 8.40% 2.10% 3.20 10,000.00
STOD 06 2 3mR+1.9% Coupon at maturity Nominal 21.08.2011 N/A N/A 1.90% N/A 3,000.00
STOD 06 1 6.0% Annual coupon Indexed 28.03.2013 08.06.2007 8.10% 2.24% 4.92 4,940.00
Company Profile
On 3 May 1999 Stoðir Real Estate Inc. was founded and in May 2002 it merged with Þyrping hf., a property company. Þyrping was the larger party in the merger and had been operating since 1991. The merger created the largest real-estate business in Iceland.
Stoðir has through the years focused on acquiring real estate which is leased to public authorities, as it views them as reliable tenants.
At the end of 2005, Stoðir Real Estate acquired the Danish real estate company Atlas Ejendomme A/S. This acquisition strengthened the company as Atlas Ejendomme owns more than 150 thousand square metres of property, mainly in the centre of Copenhagen, and as the Danish state is the largest tenant. This purchase is the largest property deal in Denmark in recent years.
Stoðir will continue to look for further offshore expansion, both because there are many opportunities for acquisitions in foreign real estate markets and because a lack of opportunities in Iceland limits the further expansion of Stoðir in the domestic real estate market.
The company's properties comprise commercial, office, hotel and storage premises, amounting to over 500,000 m2. Leaseholders number over 500. Among the largest leaseholders are e.g. Hagar plc, Icelandair Hotels, the Danish State and the Icelandic Treasury property department. Occupancy of properties is more than 98%.
Credit Summary
Stoðir has issued four bonds since its foundation. The first bond (STOD 08 0125) is a zero coupon bill and was issued 26 January 2007. The bond will mature 25 January 2008.
The second bond (STOD 03 1) is an index-linked interest-paying bond, issued 5 February 2003. The bond bears 7.4% annual interest payable on 5 February, for the first time in 2004 and finally in 2011.
The third bond (STOD 06 2) is a non-indexed bond. It was issued 21 August 2006 and will mature 21 August 2011. The bond bears liquid interest rate of 3M REIBOR+1.9%, which will be paid at maturity.
The fourth bond (STOD 06 1) was issued 28 March 2006 and is an index-linked bond. The bond bears 6% interest rate paid annually. The bond will mature 28 March 2013.
Debt Maturity
0
6,000
12,000
18,000
24,000
30,000
36,000
42,000
48,000
54,000
60,000
66,000
72,000
78,000
84,000
2007 2008 2009 2010 2011 2012 2013*
ISKm
STOD 06 2
STOD 08 0125
STOD 06 1
STOD 03 1
Long-term debt
*Borrowings in 2013 will mature that year and later
Financial Calendar
H1 interim account – published 27 – 31 August 2007
Further Information
OMX Nordic Exchange Iceland (www.omxgroup.com)
- STOD 03 1
- STOD 06 2
- STOD 06 1
Recent News
In the end of February, Stoðir Real Estate Inc. purchased all shares in FS6 ehf. The purchase includes the real estate Kringlan 1, 5 and 7 as well as building sites related to them.
On 27 February, Stoðir Real Estate announced its purchase of all shares in Landsafl hf. which is one of the largest real estate in Iceland. It specialises in real estate ownership, operations and leases. The company is in charge of over 100,000 square meters.
Stoðir – Real estate, renting and business activities www.stodir.is
27 June 2007

Credit Research • June 2007 • Page 23 of 25
Key figures Date: 26.06.2007
Price (ISK): -
Market cap: -
No. of shares: -
Reuters: -
Bloomberg: -
INCOME STATEMENT ISK million 2006 2005 2004 2003 2002
Operating revenues 6,191 4,140 5,028 2,305 2,122
Operating expenses -1,864 -1,981 -2,838 -472 -535
Operating profit (EBITDA) 4,345 2,167 2,190 1,833 1,587
Depreciation -18 -8 0 0 -554
Profit before financial income (EBIT) 4,327 2,159 2,190 1,833 1,033
Net financial income (expenses) -7,155 -1,577 -1,485 -1,771 -223
Value adjustment of investment properties 16,212 1,133 1,767 0 0
Gain on the sale of investment properties 488 213 398 12 0
Share of profit (loss) in associates -174 318 632 -7 -4
Profit before taxes 13,698 2,246 3,502 67 806
Taxes -2,303 -161 -651 -12 -43
Minority interest 0 -220 -146 0 0
Profit for the year (period) 11,395 1,865 2,705 55 763
BALANCE SHEET ISK million 2006 2005 2004 2003 2002
Non-current assets 151,800 58,921 39,982 34,401 23,461
Current assets 4,834 13,617 5,468 682 808
Total assets 156,634 72,538 45,450 35,083 24,269
Equity 22,717 10,832 9,452 6,856 4,708
Non-current liabilities 108,682 45,828 30,166 24,015 13,833
Current liabilities 25,235 15,878 5,832 4,212 5,728
Total equity and liabilities 156,634 72,538 45,450 35,083 24,269
CASH FLOW STATEMENT ISK million 2006 2005 2004 2003 2002
Net cash from (used in) operating activities 2,144 1,513 33 802 661
Net cash from (used in) investing activities -38,942 -11,508 -4,505 -4,668 -2,548
Net cash provided by financing activities 37,202 9,135 5,268 3,971 1,892
Change in cash flow 404 -860 796 105 5
FINANCIAL RATIOS
Operating profit (EBITDA) 70.2% 52.3% 43.6% 79.5% 74.8%
Profit before financial income (EBIT) 69.9% 52.1% 43.6% 79.5% 48.7%
Return on equity (ROE) 67.9% 18.6% 33.9% 1.0% -
Equity ratio 14.5% 14.9% 20.8% 19.5% 19.4%
Current ratio 0.19 0.86 0.94 0.16 0.14
EBITDA interest coverage 0.49 0.76 0.86 1.14 1.32
Interest coverage ratio 0.48 0.76 0.86 1.14 0.86
Debt/Equity ratio 5.90 5.70 3.81 4.12 4.15
Long-term debt/EBITDA 25.01 21.15 13.77 13.10 8.72
Earnings (loss) per share 5.24 0.86 1.26 0.04 0.38
Funds from Operation/Total Debt 3.2% 3.5% 1.2% 2.2% 3.0%
Free Operating Cash Flow/Total Debt -26.3% -5.2% -2.9% -10.3% -9.5%
Not listed

Credit Research • June 2007 • Page 24 of 25
Síminn – Communication www.siminn.co.uk
27 June 2007
Outstanding bonds
Ticker Coupon Type Indexation Maturity Last tradedIndicative Yield
Indicative Spread Duration
Outstanding Nominal Value (ISKm)
SIMI 06 1 6.0% Semiannual coupon Indexed 02.04.2014 20.06.2007 7.90% 2.16% 5.50 14,000.00
Company Profile
Síminn (Iceland Telecom) is a telecommunications company in Iceland with a strong position in all fields of the market. It provides fixed line, mobile phone, internet connection services and multimedia services via broadband to private and corporate clients in Iceland.
In July 2005 the Icelandic government sold its 98.8% share in Síminn and the company was privatized. Skipti ehf. was the buyer of Síminn and the amount was ISK 66.7 billion. In December 2005, three companies Síminn, Íslenska sjónvarpsfélagið (The Icelandic Television Company) and the parent company, Skipti, merged into one, under the name Síminn.
The largest shareholders in Síminn are Exista B.V. 43.7% and Kaupthing Bank hf. 27.8%.
Credit Summary
Síminn issued a bond (SIMI 06 1) 2 January 2006. The bond is denominated in ISK and is indexed to the Consumer Price Index. The bond bears a fixed 6% annual interest rate, paid semiannually. The bond's amortisation type is periodic interest payments and its maturity date is 2 April 2014.
The Icelandic Telecom Market
Before 1998, the Icelandic telecom market was very uncompetitive; in fact a monopoly cared for most of Iceland's telecommunications services named Landssíminn or Iceland Telecom Ltd.
In 1998, a new law was passed which opened the market for competition. The first competitor was TAL, which focused at first mainly on mobile services. Others followed, the biggest one being Íslandssími. In the internet (ISP) market the competition was a lot tougher, with companies like e.g. Íslandssími, Halló!, Margmiðlun, Skíma, Skrín and Snerpa competing.
In 2003 TAL, Íslandssími and Halló! merged under the name Og Vodafone, now called Vodafone Iceland since 6 October 2006. Today Vodafone is one of Síminn's main rival.
The Icelandic telecom market is very distinct and sharply separated from telecom markets of other countries. One of the main characters of the market is a high responsiveness towards innovation, but the Icelandic market has one of the highest penetration rates for both Internet and mobile phone.
Debt Maturity
0
5,000
10,000
15,000
20,000
25,000
30,000
35,000
40,000
2007 2008 2009 2010 2011 2012* 2013 2014
ISKm
SIM I 06 1Long-term debt
*Borrowings in 2012 will mature that year and later.
Further Information
OMX Nordic Exchange Iceland (www.omxgroup.com)
- SIMI 06 1
Recent News
On 21 December 2006, Síminn decided to undergo an organizational change where one parent company, a holding company, will be founded within the group. The new holding company will be named Skipti hf and it is assumed that it will be listed on ICEX before the end of 2007. Each operational unit will be run in separate subsidiaries which are all owned by the parent company. This proposition was formally approved at the shareholders meeting on 15 March 2007.
Síminn Management
Chairman of Board: Lýður Guðmundsson
President and CEO: Brynjólfur Bjarnason
Credit Research • June 2007 • Page 25 of 25
Key figures Date: 26.06.2007
Price (ISK): -
Market cap: -
No. of shares: -
Reuters: -
Bloomberg: -
Not listed
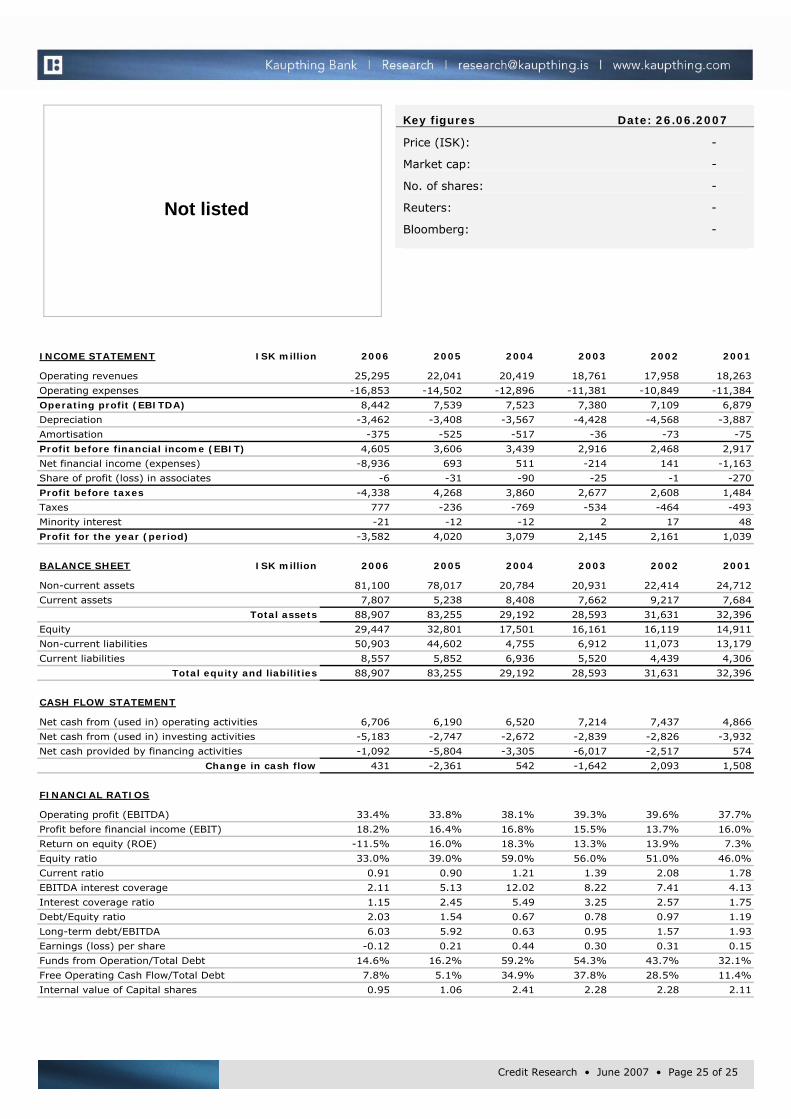
INCOME STATEMENT ISK million 2006 2005 2004 2003 2002 2001
Operating revenues 25,295 22,041 20,419 18,761 17,958 18,263
Operating expenses -16,853 -14,502 -12,896 -11,381 -10,849 -11,384
Operating profit (EBITDA) 8,442 7,539 7,523 7,380 7,109 6,879
Depreciation -3,462 -3,408 -3,567 -4,428 -4,568 -3,887
Amortisation -375 -525 -517 -36 -73 -75
Profit before financial income (EBIT) 4,605 3,606 3,439 2,916 2,468 2,917
Net financial income (expenses) -8,936 693 511 -214 141 -1,163
Share of profit (loss) in associates -6 -31 -90 -25 -1 -270
Profit before taxes -4,338 4,268 3,860 2,677 2,608 1,484
Taxes 777 -236 -769 -534 -464 -493
Minority interest -21 -12 -12 2 17 48
Profit for the year (period) -3,582 4,020 3,079 2,145 2,161 1,039
BALANCE SHEET ISK million 2006 2005 2004 2003 2002 2001
Non-current assets 81,100 78,017 20,784 20,931 22,414 24,712
Current assets 7,807 5,238 8,408 7,662 9,217 7,684
Total assets 88,907 83,255 29,192 28,593 31,631 32,396
Equity 29,447 32,801 17,501 16,161 16,119 14,911
Non-current liabilities 50,903 44,602 4,755 6,912 11,073 13,179
Current liabilities 8,557 5,852 6,936 5,520 4,439 4,306
Total equity and liabilities 88,907 83,255 29,192 28,593 31,631 32,396
CASH FLOW STATEMENT
Net cash from (used in) operating activities 6,706 6,190 6,520 7,214 7,437 4,866
Net cash from (used in) investing activities -5,183 -2,747 -2,672 -2,839 -2,826 -3,932
Net cash provided by financing activities -1,092 -5,804 -3,305 -6,017 -2,517 574
Change in cash flow 431 -2,361 542 -1,642 2,093 1,508
FINANCIAL RATIOS
Operating profit (EBITDA) 33.4% 33.8% 38.1% 39.3% 39.6% 37.7%
Profit before financial income (EBIT) 18.2% 16.4% 16.8% 15.5% 13.7% 16.0%
Return on equity (ROE) -11.5% 16.0% 18.3% 13.3% 13.9% 7.3%
Equity ratio 33.0% 39.0% 59.0% 56.0% 51.0% 46.0%
Current ratio 0.91 0.90 1.21 1.39 2.08 1.78
EBITDA interest coverage 2.11 5.13 12.02 8.22 7.41 4.13
Interest coverage ratio 1.15 2.45 5.49 3.25 2.57 1.75
Debt/Equity ratio 2.03 1.54 0.67 0.78 0.97 1.19
Long-term debt/EBITDA 6.03 5.92 0.63 0.95 1.57 1.93
Earnings (loss) per share -0.12 0.21 0.44 0.30 0.31 0.15
Funds from Operation/Total Debt 14.6% 16.2% 59.2% 54.3% 43.7% 32.1%
Free Operating Cash Flow/Total Debt 7.8% 5.1% 34.9% 37.8% 28.5% 11.4%
Internal value of Capital shares 0.95 1.06 2.41 2.28 2.28 2.11