THE HYDROSPHERE - Springer · PDF fileTHE HYDROSPHERE 3-1 THE WATER CYCLE ... For this...
46
3 THE HYDROSPHERE 3-1 THE WATER CYCLE Water from the surface of the ocean is evaporated into the atmosphere. The only energy that drives the evaporation is solar radiation from the sun. The solar constant is two calories (1 calorie is the quantity of heat required to raise 1 gram of water 1 degree centigrade) per square centimeter per minute. Over the whole earth the actual amount of radiation is 2.55 x 10 18 calories, or about one-fourth of the product of the solar constant and the area of the earth's surface. The ultraviolet rays of the sun's light are absorbed by the ozone of the upper atmosphere; radiation is also reflected by clouds or is scattered at lower altitudes. About 81 % of the radiation reaches the earth's surface, but about one-third is reflected back into space. Of the absorbed radiation, 77% is reradiated as long-wave energy back into space. What remains is 23%, which goes into the evaporation of water (Figure 8). The unending circulation of the earth's moisture and water is the water cycle. It operates in and on the land and oceans as well as in the atmosphere. Water from the oceans, which contain an estimated 97.3% of the earth's water, is evaporated into the atmosphere to form clouds that later condense and fall back to the surface as rain, hail, snow, or sleet. Some of the precipitation, after wetting the ground, runs off the surface to streams. Rapid runoff causes erosion and contributes to floods. Of the water soaking into the ground, some is available to growing plants, some evaporates, and some reaches deeper zones, that is, water layers (termed aquifers, seeps, springs, and groundwater). The streams feed into river systems and eventually flow back to the ocean, as the water runs downhill to sea level. About 80,000 cubic miles of water per year are evaporated from the oceans and about 15,000 cubic miles from the hikes and land surfaces. Total evaporation equals precipitation, but the condensed matter falls back on the land and the oceans, with 24,000 cubic miles, about one-quarter of the total, 41 C. L. Mantell et al., Our Fragile Water Planet © Springer Science+Business Media New York 1976
Transcript of THE HYDROSPHERE - Springer · PDF fileTHE HYDROSPHERE 3-1 THE WATER CYCLE ... For this...

3
THE HYDROSPHERE
3-1 THE WATER CYCLE
Water from the surface of the ocean is evaporated into the atmosphere. The only energy that drives the evaporation is solar radiation from the sun. The solar constant is two calories (1 calorie is the quantity of heat required to raise 1 gram of water 1 degree centigrade) per square centimeter per minute. Over the whole earth the actual amount of radiation is 2.55 x 10¹⁸ calories, or about one-fourth of the product of the solar constant and the area of the earth's surface. The ultraviolet rays of the sun's light are absorbed by the ozone of the upper atmosphere; radiation is also reflected by clouds or is scattered at lower altitudes. About 81 % of the radiation reaches the earth's surface, but about one-third is reflected back into space. Of the absorbed radiation, 77% is reradiated as long-wave energy back into space. What remains is 23%, which goes into the evaporation of water (Figure 8).
The unending circulation of the earth's moisture and water is the water cycle. It operates in and on the land and oceans as well as in the atmosphere. Water from the oceans, which contain an estimated 97.3% of the earth's water, is evaporated into the atmosphere to form clouds that later condense and fall back to the surface as rain, hail, snow, or sleet. Some of the precipitation, after wetting the ground, runs off the surface to streams. Rapid runoff causes erosion and contributes to floods. Of the water soaking into the ground, some is available to growing plants, some evaporates, and some reaches deeper zones, that is, water layers (termed aquifers, seeps, springs, and groundwater). The streams feed into river systems and eventually flow back to the ocean, as the water runs downhill to sea level.
About 80,000 cubic miles of water per year are evaporated from the oceans and about 15,000 cubic miles from the hikes and land surfaces. Total evaporation equals precipitation, but the condensed matter falls back on the land and the oceans, with 24,000 cubic miles, about one-quarter of the total,
41
C. L. Mantell et al., Our Fragile Water Planet© Springer Science+Business Media New York 1976

42
FIGURE 8. The water cycle.
CHAPTER THREE
Und .tfl 0 Ir,bul'on R ..... d"...... 000 •• F WI.I.. 0\. s.l11 .. tnd Inland Ma 01 2 5001 """"ur. and 00 7 G.ound ... t.. m,1e dftp &8 3 Ground .. I &8 1
falling on land. This is equivalent to a depth of nearly 500 ft of water over all of Texas.
The distribution of water over the surface of the earth is shown in Table 9. The oceans have better than 97%. Most of the remainder is locked up in glaciers, which have increased, decreased, and fluctuated over geologic ice ages . Underground storage, or aquifers, account for less than 1%, lakes and rivers for a little more than one-tenth of one percent, and the atmosphere for a little more than one-hundredth of one percent. The biosphere, or life and life-endowed organisms, constitute six ten-thousandths of one percent of the water. Water is absolutely essential to life, but has no dependence on human and animal life. We, however, are absolutely dependent on water. We cannot exist on seawater, save that from which we remove the mineral salts. We must have the relatively clean, pure water of underground aquifers, lakes, rivers, and the atmosphere . We adapt, and in isolated areas collect rainwater on the roofs of our habitations and store the water in reservoirs (as in Bermuda). However immense the water cycle might be, we have available for all our purposes less than one percent of the earth's water.
Peixoto and Kettani 1 discussed the water cycle and the effect of the flow of winds in the atmosphere, on a global scale. On the average, whenever there is an imbalance between precipitation and evaporation, there is a need for a net transport of water vapor to or from the locality by atmospheric circulations. An independent check on the precipitation-evaporation difference is available.
For this purpose, time averages of the wind and the humidity will not do, because the effect of the deviations of these factors from their arithmetic mean cannot be neglected. The process must be evaluated instantaneously. An average of the results must be taken over a long interval and for several levels in the atmosphere, up to an elevation of about 5 or 6 km.
'J. P. PEIXOTO and M. A. KETTANI, Scientific American, 228:4 (1973).

THE HYDROSPHERE 43
Table 9. Distribution of Water on the Earth's Surface
Region Water distribution (X JOI'm3) Percentage
Oceans 1350. 97.3 Glaciers or polar ice 29 1.8 Underground
aquifers 8.4 0.6 Lakes and rivers 2 0.15 Atmosphere 0.013 Biosphere life 0.0006 Soils 0.066
The annual mean water-vapor content, averaged for the entire atmosphere, is rather small, amounting to about 0.3% of the total mass of the atmosphere. That quantity is of the same order of magnitude as the amount of water contained in freshwater lakes. Hence the atmosphere is a comparatively small reservoir of water; at a given instant it holds only a tiny part of all the water that participates in the hydrologic cycle. If all the atmospheric water vapor were to condense at once, only a moderate amount of precipitation would result. Even though the total amount of water in the atmosphere is small, however, there is a huge transport of water vapor by atmospheric circulations of various scales in space and in time.
The influence of this small amount of water vapor on the climate of the earth and on hydrologic resources is far out of proportion to its mass. Water vapor plays a major role in the overall energetics of the earth and in the general circulation of the atmosphere. It is the most important factor in all radiative processes of the atmosphere in that it regulates the energy balance through the absorption and transmission of radiation.
Global transport of water vapor by the atmospheric circulation was calculated on the basis of data gathered at numerous stations from pole to pole during the International Geophysical Year (1958). The data consisted of daily measurements of the wind and the water content of the atmosphere obtained with the aid of the IGY aerological radio-sensing network. The averaged results, which show the mean flow of moisture during the year as a field of vectors, represent the lower half of the atmosphere; the upper atmosphere contains only a negligible amount of moisture. The asymmetrical pattern of the vector arrows reflects important irregularities in the global transport of atmospheric water (see Figures 9 and 10).
Mathematical operations were performed on the field of vectors to compare the aerological data with conventional climatological estimates. The outcome is a contour map (Figure 10), in which regions where there is a divergence in the field of vectors (dashed contours on shaded background) correspond to net sources of moisture and hence to places where there is on the

44
80
40
iii 1: W .... W It It 0 C) Z w o .
120
;;; 0/ ---- --o j .... f: « .J
< / .... ..., / ---
80 \ 160
\
CHAPTER THREE
I 80 40 WEST o EAST 40
LONGITUDE (DEGREES'

THE HYDROSPHERE
80 120 160 ' t? j i
-- /' ----
--- - ----
40
1:-~:3 II:w all: ZCl
w o o-w o
1:~ ~I=>j: 0< U)..J
40
45
FIGURE 9. Movement of water vapor (hundreds of grams per centimeter per second) .
• LESS THAN 1
1 to 4
5 to 8
- 9 to 12
- 13 to 16
~ 17 to 20
~ 21 to 24

46 CHAPTER THREE

THE HYDROSPHERE
80
80 120 160
I/) w w a:: CI w o w o :J l-I<l .J
47
FIGURE 10. Contour map comparing aerologic data with climatological estimates. Dashed contours correspond to where evaporation exceeds precipitation, solid contours to where precipitation exceeds evaporation.

48 CHAPTER THREE
a, erage an excess of evaporation over precIpitation, whereas regions where C( ,nvergence prevails (solid contours on white background) correspond to net si nks of water vapor and hence to places where precipitation exceeds evaporati In. The numbers on the contours indicate the equivalent depth of liquid water ill centimeters per year.
'3-2 THE GREAT LAKES OF THE UNITED STATES
Over geologic time the distribution of terrestial water has changed. When continental ice caps formed at maximum glaciation, the sea level may have been lowered by as much as 140 m, exposing large areas of the continental shelves. If the ice caps were to melt, the sea level would rise as much as 60 m, flooding a large area of the continents. Against such changes man must retreat to higher ground if it is available.
Ages ago, an extensive ice sheet covered the area that is now Ontario, Canada, and Michigan, Minnesota, Wisconsin, and adjoining states. In its advance and later retreat the Great Lakes were formed, presenting a watery staircase that spans 800 miles. Lake Superior, the highest and deepest lake, lies 21 ft above Lakes Michigan and Huron. A drop of 7 ft separates these lakes from Lake Erie, which in tum is 325 ft higher than Lake Ontario. The surface areas, depths, and volumes of the Great Lakes are given in Table 10.
At times the lakes had other outlets. Water drained through the Mississippi River, as well as via the Finger Lakes in New York and the Susquehanna River, or via the Mohawk Valley and the Hudson. It is estimated that the St. Lawrence River became the major path about 4000-12,000 years ago.
The Great Lakes is an area where sailors have been dominant in humanizing the watery region. From Lake Superior, boats bypass rapids of the St.
Table 10. The Great Lakes"
Surface Volume Average Connecting Rank Greatest area (cubic depth river or over depth
Lake (square miles) miles) (feet) strait earth (feet)
Superior 31,700 2,938 489 St. Mary's 2 1,333 Michigan 22,300 1,180 279 Mackinac 6 923 Huron 23,000 849 195 St. Clair 5 750
and Detroit Erie 9,910 116 62 Niagara 12 210 Ontario 7,340 393 283 SI. Lawrence 14 802
Total 94,250
aFor comparison: Caspian Sea surface area is 143,550 square miles.

THE HYDROSPHERE 49
Mary's River at the locks of the Sault Ste. Marie canals. The boats pass from Lake Huron to Lake Erie via the St. Clair River, Lake St. Clair, and the Detroit River. Connection with Lake Michigan is by the Straits of Mackinac. Passage from Lake Erie to Lake Ontario is via the Weiland Canal, whose eight locks conquered the Niagara escarpment. From Lake Erie, passage is via the Thousand Islands in the St. Lawrence, the Eisenhower Locks at Massena, and the St. Lawrence Seaway to the ocean. Thus the Great Lakes cities became seaports through our engineering skill.
More than 25% of United States income from farming, mining, and manufacturing is developed in the Great Lakes area. The farmers were able to use their fertile fields only after draining. The U.S. Geological Survey and the Departments of Agriculture and the Interior have often strongly rebutted the statement of some environmentalists that "Lake Erie is dead." Lake Erie is the shallowest of the Great Lakes and was created by retreating glaciers some 20,000 years ago. Barring another ice age, Erie has several thousand years to go before senility. The western part of the lake receives a large amount of natural organic material transported from the surrounding terrain, and that is where the algal growth has always been present, in the extremely shallow areas. Over the last 100 years, Lake Erie has consistently produced about 50% of the fish catch of the entire Great Lakes system, according to Department of Census and manufacturers' figures. This is not the mark of a dead lake.
Regier and Hartman2 confirm the statement that Lake Erie's biotic community is not dead. Their tables for all varieties and species of fish show that catches have increased, although there may be fewer of the species most popular in the 1950s. They also provide an extensive bibliography. Intergovernmental cooperation and monitoring methods exist for complete restoration of Lake Erie's condition to the 1840- 1850 status.
Lakes are depressions in the crust of the planet which collect water from atmospheric precipitation such as rain, melting ice and snow, springs, rivers, and runoff from land surfaces. They are widely distributed, but more abundant at high altitudes and in recently glaciated mountain regions. They are frequent along rivers of low gradiant and wide fiats. They occur at all altitudes, as shown in Table 11.
Formation of lakes may be the result of changes in the earth's crust by physical forces, as shown in Table 12.
From the time of its birth or formation, a lake is destined to die and disappear. Even when there is enough water to keep the lake filled, there is deposition of detrital matter which fills the lake, and the effluent stream cuts deeper and deeper channels which in tum lower the lake.
2H. A. REGIER and W. L. HARTMAN, Lake Erie's fish community-150 years of cultural stress, Science, J 80 (4092): 1248-1255 (1973).

50 CHAPTER THREE
Table 11. Range of Lake Elevations
Lake
Titicaca, Bolivia Yellowstone, Nevada, USA Superior, USA Caspian Sea, USSR Sea of Tiberias, Israel Dead Sea, Israel
Elevation (ft above sea level)
12,500 7,741
500
Elevation (ft below sea level)
86 682
1,392
Table 12. Geologic Origin of Lakes
Physical force
Glacial erosion and terminal basins
Valleys deepened by glacial erosion
Landslides causing barriers
Damming by valley glacier
Blocking by frontal moraines
Alluvium build-up
Volcanic craters
Synclines
Rift valleys
Sinkholes
Rise of water table
Example
Lower valleys of the Alps, Switzerland
Michigan, Great Lakes, Wisconsin
C:lIifornia Lakes
Aletsch Glacier, Switzerland Malaspina Glacier, Alaska
Canadian Lakes
Lakes formed by levees of Mississippi
Ancient and dormant volcanoes
Joux Jura
Great Rift Valley, North Africa
Limestone caves and clay regions
Desert oases
Lakes
Neuchatel, Lucerne, Zurich
Superior, Huron, Michigan
Miiyllen Costain
St. John, Quebec
Ngo, Japan
Switzerland
Tanganika, Nyassa
When rainfall is less than 10 inches per year, evaporation losses are greater than precipitation gain, and salt and bitter lakes result. The Dead Sea and the Great Salt Lake in Utah had fresh water ancestors, while the Caspian ana r\fal Seas were once part 01" a much larger pert;on of the ocean T Tplift of the Carpathian mountains greatly reduced their area.
Lakes may become stagnant. Influx of organic matter, anaerobic decomposition, and excess of nutrients with stimulation of algal growth and death, have been studied by biologists and limnologists. Biologic oxidation by pumping air or pure oxygen eliminates stagnant areas, and restores circulation and

THE HYDROSPHERE 51
environmentally healthful conditions. This treatment is being applied and studied in the Lakes area of New York at Lake Waccabuc. The Great Lakes of North America are among the largest over the world's entire crust, as seen from Table 13. Other large United States lakes are listed in Table 14.
Table 13. Large Lakes of the World (Source: National Geographic Society)
Area Length Maximum Depth Lake Continent (square miles) (miles) (feet)
Caspian Sea Asia-Europe 143,550 760 3,264 Superior North America 31,800 350 1,333 Victoria Africa 26,828 750 265 Aral Sea Asia 25,800 280 223 Huron North America 23,000 206 750 Michigan North America 22,400 307 923 Tanganyika Africa 12,700 420 4,710 Great Bear North America 12,275 192 1,356 Baikal Asia 11,750 395 5,315 Nyasa Africa 11,430 360 2,226 Great Slave North America 10,980 298 2,015
Table 14. U.S. Natural Lakes other than the Great Lakes (Courtesy USGS)
Lake
Lake of the Woods Great Salt Iliamna Okeechobee Pontchartrain Champlain St. Clair Becharof Red Lake Salton Sea
Lake
Sakakawea Kentucky Fort Peck Powell Mead
Location
Minnesota, Ontario, and Manitoba Utah Alaska Florida Louisiana New York, Vermont, and Quebec Michigan and Ontario Alaska Minnesota California
Table 14a. Largest Man-Made U.S. Lakes (Courtesy, USGS)
Surface Area Location (square miles)
North Dakota 609 Kentucky and Tennessee 408 Montana 383 Arizona and Utah 252 Arizona and Nevada 246
Area (square miles)
1,695 1,000 1,000
700 625 490 460 458 451 350
Maximum Depth (feet)
200 145 220 580 589

52 CHAPTER THREE
Lakes, brooks, springs, and aquifers feed from higher elevations to rivers, and from rivers to the sea. Rivers have flood plains over which some sort of human control has been exerted ever since recorded history began. Dams created artificial lakes; the largest ones in the United States are listed in Table 14a. The world's highest dams are listed in Table 15, the largest dams in Table 16, the world's greatest man-made lakes for flood control and associated hydroelectric power, and the world's largest hydroelectric plants, in Tables 17 and 17a, respectively.
Table 15. The World's Highest Dams
Height Name Location (feet) Earth Concrete Completed
Nurek USSR 1,040 X Inguri USSR 860 X Grand Dixence Switzerland 932 X 1962 Vaiont Italy 858 X 1961 Mica Canada 800 X Mauvoisin Switzerland 777 X 1958 Sayansk USSR 774 Oroville USA 770 X 1968 Chirkey USSR 764 X Contra Switzerland 754 X 1965 Bhakra India 740 X 1963 Hoover USA 726 X 1936
Table 16. The World's Largest Dams (Courtesy, USDI)
Volume Name Country (million cubic yards) Completed
Tarbe1a Pakistan 159 Fort Peck USA 126 1940 Mangia Pakistan 108 1967 Oahe USA 92 1963 South Saskatchewan Canada 86 1966 Ornvillf> T T~" J..7UO
San Luis USA 78 1967 Nurek USSR 76 N aga junasagar India 74 1966 Garrison USA 67 1956

THE HYDROSPHERE
Table 17. The World's Greatest Man-Made Lakes
Capacity Name (million acre-feet) Country
Owen Falls 166 Uganda Bratsk 137 USSR Kariba 130 Rhodesia-Zambia Sadd-EI Aali 126 UAR Akosombo 120 Ghana Manicouagan #5 115 Canada
Table 17a. The World's Largest Hydroelectric Plants
Name Country Initial Operation
Sayansk USSR Krasnoyarsk USSR 1967 Grand Coulee USA 1941 Bratsk USSR 1961 Sukhovo USSR Churchill Falls Canada
3-3 RIVERS AND FLOOD CONTROL
53
Completed
1954 1964 1959
1965 1967
Ultimate Installed
Capacity (mw)
6,300 6,000 5,574 4,500 4,500 4,500
In the flood control of rivers, we have won battles with great flows of water over tremendous distances. The major United States rivers are listed in Table 18, prepared by the Army Corps of Engineers, which controls navigation on them. Table 19 lists the major foreign rivers, using data from the National Geographic Society.
Rivers playa significant role both in the Earth's hydrologic (water) cycle and in its petrogenic (rock) cycle, emptying water from the land into the oceans and gradually wearing away the land in their drainage systems by carrying sediment to the sea. Moreover, rivers have historically offered the most convenient pathways for exploration, later becoming courses for transportation and commerce. Civilizations based on agriculture have always flourished along fertile river valleys. The flood and flow of many river systems are now controlled by dams and reservoirs to assure most efficient use of the water.
The longest rivers of the world, in miles, are: the Nile (4145), Africa; the Amazon (3900), South America; the Mississippi-Missouri-Red Rock (3710), United States; the Ob-Irtysh (1460), Siberia; the Yangtze (3400), China; the

54
River
Table 18. Major United States Rivers (Courtesy. Army Corps of Engineers)
Empties into
Mississippi-Missouri-Red Rock Gulf of Mexico Rio Grande Gulf of Mexico Yukon Bering Sea Arkansas Mississippi river Colorado Gulf of California Ohio-Allegheny Mississippi river Red (Oklahoma-Texas-Louisiana) Mississippi river Columbia Pacific Ocean Brazos Gulf of Mexico Snake Columbia river
Table 19. Major Foreign Rivers ~ource: National Geographic Society)
River Location Empties into
Nile Africa Mediterranean Amazon Brazil Atlantic Ocean Ob-Irtysh USSR Gulf of Ob Yangtze China East China Sea Yellow China Yellow Sea Congo Africa Atlantic Ocean Amur USSR Tatar Strait Lena USSR Lapter Sea Mackenzie-Peace Canada Beaufort Sea Mekong S.E. Asia South China Sea Niger Africa Gulf of Guinea
CHAPTER THREE
Length (miles)
3,741 1,885 1,875 1,450 1,450 1,306 1,222 1,214 1,210 1,000
Length (miles)
4,145 3,900 3,460 3,400 3,000 2,718 2,700 2,680 2,635 2,600 2,600
Huang or Yellow River (3000), China; the Congo (2718), Africa; the Amur (2700), Siberia; the Lena (2680), Siberia; the Mackenzie-Peace (2635), C':::-::::-l~: <"", U"'1r"n~ ('~()()) Sontheast Asia: the Nil!;er (2600), Africa; the Parana (2500), South America; The Murray-Darling (2310), Australia; and the Volga, (2290), East Europe. The Angara is the only outlet of Lake Baikal, USSR, and drops 1140 ft in 1150 miles.
Most fish spawn and live their first life in the shallower parts of the sea adjacent to the coast. Fish migrate into fresh water to spawn and lay eggs in the brackish waters of the intertidal estuarine zones, the marshlands, and the tidal estuaries adjacent to the sea. Ocean fish of many species actually return to the shallow bays to spawn.
In the eastern Mediterranean a dramatic change has occurred since the completion of the high Aswan Dam in Egypt, in 1965. Previously, the annual

THE HYDROSPHERE 55
discharge of fresh floods into the Mediterranean from the Nile was about 80,000 million cubic meters per year. This flow came chiefly in late summer and early autumn as a reflection of the monsoon rains at the headwaters of the Blue Nile in Ethiopia, 2500 miles upstream. The dam, which is some 364 ft high, has formed Lake Nasser, with a total area of 1.25 million acres. It holds back all but about 5% of the seasonal discharge of Nile flood waters.
The Nile River floods once carried huge quantities of silt which were a source of nutrients and minerals and contained chemicals washing out of the soil itself and the agricultural and sewage products of more than 70 million people. The Nile Valley was thus provided with enrichment which reached the sea each year after flooding the adjacent lowlands along the delta. After the flood there was a noticeable outburst of "bloom" on the Mediterranean-an immense reproduction of algae and other plant and animal organisms. A similar bloom in Lake Erie is called "pollution" by environmentalists.
This rich bloom, with some 50-100 million tons of silt that flooded into the brackish estuarine waters of the delta and the adjacent shallow sea, was a most effective marine fertilizer. It nourished more than one-half the fish caught annually by Egyptians. The end products of this food chain were Tilapia fish in the rivers, and mullet and other edible saltwater species, as well as sardines, further offshore. The sardine take alone was approximately 18,000 tons per year.
The blooms of algae caused by the annual enrichment have virtually disappeared. To the environmentalist, the Aswan Dam has removed pollution from the Mediterranean. Sardines have become scarce, and the catches have been reduced to some 500 tons per year, less than 3% of the former crop. The delta itself is being eroded. Some of the delta lakes have become less saline, lacking the blend of fresh and salt waters for ideal brackish conditions. The fish and shrimp that were formerly abundant in these shallow estuaries are unable to spawn.
Rivers in the United States are often called dirty and polluted. Rivers are the natural transport system for sediment, organic matter, and drainage of the rains and melting snow that fallon the land. Other than in the Middle Atlantic and New England states, and the Pacific Northwest, rivers are not clean, limpid streams, but colored and muddy. "Big Muddy," the Missouri, carries a load of more than 2 million tons of sediment per day into the Gulf of Mexico, or over 700 million tons per year. The daily load of sediment is the equivalent of 40,000 freight cars. The Savannah is brown and muddy, as are the Pee Dee, the Warrior, the Ohio, the Colorado, the Atchafalaya, and the Rio Grande. These augment the load of detritus carried to the oceans. The exceptions are rivers like the St. Lawrence, with its tributaries, the Niagara, the Shawinigan, the Sagenay, and the Columbia and the Hood river systems. These are clear, sparkling, without mud or color.

56 CHAPTER THREE
Table 20. The World's Greatest Waterfalls (Courtesy. United States Geologic Survey)
Continent Country Location Height (ft)
Africa Ethiopia Fincha 508 Lesotho Maletsunyane 630 South Africa Aughrabies 400
Tugela 3,110 Tanzania-Zambia Kalambo 726 Zambia Chirombo 800
Asia India Cauvery 330 Gersoppa 830
Japan Kegon 330 Yudaki 335
Australia New South Wales Wentworth 518 Queensland Wollomombi 1,100
New Zealand Sutherland 1,904 Europe Austria Krimoni 1,250
France Gavarnie 1,385 Norway Mardalsfoss (Eastern) 1,696
Veltis 1,214 Switzerland Cascade de Gietroz 1,640
Giessbach 1,312 Trummelbach 1,312
Rivers in their passage to the sea create some lakes where the drop in level is small, but create large waterfalls where the change in elevation above sea level is precipitous. There are tens of thousands of waterfalls throughout the globe. Some have been humanized to furnish power, some are in national parks, and some are "wild rivers" in undeveloped areas or in scarcely inhabited wildernesses. The highest waterfalls in the world are: Angel (Venezuela): 3212 ft; Tugela (South Africa): 3110 ft; Yosemite (California): 2425 ft; Cuquenan (Venezuela): 2000 ft; Sutherland (New Zealand): 1904 ft; Eastern Mardalsfoss (Norway): 1696 ft (Table 20).
On the basis of annual flow combined with considerable height, Guaira, between Brazil and Paraguay, is the world's greatest waterfall; its estimated annual flow is 470,000 cubic feet per second (cusecs). A greater volume of water passes over Stanley Falls, in the Democratic Republic of the Congo, but not one of its seven falls, spread over a distance of 60 miles, is over 10 ft. The estimated annual flows of other great waterfalls, in cusecs, are: Niagara (Canada and the United States), 212,200; Paulo Afonso (Brazil), 100,000; Urubupunga (Brazil), 97,000; Iguazu (Argentina and Brazil), 61,600; Patos Maribondo (Brazil), 53,000; Victoria (Zambia and Rhodesia), 38,400; Churchill (Labrador), 30,000-40,000; and Kaieteur (Guyana), 23,400.

THE HYDROSPHERE
Table 20 (continued)
Continent Country State or Province Location
North America Canada British Columbia Takakaw Panther
Labrador Churchill Mackenzie District Virginia Quebec Montmorency
Canada-USA Ontario Horseshoe New York American
United States Arizona Mooney California Feather
Illilouette Nevada Ribbon Silver Strand Vernal Yosemite
Colorado Seven Georgia Tallulah Idaho Shoshone New York Taughannock Oregon Multnomah Tennessee Fall Creek Washington Fairy Falls
Palouse Sluiskin
Wisconsin Manitou Wyoming Yellowstone (Upper)
Yellowstone (Lower) Mexico EI Saito
South America Brazil Glass Guyana King George VI Colombia Catarata de Candelas Venezuela Angel
Cuquenan
3-4 THE TENNESSEE VALLEY AUTHORITY AND FLOODS
57
Height (ft)
1,650 600 245 315 251 186 193 220 640 370 594
1,612 1,170
317 2,425
266 251 195 215 620 256 700 198 300 165 109 308 218
1,325 1,600
984 3,212 2,000
The Tennessee Valley Authority (TV A) was created over 40 years ago, in the summer of 1943, by a generation of conservationists, Congress, and President Franklin Roosevelt, primarily as a flood-control agency and only secondarily as a power producer. The creation of a huge system of dams, lakes, and flood-control projects was successful. It is shown in Figure 11.

58 CHAPTER THREE
~'\, ~. V~-J
KENTVCKY ~ .. ' Bristol -- ---- -v-- - ---- --~ ----:;:..;z;;-- ~ - - -~7----
Naltwille )~ .. /Vt,.,j..g • Knoxville . '. ,.'\..'''-, r
NORTH CAROLINA
O Tllnneue RiVllr Weteran ' Oams
FIGURE 11 . The Tennessee Valley region, showing watershed and dams.
At first, TV A was a hydraulic power producer, with low rates to attract industry . Customers grew faster than the hydraulic power supply, and TV A moved into coal-fired plants to satisfy demand. Coal power, not water power, now accounts for 80% of the 100 billion kwh per year produced by TVA, and feeds to 160 local electric systems and ultimately to 2.3 million customers. In 40 years TV A has gone from a successful and unified river control system to an establishment of 21.9 MW of installed generating capacity, making it among the largest, if not the largest, in North America.
TVA 1970 estimates show the annual bill for a typical Tennessee allelectric home at $292 for 24,000 kwh, or $25 per month, equivalent to about one dollar per day for heating, cooking, and household appliances . TVA maintains that it took coal furnaces out of every house in Knoxville. When TVA began operations, emissions and dust were common. TVA is now the country's largest coal consumer of mountain strip mining coal, burning 35 million tons a year.
Southern California Edison figures that snow runoff to its hydroelectric plants in the southern Sierra Madre, helped by rainfall produced by c1oudseeding, has increased 8% since 1951.
When the water cycle deviates severely from its historical custom, people and human works may be destroyed by floods from rivers too heavily loaded by sudden or violent rain, or by the results of melting snow from record-breaking snowstorms. Ten inches of snow is equivalent to 1 inch of rain. Dams are designed only to accommodate the maximum flows of a 40-year cycle. Floods can be more destructive than volcanoes, but the damage they cause is generally

THE HYDROSPHERE 59
small in comparison with earthquakes, although tidal waves, which are themselves associated with submarine earthquakes and/or volcanoes, have killed hundreds ofthousands of people. Tables 21, 22, and 23 provide some history.
In the United States, we have controlled floods in such large areas as the Tennessee River basin, but, in 1973, the Mississippi flooded vast areas because flood-control dams, levees, locks, and bank stabilizations still do not exist on a sufficiently grand scale. Coupled with Hurricane Camille, the Susquehanna in Pennsylvania ripped out bridges and flooded many low areas. Wilkes-Barre was still stricken more than a year later; curiously, rebuilding continues on the flood plain of the river!
In January, 1969, Southern California had torrential rains which pounded the Los Angeles-Santa Barbara area. The area suffered the most damaging flood in 31 years, with rain for more than a week. When the rains finally ended, property damage was more than $60 million, 9000 homes were destroyed, and 91 persons had died.
The Mississippi is the trunk of a river system whose branches are the Missouri, the Red, the Ohio, the Tennessee, the Arkansas, the Des Moines, the Cedar, the Rock, the Illinois, the Wisconsin, the Wabash, the Platte, and many other rivers. These draw the runoff rains, the melting snow, and drainage from
Table 21. World's Principal Floods
Date Location Deaths Explanation
1228 Netherlands 100,000 Seaflood to Friesland 1642 China 300,000 Kaifeng seawall destroyed 1787 Eastern India 10,000 Stonn drove seawater inland 20 mi 1887 Honan, China 500,000 Yellow River overflowed 1889 Johnstown, Pa. 2,000 Flood; dam breakage 1900 Galveston, Texas 6,000 Tidal wave 1911 China 100,000 Yangtze River overflowed 1939 China 1,000,000 Floods in north; extensive drownings
and starvation 1947 Honshu, Japan 2,000 Flooding after typhoon 1948 Foochow, China 1,000 Floods 1951 Manchuria 1,800 Flooding 1953 Northwest Europe 1,794 Stonns and floods devastated North
Sea coastal areas 1954 Iran 2,000 Flash flood 1955 Pakistan and India 1,700 Flood 1956 China 2,000 3 Provinces flooded after typhoon 1957 Western Mexico 2,000 Flood 1960 East Pakistan 10,000 Tidal wave 1963 Northern Italy 2,000 Vaimont Dam collapsed 1968 Western India 1,000 Widespread flooding; killed
80,000 cattle

60 CHAPTER THREE
Table 22. Heaviest Snowstorms and Snowfall in the United States (Courtesy, U.S. Dept. of Commerce)
Depth Date Location (inches) Description
2/19-24/1717 New England 60--72 Drifts covered many one-story houses 12/3-6/1886 Asheville, N. Car. 26 Heavy snow and high winds 3/11-14/1888 Boston, New York City, 40--50 Major eastern cities paralyzed
Philadelphia, and Washington
2/14-15/1894 Rayne, Louisiana 24 Record for Louisiana 2/11-14/1899 Washington, D.C. 34.2 Record for Capital 4/19-21/1901 Watertown, Ohio 45 Record 24-hour fall for state 11/7-11/1913 Ohio, Pennsylvania, and 36 Severe snow and windstorm
West Virginia 12/29-31/1915 Flagstaff, Ariz. 54 Record for state 12/23-26/1916 Summit, Calif. 59 Heaviest 24-hour fall in California 4/14-15/1921 Silver Lake, Colo. 95 75.8 inches in 24 hours; greatest in
U.S. history 11/17-20/1921 The Dalles, Oregon 54 Record in state 4/27-28/1928 Bayard, West Virginia 35 Record 24-hour of 34 inches 1/18-19/1933 Giant Forest, California 60 Record for state for 24 hours 1/18-22/1940 Watertown, New York 69 Record for state 11/2-6/1946 New Mexico 36 Record for state for 24 hours 3/2-5/1947 Readsboro, Vermont 50 Record for state 3/2-5/1947 Peru, Massachusetts 47 Record for state 1/1-6/1949 Colorado, Idaho, Montana, 36--48 Most adverse weather in history
Nebraska, North Dakota, of the West South Dakota, Utah, and Wyoming
3/25-27 /1950 Dumont, South Dakota 60 Record for state 11/23-28/1950 Ohio, Pennsylvania, and 33-57 Record for 3 states
West Virginia 1/11-16/1952 Tahoe, California 149 Greatest for single storm in U.S.
(except Alaska) 3/2-5/1955 Colorado, Idaho, Montana, 30--52 One of the heaviest and latest
South Dakota, spring storms and Wyoming
2/18-20/1960 Maryland, New England, 20--36 Damage in millions of dollars New Jersey, New York, Pennsylvania, and West Virginia
2/2-5/1964 New Mexico, Oklahoma, 18-36 Second heaviest storm in Panhandle's and Texas Panhandle history
2/24-27 /1969 New England 25-60 Most severe storm in many areas for years
2/10--11/1973 Georgia, North Carolina, 15-21 Worst storm in South in century and South Carolina

THE HYDROSPHERE
Date
7-8/-/1860--61 7/1/1861 5/12/1916 6/22/1947 3/15-16/1952 7/4/1956 2/28-29/1964
Table 23. World's Greatest Rainfall (Courtesy, U.S. Dept. ojCommerce)
Location Duration
Cherrajuni, India 1 year Cherrajuni, India 1 month Plumb Point, Jamaica 15 minutes Holt, Missouri 42 minutes Cilaos, Reunion 24 hours Unionville, Maryland 1 minute Belouve, Reunion 12 hours
61
Depth (inches)
1,041.78 366.14
7.80 12.00 73.62
1.23 42.76
31 states and Canada, in an area from the Rocky Mountains and the Great Divide to the Appalachians in the East.
Heavy snows in the winter of 1972, prolonged rains in the Midwest, and freak spring blizzards in the upper river states caused, through April and May, 1973, the entire system from Minnesota to New Orleans to crest above flood stage. For a brief period, the waters receded slightly, and then, fed by more rain and snow, crested higher. This occurred four times. Millions of acres of farmland were covered with water. Dozens of river towns, summer resorts, fishing camps, industrial plants, urban housing areas, railroads, and county, state, and interstate highways were submerged. Ferries were put out of action, bridges demolished, and the central granary of the nation paralyzed. Levees, the earthwork barriers with their hold-in-place revetments, built up over the years to hold back the currents of the river, broke or washed out. Those that held had water cascading over them. The 27 flood-control dams above St. Louis and their navigation locks were like flotsam as seas of water spread 3-4 miles beyond their ends. The suburbanites, who had been assured by developers that the river would never dampen their doors, found that their ruined homes (those which did not float away) were situated in the flood plain of a mighty river. The longest and oldest dam, at Keokuk, built primarily for power generation and to make the rapids navigable, had to open its spillways to relieve crushing pressure upstream from ice jams. When the ice and snow came down in late April, the industries below the dam were flooded. Quincy, Illinois, a few miles downstream, was a disaster area. At Hardin, Illinois, the bridge master opened a drawbridge to let a house go through.
Casualties were few because the Mississippi system never floods by surprise. Everybody knew it was coming, but meteorologists could not predict with what severity. In time, the water and the river went down. Granaries and elevators held spoiled grain and beans, but planting was begun as soon as fields

62 CHAPTER THREE
were drained and again ploughable. The people went back to their fields , homes, factories, and cities to clean them up and make them useful again . The next efforts at flood control of the Mississippi and Missouri will be drawn up on the basis of a l00-year cycle to protect against further such serious disasters.
On June 9, 1972, 14 inches of rain spilled onto a small area of the Black Hills of western South Dakota. Normally, 14 inches fall in an entire year (Figure 12) . In the late afternoon a strong breeze blowing from the Southeast carried an unusually moist supply of air to the eastern side of the Black Hills. The steep slopes forced the incoming air upward, causing moisture to accumulate over the hills. Normally, high-level winds would carry much of this moisture away, but on this day the upper-level circulation had come to a near standstill. The damp accumulation hovered, almost motionless, and the rains
MONTANA
NEBRASKA
o 510 .--.,
mil"
SOUTH DAKOTA
50
FIGURE 12. The Black Hills region of South Dakota.

THE HYDROSPHERE 63
began to fall. The steep, rocky, 3S00- to 7000-ft-high Black Hills could not absorb the downpour. From near the foot of Mount Rushmore, the runoff picked up battering-ram force as it funneled through narrow canyons and dropped toward the grasslands to the east. Thundering against the back door of Rapid City, where 43,000 people lived, the flash flood crumpled a 34-year-old earthen dam and unleashed a rampaging S-ft-high wall of water through the heart of the town.
Before the rains stopped and the flood dissipated, 237 people had died, S were missing, and SOOO had been left homeless in a 30-mile-Iong, half-milewide path of destruction. Dozens of bridges were destroyed, SOOO cars were demolished or damaged, and 1200 homes and about 100 business buildings had vanished.
3-5 DRAINAGE OF WETLANDS
We often hear the cry "Save our wetlands, or we will damage our environment." Yet the Hollanders for centuries have been stimulated by an exactly opposite philosophy: "Recover our wetlands from the sea." They improved their fisheries and seafood production. Wetland areas are highly variable with changes of season, rain, hail, snow, tides, and ocean currents, so much so that in Virginia and Maryland they have had to be controlled in order to maintain the lobster, clam, crab and fish industries.
Since the early days of settlement, American farmers have drained land. 3
In 1763, the Dismal Swamp area of Virginia and North Carolina was surveyed by George Washington and others with a view to land reclamation and inland water transportation. The Dismal Swamp Canal Company was chartered, in 1787, by the two states. The canal was opened 7 years later. It is still a means of transportation and helps to prevent floods.
Early drainage works were also constructed in Delaware, Maryland, New Jersey, Massachusetts, South Carolina, and Georgia. Drainage work of concern to the public was carried out under the authority of colonial and state laws. Among the earliest laws are those of Maryland, in 1790, and Delaware, in 1816. The North Central states likewise became interested in land drainage shortly after settlement. Michigan and Ohio had drainage laws by 1847.
The early work which started in colonial days consisted primarily of constructing small open ditches to drain wet spots in fields, and of cleaning out small natural streams. Little engineering work was involved. In 183S, John
aWater, The 1955 Yearbook of the Department of Agriculture, Government Printing Office, Washington, D.C., 1956.

64 CHAPTER THREE
Johnson of Seneca County, New York, brought over, from Scotland, patterns from which clay tile was molded by hand and laid on his farm. This was the beginning of modem drainage in the United States.
Settlement of the Ohio and Mississippi valleys was just starting. Much of this land, though very fertile, could not be cultivated until it had been drained. Malaria was prevalent in large areas. Here the use of tile spread rapidly; 1140 tile factories, mainly in Illinois, Indiana, and Ohio, were in operation by 1880. More than 30,000 miles of tile had been laid in Indiana by 1882.
Farmers learned that the success of many tile systems depended on large outlet ditches. The construction of such ditches increased rapidly as the North Central states were settled. The Ohio Society of Engineers and Surveyors reported, in 1884, that 20,000 miles of public ditches had been constructed in Ohio, benefiting 11 million acres of land and improving the health of the citizens.
Drainage has added an estimated 25-30 million acres to the tillable areas in the North Central states, and has increased production on about 37 million acres more. Typical of the additions to the tillable land are large tracts in northwestern Ohio, northern Indiana, north central Illinois, north central Iowa, and southeastern Missouri. What the tracts were once like is described in the report on Long's expedition to the source of the Minnesota River in 1823, written by W. H. Keating, of the University of Pennsylvania, who accompanied the expedition. The Long expedition, undertaken by order of J. C. Calhoun, Secretary of War, sought information about the conditions in the country, then undeveloped, west of Pennsylvania.
Professor Keating described the land east of Fort Wayne, Indiana, thus:
Near to this house we passed the State line which divides Ohio from Indiana .... The distance from this to Fort Wayne is 24 miles, without a settlement; the country is so wet that we scarcely saw an acre of land upon which settlement could be made. We travelled for a couple of miles with our horses wading through water sometimes to the girth. Having found a small patch of esculent grass (which from its color is known here as bluegrass) we attempted to stop and pasture our horses, but this we found impossible on account of the immense swarms of mosquitoes and horse flies which tormented both horses and riders in a manner that excluded all possibility of rest.
He also described the land south and west of what is now Chicago:
From Chicago to a place where we forded the Des Plaines River the country presents a low, flat and swampy prairie, very thickly covered with high grass, aquatic plants, and among others, the wild rice. The latter occurs principally in places which are under water; its blades floating on the surface of the fluid like those of the young domestic plant. The whole of this tract is overflowed during the spring and canoes pass in every direction across the prairie.

THE HYDROSPHERE 65
Drainage changed those conditions. Today, the traveler who notes the well-cared-for, productive fields, the substantial farm buildings, the good roads, and the splendid school buildings, may not think that drainage made possible many of the developments, that without drainage the localities would be much the same as Keating described them in 1823. In both areas there are now more miles of public outlet ditches and drains than there are miles of public highways.
The Swamp Land Acts of 1849 and 1850 were the first important federal legislation relating to land drainage. They were the result of more than 20 years of discussion in the Congress of appropriate procedures for initiating reclamation of the wetlands of the public domain. For more than 75 years they were almost the only statement of federal drainage policy. Under the acts, vast acreages of swamp and overflowed lands were transferred to the states on the condition that funds from their sale be used to build the drains and levees necessary to reclaim them.
Under the Swamp Land Acts of 1849, 1850, and 1860, approximately 64 million acres of swamp and overflow land in 15 states were turned over to the respective states to facilitate reclamation of the land for agricultural use. No important reservations were attached to this transfer, and the states were free to dispose of the land as they saw fit. In that way the Federal Government relinquished control of most of the potential drainage work in the public domain.
It has become common practice to dismiss as failures the drainage and flood-control projects started under the Swamp Land Acts. It is true that for the most part the states did not immediately develop the land as anticipated. But that is not the whole story.
Over the lower Mississippi Valley states, where administration and use of swampland funds was a major political, economic, and social issue for more than 30 years, reclamation carried out under the Swamp Land Acts permanently affected the agricultural economy. The experience in flood control and drainage engineering gained in trying to meet the provisions of the grants formed the basis for the elaborate drainage projects later undertaken by local districts and by the states and the Federal Government for control of floods in the lower Mississippi Valley. Likewise, most of the legal and administrative concepts and machinery set up under the Swamp Lands Acts became a permanent part of flood-control and drainage practices.
Disastrous floods occurred frequently from 1850 through 1900. Loss of life and property led to increased expenditures for flood-control work each year. Flood-control improvements in time grew to an impressive size. With their increasing enlargement, waves of optimism found expression in the development of new land. By 1900, it appeared that public reclamation work

66 CHAPTER THREE
should include land drainage as well as levee building. Soon the landscape of much of the Delta region was altered through drainage activities initiated and financed through the creation of local drainage districts under state laws.
Drainage is a land improvement and cultural practice on about 2 million farms. The agricultural census of 1950 reported nearly 103 million acres of land in organized district and county drainage enterprises in 40 states. More than $900 million, or an average of about $9 per acre, has been expended on public drainage improvements on the 103 million acres, which is larger than the combined areas of Ohio, Indiana, and Illinois. More than 155,000 miles of outlet ditches, 56,000 miles of main-outlet tile drains, 7800 miles of levees, and pumping plants of more than 110,000 horsepower have been constructed. The enterprises range in size from less than 100 acres to more than I million acres; they average about 7300 acres. Of the 103 million acres in drainage enterprises, some 15 million acres are still too wet for cultivation; crop losses are frequent on an additional 10 million acres because of poor drainage.
The map, Figure 13, and Tables 24 and 25 show where the drained lands are located and the rate at which drainage is done. Land in organized drainage enterprises is largely in the Com Belt, the Lake States, and the Mississippi Delta. Between 1920, when the first census of drainage was taken, and 1950, the greatest increase of land in drainage enterprises occurred in the Delta and the Com Belt states. The southeastern region had a high proportional increase. The relatively little drainage work done in the western states has been mostly in connection with irrigation.
The millions of acres, once too wet to be cultivated and since reclaimed, now rank among the most valuable agricultural areas of the country. Additional millions of acres, where crop losses were frequent, owing to inadequate drainage, now produce well.
In southeastern Missouri one drainage district of 400,000 acres, with other smaller districts, covers much of the agricultural area of five counties. In 1909, before drainage, the only land under cultivation consisted of small patches along streams. Less than 5% of it was cultivated, and the rest was swampland. Drainage work was started about 1912. Now, 95% of the area is under cultivation and includes some of the most valuable land in Missouri.
Drainage has added 50-60 million acres of fertile swampland to the cultivatable areas of the United States, and cultivation has been increased on an additional 75-100 million acres. An estimated 20 million additional acres of fertile undeveloped land needs to be drained if farmland is to be developed from it. Roughly 7 million acres of this drainable land is found in the fertile bottomlands of the Mississippi River, in Arkansas, Louisiana, and Mississippi. Another 7-8 million acres are scattered in the Coastal Plains and other parts of the Southeast. But if this acreage were shown on the map in Figure 13, the dark, dotted space would be increased by about one-fifth; in the

THE HYDROSPHERE 67
'. ",
ii 1) :» !l ii 5 -2 2 ii a 3
""" ,2
r .;
to u .... 0 c .... M :> II) M 2 Q) L. .... oo~ n:I .... 00
(J') co -0 N~ Q)
.'!:' 0 c: ......
:::>

68 CHAPTER THREE
Southeast it would probably be more than doubled. Not all wetland is suitable for drainage. At least 75 million acres of wetland in the United States are unsuited for agriculture under present conditions, but they can be used for wildlife, forests, and recreation. Tables 24 and 25 give statistical data.
The Okefenokee Swamp and the Everglades are areas unsuited to drainage for agriculture. The Okefenokee is an oasis of primitive beauty (in the eyes of a naturalist) and is some 680 square miles in area. It is a realm of stately cypress trees, peat quagmires, and dim waterways. There are sandy pine islands, sunlit prairies, and clear lakes, with alligators in the fastnesses of the swamp, and serpents, a wide variety of amphibians, black bear, little deer, bobcat, and raccoon. Humans are welcome only as visitors: Okefenokee is a national preserve.
Table 24. Acreage of Land in Organized Drainage Enterprises Regions and by Specified Years, 1920-1950
Area in thousands of acres
Changeb
RegionU 1920 1930 1940 1950 1940-1950
Northern Northeastern 0 0 578 744 166 Lake States 19,757 21,548 20,730 21,979 1,249 Corn Belt 28,924 32,700 32,194 35,194 3,000 Northern Plains 2,164 2,929 3,227 3,457 230
Total 50,845 57,177 56,729 61,374 4,645
Southern Appalachian 1,265 1,873 1,908 2,750 842 Southeastern 1,843 6,247 6,016 6,506 490 Mississippi Delta 7,347 11,275 11 ,703 19,886 8,183 Southern Plains 2,178 3,054 4,416 6,096 1,680
Total 12,633 22,449 24,043 35,238 11,195
Western Mountain 810 1,970 2,773 2,671 -102b Pacific 1,207 2,812 3,422 3,405 -17b
Total 2,017 4,782 6,195 6,076 -119b
United States 65,495 84,408 86,967 102,688 15,721
Source: Bureau of the Census: Census of Agriculture, 1950, Drainage of Agricultural Lands. vol. 4, 1950. ulncIuding irrigation enterprises that have their own drainage. bDecrease indicated by minus sign.

THE HYDROSPHERE 69
Table 25. Drainage Development and Use of Land in Drainage Enterprises in the United States to 1950
Area in thousands of acres
Land in all In planted Year enterprises Drained Improved crops
Before 1870 171 150 133 97 1870-79 428 404 373 288 1880-89 2,429 2,267 2,173 1,865 1890-99 3,743 3,500 3,256 2,482 1900-04 5,769 5,414 5,134 3,814 1905--09 12,192 11,081 10,340 7,652 1910-14 19,573 14,138 12,281 9,006 1915-19 18,012 16,262 14,067 10,268 1920-24 11,272 10,028 8,848 6,480 1925-29 7,411 6,824 6,188 4,511 1930-34 2,093 1,974 1,788 1,326 1935-39 3,874 2,962 2,808 1,824 1940-49 15,721 14,749
Total to 1950 102,688 82,138
Source: Bureau of the Census, Drainage of Agricultural Lands [1940], 1942 .. Drainage of Agricultural Lands, vol. 4,1952.
3-6 GLACIERS
When snowfall exceeds loss by evaporation, the remaining snow compacts into ice by pressure. The resulting mass may descend slowly, as a glacier, or more swiftly in ice falls or avalanches. On steep slopes the foundation is unstable from spring rains and blowing winds, and the mass descends. Avalanches are thus masses of snow mixed with ice, soil, pebbles, and boulders which reach a condition of instability and slide down a mountain slope with destructive force. Thunderstorms, and skiers whb disobey the avalanche patrol, may also cause avalanches. Air displacement causes strong winds sufficient to uproot trees adjacent to the course of the avalanche. Everywhere we have learned to live with avalanches and keep them under control. In the Alps, rifle shots, small artillery, and even dynamite are employed to trigger avalanches, thereby removing their menace. They occur in the high mountain areas of the Alps in Europe, the Andes, the Himalayas, the northern United States (Glacier National Park on the Canadian border), and Alaska, as well as in the Arctic and Antarctic, Greenland, Iceland, Siberia, and eastern USSR.

70 CHAPTER THREE
The limit above which snow remains throughout the year is called the snow line, and varies from 15,000-16,000 ft in the tropics and in the Peruvian, Bolivian, and Chilean Andes, to sea level in the Polar regions.
The Alpine types of glacier have been studied for a long time. Owing to the weight of accumulated snow on gentle slopes in the high mountain valleys and on the summits of dome-like peaks, the lower layers are compacted to dense, clear ice with a granular structure known as neve, or fim. The ice is stratified from falls of snow and melting between falls, and from thin layers of dust from the air or the melted snow. Debris interferes little with mountain climbers, but cracks in the ice or crevasses are dangerous. At the head of the clear ice granular structure is a large symmetrical crevasse lying a short distance from the exposed rock surface, where the rock has been disintegrated by frost action. The debris formed falls to the bottom of the crevasse to form a moraine.
Glaciers creep, with the greatest movement being in summer, depending on the size of the mass, the slope and smoothness of the valley floor, and the slope of the upper ice surface. The movement may be compared to a turgid stream, greatest in the center, in the upper layers, and in restricted channels.
In summer, when melting is greater than precipitation, the granular ice appears beneath the snow. This is the fim line, where boulders and debris come to the surface and large boulders sink, but flat rocks protect the ice from melting so that they are perched as in ice tables. Dust and small rocks absorb the sun's heat more quickly, so that the ice beneath them melts and they sink. The moraines increase as the glacier passes to lower altitudes. Finally, the ice sheet melts to water in which the rock burden sinks to form a series of mounds of the terminal moraine. The lower end of a valley glacier may advance and retreat over a period of two decades, depending on variations in climatic conditions, the severity of winters, the heat of summers, and other meteorological conditions.
The Alaskan glaciers consist of great valley glaciers that melt to form a large sheet of very slowly flowing ice. The Malaspina Glacier covers 1500 square miles, and has enough debris to support forests. Precipitation and evaporation loss are very closely in balance.
In Greenland, the greater part of the land is covered by an ice sheet sloping very gently to the coast. Valley glaciers occur only along the coast where rocky peaks protect the ice sheet. The moraines are not large and consist of rocks abraded from the underlying rock structure. Along stretches of the coast the ice forms vertical or overhanging cliffs. The Greenland Icecap is the source of a large number of icebergs during the summer. These drift to lower latitudes and gradually disappear by melting. But it is necessary to operate an iceberg patrol in the shipping lanes to warn of dangerous icebergs.

THE HYDROSPHERE 71
In some parts of the Himalayas the glaciers are reported to be retreating. Glaciers assisted by frost action on exposed rocks are important eroding mechanisms, resulting in pyramid-shaped mountain peaks, hanging and U-shaped valleys, and truncated spurs and steps in the valley floor from the deepening of valley glaciers. There are many other effects of retreating glaciers: perched blocks, clay beds, lateral and terminal moraines, old lake terraces, and a wide variety of lakes.
3-7 DESERTS
Once used only for uninhabited- "deserted" -places, the term desert is now commonly applied to regions characterized by meager rainfall, scanty vegetation, and limited human use. However, of the three types of deserts commonly recognized, only a few tropical deserts, such as the Libyan part of the Sahara, resemble the popular image of a hot, dry, sandy expanse. Middlelatitude deserts lie in the "rain-shadow" of a mountain barrier (e.g., the deserts in the southwestern United States) or deep within the moisture-starved interiors of continents (e.g., the Gobi). Polar deserts occur because moisture is "locked up" as ice and snow.
Civilizations have attacked the deserts from time immemorial with canals, irrigation, and reclamation. Present-day societies, which number among them all of the technologists, engineers, and scientists who ever breathed, 90% of whom are still living, have been particularly successful in reclaiming deserts, especially the Imperial Valley in the United States, which has been transformed into a major food granary (Table 26).
The Atacama and the Kalahire deserts in Chile are caused by their nearness to the sea, in that they are on a western coast in the lee of prevailing winds and a cold coastal current. The icy Humboldt current, reinforced by the upwelling of deeper water, cools the breezes reaching the high coastal mountains of the Andes, the ascent cooling them more than the land can warm them. The cloud banks and fogs seem to promise rain, but from Arica to Caldera there is less than 1 inch per year. When the Humboldt is displaced by a warm tropical water stream, there are years of disaster. In the years of EI Niiio (Spanish for "Christ Child at Christmas") torrential rains are let loose on the dust-dry desert hills of the Peruvian Coasts. The soil washes away, the mountain stones roll, the mud and adobe huts disintegrate, and crops are ruined. Their fisheries, among the world's richest, are wrecked when the cold water fauna sickens and dies in warm water. Birds and animals that eat fish to live, die, and wastes are rampant-far beyond human control or influence.

Des
ert
Ata
cam
a B
lack
Roc
k
Col
orad
o
Das
ht-i
-Kav
ir
Dea
th V
alle
y
Kar
a K
um
Kyz
yl K
um
Neg
ev
Nam
ib
Sah
ara
Tabl
e 26
. P
rinci
pal
Des
erts
of t
he W
orld
Loc
atio
n
Nor
ther
n C
hile
H
umbo
lt a
nd P
ersh
ing
Cou
ntie
s,
Nev
ada,
US
Ari
d re
gion
of
sout
heas
tern
Cal
ifor
nia
Iran
, fr
om C
aspi
an S
ea to
Per
sian
Gul
f E
aste
rn C
alif
orni
a an
d so
uthw
este
rn
Nev
ada
Asi
atic
US
SR
Kaz
akhs
tan,
US
SR
S
outh
ern
Isra
el
Sou
thw
est
Afr
ica
Nor
th A
fric
a, o
n th
e w
est
exte
nds
to
Atl
anti
c O
cean
Size
(ap
prox
)
600
mil
es l
ong
1000
squ
are
mil
es
200
mil
es l
ong,
m
ax.
wid
th 5
0 m
iles
30
0 m
iles
long
, 10
0 m
iles
wid
e 29
36 s
quar
e m
iles
1 IO
,OO
O s
quar
e m
iles
370
mil
es x
220
mil
es
4700
squ
are
mil
es
800
mile
s lo
ng,
30 to
10
0 m
iles
wid
e O
ver
3,00
0,00
0 sq
uare
mil
es
Com
men
ts
An
area
of
nitr
ate
and
low
cop
per
cont
ent
depo
sits
A
bar
ren
plai
n, d
evoi
d o
f ve
geta
tion
, fr
om i
ts s
ur
face
, al
kali
ne d
ust
is b
low
n in
to v
ast
clou
ds
by s
umm
er w
inds
In
clud
es I
mpe
rial
Val
ley
who
se s
oil
is hi
ghly
pr
oduc
tive
whe
n ir
riga
ted
Sali
ne s
wam
ps a
nd d
ry s
alt
area
s Y
ield
ed m
uch
bora
x (2
0-m
ule
team
) in
19t
h ce
ntur
y
Has
old
riv
er b
eds
of c
hann
els
or tr
ibut
arie
s o
f th
e A
mu
and
othe
r ri
vers
S
tati
onar
y sa
nds
wit
h sp
arse
veg
etat
ion
Bar
ren
expa
nses
of
sand
, no
w i
rrig
ated
, w
ith f
arm
s,
orch
ards
, an
d to
wns
; K
ing
Sol
omon
's m
ines
and
th
e D
ead
Sea
, so
urce
s o
f che
mic
als,
are
the
re
Lon
g na
rrow
des
ert
plai
n al
ong
Atl
anti
c C
oast
, pa
rall
el to
col
d B
engu
ela
curr
ent o
f th
e oc
ean
Nom
adic
her
ding
, pe
trol
eum
exp
lora
tion
and
oil
pr
oduc
tion
; th
e L
ibia
n an
d N
ubia
n D
eser
ts
incl
uded
j:j ~ ""t
l rr1 :0
~
:0 rn
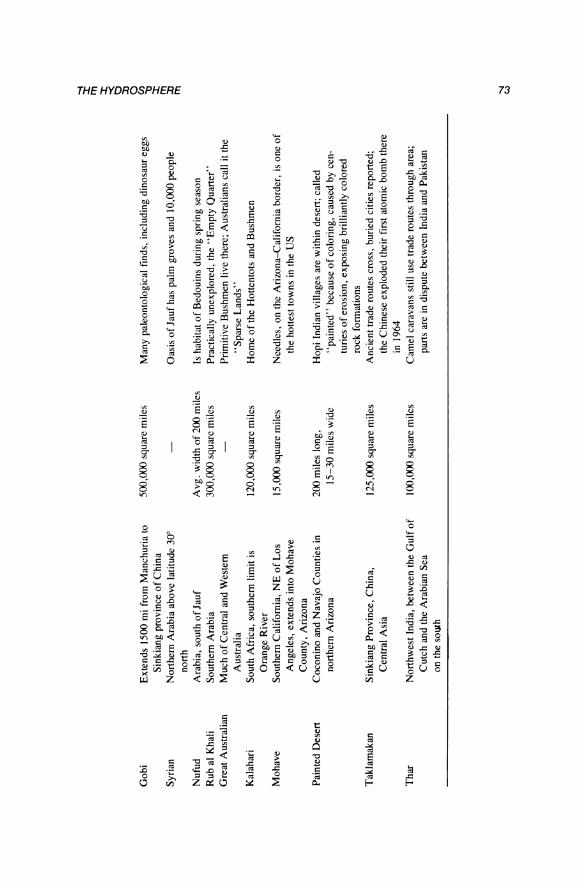
Gob
i
Syri
an
Nuf
ud
Rub
al
Kha
li G
reat
Aus
tral
ian
Kal
ahar
i
Moh
ave
Pai
nted
Des
ert
Tak
lam
akan
Tha
r
Ext
ends
150
0 m
i fr
om M
anch
uria
to
Sin
kian
g pr
ovin
ce o
f Chi
na
Nor
ther
n A
rabi
a ab
ove
latit
ude
30"
nort
h A
rabi
a, s
outh
of J
auf
Sou
ther
n A
rabi
a M
uch
of
Cen
tral
and
Wes
tern
A
ustr
alia
So
uth
Afr
ica,
sou
ther
n lim
it is
O
rang
e R
iver
S
outh
ern
Cal
ifor
nia,
NE
of
Los
A
ngel
es,
exte
nds
into
Moh
ave
Cou
nty,
Ari
zona
C
ocon
ino
and
Nav
ajo
Cou
ntie
s in
no
rthe
rn A
rizo
na
Sin
kian
g P
rovi
nce,
Chi
na,
Cen
tral
Asi
a
Nor
thw
est
Indi
a, b
etw
een
the
Gul
f of
Cut
ch a
nd t
he A
rabi
an S
ea
on t
he s
outh
500,
000
squa
re m
iles
A v
g. w
idth
of
200
mil
es
300,
000
squa
re m
iles
120,
000
squa
re m
iles
15,0
00 s
quar
e m
iles
200
mil
es l
ong,
1
5-3
0 m
iles
wid
e
125,
000
squa
re m
iles
100,
000
squa
re m
iles
Man
y pa
leon
tolo
gica
l fi
nds,
inc
ludi
ng d
inos
aur
eggs
Oas
is o
f Jau
f ha
s pa
lm g
rove
s an
d 10
,000
peo
ple
Is h
abita
t o
f B
edou
ins
duri
ng s
prin
g se
ason
P
ract
ical
ly u
nexp
lore
d, t
he "
Em
pty
Qua
rter
" P
rim
itiv
e B
ushm
en l
ive
ther
e; A
ustr
alia
ns c
all
it th
e "S
pars
e L
ands
" H
ome
of t
he H
otte
ntot
s an
d B
ushm
en
Nee
dles
, on
the
Ari
zona
-Cal
ifor
nia
bord
er,
is o
ne o
f th
e ho
ttes
t to
wns
in
the
US
Hop
i In
dian
vill
ages
are
wit
hin
dese
rt;
call
ed
•• pa
inte
d"
beca
use
of c
olor
ing,
cau
sed
by c
en
turi
es o
f ero
sion
, ex
posi
ng b
rill
iant
ly c
olor
ed
rock
for
mat
ions
A
ncie
nt tr
ade
rout
es c
ross
, bu
ried
citi
es r
epor
ted;
th
e C
hine
se e
xplo
ded
thei
r fi
rst
atom
ic b
omb
ther
e in
196
4 C
amel
car
avan
s st
ill u
se t
rade
rou
tes
thro
ugh
area
; pa
rts
are
in d
ispu
te b
etw
een
Indi
a an
d P
akis
tan
~
III :x: ~ II ~ ~ II
I ~

74 CHAPTER THREE
The importance of water to the creation and sustenance of every living thing was profoundly appreciated by the builders of civilization in the ancient Middle East. The vital role of the water cycle, by which the supply of water on the land is constantly replenished, and the loss of an adequate supply, resulted in the demise of many human settlements in the ancient world. Notable was the disappearance of the high civilizations of the "fertile crescent" in the Tigris and Euphrates River Valleys, the Persian Empire, and more recently the fall of the Roman Empire and the decline of the Arabian caliphates, which has been blamed on the more or less sudden decline in the amount of water available. Potentially prosperous regions of Africa, Asia, and Australia, stretching over millions of square miles in the tropical latitudes, presently have only a sparse population because of a lack of water.
In primeval days, the earth was devoid of atmosphere. The earth had no oceans, and its surface was covered with lava-emitting volcanoes, along with hydrogen and hydrogen-rich compounds and water vapor. Some water molecules were split by sunlight to hydrogen and oxygen. The hydrogen escaped, and the oxygen reacted with metals to form oxides and with ammonia and methane to form nitrogen and carbon dioxide. As the earth cooled, plants appeared, absorbing the carbon dioxide and liberating oxygen; water molecules condensed and formed the oceans. The amount of water on the earth can be considered to have been constant during the evolution of man.
Underground seas have been discovered in Iran, Arabia, and North Africa, where ancient peoples used these aquifers some 3000 years ago. They built a system of underground channels (qanats) for tapping underground water.4 The system was expanded under the Islamic caliphates to the Middle East and to North Africa. There were qanat networks of underground channels bringing water from the highland aquifers to the low lands by gravity, as is done in Iran today for three-quarters of its water needs.
Arabia found its underground water as a result of drilling for oil. The eastern region has seven aquifers in Cenozoic and Mesozoic strata. The gradient is west-east. The existence of underground water in large quantities under the Sahara has been confirmed. There are seven major storage basins, as shown in Figure 14, having a total area of 4.5 million km2 and 15.3 trillion m3
of water. The Western Desert basin of Egypt covers 1.8 million km2 and has a storage capacity of 6 million m3 •
The Great Eastern Erg of Algeria has an area of 375,000 km2 and 1.7 trillion ft3 of fossil water, gathered when the Sahara was a tropical region with heavy rainfall. The aquifer is now charged by flood rains from the Tell Mountains. The discharge occurs by evaporation from the Chott MelrhirDjerid, which is dry except during the rainy seasons. Its lowest point is 30 m below sea level and extends over an area of 10,000 km2 •
4H. E. WULFF, Scientific American, April, 1968.

THE HYDROSPHERE
TA EZROUFT
s A H A R A
FEZZA BASIN
o E S
KHARGA __ OASIS
E R '1
75
FIGURE 14. The Sahara Desert contains underground water resources concentrated in seven major storage areas. These are the Great Western Erg, the Great Eastern Erg, the Tanezrouft, the Niger, the Fezzan, the Chad, and the Western Desert basins. The total water storage is estimated to be 15.3 x 10¹² m3 •
Hummerstone5 has reported that Libya asked Occidental Petroleum, in 1967, to drill for water in the Libyan Sahara, and a subterranean reservoir was discovered. Rainfall is negligible and the temperatures reach 170°F. The aquifer is believed to extend hundreds of miles and to contain the equivalent of the Nile's flow for 200 years.
At Kufra, 300 miles south of the Mediterranean, a somnambulant oasis has 35 fields , each two-thirds of a mile across, and fed by irrigation from the aquifer. Because labor in the area was short, automation was needed . There is a single well in the center of each circular field, each with a diesel engine to pump the water. An overhead pipe 1850 ft long is connected to the wellhead and pivots around it, spraying water on the crop as it turns. Each irrigator is supported on wheels, every 230 ft of pipe. The pipe mechanism is driven by electric motors using current from a diesel-driven generator at speeds of one revolution per 20, 40, or 60 h.
The present 8500 acres are producing four crops per year of wheat and barley and 12 crops per year of alfalfa, with 130,000 acres projected. There are 250 acres in each circular unit. At the predicted rate of use the water table is expected to drop 115 ft in 40 years, or about 3 ft per year.
SR. D. HUMMERSTONE, Fortune, 1973 .

76 CHAPTER THREE
The water cycle over the planet is a distillation extending over the surface. The heating of the subtropical regions by solar radiation leads to a continuous evaporation of water to the atmosphere, removal by wind currents, and transportation-mostly in the lower half of the atmosphere-northward and southward into other latitudes.
During the process of transfer in the gaseous phase, some vapor condenses to form clouds because of cooling by expansion. These condense and precipitate over the equatorial, middle, and high latitudes. Clouds, rain, typhoons, rivers, and underground flow return the water to the oceans.
3-8 RECLAMATION
As the conservation arm of the Federal Government, the Department of the Interior defines its task in terms of the entire planet. From recreation to reclamation, from minerals to mallards, from water to wilderness, the various programs within the department must meet specific problems and still mesh with other efforts-efforts to preserve our historic past, to stretch our natural resource potential, and to restore, beautify, and enhance our overall environment.
Originally designated the Reclamation Service, the agency was created 6 decades ago to irrigate the dry lands of the West and make them capable of settlement. By building those arid acres into a viable economy, reclamation served not only to benefit that area but the entire nation.
As the water needs of America grew, the role of the bureau expanded. Bureau functions multiplied to include irrigation, hydropower generation, flood control, municipal and industrial water supply, water-quality improvement, outdoor recreation, and fish and wildlife enhancement.
Its whole method of operating changed as the ratio between human needs and natural resource supplies narrowed. More people require more food, more electricity, more water to drink and use in their homes, more water to work in their industries, and more recreation.
Gradually, the bureau became vitally concerned with all sources of water-water in natural waterways, ground water, moisture carried in the atmosphere, and the sea. In its early days it usually built only a single-purpose project on one site. Its operations presently include development of the entire length of a stream, then of a whole river basin. It is engaged now in interbasin development as the most efficient and most economical method of filling the nation's urgent need for water.
The regional approach to water resources is embodied in the Colorado River Basin project of the Bureau of Reclamation and others to solve the serious water-supply problems of a large section of the arid West. Benefits

THE HYDROSPHERE 77
have included irrigation, municipal and industrial supply, flood control, hydroelectric generation, water quality regulation, recreation, and fish and wildlife betterment. The comprehensive plan provides for construction of dams, power plants, and distribution systems to meet the needs of the basin area. The Colorado River Basin project is the joint creation of the states, the local entities of the area, and the Federal Government.
The 1966 period saw completion of 11 dams with reservoirs having a combined impoundment capacity of 2.8 million acre-feet of water. (One acrefoot equals approximately 326,000 gal.) A total of 457,200 kW of electric power generating capacity was installed, as were 900 miles of high-voltage transmission lines. Construction of 733 miles of canals, pipelines, laterals, and drains was also completed. These additions brought the number of reclamation dams to 248, capable of impounding 129.5 million acre-feet of water, enough to put New York State under nearly 4 ft of water. At the end of 1966, 17 dams were under construction, having a total reservoir capacity of 5 million acrefeet, 4 power plants, and 2 pump-generating plants, with a combined capacity of 917,200 kW, and with 623 miles of high-voltage transmission lines.
Ground water overdraft by pumping from the Arvin-Edison Water Storage District in the San Joaquin Valley has been averaging 200,000 acre-feet (nearly 65 billion gal) a year. A distribution system has now been constructed to convey surface water from the bureau's Friant-Kern Canal and will deliver enough water to halt the overdraft. Much of this water will be allowed to percolate into the soil to replenish the ground water aquifer, and some will be used for surface irrigation.
During 1966, the first 16-mile section of the San Luis Canal in California was completed and work began on the final reach of what will be one of the largest artificial rivers in America, capable of carrying about 100,000 gal of water per second. The concrete-lined canal conveys water southward 103 miles from the San Luis Dam near Los Banos to irrigate one-half million acres of land. The State will use it to carry over 1 million acre-feet of water annually for irrigation and municipal and industrial use, transporting the water by a state-owned canal still farther south across the Tehachapi Mountains to the southern California coastal area.
The San Luis Dam, completed in 1967, impounds more than 2 million acre-feet of water. The entire system, completed in 1970, has over 1000 miles of irrigation pipelines. Its costs are to be repaid by the water users under a $157,048,000 contract with the Westlands Water District-the largest such contract in the history of reclamation. Water for this distribution system is imported from northern California via facilities of the Central Valley project, with structures of the San Luis Unit providing the final link.
Within the upper Colorado Basin project, the river has been developed in a 11O,5OO-square-mile area, embracing parts of Colorado, Utah, Wyoming, New Mexico, and Arizona.

78 CHAPTER THREE
On the Curecanti Unit in southeastern Colorado, Blue Mesa Dam was constructed, a 340-ft-high earthfill structure, with a 60,000 kW power plant, plugging the Gunnison River. By 1967, 465-ft-high Morrow Point Dam, 12 miles downstream and with an underground 120,000-kW power plant, was completed.
Because of the mountainous terrain of the Colorado River Basin, much of the reclamation work there required tunneling to divert water from one watershed to another. In 1905, the Bureau started a tunnel to transport Gunnison River water through a rocky ridge to the Uncompahgre Valley in Colorado.
Reclamation's development of the lO-state Missouri River Basin project began with the Garrison Diversion Unit. Water from the Garrison Reservoir behind Garrison Dam, on the mainstem of the Missouri River in central North Dakota, provides irrigation for 250,000 acres in the state.
Since 1967, the Canadian River project in Texas has supplied 11 cities in the panhandle region of that state. The project includes Sanford Dam on the Canadian River and a 322-mile pipeline distribution system.
A fundamental feature of the reclamation program is that, to a large extent, the direct beneficiaries of a project pay for it. Nearly 90% of the cost of constructing multimillion-dollar developments to conserve water for the use and enjoyment of all the people is repaid to the U.S. Treasury in cash. Federal investment for power and for municipal and industrial water facilities is repaid, with interest, by electricity and water users, and that for irrigation features is repaid in full, but without interest. About one-half of the cost of irrigation elements is borne by the water users and the remainder is repaid through the sale of surplus power and from other revenues after costs allocated to power and additional reimbursable purposes have been met.
National recreation areas are at reclamation reservoirs, examples of which are: Bighorn Canyon, in Montana and Wyoming: Whiskeytown-ShastaTrinity, in California; Rocky Mountain, in Colorado; Lake Mead, in Arizona and California; and Coulee Dam, in Washington.
Because much of the water in the western states comes from the melting of winter snow-pack in the mountains, the bureau's primary research during the year concentrates on precipitation induction (cloud seeding) of mountain-cloud systems. Since summer thunderstorms are a major source of moisture for the Great Plains, the researchers also study the characteristics of convective cloud (thunderstorm) systems.
One facet of weather modification research is the development of instruments to transmit meteorological and hydrologicai information from remote or inaccessible sites to a central point where the facts can be analyzed. Aircraft equipped with intricate instruments obtain needed data from within the clouds.
The resource needs of underdeveloped countries are virtually identical to those of the United States. However, they generally are more immediate and

THE HYDROSPHERE 79
intense. Such nations lack the knowledge and training necessary for creating and operating water-supply systems for agricultural, human, and industrial consumption, and for power generation.
Ladurie6 traces the history of climate since the year A.D. 1000. Olive growing moved northward from 1550 to 1600 because growers were seeking expanding markets, but actually it was a time of colder climate. Ladurie states that late medieval reductions in grape growing resulted from plagues and the disruptions of war, causing high labor costs.
In France and Germany, early harvests were the result of warm springs and summers associated with anticyclonic conditions. Late harvests resulted from cool springs and summers with cloudy cyclonic periods. Vintage dates and wine quality were related to meteorological conditions. Ladurie records that Germany had warm summers from 1453 to 1552, and that from 1552 to 1600 weather was unfavorable for wine production.
That man lives and is dependent on water on our water planet is illustrated in the 1970 report of Estimated Use of Water in the United States, which is updated every five years. 7
Water use in the United States in 1970 averaged about 370 bgd (billion gallons per day), or about 1800 gal per capita per day. This amount was withdrawn for the four principal off-channel uses, which are (1) public supplies (for domestic, commercial, and industrial uses), (2) rural supplies (domestic and livestock), (3) irrigation, and (4) self-supplied industry (including thermoelectric power). In 1970, withdrawals exceeded the 310 bgd estimated for 1965 by 19%. Increases were, approximately: 25% for self-supplied industry (mainly in electric utility thermoelectric plants), 13% for public supplies, 13% for rural supplies, and 8% for irrigation. Industrial water withdrawals included 54 bgd of saline water, a 20% increase in 5 years. Hydroelectric power, (an in-channel use) amounted to 2800 bgd, a 5-year increase of 22%. The quantity of fresh water consumed-Le., water made unavailable for further possible withdrawal because of evaporation, incorporation in crops and manufactured products, and other causes-was estimated to average 87 bgd for 1970, an increase of about 12% since 1965.
Estimates of water withdrawn from the principal sources indicated that 68 bgd came from fresh ground water, 1 bgd came from saline ground water, 250 bgd came from fresh surface water, 53 bgd came from saline surface water, and 0.5 bgd was reclaimed sewage.
The average annual streamflow-a simplified measure of the total available water supply-is approximately 1200 bgd in the coterminous United States. Total water withdrawn in 1970 for off-channel uses (withdrawals other
6E. L. LADURIE, Times of Feast, Times of Famine, translated from French by Barbara Bray, Doubleday, Garden City, New York, 1971,426 pp.
7U.S. Geological Survey Circular 676, U.S. Gov't Printing Office, Washington, D.C.

80 CHAPTER THREE
than for hydroelectric power) amounted to about 30% of the average annual streamflow; 7% of the 1200 bgd basic supply was consumed. However, comparisons of Water Resources Council regions indicate that the rate of withdrawal was higher than the locally dependable supply in the Middle Atlantic, Texas-Gulf, Rio Grande, Lower Colorado, and California-South Pacific regions. Consumption amounted to nearly 25% of withdrawals in the coterminous United States; however, fresh water consumption amounted to only 14% of off-channel withdrawals in the 31 eastern states and ranged from 30% to nearly 70% of off-channel withdrawals in the Water Resources Council regions in the West. In the Rio Grande and Lower Colorado regions, freshwater consumption in 1970 exceeded the estimated dependable supply of fresh water.
Interpreting from Figure 15, the per capita use in potable water is of the order of 180 gal per day, and for all uses 1800 gal per person per day. (See also Figures 16 and 17; Tables 27 and 28.)
3-9 GEYSERS
In many places, faults in the earth's crust have allowed molten magma from the planet's interior to intrude near the surface. In some of these areas, ground water percolating down into the earth comes into contact with the hot solidifying magma. If the heated water rises to the surface, it is manifested as hot springs, geysers, or fumaroles. Wells have been drilled in these to produce steam or hot water for the generation of electric energy. The world's first and largest geothermal power plant is near Lardarello, Italy.s There, 380,000 kW of geothermal power are generated using steam from a vapor-dominated geothermal reservoir. 9 On New Zealand's North Island, a 175,000-kW generating capacity is installed using the energy of hot water from the Wairakei geothermal field. 10 A third facility, a 75,000-kW power plant being built near Mexicali, Baja California, Mexico, will use steam flushed from hot brine that has about the same salinity as seawater.
Finneyll, of Pacific Gas and Electric Company, has described the Geysers geothermal power plant on a resort site featuring mineral baths. It is now the only United States geothermal plant, which by 1974 became the largest of its kind in the world. Located in a mountainous area some 80 miles north of San Francisco, its six turbine generator units have a total net capacity of
81. BARNEA, Scientific American, 226: 70 (1972). 9D. E. WHITE, L. 1. P. MUFFLER, and A. H. TRUESDELL, Economic Geology 1: 66, 75 (1971).
IOPower from the earth: The story of the Wairakei Geothermal Project. New Zealand Ministry of Works, 1970.
111. P. FINNEY, Chemical Engineering Progress, 68: 83-86 (1972).

THE HYDROSPHERE
><t:
380,000
360,000
o 340,000 a: w ~ 320,000 z o ::l 300,000 <t: t:J u.. 280,000 o en ~ 260,000
...J
...J 240,000 ::2: z -:. 220,000 a: w 3: 200,000 o e.. a: w I<t: 3: t:J Z
180,000
160,000
Q 140,000 ::::> ...J
~ 120,000 w
~ 100,000 <t: ~ 80,000 J: l-§: 60,000 a: w !;j: 40,000
3: 20,000
380
360
340
320
w t 300 o w e.. 280 u.. o ~260 o ...J ...J 240 ::2:
~220
60
40
20
Per capita use of public water supplies (Scale at right)
Water withdra:~~~~~~~i~~te~r...:s~u~pp~l~ie:::s:..-___ --(Scale at far left)
81
1,900
1,800
1,700
1,600
1,500 ~
1,400 ~ w e..
1,300 <t: le..
1,200 5 a:
1,100 ~ en Z
1,000 g ...J
900 ~
BOO
700
600
soo
400
300
200
100
z
z ~ a: o J: l-§: a: w I<t: 3:
o OL-L-______ -L ________ J-________ L-______ -J-...JO
1950 1955 1960 1965 1970
FIGURE 15. Trends in population and withdrawals of water in the United States, 1950-70.

Tab
le 2
7.
Cha
nges
in W
ater
With
draw
als
and
Con
sum
ptio
n in
the
Uni
ted
Sta
tes
(bill
ion
gallo
ns p
er d
ay,
1950
-70)
1950
19
55
1960
19
65
Tot
al p
opul
atio
n (m
illi
ons)
15
0.7
164
179.
3 19
3.8
Pub
lic
supp
lies
14
17
21
24
R
ural
dom
esti
c an
d li
vest
ock
3.6
3.6
3.6
4.0
Irri
gati
on
110"
11
0 11
0 12
0 T
herm
oele
ctri
c po
wer
(el
ectr
ic u
tility
) us
e 4(
)b
72
100
130
Oth
er s
elf-
supp
lied
ind
ustr
ial
use
37b
39
38
46
Tot
al w
ithd
raw
als
200
240
270
310
Fre
sh g
roun
d w
ater
34
47
50
60
S
alin
e gr
ound
wat
er
0.65
0.
38
0.47
F
resh
sur
face
wat
er
160c
18
0 19
0 21
0 S
alin
e su
rfac
e w
ater
IO
C 18
31
43
R
ecla
imed
sew
age
0.2
0.1
0.7
Wat
er c
onsu
med
by
off-
chan
nel
uses
61
77
W
ater
use
d fo
r hy
droe
lect
ric
pow
er
1100
15
00
2000
23
00
aInc
ludi
ng a
n es
tim
ated
30
bgd
in i
rrig
atio
n co
nvey
ance
los
ses.
bE
stim
ated
dis
trib
utio
n o
f77
bgd
rep
orte
d by
Mac
Kic
han
(195
1).
cOis
trib
utio
n o
f 17
0 bg
d o
f fr
esh
and
salin
e w
ater
rep
orte
d by
Mac
Kic
han
(195
1).
~
Per
cent
ch
ange
19
70
1965
-70
203.
2 5
27
13
4.5
13
130
8 17
0 33
47
2
370
19
68
13
1.0
113
250
19
53
23
0.5
-29
87
13
28
00
22
()
~ "tJ
.~
:0 :t :0
~

Table 28. United States Self-Supplied and Irrigation Water Withdrawals (million gallons per day)
Self-supplied Irrigation water State industrial water withdrawals withdrawals
Alabama 6,100 18 Alaska 180 0.9 Arizona 220 6,300 Arkansas 1,500 1,300 California 11,000 33,000 Colorado 320 13,000 Connecticut 3,100 5.9 Delaware 5,200 76 Florida 12,000 2,200 Georgia 4,600 47 Hawaii 1,300 1,300 Idaho 450 15,000 Illinois 13,000 21 Indiana 8,000 25 Iowa 1,700 26 Kansas 420 3,000 Kentucky 4,200 7.1 Louisiana 7,000 1,600 Maine 620 8.9 Maryland 4,600 6.6 Massachusetts 3,400 58 Michigan 11,000 58 Minnesota 2,900 20 Mississippi 1,500 370 Missouri 2,800 77 Montana 210 7,600 Nebraska 990 4,700 Nevada 140 3,000 New Hampshire 600 2.8 New Jersey 5,200 76 New Mexico 110 2,800 New York 15,000 27 North Carolina 5,200 82 North Dakota 370 190 Ohio 17,000 31 Oklahoma 360 820 Oregon 720 4,800 Pennsylvania 18,000 10 Rhode Island 350 4.5 South Carolina 3,000 29 South Dakota 190 230 Tennessee 5,900 4.2 Texas 15,000 10,000 Utah 290 3,600 Vermont 51 0.1 Virginia 5,000 35 Washington 600 5,600 West Virginia 5,600 1.3 Wisconsin 5,600 52 Wyoming 310 5,400

84
Not. : Ar.a of <:lr<:le Ind lc;ates water use.
o 400
100 million • lIalions per d.y
............... MII ••
(2) 1,000 million
""Ion. p.r d.y
400 ·M il e.' I
CHAPTER THREE
EXPLAN ATION
R.tum~p.rt flow V consumed
10,000 million lIelion•
per dey
PUERTO RICO
o 80 .........--....MII ••
FIGURE 16. Irrigation water withdrawals by United States regions, 1970.
184,000 kW. These units use steam directly from a geothermal dry-steam reservoir similar to the Lardarello steam field. The Geysers area extends along a steep, narrow canyon of Big Sulfur Creek, a tributary of the Russian River . As the name implies, the area has long been noted for its natural steam vents, or fumaroles, hot mud pots, and brilliantly colored rock formations altered from geothermal activity .
In the 1860s, a resort was built to take advantage of the Geysers' natural steam vents for hot mineral baths. In the early 1920s a group of area businessmen formed the Geysers Development Company to try to develop electric power. Eight shallow steam wells were drilled. They were productive, but at that time undeveloped hydroelectric power potential was lower in cost and so plentiful in California that power production at the Geysers was uneconomical.

THE HYDROSPHERE
NOle: Area 0' circle Indlcales waler use.
o 400
o 100 million gallons
per day
(!) 1,000 million gallons per day
, <J IT\
o 150 ~Miles
• Kaual t::;.V MOIOk4ll1 04llhu C:;:s:::> Maul
HAWAII Haw;IID
----Miles
EXPLANATION CJart consumed Relurn flow
10,000 million gallons per
day
PUERTO RICO
o 80 Miles
FIGURE 17. Self-supported water withdrawals by United States regions, 1970.
85
Two small reciprocating steam engine sets installed for lighting at the resort became the first authentic geothermal power plant in the United States.
In 1955, the Magma Power Company obtained leases on most of the property around the original steam wells. Engineering studies followed which showed that a small turbine generator unit could be installed and operated economically if the steam price was about 2 .5 mills per kWh. There are now II widely distributed units in a rectangle measuring 4 miles x 2 miles . The generation of electric power has proven commercially successful at the Geysers. Power production costs there compare favorably with those of PG&Es latest supercritical fossil units.
Attention to design, operation, and maintenance has overcome problems associated with particulate matter in the steam and the corrosiveness of the

86 CHAPTER THREE
condensate. Additional generating capacity is scheduled each year to total 502,000 kW, making the Geysers power plant the largest geothermal power installation in the world. Beyond that, additional capacity will continue to be installed as additional steam reserves are developed.