
The Hydrogen Remote-Control Car: The Future of TransportationThe Hydrogen Remote-Control Car: The...
40
The Hydrogen Remote-Control Car: The Future of Transportation Jonathan Melgar 1 Abstract Fossil fuels are rapidly depleting and the world is in need of an alter- nate means of obtaining energy, especially in the automotive industry. A possible solution is hydrogen, the most abundant element in the uni- verse. Hydrogen fuel cells take hydrogen and create energy, and can be stacked in series to produce the maximum amount of power. In this project I discovered that fuel cells can emit just as much power as reg- ular batteries and are reusable as well. If hydrogen fuel is established in the automotive industry, the use of petroleum can be obsolete. is would not only alleviate the United States’ dependency on foreign oil, but also aid the environment by significantly lowering the emission of greenhouse gases. 2 e Big Idea e modern world is no longer a collection of isolated, self-sufficient agrarian societies. Rather, it has become an industrial environment that revolves around cities and the intensive use of fossil fuels. A fossil fuel is a fuel formed by natural resources such as the decomposition of plants and animals that lived over 300 million years ago. [1] ese produce energy through the process of combustion, but this energy is not re- newable and is running out. Over 85% of U.S. energy demands are met by the combustion of fossil fuels. [2] In other words, fossil fuels have become the lifeblood of our economy. What is going to happen when they run out? at is the true problem facing society. e answer to energy needs may come in the form of green energy: energy that is sustainable, renewable, and most importantly does not is paper was written for Dr. James Dann’s Applied Science Research class in the spring of 2010.
Transcript of The Hydrogen Remote-Control Car: The Future of TransportationThe Hydrogen Remote-Control Car: The...
The Hydrogen Remote-Control Car: The Future of Transportation
Jonathan Melgar
1 Abstract
Fossil fuels are rapidly depleting and the world is in need of an alter-nate means of obtaining energy, especially in the automotive industry. A possible solution is hydrogen, the most abundant element in the uni-verse. Hydrogen fuel cells take hydrogen and create energy, and can be stacked in series to produce the maximum amount of power. In this project I discovered that fuel cells can emit just as much power as reg-ular batteries and are reusable as well. If hydrogen fuel is established in the automotive industry, the use of petroleum can be obsolete. This would not only alleviate the United States’ dependency on foreign oil, but also aid the environment by significantly lowering the emission of greenhouse gases.
2 The Big Idea
The modern world is no longer a collection of isolated, self-sufficient agrarian societies. Rather, it has become an industrial environment that revolves around cities and the intensive use of fossil fuels. A fossil fuel is a fuel formed by natural resources such as the decomposition of plants and animals that lived over 300 million years ago. [1] These produce energy through the process of combustion, but this energy is not re-newable and is running out. Over 85% of U.S. energy demands are met by the combustion of fossil fuels. [2] In other words, fossil fuels have become the lifeblood of our economy. What is going to happen when they run out? That is the true problem facing society.
The answer to energy needs may come in the form of green energy: energy that is sustainable, renewable, and most importantly does not
This paper was written for Dr. James Dann’s Applied Science Research class in the spring of 2010.
harm the environment. One may argue that green energy cannot pro-duce as much energy as fossil fuels, and currently that is true, but in the future green energy could possibly top the charts of our energy con-sumption. Technology is improving day by day, and already one aspect of green energy that will never be met by fossil fuels is the fact that green energy is renewable. The investment in green energy isn’t just a matter of power, but rather a matter of the preservation of humanity and the way of life we have become accustomed to.
The work described in this paper focuses specifically on transportation and how cars, something that almost everyone in the world has or will have in the near future, can be the foundation of a shift to a green world. Currently cars use gasoline, a by-product of petroleum, to power their motors. But petroleum is a fossil fuel and a source of greenhouse gases, and we are rapidly depleting its supply. The answer to this might come in the form of the most abundant resource in the universe, hydrogen. While it doesn’t exist in its pure form on earth, we can produce it by means of electrolysis and a device called a fuel cell. [3]
3 Introduction
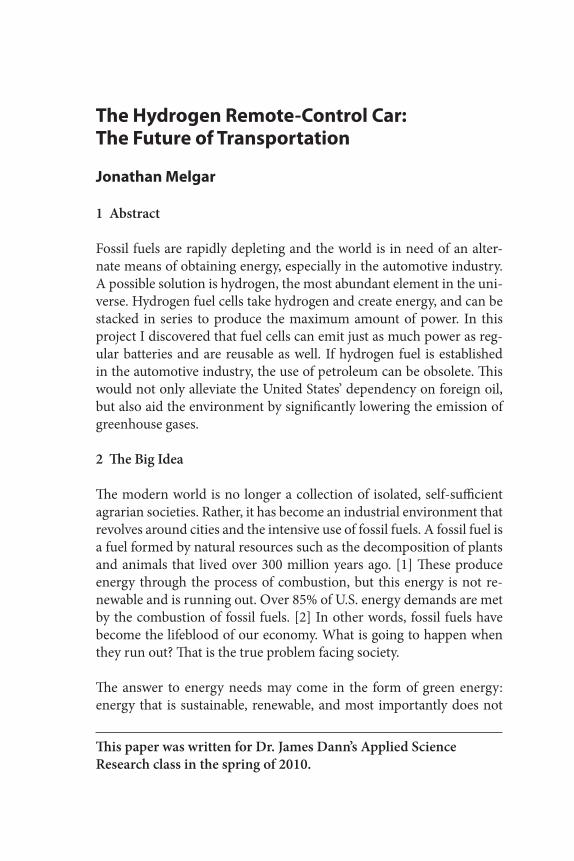
Facing a fossil fuel shortage, global warming caused by greenhouse gases, and the consequent threat to our urbanized, industrial way of life, the world needs to find alternative resources to take the place of petroleum. But first let’s explore the problem. In 2000 the United States consumed more energy than it produced, meaning that we had to sup-plement domestic production with imports, especially of crude oil. [5]
98 Jonathan Melgar
THE MENLO ROUNDTABLE 99
Figure 1: 2000 U.S. energy overview. The U.S. produced 72 quadrillion Btu of energy, exported 4 quadrillion Btu, consumed 98 Btu, and required imports of 29 quadrillion Btu. [5] (For full-color versions of all figures, go to http://roundtable.menloschool.org.)
On the other hand, in what sectors is this energy being consumed?
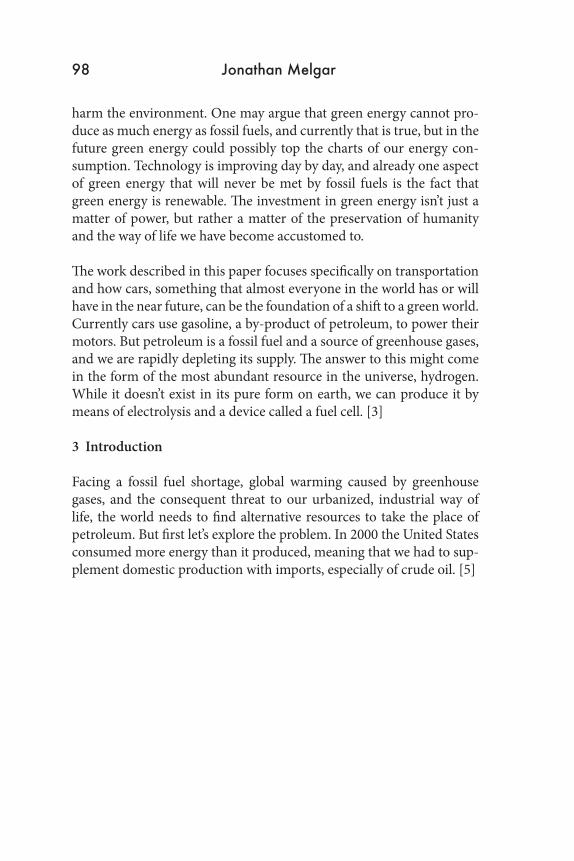
Figure 2: 2000 energy consumption by end use in four major sectors: industrial, transportation, residential, and commercial. The largest share goes to industry, but use by all four categories is increasing steadily over time. [5]
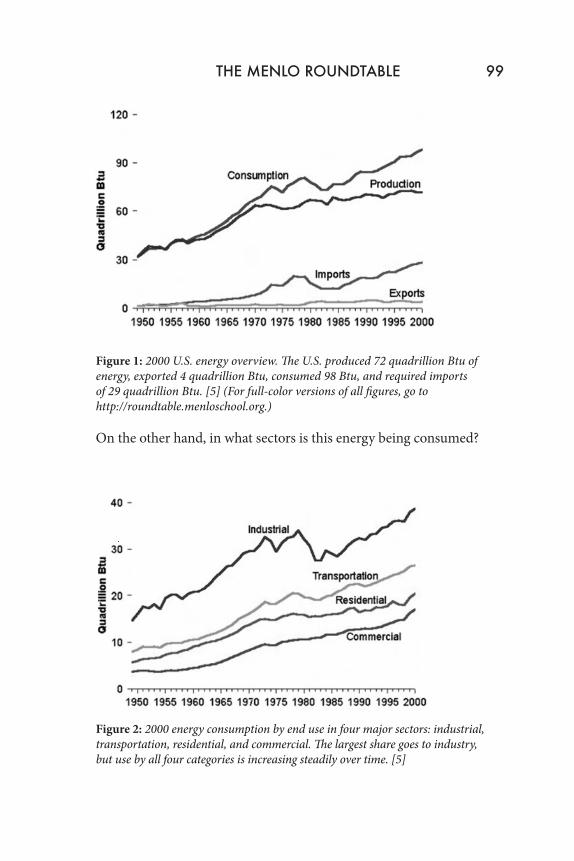
Figure 3: 2000 industrial energy consumption. Topping the charts are petroleum and natural gas, which both are fossil fuels. About three-fifths of the energy consumed in the industrial sector is used for manufacturing. [5]
As noted in Figure 2, the majority of U.S. energy consumption is in industry, which is not a surprise for an industrial nation. The major re-sources that power industries are petroleum and natural gas, which are both fossil fuels. Ultimately the United States is dependent on foreign petroleum to power its economy, the use of which also contributes to greenhouse gases and global warming.
Over the last few years, the temperature of the earth’s surface has gradu-ally risen along with the amount of carbon dioxide in the atmosphere. The gradual rise in both is having an all too visible impact on the en-vironment: an example is the melting of the polar ice caps. The com-bustion of petroleum and other fossil fuels that drives modern society produces carbon dioxide, methane, nitrous oxide and other greenhouse gases. These gases enter the atmosphere and emit infrared radiation that cause the temperatures to rise. [6] If not halted, this trend could devastate human societies and even wipe them out entirely.
100 Jonathan Melgar
THE MENLO ROUNDTABLE 101
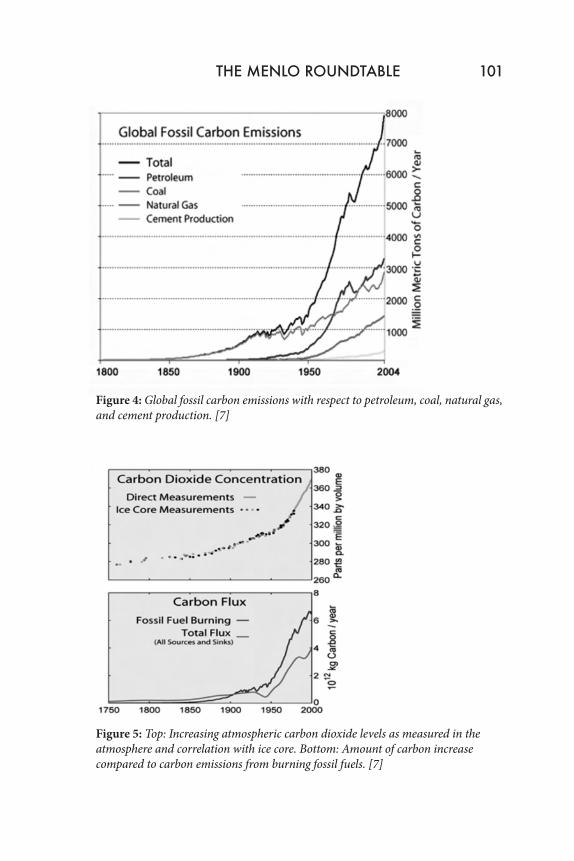
Figure 4: Global fossil carbon emissions with respect to petroleum, coal, natural gas, and cement production. [7]
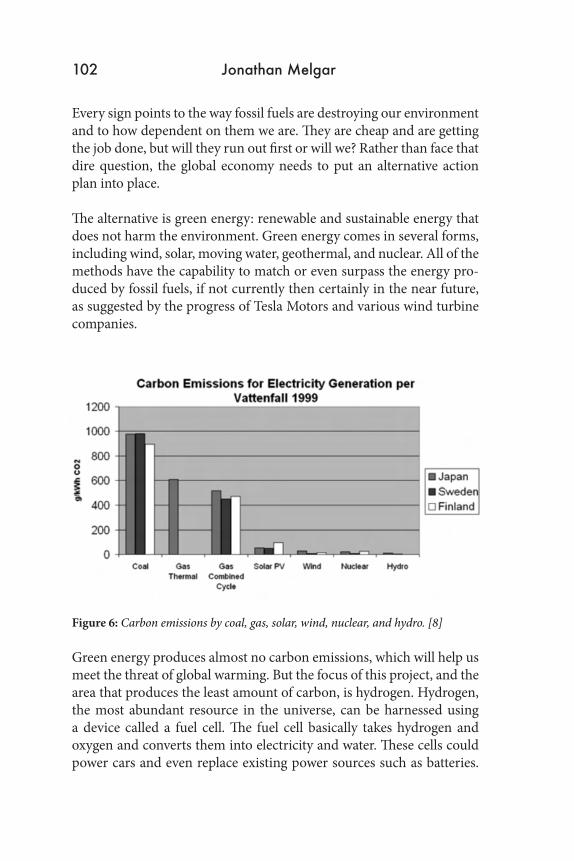
Figure 5: Top: Increasing atmospheric carbon dioxide levels as measured in the atmosphere and correlation with ice core. Bottom: Amount of carbon increase compared to carbon emissions from burning fossil fuels. [7]
Every sign points to the way fossil fuels are destroying our environment and to how dependent on them we are. They are cheap and are getting the job done, but will they run out first or will we? Rather than face that dire question, the global economy needs to put an alternative action plan into place.
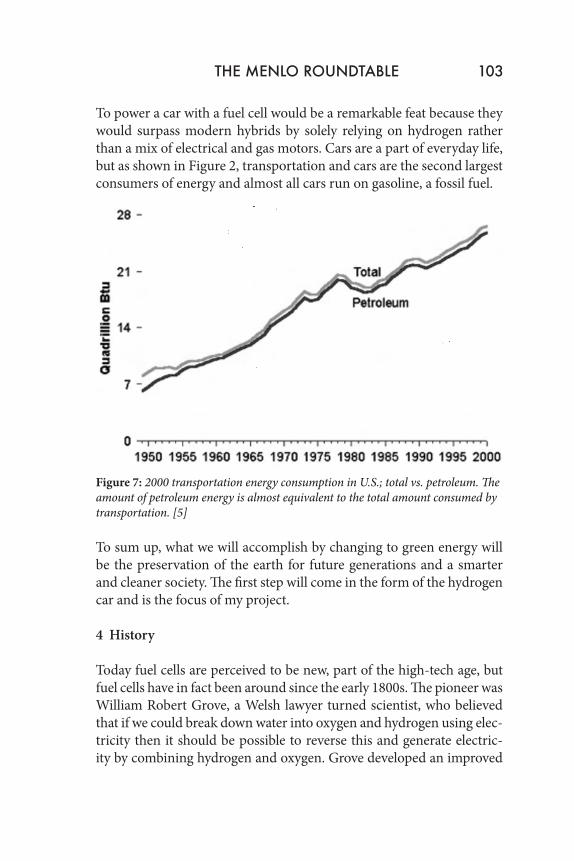
The alternative is green energy: renewable and sustainable energy that does not harm the environment. Green energy comes in several forms, including wind, solar, moving water, geothermal, and nuclear. All of the methods have the capability to match or even surpass the energy pro-duced by fossil fuels, if not currently then certainly in the near future, as suggested by the progress of Tesla Motors and various wind turbine companies.
Figure 6: Carbon emissions by coal, gas, solar, wind, nuclear, and hydro. [8]
Green energy produces almost no carbon emissions, which will help us meet the threat of global warming. But the focus of this project, and the area that produces the least amount of carbon, is hydrogen. Hydrogen, the most abundant resource in the universe, can be harnessed using a device called a fuel cell. The fuel cell basically takes hydrogen and oxygen and converts them into electricity and water. These cells could power cars and even replace existing power sources such as batteries.
102 Jonathan Melgar
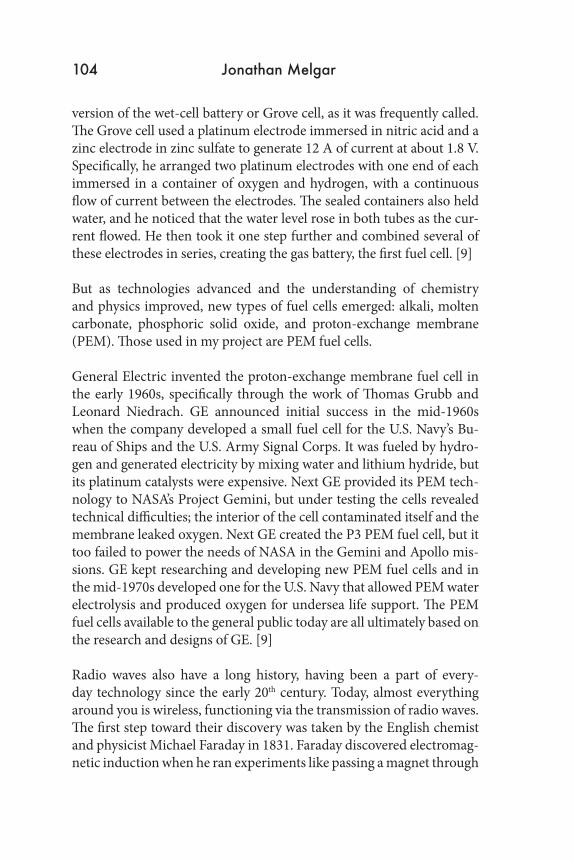
To power a car with a fuel cell would be a remarkable feat because they would surpass modern hybrids by solely relying on hydrogen rather than a mix of electrical and gas motors. Cars are a part of everyday life, but as shown in Figure 2, transportation and cars are the second largest consumers of energy and almost all cars run on gasoline, a fossil fuel.
Figure 7: 2000 transportation energy consumption in U.S.; total vs. petroleum. The amount of petroleum energy is almost equivalent to the total amount consumed by transportation. [5]
To sum up, what we will accomplish by changing to green energy will be the preservation of the earth for future generations and a smarter and cleaner society. The first step will come in the form of the hydrogen car and is the focus of my project.
4 History
Today fuel cells are perceived to be new, part of the high-tech age, but fuel cells have in fact been around since the early 1800s. The pioneer was William Robert Grove, a Welsh lawyer turned scientist, who believed that if we could break down water into oxygen and hydrogen using elec-tricity then it should be possible to reverse this and generate electric-ity by combining hydrogen and oxygen. Grove developed an improved
THE MENLO ROUNDTABLE 103
version of the wet-cell battery or Grove cell, as it was frequently called. The Grove cell used a platinum electrode immersed in nitric acid and a zinc electrode in zinc sulfate to generate 12 A of current at about 1.8 V. Specifically, he arranged two platinum electrodes with one end of each immersed in a container of oxygen and hydrogen, with a continuous flow of current between the electrodes. The sealed containers also held water, and he noticed that the water level rose in both tubes as the cur-rent flowed. He then took it one step further and combined several of these electrodes in series, creating the gas battery, the first fuel cell. [9]
But as technologies advanced and the understanding of chemistry and physics improved, new types of fuel cells emerged: alkali, molten carbonate, phosphoric solid oxide, and proton-exchange membrane (PEM). Those used in my project are PEM fuel cells.
General Electric invented the proton-exchange membrane fuel cell in the early 1960s, specifically through the work of Thomas Grubb and Leonard Niedrach. GE announced initial success in the mid-1960s when the company developed a small fuel cell for the U.S. Navy’s Bu-reau of Ships and the U.S. Army Signal Corps. It was fueled by hydro-gen and generated electricity by mixing water and lithium hydride, but its platinum catalysts were expensive. Next GE provided its PEM tech-nology to NASA’s Project Gemini, but under testing the cells revealed technical difficulties; the interior of the cell contaminated itself and the membrane leaked oxygen. Next GE created the P3 PEM fuel cell, but it too failed to power the needs of NASA in the Gemini and Apollo mis-sions. GE kept researching and developing new PEM fuel cells and in the mid-1970s developed one for the U.S. Navy that allowed PEM water electrolysis and produced oxygen for undersea life support. The PEM fuel cells available to the general public today are all ultimately based on the research and designs of GE. [9]
Radio waves also have a long history, having been a part of every-day technology since the early 20th century. Today, almost everything around you is wireless, functioning via the transmission of radio waves. The first step toward their discovery was taken by the English chemist and physicist Michael Faraday in 1831. Faraday discovered electromag-netic induction when he ran experiments like passing a magnet through
104 Jonathan Melgar
a coil of wire and spinning a coil near a magnet. He described the re-sults as lines of force inducing transient currents. [24] But in his time scientists rejected his theory of lines of force simply because there were no mathematical equations behind them until James Clerk Maxwell, a Scottish physicist, formulated them in the 1870s. Maxwell noticed that Gauss’s, Ampere’s, and Faraday’s equations were all trying to explain the same phenomenon, which he named electromagnetism. He went on to add to the three original laws by adding to Ampere’s Law the notion that a changing magnetic field will induce a current and vice versa; the combination of the various laws by Maxwell became known as Max-well’s Equations. [20, 25] Maxwell went on to use them to calculate the speed of light, and hypothesized that since light is a visible wave origi-nating from a vibrating particle that creates an electromagnetic wave, there must be more waves both below and above the visible range. [21] A German physicist named Heinrich Hertz in the late 1880s provided evidence for these theories by discovering radio waves. Hertz used two rods as a receiver and a spark gap as the receiving antennae. When the waves were picked up, a spark jumped, revealing that something actu-ally was going on. He went on to prove these waves had all electromag-netic wave properties and demonstrated that the velocity of the waves was equal to that of visible light, and that electric and magnetic fields could detach themselves from wires and travel freely. [20, 22]
Then, just before the turn of the 20th century, radio waves began to be harnessed and used. The first demonstration of the practical power of radio waves came in 1898 when Nikola Tesla, in a presentation in Madi-son Square Garden, demonstrated a small boat that apparently obeyed commands from the audience but was actually controlled by Tesla, who interpreted the verbal requests and sent appropriate frequencies to tuned circuits on the boat. Later that year he patented his design. [23] Radio waves began to be used more extensively and saw considerable action and use in the Second World War. The Luftwaffe (the German air force) used controllable winged bombers to target Allied ships. [23] But just as the militaries of the world began using radio waves, so too the general public began to be exposed to this new technology. The Good brothers in 1930 created a valve vacuum tube-based control in remote control (R/C) hob-bies and today their “Guff” model plane sits in the National Aerospace Museum as one of the first radio-controlled hobby models. [23]
THE MENLO ROUNDTABLE 105
By the start of the 21st century, all the before-mentioned discoveries be-gan to be implemented together: hydrogen producing electricity that runs a wirelessly remote-controlled toy car. Even today these technolo-gies are breaking new ground, and one day hydrogen might run every-thing from our cars to houses.
5 CAD Drawings
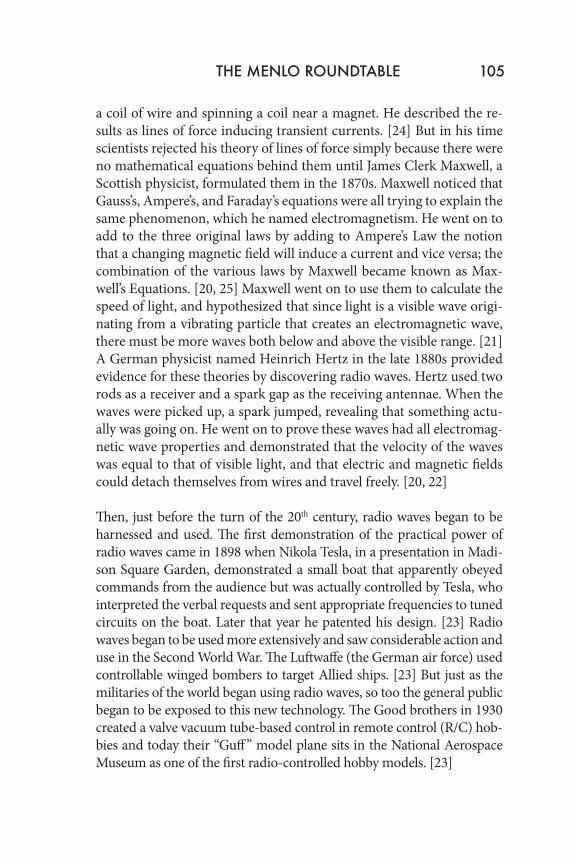
Figure 8: Cross views of the prototype 1, or Hydrogen Truck, which was made from a four-wheel drive chassis kit from Tamiya and body frame from a metal sheet. The truck bed holds four fuel cells. Two wires connected to the motor exit through the cabin to connect to the cells. Dimensions: height 4.5”, length 7.156”, and width 4.875”.
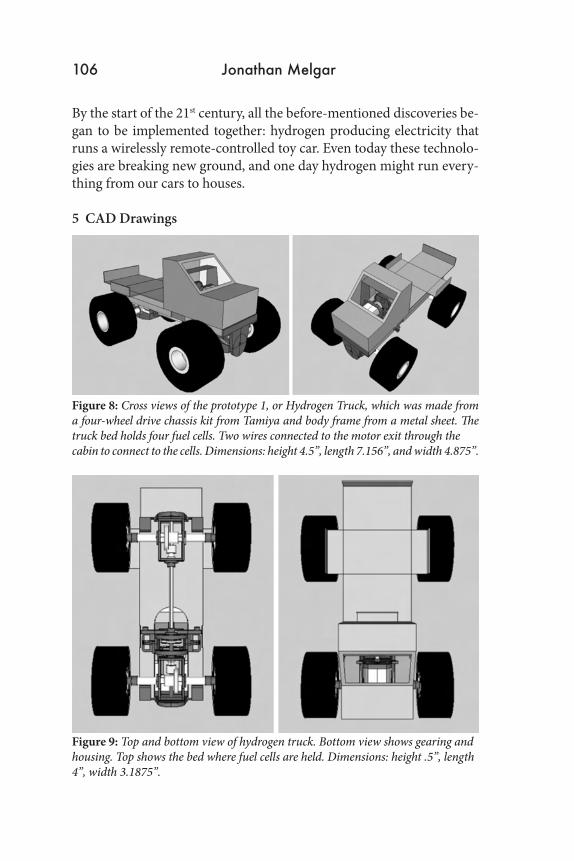
Figure 9: Top and bottom view of hydrogen truck. Bottom view shows gearing and housing. Top shows the bed where fuel cells are held. Dimensions: height .5”, length 4”, width 3.1875”.
106 Jonathan Melgar

Figure 10: The main gears connect the motor to the drive shaft inside the housing. This is located in the center of the truck and the motor connects to the gears through the hole at the top.
Figure 11: Front and back view of prototype 2, or the Racer. made from parts from Tamiya USA and Tamiya Racing Wheels, showing progress as of February. Unfinished: missing motor and wheels. Dimensions: height 8.6 cm, width 5.3 cm, and length 16 cm.
THE MENLO ROUNDTABLE 107
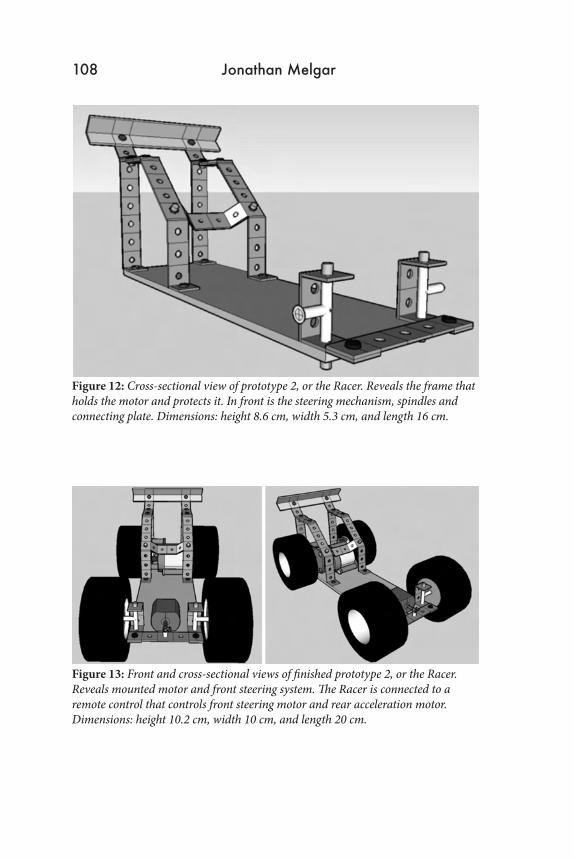
Figure 12: Cross-sectional view of prototype 2, or the Racer. Reveals the frame that holds the motor and protects it. In front is the steering mechanism, spindles and connecting plate. Dimensions: height 8.6 cm, width 5.3 cm, and length 16 cm.
Figure 13: Front and cross-sectional views of finished prototype 2, or the Racer. Reveals mounted motor and front steering system. The Racer is connected to a remote control that controls front steering motor and rear acceleration motor. Dimensions: height 10.2 cm, width 10 cm, and length 20 cm.
108 Jonathan Melgar
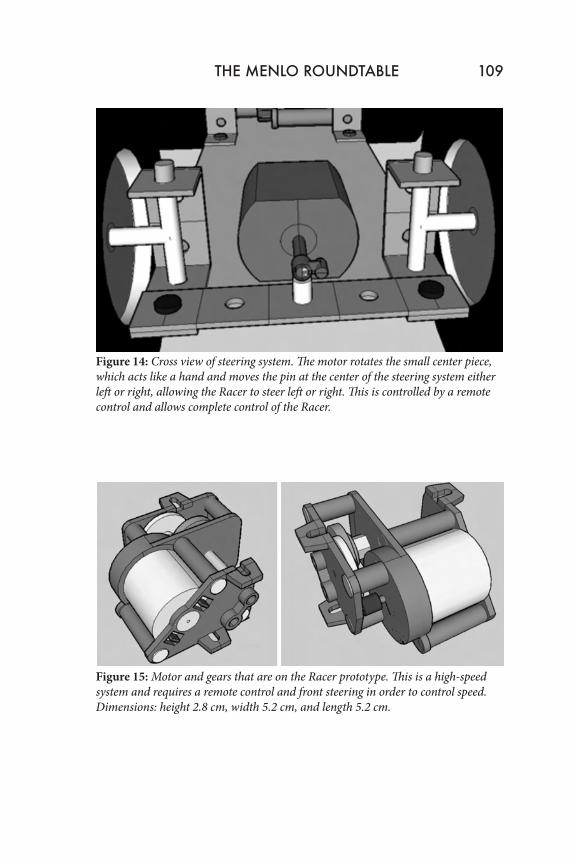
Figure 14: Cross view of steering system. The motor rotates the small center piece, which acts like a hand and moves the pin at the center of the steering system either left or right, allowing the Racer to steer left or right. This is controlled by a remote control and allows complete control of the Racer.
Figure 15: Motor and gears that are on the Racer prototype. This is a high-speed system and requires a remote control and front steering in order to control speed. Dimensions: height 2.8 cm, width 5.2 cm, and length 5.2 cm.
THE MENLO ROUNDTABLE 109
6 Theory
Hydrogen fuel cells are electrochemical devices that combine hydro-gen with oxygen from the atmosphere to create electricity and water vapor. [10] These cells are thermodynamically open systems, meaning that they consume an external reactant, oxygen, which must be replen-ished and drives the reaction. [11] Fuel cells vary in size and how much current/voltage they produce. They also come in several types: proton-exchange membrane fuel cells (PEM) and two high-temperature types: solid oxide fuel cells (SOFC) and molten carbonate fuel cells (MCFC). I will be using PEM fuel cells in my R/C.
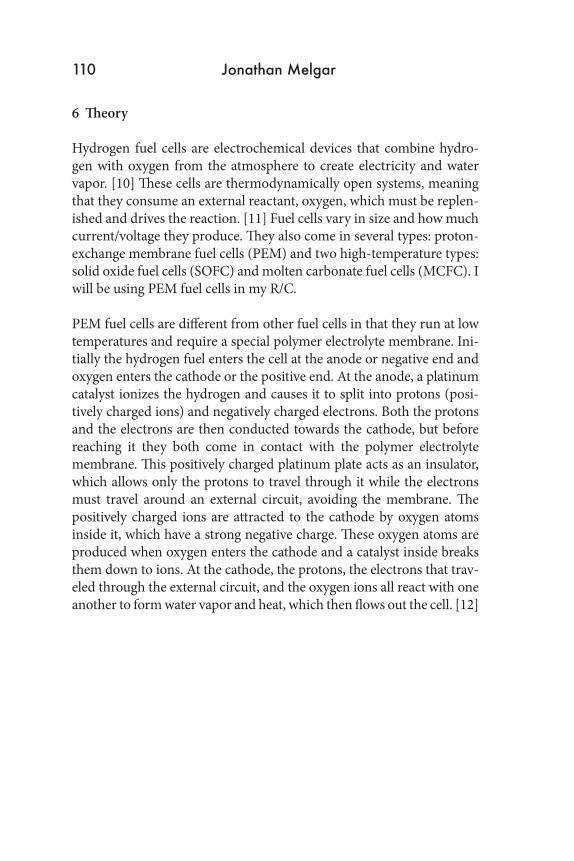
PEM fuel cells are different from other fuel cells in that they run at low temperatures and require a special polymer electrolyte membrane. Ini-tially the hydrogen fuel enters the cell at the anode or negative end and oxygen enters the cathode or the positive end. At the anode, a platinum catalyst ionizes the hydrogen and causes it to split into protons (posi-tively charged ions) and negatively charged electrons. Both the protons and the electrons are then conducted towards the cathode, but before reaching it they both come in contact with the polymer electrolyte membrane. This positively charged platinum plate acts as an insulator, which allows only the protons to travel through it while the electrons must travel around an external circuit, avoiding the membrane. The positively charged ions are attracted to the cathode by oxygen atoms inside it, which have a strong negative charge. These oxygen atoms are produced when oxygen enters the cathode and a catalyst inside breaks them down to ions. At the cathode, the protons, the electrons that trav-eled through the external circuit, and the oxygen ions all react with one another to form water vapor and heat, which then flows out the cell. [12]
110 Jonathan Melgar
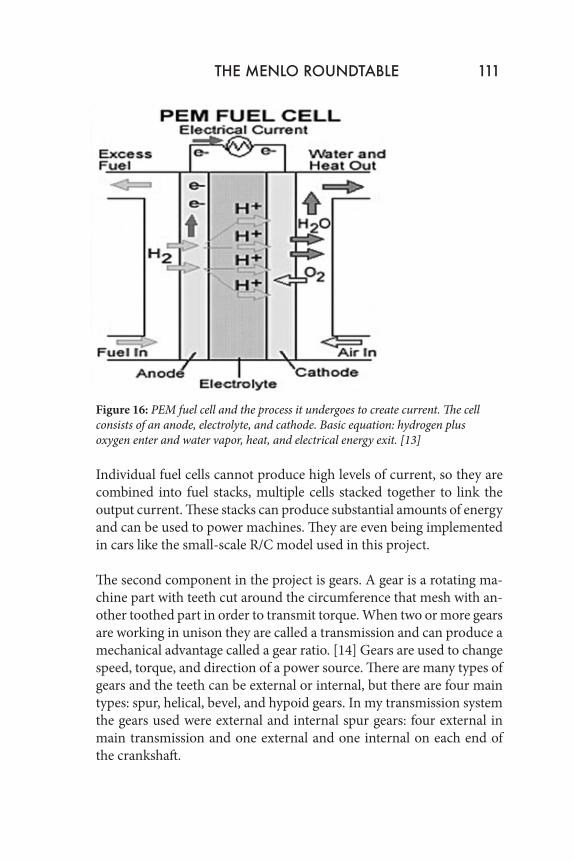
Figure 16: PEM fuel cell and the process it undergoes to create current. The cell consists of an anode, electrolyte, and cathode. Basic equation: hydrogen plus oxygen enter and water vapor, heat, and electrical energy exit. [13]
Individual fuel cells cannot produce high levels of current, so they are combined into fuel stacks, multiple cells stacked together to link the output current. These stacks can produce substantial amounts of energy and can be used to power machines. They are even being implemented in cars like the small-scale R/C model used in this project.
The second component in the project is gears. A gear is a rotating ma-chine part with teeth cut around the circumference that mesh with an-other toothed part in order to transmit torque. When two or more gears are working in unison they are called a transmission and can produce a mechanical advantage called a gear ratio. [14] Gears are used to change speed, torque, and direction of a power source. There are many types of gears and the teeth can be external or internal, but there are four main types: spur, helical, bevel, and hypoid gears. In my transmission system the gears used were external and internal spur gears: four external in main transmission and one external and one internal on each end of the crankshaft.
THE MENLO ROUNDTABLE 111
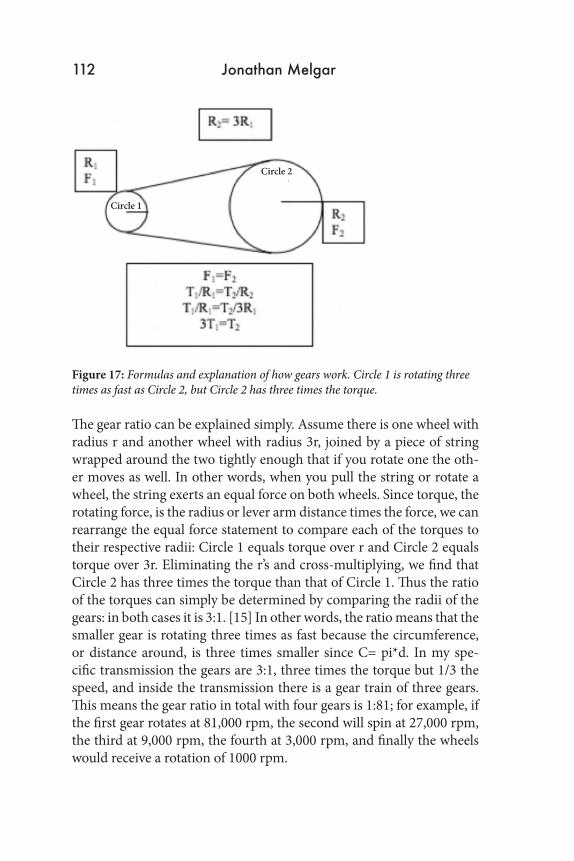
Figure 17: Formulas and explanation of how gears work. Circle 1 is rotating three times as fast as Circle 2, but Circle 2 has three times the torque.
The gear ratio can be explained simply. Assume there is one wheel with radius r and another wheel with radius 3r, joined by a piece of string wrapped around the two tightly enough that if you rotate one the oth-er moves as well. In other words, when you pull the string or rotate a wheel, the string exerts an equal force on both wheels. Since torque, the rotating force, is the radius or lever arm distance times the force, we can rearrange the equal force statement to compare each of the torques to their respective radii: Circle 1 equals torque over r and Circle 2 equals torque over 3r. Eliminating the r’s and cross-multiplying, we find that Circle 2 has three times the torque than that of Circle 1. Thus the ratio of the torques can simply be determined by comparing the radii of the gears: in both cases it is 3:1. [15] In other words, the ratio means that the smaller gear is rotating three times as fast because the circumference, or distance around, is three times smaller since C= pi*d. In my spe-cific transmission the gears are 3:1, three times the torque but 1/3 the speed, and inside the transmission there is a gear train of three gears. This means the gear ratio in total with four gears is 1:81; for example, if the first gear rotates at 81,000 rpm, the second will spin at 27,000 rpm, the third at 9,000 rpm, the fourth at 3,000 rpm, and finally the wheels would receive a rotation of 1000 rpm.
112 Jonathan Melgar
Circle 1
Circle 2
Figure 18: A reducing gear train like one used in transmission of Hydrogen Truck. The ratio of each of the gears is 5:1 and the total reduction is 125:1, resulting in the initial 100 rpm dropping to .8 rpm in the total system. [16]
But a remote control car wouldn’t be remote controlled if it was not using radio waves to transmit commands. These cars vary from manu-facturer to manufacturer, but all consist of four basic parts: a power source, motors, transmitter, and receiver. [17] The power source varies from rechargeable batteries to regular disposables, but today some are beginning to use hydrogen fuel cells. The two visible components in the radio control system consist of the controller and the car.
THE MENLO ROUNDTABLE 113
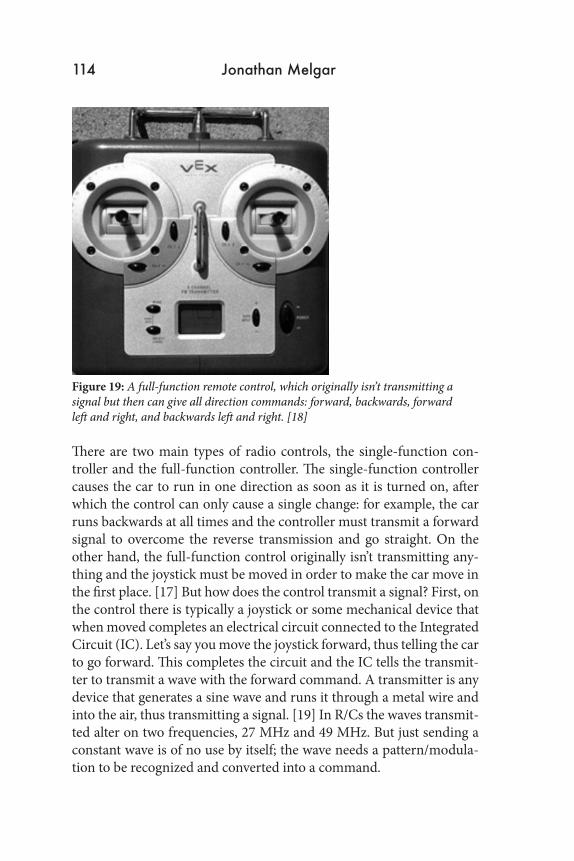
Figure 19: A full-function remote control, which originally isn’t transmitting a signal but then can give all direction commands: forward, backwards, forward left and right, and backwards left and right. [18]
There are two main types of radio controls, the single-function con-troller and the full-function controller. The single-function controller causes the car to run in one direction as soon as it is turned on, after which the control can only cause a single change: for example, the car runs backwards at all times and the controller must transmit a forward signal to overcome the reverse transmission and go straight. On the other hand, the full-function control originally isn’t transmitting any-thing and the joystick must be moved in order to make the car move in the first place. [17] But how does the control transmit a signal? First, on the control there is typically a joystick or some mechanical device that when moved completes an electrical circuit connected to the Integrated Circuit (IC). Let’s say you move the joystick forward, thus telling the car to go forward. This completes the circuit and the IC tells the transmit-ter to transmit a wave with the forward command. A transmitter is any device that generates a sine wave and runs it through a metal wire and into the air, thus transmitting a signal. [19] In R/Cs the waves transmit-ted alter on two frequencies, 27 MHz and 49 MHz. But just sending a constant wave is of no use by itself; the wave needs a pattern/modula-tion to be recognized and converted into a command.
114 Jonathan Melgar
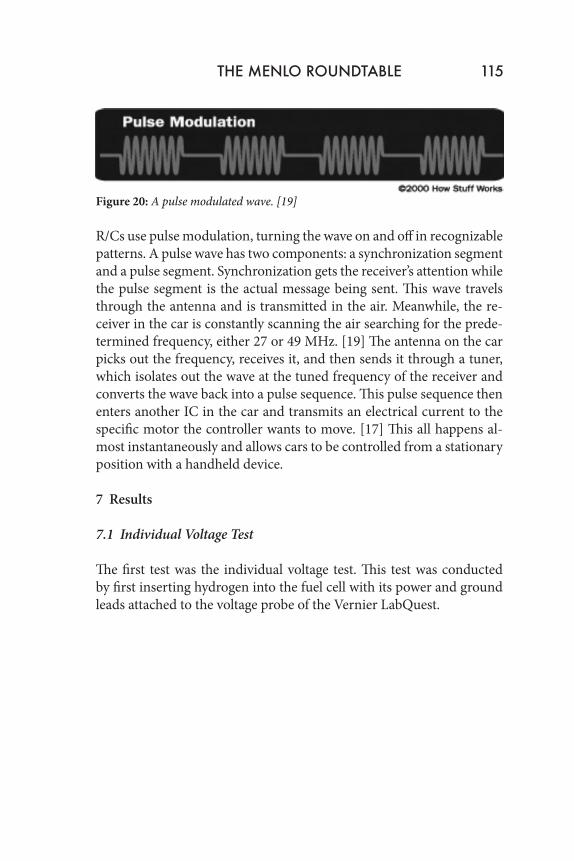
Figure 20: A pulse modulated wave. [19]
R/Cs use pulse modulation, turning the wave on and off in recognizable patterns. A pulse wave has two components: a synchronization segment and a pulse segment. Synchronization gets the receiver’s attention while the pulse segment is the actual message being sent. This wave travels through the antenna and is transmitted in the air. Meanwhile, the re-ceiver in the car is constantly scanning the air searching for the prede-termined frequency, either 27 or 49 MHz. [19] The antenna on the car picks out the frequency, receives it, and then sends it through a tuner, which isolates out the wave at the tuned frequency of the receiver and converts the wave back into a pulse sequence. This pulse sequence then enters another IC in the car and transmits an electrical current to the specific motor the controller wants to move. [17] This all happens al-most instantaneously and allows cars to be controlled from a stationary position with a handheld device.
7 Results
7.1 Individual Voltage Test
The first test was the individual voltage test. This test was conducted by first inserting hydrogen into the fuel cell with its power and ground leads attached to the voltage probe of the Vernier LabQuest.
THE MENLO ROUNDTABLE 115
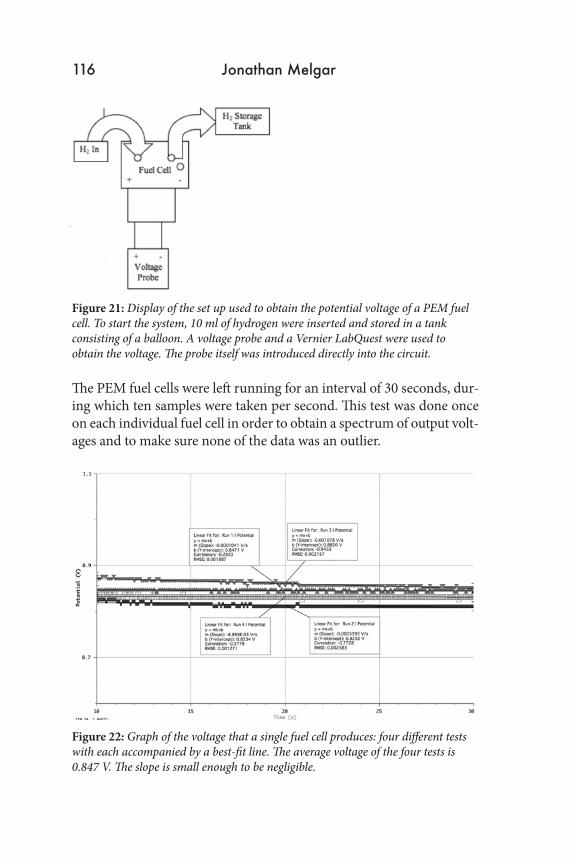
Figure 21: Display of the set up used to obtain the potential voltage of a PEM fuel cell. To start the system, 10 ml of hydrogen were inserted and stored in a tank consisting of a balloon. A voltage probe and a Vernier LabQuest were used to obtain the voltage. The probe itself was introduced directly into the circuit.
The PEM fuel cells were left running for an interval of 30 seconds, dur-ing which ten samples were taken per second. This test was done once on each individual fuel cell in order to obtain a spectrum of output volt-ages and to make sure none of the data was an outlier.
Figure 22: Graph of the voltage that a single fuel cell produces: four different tests with each accompanied by a best-fit line. The average voltage of the four tests is 0.847 V. The slope is small enough to be negligible.
116 Jonathan Melgar
All of the data was inside an interval of 1 V, which meant that the out-puts were consistent, and also over the total time the output voltage hardly deviates (see Figure 22). The open circuit output voltage of the PEM fuel cells resulted to be 0.847 V.
7.2 Dual Fuel Cell Tests
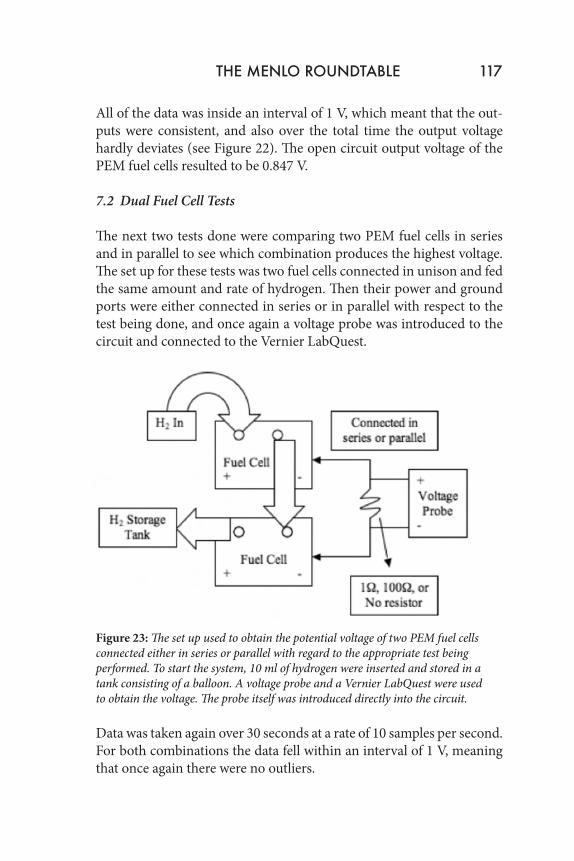
The next two tests done were comparing two PEM fuel cells in series and in parallel to see which combination produces the highest voltage. The set up for these tests was two fuel cells connected in unison and fed the same amount and rate of hydrogen. Then their power and ground ports were either connected in series or in parallel with respect to the test being done, and once again a voltage probe was introduced to the circuit and connected to the Vernier LabQuest.
Figure 23: The set up used to obtain the potential voltage of two PEM fuel cells connected either in series or parallel with regard to the appropriate test being performed. To start the system, 10 ml of hydrogen were inserted and stored in a tank consisting of a balloon. A voltage probe and a Vernier LabQuest were used to obtain the voltage. The probe itself was introduced directly into the circuit.
Data was taken again over 30 seconds at a rate of 10 samples per second. For both combinations the data fell within an interval of 1 V, meaning that once again there were no outliers.
THE MENLO ROUNDTABLE 117
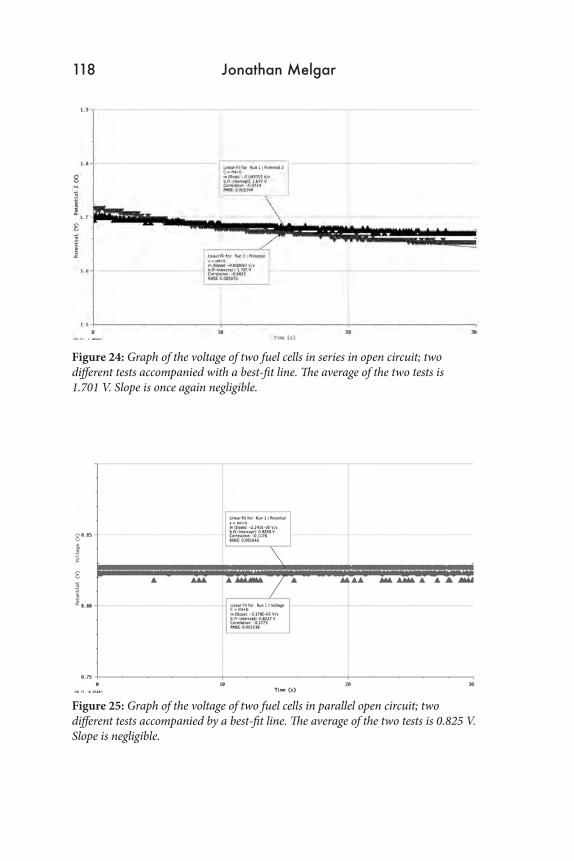
Figure 24: Graph of the voltage of two fuel cells in series in open circuit; two different tests accompanied with a best-fit line. The average of the two tests is 1.701 V. Slope is once again negligible.
Figure 25: Graph of the voltage of two fuel cells in parallel open circuit; two different tests accompanied by a best-fit line. The average of the two tests is 0.825 V. Slope is negligible.
118 Jonathan Melgar
The results for the series combination were an average voltage of 1.701 V, which is what we expect since a circuit in series amplifies the voltage (see Figure 24). The result for the parallel test was an average voltage of 0.825 V, which too is what we expect because parallel circuits maintain the same voltage (see Figure 25).
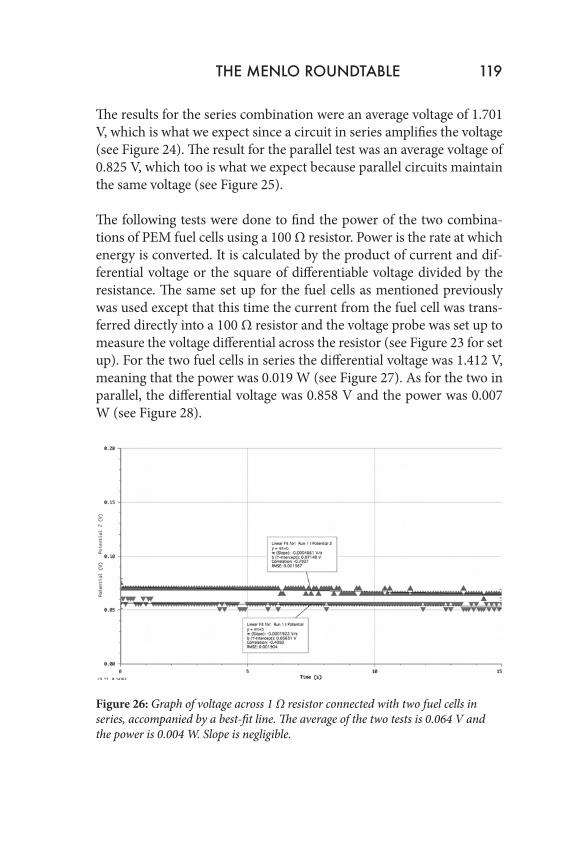
The following tests were done to find the power of the two combina-tions of PEM fuel cells using a 100 Ω resistor. Power is the rate at which energy is converted. It is calculated by the product of current and dif-ferential voltage or the square of differentiable voltage divided by the resistance. The same set up for the fuel cells as mentioned previously was used except that this time the current from the fuel cell was trans-ferred directly into a 100 Ω resistor and the voltage probe was set up to measure the voltage differential across the resistor (see Figure 23 for set up). For the two fuel cells in series the differential voltage was 1.412 V, meaning that the power was 0.019 W (see Figure 27). As for the two in parallel, the differential voltage was 0.858 V and the power was 0.007 W (see Figure 28).
Figure 26: Graph of voltage across 1 Ω resistor connected with two fuel cells in series, accompanied by a best-fit line. The average of the two tests is 0.064 V and the power is 0.004 W. Slope is negligible.
THE MENLO ROUNDTABLE 119
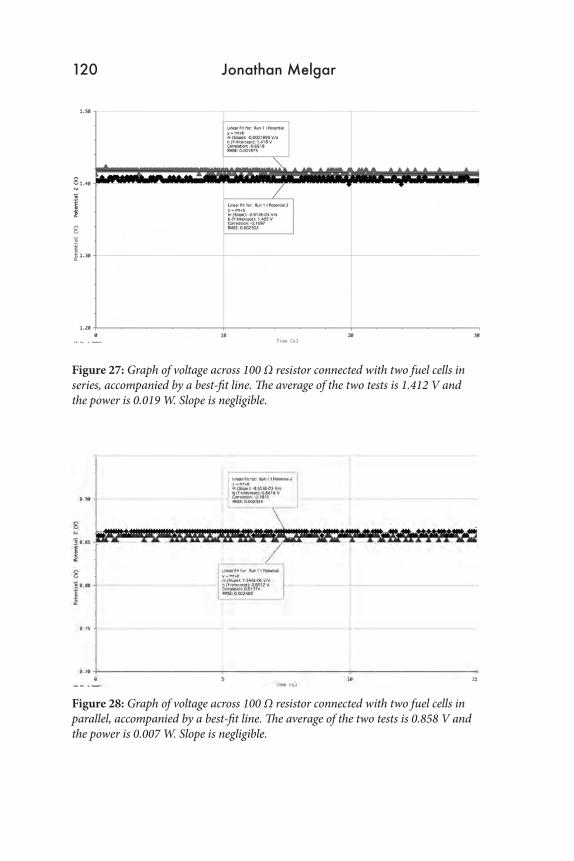
Figure 27: Graph of voltage across 100 Ω resistor connected with two fuel cells in series, accompanied by a best-fit line. The average of the two tests is 1.412 V and the power is 0.019 W. Slope is negligible.
Figure 28: Graph of voltage across 100 Ω resistor connected with two fuel cells in parallel, accompanied by a best-fit line. The average of the two tests is 0.858 V and the power is 0.007 W. Slope is negligible.
120 Jonathan Melgar
7.3 Four Fuel Cell Tests
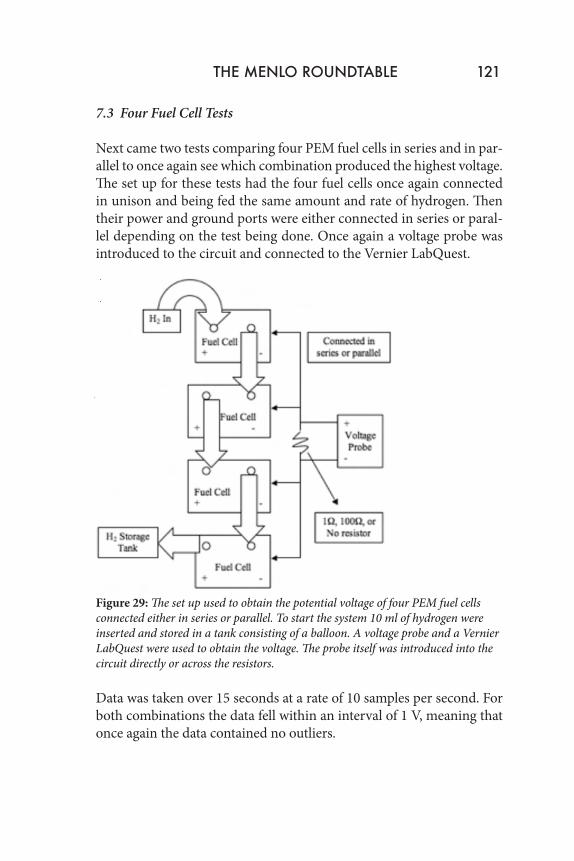
Next came two tests comparing four PEM fuel cells in series and in par-allel to once again see which combination produced the highest voltage. The set up for these tests had the four fuel cells once again connected in unison and being fed the same amount and rate of hydrogen. Then their power and ground ports were either connected in series or paral-lel depending on the test being done. Once again a voltage probe was introduced to the circuit and connected to the Vernier LabQuest.
Figure 29: The set up used to obtain the potential voltage of four PEM fuel cells connected either in series or parallel. To start the system 10 ml of hydrogen were inserted and stored in a tank consisting of a balloon. A voltage probe and a Vernier LabQuest were used to obtain the voltage. The probe itself was introduced into the circuit directly or across the resistors.
Data was taken over 15 seconds at a rate of 10 samples per second. For both combinations the data fell within an interval of 1 V, meaning that once again the data contained no outliers.
THE MENLO ROUNDTABLE 121
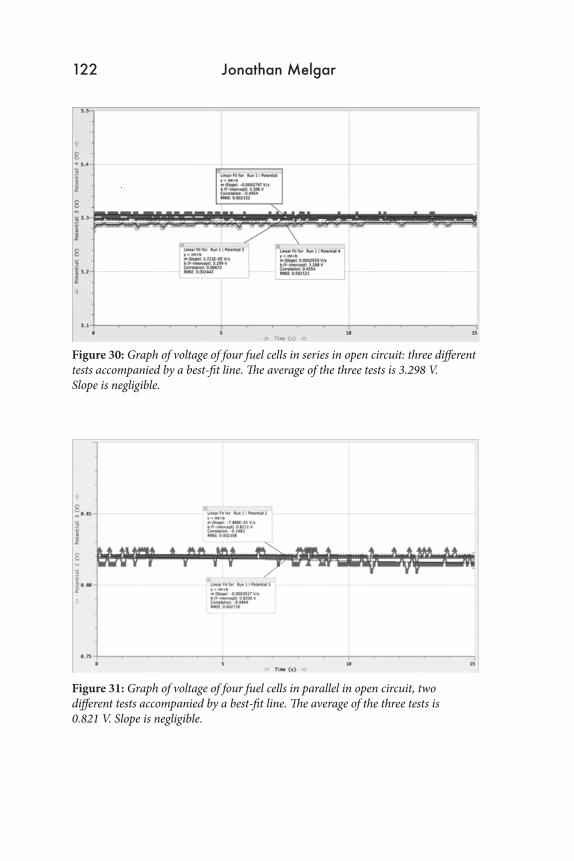
Figure 30: Graph of voltage of four fuel cells in series in open circuit: three different tests accompanied by a best-fit line. The average of the three tests is 3.298 V. Slope is negligible.
Figure 31: Graph of voltage of four fuel cells in parallel in open circuit, two different tests accompanied by a best-fit line. The average of the three tests is 0.821 V. Slope is negligible.
122 Jonathan Melgar
The results for the four fuel cells in series yielded an average of 3.298 V, which is what we expect because series amplifies the voltage, thus being four times the voltage of one cell (see Figure 30). The results for the four in parallel yielded a voltage of 0.821 V, which too is what we expect since a circuit in parallel maintains the same voltage throughout (see Figure 31).
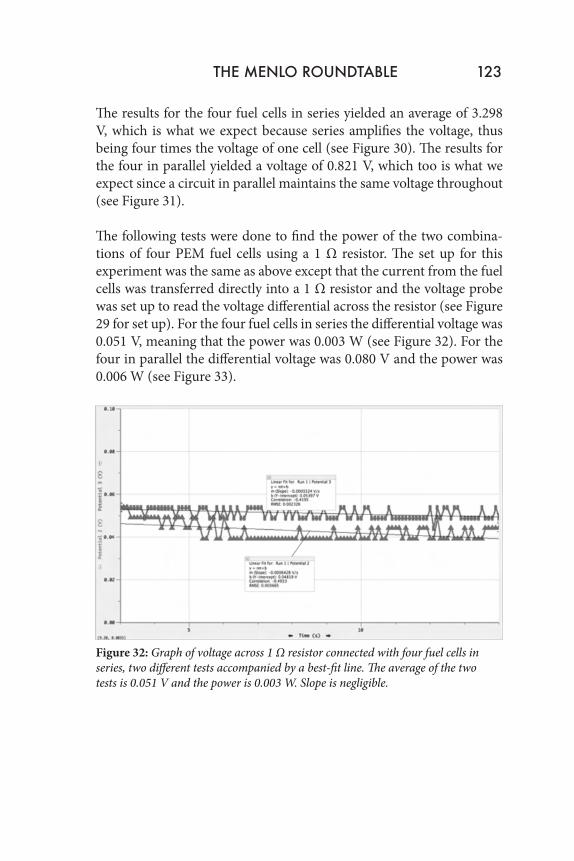
The following tests were done to find the power of the two combina-tions of four PEM fuel cells using a 1 Ω resistor. The set up for this experiment was the same as above except that the current from the fuel cells was transferred directly into a 1 Ω resistor and the voltage probe was set up to read the voltage differential across the resistor (see Figure 29 for set up). For the four fuel cells in series the differential voltage was 0.051 V, meaning that the power was 0.003 W (see Figure 32). For the four in parallel the differential voltage was 0.080 V and the power was 0.006 W (see Figure 33).
Figure 32: Graph of voltage across 1 Ω resistor connected with four fuel cells in series, two different tests accompanied by a best-fit line. The average of the two tests is 0.051 V and the power is 0.003 W. Slope is negligible.
THE MENLO ROUNDTABLE 123
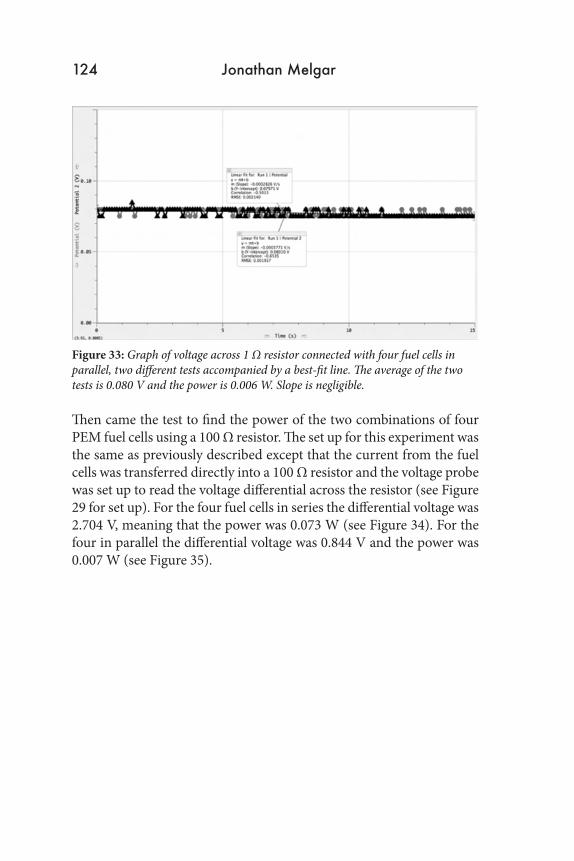
Figure 33: Graph of voltage across 1 Ω resistor connected with four fuel cells in parallel, two different tests accompanied by a best-fit line. The average of the two tests is 0.080 V and the power is 0.006 W. Slope is negligible.
Then came the test to find the power of the two combinations of four PEM fuel cells using a 100 Ω resistor. The set up for this experiment was the same as previously described except that the current from the fuel cells was transferred directly into a 100 Ω resistor and the voltage probe was set up to read the voltage differential across the resistor (see Figure 29 for set up). For the four fuel cells in series the differential voltage was 2.704 V, meaning that the power was 0.073 W (see Figure 34). For the four in parallel the differential voltage was 0.844 V and the power was 0.007 W (see Figure 35).
124 Jonathan Melgar
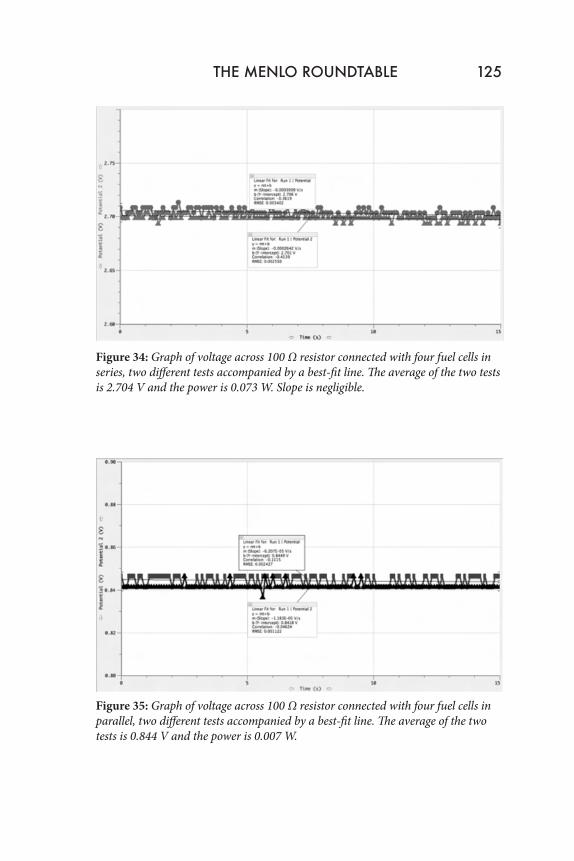
Figure 34: Graph of voltage across 100 Ω resistor connected with four fuel cells in series, two different tests accompanied by a best-fit line. The average of the two tests is 2.704 V and the power is 0.073 W. Slope is negligible.
Figure 35: Graph of voltage across 100 Ω resistor connected with four fuel cells in parallel, two different tests accompanied by a best-fit line. The average of the two tests is 0.844 V and the power is 0.007 W.
THE MENLO ROUNDTABLE 125
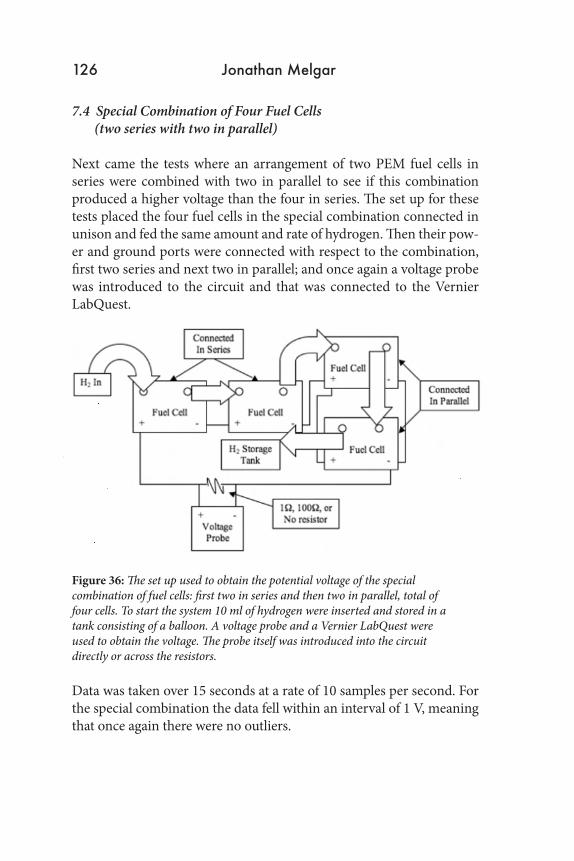
7.4 Special Combination of Four Fuel Cells (two series with two in parallel)
Next came the tests where an arrangement of two PEM fuel cells in series were combined with two in parallel to see if this combination produced a higher voltage than the four in series. The set up for these tests placed the four fuel cells in the special combination connected in unison and fed the same amount and rate of hydrogen. Then their pow-er and ground ports were connected with respect to the combination, first two series and next two in parallel; and once again a voltage probe was introduced to the circuit and that was connected to the Vernier LabQuest.
Figure 36: The set up used to obtain the potential voltage of the special combination of fuel cells: first two in series and then two in parallel, total of four cells. To start the system 10 ml of hydrogen were inserted and stored in a tank consisting of a balloon. A voltage probe and a Vernier LabQuest were used to obtain the voltage. The probe itself was introduced into the circuit directly or across the resistors.
Data was taken over 15 seconds at a rate of 10 samples per second. For the special combination the data fell within an interval of 1 V, meaning that once again there were no outliers.
126 Jonathan Melgar
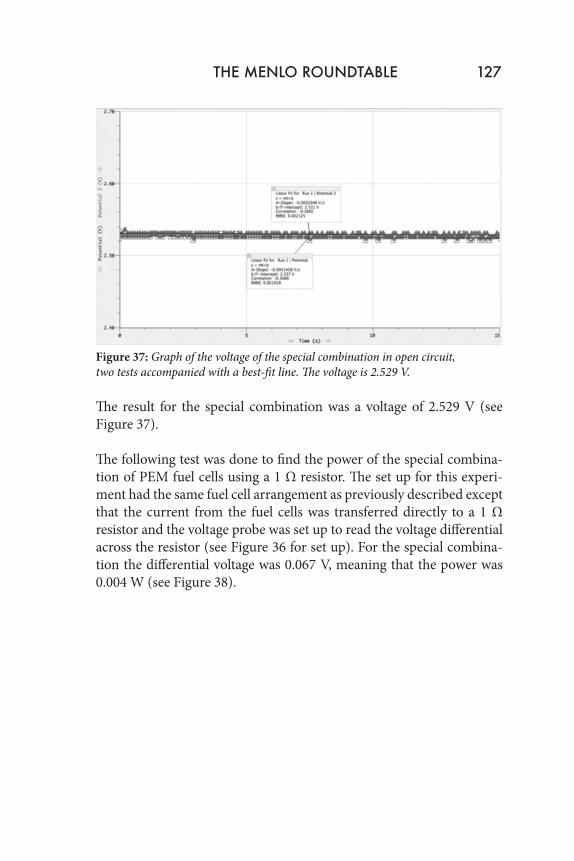
Figure 37: Graph of the voltage of the special combination in open circuit, two tests accompanied with a best-fit line. The voltage is 2.529 V.
The result for the special combination was a voltage of 2.529 V (see Figure 37).
The following test was done to find the power of the special combina-tion of PEM fuel cells using a 1 Ω resistor. The set up for this experi-ment had the same fuel cell arrangement as previously described except that the current from the fuel cells was transferred directly to a 1 Ω resistor and the voltage probe was set up to read the voltage differential across the resistor (see Figure 36 for set up). For the special combina-tion the differential voltage was 0.067 V, meaning that the power was 0.004 W (see Figure 38).
THE MENLO ROUNDTABLE 127
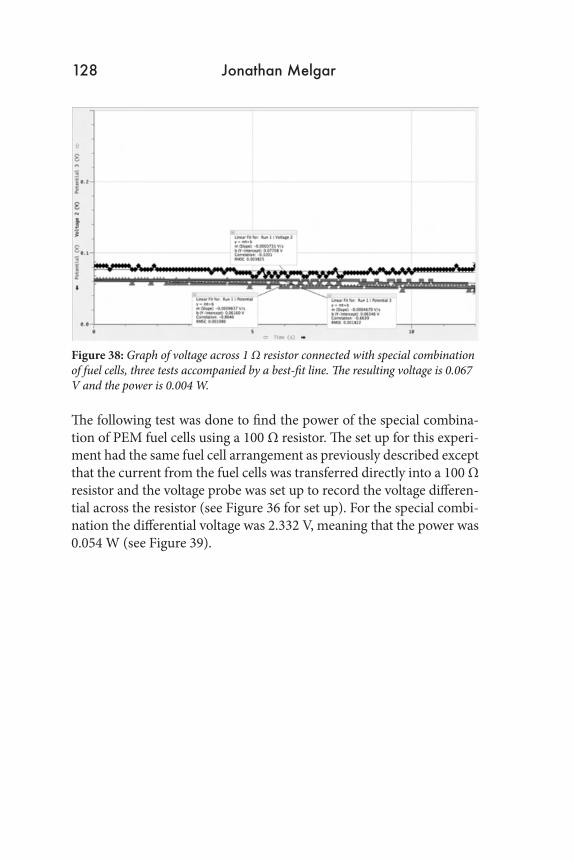
Figure 38: Graph of voltage across 1 Ω resistor connected with special combination of fuel cells, three tests accompanied by a best-fit line. The resulting voltage is 0.067 V and the power is 0.004 W.
The following test was done to find the power of the special combina-tion of PEM fuel cells using a 100 Ω resistor. The set up for this experi-ment had the same fuel cell arrangement as previously described except that the current from the fuel cells was transferred directly into a 100 Ω resistor and the voltage probe was set up to record the voltage differen-tial across the resistor (see Figure 36 for set up). For the special combi-nation the differential voltage was 2.332 V, meaning that the power was 0.054 W (see Figure 39).
128 Jonathan Melgar
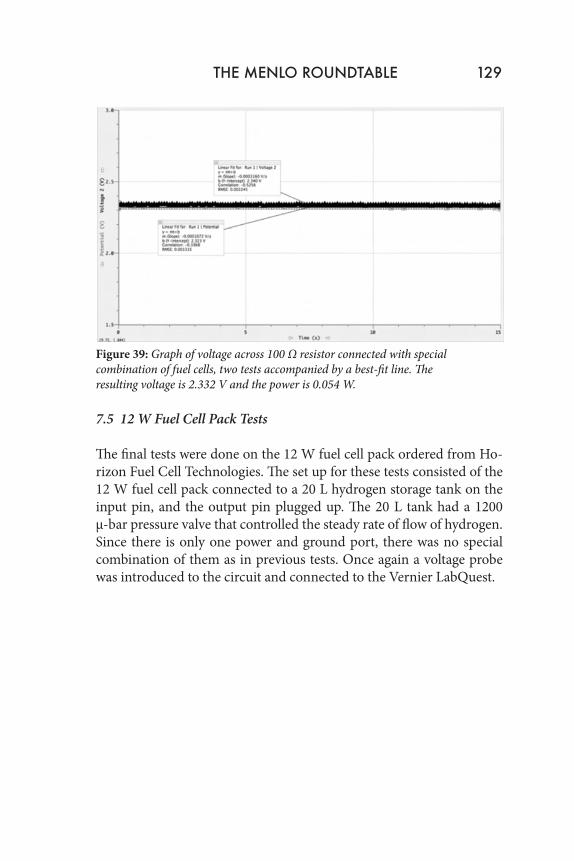
Figure 39: Graph of voltage across 100 Ω resistor connected with special combination of fuel cells, two tests accompanied by a best-fit line. The resulting voltage is 2.332 V and the power is 0.054 W.
7.5 12 W Fuel Cell Pack Tests
The final tests were done on the 12 W fuel cell pack ordered from Ho-rizon Fuel Cell Technologies. The set up for these tests consisted of the 12 W fuel cell pack connected to a 20 L hydrogen storage tank on the input pin, and the output pin plugged up. The 20 L tank had a 1200 μ-bar pressure valve that controlled the steady rate of flow of hydrogen. Since there is only one power and ground port, there was no special combination of them as in previous tests. Once again a voltage probe was introduced to the circuit and connected to the Vernier LabQuest.
THE MENLO ROUNDTABLE 129
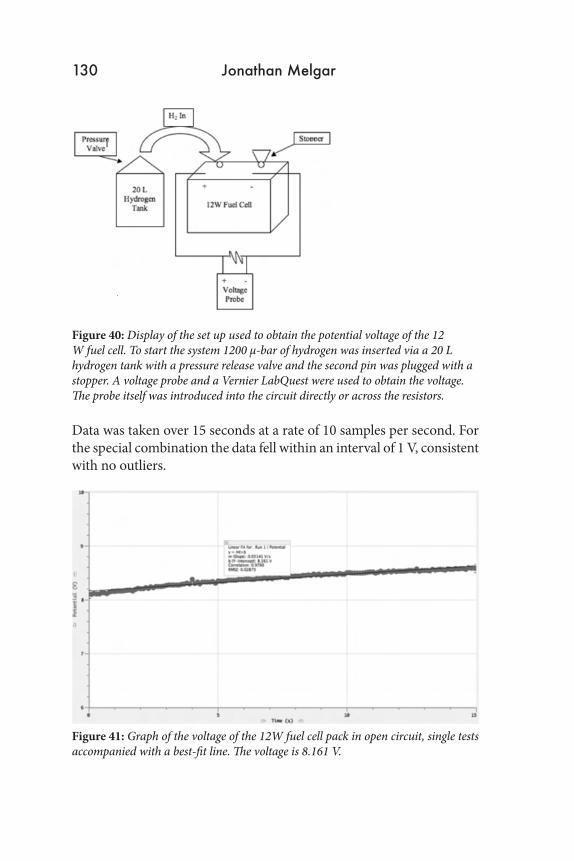
Figure 40: Display of the set up used to obtain the potential voltage of the 12 W fuel cell. To start the system 1200 μ-bar of hydrogen was inserted via a 20 L hydrogen tank with a pressure release valve and the second pin was plugged with a stopper. A voltage probe and a Vernier LabQuest were used to obtain the voltage. The probe itself was introduced into the circuit directly or across the resistors.
Data was taken over 15 seconds at a rate of 10 samples per second. For the special combination the data fell within an interval of 1 V, consistent with no outliers.
Figure 41: Graph of the voltage of the 12W fuel cell pack in open circuit, single tests accompanied with a best-fit line. The voltage is 8.161 V.
130 Jonathan Melgar
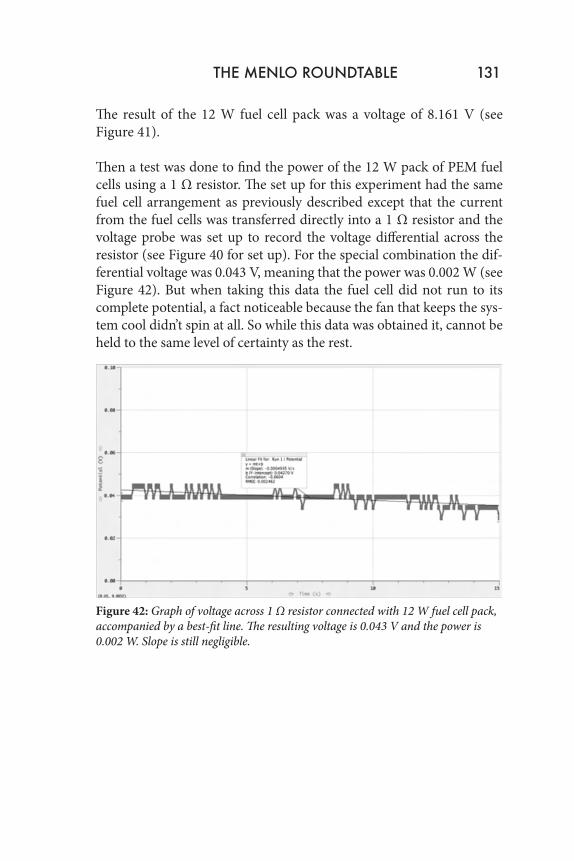
The result of the 12 W fuel cell pack was a voltage of 8.161 V (see Figure 41).
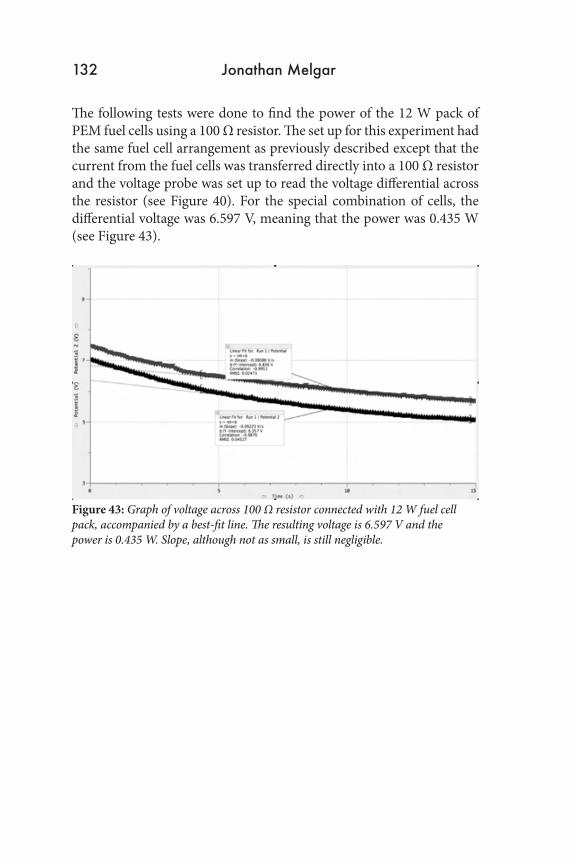
Then a test was done to find the power of the 12 W pack of PEM fuel cells using a 1 Ω resistor. The set up for this experiment had the same fuel cell arrangement as previously described except that the current from the fuel cells was transferred directly into a 1 Ω resistor and the voltage probe was set up to record the voltage differential across the resistor (see Figure 40 for set up). For the special combination the dif-ferential voltage was 0.043 V, meaning that the power was 0.002 W (see Figure 42). But when taking this data the fuel cell did not run to its complete potential, a fact noticeable because the fan that keeps the sys-tem cool didn’t spin at all. So while this data was obtained it, cannot be held to the same level of certainty as the rest.
Figure 42: Graph of voltage across 1 Ω resistor connected with 12 W fuel cell pack, accompanied by a best-fit line. The resulting voltage is 0.043 V and the power is 0.002 W. Slope is still negligible.
THE MENLO ROUNDTABLE 131
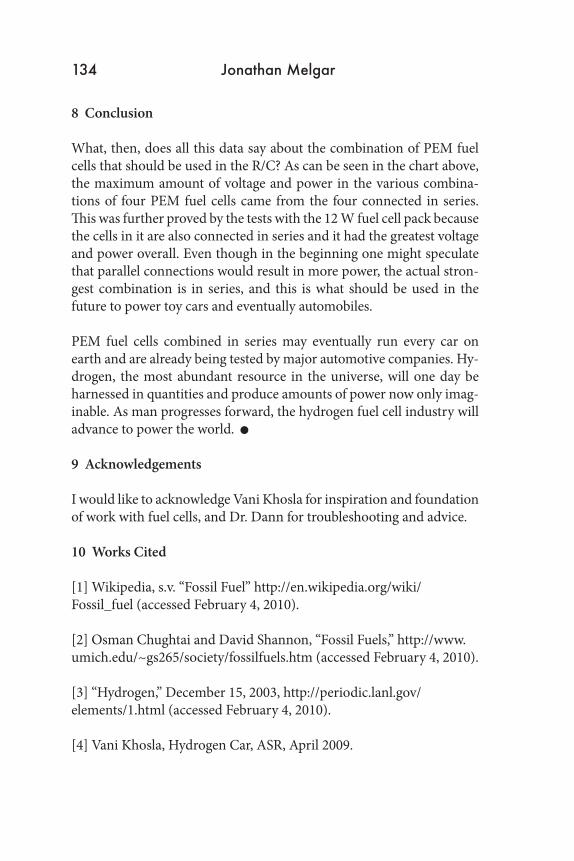
The following tests were done to find the power of the 12 W pack of PEM fuel cells using a 100 Ω resistor. The set up for this experiment had the same fuel cell arrangement as previously described except that the current from the fuel cells was transferred directly into a 100 Ω resistor and the voltage probe was set up to read the voltage differential across the resistor (see Figure 40). For the special combination of cells, the differential voltage was 6.597 V, meaning that the power was 0.435 W (see Figure 43).
Figure 43: Graph of voltage across 100 Ω resistor connected with 12 W fuel cell pack, accompanied by a best-fit line. The resulting voltage is 6.597 V and the power is 0.435 W. Slope, although not as small, is still negligible.
132 Jonathan Melgar

7.6 Chart of All Results
Fuel Cell Type Voltage Power
Single FCOpen circuit 0.847 V
Double FC (series)Open circuit 1.701 V1 Ω 0.064 V 0.004 W100 Ω 1.412 V 0.019 W
Double FC (parallel)Open circuit 0.825 V1 Ω100 Ω 0.858 V 0.007 W
Quad FC (series)Open circuit 3.298 V1 Ω 0.051 V 0.003 W100 Ω 2.704 V 0.073 W
Quad FC (parallel)Open circuit 0.821 V1 Ω 0.080 V 0.006 W100 Ω 0.844 V 0.007 W
Special Combination (two single & two double)
Open circuit 2.529 V1 Ω 0.067 V 0.004 W100 Ω 2.332 V 0.054 W
12 W Fuel Cell PackOpen circuit 8.161 V1 Ω 0.043 V 0.002 W100 Ω 6.597 V 0.435 W
Figure 44: Chart displaying all test results.
THE MENLO ROUNDTABLE 133
8 Conclusion
What, then, does all this data say about the combination of PEM fuel cells that should be used in the R/C? As can be seen in the chart above, the maximum amount of voltage and power in the various combina-tions of four PEM fuel cells came from the four connected in series. This was further proved by the tests with the 12 W fuel cell pack because the cells in it are also connected in series and it had the greatest voltage and power overall. Even though in the beginning one might speculate that parallel connections would result in more power, the actual stron-gest combination is in series, and this is what should be used in the future to power toy cars and eventually automobiles.
PEM fuel cells combined in series may eventually run every car on earth and are already being tested by major automotive companies. Hy-drogen, the most abundant resource in the universe, will one day be harnessed in quantities and produce amounts of power now only imag-inable. As man progresses forward, the hydrogen fuel cell industry will advance to power the world.
9 Acknowledgements
I would like to acknowledge Vani Khosla for inspiration and foundation of work with fuel cells, and Dr. Dann for troubleshooting and advice.
10 Works Cited
[1] Wikipedia, s.v. “Fossil Fuel” http://en.wikipedia.org/wiki/Fossil_fuel (accessed February 4, 2010).
[2] Osman Chughtai and David Shannon, “Fossil Fuels,” http://www.umich.edu/~gs265/society/fossilfuels.htm (accessed February 4, 2010).
[3] “Hydrogen,” December 15, 2003, http://periodic.lanl.gov/elements/1.html (accessed February 4, 2010).
[4] Vani Khosla, Hydrogen Car, ASR, April 2009.
134 Jonathan Melgar

[5] “History of Energy in the United States: 1635-2000,” http://www.eia.doe.gov/emeu/aer/eh/total.html (accessed February 4, 2010).
[6] “Greenhouse Effect,” http://hyperphysics.phy-astr.gsu.edu/hbase/thermo/grnhse.html (accessed February 4, 2010).
[7] Wikipedia, s.v. “Greenhouse Gas” http://en.wikipedia.org/wiki/Greenhouse_gas (accessed February 4, 2010).
[8] Wikipedia, s.v. “Sustainable Energy,” http://en.wikipedia.org/wiki/Sustainable_energy (accessed February 4, 2010).
[9] “Collecting the History of Fuel Cells,” Smithsonian National Museum of American History, August 2009, http://americanhistory.si.edu/fuelcells/ (accessed March 4, 2010).
[10] Wikipedia, s.v. “Fuel Cell,” http://en.wikipedia.org/wiki/Fuel_cell (accessed February 4, 2010).
[11] Karim Nice and Jonathan Strickland “How Fuel Cells Work,” http://auto.howstuffworks.com/fuel-efficiency/alternative-fuels/fuel-cell.htm (accessed February 4, 2010).
[12] “How Fuel Cells Work,” http://www.fueleconomy.gov/feg/fcv_pem.shtml htm (accessed February 4, 2010).
[13] Christine Gable and Scott Gable, “Proton Exchange Membrane Fuel Cell,” About.com, http://alternativefuels.about.com/od/researchdevelopment/ig/Fuel-Cell-Diagrams/PEM-Fuel-Cell.htm(accessed February 4, 2010).
[14] Karim Nice, “How Gears Work,” http://www.howstuffworks.com/gear.htm (accessed February 4, 2010).
[15] Marshall Brian, “How Gear Ratios Work,” http://www.howstuffworks.com/gears.htm (accessed February 4, 2010).
THE MENLO ROUNDTABLE 135
[16] “Reducing Gear Train,” http://myweb.cwpost.liu.edu/magot/classes/csc/RobotFundamentals/downloads/ReducingGearTrain.JPG (accessed February 4, 2010).
[17] Marshall Brian, “How Radio Works,” http://electronics.howstuffworks.com/radio.htm (accessed April 2, 2010).
[18] Radio Control Image, http://www.instructables.com/image/F1XYS3XFHEJ13RS/How-To-Radio-Control-DC-Motors-Cheaply.jpg (accessed April 2, 2010).
[19] Jeff Tyson, “How Radio Controlled Toys Work,” http://electronics.howstuffworks.com/rc-toy.htm (accessed April 2, 2010).
[20] “Scientist and Electromagnetic Waves: Maxwell and Hertz,” The Electromagnetic Spectrum, http://science.hq.nasa.gov/kids/imagers/ems/consider.html htm (accessed April 2, 2010).
[21] “Electromagnetic Spectrum - Wavelength, Frequency, And Energy, Wavelength Regions,” http://science.jrank.org/pages/2368/Electromagnetic-Spectrum.html (accessed April 2, 2010).
[22] Wikipedia, s.v. “Heinrich Hertz,” http://en.wikipedia.org/wiki/Heinrich_Hertz (accessed April 2, 2010).
[23] Wikipedia, s.v. “Radio Control,” http://en.wikipedia.org/wiki/Radio_control (accessed April 3, 2010).
[24] Wikipedia, s.v. “Faraday’s law of induction” http://en.wikipedia.org/wiki/Faraday%27s_law_of_induction (accesses May 17, 2010).
[25] Michael Fowler, “Maxwell’s Equations and Electromagnetic Waves,” http://galileoandeinstein.physics.virginia.edu/more_stuff/Maxwell_Eq.html (accesses May 17, 2010).
[26] Materials for prototypes attained from Tamiya USA.
136 Jonathan Melgar