the human brain - MIT CSAILpeople.csail.mit.edu/ythomas/publications/2018Parcellations-NRN.pdf ·...
15
The organization of the human brain is governed by two fundamental principles: functional integration into large-scale networks, which is realized through long-range connections, and functional segregation into distinct regions, which is realized through local differen- tiation 1 . Importantly, these two principles are not mutu- ally exclusive but rather jointly form the neurobiological basis of all higher brain functions that arise from inter- actions between specialized regions. The spatial arrange- ment of cortical areas and subcortical nuclei presents a highly heterogeneous landscape, and ample evidence suggests that this complex topography is crucial for men- tal processes 2 and inter-individual differences thereof 3–5 . Accordingly, brain parcellation — that is, delineation of spatial partitions of the brain — is fundamental for decoding the human brain. The study of brain organization is complicated by evidence of multiple axes of organization according to different neurobiological properties and their meas- ures. For example, microstructure evidences different hippocampal subregions along the medio–lateral axis 6 , whereas patterns of long-range interactions vary along the hippocampal anterior–posterior axis 7 . Similarly, the premotor cortex can be distinguished from the adja- cent prefrontal and primary motor cortex on the basis of microstructural characteristics 8 and can also be sub- divided into ventral and dorsal regions by connectivity and function 9 . Thus, from both a methodological and a conceptual standpoint, understanding human brain organization requires a dual perspective, considering both local properties and connectivity fingerprints 10 . Brain cartography has a long history 11 (BOX 1), over which different properties of brain tissues have been progressively integrated towards the now commonly accepted conceptualization of brain areas 12 as entities that show distinct connectivity, microarchitecture, topogra- phy and function 13 . The concept of brain areas is closely related to the perspective of a so-called universal map that has driven the brain cartography field for more than a century 14–16 . However, the goal of creating a universal map is challenged by the complexity of brain organization at several levels and across several axes, as well as the divergence of patterns across different neurobiological properties. Furthermore, substantial inter-individual variability in brain network and areal topography has been documented 17–19 but is still poorly understood, thus challenging the very existence of a universal brain atlas. Hence, the axiom of a universal map that grounds the field of brain cartography remains a matter of conjecture. Not only can brain parcellations provide funda- mental insights into the organizational principles of the human brain, but they are also of great practical relevance as biologically informed strategies of data reduction, enabling information from hundreds of thousands of voxels or vertices to be compressed into manageable sets of nodes reflecting distinct entities. Such reduction is important for some emerging big-data approaches that aim to predict behavioural or clinical phenotypes from brain imaging data 20–23 . Likewise, the study of brain connectivity with tools from graph theory requires a limited set of nodes 24 . Importantly, however, for such aggregation to provide a valid compression, the parcels should reflect a biologically meaningful pattern- ing. This reasoning renders macrostructural character- istics (for example, sulci and gyri; see macroanatomy Imaging-based parcellations of the human brain Simon B. Eickhoff 1,2 *, B. T. Thomas Yeo 3,4,5,6 and Sarah Genon 1,2 Abstract | A defining aspect of brain organization is its spatial heterogeneity, which gives rise to multiple topographies at different scales. Brain parcellation — defining distinct partitions in the brain, be they areas or networks that comprise multiple discontinuous but closely interacting regions — is thus fundamental for understanding brain organization and function. The past decade has seen an explosion of in vivo MRI-based approaches to identify and parcellate the brain on the basis of a wealth of different features, ranging from local properties of brain tissue to long-range connectivity patterns, in addition to structural and functional markers. Given the high diversity of these various approaches, assessing the convergence and divergence among these ensuing maps is a challenge. Inter-individual variability adds to this challenge but also provides new opportunities when coupled with cross-species and developmental parcellation studies. 1 Institute of Neuroscience and Medicine, Brain and Behavior (INM-7), Research Centre Jülich, Jülich, Germany. 2 Institute of Systems Neuroscience, Medical Faculty, Heinrich-Heine- University Düsseldorf, Düsseldorf, Germany. 3 Department of Electrical and Computer Engineering, ASTAR-NUS Clinical Imaging Research Centre, Singapore Institute for Neurotechnology and Memory Networks Program, National University of Singapore, Singapore, Singapore. 4 NUS Graduate School for Integrative Sciences and Engineering, National University of Singapore, Singapore, Singapore. 5 Martinos Center for Biomedical Imaging, Massachusetts General Hospital, Harvard Medical School, Charlestown, MA, USA. 6 Centre for Cognitive Neuroscience, Duke-NUS Graduate Medical School, Singapore, Singapore. *e-mail: simon.eickhoff@ med.uni-duesseldorf.de https://doi.org/10.1038/ s41583-018-0071-7 REVIEWS NATURE REVIEWS | NEUROSCIENCE
Transcript of the human brain - MIT CSAILpeople.csail.mit.edu/ythomas/publications/2018Parcellations-NRN.pdf ·...
The organization of the human brain is governed by two fundamental principles: functional integration into large-scale networks, which is realized through long-range connections, and functional segregation into distinct regions, which is realized through local differen-tiation1. Importantly, these two principles are not mutu-ally exclusive but rather jointly form the neurobiological basis of all higher brain functions that arise from inter-actions between specialized regions. The spatial arrange-ment of cortical areas and subcortical nuclei presents a highly heterogeneous landscape, and ample evidence suggests that this complex topography is crucial for men-tal processes2 and inter-individual differences thereof3–5. Accordingly, brain parcellation — that is, delineation of spatial partitions of the brain — is fundamental for decoding the human brain.
The study of brain organization is complicated by evidence of multiple axes of organization according to different neurobiological properties and their meas-ures. For example, microstructure evidences different hippocampal subregions along the medio–lateral axis6, whereas patterns of long-range interactions vary along the hippocampal anterior–posterior axis7. Similarly, the premotor cortex can be distinguished from the adja-cent prefrontal and primary motor cortex on the basis of microstructural characteristics8 and can also be sub-divided into ventral and dorsal regions by connectivity and function9. Thus, from both a methodological and a conceptual standpoint, understanding human brain organization requires a dual perspective, considering both local properties and connectivity fingerprints10.
Brain cartography has a long history11 (Box 1), over which different properties of brain tissues have been
progressively integrated towards the now commonly accepted conceptualization of brain areas12 as entities that show distinct connectivity, microarchitecture, topogra-phy and function13. The concept of brain areas is closely related to the perspective of a so-called universal map that has driven the brain cartography field for more than a century14–16. However, the goal of creating a universal map is challenged by the complexity of brain organization at several levels and across several axes, as well as the divergence of patterns across different neurobiological properties. Furthermore, substantial inter-individual variability in brain network and areal topography has been documented17–19 but is still poorly understood, thus challenging the very existence of a universal brain atlas. Hence, the axiom of a universal map that grounds the field of brain cartography remains a matter of conjecture.
Not only can brain parcellations provide funda-mental insights into the organizational principles of the human brain, but they are also of great practical relevance as biologically informed strategies of data reduction, enabling information from hundreds of thousands of voxels or vertices to be compressed into manageable sets of nodes reflecting distinct entities. Such reduction is important for some emerging big-data approaches that aim to predict behavioural or clinical phenotypes from brain imaging data20–23. Likewise, the study of brain connectivity with tools from graph theory requires a limited set of nodes24. Importantly, however, for such aggregation to provide a valid compression, the parcels should reflect a biologically meaningful pattern-ing. This reasoning renders macrostructural character-istics (for example, sulci and gyri; see macroanatomy
Imaging-based parcellations of the human brainSimon B. Eickhoff1,2*, B. T. Thomas Yeo 3,4,5,6 and Sarah Genon1,2
Abstract | A defining aspect of brain organization is its spatial heterogeneity , which gives rise to multiple topographies at different scales. Brain parcellation — defining distinct partitions in the brain, be they areas or networks that comprise multiple discontinuous but closely interacting regions — is thus fundamental for understanding brain organization and function. The past decade has seen an explosion of in vivo MRI-based approaches to identify and parcellate the brain on the basis of a wealth of different features, ranging from local properties of brain tissue to long-range connectivity patterns, in addition to structural and functional markers. Given the high diversity of these various approaches, assessing the convergence and divergence among these ensuing maps is a challenge. Inter-individual variability adds to this challenge but also provides new opportunities when coupled with cross-species and developmental parcellation studies.
1Institute of Neuroscience and Medicine, Brain and Behavior (INM-7), Research Centre Jülich, Jülich, Germany.2Institute of Systems Neuroscience, Medical Faculty, Heinrich-Heine-University Düsseldorf, Düsseldorf, Germany.3Department of Electrical and Computer Engineering, ASTAR-NUS Clinical Imaging Research Centre, Singapore Institute for Neurotechnology and Memory Networks Program, National University of Singapore, Singapore, Singapore.4NUS Graduate School for Integrative Sciences and Engineering, National University of Singapore, Singapore, Singapore.5Martinos Center for Biomedical Imaging, Massachusetts General Hospital, Harvard Medical School, Charlestown, MA, USA.6Centre for Cognitive Neuroscience, Duke-NUS Graduate Medical School, Singapore, Singapore.
*e-mail: [email protected]
https://doi.org/10.1038/ s41583-018-0071-7
ReVieWS
Nature reviews | NeuroscieNce

atlas examples in TaBle 1) notoriously unsuited for such tasks, as they do not converge with the heterogeneity of functional, structural or connectional markers13,25. Thus, brain parcellation contributes to a better under-standing of brain function and dysfunction not only at the conceptual level but also by providing critical priors for connectomics and large-scale analyses of brain–behaviour relationships.
In spite of the technical and conceptual heterogene-ity in the burgeoning field of brain parcellation, for more than a century its fundamental idea has remained to identify components (either topographically distinct regions or distributed networks) that are internally homogeneous with respect to a particular neurobio-logical measure but that are different from each other. This goal can be achieved by two conceptually distinct approaches: boundary mapping and clustering or fac-torization. In the boundary mapping approach, a bor-der is detected by localizing the most abrupt spatial changes in the assessed feature using a local border detection (or edge detection) technique. In clustering and factorization approaches, spatial elements (voxels or vertices) are grouped on the basis of their similarity and dissimi larity according to a given marker. Hence, boundary mapping and clustering (or factorization) approaches can be referred to as local partitioning and global partitioning approaches, respectively. Note that here we consider only ‘hard partitions’ in which each location is assigned to one and only one spatial component of the brain, as opposed to ‘soft’ partitions26 (Box 2).
Almost any parcellation approach can be applied to almost any neurobiological property (TaBle 1). Hence, we can further divide brain parcellation approaches according to the type of marker by distinguishing mark-ers that describe underlying tissue properties (that is, capitalizing on local structural or functional properties) from markers that reflect integration into larger net-works (that is, capitalizing on long-range connections). In other words, a further conceptual distinction can be proposed based on whether the parcellation builds on local architecture or function (local properties) or on connectivity fingerprints (global or connectivity proper-ties). In this Review, we discuss the history of brain par-cellation and its current state along this taxonomy of two independent dimensions — that is, the marker approach and the partitioning approach (Fig. 1) — and examine conceptual questions regarding the relationships among parcellations derived from different markers.
Parcellation based on local propertiesEarly efforts to parcellate the brain on the basis of local properties have mostly been histological, using, for example, cytoarchitecture and myeloarchitecture, neurochemical markers or (more recently) receptor expression (Box 1). However, these approaches usually require postmortem tissue, hence preventing parallel studies of function and leading to the highly labori-ous examination of only small samples. By contrast, neuro imaging techniques such as MRI allow the acqui-sition of whole-brain images in vivo, in large samples of individuals.
www.nature.com/nrn
R e v i e w s
Box 1 | early brain cartography and histological approaches to brain parcellation
the very first endeavours to map the human brain in the 19th and early 20th centuries were based on ex vivo investigation of brain microstructure and macrostructure. Flattened out, the cortex is organized vertically, into columns and dendritic bundles, and horizontally, in layers parallel to the pial surface. From the earliest studies, these neurobiological features were observed to vary across the brain. More specifically, properties of these features regularly reveal zones of homogeneity and abrupt changes between zones. accordingly, the point at which the pattern of a marker — for example, the thickness of cortical layers, the size of pyramidal cells or the extent of myelination — changes represents a border between distinct areas13,118. a pioneering cartography work illustrating this approach is the map created by Korbinian Brodmann, widely known as Brodmann areas14. Other researchers of this period, such as Cécile and Oscar vogt, capitalized on different local properties, in particular myeloarchitecture, to define brain areas119. In addition, the first localization of brain macrostructure in a stereotactic coordinate system was proposed by talairach and tournoux120.
according to the means of their time, all these cartographers transcribed their observations by manually drawing 2D maps of brain regions on paper. importantly, these first maps were highly observer-dependent and based on subjective classification criteria and therefore suffer from reproducibility issues121. this motivated the subsequent development of observer-independent techniques based on computerized image analysis122 using a border detection approach47,77. Combined with 3D reconstruction and spatial registration of multiple postmortem brains into a standard reference space, this development allowed rigorous investigations of microstructure, providing evidence for more than 200 histologically distinct brain areas13,123.
Over time, other histological approaches complemented cytoarchitecture and myeloarchitecture, such as immunochemistry or receptoarchitectonic studies (for a review, see reF.13). in receptoarchitectonic studies, examining the local density of various transmitter receptors allows the definition of specific ‘receptor fingerprints’ that differ between cortical areas and also reflect functional relationships77. interestingly, although not all cortical area borders are reflected by changes in all receptor types, those borders that are evident colocalize very well with each other and also with cytoarchitectonic and myeloarchitectonic differences77. as histological mapping is performed on directly observable — rather than modelled or inferred — markers, it provides important reference points for mapping the human brain. Conversely, the main drawback of histological brain mapping is the reliance on the use of postmortem specimens, thus precluding any comparison with functional data within the same individual. Moreover, given the labour-intensive preparation of tissue, sample sizes are inevitably and severely limited. However, developments of high-resolution Mri will offer an alternative approach by allowing whole-brain microstructural investigations without sample size restriction.
Large-scale networksConstellations of brain areas that are strongly connected to each other, presumably subserving specific functions.
Connectivity fingerprintsPatterns of the interactions of brain regions with other brain regions.
Brain cartographyThe study of brain organization with the particular objective of representing the organization of the brain as a map of distinct areas.
Brain areasBrain regions showing specific structure, function and connectivity.
Universal mapa unique division of the brain into individual areas, each having specific structure, connectivity and function, which can be found in all humans.
Graph theoryThe use of graphs to study and model relationships between objects with elements such as nodes and edges.
CytoarchitectureTissue composition with regard to cell characteristics.
MyeloarchitectureThe pattern of myelinated fibres.

Nature reviews | NeuroscieNce
R e v i e w s
Table 1 | Whole-brain or cortical parcellations available for download or visualization
Name (group or institution)
Brain coverage Granularity (number of parcels/networks)a
original format (and other formats)
Links refs
Macroanatomy
AAL Atlas Whole brain 82 parcels Volume http://www.gin.cnrs.fr/en/tools/aal-aal2/ 102
Harvard–Oxford Atlas Cerebrum 69 parcels Volume Included in the installation package of FSL (https://fsl.fmrib.ox.ac.uk/fsl/fslwiki/Atlases) and MRIcron (http://www.mccauslandcenter.sc.edu/mricro/mricron) and can be found here: http://neuro. debian.net/pkgs/fsl-harvard-oxford- atlases.html
138–141
Desikan–Killiany Atlas Cerebral cortex 70 parcels Surface Included in the installation package of FreeSurfer: https://surfer.nmr.mgh.harvard.edu/fswiki/CorticalParcellation
140
Destrieux Atlas Cerebral cortex 148 parcels Surface Included in the installation package of FreeSurfer: https://surfer.nmr.mgh.harvard.edu/fswiki/CorticalParcellation
142
MarsAtlas Cerebrum 89 parcels Surface and volume http://meca-brain.org/software/marsatlas- colin27/
143
Rs-fMRI
Bellec et al. (2010) Whole brain 7 , 12, 20, 36, 64, 122, 197 , 325 and 444 parcels
Volume https://figshare.com/articles/Group_ multiscale_functional_template_generated_with_BASC_on_the_Cambridge_sample/1285615
61
Power et al. (2011) Cerebrum 14 networks Volume https://www.jonathanpower.net/2011-neuron-bigbrain.html
144
Yeo et al. (2011), Buckner et al. (2011) and Choi et al. (2012)
Cerebral cortex, cerebellum and striatum
7 and 17 networks Surface of cerebral cortex and volume of cerebellum and striatum
Included in the installation package of FreeSurfer: https://surfer.nmr.mgh.harvard.edu/fswiki/CorticalParcellation_Yeo2011, http://surfer.nmr.mgh.harvard.edu/fswiki/CerebellumParcellation_Buckner2011 and https://surfer.nmr.mgh.harvard.edu/fswiki/StriatumParcellation_Choi2012
70,145,146
The 7 and 17 spatially distributed cortical networks have also been converted into 51 and 114 spatially connected parcels, respectively: https://github.com/ThomasYeoLab/CBIG/tree/master/stable_projects/brain_parcellation/Yeo2011_fcMRI_clustering
Craddock et al. (2012) Whole brain 10 to 1,000 parcels Volume http://ccraddock.github.io/cluster_roi/atlases.html
83
Shen et al. (2013) Whole brain 93, 184 and 278 parcels Volume www.nitrc.org/frs/?group_id=51 147
Gordon et al. (2016) Cerebral cortex 333 parcels Surface (and volume) www.nil.wustl.edu/labs/petersen/Resources.html
59
Atlas of Intrinsic Connectivity of Homotopic Areas
Cerebrum 384 parcels Volume In the installation package of AAL toolbox (http://www.gin.cnrs.fr/en/tools/aal-aal2/) and MRIcron (http://www.mccauslandcenter. sc.edu/mricro/mricron) and can be found here: https://omictools.com/atlas-of- intrinsic-connectivity-of-homotopic- areas-tool
148
Wang et al. (2015) Cerebral cortex 18 networks Surface Pre-compiled code for individual-specific network parcellations: http://nmr.mgh.harvard.edu/bid/DownLoad.html
18
Gordon et al. (2017) Cerebral cortex Subject dependent Surface Individual-specific network and areal-level parcellations for the Midnight Scan Club subjects: https://www.openfmri.org/dataset/ds000224/
97
Schaefer et al. (2018) Cerebral cortex 100, 200, 400, 600, 800 and 1,000 parcels
Surface (and volume) https://github.com/ThomasYeoLab/CBIG/tree/master/stable_projects/brain_parcellation/Schaefer2018_LocalGlobal
54

www.nature.com/nrn
R e v i e w s
Different types of parcellation based on local prop-erties. The MRI approach that is most similar to histo-logical methods is the mapping of myelin27. One popular estimate of myelin content that is used to create myelin density maps is yielded by the T1-weighted:T2-weighted ratio28. Myelin markers can be used to disentangle pri-mary areas from associative areas. For example, V1 and V2 delineated using functional imaging and histological measures are much more heavily myelinated than higher visual cortical areas28 (Fig. 2). However, MRI-based (and histology-based) myelin mapping for cartography purposes has been mostly limited to auditory29, visual30 and sensorimotor28 regions. Owing to a lack of distinc-tiveness in myelination densities across the association cortex, the application of myelin mapping for cartogra-phy beyond the sensorimotor cortex often requires the incorporation of additional information, such as cortical thickness or cytoarchitecture28.
Other local markers that can be used for parcel-lation are functional signals in response to specific external stimulation or mental tasks. Following the modelling of local responses across time or across different contexts, distinct areas can be disentangled based on their response patterns. The most widespread application of such approaches is visuotopic mapping31 (Fig. 2). Importantly, visual areas defined based on functional MRI (fMRI) visuotopic mapping corre-spond well with the areas defined by cytoarchitecture, supporting the validity of using fMRI signals for brain parcellation (Fig. 2).
However, beyond visuotopic mapping, parcellation based on local functional signal has been surprisingly rarely explored. Although parcellation on the basis of local functional responses presumably represents a powerful approach to understand brain organiza-tion in terms of areas and networks, recording the complete repertoire of functional responses remains
a major challenge. Accordingly, parcellations based on functional response have thus far been limited to a particular set of tasks or a comparably confined brain region. For example, one study parcellated the brain into functional networks by clustering task-evoked responses during finger tapping32. Another recent study proposed a parcellation based on response to semantic content during several hours of story listen-ing by seven individuals33 (TaBle 1). Nevertheless, the richness of these recordings probably did not come close to reflecting the entirety of the brain’s functional repertoire. Together with the small sample sizes used, this point raises the question of the universality of the resulting parcellation.
To tackle these limitations directly, meta-analytic approaches have been used to define subregions within, for example, the insular cortex34 on the basis of the con-vergence of activation during tasks involving different cognitive domains, such as motor tasks and cognitive or affective processing. This approach was recently automated in a clustering procedure, thus highlight-ing the potential to parcellate cortical and subcortical regions by local activation data35 (Fig. 1). Importantly, the extension of such approaches to other brain regions (such as the hippocampus) would require an extensive repertoire of functional responses, complicating devel-opments. Recent progress in the aggregation of activa-tion data36–38 may help to overcome these challenges. Whole-brain maps of local response patterns to vari-ous task conditions and stimuli may thus be computed from large sets of activation data. Such an approach would enable the delineation of brain areas based on their pattern of activations across many dimensions of behavioural tasks (depending on the task, stimulus, response and so on). However, this approach might be biased towards tasks that can readily be applied in the scanner and by the fact that activations are
Visuotopic mappingThe identification of visual areas based on differential cortical responses to different visual stimuli. an example of a mapping stimulus would be a rotating sector of a flashing checkerboard.
Name (group or institution)
Brain coverage Granularity (number of parcels/networks)a
original format (and other formats)
Links refs
Rs-fMRI (cont.)
Kong et al. (2018) Cerebral cortex 17 networks Surface Code for individual-specific network parcellations: https://github.com/ThomasYeoLab/CBIG/tree/master/stable_projects/brain_parcellation/Kong2019_MSHBM
5
Other
PrAGMATiC, based on task fMRI
Cerebral cortex 320 parcels Volume (and surface) For visualization only: http://gallantlab. org/huth2016/
33,149
Brainnetome, based on PDT
Cerebral cortex and subcortical structures
246 parcels Volume http://atlas.brainnetome.org/download.html
103
Varikuti et al. (2018), based on sMRI (SC)
Whole brain 2 to 500 parcels Volume http://anima.fz-juelich.de/studies/Varikuti_NMFBrainAge_2018
23
HCP Multimodal Parcellation, Glasser et al. (2016)
Cerebral cortex 360 parcels Surface https://balsa.wustl.edu/WN56 16
AAL , automated anatomical labelling; fMRI, functional MRI; FSL , FMRIB Software Library ; HCP, Human Connectome Project; PDT, probabilistic diffusion tractography ; rs-fMRI, resting-state functional MRI; SC, structural covariance ; sMRI, structural MRI. aGranularity refers to the number of parcels, clusters/components or networks. Only parcellations or segmentations based on MRI data are reported in this table. Manual segmentation and atlases based on other techniques (for example, Brodmann atlas) are not included here. The atlases are organized by modality and by publication date within each modality.
Table 1 (cont.) | Whole-brain or cortical parcellations available for download or visualization
Nature reviews | NeuroscieNce
R e v i e w s
more frequently reported in certain brain regions (for example, the insula) than in others39. Furthermore, a fundamental limitation of meta-analysis is the spatial blurring that is inherent to combining partici-pants from studies across different laboratories and coordinate systems. Therefore, extensive recordings of activation paradigms in a small number of partici-pants40 and extensive aggregation of activation studies are highly complementary.
Future challenges for parcellations based on local properties. Although MRI-based measurements of the brain’s local properties, such as myelination or functional responses, are less time-intensive and labour-intensive than ex vivo microstructural exami-nation, their clear drawback is that the respective properties are not directly observable but must be inferred from the measured data, rendering the ensu-ing brain maps contingent on the model for meas-uring these properties. Nevertheless, as illustrated in Fig. 2, the delineation of cortical areas based on MRI-measured local properties converge with those from histology-based architectonic approaches, clearly supporting the biological validity of the former41. Furthermore, the ongoing development of high-field scanners should provide the possibility of MRI-based architectonic parcellation41,42. That is, in the future, parcellations could capitalize on imaging properties that are closer to the microstructure of the brain, such as the laminar patterns in the human medial temporal cortex that were observed through ex vivo MRI43. Such advances could provide an important bridge to histo-logical investigations in the same specimen44–46. Thus, brain parcellation based on local properties not only has a storied tradition (Box 1; Fig. 1) but also should see substantial future progress42.
Parcellation based on connectivityLocal differentiation and network integration are com-plementary characteristics of brain organization47, as each brain area is characterized by its regional makeup and its specific interactions with other regions48. Thus, a connectivity profile distinct from neighbouring tissue has been a longstanding criterion for defining a cortical area. Accordingly, information on functional interac-tion and anatomical connectivity, which reflect func-tional integration, can be used for mapping the regional segregation of a brain area48.
We note that connectivity is itself a heterogeneous concept, referring to, for example, functional depend-encies (functional connectivity) or a physical connec-tion (structural connectivity). To provide an overview on the key lines of research, we focus on the three approaches that have been used most frequently in brain parcellation to date (Box 3): the estimation of anatomi-cal connectivity by tractography on diffusion-weighted images49; task-free functional connectivity assessed through resting-state echo planar imaging time series cor-relations50; and co-activations during task performance revealed through meta-analytic connectivity modelling51,52. These approaches all allow the inference of voxel-wise or vertex-wise structural or functional connectivity with other brain locations, which in turn allows the computation of a connectivity fingerprint15. Brain areas can be delineated directly from their functional con-nectivity or from their whole-brain connectivity fin-gerprint using either boundary mapping or clustering approaches. Of note, the parcellation technique can, in theory, be applied to any connectivity measure, such as structural covariance, although the latter has been less commonly used (Box 3). Thus, the most frequently used connectivity-based parcellations are based on
Non-negative matrix factorizationa multivariate statistical approach to factorize data into components promoting a part-based representation of the data.
Box 2 | Defining brain components with clustering and factorization
Neuroimaging data typically consist of values for thousands of voxels or vertices. Different approaches can be used to identify latent patterns of spatial organization in the data. these approaches are frequently referred to as unsupervised learning because the spatial pattern is unknown a priori, in contrast to supervised learning approaches, in which the true assignment of each data point is known a priori. In the framework of brain parcellation, two main unsupervised learning approaches can be distinguished: clustering and factorization. Clustering is used to group similar voxels or vertices together and apart from other, different voxels or vertices, whereas factorization organizes the data sets into dimensions and components that best represent variations in the data. Please note that this distinction is only for didactic purposes, as from a mathematical point of view, some clustering algorithms (such as k-means) can be seen as matrix factorization problems, and some factorization approaches (such as non-negative matrix factorization (NMF)) are frequently used within a clustering perspective. accordingly, some variants of k-means and NMF are mathematically equivalent124.
as mentioned above, from a more conceptual point of view, clustering approaches are typically used to group a set of objects into different groups in such a way that objects from the same group are more similar to each other than are objects from different groups. the clustering is based on the mathematical distance (that is, the dissimilarity) between the elements (in this context, voxels or vertices), computed usually based on their connectivity fingerprints. elements are grouped into clusters such that two elements that have similar connectivity fingerprints are assigned to the same cluster and, conversely, elements that have highly dissimilar connectivity profile are assigned to different clusters. the most widely used clustering algorithms in the connectivity- based parcellation (CBP) field are k-means clustering, spectral clustering and hierarchical clustering (see reF.53 for a comparative study).
Factorization approaches, by contrast, extract latent dimensions from data or find a low-dimensional representation of the elements’ profiles. the classical matrix factorization is principal component analysis (PCa), which identifies the main dimensions along which different data points vary.
By contrast, NMF19 approaches constrain the decomposed components to be strictly non-negative. together with additional constraints (for example, that components should be mostly zero, except in a small number of locations), NMF often yields a part-based decomposition of the data. For example, when applied to face photographs, NMF will yield components that represent distinct facial parts (such as nose, eyes and mouth). accordingly, NMF has an inherent clustering property, which allows the parcellation of the brain into localized components that mirror brain regions and has thus been successfully used for whole-brain partitions23,125.
importantly, all methods have distinct advantages and disadvantages, and thus the choice of approach should depend on the data at hand, as well as the objective of the parcellation. For example, NMF can model many different data distributions owing to the flexibility of matrix factorization, whereas k-means attempts to capture spherical clusters (in feature space). However, standard k-means yields a hard clustering, whereby each element (voxel or vertex) is uniquely assigned to either one cluster or another, whereas factorization approaches (such as fuzzy or soft clustering71) do not yield a clear, deterministic assignment. in soft partitioning, any given element (voxel or vertex) can be assigned to several groups by obtaining, for example, the probability of assignment to each group. However, a final spatial hard partition can be obtained when the scores from fuzzy clustering or factorization are integrated in a ‘winner-takes-all’ approach126. Currently, there are no clear guidelines for the use of these techniques in brain parcellation, owing to a lack of comprehensive empirical and theoretical studies that evaluate the advantages and limitations of each approach and variants thereof for different data sets and parcellation purposes.

www.nature.com/nrn
R e v i e w s
structural connectivity inferred from diffusion MRI, resting-state functional connectivity and task-based functional connectivity.
Boundary mapping versus clustering. In contrast to histological brain mapping, which has largely relied on border detection, connectivity-based parcellation (CBP) has mainly used clustering approaches to group voxels, such that connectivity fingerprints are as sim-ilar as possible within a group of voxels and as differ-ent as possible between groups of voxels. The resulting clusters represent different brain areas or networks. All
methods have their inherent assumptions, strengths and limitations, and the choice of algorithm imposes those assumptions on the resulting parcellation. Accordingly, different algorithms can yield different parcellations on the same data25,53,54. To date, relatively few studies have applied boundary mapping techniques to resting-state functional connectivity markers55–59 (Fig. 1) or clustering to markers of local properties32,35. There are, however, no technical or conceptual reasons for the dominant partnering of local properties and border detection on the one hand and the pairing of connectivity markers and clustering approaches on the other. Rather, either
Algorithm Boundary mapping Clustering or factorization
Markers
Local
Global
Histology-based:• Cytoarchitecture• Receptors• Myelin
MRI-based:• Myelin• Meta-analytic activation modelling
MRI-based:• Resting-state functional connectivity• Meta-analytic connectivity modelling• Diffusion tractography• Structural covariance
Border detection in cortex basedon cytoarchitecture
Clustering of amygdala voxels based on their activation in behavioural paradigms
Boundary mapping of resting-state functional connectivity of cerebral cortex
Clustering of cerebral cortex based on resting-state functional connectivity
3
3
5
5
2
2
4
4
1
1
Fig. 1 | A 2D taxonomy of brain parcellation approaches. Parcellation approaches can be classified along two dimensions. The marker dimension ranges from markers that capitalize on local properties of brain tissues, such as cell body density or functional MRI (fMRI) signal time course, to markers that capitalize on connectivity fingerprint48 across the brain. The other dimension categorizes parcellation approaches according to the algorithm used for defining parcels, distinguishing local boundary mapping techniques55 from global clustering (or factorization) approaches. At the top of the table are two examples of such approaches: on the left (under ‘Boundary mapping’), cortical regions were partitioned according to their resting-state functional connectivity55 and, on the right (under ‘Clustering or factorization’), a matrix reveals five distinct clusters of voxels in area 44 that show similar patterns of whole-brain co-activation, measured using fMRI/PET during different tasks72. In theory , any type of parcellation approach can be used for regional or whole-brain parcellation. Accordingly , each cell illustrates an example application of a local (left column) or global (right column) parcellation technique to markers of local (top row) or global (bottom row) properties. Top left cell: regions of the JuBrain atlas identified by border detection according to architectonic properties. Top right cell: parcellation of the amygdala into subregions with a clustering approach applied to behavioural meta-analytic data35 (activation studies across a wide range of paradigms probing cognitive, motor and socio-affective functions from the BrainMap database36). Bottom left cell: parcellation of the cerebral cortex based on boundary mapping applied to resting-state functional connectivity59. Bottom right cell: parcellation of the cerebral cortex into functional networks based on clustering applied to the resting-state functional connectivity70. “Boundary mapping” heading image adapted with permission from reF.55, Elsevier. “Clustering or factorization” heading image adapted with permission from reF.72, Elsevier. Left-hand cell images adapted with permission from reF.11, Elsevier. Top-right cell image adapted with permission from reF.35, Elsevier. Bottom-right cell image adapted with permission from J. Neurophysiol., Yeo, B. T. et al., 106, 2011, 1125–1165 (reF.70).
Spectral clusteringa clustering approach based on the eigenvectors of the matrix of similarity (such as connectivity) between brain locations (voxels or vertices). The term ‘spectral’ refers to the spectrum (eigenvalues) of the similarity matrix.
Hierarchical clusteringa clustering approach that disentangles clusters in a hierarchical fashion, in such a way that relationships between clusters can be visualized as a tree structure.
Principal component analysisa multivariate statistical approach to factorize data into orthogonal components that best represent variance in the data.
Fuzzy or soft clusteringa clustering approach in which points are not assigned to one single group but have a fractional value that represents their relative membership in each group.

Nature reviews | NeuroscieNce
R e v i e w s
type of neurobiological property may be assessed using either approach; the current predilection seems historically driven.
Indeed, boundary mapping and clustering can be considered complementary for capturing different aspects of brain organization and as such were very recently integrated into a single hybrid model54. This was done by using an objective function that promoted the assignment of vertices with similar connectivity profiles to the same region (that is, clustering) but at the same time encouraged the assignment of spatially adjacent vertices with different profiles to different regions (that is, boundary mapping). As illustrated in Supplementary Figure 1, the resulting brain par-cellation outperformed local and global approaches in terms of the homogeneity of the functional signal within the derived regions and also captured topo-graphic organization in sensorimotor and visual areas. Thus, combining local border detection with clustering may be a promising direction for future brain parcellations.
Examples of connectivity-based parcellations. CBP was first performed on structural connectivity mark-ers estimated from diffusion MRI. Behrens et al.49 and Johansen-Berg et al.60 computed probabilistic tractography for each seed voxel in the thalamus and medial fron-tal cortex, respectively, and then grouped these voxels according to their connectivity profiles. The resulting thalamic subregions corresponded to nuclei identi-fied by histological studies, and spatial clusters in the medial frontal cortex matched the supplementary and pre-supplementary motor areas defined by task acti-vation, providing important face validity. In another
study, CBP applied to resting-state functional connec-tivity markers55 demonstrated the existence of sharp local transitions in functional connectivity patterns across the cortex. Following these pioneering stud-ies, CBP based on resting-state functional connectiv-ity markers or on probabilistic tractography has been widely applied. Resting-state functional connectivity has proved particularly popular and accessible for esti-mating connectivity and has already been widely used for parcellation not only at the areal level but also at the network level, while still representing the focus of technical developments61,62.
Soon after, CBPs based on meta-analytic connectivity modelling63–65 and on structural covariance64,66 data were also introduced. As a proof of concept, meta-analytic connectivity modelling was first used to delineate the pre-supplementary motor area and the supplemen-tary motor area65, and both approaches (CBP based on meta-analytic connectivity modelling and CBP based on structural covariance) were then used to parcellate the insula63,64. Meta-analytic connectivity modelling has since been extensively used to parcellate cortical regions and subcortical structures, whereas structural covari-ance has been only sparingly used. The relatively limited use of the latter approach may relate to its complicated interpretation; it is based on structural data but used as a proxy for functional interactions. Importantly, CBPs based on different markers seem to converge towards a similar pattern of brain organization64,67, suggesting that they capture robust aspects of brain topography. Nevertheless, we should note that often such conver-gence was explicitly searched for or requested as a proof of concept, and some evidence suggests that at higher granularity, partitions based on different connectivity
a Retinotopy b Cytoarchitecture c Myelin mapping
V3A
V3
V3
V1
V1–V2V1
VP
V2
V2
V2
V2V
Fig. 2 | Mapping of visual areas with local markers. Different parcellation approaches converge towards similar delineations of visual areas. Visuotopic mapping (based on functional MRI (fMRI)) and cytoarchitecture mapping (based on ex vivo brain tissues) show consistency in the delineation of V1 from V2. Furthermore, myelin mapping (based here on MRI) distinguishes V1 and V2 from higher visual areas in a similar way to visuotopic and cytoarchitecture mapping. a | Delineation of V1 and V2 based on fMRI visuotopic mapping136. b | Mapping of visual areas based on cytoarchitecture137. c | Myelin mapping, based on MRI T1-weighted:T2-weighted ratio28, differentiates V1 and V2, which are heavily myelinated (red), from higher visual areas (such as V3), which show lower myelin ratios (yellow and green). Part a is adapted with permission from reF.136, National Academy of Sciences. Part b is adapted with permission from reF.31, Elsevier. Part c is republished with permission of Society for Neuroscience, from Mapping human cortical areas in vivo based on myelin content as revealed by T1- and T2-weighted MRI. Glasser, M. F. & Van Essen, D. C. 31, (2011)28; permission conveyed through Copyright Clearance Center, Inc.
Echo planar imagingan Mri sequence used for functional and diffusion imaging.
Meta-analytic connectivity modellinga method that aims to model functional connectivity in the brain based on a co-activation pattern across various activation studies.
Probabilistic tractographyan approach to estimate white-matter tract pathways in the brain from diffusion Mri images.
Structural covarianceThe pattern of covariations in measures of morphometry (such as grey-matter volume) across brain regions.

www.nature.com/nrn
R e v i e w s
measures tend to diverge64,68. Below, we briefly discuss challenges associated with CBP and new technical devel-opments before returning to the issue of divergence and convergence between partition schemes based on different markers.
Challenges associated with connectivity-based par-cellations. Parallel with the increase in the range of markers, CBP has undergone rapid development, which has produced divergent methods, leading to a rather heterogeneous literature. In fact, there are hardly any examples of CBP papers using the same approach. These technical developments and the ensuing challenges are
reviewed elsewhere69 but, here, we wish to highlight one critical aspect: the issue of selecting the number of clus-ters or parcels. First, we note that this may represent an ill-posed problem, as the brain has a multilevel organ-ization, and therefore, there may be no right number of parcels61,70. Instead, different granularities may reflect different levels of brain organization. Second, it must be remembered that clustering algorithms such as k-means can partition any data set into any number of clusters71. In combination with a lack of biological ground truth, the question of how many clusters or parcels to select has necessitated the development of evaluation proce-dures. Many studies have used internal information; that
Box 3 | Main connectivity measures used for parcellation
traditionally, the term ‘connectivity’ refers to physical connections via white-matter tracts, which can be demonstrated using invasive tracing techniques in experimental animals or ex vivo fibre-dissection methods. Moreover, structural connectivity can also be estimated using tractography based on diffusion-weighted images127 (although see reF.128). By contrast, functional relationships between different parts of the brain may be revealed by correlating the time series of signals from different voxels or vertices during task performance or, more commonly, in the absence of a behavioural task — that is, in the resting state129. Notably, anatomical connectivity and functional connectivity represent very broad concepts with many different measurement and computation approaches, each carrying its own advantages and challenges, as well as potentially unique contributions, to multimodal brain-mapping endeavours. the four approaches assessing connectivity most frequently used in brain parcellation are resting-state functional connectivity, meta-analytic connectivity modelling, diffusion tractography and structural covariance (see the table).
Meta-analytic connectivity modelling reflects task-based functional organization estimated from the co-activation patterns of voxels across many studies, whereas structural covariance reflects functional coupling that is suggested by concurrent morphological variations across a group of subjects. Both approaches rely on covariation across a population sample (structural covariance) or multiple group studies (meta-analytic connectivity modelling), in contrast to probabilistic diffusion tractography and resting-state functional connectivity, in which measures are inferred independently for each subject. within the structural versus functional taxonomy, structural covariance is in an ambiguous position, as it is a proxy for functional connectivity but inferred from statistical covariance in the brain structure.
Connectivity-based parcellation (CBP) was initially developed for connectivity computed at the individual subject level but was quickly extended to connectivity inferred from statistical dependencies across a
data set. each type of connectivity measure has its own strengths and limitations and is prone to particular artefacts. For example, diffusion tractography might yield spurious results128 owing to several factors. Crossing fibres might cause the tractography model to ‘jump’ between tracts, leading to false positives. Furthermore, diffusion tractography shows a gyral bias: more connections may be detected, hitting the crown of a gyrus rather than its wall, owing to the intrinsic geometry of cortical folds130,131. Conversely, tractography may also fail to infer the connectivity of grey-matter voxels or vertices near pial surfaces that are particularly spatially distant from white matter68. In addition, the limited spatial resolution of current tractography methods can potentially result in false negatives (missed connections), particularly with regard to small white fibres132.
Functional connectivity approaches are less affected by geometric factors, but signal loss and distortion are nevertheless common with functional Mri (fMri) near air–tissue interfaces. Furthermore, functional connectivity approaches are based on statistical dependencies between regions (either at the subject level in resting-state functional connectivity or at the group level in meta-analytic connectivity modelling and structural covariance) and are therefore sensitive to confounding factors. For example, fMri, particularly resting-state fMri (rs-fMri), is sensitive to various systemic influences, such as motion, respiratory and cardiovascular noise133,134. task-based fMri might be less influenced than rs-fMri by physiological noise but is usually more limited than the latter in terms of sample size (for example, the mean sample size across experiments in the BrainMap database36 is 12 subjects). although aggregation of studies (that is, in meta-analyses) can overcome the size limitation of individual studies, averaging across subjects and studies with different stereotaxic spaces limits spatial precision. Given that several known and unknown factors might potentially result in artefactual patterns, one approach for increasing the likelihood of a parcellation representing some true biological property is to retain only patterns that are consistent across markers and methods.
Crossing fibresindividual white-matter fibres whose spatial direction result in points where they meet or cross each other, complicating the estimation of their respective paths.
k-meansa clustering algorithm that divides a set of data points into k clusters by iteratively optimizing the definition of each cluster centroid and data points assigned to the clusters.
Type Data measured Main method Variant methods Parameters refs
fMRI and PET imaging (functional)
Task-based fMRI and PET
Activation during task Meta-analytic connectivity modelling
Within-fMRI study functional connectivity
• Task domains• Map or peak data
65
Resting-state fMRI Signal fluctuations at rest Cross-time correlation in signal fluctuations
• Signal denoising• Target voxels or ROI
55
Imaging of co-plasticity (structural)
Anatomical MRI Structural variation in morphology in anatomical scan
Cross-subject correlation in grey-matter volume (structural covariance)
Cortical thickness135 • Segment modulation• Smoothing• Target voxels or ROI
64,66
Structural or anatomical
Diffusion MRI Estimation of fibre direction
Probabilistic diffusion tractography
Deterministic tractography
• Seed WM masking• Target voxels or ROI
49
fMRI, functional MRI; PET, positron emission tomography ; ROI, region of interest, WM, white matter.
Nature reviews | NeuroscieNce
R e v i e w s
is, information within the data. For example, consider-ing that a good clustering should maximize variance between clusters and minimize variance within clusters, the ratio of these variances can be used to character-ize cluster separation and to select the optimal number of clusters. Such internal information criteria mainly target the quality of the yielded clustering when con-sidered purely from a technical point of view — that is, within the framework of an unsupervised learning problem. Although these criteria have been frequently used in CBP studies72–74, a good clustering from a data representation perspective might not necessarily repre-sent a good partition with regards to the neurobiology that the approach aims to reveal — particularly in the presence of, for example, structured noise or outliers.
Consequently, there is increasing interest in evalua-tion criteria for assessing parcellations that go beyond characterizing the quality of data representation. For example, assuming that partitions driven by biologi-cal truth should be more stable across different sam-ples, reproducibility may indicate biological validity. Many studies have hence investigated stability across re-sampling and reproducibility across independent samples to propose optimal partitions70,75. Along the same lines, some recent studies have capitalized on the richness of technical variants (that is, the use of differ-ent data preprocessing and/or clustering algorithms) to examine the robustness of the parcellation scheme across different analyses22,31. The underlying idea here is that a partition scheme that is constant across dif-ferent techniques is likely to be driven by the under-lying neurobiology rather than methodological effects. Nevertheless, because such resampling methods do not rule out the influence of consistent artefacts within the same measurement technique, evidence of convergence across different markers has also more recently been used for so-called cross-modal validation67,68,70,76. Thus, in the absence of apparent ground truth, current par-cellation work capitalizes on replication, robustness and convergence as proxies for biological validity.
Divergence between propertiesThe idea that different neurobiological properties should show similar patterns of organization was already noted in 1925 by von Economo and Koskinas and has remained a fundamental axiom of brain mapping. As written by Zilles and colleagues77 in 2002, “all these architectonic and functional imaging studies support the hypothesis of a correlated structural and functional subdivision of the cortex.” Such convergence across properties is indeed frequently observed (Fig. 2). Accordingly, especially with the emergence of CBP, convergence with previous brain maps (particularly from cytoarchitecture) has been used to argue for the validity of newly developed methods. We stress, however, that no property, be it resting-state connectivity, cytoarchitecture, diffusion tractography or task-based activation patterns, should be considered conceptually superior to any other modality, as each represents its own specific window into the topographic organization of the human brain. The prevailing notion that there is a gold-standard parcellation method thus seems misleading. Rather, the critical question is how to
examine and interpret the convergence and divergence across parcellation results.
Although consistency across neurobiological proper-ties certainly instils confidence in the robustness of a par-cellation, we note a confusing development. There seems to have been a gradual shift from providing arguments that a newly conceived method may identify meaningful patterns towards the notion that parcellations must nec-essarily converge if they are to be considered biologically relevant41,78. This notion is in stark contrast to the fun-damental idea that different properties reflect different aspects of brain organization79. In fact, divergences in the topographical maps evidenced by different markers can actually be found quite frequently in the literature, although they are rarely highlighted80. For example, his-tological features mainly show an organization of the hippocampus along the medial–lateral axis6, whereas connectivity markers will primarily reveal an organiza-tion along the anterior–posterior axis81,82. Notably, such differences are largely irrelevant from a data compres-sion perspective, as the best representation of the data is specific to the data in hand and to the purpose of the representation11,83. For example, a CBP derived from resting-state functional connectivity provides a good condensed representation of voxel-wise data for subse-quent analyses of fMRI signals, with resulting parcels being more homogeneous in terms of resting-state signal than, for example, cytoarchitectonic areas83.
From a conceptual view, however, such differences between topographical maps that have been derived using different markers arguably deserve more attention than they have received up to now. The fact that each neurobiological property represents a unique window into brain organization suggests that several different, equally valid maps can be derived from the analysis of different markers, such as cytoarchitecture, connectivity or function. Furthermore, this conceptualization implies that parcellation based on any given characteristic (such as cytoarchitecture) cannot be used as a completely faith-ful surrogate for parcellation based on another character-istic (such as anatomical connectivity)44,84, although it can be expected to have some predictive value (see below).
Nevertheless, inferences on brain organization that are based on any one specific marker in isolation might also be difficult because all methods are susceptible to artefacts. In particular, MRI-based markers indirectly represent biological features (Box 3), whereas analyses of histological sections are susceptible to geometric dis-tortions resulting from tangential sectioning. Hence, one approach for increasing the likelihood that a par-cellation represents a biological property of the brain is to retain only those patterns that are consistent across parcellations based on different markers and methods, even though this approach comes at the cost of poten-tially missing important aspects of brain organization not revealed by all markers and methods.
Multimodal approachesAlthough the idea of integrating different approaches towards a universal whole-brain (or cortical) map has been around for many years12, the perspective has been only recently concretized in humans16,85. Although we
www.nature.com/nrn
R e v i e w s
refer to these approaches as ‘multimodal’, this term should not be taken as referring to different MRI modalities but more generically to studies investigating different markers for parcellation, be they MRI-based (such as resting-state functional connectivity) or not (for example, based on a receptor fingerprint).
First endeavours of multimodal approaches. Several studies have derived multimodal parcels by retaining the spatial overlap between clusters from unimodal parcella-tions. For example, resting-state functional connectivity, meta-analytic connectivity modelling and probabilistic tractography parcellation schemes were superimposed to derive robust parcels in the superior parietal lobule86, in the dorsal premotor cortex68 and even in a small sub-cortical structure, the nucleus accumbens87. Thus, the cluster conjunction approach has provided encouraging results for brain cartography in terms of representing robust, fundamental units11.
However, such conjunction allows unequivocal mapping only when all unimodal parcellations reveal a similar pattern, whereas the procedure for dealing with substantial discrepancies between unimodal parcella-tions remains an open challenge. Most previous studies chose to exclude ambiguous voxels, but doing this can lead to a fragmented and incomplete map. Furthermore, we anticipate that when a convergence between partition schemes based on different markers can be observed, it will be restricted to subdivisions at certain spatial scales64,68, thus enforcing the conjunction at a level of partitions that might not be optimal (for example, less stable) for each unimodal partition when considered in isolation. Thus, there is no guarantee that this approach could be successfully applied to the whole brain and yield a biologically valid map.
One strategy to avoid such a situation lies in mul-timodal integration before partitioning. Using a semi-automated border identification approach, an innovative integration of MRI-derived local and connec-tivity measures into a unique parcellation was recently performed16. As a fully automated detection of borders is prone to false positives (because abrupt changes in marker distribution can be driven by artefacts), a trained (human) observer supervised the procedure and ulti-mately accepted or rejected each automatically detected border. This approach has the advantage of being able to integrate decades of prior knowledge on brain organ-ization but conversely comes with the drawback that a priori knowledge and expectations of brain organization may bias the ensuing parcellation.
Challenges in integrating properties. An important but underappreciated aspect of multimodal brain par-cellation is the fact that different properties should be expected to provide complementary information about regional brain organization80. Arguably, only a combi-nation of different measures may allow a true under-standing of topographic organization in the human brain. However, three sub-goals may potentially conflict here. First, a multimodal approach should retain infor-mation relating to each property. Second, a multimodal approach should neutralize artefacts or spurious patterns
that occur in only one measure. Third, the approach should be data-driven to minimize potential biases from a priori and subjective expectations. These are poten-tially contradictory requirements because a pattern observed in only one modality could reflect a biolog-ical aspect that is uniquely captured by that modality or an artefact of the technique. In turn, artefacts can be detected by human inspection, but such intervention is ultimately observer-dependent and may hinder the dis-covery of new patterns that are not expected from previ-ous literature. Considering these issues, we discuss below two potential strategies to maximize the information retained and to minimize manual intervention.
Maximizing the number of modalities. One basic axiom is that different modalities reflect the many dimensions along which the brain is organized. For example, the frontal lobe is organized along rostro–caudal, ventro–dorsal and medial–lateral axes88. Let us accordingly consider three dimensions A, B and C. Suppose a given marker predominantly reflects dimen-sion A; to a lesser extent, dimension B; and to an even more minor extent, dimension C. By contrast, another marker might mostly reflect dimension B; to a lesser extent, dimension A; and to even lesser extent, dimen-sion C. Integrating both modalities would maximize the likelihood of capturing brain organization along both dimensions A and B. Such integration would also offer greater insights into dimension C than either of the modalities considered in isolation. However, the inte-gration of modalities might still not optimally represent brain organization along dimension C. An additional modality sensitive to dimension C would be necessary to fully capture this last dimension.
In other words, we expect that the higher the num-ber of different modalities is, the higher the chance to fully capture each dimension or organizational aspect. This strategy would not only promote an optimal cov-erage of the multiple organizational dimensions of the brain but also contribute to disentangling true neuro-biological aspects from artefacts with minimal human intervention. We therefore argue that a multimodal approach should maximize the number and the diversity of modalities. This pertains particularly to the integra-tion of structural, functional and connectional measures across both MRI and, importantly, histological meas-ures. To the best of our knowledge, such integration has not yet been achieved. Thus far, the few published mul-timodal studies have focused exclusively on MRI-based features16,68,86,87,89, and integration of histological features with MRI-based features has been performed in only one specimen85. For example, the integration of histo-logical myelin maps with MRI-derived proxies thereof has been unexplored to date, but such integration would provide at least some protection against method-specific artefacts or biases.
Towards a multimodal map with predictive value. The integration of different markers poses technical challenges, and how divergent parcellations should be conceptualized also remains an open topic. That is, if different properties, such as microstructure and

Nature reviews | NeuroscieNce
R e v i e w s
long-range connectivity, indeed reflect different organ-izational dimensions, how should a multimodal map of cortical areas be defined? Although certainly a prema-ture idea at the current stage, we suggest that an opti-mal representation of multiple divergent parcellations is defined by an ‘or’ combination of unimodal borders. Concretely, wherever the local information-processing infrastructure or the pattern of interactions changes, a new region should be defined. Such an approach might potentially contribute to disentangling small regions, called domains, that have been observed in invasive studies in non-human primates and that are hypoth-esized to exist in humans. The primary example of domains are separable entities in the posterior parietal cortex, primary motor and premotor cortex that seem to be related to different kinds of movements (for example, defence of the head) and could support close functions in humans, such as protective behaviour of periper-sonal space90,91. An ‘or’ combination across a multi-modal map might help to disclose those small entities but could also include spurious borders owing to modality-specific artefacts.
One avenue to empirically evaluate different methods for combining multiple maps is through supervision on a meta-level by testing which approach holds the high-est predictive value for brain function and dysfunction. In other words, an optimal multimodal map should provide the best prediction of task-related activations, behavioural phenotype and/or clinical symptoms. For example, a map that divides the hippocampus along both the anterior–posterior axis (based on connectivity) and the medial–lateral axis (based on histology) might better predict clinical phenotype (in Alzheimer disease or major depressive disorder) with supervised machine learning than either connectivity-based or histological maps alone.
We note that this view is in line with a long tradi-tion in brain cartography, as even early brain-mapping books sought to relate partitioning to behavioural (dys-) function. For example, intracranial stimulation in two distinct areas in non-human primates induced differ-ent patterns of interference with animal behaviour92. In humans, invasive cortical stimulation mapping in surgical patients mirrors such functional validation18. The neuropsychological lesion–deficit approach can also contribute to the distinction of different brain areas, despite several limitations93. Alternatively, the validity of functional maps can be tested in surgical patients based on their ability to predict post-surgical deficits. Hence, being more controlled than the post hoc lesion approach, investigation in surgical patients can be seen as a gold standard for functional mapping. This deficit-based view should then be complemented by a detailed, again multimodal characterization of the physiological properties of the delineated areas in order to build a functionally comprehensive atlas upon the spatial parcellation scheme.
Multimodal and unimodal maps. Importantly, testing the validity of a multimodal map based on its predic-tive value remains relatively unexplored. Given that each type of neurobiological property is differentially
informative80, the concept of such map may itself be open to debate. For example, Glasser et al.’s16 multi-modal parcellation gives an excellent separation between motor and somatosensory areas but does not provide somatotopic or visuotopic information. Accordingly, the interpretability and relevance of such a map can be debated, although the latter may be proxied by its predic-tive value. We initially proposed that a multimodal map would have more predictive value than any unimodal map. We nevertheless should raise the point that, con-ceptually, individual maps may outperform multimodal maps with respect to the prediction of some phenotypes. For example, a map yielded by tractography mapping could have a higher predictive value in multiple scle-rosis atrophy and symptoms than would a map derived from resting-state functional connectivity, whereas the latter may have better predictive value for schizophre-nia diagnosis and subtyping. Accordingly, a collection of unimodal maps may have its own place in understand-ing brain–behaviour relationships and may complement multimodal maps.
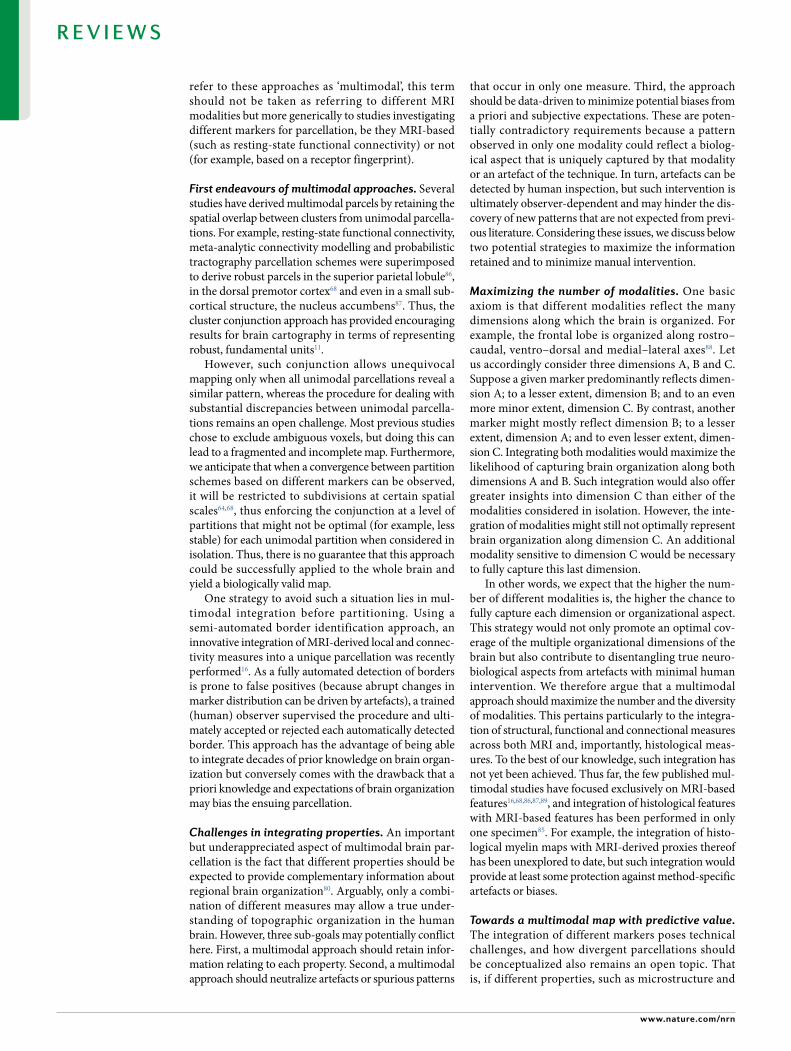
Future questions and challengesInter-individual variability. An important consid-eration for building a general representation of brain organization pertains to inter-subject variability, which is encountered at all spatial levels and in all neurobio-logical properties, from histology6,17,94 to large-scale net-works95,96. Group-based parcellation schemes generally capture the main aspects of organization evident across individuals, whereas the size, shape and position of areas and networks can vary substantially between individ-uals5,18,19,76,97 (Fig. 3). Furthermore, divergent patterns of brain organization from the most common pattern (that is, changes in the spatial arrangement of cortical regions) can be observed in approximately 5–10% of the healthy population16,19, and care should therefore be taken to avoid the undue influence of such outliers. Notwithstanding their non-conformation to a theo-retically universal map of the brain, such topological outliers, if they do not result from artefacts, can also be considered to be interesting cases of inter-individual var-iability to understand brain–phenotype relationships98. Indeed, recent studies have suggested that the top o-graphy (location and size) of individual-specific brain parcellations is predictive of individual differences in demographics, cognition, emotion and personality3,5,99. In this context, we would argue that the quest to under-stand robust patterns of brain topography across differ-ent markers and the investigation of inter-individual differences are closely intertwined challenges. Only by understanding the generic characteristic of topographic organization can we start to appreciate idiosyncrasies and their relationships to socio-demographic, cognitive or affective profiles.
Further complicating the understanding of inter- individual differences, regions that show high inter-individual variability often also show substantial changes across ontogenesis and phylogenesis and even exhibit inter-hemispheric asymmetry35,95,100,101. This coexist-ence of different, albeit related, issues has caused many debates on the true structure and function of these ‘hot
DomainsSpatial units in the brain that are smaller than usual brain regions and show specific functions.
www.nature.com/nrn
R e v i e w s
regions’, which include, for example, the inferior por-tion of the posterior middle frontal gyrus. Although this region had long been somewhat neglected, the recent multimodal parcellation by Glasser et al.16 found strik-ing local and connectivity marker changes in that region relative to adjacent regions, as well as activation during language tasks, leading to the hypothesis of the exist-ence of a new ‘area 55b’ devoted to language functions. However, the authors also pointed out that this area showed high inter-individual variability. Furthermore, meta-analytic investigation revealed an engagement of this region in language functions only in the left hemi-sphere68. Generally, as many brain structures seem to be symmetric at the macrostructural and microstructural levels102, hemispheric symmetry is implicitly assumed and often prioritized in parcellation studies16,103. Never-theless, studies that do not pose such constraints have revealed different patterns of organization across hemi-spheres (that is, asymmetry) in neocortical70 but also evolutionarily older brain structures81,104. In sum, the extent to which the brain is symmetrically organized can be considered an open question. Asymmetries in brain structure can be observed early in human develop-ment105, but functional asymmetries are probably further shaped across ontogenesis to varying extents in different individuals. In other words, functional (a)symmetry is highly variable across individuals, making it difficult to draw conclusive evidence for a strict symmetry or asym-metry in some regions. Following these assumptions,
future studies should test whether individual patterns of brain functional asymmetry are associated with or predict individual phenotypes.
Studies of ontogeny and phylogeny. The question of symmetry and the influence of ontogeny will become particularly interesting when considering, for example, the prefrontal cortex — a highly variable, evolutionarily new brain region that matures relatively late compared with other brain regions and shows evidence for strong hemispheric specialization106,107. Both developmental and phylogenetic aspects, however, are still rarely con-sidered in the context of studies of brain parcellation, though we expect this may change rapidly. Although multimodal MRI captures only a limited repertoire of neurobiological properties, it has the advantage of being readily performed not only at different stages across the human lifespan but also in non-human primates or rodents. Comparisons with non-human primates have often highlighted similarities in brain organization to humans8,108–113, but there is also evidence of differences114. For example, a recent study has suggested the existence of an area called FPl (referring to its lateral frontal pole location) in humans that lacks correspondence with any region in the macaque prefrontal cortex115. Similarly, the first studies of brain organization in non-human primates with approaches mirroring those used in humans have been only recently performed44,84,116,117. In turn, and quite surprisingly, systematic comparisons of
a b c Subject A
Subject B
Subject C
Subject I
Subject 1
Subject 2
Subject 3
Subject II
Subject III
Day 1 Day 2
Fig. 3 | inter-individual variability in functional parcellation. Organization of individual-specific cortical parcellations echoes that of group-level parcellations but also exhibits substantial inter-individual variability. a | Network-level parcellations of Human Connectome Project (HCP) individuals using a half hour of resting-state functional MRI (rs-fMRI) data per participant18. b | By exploiting a large quantity of data (5 hours per participant) from the Midnight Scan Club, highly detailed network-level (left) and area-level (right) parcellations of individual participants were generated97. c | Recent algorithmic advances allow the delineation of highly detailed network-level parcellations using a half hour of data per HCP participant5. Consistent with multiple studies, individual-specific networks exhibit unique topological features that are highly replicable across two different days (black arrows). Part a is adapted from reF.18, Springer Nature Limited. Part b is adapted with permission from reF.97, Elsevier. Part c is adapted from Kong, R . et al. Spatial topography of individual-specific cortical networks predicts human cognition, personality and emotion, Cereb. Cortex, 2018, https://doi.org/10.1093/cercor/bhy123 (reF.5), by permission of Oxford University Press.

parcellations across the human lifespan are still com-pletely absent, even though there is no doubt that brain structure, function and connectivity dynamically change throughout the entire human lifespan.
ConclusionsIn contrast to histological brain mapping, which has a long history and is a relatively mature field, imaging-based parcellation is a recent approach that has evolved across different dimensions, including various different methods, markers and evaluation approaches. The recent combination of local and global mapping techniques has raised the opportunity for parcellations that capture both areal and network organization. This double optimization might reconcile the objective of opti-mal whole-brain representation for data compression and accurate representation of well-defined brain areas for neuroscientific inferences. Recent progress in high-field scanners will provide support for mapping of imaging properties that are closer to the microstructure, such as whole-brain patterns of lamination. We can expect that, in the future, the application of hybrid algorithms to high-resolution MRI data should open new vistas in which brain areas are delineated in vivo based on a com-bination of information related to their microstructure and their integration into larger networks.
From a cartography perspective, the many markers offered by MRI should support robust mapping of brain
areas by crossing partition schemes that are revealed by different modalities. Nevertheless, considered separately, the different organizational topographies revealed by markers reflecting different neurobiological properties are also likely to have a crucial role in our understand-ing of the organizational dimensions of the brain. Given that these dimensions underlie the architecture of the human mind, characterizing the relationship between these topographies and behavioural functions should bring new insight into the understanding of the human mind, behaviour and dysfunction93. In addition to the richness of MRI markers, large MRI data sets have been acquired around the world and across different periods of the human lifespan. The availability of these data opens up new possibilities towards the characteriza-tion and understanding of inter-individual variability, brain asymmetry and the dynamics of inter-individual variability and brain asymmetry across lifespan devel-opment. Along the same lines, although parcellation in non-human primates is still in its infancy, it should bring complementary insights into brain phylogeny. Thus, imaging-based brain parcellation, following extensive developments and applications in the recent decade, still holds great promise for revolutionizing our under-standing of human brain organization and its relation to human behaviour.
Published online xx xx xxxx
1. Tononi, G., Sporns, O. & Edelman, G. M. A measure for brain complexity: relating functional segregation and integration in the nervous system. Proc. Natl Acad. Sci. USA 91, 5033–5037 (1994).
2. Fox, P. T. & Friston, K. J. Distributed processing; distributed functions? NeuroImage 61, 407–426 (2012).
3. Bijsterbosch, J. D. et al. The relationship between spatial configuration and functional connectivity of brain regions. eLife 7, e32992 (2018).
4. Cachia, A. et al. How interindividual differences in brain anatomy shape reading accuracy. Brain Struct. Function 223, 701–712 (2018).
5. Kong, R. et al. Spatial topography of individual- specific cortical networks predicts human cognition, personality and emotion. Cereb. Cortex https://doi.org/10.1093/cercor/bhy123 (2018). References 3–5 demonstrate that fine- scale inter- individual differences in brain anatomy and parcellations are predictive of individuals’ behaviour, such as cognitive performance and personality traits.
6. Amunts, K. et al. Cytoarchitectonic mapping of the human amygdala, hippocampal region and entorhinal cortex: intersubject variability and probability maps. Anat. Embryol. 210, 343–352 (2005).
7. Strange, B. A., Witter, M. P., Lein, E. S. & Moser, E. I. Functional organization of the hippocampal longitudinal axis. Nat. Rev. Neurosci. 15, 655–669 (2014).
8. Geyer, S. & Zilles, K. in Higher- Order Motor Disorders: From Neuroanatomy and Neurobiology to Clinical Neurology (eds Freund, H.-J., Jeannerod, M., Hallett, M. & Leiguarda, R.) 3–22 (Oxford Univ. Press, 2005).
9. Schubotz, R. I., Anwander, A., Knösche, T. R., von Cramon, D. Y. & Tittgemeyer, M. Anatomical and functional parcellation of the human lateral premotor cortex. NeuroImage 50, 396–408 (2010).
10. Churchland, P. S. & Sejnowski, T. J. Perspectives on cognitive neuroscience. Science 242, 741–745 (1988).
11. Eickhoff, S. B., Constable, R. T. & Yeo, B. T. Topographic organization of the cerebral cortex and brain cartography. NeuroImage 170, 332–347 (2017).
12. Felleman, D. J. & Van Essen, D. C. Distributed hierarchical processing in the primate cerebral cortex. Cereb. Cortex 1, 1–47 (1991).
13. Amunts, K. & Zilles, K. Architectonic mapping of the human brain beyond Brodmann. Neuron 88, 1086–1107 (2015).
14. Brodmann, K. Vergleichende Lokalisationslehre der Grosshirnrinde in ihren Prinzipien dargestellt auf Grund des Zellenbaues (Johann Ambrosius Barth, 1909).
15. Preuss, T. M. & Goldman- Rakic, P. S. Architectonics of the parietal and temporal association cortex in the strepsirhine primate Galago compared to the anthropoid primate Macaca. J. Comp. Neurol. 310, 475–506 (1991).
16. Glasser, M. et al. A multi- modal parcellation of human cerebral cortex. Nature 536, 171–178 (2016). This study represents an impressive endeavour to build a comprehensive multimodal brain map using in vivo MRI.
17. Amunts, K. et al. Broca’s region revisited: cytoarchitecture and intersubject variability. J. Comp. Neurol. 412, 319–341 (1999).
18. Wang, D. et al. Parcellating cortical functional networks in individuals. Nat. Neurosci. 18, 1853–1860 (2015).
19. Gordon, E. M., Laumann, T. O., Adeyemo, B. & Petersen, S. E. Individual variability of the system- level organization of the human brain. Cereb. Cortex 27, 386–399 (2017).
20. Finn, E. S. et al. Functional connectome fingerprinting: identifying individuals using patterns of brain connectivity. Nat. Neurosci. 18, 1664–1671 (2015).
21. Davatzikos, C. Computational neuroanatomy using brain deformations: from brain parcellation to multivariate pattern analysis and machine learning. Med. Image Anal. 33, 149–154 (2016).
22. Miller, K. L. et al. Multimodal population brain imaging in the UK Biobank prospective epidemiological study. Nat. Neurosci. 19, 1523–1536 (2016).
23. Varikuti, D. P. et al. Evaluation of non- negative matrix factorization of grey matter in age prediction. NeuroImage 173, 394–410 (2018).
24. Bullmore, E. & Sporns, O. Complex brain networks: graph theoretical analysis of structural and functional systems. Nat. Rev. Neurosci. 10, 186–198 (2009).
25. Arslan, S. et al. Human brain mapping: a systematic comparison of parcellation methods for the human cerebral cortex. NeuroImage 170, 5–30 (2017). This study provides an extensive evaluation of parcellation approaches based on resting- state functional connectivity.
26. Smith, S. M. et al. Correspondence of the brain’s functional architecture during activation and rest. Proc. Natl Acad. Sci. USA 106, 13040–13045 (2009).
27. Lutti, A., Dick, F., Sereno, M. I. & Weiskopf, N. Using high- resolution quantitative mapping of R1 as an index of cortical myelination. NeuroImage 93, 176–188 (2014).
28. Glasser, M. F. & Van Essen, D. C. Mapping human cortical areas in vivo based on myelin content as revealed by T1-and T2-weighted MRI. J. Neurosci. 31, 11597–11616 (2011).
29. De Martino, F. et al. High- resolution mapping of myeloarchitecture in vivo: localization of auditory areas in the human brain. Cereb. Cortex 25, 3394–3405 (2015).
30. Sereno, M. I., Lutti, A., Weiskopf, N. & Dick, F. Mapping the human cortical surface by combining quantitative T1 with retinotopy. Cereb. Cortex 23, 2261–2268 (2012).
31. Wilms, M. et al. Comparison of functional and cytoarchitectonic maps of human visual areas V1, V2, V3d, V3v, and V4 (v). NeuroImage 49, 1171–1179 (2010).
32. Orban, P. et al. The richness of task- evoked hemodynamic responses defines a pseudohierarchy of functionally meaningful brain networks. Cereb. Cortex 25, 2658–2669 (2015).
33. Huth, A. G., de Heer, W. A., Griffiths, T. L., Theunissen, F. E. & Gallant, J. L. Natural speech reveals the semantic maps that tile human cerebral cortex. Nature 532, 453–458 (2016).
34. Kurth, F., Zilles, K., Fox, P. T., Laird, A. R. & Eickhoff, S. B. A link between the systems: functional differentiation and integration within the human insula revealed by meta- analysis. Brain Struct. Funct. 214, 519–534 (2010).
35. Yang, Y. et al. Identifying functional subdivisions in the human brain using meta- analytic activation modeling- based parcellation. NeuroImage 124, 300–309 (2016).
36. Laird, A. R., Lancaster, J. L. & Fox, P. T. BrainMap: the social evolution of a human brain mapping database. Neuroinformatics 3, 65–78 (2005).
37. Yarkoni, T., Poldrack, R. A., Nichols, T. E., Van Essen, D. C. & Wager, T. D. Large- scale automated synthesis of human functional neuroimaging data. Nat. Methods 8, 665–670 (2011).
Nature reviews | NeuroscieNce
R e v i e w s
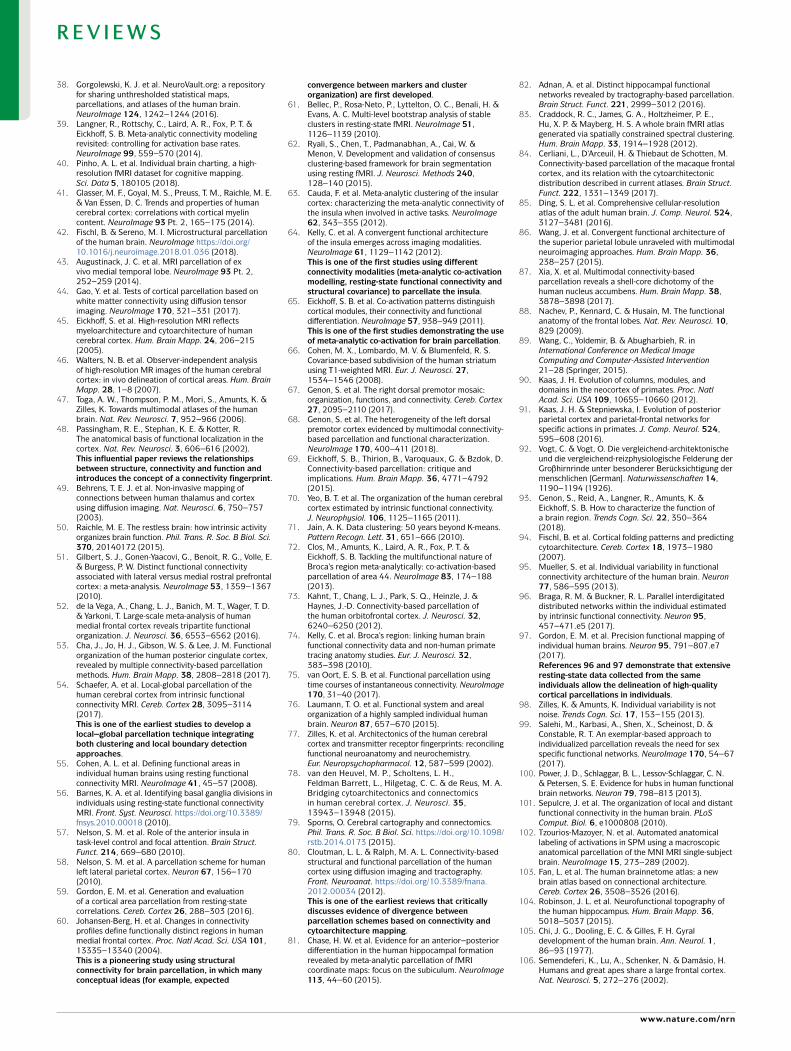
www.nature.com/nrn
R e v i e w s
38. Gorgolewski, K. J. et al. NeuroVault.org: a repository for sharing unthresholded statistical maps, parcellations, and atlases of the human brain. NeuroImage 124, 1242–1244 (2016).
39. Langner, R., Rottschy, C., Laird, A. R., Fox, P. T. & Eickhoff, S. B. Meta- analytic connectivity modeling revisited: controlling for activation base rates. NeuroImage 99, 559–570 (2014).
40. Pinho, A. L. et al. Individual brain charting, a high- resolution fMRI dataset for cognitive mapping. Sci. Data 5, 180105 (2018).
41. Glasser, M. F., Goyal, M. S., Preuss, T. M., Raichle, M. E. & Van Essen, D. C. Trends and properties of human cerebral cortex: correlations with cortical myelin content. NeuroImage 93 Pt. 2, 165–175 (2014).
42. Fischl, B. & Sereno, M. I. Microstructural parcellation of the human brain. NeuroImage https://doi.org/ 10.1016/j.neuroimage.2018.01.036 (2018).
43. Augustinack, J. C. et al. MRI parcellation of ex vivo medial temporal lobe. NeuroImage 93 Pt. 2, 252–259 (2014).
44. Gao, Y. et al. Tests of cortical parcellation based on white matter connectivity using diffusion tensor imaging. NeuroImage 170, 321–331 (2017).
45. Eickhoff, S. et al. High- resolution MRI reflects myeloarchitecture and cytoarchitecture of human cerebral cortex. Hum. Brain Mapp. 24, 206–215 (2005).
46. Walters, N. B. et al. Observer- independent analysis of high- resolution MR images of the human cerebral cortex: in vivo delineation of cortical areas. Hum. Brain Mapp. 28, 1–8 (2007).
47. Toga, A. W., Thompson, P. M., Mori, S., Amunts, K. & Zilles, K. Towards multimodal atlases of the human brain. Nat. Rev. Neurosci. 7, 952–966 (2006).
48. Passingham, R. E., Stephan, K. E. & Kotter, R. The anatomical basis of functional localization in the cortex. Nat. Rev. Neurosci. 3, 606–616 (2002). This influential paper reviews the relationships between structure, connectivity and function and introduces the concept of a connectivity fingerprint.
49. Behrens, T. E. J. et al. Non- invasive mapping of connections between human thalamus and cortex using diffusion imaging. Nat. Neurosci. 6, 750–757 (2003).
50. Raichle, M. E. The restless brain: how intrinsic activity organizes brain function. Phil. Trans. R. Soc. B Biol. Sci. 370, 20140172 (2015).
51. Gilbert, S. J., Gonen- Yaacovi, G., Benoit, R. G., Volle, E. & Burgess, P. W. Distinct functional connectivity associated with lateral versus medial rostral prefrontal cortex: a meta- analysis. NeuroImage 53, 1359–1367 (2010).
52. de la Vega, A., Chang, L. J., Banich, M. T., Wager, T. D. & Yarkoni, T. Large- scale meta- analysis of human medial frontal cortex reveals tripartite functional organization. J. Neurosci. 36, 6553–6562 (2016).
53. Cha, J., Jo, H. J., Gibson, W. S. & Lee, J. M. Functional organization of the human posterior cingulate cortex, revealed by multiple connectivity- based parcellation methods. Hum. Brain Mapp. 38, 2808–2818 (2017).
54. Schaefer, A. et al. Local- global parcellation of the human cerebral cortex from intrinsic functional connectivity MRI. Cereb. Cortex 28, 3095–3114 (2017). This is one of the earliest studies to develop a local–global parcellation technique integrating both clustering and local boundary detection approaches.
55. Cohen, A. L. et al. Defining functional areas in individual human brains using resting functional connectivity MRI. NeuroImage 41, 45–57 (2008).
56. Barnes, K. A. et al. Identifying basal ganglia divisions in individuals using resting- state functional connectivity MRI. Front. Syst. Neurosci. https://doi.org/10.3389/fnsys.2010.00018 (2010).
57. Nelson, S. M. et al. Role of the anterior insula in task- level control and focal attention. Brain Struct. Funct. 214, 669–680 (2010).
58. Nelson, S. M. et al. A parcellation scheme for human left lateral parietal cortex. Neuron 67, 156–170 (2010).
59. Gordon, E. M. et al. Generation and evaluation of a cortical area parcellation from resting- state correlations. Cereb. Cortex 26, 288–303 (2016).
60. Johansen- Berg, H. et al. Changes in connectivity profiles define functionally distinct regions in human medial frontal cortex. Proc. Natl Acad. Sci. USA 101, 13335–13340 (2004). This is a pioneering study using structural connectivity for brain parcellation, in which many conceptual ideas (for example, expected
convergence between markers and cluster organization) are first developed.
61. Bellec, P., Rosa- Neto, P., Lyttelton, O. C., Benali, H. & Evans, A. C. Multi- level bootstrap analysis of stable clusters in resting- state fMRI. NeuroImage 51, 1126–1139 (2010).
62. Ryali, S., Chen, T., Padmanabhan, A., Cai, W. & Menon, V. Development and validation of consensus clustering- based framework for brain segmentation using resting fMRI. J. Neurosci. Methods 240, 128–140 (2015).
63. Cauda, F. et al. Meta- analytic clustering of the insular cortex: characterizing the meta- analytic connectivity of the insula when involved in active tasks. NeuroImage 62, 343–355 (2012).
64. Kelly, C. et al. A convergent functional architecture of the insula emerges across imaging modalities. NeuroImage 61, 1129–1142 (2012). This is one of the first studies using different connectivity modalities (meta- analytic co- activation modelling, resting- state functional connectivity and structural covariance) to parcellate the insula.
65. Eickhoff, S. B. et al. Co- activation patterns distinguish cortical modules, their connectivity and functional differentiation. NeuroImage 57, 938–949 (2011). This is one of the first studies demonstrating the use of meta- analytic co- activation for brain parcellation.
66. Cohen, M. X., Lombardo, M. V. & Blumenfeld, R. S. Covariance- based subdivision of the human striatum using T1-weighted MRI. Eur. J. Neurosci. 27, 1534–1546 (2008).
67. Genon, S. et al. The right dorsal premotor mosaic: organization, functions, and connectivity. Cereb. Cortex 27, 2095–2110 (2017).
68. Genon, S. et al. The heterogeneity of the left dorsal premotor cortex evidenced by multimodal connectivity- based parcellation and functional characterization. NeuroImage 170, 400–411 (2018).
69. Eickhoff, S. B., Thirion, B., Varoquaux, G. & Bzdok, D. Connectivity- based parcellation: critique and implications. Hum. Brain Mapp. 36, 4771–4792 (2015).
70. Yeo, B. T. et al. The organization of the human cerebral cortex estimated by intrinsic functional connectivity. J. Neurophysiol. 106, 1125–1165 (2011).
71. Jain, A. K. Data clustering: 50 years beyond K- means. Pattern Recogn. Lett. 31, 651–666 (2010).
72. Clos, M., Amunts, K., Laird, A. R., Fox, P. T. & Eickhoff, S. B. Tackling the multifunctional nature of Broca’s region meta- analytically: co- activation-based parcellation of area 44. NeuroImage 83, 174–188 (2013).
73. Kahnt, T., Chang, L. J., Park, S. Q., Heinzle, J. & Haynes, J.-D. Connectivity- based parcellation of the human orbitofrontal cortex. J. Neurosci. 32, 6240–6250 (2012).
74. Kelly, C. et al. Broca’s region: linking human brain functional connectivity data and non- human primate tracing anatomy studies. Eur. J. Neurosci. 32, 383–398 (2010).
75. van Oort, E. S. B. et al. Functional parcellation using time courses of instantaneous connectivity. NeuroImage 170, 31–40 (2017).
76. Laumann, T. O. et al. Functional system and areal organization of a highly sampled individual human brain. Neuron 87, 657–670 (2015).
77. Zilles, K. et al. Architectonics of the human cerebral cortex and transmitter receptor fingerprints: reconciling functional neuroanatomy and neurochemistry. Eur. Neuropsychopharmacol. 12, 587–599 (2002).
78. van den Heuvel, M. P., Scholtens, L. H., Feldman Barrett, L., Hilgetag, C. C. & de Reus, M. A. Bridging cytoarchitectonics and connectomics in human cerebral cortex. J. Neurosci. 35, 13943–13948 (2015).
79. Sporns, O. Cerebral cartography and connectomics. Phil. Trans. R. Soc. B Biol. Sci. https://doi.org/10.1098/rstb.2014.0173 (2015).
80. Cloutman, L. L. & Ralph, M. A. L. Connectivity- based structural and functional parcellation of the human cortex using diffusion imaging and tractography. Front. Neuroanat. https://doi.org/10.3389/fnana. 2012.00034 (2012). This is one of the earliest reviews that critically discusses evidence of divergence between parcellation schemes based on connectivity and cytoarchitecture mapping.
81. Chase, H. W. et al. Evidence for an anterior–posterior differentiation in the human hippocampal formation revealed by meta- analytic parcellation of fMRI coordinate maps: focus on the subiculum. NeuroImage 113, 44–60 (2015).
82. Adnan, A. et al. Distinct hippocampal functional networks revealed by tractography- based parcellation. Brain Struct. Funct. 221, 2999–3012 (2016).
83. Craddock, R. C., James, G. A., Holtzheimer, P. E., Hu, X. P. & Mayberg, H. S. A whole brain fMRI atlas generated via spatially constrained spectral clustering. Hum. Brain Mapp. 33, 1914–1928 (2012).
84. Cerliani, L., D’Arceuil, H. & Thiebaut de Schotten, M. Connectivity- based parcellation of the macaque frontal cortex, and its relation with the cytoarchitectonic distribution described in current atlases. Brain Struct. Funct. 222, 1331–1349 (2017).
85. Ding, S. L. et al. Comprehensive cellular- resolution atlas of the adult human brain. J. Comp. Neurol. 524, 3127–3481 (2016).
86. Wang, J. et al. Convergent functional architecture of the superior parietal lobule unraveled with multimodal neuroimaging approaches. Hum. Brain Mapp. 36, 238–257 (2015).
87. Xia, X. et al. Multimodal connectivity- based parcellation reveals a shell- core dichotomy of the human nucleus accumbens. Hum. Brain Mapp. 38, 3878–3898 (2017).
88. Nachev, P., Kennard, C. & Husain, M. The functional anatomy of the frontal lobes. Nat. Rev. Neurosci. 10, 829 (2009).
89. Wang, C., Yoldemir, B. & Abugharbieh, R. in International Conference on Medical Image Computing and Computer- Assisted Intervention 21–28 (Springer, 2015).
90. Kaas, J. H. Evolution of columns, modules, and domains in the neocortex of primates. Proc. Natl Acad. Sci. USA 109, 10655–10660 (2012).
91. Kaas, J. H. & Stepniewska, I. Evolution of posterior parietal cortex and parietal- frontal networks for specific actions in primates. J. Comp. Neurol. 524, 595–608 (2016).
92. Vogt, C. & Vogt, O. Die vergleichend- architektonische und die vergleichend- reizphysiologische Felderung der Großhirnrinde unter besonderer Berücksichtigung der menschlichen [German]. Naturwissenschaften 14, 1190–1194 (1926).
93. Genon, S., Reid, A., Langner, R., Amunts, K. & Eickhoff, S. B. How to characterize the function of a brain region. Trends Cogn. Sci. 22, 350–364 (2018).
94. Fischl, B. et al. Cortical folding patterns and predicting cytoarchitecture. Cereb. Cortex 18, 1973–1980 (2007).
95. Mueller, S. et al. Individual variability in functional connectivity architecture of the human brain. Neuron 77, 586–595 (2013).
96. Braga, R. M. & Buckner, R. L. Parallel interdigitated distributed networks within the individual estimated by intrinsic functional connectivity. Neuron 95, 457–471.e5 (2017).
97. Gordon, E. M. et al. Precision functional mapping of individual human brains. Neuron 95, 791–807.e7 (2017). References 96 and 97 demonstrate that extensive resting- state data collected from the same individuals allow the delineation of high- quality cortical parcellations in individuals.
98. Zilles, K. & Amunts, K. Individual variability is not noise. Trends Cogn. Sci. 17, 153–155 (2013).
99. Salehi, M., Karbasi, A., Shen, X., Scheinost, D. & Constable, R. T. An exemplar- based approach to individualized parcellation reveals the need for sex specific functional networks. NeuroImage 170, 54–67 (2017).
100. Power, J. D., Schlaggar, B. L., Lessov- Schlaggar, C. N. & Petersen, S. E. Evidence for hubs in human functional brain networks. Neuron 79, 798–813 (2013).
101. Sepulcre, J. et al. The organization of local and distant functional connectivity in the human brain. PLoS Comput. Biol. 6, e1000808 (2010).
102. Tzourios- Mazoyer, N. et al. Automated anatomical labeling of activations in SPM using a macroscopic anatomical parcellation of the MNI MRI single- subject brain. NeuroImage 15, 273–289 (2002).
103. Fan, L. et al. The human brainnetome atlas: a new brain atlas based on connectional architecture. Cereb. Cortex 26, 3508–3526 (2016).
104. Robinson, J. L. et al. Neurofunctional topography of the human hippocampus. Hum. Brain Mapp. 36, 5018–5037 (2015).
105. Chi, J. G., Dooling, E. C. & Gilles, F. H. Gyral development of the human brain. Ann. Neurol. 1, 86–93 (1977).
106. Semendeferi, K., Lu, A., Schenker, N. & Damásio, H. Humans and great apes share a large frontal cortex. Nat. Neurosci. 5, 272–276 (2002).

Nature reviews | NeuroscieNce
R e v i e w s
107. Wood, J. N. & Grafman, J. Human prefrontal cortex: processing and representational perspectives. Nat. Rev. Neurosci. 4, 139–147 (2003).
108. Geyer, S., Matelli, M., Luppino, G. & Zilles, K. Functional neuroanatomy of the primate isocortical motor system. Anat. Embryol. 202, 443–474 (2000).
109. Rizzolatti, G., Luppino, G. & Matelli, M. The organization of the cortical motor system: new concepts. Electroencephalogr. Clin. Neurophysiol. 106, 283–296 (1998).
110. Rizzolatti, G. & Luppino, G. The cortical motor system. Neuron 31, 889–901 (2001).
111. Petrides, M. & Pandya, D. Dorsolateral prefrontal cortex: comparative cytoarchitectonic analysis in the human and the macaque brain and corticocortical connection patterns. Eur. J. Neurosci. 11, 1011–1036 (1999).
112. Petrides, M. & Pandya, D. Comparative cytoarchitectonic analysis of the human and the macaque ventrolateral prefrontal cortex and corticocortical connection patterns in the monkey. Eur. J. Neurosci. 16, 291–310 (2002).
113. Vincent, J. L. et al. Intrinsic functional architecture in the anaesthetized monkey brain. Nature 447, 83–86 (2007).
114. Orban, G. A., Van Essen, D. & Vanduffel, W. Comparative mapping of higher visual areas in monkeys and humans. Trends Cogn. Sci. 8, 315–324 (2004).
115. Neubert, F.-X., Mars, R. B., Thomas, A. G., Sallet, J. & Rushworth, M. F. Comparison of human ventral frontal cortex areas for cognitive control and language with areas in monkey frontal cortex. Neuron 81, 700–713 (2014).
116. Xu, T. et al. Delineating the macroscale areal organization of the macaque cortex in vivo. Cell Rep. 23, 429–441 (2018).
117. Croxson, P. L., Forkel, S. J., Cerliani, L. & Thiebaut de Schotten, M. Structural variability across the primate brain: a cross- species comparison. Cereb. Cortex https://doi.org/10.1093/cercor/bhx244 (2017).
118. Zilles, K. & Amunts, K. Centenary of Brodmann’s map — conception and fate. Nat. Rev. Neurosci. 11, 139–145 (2010).
119. Klatzo, I. Cécile and Oskar Vogt: the visionaries of modern neuroscience Vol. 80 (ed. Reulen, H.-J.) (Springer Science & Business Media, 2002).
120. Talairach, J. & Tournoux, P. Co- Planar Stereotaxic Atlas of the Human Brain: 3-Dimensional Proportional System: An Approach to Cerebral Imaging. (Thieme, New York, 1987).
121. Frackowiak, R. & Markram, H. The future of human cerebral cartography: a novel approach. Phil. Trans. R. Soc. B Biol. Sci. 370, 20140171 (2015).
122. Schleicher, A., Amunts, K., Geyer, S., Morosan, P. & Zilles, K. Observer- independent method for microstructural parcellation of cerebral cortex: a quantitative approach to cytoarchitectonics. NeuroImage 9, 165–177 (1999).
123. Eickhoff, S. B. et al. A new SPM toolbox for combining probabilistic cytoarchitectonic maps and functional imaging data. NeuroImage 25, 1325–1335 (2005).
124. Ding, C., He, X. & Simon, H. D. On the equivalence of nonnegative matrix factorization and spectral
clustering. Proc. 2005 SIAM Int. Conf. Data Mining https://doi.org/10.1137/1.9781611972757.70 (2005).
125. Sotiras, A., Resnick, S. M. & Davatzikos, C. Finding imaging patterns of structural covariance via non- negative matrix factorization. NeuroImage 108, 1–16 (2015).
126. Yeo, B. T., Krienen, F. M., Chee, M. W. & Buckner, R. L. Estimates of segregation and overlap of functional connectivity networks in the human cerebral cortex. NeuroImage 88, 212–227 (2014).
127. Catani, M. in Diffusion MRI: Theory, Methods, and Applications 5–18 (Oxford Univ. Press, 2010).
128. Maier- Hein, K. H. et al. The challenge of mapping the human connectome based on diffusion tractography. Nat. Commun. 8, 1349 (2017).
129. Biswal, B., Zerrin Yetkin, F., Haughton, V. M. & Hyde, J. S. Functional connectivity in the motor cortex of resting human brain using echo- planar MRI. Magn. Reson. Med. 34, 537–541 (1995).
130. Van Essen, D. C. et al. in Diffusion MRI 2nd edn (eds Johansen- Berg, H. & Behrens, T. E. J.), 337–358 (Academic Press, 2014).
131. Jbabdi, S. & Johansen- Berg, H. Tractography: where do we go from here? Brain Connectiv. 1, 169–183 (2011).
132. Catani, M. et al. Short frontal lobe connections of the human brain. Cortex 48, 273–291 (2012).
133. Birn, R. M. The role of physiological noise in resting- state functional connectivity. NeuroImage 62, 864–870 (2012).
134. Power, J. D., Barnes, K. A., Snyder, A. Z., Schlaggar, B. L. & Petersen, S. E. Spurious but systematic correlations in functional connectivity MRI networks arise from subject motion. NeuroImage 59, 2142–2154 (2012).
135. He, Y., Chen, Z. J. & Evans, A. C. Small- world anatomical networks in the human brain revealed by cortical thickness from MRI. Cereb. Cortex 17, 2407–2419 (2007).
136. Tootell, R. B. H. et al. Functional analysis of primary visual cortex (V1) in humans. Proc. Natl Acad. Sci. USA 95, 811 (1998).
137. Amunts, K., Malikovic, A., Mohlberg, H., Schormann, T. & Zilles, K. Brodmann’s areas 17 and 18 brought into stereotaxic space- where and how variable? NeuroImage 11, 66–84 (2000).
138. Frazier, J. A. et al. Structural brain magnetic resonance imaging of limbic and thalamic volumes in pediatric bipolar disorder. Am. J. Psychiatry 162, 1256–1265 (2005).
139. Makris, N. et al. Decreased volume of left and total anterior insular lobule in schizophrenia. Schizophr. Res. 83, 155–171 (2006).
140. Desikan, R. S. et al. An automated labeling system for subdividing the human cerebral cortex on MRI scans into gyral based regions of interest. NeuroImage 31, 968–980 (2006).
141. Goldstein, J. M. et al. Hypothalamic abnormalities in schizophrenia: sex effects and genetic vulnerability. Biol. Psychiatry 61, 935–945 (2007).
142. Destrieux, C., Fischl, B., Dale, A. & Halgren, E. Automatic parcellation of human cortical gyri and sulci using standard anatomical nomenclature. NeuroImage 53, 1–15 (2010).
143. Auzias, G., Coulon, O. & Brovelli, A. MarsAtlas: a cortical parcellation atlas for functional mapping. Hum. Brain Mapp. 37, 1573–1592 (2016).
144. Power, J. D. et al. Functional network organization of the human brain. Neuron 72, 665–678 (2011).
145. Buckner, R. L., Krienen, F. M., Castellanos, A., Diaz, J. C. & Yeo, B. T. The organization of the human cerebellum estimated by intrinsic functional connectivity. J. Neurophysiol. 106, 2322–2345 (2011).
146. Choi, E. Y., Yeo, B. T. & Buckner, R. L. The organization of the human striatum estimated by intrinsic functional connectivity. J. Neurophysiol. 108, 2242–2263 (2012).
147. Shen, X., Tokoglu, F., Papademetris, X. & Constable, R. T. Groupwise whole- brain parcellation from resting- state fMRI data for network node identification. NeuroImage 82, 403–415 (2013).
148. Joliot, M. et al. AICHA: an atlas of intrinsic connectivity of homotopic areas. J. Neurosci. Methods 254, 46–59 (2015).
149. Huth, A. G., Griffiths, T. L., Theunissen, F. E. & Gallant, J. L. PrAGMATiC: a probabilistic and generative model of areas tiling the cortex. Preprint at http://arxiv.org/abs/1504.03622 (2015).
AcknowledgementsThe work of S.B.E. and S.G. is supported by the Deutsche Forschungsgemeinschaft (DFG, GE 2835/1-1, EI 816/4-1), the Helmholtz Portfolio Theme ‘Supercomputing and Modelling for the Human Brain’ and the European Union’s Horizon 2020 Research and Innovation Programme under Grant Agreement No. 720270 (HBP SGA1) and Grant Agreement No. 785907 (HBP SGA2). B.T.T.Y. is supported by the Singapore Ministry Of Education Tier 2 (MOE2014- T2-2-016), the National University of Singapore (NUS) Strategic Research (DPRT/944/09/14), the National University of Singapore (NUS) School of Medicine Aspiration Fund (R185000271720), Singapore National Medical Research Council (CBRG/0088/2015), NUS Young Investi-gator Award and the Singapore National Research Foun-dation Fellowship (Class of 2017). The authors also thank N. Palomero- Gallagher for helpful discussion and Q. Yang and R. Kong for their help with the figures.
Author contributionsS.B.E., B.T.T.Y. and S.G. researched data for the article, made substantial contributions to discussion of content, wrote the manuscript and reviewed or edited the manuscript before submission.
Competing interestsThe authors declare no competing interests.
Publisher’s noteSpringer Nature remains neutral with regard to jurisdictional claims in published maps and institutional affiliations.
Reviewer informationNature Reviews Neuroscience thanks M. Joliot, H. Liu and the other, anonymous reviewer(s) for their contribution to the peer review of this work.
Supplementary informationSupplementary information is available for this paper at https://doi.org/10.1038/s41583-018-0071-7.