
Making better use of existing housing stock housing law services Tim Crook.

www.bretrust.org.uk
The Housing Stock of The United KingdomJustine Piddington, Simon Nicol, Helen Garrett, Matthew Custard

The Housing Stock of The United KingdomThe Housing Stock of The United Kingdom
not an option. Improving our existing dwellings does not, however, need to be overly expensive and has multiple benefits to society as a whole, both economic and social. It is also more sustainable.
The report concludes that investments in national housing condition surveys will pay for themselves time again in well-informed, funded and targeted housing policies that will ultimately deliver social and economic benefits. All the better if these surveys have comparable methodologies and timeframes.
Acknowledgements This report was funded by the BRE Trust.
The authors would like to thank the following for their guidance and advice:
– Reannan Rottier and Stephanie Freeth of MHCLG
– Gowan Watkins of the Welsh Government
– Jahnet Brown of the Northern Ireland Housing Executive
– Diarmuid Lloyd and Adam Krawczyk of the Scottish Government
and the following for providing images of housing in Denmark and Africa respectively:
– Anders Gade Jeppesen of BL Danish Housing
– Gwyn Roberts of BRE
Any third-party URLs are given for information and reference purposes only and the BRE Trust does not control or warrant the accuracy, relevance, availability, timeliness or completeness of the information contained on any third-party website. Inclusion of any third-party details or website is not intended to reflect their importance, nor is it intended to endorse any views expressed, products or services offered, nor the companies or organisations in question. Any views expressed in this publication are not necessarily those of the BRE Trust. Every effort has been made to ensure that the information and guidance in this publication were accurate when published, but the Trust can take no responsibility for the subsequent use of this information, nor for any errors or omissions it may contain. To the extent permitted by law, the BRE Trust shall not be liable for any loss, damage or expense incurred by reliance on the information or any statement contained herein.
Executive summary There is a regular call for statistics on the United Kingdom (UK) housing stock, usually to compare them with statistics of other European or world nations. This is, however, not straightforward, as they have to be compiled from the four separate housing surveys of England, Scotland, Wales and Northern Ireland. The four surveys are undertaken over different timescales, with different sampling criteria and survey instruments. Even questions that appear similar are often subtly different. Scotland and Wales do not include vacant dwellings whereas England and Northern Ireland do.
Nevertheless, key information which describes the housing stock of the four nations is comparable.
This report is a follow-up to the BRE Trust publication ‘Housing in the UK’, which used data from the four national housing surveys when they were last aligned in 2008. This update uses the latest published survey data and the reference year is ‘2017’.
To compile this report, a UK dataset has not been created. Rather, the published findings from the latest national reports have been taken and combined. This ensures that (unless otherwise explained) there are no contradictions between the UK and individual national reports and that, if more detail is required, these can be obtained through the published national reports and referenced back to the UK picture.
The results show that there are subtle differences between the housing stocks of the four nations. Scottish workers’ housing was traditionally provided in tenements rather than terraces, and flatted accommodation still dominates in urban areas. Northern Ireland has a much higher proportion of bungalows. The revolution in home heating powered by North Sea gas in Great Britain passed Northern Ireland (and many rural areas) by and the main form of heating there is still from expensive fuel oil.
The UK has the oldest housing stock in Europe, and most likely in the world. This is largely due to the legacy of dwellings built during the industrial revolution, which still form the backbone of our urban areas today. While still widely valued, these homes present challenges in making them healthy, safe and suitable for the future. Wales has the oldest, and poorest, housing stock in the UK; Northern Ireland the youngest and least likely to contain health and safety hazards.
The UK housing stock is changing very slowly over time and it is clear that substantial replacement by newbuild is
1. The need for statistics on the UK housing stock 4
2. The UK housing stock 14
3. Housing quality and condition 22
4. Comparisons between the UK and other nations 31
5. The future housing stock of the UK 38
6. Conclusions 42
7. References 43
2 3
Contents

The Housing Stock of The United KingdomThe Housing Stock of The United Kingdom
1Detailed cavity/solid wall insulation info has not been published for Wales. Detailed Northern Ireland wall insulation figures are based on a different method to that published in their reports.
1.1 Introduction There is a regular call for statistics on the UK housing stock, usually to compare them with statistics of other European or world nations. This is, however, not straightforward, as they have to be compiled from the four separate housing surveys of England, Scotland, Wales and Northern Ireland. The four surveys do not use identical methodologies. They are undertaken over different timescales, with different sampling criteria and survey instruments. Even questions that appear similar are often subtly different. Scotland and Wales do not inspect vacant dwellings whereas England and Northern Ireland do.
Nevertheless, key information which describes the housing stock of the four nations is comparable. All the surveys have a common heritage, particularly the physical inspection, which is the focus for this report. The physical inspection methodology for the English Housing Survey (EHS), Welsh Housing Conditions Survey (WHCS) and Northern Ireland House Condition Survey (NIHCS) is the same, with all three using the consistent surveyor briefing provided by BRE. The Scottish House Condition Survey (SHCS) methodology is based on that used by the other three nations prior to 1986.
This report is a follow-up to the BRE Trust publication ‘Housing in the UK’[1] which used data from the four national housing surveys when they were last aligned in 2008.
More recently, England, Wales and Scotland all had national housing surveys in the field in 2017, and Northern Ireland’s latest survey was in 2016, and each nation has published findings based on their own surveys. For ease of presentation, in this report, the common date for statistics will be presented as ‘2017’ and it combines information already published by these nations1. This ensures that, unless
1. The need for statistics on the UK housing stock
1.2 A short history of UK national housing surveys
The first house condition survey in the world, using trained inspectors to visit a representative sample of the national housing stock, was undertaken in England and Wales in 1967[2]. At the time, slum clearance was going ahead at pace and new housebuilding was at a historical high. There was a growing feeling that housing renewal should be based on more robust evidence. A sub-committee of the Central Housing Advisory Committee[3] recommended in its 1966 report: ‘Our older homes – a call for action’ that: “a national survey, scientifically designed and carried out by skilled investigators, was necessary to provide reliable data on house condition”, and the survey was the outcome of this.
The survey method was very simple and consisted of a one-page form to be completed by specially trained Public Health Inspectors, Figure 1.1. It was based on a sample of 6,000 randomly selected homes across England and Wales. The results were reported in Economic Trends in 1968 [4]. They showed that the condition of the housing stock in England and Wales was worse than expected. There were 15.7 million homes in England and Wales in 1967. Some 40% of these were built before 1919; 25% lacked a basic amenity (bath, wash hand basin, hot water); 19% lacked an indoor WC; 7% were in potential clearance areas; 5% required repairs exceeding £1,000 (around £17,000 at 2017 costs, based on the RPI index, the most relevant index of those dating back to 1967).
The 1967 housing survey was very significant because it provided the evidence base for future housing policies. These included the targeting of slum clearance programmes, rather than the previous ‘scattergun’ approach, and the identification of areas for grant-aided improvement work. It also enabled limited resources for public expenditure on housing improvement to be distributed on a scientific basis.
From then on, national housing surveys have been undertaken at regular intervals to monitor the condition and performance of the housing stock and to develop and target policies for its continued improvement. Wales introduced its own individual survey (the Welsh House Condition Survey 1968), following on from the alarming results coming from the small Welsh sample of the 1967 survey of England and Wales. England followed with its own individual survey in in 1971, Northern Ireland in 1974 and Scotland in 1991.
In 1976 a complementary interview survey was introduced to the English House Condition Survey (EHCS) to collect information on the people who lived in the English housing stock. This trend was followed by the other UK nations.
By 2017 England and Scotland had a continuous combined physical and interview housing survey which was reporting annually, Wales had a continuous household interview survey with an occasional physical inspection and Northern Ireland had a combined physical and interview survey every five years (with occasional interim survey). In 2017, England, Scotland and Wales all had a physical survey in the field at the same time, for the first time since 2008. Northern Ireland had completed their survey just one year earlier, in 2016. Figure 1.2 shows the frequency of these surveys over time.
Photos: Housing in the UK, 2008[1]
Photos: Top: Demolition in Grove House Lane Leeds, Gill Demolition Ltd ©1967. Bottom: Two-bedroom Victorian terrace in Aston Birmingham, Nick Hedges © 1967
noted, there are no contradictions between this UK report and individual national reports and that, if more detail is required, these can be obtained through the published national reports and referenced back to the UK picture.
All four national surveys are National Statistics accredited.
4 5

The Housing Stock of The United KingdomThe Housing Stock of The United Kingdom
Figure 1.1: Example completed 1967 survey form Figure 1.2 Timeline of UK national housing surveys
1991First national survey in Scotland (physical and interview)
First interview survey in Northern Ireland
2002EHCS moves to continuous. Two years data combined. First results in 20032004
Welsh household data collected via the Living in Wales survey
2008EHCS combined with SEH to become English Housing Survey (EHS)
2017Income and housing costs questions added to the NSW to enable fuel poverty calculations
2006SHCS moves to continuous
2012Welsh household data collected via the National Survey for Wales (NSW)
Scottish House Condition Survey combined into the Scottish Household Survey
1986New physical survey methodology launched (England and Wales)
First interview survey in Wales
19765-year (big bang) survey cycle begins in England (runs until 2001)
1974First survey in Northern Ireland (1 page)
1967First National House Condition Survey (England & Wales)
1965
1970
1975
1980
1985
1990
1995
2000
2005
2010
2015
2020
1966
1971
1976
1981
1986
1991
1996
2001
2006
2011
2016
1967
1972
1977
1982
1987
1992
1997
2002
2007
2012
2017
1968
1973
1978
1983
1988
1993
1998
2003
2008
2013
2018
1969
1974
1979
1984
1989
1994
1999
2004
2009
2014
2019
1968First single nation survey (Wales)
Physical survey
Interview survey
6 7
England Wales Northern Ireland Scotland
The Housing Stock of The United KingdomThe Housing Stock of The United Kingdom
Technological developments
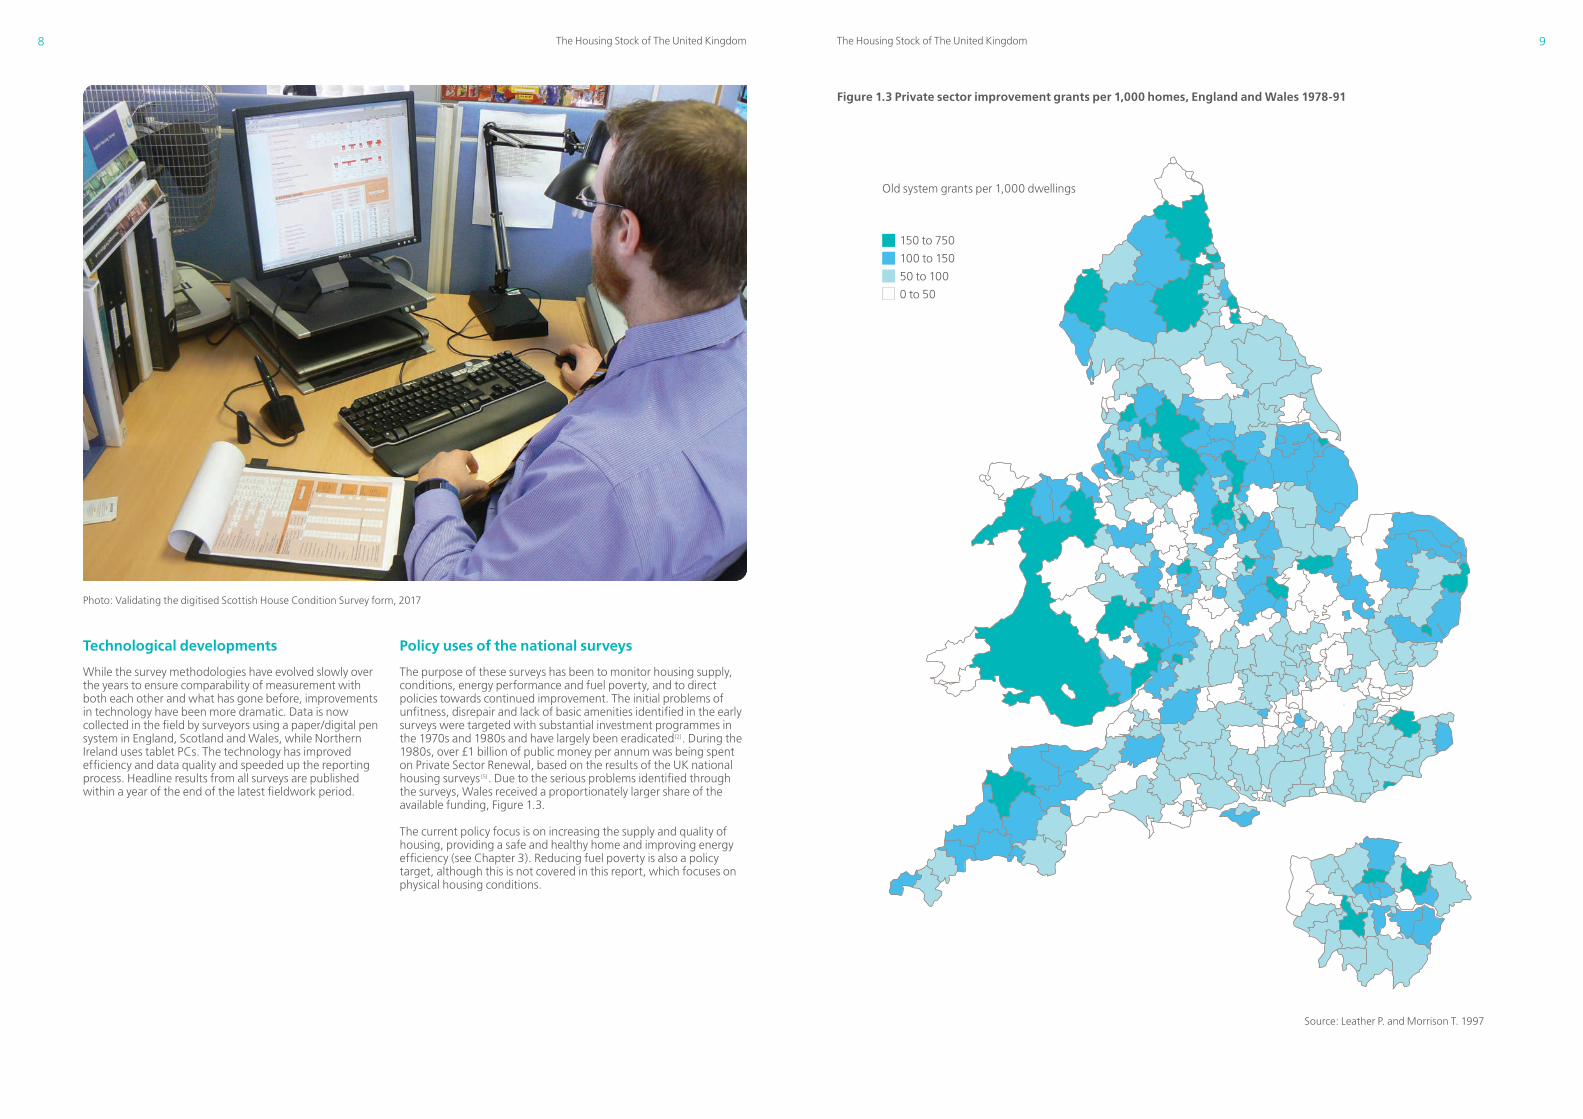
While the survey methodologies have evolved slowly over the years to ensure comparability of measurement with both each other and what has gone before, improvements in technology have been more dramatic. Data is now collected in the field by surveyors using a paper/digital pen system in England, Scotland and Wales, while Northern Ireland uses tablet PCs. The technology has improved efficiency and data quality and speeded up the reporting process. Headline results from all surveys are published within a year of the end of the latest fieldwork period.
Policy uses of the national surveys
The purpose of these surveys has been to monitor housing supply, conditions, energy performance and fuel poverty, and to direct policies towards continued improvement. The initial problems of unfitness, disrepair and lack of basic amenities identified in the early surveys were targeted with substantial investment programmes in the 1970s and 1980s and have largely been eradicated[2]. During the 1980s, over £1 billion of public money per annum was being spent on Private Sector Renewal, based on the results of the UK national housing surveys [5]. Due to the serious problems identified through the surveys, Wales received a proportionately larger share of the available funding, Figure 1.3.
The current policy focus is on increasing the supply and quality of housing, providing a safe and healthy home and improving energy efficiency (see Chapter 3). Reducing fuel poverty is also a policy target, although this is not covered in this report, which focuses on physical housing conditions.
Source: Leather P. and Morrison T. 1997
Photo: Validating the digitised Scottish House Condition Survey form, 2017
Figure 1.3 Private sector improvement grants per 1,000 homes, England and Wales 1978-91
Old system grants per 1,000 dwellings
150 to 750
100 to 150
50 to 100
0 to 50
8 9

The Housing Stock of The United KingdomThe Housing Stock of The United Kingdom
1.3 The current UK national housing survey models The current models for the UK national housing surveys, from which data are drawn for this study, are as follows:
Figure 1.4 Internal repair and defects, page 3 from the 2017 SHCS form
10 11
The English Housing Survey (EHS)
The EHS has settled into a continuous survey consisting of:
– A household questionnaire with an annual achieved sample of 13,300 interviews
– A follow-up physical survey with an annual achieved sample of 6,200 inspections.
For more detailed analysis, physical survey data is combined over two years to give a sample size of 12,400. For the purposes of this report the benchmark year is 2017, based on a combination of 2016-17 data and 2017-18 data.
The survey form used by the surveyors is a development of that introduced in 1986, although now grown to some 23 pages in length.
Full details of the EHS methodology are contained on the Ministry for Housing, Communities and Local Government (MHCLG) website. https://www.gov.uk/guidance/english-housing-survey-guidance-and-methodology
The Scottish House Condition Survey (SHCS)
Since 2003, the SHCS has been an annual continuous survey. The 2017 model consists of:
– A household questionnaire with an annual achieved sample of 11,000 interviews (the Scottish Household Survey)
– A follow-up physical survey with an annual achieved sample of 3,000 (the SHCS).
Although key statistics are published using annual data, detailed analysis is based on a three-year sample of some 9,000 homes.
While much of the information collected is broadly comparable with England, Wales and Northern Ireland, the methodology is different, particularly around the collection and costing of repair and improvement work (Figure 1.4 and Figure 1.5). The full survey form contains 12 pages.
Full details of the SHCS methodology are found on the Scottish Government website.
https://www2.gov.scot/Topics/Statistics/SHCS/Downloads
The Housing Stock of The United KingdomThe Housing Stock of The United Kingdom
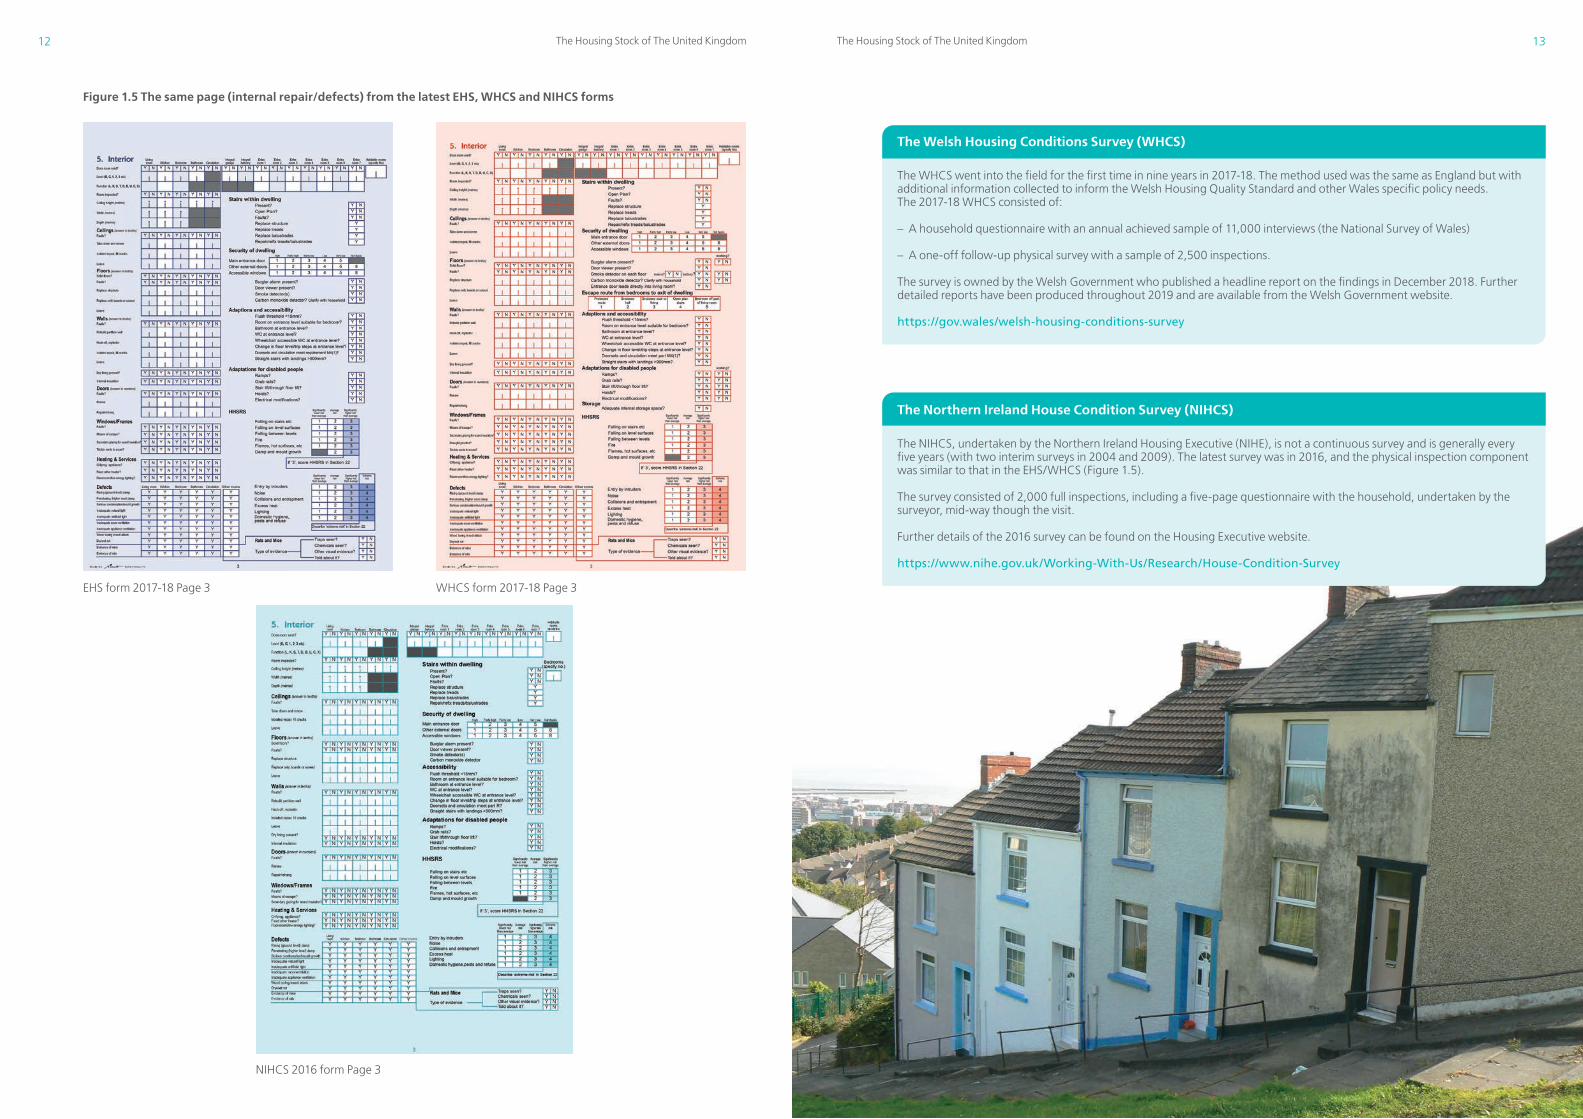
Figure 1.5 The same page (internal repair/defects) from the latest EHS, WHCS and NIHCS forms
EHS form 2017-18 Page 3 WHCS form 2017-18 Page 3
NIHCS 2016 form Page 3
The Welsh Housing Conditions Survey (WHCS)
The WHCS went into the field for the first time in nine years in 2017-18. The method used was the same as England but with additional information collected to inform the Welsh Housing Quality Standard and other Wales specific policy needs. The 2017-18 WHCS consisted of:
– A household questionnaire with an annual achieved sample of 11,000 interviews (the National Survey of Wales)
– A one-off follow-up physical survey with a sample of 2,500 inspections.
The survey is owned by the Welsh Government who published a headline report on the findings in December 2018. Further detailed reports have been produced throughout 2019 and are available from the Welsh Government website.
https://gov.wales/welsh-housing-conditions-survey
The Northern Ireland House Condition Survey (NIHCS)
The NIHCS, undertaken by the Northern Ireland Housing Executive (NIHE), is not a continuous survey and is generally every five years (with two interim surveys in 2004 and 2009). The latest survey was in 2016, and the physical inspection component was similar to that in the EHS/WHCS (Figure 1.5).
The survey consisted of 2,000 full inspections, including a five-page questionnaire with the household, undertaken by the surveyor, mid-way though the visit.
Further details of the 2016 survey can be found on the Housing Executive website.
https://www.nihe.gov.uk/Working-With-Us/Research/House-Condition-Survey
12 13

The Housing Stock of The United KingdomThe Housing Stock of The United Kingdom
The data sources for the tables and figures for this report are English Housing Survey 2017, Welsh Housing Conditions Survey 2017-18, Northern Ireland House Condition Survey 2016 and Scottish House Condition Survey 2017 (unless otherwise stated). Although the most recent Northern Ireland House Condition Survey took place in 2016, for ease of presentation the common date for findings will be presented as ‘2017’. The physical surveys of England and Northern Ireland include vacant dwellings. These are not surveyed in Scotland or Wales and are not included in their housing stock totals. As this report references data that can be traced back to the four national survey reports we have not made any adjustment for vacant dwellings. A report by National Records of Scotland (NRS)2 suggest that there were around 79,000 vacant dwellings in Scotland in 2017. In Wales, 18,000 were empty and unfurnished and a further 6,000 were vacant following death as reported by the Welsh Government.
Notes:
1. Data for Northern Ireland is based on 2016
2. 2017 Population statistics are sourced from Office for National Statistics Population estimates for the UK, England and Wales, Scotland and Northern Ireland: mid-2018, Table 1
3. Household data is sourced from published national survey reports. Average household size and average number of persons per occupied dwelling are derived from these sources.
2.1 Distribution and description of housing in the UK In 2017 there were some 28.5 million homes in the UK. The great majority of these were in England, Figure 2.1, reflecting the distribution of the UK population, Table 2.1.
2. The UK housing stock
Figure 2.1 Distribution of housing stock in the UK, 2017
England
Northern Ireland
Scotland
Wales 84%
5%9%
3%
2https://www.nrscotland.gov.uk/files/statistics/household-estimates/2017/house-est-17-publication.pdf3https://gov.wales/sites/default/files/statistics-and-research/2019-01/council-tax-dwellings-financial-year-2017-to-2018.pdf
Table 2.1: Population and Households by nation, 2017
Figure 2.2. The age and type of UK housing
Total population (thousands)2
Total households (thousands)3
Average household size
Average number of persons per occupied dwelling
Total population
Total households
55,619
23,272
2.39
2.43
84.2%
83.6%
5,425
2,464
2.20
2.20
8.2%
8.9%
3,125
1,350
2.31
2.33
4.7%
4.9%
1,871
742
2.52
2.49
2.8%
2.7%
66,040
27,828
2.37
2.41
100.0%
100.0%
Northern Ireland1England UKScotland Wales
Purpose built flat – high rise
Purpose built flat – low rise
Converted flat
Bungalow
Detached
Semi-detached
Terraced
Pre-1919 1919-1944 1945-1964 Post-1964
2.2 Age, type and size of dwellings in the UK
The housing stock of the United Kingdom is very diverse, representing a long history of housebuilding, local building preferences and materials, and policy interventions[6]. Every dwelling type shown in Figure 2.2 is represented in each of the four UK nations but in differing proportions, Table 2.2.
14 15
The Housing Stock of The United KingdomThe Housing Stock of The United Kingdom
Dwelling age
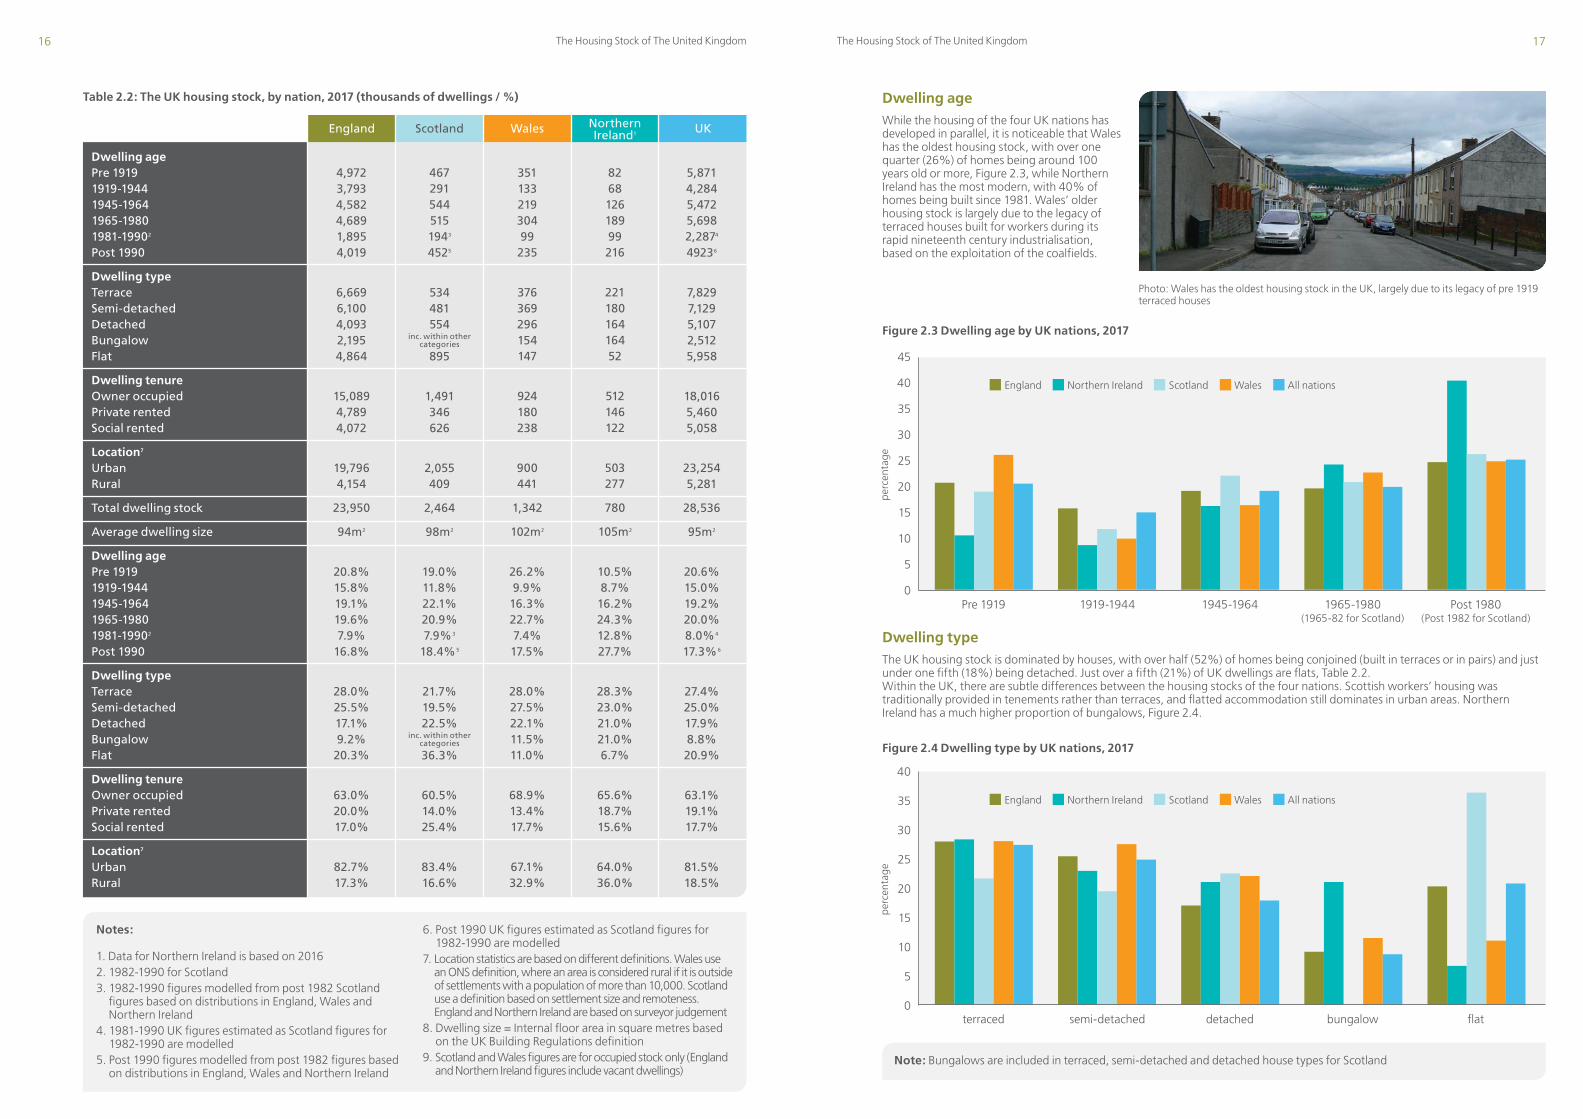
While the housing of the four UK nations has developed in parallel, it is noticeable that Wales has the oldest housing stock, with over one quarter (26%) of homes being around 100 years old or more, Figure 2.3, while Northern Ireland has the most modern, with 40% of homes being built since 1981. Wales’ older housing stock is largely due to the legacy of terraced houses built for workers during its rapid nineteenth century industrialisation, based on the exploitation of the coalfields.
Dwelling type
The UK housing stock is dominated by houses, with over half (52%) of homes being conjoined (built in terraces or in pairs) and just under one fifth (18%) being detached. Just over a fifth (21%) of UK dwellings are flats, Table 2.2. Within the UK, there are subtle differences between the housing stocks of the four nations. Scottish workers’ housing was traditionally provided in tenements rather than terraces, and flatted accommodation still dominates in urban areas. Northern Ireland has a much higher proportion of bungalows, Figure 2.4.
Table 2.2: The UK housing stock, by nation, 2017 (thousands of dwellings / %)
Dwelling agePre 19191919-19441945-19641965-19801981-19902
Post 1990
Dwelling typeTerraceSemi-detachedDetachedBungalowFlat
Dwelling tenureOwner occupiedPrivate rentedSocial rented
Location7
Urban Rural
Total dwelling stock
Average dwelling size
Dwelling agePre 19191919-19441945-19641965-19801981-19902
Post 1990
Dwelling typeTerraceSemi-detachedDetachedBungalowFlat
Dwelling tenureOwner occupiedPrivate rentedSocial rented
Location7
Urban Rural
4,9723,7934,5824,6891,8954,019
6,6696,1004,0932,1954,864
15,0894,7894,072
19,7964,154
23,950
94m2
20.8%15.8%19.1%19.6%7.9%
16.8%
28.0%25.5%17.1%9.2%
20.3%
63.0%20.0%17.0%
82.7%17.3%
4672915445151943
4525
534481554
inc. within other categories
895
1,491346626
2,055409
2,464
98m2
19.0%11.8%22.1%20.9%7.9%3
18.4%5
21.7%19.5%22.5%
inc. within other categories
36.3%
60.5%14.0%25.4%
83.4%16.6%
35113321930499235
376369296154147
924180238
900441
1,342
102m2
26.2%9.9%
16.3%22.7%7.4%17.5%
28.0%27.5%22.1%11.5%11.0%
68.9%13.4%17.7%
67.1%32.9%
826812618999216
22118016416452
512146122
503277
780
105m2
10.5%8.7%
16.2%24.3%12.8%27.7%
28.3%23.0%21.0%21.0%6.7%
65.6%18.7%15.6%
64.0%36.0%
5,8714,2845,4725,6982,2874
49236
7,8297,1295,1072,5125,958
18,0165,4605,058
23,2545,281
28,536
95m2
20.6%15.0%19.2%20.0%8.0%4
17.3%6
27.4%25.0%17.9%8.8%20.9%
63.1%19.1%17.7%
81.5%18.5%
Northern Ireland1England UKScotland Wales
16 17
Notes:
1. Data for Northern Ireland is based on 20162. 1982-1990 for Scotland 3. 1982-1990 figures modelled from post 1982 Scotland
figures based on distributions in England, Wales and Northern Ireland
4. 1981-1990 UK figures estimated as Scotland figures for 1982-1990 are modelled
5. Post 1990 figures modelled from post 1982 figures based on distributions in England, Wales and Northern Ireland
6. Post 1990 UK figures estimated as Scotland figures for 1982-1990 are modelled
7. Location statistics are based on different definitions. Wales use an ONS definition, where an area is considered rural if it is outside of settlements with a population of more than 10,000. Scotland use a definition based on settlement size and remoteness. England and Northern Ireland are based on surveyor judgement
8. Dwelling size = Internal floor area in square metres based on the UK Building Regulations definition
9. Scotland and Wales figures are for occupied stock only (England and Northern Ireland figures include vacant dwellings)
Note: Bungalows are included in terraced, semi-detached and detached house types for Scotland
Figure 2.3 Dwelling age by UK nations, 2017
England Northern Ireland Scotland Wales All nations
1965-1980 (1965-82 for Scotland)
1945-19641919-1944Pre 1919
per
cent
age
45
40
35
30
25
20
15
10
5
0Post 1980
(Post 1982 for Scotland)
Figure 2.4 Dwelling type by UK nations, 2017
England Northern Ireland Scotland Wales All nations
bungalowdetachedsemi-detachedterraced
per
cent
age
40
35
30
25
20
15
10
5
0flat
Photo: Wales has the oldest housing stock in the UK, largely due to its legacy of pre 1919 terraced houses

The Housing Stock of The United KingdomThe Housing Stock of The United Kingdom
2.4 Dwelling heating, insulation and energy efficiency in the UK Around eight in ten homes in the UK use a gas fired central heating system as the primary method for heating. Among those not using this heating method, electric storage heaters or central heating using oil were the most frequent types, Table 2.3. Northern Ireland has a distinctly different fuel mix from the rest of the UK due to an increased reliance on oil for domestic heat. (Figure 2.7).
Dwelling construction
The great majority of dwellings in the UK are built in the ‘traditional’ way using brick, blockwork or stone and constructed on site [6]. Prior to 1919 the walls would most likely have been solid. Cavity walls gradually became the dominant form of wall construction in the inter-war period with the transition taking place at different rates in different parts of the country. In recent years, there has been a growing number of homes built with timber frames supporting the roof structure, but finished to resemble traditional cavity walls, while larger blocks of flats tend to be built with concrete and steel frames.
Dwelling size
On average, homes in England are the smallest in the UK (94m2), with dwellings in Northern Ireland (105m2) being the largest (Table 2.2). One reason for this is the large proportion of flats (which tend to be smaller than houses) in England compared with Northern Ireland.
2.3 Dwelling tenure, location and construction in the UK
Dwelling tenure
Some 63% of dwellings in the UK are owner-occupied. The remainder are almost equally split across social rented, (18%) and private rented sectors (19%). Wales has the highest proportion of owner-occupied homes (69%), while Scotland has the highest proportion of social rented housing (25%). (Figure 2.5).
Dwelling location
Just over 80% (81%) of housing in the UK can be described as ‘urban’ while 19% is ‘rural’. This varies between the four UK nations, with Wales and Northern Ireland being the most rural, Table 2.2.
Pre 1919 housing is generally located in the centre of our cities, towns and villages, or in isolated rural situations. Nearly 70% of all homes in England built before 1850 are in rural locations. Housing becomes increasingly modern, as it is located away from the centre towards the suburbs[6].
Figure 2.5 UK dwellings by tenure, 2017
Figure 2.6 Dwelling construction by age (England 2013)
Northern Ireland
Scotland
Wales
England66%
61%
63%
69%
19%
14%
20%
13%
5%
10%
10%
11%
11%
15%
7%
7%
Owner occupied
Local authority/Housing exec.
Housing association
Private rented
Timber Frame Solid Cavity Wall Concrete, Steel
Post 2002
1981-2002
1965-1980
1945-1964
1919-1944
1900-1918
1850-1899
Pre 1850
0 20 40 60 80 100percentage
Source: The age and type of English homes[6]
Table 2.3: The UK housing stock, by type of heating, 2017 (thousands of dwellings / %)
Gas central heatingOil central heatingOther central heatingElectric (storage heaters)Fixed heating
Gas central heatingOil central heatingOther central heatingElectric (storage heaters)Fixed heating
20,375929716
1,223707
85.1%3.9%3.0%5.1%3.0%
1,96614310518367
79.8%5.8%4.3%7.4%2.7%
1,100135354823
82.0%10.1%2.6%3.6%1.7%
18652661
N/AN/A
23.8%67.5%7.8%N/AN/A
23,6271,733917N/AN/A
82.8%6.1%3.2%N/AN/A
Northern IrelandEngland UKScotland Wales
18 19
Note: Scotland usually categorise electric storage heaters as central heating but they are shown separately above to enable UK comparison
Photo: Tenement flats, Dundee

The Housing Stock of The United KingdomThe Housing Stock of The United Kingdom
Figure 2.7: UK Heating profile
Gas central heating
Oil central heating
Other central heating
Electric storage heaters
Fixed room heaters (all fuels)
Northern Ireland
Scotland
Wales
England68%
80%
85%
82%
14% 3%7%4%
4%3%
5%3%
2%4%3%
8%24%
10%
6%
Dwelling insulation
Fabric insulation is important in reducing greenhouse gas emissions from the housing stock as it acts to reduce demand for heat as well as delivering an improved level of thermal comfort and contributing to affordability of warmth. Insulation levels in the UK have risen steadily over time, driven by building regulations for new build housing and the retrofit of the existing stock.
Cavity wall insulation is a common energy efficiency measure. The table below shows that Northern Ireland has the highest levels of insulated cavity walls in the stock at 90% of cavity wall dwellings filled, with England and Wales having the lowest penetration at 68%. Grant programmes and other schemes have had considerable success in driving the take-up of measures such as cavity wall insulation and while potential remains, future savings will have to be sought in other parts of the stock, such as the solid wall stock.
Table 2.4: Wall insulation, 2017 (thousands of dwellings / %)
Cavity insulatedCavity uninsulatedAll cavity walls
Solid with insulationSolid uninsulatedAll solid walls
Other
Cavity insulatedCavity uninsulatedAll cavity walls
Solid with insulationSolis uninsulatedAll solid walls
11,1575,242
16,399
6946,3016,996
555
68%32%
100%
10%90%100%
1,363457
1,820
115529644
75%25%
100%
18%82%
100%
636298934
71307378
30
68%32%
100%
19%81%
100%
57066
636
11107118
26
90%10%
100%
9%91%
100%
Northern IrelandEngland Scotland Wales
included above in solid walls
– Efficiency and control of the heating system;
– Fuel used for space and water heating, ventilation and lighting;
– Ventilation and solar gain characteristics of the dwelling;
– Renewable energy technologies
SAP is not affected by the individual characteristics of the household occupying the dwelling, nor by its geographical location. The SAP methodology is continually updated to reflect new technologies and knowledge. The version used in this report, for comparison purposes, is SAP 20124.
From Figure 2.8, it can be estimated that the average UK SAP for 2017 is approximately 62, which represents a rise of some 17 SAP points since 1996. Wales has the least energy efficient housing stock, despite great improvements in recent years, reflecting its high proportion of older, solid-walled buildings.
Energy efficiency
The Standard Assessment Procedure (SAP) is the UK Government’s recommended system for measuring the energy efficiency of housing. SAP is expressed on a logarithmic scale from 1 (very inefficient) to 100 (zero energy cost).
The SAP ratings provide a measure of the annual unit energy cost of space and water heating for the dwelling under a set heating regime, which assumes specific heating patterns and room temperatures. The SAP rating takes into account a range of factors that contribute to energy efficiency, which include:
– Thermal insulation of the building fabric;
– Shape of the dwelling and exposed surfaces;
– The materials of construction;
Figure 2.8 Average SAP by UK nation (SAP 2012 time series)
1996 1997 1998 1999 2000 2001 2002 2003 2004 2005 2006 2007 2008 2009 2010 2011 2012 2013 2014 2015 2016 2017
70
65
60
55
50
45
40
35
30
Year
SAP
rati
ng
England Northern Ireland Scotland Wales
4The SAP2012 methodology varies slightly between nations; Following the release of version 9.93 of RdSAP 2012, U-values for solid brick, stone and cavity walls were updated to more accurately reflect their thermal performance. As a result of these changes, SAP2012 was modelled for the WHCS and NIHCS data using the updated U-values. Original U-values were used in Scotland and England.
20 21
Note: Northern Ireland figures differ from information published by NIHE on number of insulated cavity walls due to different approaches to categorisation of walls. For example, NIHE reports dwellings with more than one wall type as ‘partial cavity wall insulation’ (where insulation exists) whereas for this analysis (in order to maintain consistency with other nations) each dwelling has been assigned a single wall type according to the predominant wall type present.

The Housing Stock of The United KingdomThe Housing Stock of The United Kingdom
The WHQS is made up of 42 individual element assessments. However, it is only possible to assess 13 primary elements and 13 secondary elements of the standard using the WHCS due to the survey’s methodology. This WHCS based measure is known as the overall WHQS proxy and is only suitable for comparing WHQS across tenures and with the Living in Wales 2008 Property Survey 2008 measure. An overall WHQS modified proxy measure has also been calculated (using amended definitions of elements 4b and 4d of WHQS) which is more in line with the way social landlords have been advised to interpret the guidance in practice. Official Statistics on WHQS produced by the Welsh Government based on returns from social landlords should be used when looking at trends. The two data sets are not directly comparable.
In 2017, 17% of homes met the WHQS, as measured through the 2017-18 WHCS. Using the WHQS overall modified proxy as a measure, this rose to 21%. This is a significant increase on 3% from 2008 and improvement has occurred in each tenure. The social rented sector had a much higher proportion of dwellings meeting the standard than private housing (Table 3.1), particularly those owned by Registered Social Landlords (34%). This reflects the investment that the Welsh Government has made in the social sector to meet the standard.
– It is free from dampness prejudicial to the health of the occupants (if any)
– It has adequate provision for heating, lighting and ventilation
– It has an adequate supply of wholesome water
– There are satisfactory facilities in the home for the preparation and cooking of food, including a sink with a satisfactory supply of hot and cold water
– It has, for the exclusive use of the occupants (if any), a suitably located fixed bath or shower and wash-hand basin, each of which is provided with a satisfactory supply of hot and cold water
– It has an effective system of foul, waste and surface water
In the 2016 NIHCS, 7.8%6 of dwellings failed decent homes (down from 11.4% in 2011). The level of unfitness reported was 2.1%, an improvement from 4.6% in 20117.
3.2 Wales
Wales has the Welsh Housing Quality Standard (WHQS), introduced in 2002. It is the Welsh Government’s standard for social housing. Split into primary elements (ones that impact on the safety of the residents) and secondary elements (more focussed around the comfort of the residents), it includes many components similar to the Decent Homes Standard (for example; “is the dwelling structurally stable and free from disrepair; is the heating system reasonably economical; are the bathroom amenities less than 25 years old and in good condition; is the staircase and balustrade safe?”). However, it goes beyond this to include aspects of modern design, such as “is the cupboard storage convenient and adequate; is there paved access to the drying area and any garden gate?”
In 2004 the Housing Act introduced the Housing Health and Safety Rating System (HHSRS). Any element categorised with an HHSRS Category 1 hazard automatically results in the dwelling ‘failing’ the WHQS.
3.3 Northern Ireland
Northern Ireland has the Decent Homes Standard, but it differs from England in that the ‘minimum standard’ component is still the Fitness Standard, which applied in England and Wales prior to 2006, and not HHSRS. However, HHSRS is measured separately to enable comparisons with England and Wales.
The current Northern Ireland Fitness Standard states that a dwelling is unfit for human habitation if it fails to meet one or more of the following requirements:
– It is structurally stable
– It is free from serious disrepair
3. Housing quality and condition
Each of the four UK nations has its own indicators of housing quality and condition.
3.1 England England has the Decent Homes Standard. For a dwelling to be considered ‘decent’ it must:
– Meet the statutory minimum standard for housing (assessed since 2006 using the Housing Health and Safety Rating System (HHSRS))
– Be in a reasonable state of repair
– Have reasonably modern facilities and services
– Provide a reasonable degree of thermal comfort
A full definition is included in the 2017 EHS Technical report5. The level of non-decency in England was 19% in 2017. This has improved from 35% in 2007. The Decent Homes Standard is designed to be applied to social housing and it is in this sector where there are the lowest levels of non-decent homes (Figure 3.1).
Source: English Housing Survey 2017-18 Headline Report. MHCLG London.
Figure 3.1: England: Decent Homes Standard by tenure 2007-17
2007 2008 2009 2010 2011 2012 2013 2014 2015 2016 2017
50
45
40
35
30
25
20
15
10
5
0
per
cent
age
Private rented Owner occupied Social rented
5MHCLG, English Housing Survey technical advice can be found at https://www.gov.uk/government/collections/english-housing-survey-technical-advice
Table 3.1. Wales: Dwellings that meet the overall WHQS proxy/modified proxy by tenure 2017
Source: Statistics for Wales: Statistical bulletin SB 13/2019
Owner-occupied
Private rented
Social rented
• Local Authority
• Registered Social Landlord
All tenures
14%
13%
31%
27%
34%
17%
15%
19%
46%
40%
49%
21%
Overall WHQS proxy 2017 Overall WHQS modified proxy
22 23
6From Northern Ireland House Condition Survey Main Report 2016, Table 6.27From Northern Ireland House Condition Survey Main Report 2016 Appendix Tables, Table 5.1

The Housing Stock of The United KingdomThe Housing Stock of The United Kingdom
with stairs, and excess cold. Around 1.7 million (7%) dwellings had one or more Category 1 hazard relating to falls11, 898,000 (3%) dwellings had a Category 1 excess cold hazard.
Overall, Category 1 hazards were at least twice as likely to arise in the private sector (owner occupied 12%, private rented 14%) than among social homes (6%).
There was also a strong relationship between the prevalence of hazards and dwelling age with pre 1919 built homes having almost nine times (26%) the proportion of Category 1 hazards compared with the newest homes built after 1980 (3%) as shown in Figure 3.2.
Further details on the HHSRS and the methodologies used to assess hazards, including rating their severity, are available within the technical information supplied by each national housing conditions survey as already referenced and further details of the HHSRS system can be found on the MHCLG web site10. Illustrations of Category 1 hazards are provided below.
Overall 11% of the housing stock in England, Wales and Northern Ireland had at least one of the most serious (Category 1) class of hazard. The most common hazards are those associated with falls, particularly those associated
Physiological Requirements
Damp and mould growth etc.
Excessive cold
Excessive heat
Asbestos etc
Biocides
CO and fuel combustion productions
Lead
Radiation
Un-combusted fuel gas
Volatile organic compounds
Psychological Requirements
Crowding and Space
Entry by intruders
Lighting
Noise
Protection Against Infection
Domestic hygiene, pests and refuse
Food safety
Personal hygiene, sanitation and drainage
Water supply
Protection Against Accidents
Falls associated with baths etc.
Falling on level surfaces
Falling on stairs and steps
Falling between levels
Electrical hazards
Fire
Flames, hot surfaces etc.
Collision and entrapment
Explosions
Position and operability of amenities etc.
Structural collapse and falling elements
3.4 Scotland Scotland has the Scottish Housing Quality Standard (SHQS).
The SHQS is made up of 55 elements grouped into 5 higher level criteria:
A. Tolerable Standard
B. Serious Disrepair
C. Energy Efficiency
D. Modern Facilities and Services
E. Healthy, Safe and Secure
Only social sector landlords are obliged to ensure their tenants’ homes meet the standard, but enough information is collected to derive failure rate across all tenures.
In 2017, 40% of all occupied dwellings failed to meet the SHQS, an improvement on the 61% in 2010. The highest failure rate was with respect to the Energy Efficient criterion (30%), followed by Healthy, Safe and Secure (10%) and Modern Facilities criteria (7%). There were a very small number of dwellings that did not meet the Tolerable Standard (1%) or the Serious Disrepair Criterion (less than 1%)8.
3.5 Disrepair All of the four surveys measure disrepair. The current NIHCS 2016 main report9 and previous published EHS reports show that date of original construction is a critical factor when it comes to the state of repair. Also, homes located in the private sector and vacant homes also tend to have higher levels of disrepair, partly due to these tenures having an older housing stock.
3.6 Housing Health and Safety Rating System (HHSRS) The most comparable measure of poor housing is the Housing Health and Safety Rating System which was introduced in England and Wales as the minimum standard for housing in 2006 [7]. It is an evidence-based system used to identify and assess defects in dwellings and to evaluate the potential effects of these on the health and safety of occupants, visitors, neighbours and passers-by. It is also measured through the NIHCS using the same methodologies as England and Wales (although it is not part of legislation in Northern Ireland). It is not applied in Scotland, nor measured through the SHCS.
8From Scottish House Condition Survey: 2017 Tables and Figures, Table 499https://www.gov.uk/government/statistics/northern-ireland-house-condition-survey-2016-main-report
10https://www.gov.uk/government/collections/english-housing-survey-technical-advice11The four types of falls assessed by the surveys are; falls associated with stairs, falls on the level, falls between levels and falls associated with baths
Photos: Older homes are more likely to be in disrepair
Photo: Falls on stairs and steps hazard Photo: Flames, hot surfaces hazard as cooker too close to doorway
The HHSRS provides a means of rating the seriousness of any hazard in the home so that it is possible to differentiate between minor hazards and those where there is a more immediate risk of serious harm or even death. The most serious hazards are called Category 1 hazards. The assessment of hazards through the surveys in England, Wales and Northern Ireland provides an indication of the condition and quality of the housing stock.
The HHSRS identifies and scores 29 potential hazards in the housing stock, which fall into four groups, Table 3.2.
Table 3.2: The 29 HHSRS hazards
24 25

The Housing Stock of The United KingdomThe Housing Stock of The United Kingdom
Significant progress has been made in the reduction in HHSRS Category 1 hazards since the last time comparable information between the three nations was available in 2008 (Figure 3.5). We should, however, note that the HHSRS was still a relatively new means of assessing housing quality in 2008 and likely to have lead to greater surveyor variability in the assessment of HHSRS hazards at the time. In addition, the modelling of excess cold has changed over time following changes to the SAP methodology, which underpins the model.
3.7 National variations The prevalence of Category 1 hazards within each nations’ dwelling stock varied. Wales had the highest proportion of the most serious hazards (18%) compared with England (11%) and Northern Ireland (9%). There were also national variations in the prevalence of falls hazards and excess cold12, Figure 3.3.
The prevalence of Category 1 hazards by dwelling age and dwelling type also varied nationally, Table 3.3. For example, a higher proportion of homes built before 1919 in Wales (34%) had Category 1 hazards compared with those of the same age in Northern Ireland (27%) and England (26%). As with findings for the whole stock, such differences are partly reflective of factors such as climate and topography.
The reasons for these national variations are complex in nature, with interactions between different key stock characteristics such as dwelling type and age, and other factors such as climate and topography all likely contributors. For example, the higher prevalence of falls and excess cold hazards in Wales is mainly due to its older dwelling stock which tends to have steep staircases and outside spaces as well as lower average energy efficiency.
It also needs to be born in mind that the sample sizes in Wales and particularly Northern Ireland are relatively small compared with England, so comparisons need to be treated with some caution.
Variations in Category 1 hazards by tenure are shown in Figure 3.4. England and Wales had a notably higher incidence of Category 1 hazards among private rented dwellings.
Figure 3.2 Proportion of dwellings with HHSRS Category 1 hazards in England, Northern Ireland and Wales, by dwelling age
Pre 1919
1919-1944
1945-1964
1965-1980
Post 1980
0 5 10 15 20 25 30percentage
12The SAP2012 methodology used to model excess cold varies slightly between nations. It was modelled for Wales and Northern Ireland using updated U-values whereas original U-values were used in England.
Figure 3.3 Proportion of dwellings with HHSRS Category 1 hazards by type of hazard and nation
Figure 3.4 Proportion of dwellings with HHSRS Category 1 hazards by tenure and nation
England Northern Ireland Wales
England
Northern Ireland
Wales
any Category 1 hazards
owner occupied
any Category 1 falls hazards
private rented
excess cold
social rented
per
cent
age
per
cent
age
20
18
16
14
12
10
8
6
4
2
0
25
20
15
10
5
0
Figure 3.5. HHSRS Category 1 hazards in 2008 and 2017 by nation
England Northern Ireland Wales
2008 2017
per
cent
age
35
30
25
20
15
10
5
0
Photo: Where housing is off the gas grid, expensive oil is typically used for heating
26 27

The Housing Stock of The United KingdomThe Housing Stock of The United Kingdom
Recent estimates for the UK[8] suggest that the annual treatment costs to the NHS of people living in poor housing are in the same broad region as that from smoking or alcohol (Table 3.5).
3.8 The cost of poor housing There is a long established, recognised relationship between poor housing and poor health. The methodology developed by the BRE Trust[8] is perhaps the most rigorous attempt to measure the cost of this to the National Health Service (NHS) and to society. The latest methodology for producing these estimates is documented in ‘The full cost of poor housing’ publication and will not be repeated here. In summary, however, for each of the surveys of England, Wales and Northern Ireland in which the HHSRS is measured:
– ‘Poor housing’ is defined as that which contains at least one HHSRS Category 1 hazard.
– The percentage likelihood and spread of HHSRS outcomes for each hazard is modelled.
3.9 The full cost of poor housing The BRE Trust ‘cost of poor housing’ methodology focuses on first year treatment costs to the NHS because there is comprehensive data available on this which can be linked directly to the way we measure hazards in the home in the housing surveys of England, Wales and Northern Ireland. However, these first-year treatment costs are just part of the cost to society.
For many hazards there may be ongoing treatment beyond the first year. There may be care costs, sometimes for the rest of the victim’s lifetime. There could be a loss of economic potential (poorer educational achievement, loss of working days and career prospects). There will also be the mental health cost of suffering and trauma. The ‘full cost of poor housing’[8] concluded that the best way to assess the total cost to society is to use a tried-and-tested formula, such as the one developed by the Transport Research Laboratory (TRL) [20] , which evaluates the costs of
– Average NHS costs (Table 3.4) for HHSRS Category 1 hazards are applied to the likelihoods and outcomes.
– A total NHS cost for each dwelling is calculated and summed for the total housing stock.
– Costs are taken from the surveys’ ‘cost to make healthy and safe’ model to reduce the hazard to an acceptable level (at least the average for the dwelling age and type).
The ‘cost of poor housing’ has been measured separately for England[8] Wales [9] and Northern Ireland[10] and published in individual reports. Data from these reports are aggregated in Table 3.4 to provide the total cost of poor housing across these three nations (the HHSRS is not measured in Scotland). The results are not directly comparable with those quoted in the 2008 ‘Housing in the UK’ report, which used an earlier version of the methodology, nor with the HHSRS Category 1 figures for England in Figure 3.5, above, as they relate to 2015 rather than 2017.
Construction datePre 19191919-19441945-19641965-2017
Dwelling typeTerraced houseSemi-detachedDetachedFlat
TenureOwner occupiedPrivate rentedSocial rented
LocationUrbanRuralAll dwellings
26%12%8%5%
13%11%12%8%
11%14%6%
13%18%11%
34%21%14%9%
22%14%21%9%
19%24%7%
15%24%18%
27%17%10%5%
6%7%13%6%
10%9%4%
7%13%9%
Northern IrelandEnglandHHSRS Category 1 Wales
Table 3.3: HHSRS Category 1 hazards in England, Wales and Northern Ireland by dwelling age, dwelling type and tenure
Table 3.4: Comparison between the housing conditions of England, Wales and Northern Ireland
Table 3.5: UK treatment cost burden estimates to the NHS for selected hazards
Physical inactivity
Overweight and obesity
Smoking
Alcohol intake
Poor housing
Total cost burden estimates to the NHSRisk Factor
£0.9-£1.0 billion
£5.1-£5.2 billion
£2.3-£3.3 billion
£3.0-£3.2 billion
£1.5-£2.5 billion
% poor condition (HHSRS Category1)
Total cost of mitigation works per annum
Annual treatment cost to NHS per annum
Full annual health cost of poor housing per annum
Northern Ireland
England, Wales and Northern IrelandEngland Wales
11%
£10,072m
£1,413m
£18,667m
18%
£584m
£95m
£1,031m
9%
£305m
£40m
£401m
11%
£10,961m
£1,548m
£20,099m
28 29
Notes:
1. In order to be consistent national data already published, bungalows are incorporated into the four dwelling type categories above for Wales and Northern Ireland but are excluded from these categories for England.
2. Location statistics are based on different definitions. Wales use an ONS definition, where an area is considered rural if it is outside of settlements with a population of more than 10,000. Scotland use a definition based on settlement size and remoteness. England and Northern Ireland are based on surveyor judgement.
Note: Reference dates are England 2015, Wales 2017-18, Northern Ireland 2016.
Note: £1.5bn is the latest poor housing figure for England, Wales and Northern Ireland using the same HHSRS based method. The £2.5bn figure is an extrapolation for the whole of the UK, which includes Category 2 (significantly worse than average for the type of dwelling), as well as Category 1 (severe) HHSRS hazards, and assumes that Scotland will have similar hazards to the rest of the UK.
both fatal and non-fatal injuries. These costs include human impacts (pain, grief and suffering), indirect economic impacts, as well as direct medical costs. TRL have also conducted research for the Royal Society for the Prevention of Accidents (RoSPA) to value the impact of home accidents using these costs.
Using this approach, it is estimated that the total cost to society of poor housing in England, Wales and Northern Ireland is some £20 billion per annum (Table 3.4). This suggests that the annual treatment costs to the NHS is around 7.7% of the societal costs of all poor housing in these countries.
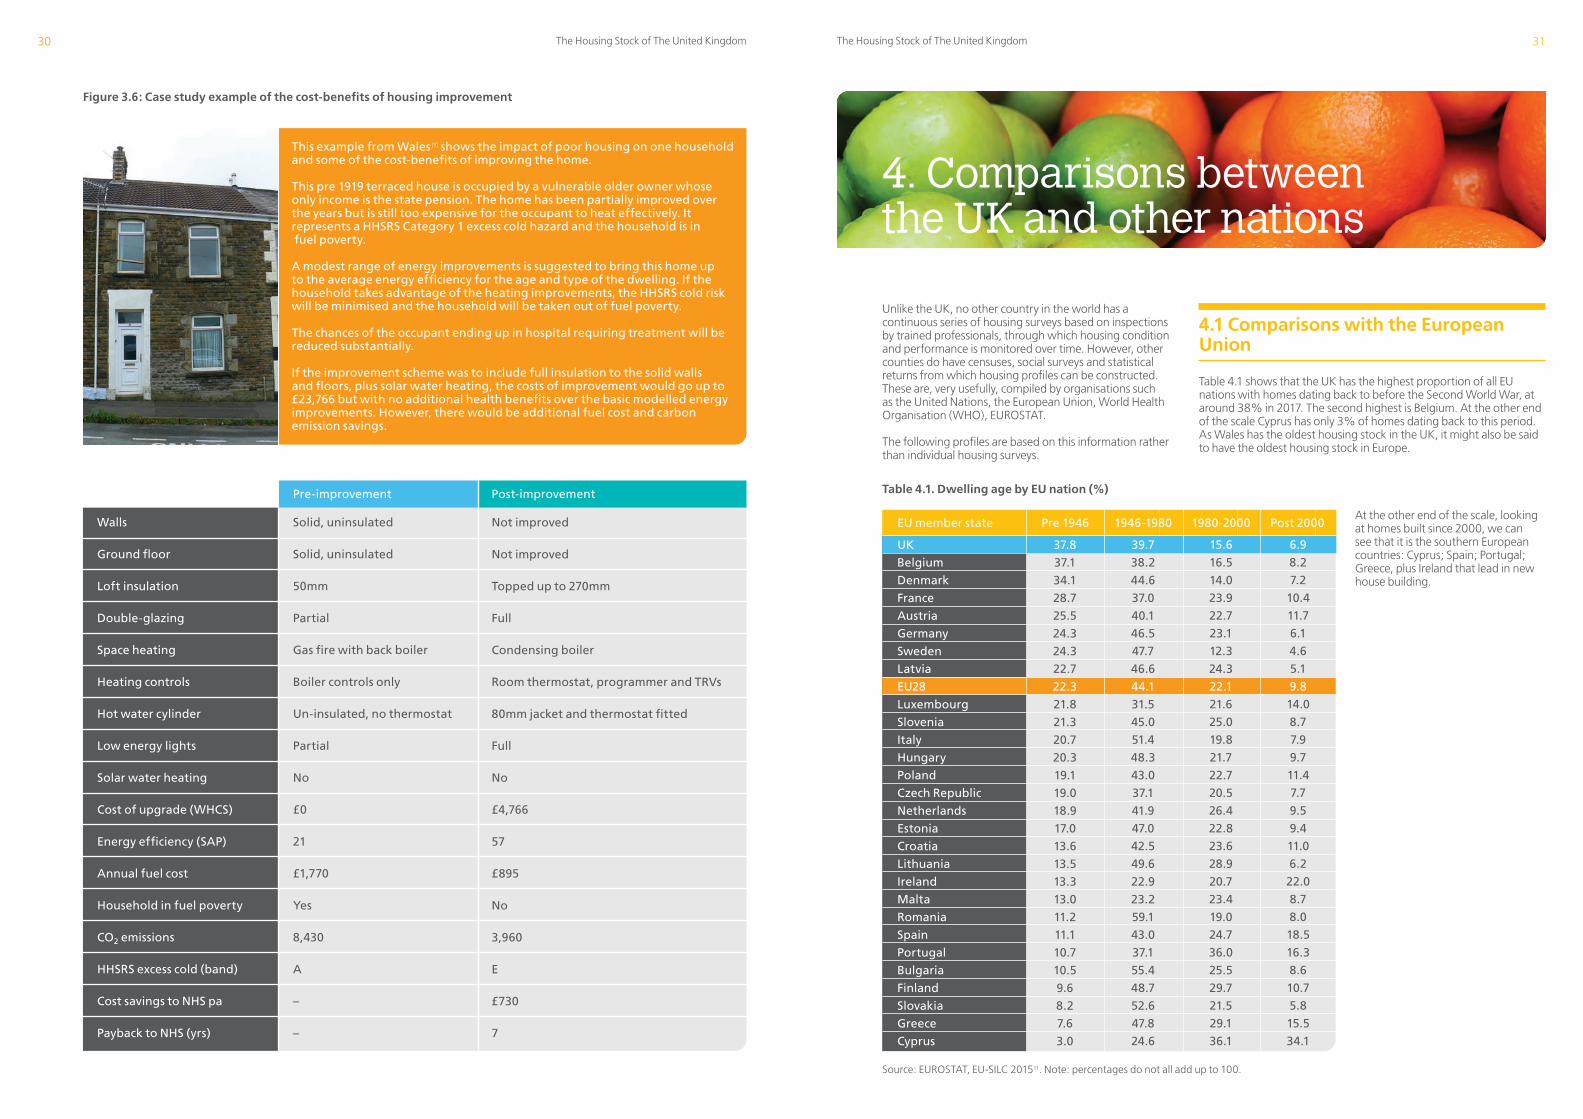
Wales has the highest proportion of poor housing among the UK nations, due largely to its older housing stock (Table 3.4). Consequently, it has a very high burden on the Welsh NHS for the treatment of housing related illnesses and accidents. Figure 3.6 shows an example, using data from the WHCS 2017-18, of how a small intervention to improve poor housing can have multiple benefits.
The Housing Stock of The United KingdomThe Housing Stock of The United Kingdom
This example from Wales [9] shows the impact of poor housing on one household and some of the cost-benefits of improving the home.
This pre 1919 terraced house is occupied by a vulnerable older owner whose only income is the state pension. The home has been partially improved over the years but is still too expensive for the occupant to heat effectively. It represents a HHSRS Category 1 excess cold hazard and the household is in fuel poverty.
A modest range of energy improvements is suggested to bring this home up to the average energy efficiency for the age and type of the dwelling. If the household takes advantage of the heating improvements, the HHSRS cold risk will be minimised and the household will be taken out of fuel poverty.
The chances of the occupant ending up in hospital requiring treatment will be reduced substantially.
If the improvement scheme was to include full insulation to the solid walls and floors, plus solar water heating, the costs of improvement would go up to £23,766 but with no additional health benefits over the basic modelled energy improvements. However, there would be additional fuel cost and carbon emission savings.
Walls
Ground floor
Loft insulation
Double-glazing
Space heating
Heating controls
Hot water cylinder
Low energy lights
Solar water heating
Cost of upgrade (WHCS)
Energy efficiency (SAP)
Annual fuel cost
Household in fuel poverty
CO2 emissions
HHSRS excess cold (band)
Cost savings to NHS pa
Payback to NHS (yrs)
Pre-improvement Post-improvement
Solid, uninsulated
Solid, uninsulated
50mm
Partial
Gas fire with back boiler
Boiler controls only
Un-insulated, no thermostat
Partial
No
£0
21
£1,770
Yes
8,430
A
–
–
Not improved
Not improved
Topped up to 270mm
Full
Condensing boiler
Room thermostat, programmer and TRVs
80mm jacket and thermostat fitted
Full
No
£4,766
57
£895
No
3,960
E
£730
7
Figure 3.6: Case study example of the cost-benefits of housing improvement
Table 4.1. Dwelling age by EU nation (%)
4. Comparisons between the UK and other nations
Unlike the UK, no other country in the world has a continuous series of housing surveys based on inspections by trained professionals, through which housing condition and performance is monitored over time. However, other counties do have censuses, social surveys and statistical returns from which housing profiles can be constructed. These are, very usefully, compiled by organisations such as the United Nations, the European Union, World Health Organisation (WHO), EUROSTAT.
The following profiles are based on this information rather than individual housing surveys.
4.1 Comparisons with the European Union
Table 4.1 shows that the UK has the highest proportion of all EU nations with homes dating back to before the Second World War, at around 38% in 2017. The second highest is Belgium. At the other end of the scale Cyprus has only 3% of homes dating back to this period. As Wales has the oldest housing stock in the UK, it might also be said to have the oldest housing stock in Europe.
Pre 1946EU member state 1946-1980 1980-2000 Post 2000
37.8
37.1
34.1
28.7
25.5
24.3
24.3
22.7
22.3
21.8
21.3
20.7
20.3
19.1
19.0
18.9
17.0
13.6
13.5
13.3
13.0
11.2
11.1
10.7
10.5
9.6
8.2
7.6
3.0
UK
Belgium
Denmark
France
Austria
Germany
Sweden
Latvia
EU28
Luxembourg
Slovenia
Italy
Hungary
Poland
Czech Republic
Netherlands
Estonia
Croatia
Lithuania
Ireland
Malta
Romania
Spain
Portugal
Bulgaria
Finland
Slovakia
Greece
Cyprus
39.7
38.2
44.6
37.0
40.1
46.5
47.7
46.6
44.1
31.5
45.0
51.4
48.3
43.0
37.1
41.9
47.0
42.5
49.6
22.9
23.2
59.1
43.0
37.1
55.4
48.7
52.6
47.8
24.6
15.6
16.5
14.0
23.9
22.7
23.1
12.3
24.3
22.1
21.6
25.0
19.8
21.7
22.7
20.5
26.4
22.8
23.6
28.9
20.7
23.4
19.0
24.7
36.0
25.5
29.7
21.5
29.1
36.1
6.9
8.2
7.2
10.4
11.7
6.1
4.6
5.1
9.8
14.0
8.7
7.9
9.7
11.4
7.7
9.5
9.4
11.0
6.2
22.0
8.7
8.0
18.5
16.3
8.6
10.7
5.8
15.5
34.1
Source: EUROSTAT, EU-SILC 201511. Note: percentages do not all add up to 100.
30 31
At the other end of the scale, looking at homes built since 2000, we can see that it is the southern European countries: Cyprus; Spain; Portugal; Greece, plus Ireland that lead in new house building.

The Housing Stock of The United KingdomThe Housing Stock of The United Kingdom
In terms of dwelling type, the UK is characterised by its ‘conjoined’ dwellings (terraced and semi-detached houses), Figure 4.2. Only Ireland and the Netherlands have similar proportions of such homes to the UK. Households in eastern and southern Europe are more likely to live in flats than houses.
Former Soviet Union and Eastern European countries are largely defined by the ‘polar’ nature of their housing, with the urban population mainly living in walk-up blocks of flats built in the communist era and the rural population living in largely self-build detached houses.
The UK picture is also by no means the norm in terms of tenure, Figure 4.3. The UK has a spread of housing tenures, with those buying with a mortgage or owning outright being the largest group. Countries like Germany and Switzerland have large regulated private rented sectors, while households in Eastern Europe were gifted state-owned flats at the end of the communist period and are now most likely to own their own homes outright.
Figure 4.1 Proportion of dwellings built since 2000, by EU nation
Other Detached house Semi-detached house Flat
Ital
y (3
)
Den
mar
k (4
)
Irel
and
(2)
Swit
zerl
and
(2)
Icel
and
(2)
Serb
ia (
2)
No
rway
Un
ite
d K
ing
do
m
Cro
atia
Ne
ther
lan
ds
Bel
giu
m
Cyp
rus
Slo
ven
ia
Hu
ng
ary
Fran
ce
Esto
nia
(2)
EU-2
8 (1
)
Spai
n
Latv
ia
Gre
ece
Fin
lan
d
Luxe
mb
ou
rg
Ro
man
ia
Swe
den
Mal
ta
Slo
vaki
a
Port
ug
al
Pola
nd
Ger
man
y
Au
stri
a
Bu
lgar
ia
Cze
ch R
epu
blic
Euro
are
a (E
A-1
9) (
1)
Lith
uan
ia
100
75
50
25
0
1 Estimates.2 2013.3 Provisional data.4 2012.Source: Eurostat (online data code: ilc_lvho01)
Figure 4.2. Dwelling types by EU member state (%)
32 33
Note: Semi-detached houses include terraced houses in this figure.
Share of dwellings built after 2000, by NUTS level 3 region, 2011 (1)(% of all dwellings)
(% of all dwellings)EU-28 = 9.8 < 5.0 5.0 - < 7.5 7.5 - < 10 10.0 - < 15.0 ≥ 15.0 Data not available
Administrative boundaries: © EuroGeographics © UN-FAO © TurkstatCartography: Eurostat – GISCO, 09/2015
800 km6004002000
[1]Regions in the United Kingdom: low reliabilitySource: Eurostat (Census Hub HC53)
The Housing Stock of The United KingdomThe Housing Stock of The United Kingdom
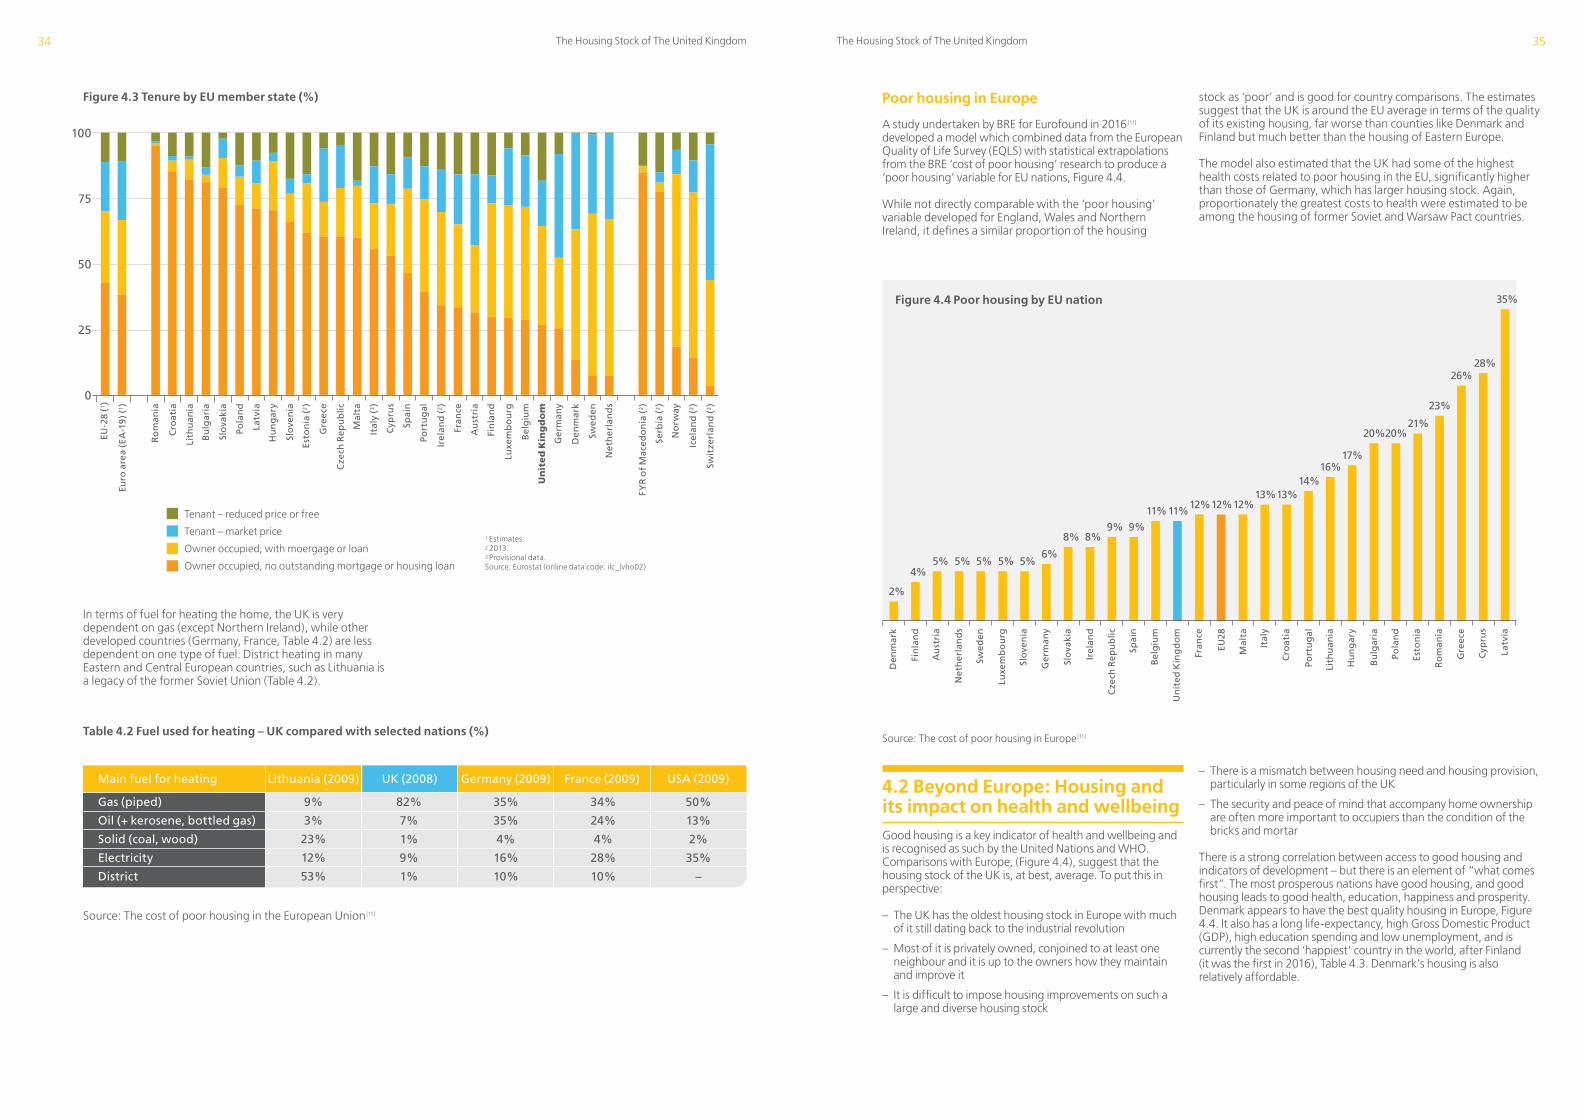
Poor housing in Europe
A study undertaken by BRE for Eurofound in 2016[11] developed a model which combined data from the European Quality of Life Survey (EQLS) with statistical extrapolations from the BRE ‘cost of poor housing’ research to produce a ‘poor housing’ variable for EU nations, Figure 4.4.
While not directly comparable with the ‘poor housing’ variable developed for England, Wales and Northern Ireland, it defines a similar proportion of the housing
4.2 Beyond Europe: Housing and its impact on health and wellbeingGood housing is a key indicator of health and wellbeing and is recognised as such by the United Nations and WHO.Comparisons with Europe, (Figure 4.4), suggest that the housing stock of the UK is, at best, average. To put this in perspective:
– The UK has the oldest housing stock in Europe with much of it still dating back to the industrial revolution
– Most of it is privately owned, conjoined to at least one neighbour and it is up to the owners how they maintain and improve it
– It is difficult to impose housing improvements on such a large and diverse housing stock
Figure 4.3 Tenure by EU member state (%)
Tenant – reduced price or free
Tenant – market price
Owner occupied, with moergage or loan
Owner occupied, no outstanding mortgage or housing loan
Ital
y (3
)
Den
mar
k
Irel
and
(2)
Swit
zerl
and
(2)
FYR
of
Mac
ed
on
ia (
2)
Icel
and
(2)
Serb
ia (
2)
No
rway
Un
ite
d K
ing
do
m
Cro
atia
Ne
ther
lan
ds
Bel
giu
m
Cyp
rus
Slo
ven
ia
Hu
ng
ary
Fran
ce
Esto
nia
(2)
EU-2
8 (1
)
Spai
n
Latv
ia
Gre
ece
Fin
lan
d
Luxe
mb
ou
rg
Ro
man
ia
Swe
den
Mal
ta
Slo
vaki
a
Port
ug
al
Pola
nd
Ger
man
y
Au
stri
a
Bu
lgar
ia
Cze
ch R
epu
blic
Euro
are
a (E
A-1
9) (
1)
Lith
uan
ia
1 Estimates.2 2013.3 Provisional data.Source: Eurostat (online data code: ilc_lvho02)
100
75
50
25
0
In terms of fuel for heating the home, the UK is very dependent on gas (except Northern Ireland), while other developed countries (Germany, France, Table 4.2) are less dependent on one type of fuel. District heating in many Eastern and Central European countries, such as Lithuania is a legacy of the former Soviet Union (Table 4.2).
Table 4.2 Fuel used for heating – UK compared with selected nations (%)
Lithuania (2009) UK (2008) Germany (2009) France (2009) USA (2009)Main fuel for heating
9%
3%
23%
12%
53%
Gas (piped)
Oil (+ kerosene, bottled gas)
Solid (coal, wood)
Electricity
District
82%
7%
1%
9%
1%
35%
35%
4%
16%
10%
34%
24%
4%
28%
10%
50%
13%
2%
35%
–
Source: The cost of poor housing in the European Union[11]
stock as ‘poor’ and is good for country comparisons. The estimates suggest that the UK is around the EU average in terms of the quality of its existing housing, far worse than counties like Denmark and Finland but much better than the housing of Eastern Europe.
The model also estimated that the UK had some of the highest health costs related to poor housing in the EU, significantly higher than those of Germany, which has larger housing stock. Again, proportionately the greatest costs to health were estimated to be among the housing of former Soviet and Warsaw Pact countries.
– There is a mismatch between housing need and housing provision, particularly in some regions of the UK
– The security and peace of mind that accompany home ownership are often more important to occupiers than the condition of the bricks and mortar
There is a strong correlation between access to good housing and indicators of development – but there is an element of “what comes first”. The most prosperous nations have good housing, and good housing leads to good health, education, happiness and prosperity. Denmark appears to have the best quality housing in Europe, Figure 4.4. It also has a long life-expectancy, high Gross Domestic Product (GDP), high education spending and low unemployment, and is currently the second ‘happiest’ country in the world, after Finland (it was the first in 2016), Table 4.3. Denmark’s housing is also relatively affordable.
Figure 4.4 Poor housing by EU nation
Source: The cost of poor housing in Europe[11]
Den
mar
k
12%11%11%
9%9%8%8%
6%5%5%5%5%5%
4%
2%
12%12%13%13%
14%16%
17%
20%20%21%
23%
26%28%
35%
Fin
lan
d
Au
stri
a
Ne
ther
lan
ds
Swe
den
Luxe
mb
ou
rg
Slo
ven
ia
Ger
man
y
Slo
vaki
a
Irel
and
Cze
ch R
epu
blic
Spai
n
Bel
giu
m
Un
ite
d K
ing
do
m
Fran
ce
EU28
Mal
ta
Ital
y
Cro
atia
Port
ug
al
Lith
uan
ia
Hu
ng
ary
Bu
lgar
ia
Pola
nd
Esto
nia
Ro
man
ia
Gre
ece
Cyp
rus
Latv
ia
34 35

The Housing Stock of The United KingdomThe Housing Stock of The United Kingdom
South Sudan is the newest independent country recognised by the United Nations. It is also ranked last in terms of its ‘happiness score’. Whilst a lack of access to modern housing is clearly a factor in this, South Sudan is currently involved in a civil war. Safety and security are key components of housing satisfaction, which perhaps we take for granted in Western Europe. Less than 1 in 400 homes in England are considered to present a mental and physical health risk from intruders, as measured through the HHSRS[8]. The UK homicide rate is low at just over 1 in 100,000 (Table 4.3). Whilst reassuring, of course it makes it even more important that we address the concerns of the people who are trapped in such situations.
Even in rapidly developing countries like Brazil, housing security is the major concern for people (Brazil has one of the highest homicide rates in the world).
The movement from rural to urban areas offers the opportunity to provide improved housing standards. The urban housing of China is more likely to have access to amenities than rural housing (improved sanitation: 87% urban vs. 64% rural [13] , while in countries like South Sudan new urban housing will be provided with amenities, which are not currently realistic to provide in inaccessible rural areas.
The value of housing
We often hear that our housing is some of the most expensive in the world. In fact, in relation to income, average house prices in the UK are fairly typical for Europe (Table 4.3). Within the UK, house values in England are significantly higher than the other UK nations (Figure 4.5). Within the nations there is also considerable variation, with London, in particular, affecting the English and UK average house value.
In February 2019, the average price of a home in the UK was £226,000. This varied from £243,000 in England to £137,000 in Northern Ireland. The average price was £160,000 in Wales and £146,000 in Scotland.
Photos: ‘Soviet’ housing in Latvia
Photo: Housing security is a major concern. Social housing, Salvador, Brazil
Photo: Typical rural housing, South Sudan
New social housing in Denmark
There are other factors, of course, which affect Denmark’s housing quality, including a history of good design and building regulation, and an equity of access to good housing for households of all incomes and tenures.
Latvia is estimated to have the poorest quality housing in Europe, Figure 4.4. Its problems largely relate to the
poor housing stock it inherited from the Soviet Union and the costs associated with maintaining and renewing it against limited resources. Rural de-population is also an issue.
Table 4.3 shows that, compared with the wider world, the UK/Western Europe, whilst not always ideal, is able to support a relatively good quality housing stock and a high standard of living.
Table 4.3 Selected countries – Indicators of development, prosperity, health and wellbeing 2018
Figure 4.5 Average house price by UK country, January 2005 – February 2019
United Kingdom
ChinaGermany BrazilDenmark South Sudan
Latvia USAIndicator
67
275
83.4
81.7
1.2
4.2
40,249
9.16
100.0
99.6
9.9
5.6
17.4
94.8
6.5
Gas
14
15
1,415
151
59.2
76.4
0.6
4.7
7,993
29.02
94.5
77.7
5.3
-
13.8
53.2
7.5
Coal
86
93
Population (million)
Population density (p.km 2)
% urban
Life expectancy
Homicide rate per 100,000
% unemployed
GDP per capita $
Home price to income ratio
% access to drinking water
% access to sanitation
% GDP spent on health
% GDP spent on education
Expected years of schooling
% access to internet
Carbon emissions (tons pc)
Primary home heating
UN Development rank (out of 188)
World happiness rank (out of 156)
82
236
77.3
81.2
1.2
3.6
42,456
9.02
100.0
99.3
11.2
4.9
17.0
89.6
8.9
Gas
5
17
211
25
86.6
75.7
29.5
11.9
8,649
18.72
95.0
73.5
8.9
5.9
15.4
59.7
2.6
Electric
79
32
6
136
87.9
80.9
1.0
5.9
53,730
6.93
100.0
99.6
10.3
7.6
19.1
97.0
5.9
Gas
11
2
13
21
19.6
57.3
13.9
11.5
534
-
58.6
6.6
2.5
1.8
4.9
17.9
0.3
None
187
156
2
31
68.1
74.7
3.4
9.4
13,993
9.35
99.6
87.5
5.8
5.3
15.8
79.9
5.5
District
41
53
327
36
82.3
79.5
5.4
4.3
57,808
3.58
99.2
100.0
16.8
5.0
16.5
76.2
16.2
Gas
13
19
Sources: UN World Statistics Pocketbook 2018[12] and UN Development Index 2018[13]. Happiness Indicator is from the ‘World Happiness Report[14]. The home price to income ratio is from NUMEO[15].
Source: ONS UK House Price Index: February 2019
England Wales Scotland Northern Ireland
2015
Feb
2016
Jun
2017
Oct
2019
Feb
2005
Oct
2007
Feb
2008
Jun
2009
Oct
2011
Feb
2012
Jun
2013
Oct
400,000
200,000
0
36 37

The Housing Stock of The United KingdomThe Housing Stock of The United Kingdom
Homes are not, however, remaining as built. Figure 5.2 shows that nearly 60% of the homes in England that survive from before 1967 have had major improvements. Some 35% have been extended and 15% have been totally renovated.
5. The future housing stock of the UK
The UK housing stock is changing slowly over time. ONS figures suggest 192,000 completions in the UK as a whole (161,000 of which were in England) in 2017/18 [16] but as this data is based on building control data only, it is an undercount. Alternative published statistics for England in 2017/18 [17] showed 222,000 net housing additions.
The housing surveys show a net increase of some 5 million homes over the 26-year period 1991-2017, an average of just less than 200,000 per annum. This net increase includes gains through new build/conversion/change of use, and losses through demolition/change of use.
Figure 5.1 shows that the UK housing stock is not being ‘renewed’ but rather being added to at a slow rate. A simple mathematic extrapolation suggests that a home built today would have to last 1,000 years at current replacement rates.
Figure 5.2 What has happened to homes built before 1967?
Figure 5.1 Changes in the UK housing stock, 1991-2017
Sources: 1991 (1993 Wales) and 2017 UK national housing surveys
30,000
25,000
20,000
15,000
10,000
5,000
020171991
1991-20174,923
1965-19907,985
1965-19907,774
1945-19645,472
1945-19645,095
1919-19444,284
1919-19444,480
Pre 19195,871
Pre 19196,115
thou
sand
s of
dw
ellin
gs
Photo: The main structure of this well-built Victorian Cotswold stone house could last 1,000 years, if properly maintained, although the interior, amenities and services will have undergone many renewals during this time.
60
50
40
30
20
10
0
per
cent
age
any major improvement
home extended
completely renovated
major alteration to external appearance
home converted
loft space converted
Sources: MHCLG, 2017[2]
38 39

The Housing Stock of The United KingdomThe Housing Stock of The United Kingdom
There will most likely still be some 3 million pre 1919 terraced houses around in 2050. These remain popular, as they are usually conveniently located to urban centres and stations. Outside the most expensive areas, they are within the price reach of couples and young families. People have an emotional connection to them. They do, however, present a greater challenge in improving them to modern standards due to their solid wall construction and limited space standards. Parking is a perennial problem.
One house type that is on the decline is the bungalow. Very few are now being built, because they occupy too much high value land for their floor area. And many of those that remain, particularly those on large plots in high value areas, are being re-developed into new or highly improved homes.
In terms of housing conditions, homes will continue to improve but will be subject to cycles of maintenance and disrepair. At current rates, we will not meet the Government’s aim to make the UK a zero-carbon country by 2050. Nor will we meet our domestic energy efficiency targets by building new energy efficient homes alone. There will need to be a concerted effort to improve the existing housing stock[18]. However, a positive outcome from the inherently slow rate of change in the UK housing stock relates to the conservation and retention of products and materials that are ‘banked’ in existing dwellings. The concept of Circular Economy is gaining prominence as a means of reducing impacts, such as whole life carbon emissions, i.e. operational plus embodied carbon over the lifetime of the asset. Projects, such as the EU funded Building as Material Banks (BAMB), find that “there are strong economic, environmental and societal benefits associated with retaining and upgrading existing assets rather than a ‘take-make-use-dispose’ linear approach[19].”
What will the UK housing of the future look like? Brave proclamations and predictions are often made about what our housing stock will look like in future. Will it be like these new low energy, sustainable homes in St Albans?
The reality is that the UK housing will look much the same as it does today. At current rates of replacement, another 6.6 million homes will be added between 2017 and 2050, leading to a total UK housing stock of around 35 million homes. Only a small number will be replaced, although many will have undergone significant improvement.
Following recent trends[6] , around half of new UK housing will be flats, compared with 21% of the existing housing stock, followed by detached houses. It is perhaps a factor that the medium sized family homes that dominate the existing housing stock are well established and what the market requires is easy-to-manage flats for smaller households and larger detached houses for wealthier families.
Non-traditional methods of construction, such as off-site fabrication, are still relatively uncommon and it remains to be seen whether the market will embrace these technologies in the future. Much will be similar in style and basic construction as pre-existing homes.
The net result is likely to be that the most common house type in 2050 will still be the family semi-detached house built between 1919 -1964. These are still highly sought after as family homes. They are usually situated on generous plots, which lend themselves to improvement and extension. They are traditionally built with cavity walls and large useful loft spaces which are un-complicated to improve. Also, they are typically located in suburban locations, close to schools and amenities. Essentially, they remain desirable and flexible family homes and there are likely to still be over 5 million of these around in 2050.
Photo: Sustainable new housing, St Albans, England
Photo: Modern flats for smaller, private households
Photo: Solid wall terraced houses are convenient and popular, but offer challenges for improvement
Photo: A modest bungalow in the process of being transformed into a large, two-storey house
Photo: A modest suburban 1930s semi-detached house, now improved to 5 beds with side, rear and loft extensions
40 41

The Housing Stock of The United KingdomThe Housing Stock of The United Kingdom
1. Piddington J, Garrett H, Nowak, T (2013). FB62 Housing in the UK: National comparisons in typology, condition and cost of poor housing. IHS BRE Press, Bracknell.
2. Ministry for Housing, Communities and Local Government (2017). 50 Years of the English Housing Survey. MHCLG, London.
3. Central Housing Advisory Committee (1966). Our Older Homes: A Call for Action. (Report of the Sub-Committee on Standards of Housing Fitness). London: HMSO.
4. Ministry of Housing and Local Government (1968). House Condition Survey, England and Wales 1967. Economic Trends 175 (May 1968), pp. xxiv.
5. Leather, P and Morrison, T (1997). The state of UK housing: A fact-file on dwelling conditions. The Policy Press, Bristol.
6. Nicol S, Beer C and Scott, C (2014). FB 71 The age and construction of English Homes. IHS BRE Press, Bracknell.
7. Office of the Deputy Prime Minister (2004). Housing Health and Safety Rating System – Guidance (Version 2). ODPM, London.
8. Roys M, Nicol S, Garrett H, Margoles S (2016). FB81 The Full Cost of Poor Housing. IHS BRE Press, Bracknell.
9. Nicol S and Garrett, H. (2019) The Full Cost of Poor Housing in Wales. BRE Trust, Watford.
10. Housing Executive (2018b). The Cost of Poor Housing in Northern Ireland. Housing Executive, Belfast.
11. Nicol S, Roys M, Ormandy D, Ezratty V (2016). The Cost of Poor Housing in the European Union. BRE Trust, Watford.
12. United Nations Department of Economic and Social Affairs, Statistics Division (2018). World Statistics Pocketbook: 2018 edition. UN New York.
13. United Nations Development Programme (2018). Human Development Index 2018. UN, New York.
14. Helliwell J.F, Layard R and Sachs D (2019). World Happiness Report. UN New York.
15. NUMEO (2019). Property Price Index by Country 2019.
16. https://www.ons.gov.uk/peoplepopulationandcommunity/housing/datasets/ukhousebuildingpermanentdwellingsstartedandcompleted
17. https://www.gov.uk/government/statistical-data-sets/live-tables-on-net-supply-of-housing
18. Committee on Climate Change (2019). UK housing: Fit for Future.
19. https://www.bamb2020.eu
20. Walker L K. RE-valuation of home accidents. TRL Published Project Report PPR483. Crowthorne, TRL. 2010.
The housing of the UK is the oldest in the world and is being replaced very slowly. As such, it presents unique challenges in making it fit for the future. Below are some global conclusions based on BRE’s experience of 50 years of housing conditions surveys:
– Targeted policies can have a major effect on housing conditions and performance.
– Housing improvements are generally one-way gains and will accrue benefits long into the future.
– Housing repair and maintenance has to be sustained.
– Tackling poor housing conditions does not have to be expensive and has multiple benefits to society as a whole.
– It makes economic sense to invest in improving housing rather than pay for the consequences of poor housing through the NHS and other agencies.
– If you provide sufficient good quality housing, everything else will follow, with proven gains in asset value, health, wellbeing, life chances and economic performance.
– Build sub-standard housing and you are stuck with it and it will be very difficult to repair, improve or replace.
– Finally, investments in national housing surveys will pay for themselves time again in well-informed, funded and targeted housing policies that will ultimately deliver social and economic benefits. All the better if these surveys have comparable methodologies and timeframes.
6. Conclusions 7. References
42 43

PEN
02 2
0 ©
BR
E Fe
bru
ary
2020BRE Trust
Bucknalls Lane Watford Herts WD25 9XX
T: 0333 321 8811 E: [email protected] www.bretrust.org.uk
BRE Trust
The BRE Trust is a registered charity in England & Wales: No. 1092193, and Scotland: No. SC039320. It uses gift aid to fund research and education programmes in the built environment.
February 2020


