The Housing Bubble that Burst: Can House Prices be Explained ...
24
47 The Housing Bubble that Burst: Can House Prices be Explained? And Can Their Fluctuations be Dampened? Niels Arne Dam, Tina Saaby Hvolbøl, Erik Haller Pedersen, Peter Birch Sørensen and Susanne Hougaard Thamsborg, Economics INTRODUCTION AND SUMMARY The Danish housing market went through a dramatic cycle in the 2000s. Over a few years in the middle of the decade, real house prices rose at a pace not seen since the hectic years from 1983 to 1986. Then the curve took a steep dive, and homeowners experienced large real capital losses in 2008 and the first half of 2009. The skyrocketing house prices contributed strongly to the overheating of the Danish economy seen in 2006 and 2007, and the downturn in the housing market began before the international and Danish financial crisis hit the real economy in earnest. The timing of the housing market plunge was very unfortunate as it amplified the contractionary effects of the financial crisis. Experience from the last decade has, once again, demonstrated that large fluctuations in house prices can destabilise the economy. Therefore it is important to understand the factors that drive house prices. Broader understanding of pricing mechanisms for owner-occupied housing is a prerequisite if future economic policy is to prevent large fluctuations in the housing market. In Part 2 of this Monetary Review, we perform an in-depth analysis of recent years' developments in the owner-occupied housing market and discuss how fluctuations can be curbed. This article provides a non- technical summary of our most important results and conclusions. One of the main conclusions is that the housing market boom in the last decade was to a large extent driven by the introduction of new forms of housing finance and to some extent by the nominal freeze on the prop- erty value tax. These measures amplified cyclical fluctuations and have entailed lower employment prospects in the coming years than we would otherwise have seen. Fluctuations in the housing market, and hence in the economy, can be reduced by restoring the link between Monetary Review 1st Quarter 2011 - Part 1
Transcript of The Housing Bubble that Burst: Can House Prices be Explained ...
47
The Housing Bubble that Burst: Can House Prices be Explained? And Can Their Fluctuations be Dampened?
Niels Arne Dam, Tina Saaby Hvolbøl, Erik Haller Pedersen, Peter Birch Sørensen and Susanne Hougaard Thamsborg, Economics
INTRODUCTION AND SUMMARY
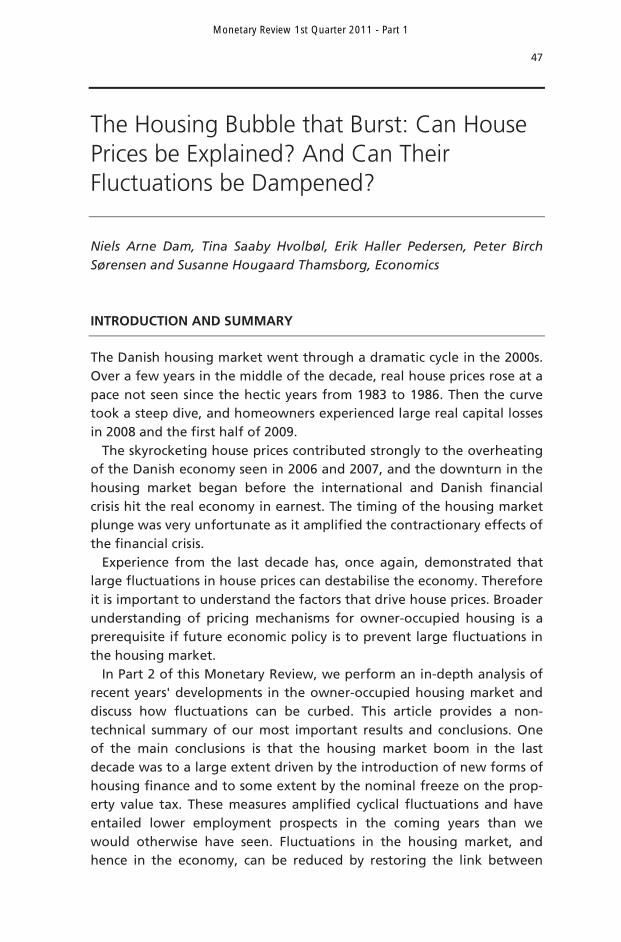
The Danish housing market went through a dramatic cycle in the 2000s. Over a few years in the middle of the decade, real house prices rose at a pace not seen since the hectic years from 1983 to 1986. Then the curve took a steep dive, and homeowners experienced large real capital losses in 2008 and the first half of 2009.
The skyrocketing house prices contributed strongly to the overheating of the Danish economy seen in 2006 and 2007, and the downturn in the housing market began before the international and Danish financial crisis hit the real economy in earnest. The timing of the housing market plunge was very unfortunate as it amplified the contractionary effects of the financial crisis.
Experience from the last decade has, once again, demonstrated that large fluctuations in house prices can destabilise the economy. Therefore it is important to understand the factors that drive house prices. Broader understanding of pricing mechanisms for owner-occupied housing is a prerequisite if future economic policy is to prevent large fluctuations in the housing market.
In Part 2 of this Monetary Review, we perform an in-depth analysis of recent years' developments in the owner-occupied housing market and discuss how fluctuations can be curbed. This article provides a non-technical summary of our most important results and conclusions. One of the main conclusions is that the housing market boom in the last decade was to a large extent driven by the introduction of new forms of housing finance and to some extent by the nominal freeze on the prop-erty value tax. These measures amplified cyclical fluctuations and have entailed lower employment prospects in the coming years than we would otherwise have seen. Fluctuations in the housing market, and hence in the economy, can be reduced by restoring the link between
Monetary Review 1st Quarter 2011 - Part 1
48
property value tax and current house prices, and by phasing out deferred-amortisation mortgage loans for owner-occupied housing.
CAN HOUSE PRICES BE EXPLAINED?1
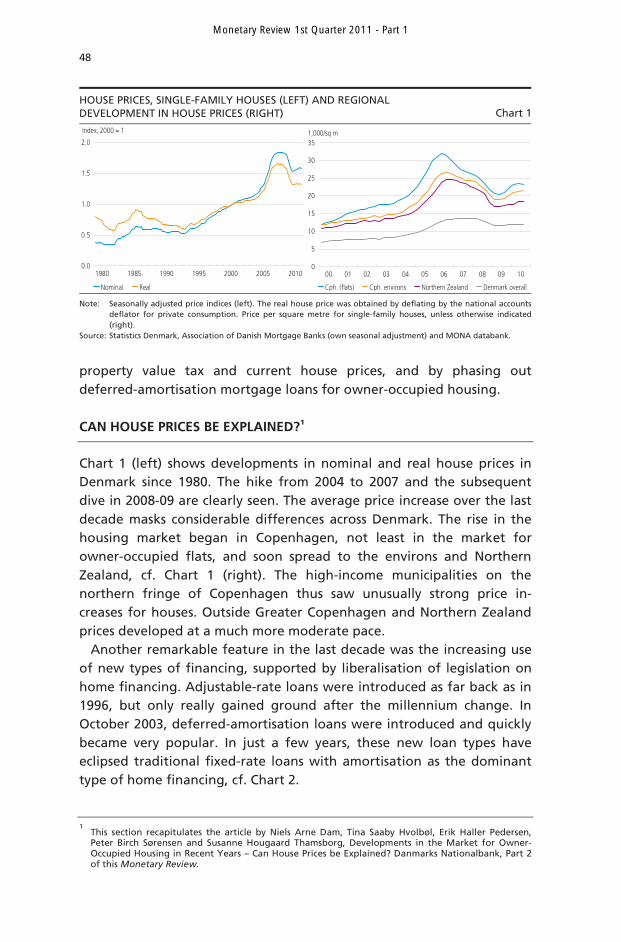
Chart 1 (left) shows developments in nominal and real house prices in Denmark since 1980. The hike from 2004 to 2007 and the subsequent dive in 2008-09 are clearly seen. The average price increase over the last decade masks considerable differences across Denmark. The rise in the housing market began in Copenhagen, not least in the market for owner-occupied flats, and soon spread to the environs and Northern Zealand, cf. Chart 1 (right). The high-income municipalities on the northern fringe of Copenhagen thus saw unusually strong price in-creases for houses. Outside Greater Copenhagen and Northern Zealand prices developed at a much more moderate pace.
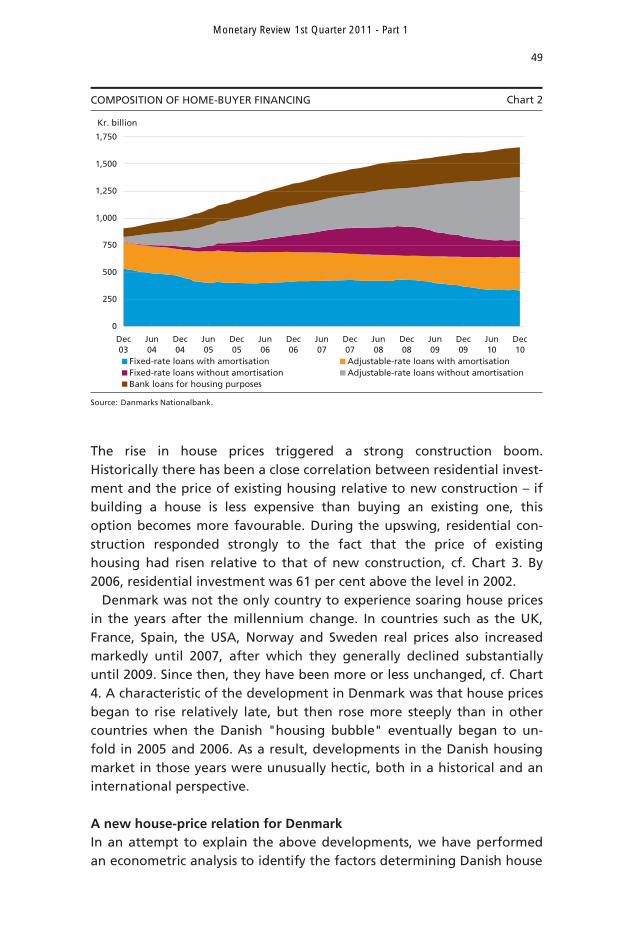
Another remarkable feature in the last decade was the increasing use of new types of financing, supported by liberalisation of legislation on home financing. Adjustable-rate loans were introduced as far back as in 1996, but only really gained ground after the millennium change. In October 2003, deferred-amortisation loans were introduced and quickly became very popular. In just a few years, these new loan types have eclipsed traditional fixed-rate loans with amortisation as the dominant type of home financing, cf. Chart 2.
1 This section recapitulates the article by Niels Arne Dam, Tina Saaby Hvolbøl, Erik Haller Pedersen,
Peter Birch Sørensen and Susanne Hougaard Thamsborg, Developments in the Market for Owner-Occupied Housing in Recent Years – Can House Prices be Explained? Danmarks Nationalbank, Part 2 of this Monetary Review.
HOUSE PRICES, SINGLE-FAMILY HOUSES (LEFT) AND REGIONAL DEVELOPMENT IN HOUSE PRICES (RIGHT) Chart 1
0.0
0.5
1.0
1.5
2.0
Nominal Real
1980 1985 1990 1995 2000 2005 2010
Index, 2000 = 1
0
5
10
15
20
25
30
351,000/sq m
Cph. (flats) Cph. environs Northern Zealand Denmark overall
00 01 02 03 04 05 06 07 08 09 10
Note: Source:
Seasonally adjusted price indices (left). The real house price was obtained by deflating by the national accounts deflator for private consumption. Price per square metre for single-family houses, unless otherwise indicated (right). Statistics Denmark, Association of Danish Mortgage Banks (own seasonal adjustment) and MONA databank.
Monetary Review 1st Quarter 2011 - Part 1
49
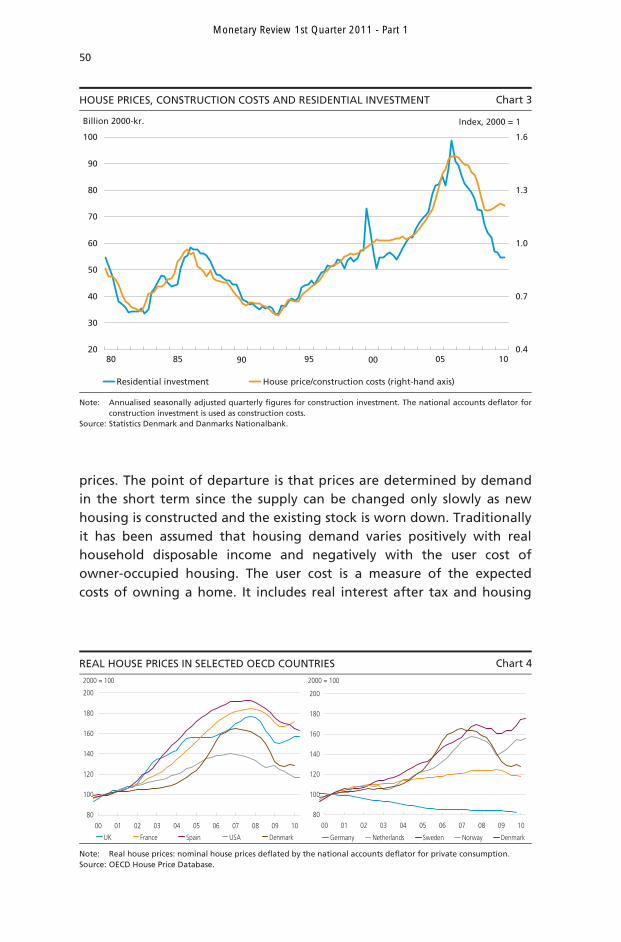
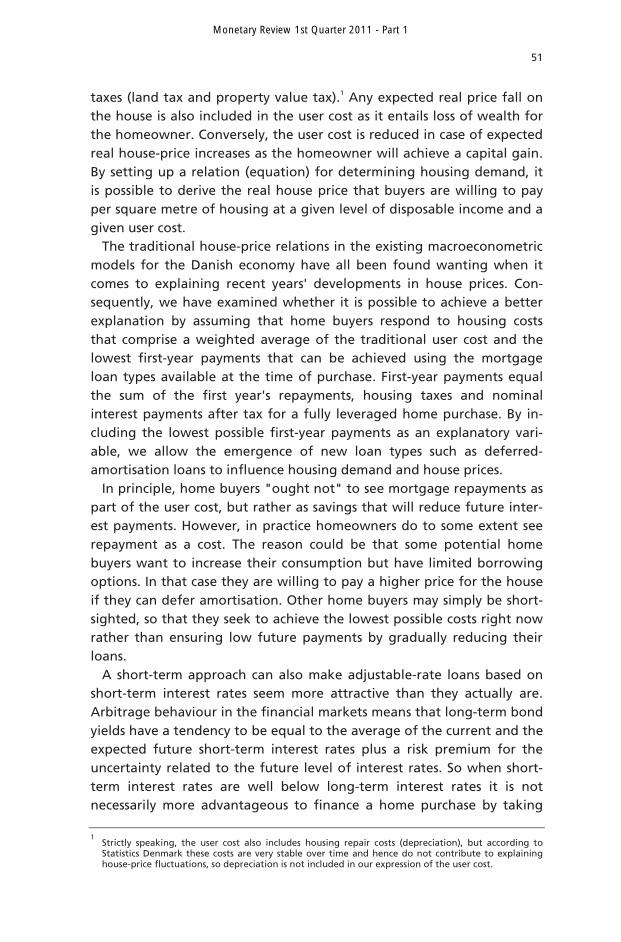
The rise in house prices triggered a strong construction boom. Historically there has been a close correlation between residential invest-ment and the price of existing housing relative to new construction – if building a house is less expensive than buying an existing one, this option becomes more favourable. During the upswing, residential con-struction responded strongly to the fact that the price of existing housing had risen relative to that of new construction, cf. Chart 3. By 2006, residential investment was 61 per cent above the level in 2002.
Denmark was not the only country to experience soaring house prices in the years after the millennium change. In countries such as the UK, France, Spain, the USA, Norway and Sweden real prices also increased markedly until 2007, after which they generally declined substantially until 2009. Since then, they have been more or less unchanged, cf. Chart 4. A characteristic of the development in Denmark was that house prices began to rise relatively late, but then rose more steeply than in other countries when the Danish "housing bubble" eventually began to un-fold in 2005 and 2006. As a result, developments in the Danish housing market in those years were unusually hectic, both in a historical and an international perspective. A new house-price relation for Denmark In an attempt to explain the above developments, we have performed an econometric analysis to identify the factors determining Danish house
COMPOSITION OF HOME-BUYER FINANCING Chart 2
0
250
500
750
1,000
1,250
1,500
1,750
Dec03
Jun04
Dec04
Jun05
Dec05
Jun06
Dec06
Jun07
Dec07
Jun08
Dec08
Jun09
Dec09
Jun10
Dec10
Fixed-rate loans with amortisation Adjustable-rate loans with amortisationFixed-rate loans without amortisation Adjustable-rate loans without amortisationBank loans for housing purposes
Kr. billion
Source: Danmarks Nationalbank.
Monetary Review 1st Quarter 2011 - Part 1
50
prices. The point of departure is that prices are determined by demand in the short term since the supply can be changed only slowly as new housing is constructed and the existing stock is worn down. Traditionally it has been assumed that housing demand varies positively with real household disposable income and negatively with the user cost of owner-occupied housing. The user cost is a measure of the expected costs of owning a home. It includes real interest after tax and housing
HOUSE PRICES, CONSTRUCTION COSTS AND RESIDENTIAL INVESTMENT Chart 3
20
30
40
50
60
70
80
90
100
Billion 2000-kr.
0.4
0.7
1.0
1.3
1.6
Residential investment House price/construction costs (right-hand axis)
80 85 90 95 00 05 10
Index, 2000 = 1
Note: Source:
Annualised seasonally adjusted quarterly figures for construction investment. The national accounts deflator forconstruction investment is used as construction costs. Statistics Denmark and Danmarks Nationalbank.
REAL HOUSE PRICES IN SELECTED OECD COUNTRIES Chart 4
80
100
120
140
160
180
200
00 01 02 03 04 05 06 07 08 09 10
UK France Spain USA Denmark
2000 = 100
80
100
120
140
160
180
200
00 01 02 03 04 05 06 07 08 09 10
Germany Netherlands Sweden Norway Denmark
2000 = 100
Note: Source:
Real house prices: nominal house prices deflated by the national accounts deflator for private consumption. OECD House Price Database.
Monetary Review 1st Quarter 2011 - Part 1
51
taxes (land tax and property value tax).1 Any expected real price fall on the house is also included in the user cost as it entails loss of wealth for the homeowner. Conversely, the user cost is reduced in case of expected real house-price increases as the homeowner will achieve a capital gain. By setting up a relation (equation) for determining housing demand, it is possible to derive the real house price that buyers are willing to pay per square metre of housing at a given level of disposable income and a given user cost.
The traditional house-price relations in the existing macroeconometric models for the Danish economy have all been found wanting when it comes to explaining recent years' developments in house prices. Con-sequently, we have examined whether it is possible to achieve a better explanation by assuming that home buyers respond to housing costs that comprise a weighted average of the traditional user cost and the lowest first-year payments that can be achieved using the mortgage loan types available at the time of purchase. First-year payments equal the sum of the first year's repayments, housing taxes and nominal interest payments after tax for a fully leveraged home purchase. By in-cluding the lowest possible first-year payments as an explanatory vari-able, we allow the emergence of new loan types such as deferred-amortisation loans to influence housing demand and house prices.
In principle, home buyers "ought not" to see mortgage repayments as part of the user cost, but rather as savings that will reduce future inter-est payments. However, in practice homeowners do to some extent see repayment as a cost. The reason could be that some potential home buyers want to increase their consumption but have limited borrowing options. In that case they are willing to pay a higher price for the house if they can defer amortisation. Other home buyers may simply be short-sighted, so that they seek to achieve the lowest possible costs right now rather than ensuring low future payments by gradually reducing their loans.
A short-term approach can also make adjustable-rate loans based on short-term interest rates seem more attractive than they actually are. Arbitrage behaviour in the financial markets means that long-term bond yields have a tendency to be equal to the average of the current and the expected future short-term interest rates plus a risk premium for the uncertainty related to the future level of interest rates. So when short-term interest rates are well below long-term interest rates it is not necessarily more advantageous to finance a home purchase by taking
1 Strictly speaking, the user cost also includes housing repair costs (depreciation), but according to
Statistics Denmark these costs are very stable over time and hence do not contribute to explaining house-price fluctuations, so depreciation is not included in our expression of the user cost.
Monetary Review 1st Quarter 2011 - Part 1
52
out an adjustable-rate loan rather than a fixed-rate long-term loan. A steep yield curve usually reflects that short-term interest rates are set to rise substantially, or that there is considerable uncertainty regarding the future level of interest rates. If home buyers are not fully aware of this, access to adjustable-rate loans based on short-term interest rates could make a home purchase look more favourable. Financing at a currently low rate of interest could also be attractive for liquidity-constrained buyers who would like to increase consumption now at the expense of future consumption.
So there are several reasons to assume that the emergence of new loan types in the early 2000s contributed to raising housing demand and house prices. As previously mentioned, we are assuming that home buyers re-spond to housing costs that are a weighted average of the traditional user cost (the relevant costs for a rational home buyer not constrained by liquidity) and the lowest possible first-year payments, given the loan types available at the time of the purchase. In our econometric analysis, we let data determine the weight of the first-year payments in the housing costs, selecting the weight so as to achieve the best possible statistical explan-ation of house prices. Using this approach, we find that home buyers respond to housing costs in which the first-year payments have a weight of 60 per cent, while the traditional user cost has a weight of 40 per cent. One possible interpretation is that 60 per cent of home buyers are con-strained by liquidity or are short-sighted, while the remaining 40 per cent take a longer-term approach and are not short of liquidity for financing their desired consumption level. Another, equally plausible, interpretation is that individual home buyers attach considerable importance (60 per cent) to the opportunity to consume now, but that they also attach some importance (40 per cent) to consumption opportunities in the longer term, which are improved by e.g. repayment of loans (and by inflation that erodes the real value of their debt).
Our econometric relation for explaining the average level of house prices takes into account that prices only gradually adjust to changes in the underlying housing demand, which is, as already mentioned, deter-mined by real disposable income and by our weighted average of the user cost and the lowest possible first-year payments. The long-term yield on 30-year fixed-rate mortgage bonds affects housing demand and house prices by way of the user cost, while short-term yields and re-quired mortgage repayments have an impact via their effect on the first-year payments. Housing taxes work through both channels. Over time, changes in house prices affect the housing supply by impacting on the volume of new construction. In that way, changes in housing demand are slowly reflected in changes in supply, which dampens long-term
Monetary Review 1st Quarter 2011 - Part 1
53
price fluctuations. Our analysis of house prices takes account of the development in the housing supply.1
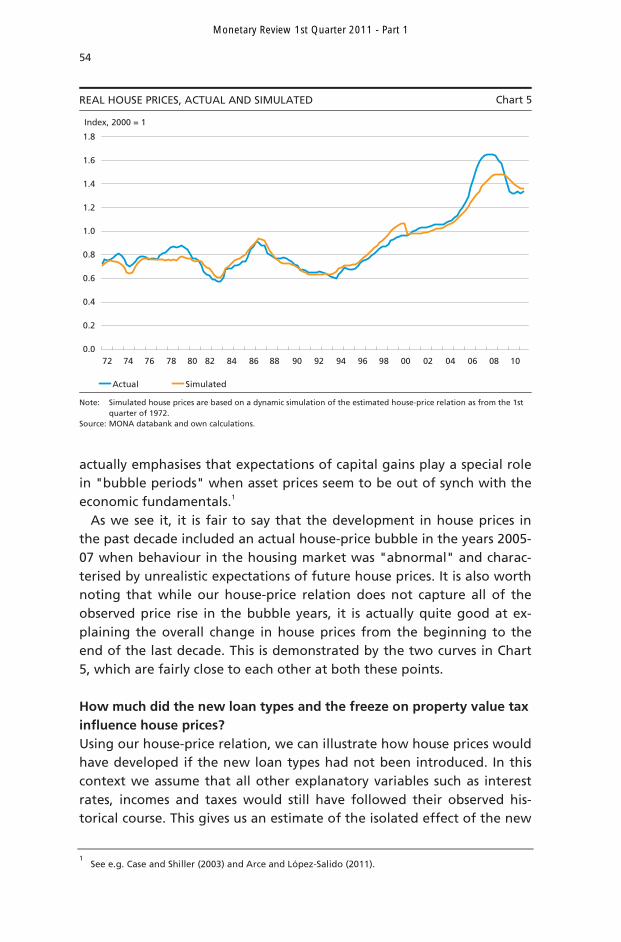
Using the above explanatory variables, we have estimated a house-price relation on Danish data for the period from the 1st quarter of 1972 to the 2nd quarter of 2010. As house prices respond sluggishly to changes in the underlying housing demand, there is a statistical correl-ation between current house prices and prices in previous periods. We have performed a "dynamic simulation" of the estimated house-price relation in which the predicted house price in a given period is based not only on the currently observed levels of interest rates, incomes and taxes, etc., but also on predicted house prices in previous periods. In this way we can examine whether the relation is good at capturing fluctu-ations in house prices or whether the house-price predictions tend to diverge from actual developments.
The result of this exercise is illustrated in Chart 5. It is seen that the relation generally captures the most significant fluctuations in house prices until 2004 fairly well, while it has difficulty explaining the steep price increases in 2005-06 and the subsequent fall in 2008-09. This sup-ports the popular assumption that there was a "bubble" in the housing market in the years just before the financial crisis, when house prices were decoupled from the underlying economic fundamentals that nor-mally govern price formation. When the bubble burst, the subsequent price fall was particularly dramatic because prices had risen so far above their fundamental level.
As previously mentioned, expectations of future capital gains on houses will stimulate housing demand by reducing the user cost. Various surveys indicate that household expectations of the future course of house prices are strongly influenced by price developments in the imme-diate past. This assumption has been incorporated into our econometric analysis. In the "bubble years" 2005-07, our estimate of the expected rise in house prices reached the highest level seen at any time during the period from 1972 to the present. The high expectations of future capital gains contribute to explaining why housing demand and house prices soared in the "bubble years". Yet our estimated house-price relation is unable to capture all of the actual price increase. The reason could be that the relation does not take account of the possibility that house-price expectations may have carried greater weight in buyer consider-ations in the years when observed price increases were particularly dra-matic. The economic literature on speculative bubbles in asset markets
1 In the house-price relation, we take the development in the housing supply as a given. However, we
have also estimated a separate relation for explaining residential investment, which is presented in more detail in Dam et al. (2011a).
Monetary Review 1st Quarter 2011 - Part 1
54
actually emphasises that expectations of capital gains play a special role in "bubble periods" when asset prices seem to be out of synch with the economic fundamentals.1
As we see it, it is fair to say that the development in house prices in the past decade included an actual house-price bubble in the years 2005-07 when behaviour in the housing market was "abnormal" and charac-terised by unrealistic expectations of future house prices. It is also worth noting that while our house-price relation does not capture all of the observed price rise in the bubble years, it is actually quite good at ex-plaining the overall change in house prices from the beginning to the end of the last decade. This is demonstrated by the two curves in Chart 5, which are fairly close to each other at both these points. How much did the new loan types and the freeze on property value tax influence house prices? Using our house-price relation, we can illustrate how house prices would have developed if the new loan types had not been introduced. In this context we assume that all other explanatory variables such as interest rates, incomes and taxes would still have followed their observed his-torical course. This gives us an estimate of the isolated effect of the new
1 See e.g. Case and Shiller (2003) and Arce and López-Salido (2011).
REAL HOUSE PRICES, ACTUAL AND SIMULATED Chart 5
0.0
0.2
0.4
0.6
0.8
1.0
1.2
1.4
1.6
1.8
Actual Simulated
Index, 2000 = 1
72 74 76 78 80 82 84 86 88 90 92 94 96 98 00 02 04 06 08 10
Note: Source:
Simulated house prices are based on a dynamic simulation of the estimated house-price relation as from the 1st quarter of 1972. MONA databank and own calculations.
Monetary Review 1st Quarter 2011 - Part 1
55
loan types. Initially we assume that the large unexplained "bubble element" in house prices in the middle of the last decade would have been unchanged. In this way we find that the increase in real house prices from the 4th quarter of 1999 until the peak in the 1st quarter of 2007 would "only" have been approximately 40 per cent if the new loan types had not been introduced, compared with an actual increase of 71 per cent. According to the house-price relation, adjustable-rate loans and deferred-amortisation loans have had more or less the same impact on house prices.
We have also calculated the isolated effect of the freeze on property value tax in nominal terms from the beginning of 2002. If this freeze had not been introduced, property value tax would have developed more or less in line with house prices. In addition, we assume that all other factors (including the new loan types) would have developed as they actually did. We have performed two alternative calculations. In the first one, we assume that home buyers solely respond to current property value tax, i.e. that no-one takes into account the gradual erosion of taxes by inflation as a result of the freeze. Under this assump-tion, our house-price relation shows that real house prices would have risen by approximately 5 percentage points less up to the peak in the 1st quarter of 2007.
However, as already mentioned, our house-price relation could also be interpreted to the effect that a proportion (an estimated 40 per cent) of home buyers are actually forward-looking and attach importance not only to current, but also to future housing costs. At the other extreme we have therefore assumed that these home buyers fully factor in the future tax savings achieved through the freeze on nominal property value tax. Applying a conservative assumption of expected house-price rises, we find that the real increase in house prices from the end of 1999 to the beginning of 2007 would have been a good 9 percentage points lower if the property value tax had not been frozen.
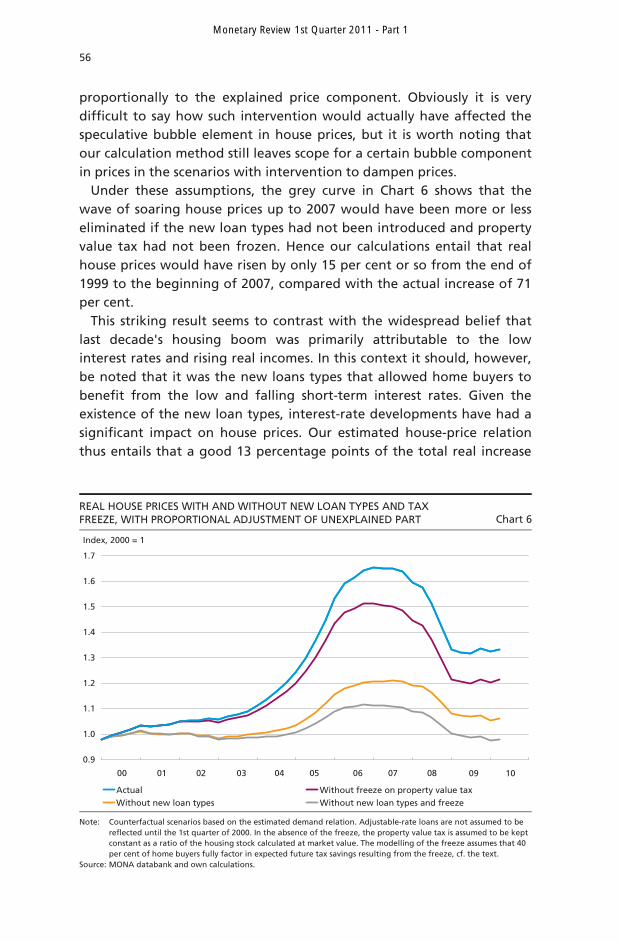
These estimates assume that the unexplained "bubble element" in house prices in 2005-07 would have been unaffected by intervention to dampen house prices. In reality it seems more likely that such interven-tion would have dampened the extraordinarily high expectations of price increases in the "bubble period" that our estimated house-price relation has difficulty capturing. In Chart 6 we have therefore assumed that if non-introduction of the new loan types or non-freezing of prop-erty value tax had dampened house prices by a certain factor, as in-dicated by the house-price relation, the bubble element in house prices would have been reduced by the same factor. In other words, we as-sume that the unexplained bubble component in house prices is reduced
Monetary Review 1st Quarter 2011 - Part 1
56
proportionally to the explained price component. Obviously it is very difficult to say how such intervention would actually have affected the speculative bubble element in house prices, but it is worth noting that our calculation method still leaves scope for a certain bubble component in prices in the scenarios with intervention to dampen prices.
Under these assumptions, the grey curve in Chart 6 shows that the wave of soaring house prices up to 2007 would have been more or less eliminated if the new loan types had not been introduced and property value tax had not been frozen. Hence our calculations entail that real house prices would have risen by only 15 per cent or so from the end of 1999 to the beginning of 2007, compared with the actual increase of 71 per cent.
This striking result seems to contrast with the widespread belief that last decade's housing boom was primarily attributable to the low interest rates and rising real incomes. In this context it should, however, be noted that it was the new loans types that allowed home buyers to benefit from the low and falling short-term interest rates. Given the existence of the new loan types, interest-rate developments have had a significant impact on house prices. Our estimated house-price relation thus entails that a good 13 percentage points of the total real increase
REAL HOUSE PRICES WITH AND WITHOUT NEW LOAN TYPES AND TAX FREEZE, WITH PROPORTIONAL ADJUSTMENT OF UNEXPLAINED PART Chart 6
0.9
1.0
1.1
1.2
1.3
1.4
1.5
1.6
1.7
Index, 2000 = 1
Actual Without freeze on property value taxWithout new loan types Without new loan types and freeze
00 01 02 03 04 05 06 07 08 09 10
Note: Source:
Counterfactual scenarios based on the estimated demand relation. Adjustable-rate loans are not assumed to be reflected until the 1st quarter of 2000. In the absence of the freeze, the property value tax is assumed to be kept constant as a ratio of the housing stock calculated at market value. The modelling of the freeze assumes that 40 per cent of home buyers fully factor in expected future tax savings resulting from the freeze, cf. the text. MONA databank and own calculations.
Monetary Review 1st Quarter 2011 - Part 1
57
in house prices from the millennium change until the peak in the 1st quarter of 2007 are attributable to the low level of the 30-year bond yield, while an equivalent share of the price increase can be related to the interest savings from the low (short-term) yield on adjustable-rate loans. The house-price relation also entails that just under 7 percentage points of the increase in real prices are attributable to income develop-ments, when adjustment is made for growth in the housing stock.
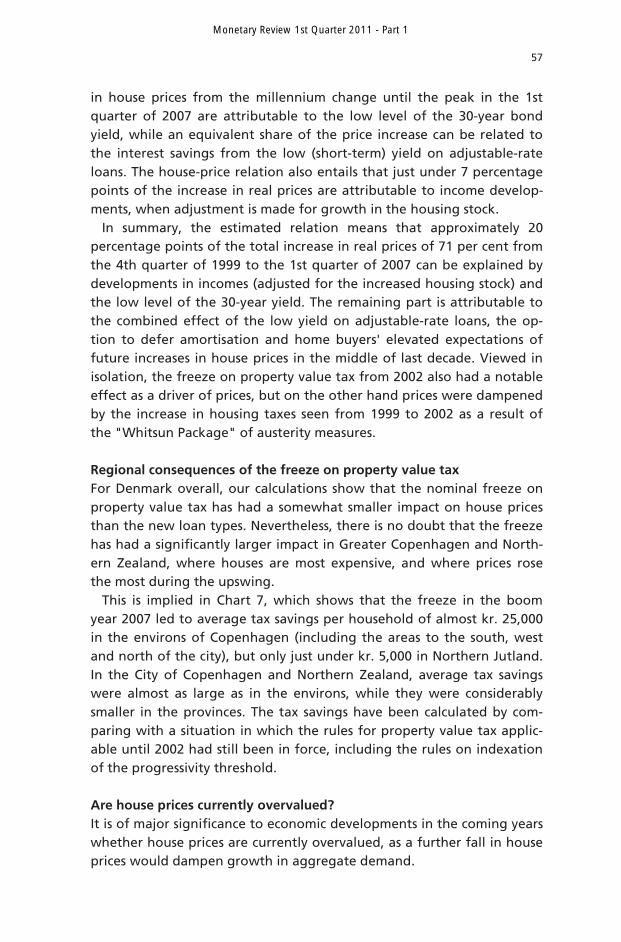
In summary, the estimated relation means that approximately 20 percentage points of the total increase in real prices of 71 per cent from the 4th quarter of 1999 to the 1st quarter of 2007 can be explained by developments in incomes (adjusted for the increased housing stock) and the low level of the 30-year yield. The remaining part is attributable to the combined effect of the low yield on adjustable-rate loans, the op-tion to defer amortisation and home buyers' elevated expectations of future increases in house prices in the middle of last decade. Viewed in isolation, the freeze on property value tax from 2002 also had a notable effect as a driver of prices, but on the other hand prices were dampened by the increase in housing taxes seen from 1999 to 2002 as a result of the "Whitsun Package" of austerity measures. Regional consequences of the freeze on property value tax For Denmark overall, our calculations show that the nominal freeze on property value tax has had a somewhat smaller impact on house prices than the new loan types. Nevertheless, there is no doubt that the freeze has had a significantly larger impact in Greater Copenhagen and North-ern Zealand, where houses are most expensive, and where prices rose the most during the upswing.
This is implied in Chart 7, which shows that the freeze in the boom year 2007 led to average tax savings per household of almost kr. 25,000 in the environs of Copenhagen (including the areas to the south, west and north of the city), but only just under kr. 5,000 in Northern Jutland. In the City of Copenhagen and Northern Zealand, average tax savings were almost as large as in the environs, while they were considerably smaller in the provinces. The tax savings have been calculated by com-paring with a situation in which the rules for property value tax applic-able until 2002 had still been in force, including the rules on indexation of the progressivity threshold.
Are house prices currently overvalued? It is of major significance to economic developments in the coming years whether house prices are currently overvalued, as a further fall in house prices would dampen growth in aggregate demand.
Monetary Review 1st Quarter 2011 - Part 1
58
The term "overvaluation" of prices can be interpreted in two ways. Firstly, it could mean that the current house prices are "abnormally" high in relation to the normal link between interest rates, incomes, housing taxes and house prices. Chart 5 does not indicate that this is the case. In 2010 house prices were actually a little below the level to be expected according to our estimated house-price relation.
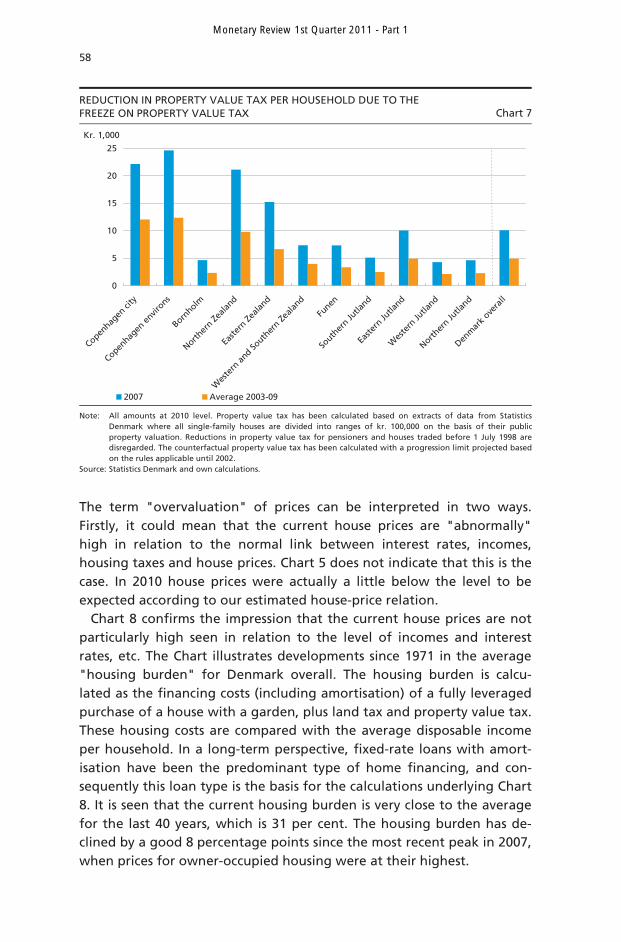
Chart 8 confirms the impression that the current house prices are not particularly high seen in relation to the level of incomes and interest rates, etc. The Chart illustrates developments since 1971 in the average "housing burden" for Denmark overall. The housing burden is calcu-lated as the financing costs (including amortisation) of a fully leveraged purchase of a house with a garden, plus land tax and property value tax. These housing costs are compared with the average disposable income per household. In a long-term perspective, fixed-rate loans with amort-isation have been the predominant type of home financing, and con-sequently this loan type is the basis for the calculations underlying Chart 8. It is seen that the current housing burden is very close to the average for the last 40 years, which is 31 per cent. The housing burden has de-clined by a good 8 percentage points since the most recent peak in 2007, when prices for owner-occupied housing were at their highest.
REDUCTION IN PROPERTY VALUE TAX PER HOUSEHOLD DUE TO THE FREEZE ON PROPERTY VALUE TAX Chart 7
0
5
10
15
20
25
Copenhag
en ci
ty
Copenhag
en en
virons
Bornholm
Norther
n Zeala
nd
Easte
rn Ze
aland
Wes
tern
and So
uther
n Zeala
nd
Funen
South
ern Ju
tland
Easte
rn Ju
tland
Wes
tern
Jutla
nd
Norther
n Jutla
nd
Denm
ark o
vera
ll
2007 Average 2003-09
Kr. 1,000
Note: Source:
All amounts at 2010 level. Property value tax has been calculated based on extracts of data from StatisticsDenmark where all single-family houses are divided into ranges of kr. 100,000 on the basis of their publicproperty valuation. Reductions in property value tax for pensioners and houses traded before 1 July 1998 aredisregarded. The counterfactual property value tax has been calculated with a progression limit projected basedon the rules applicable until 2002. Statistics Denmark and own calculations.
Monetary Review 1st Quarter 2011 - Part 1
59
We have also calculated developments in housing burdens in various parts of Denmark, assuming different types of financing. Again, our cal-culations do not point to general overvaluation of house prices at pre-sent.
Although house prices are not overvalued in the above sense, they may still be higher than the level which is compatible with long-term equilibrium in the housing market. To assess whether that is the case, we have performed three types of calculations. The first method is based on the assumption that the market for owner-occupied housing can only be in long-term equilibrium if the costs of living in one's own house more or less correspond to the normal costs of renting an equivalent house. Calculations based on this method indicate that real house prices must come down in the longer term. But there are considerable data problems related to using this method as the market for rented single-family houses is very small. Furthermore, the market for rental housing is extensively regulated and there are often waiting lists. As a result, it is very difficult to determine the ratio of owner-occupied housing prices to rents that is sustainable in the long term.
Our other two calculation methods are variations of the "Tobin's Q" method, which assumes that in a situation of long-term equilibrium the
HOUSING BURDEN SINCE 1971 Chart 8
0
10
20
30
40
50Per cent
71 73 75 77 79 81 83 85 87 89 91 93 95 97 99 01 03 05 07 09 Note: Source:
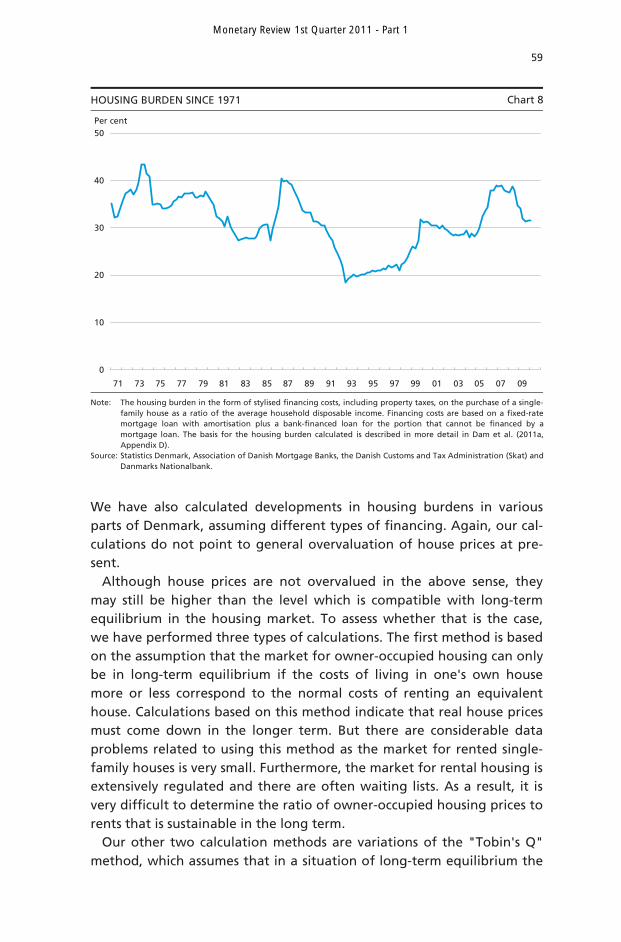
The housing burden in the form of stylised financing costs, including property taxes, on the purchase of a single-family house as a ratio of the average household disposable income. Financing costs are based on a fixed-ratemortgage loan with amortisation plus a bank-financed loan for the portion that cannot be financed by amortgage loan. The basis for the housing burden calculated is described in more detail in Dam et al. (2011a,Appendix D). Statistics Denmark, Association of Danish Mortgage Banks, the Danish Customs and Tax Administration (Skat) andDanmarks Nationalbank.
Monetary Review 1st Quarter 2011 - Part 1
60
price of existing housing must correspond to the cost of acquiring new housing of equivalent size and quality. One of the two variants of the Tobin's Q method indicates that house prices are currently somewhat above the long-term sustainable level, while the other variant gives a more ambiguous outcome. A fundamental problem when using this approach is that new housing and existing housing are often not comparable as they are situated on plots of land with very different location values. The location value in central, "expensive", fully de-veloped areas is determined by demand for housing with this specific location, so there is no fixed, cost-based long-term equilibrium price for such housing.
In other words, the Tobin's Q method and the method based on calcu-lation of the house-price-to-rent ratio provide only a weak basis for assessing the long-term sustainability of the current house prices. Con-sequently, we attach more importance to the results of our calculation of the housing burden, which does not indicate that the housing market is currently overvalued, cf. above. This conclusion is supported by the proximity of the current house prices to the level that could be expected on the basis of the house-price relation.
All the same, it is important to be aware of the fundamental differ-ences between the calculation methods described. While calculations of the house-price-to-rent ratio and Tobin's Q assess current house prices relative to an expected long-term equilibrium level, the house-price rela-tion and the calculation of the housing burden seek to assess whether current house prices are "reasonable" in view of the current levels of in-terest rates, incomes and housing taxes. Hence, the question is how house prices can be expected to develop in the coming years – when interest rates are expected to rise.
Where is the housing market heading? We have tried to answer this question by projecting developments in the supply of and demand for housing. We have done so by incorporating our estimated house-price relation and a newly estimated relation for residential investment into Danmarks Nationalbank's macroeconometric model, MONA. Using this extended model, we have performed a me-dium-term projection of developments in the Danish economy up to and including 2015, given the expected average growth in Denmark's export markets and the expected international interest-rate developments, etc.
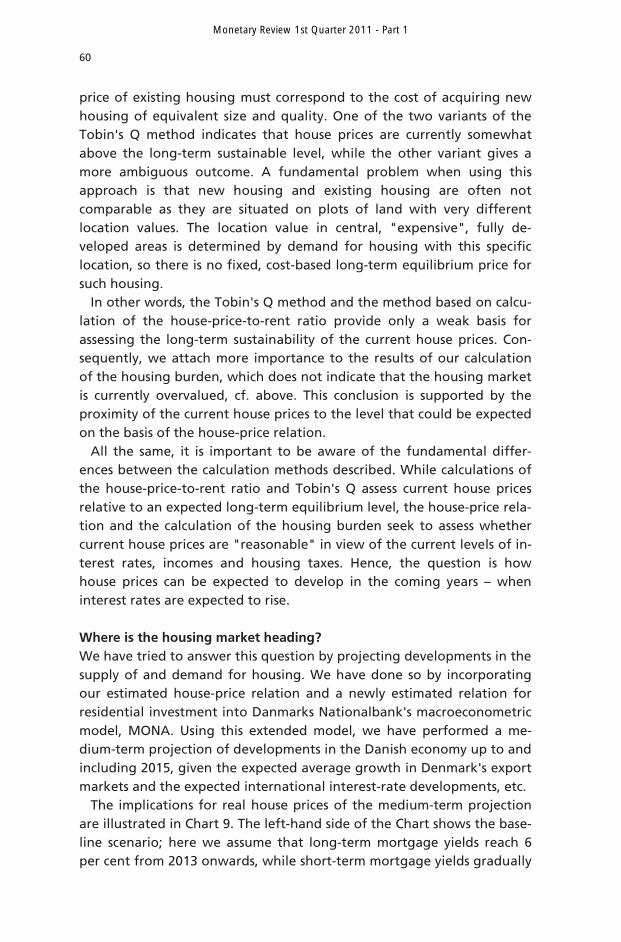
The implications for real house prices of the medium-term projection are illustrated in Chart 9. The left-hand side of the Chart shows the base-line scenario; here we assume that long-term mortgage yields reach 6 per cent from 2013 onwards, while short-term mortgage yields gradually
Monetary Review 1st Quarter 2011 - Part 1
61
rise to 4 per cent in the period up to 2015. In this scenario, real house prices are expected to be almost flat in the coming years, i.e. average nominal house prices are expected to develop more or less in line with the consumer price index. Real house prices do not fall despite the expected rise in interest rates; this is attributable to factors such as the expected gradual normalisation of the cyclical situation by 2015, which provides a basis for a certain increase in real disposable income, thereby stimulating housing demand.
Chart 9 (right) shows the expected development in house prices in an alternative scenario, in which international and Danish interest rates from 2012 rise more rapidly and to a higher level than in the above baseline scenario. In this scenario, both short-term and long-term bond yields are 1 percentage point higher by 2015 than in the baseline scen-ario. The steep rise in interest rates will dampen growth in the Danish economy, which in turn will reduce housing demand and hence house prices. In addition, there is a direct negative impact on house prices in that the additional rise in interest rates increases the households' housing costs. As a result, real house prices fall by 6-7 per cent in the period up to 2015, cf. Chart 9 (right).
We see the baseline scenario in Chart 9 (left) as the most likely one, since interest rates in the alternative scenario (right) exceed the level deemed to be normal in the longer term. All the same, it should be emphasised that model simulations such as those shown here are not good at capturing the fluctuations in house prices that may occur as a result of sudden shifts in households' expectations of the future. The projection is also based on the assumption that the international econ-omy does not suffer a new, unexpected downturn, e.g. because the European sovereign debt crisis intensifies.
MEDIUM-TERM PROJECTION OF REAL HOUSE PRICES Chart 9
Baseline scenario
1.15
1.30
1.45
1.60
1.75
-20
-10
0
10
20
Annual growth rate (right-hand axis) Level
05 06 07 08 09 10 11 12 13 14 15
Index, 2000 = 1 Per cent year-on-yearHigher interest rates
1.15
1.30
1.45
1.60
1.75
-20
-10
0
10
20
Annual growth rate (right-hand axis) Level
Index, 2000 = 1
05 06 07 08 09 10 11 12 13 14 15
Per cent year-on-year
Note: Source:
Projection of real house prices based on MONA extended by new relations for house price and residential investment. The baseline scenario is based on the forecast published in this Monetary Review supplemented by a technical projection for 2014-15. Danmarks Nationalbank.
Monetary Review 1st Quarter 2011 - Part 1
62
CAN HOUSE-PRICE FLUCTUATIONS BE DAMPENED?1
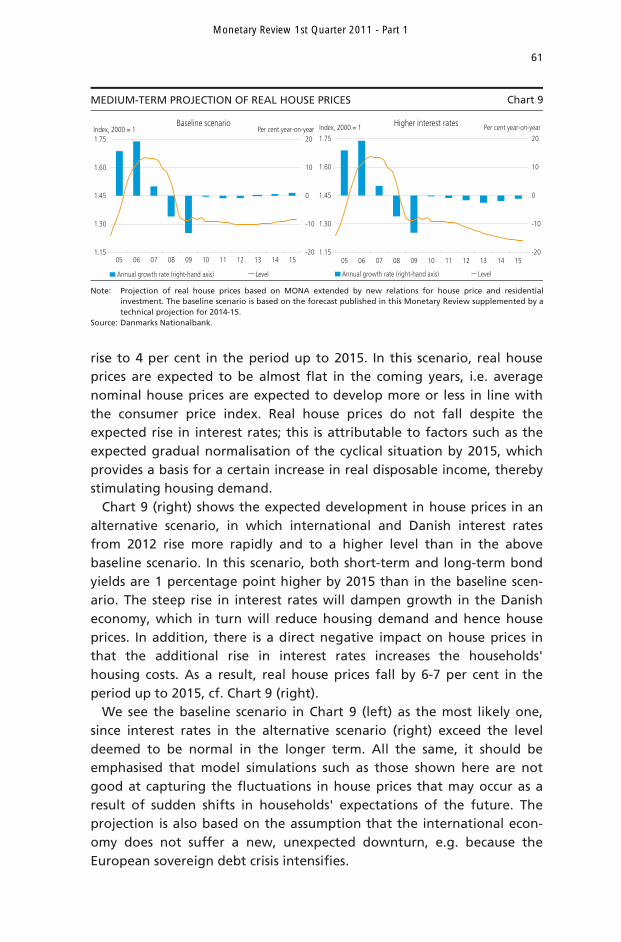
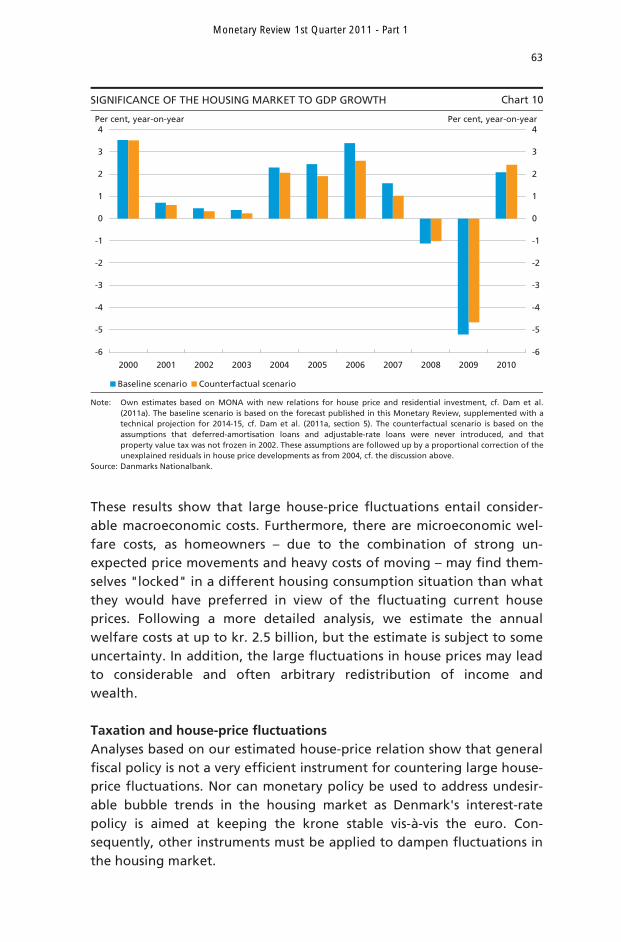
Costs of fluctuating house prices The housing boom and subsequent downturn in the housing market seen after the introduction of the new loan types and the freeze on property value tax have amplified cyclical fluctuations in the Danish economy since the middle of the last decade. This is illustrated by Chart 10, where the yellow bars show the actual growth rates in the real gross domestic product, GDP, while the blue bars show the growth rates that would, according to Danmarks Nationalbank's MONA model, have been realised if house prices had followed the lower grey curve in Chart 6 (without new loan types and tax freeze) instead of their actual course. It is seen that growth would have been lower in the middle of the last decade, when the economy was overheated. On the other hand, the cyclical downturn in the wake of the financial crisis would have been a little milder, and growth in 2010 would have been slightly higher.2 Our calculations show that approximately two thirds of the additional cyc-lical fluctuations that accompanied the housing bubble can be attri-buted to the deferred-amortisation loans and the nominal tax freeze.
The model simulations behind Chart 10 and the medium-term pro-jection behind Chart 9 also show that without the housing boom un-employment would have been higher in the middle of the last decade, but competitiveness would have developed more favourably. This means that there would have been prospects of stronger export performance and higher employment in the export sector in the coming years. The model simulations also show that the housing boom contributed strong-ly to a general boom in business fixed investment. This will dampen the demand for labour in the coming years as expansion of the capital stock can to some extent replace the need for labour in production. Combined with the weakening of Denmark's competitiveness, this means that the housing boom will entail a higher level of unemployment in the coming years than could otherwise have been expected. In addition, the freeze on property value tax has weakened public finances. According to the model simulations, the freeze reduces the balance of the public finances by approximately kr. 10 billion in 2015.
1 This section provides a brief outline of the article by Niels Arne Dam, Tina Saaby Hvolbøl and Peter
Birch Sørensen, Can House-Price Fluctuations be Dampened? Danmarks Nationalbank, Part 2 of this Monetary Review.
2 This analysis confirms the hypothesis of the impact of financial innovation in the mortgage-credit
market presented in Danmarks Nationalbank Monetary Review, 1st Quarter 2006, cf. p. 33: "The introduction of new financial products can also strengthen the link between housing wealth and consumption and may lead to larger fluctuations in housing prices and thus to greater cyclical fluctuations than previously seen."
Monetary Review 1st Quarter 2011 - Part 1
63
These results show that large house-price fluctuations entail consider-able macroeconomic costs. Furthermore, there are microeconomic wel-fare costs, as homeowners – due to the combination of strong un-expected price movements and heavy costs of moving – may find them-selves "locked" in a different housing consumption situation than what they would have preferred in view of the fluctuating current house prices. Following a more detailed analysis, we estimate the annual welfare costs at up to kr. 2.5 billion, but the estimate is subject to some uncertainty. In addition, the large fluctuations in house prices may lead to considerable and often arbitrary redistribution of income and wealth. Taxation and house-price fluctuations Analyses based on our estimated house-price relation show that general fiscal policy is not a very efficient instrument for countering large house-price fluctuations. Nor can monetary policy be used to address undesir-able bubble trends in the housing market as Denmark's interest-rate policy is aimed at keeping the krone stable vis-à-vis the euro. Con-sequently, other instruments must be applied to dampen fluctuations in the housing market.
SIGNIFICANCE OF THE HOUSING MARKET TO GDP GROWTH Chart 10
-6
-5
-4
-3
-2
-1
0
1
2
3
4
2000 2001 2002 2003 2004 2005 2006 2007 2008 2009 2010
-6
-5
-4
-3
-2
-1
0
1
2
3
4
Baseline scenario Counterfactual scenario
Per cent, year-on-year Per cent, year-on-year
Note: Source:
Own estimates based on MONA with new relations for house price and residential investment, cf. Dam et al.(2011a). The baseline scenario is based on the forecast published in this Monetary Review, supplemented with atechnical projection for 2014-15, cf. Dam et al. (2011a, section 5). The counterfactual scenario is based on theassumptions that deferred-amortisation loans and adjustable-rate loans were never introduced, and thatproperty value tax was not frozen in 2002. These assumptions are followed up by a proportional correction of theunexplained residuals in house price developments as from 2004, cf. the discussion above. Danmarks Nationalbank.
Monetary Review 1st Quarter 2011 - Part 1
64
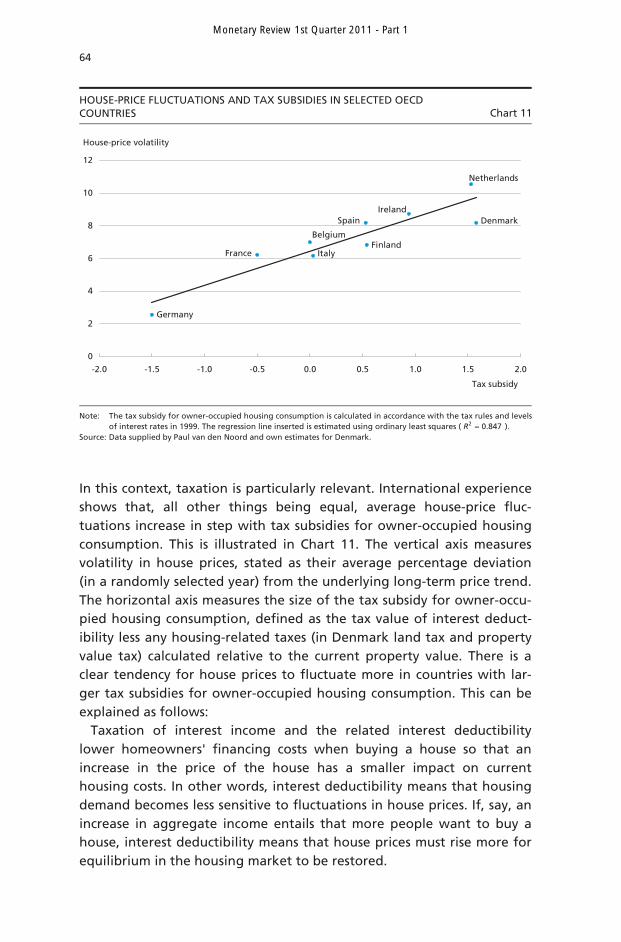
In this context, taxation is particularly relevant. International experience shows that, all other things being equal, average house-price fluc-tuations increase in step with tax subsidies for owner-occupied housing consumption. This is illustrated in Chart 11. The vertical axis measures volatility in house prices, stated as their average percentage deviation (in a randomly selected year) from the underlying long-term price trend. The horizontal axis measures the size of the tax subsidy for owner-occu-pied housing consumption, defined as the tax value of interest deduct-ibility less any housing-related taxes (in Denmark land tax and property value tax) calculated relative to the current property value. There is a clear tendency for house prices to fluctuate more in countries with lar-ger tax subsidies for owner-occupied housing consumption. This can be explained as follows:
Taxation of interest income and the related interest deductibility lower homeowners' financing costs when buying a house so that an increase in the price of the house has a smaller impact on current housing costs. In other words, interest deductibility means that housing demand becomes less sensitive to fluctuations in house prices. If, say, an increase in aggregate income entails that more people want to buy a house, interest deductibility means that house prices must rise more for equilibrium in the housing market to be restored.
HOUSE-PRICE FLUCTUATIONS AND TAX SUBSIDIES IN SELECTED OECD COUNTRIES Chart 11
Finland
Germany
France Italy
DenmarkSpain
Netherlands
0
2
4
6
8
10
12
-2.0 -1.5 -1.0 -0.5 0.0 0.5 1.0 1.5 2.0
Tax subsidy
House-price volatility
Ireland
Belgium
Note: Source:
The tax subsidy for owner-occupied housing consumption is calculated in accordance with the tax rules and levelsof interest rates in 1999. The regression line inserted is estimated using ordinary least squares ( 847.02 =R ). Data supplied by Paul van den Noord and own estimates for Denmark.
Monetary Review 1st Quarter 2011 - Part 1
65
Whereas interest deductibility increases the volatility of house prices, all other things being equal, property taxes on houses have the opposite effect, to the extent that they are levied on the basis of current property values and hence indexed to match developments in house prices. If higher house prices lead to higher housing taxes, the price rise will have a more pronounced impact on housing costs and thus make the housing demand more sensitive to changes in prices. Housing taxes that track property values therefore reduce fluctuations in house prices resulting from demand shocks.
It follows from this analysis that the freeze on the nominal property value tax and the resultant decoupling of taxes from current property prices have removed an important automatic stabiliser in the Danish housing market. When property value tax is no longer permitted to mir-ror the ups and downs of house prices, it cannot contribute to reducing fluctuations. Based on the empirical relationship illustrated in Chart 11, we estimate that after the freeze on property value tax house prices will, on average, deviate by a good 7.5 percentage points from their long-term equilibrium level. In the absence of a freeze, prices would have deviated from their equilibrium level by only 6 percentage points on average. So the volatility of house prices increases by around one fourth relative to a situation where the freeze had not been introduced. The analysis behind Chart 6 also supports the conclusion that the nom-inal freeze applied to property value tax has increased the volatility of house prices.
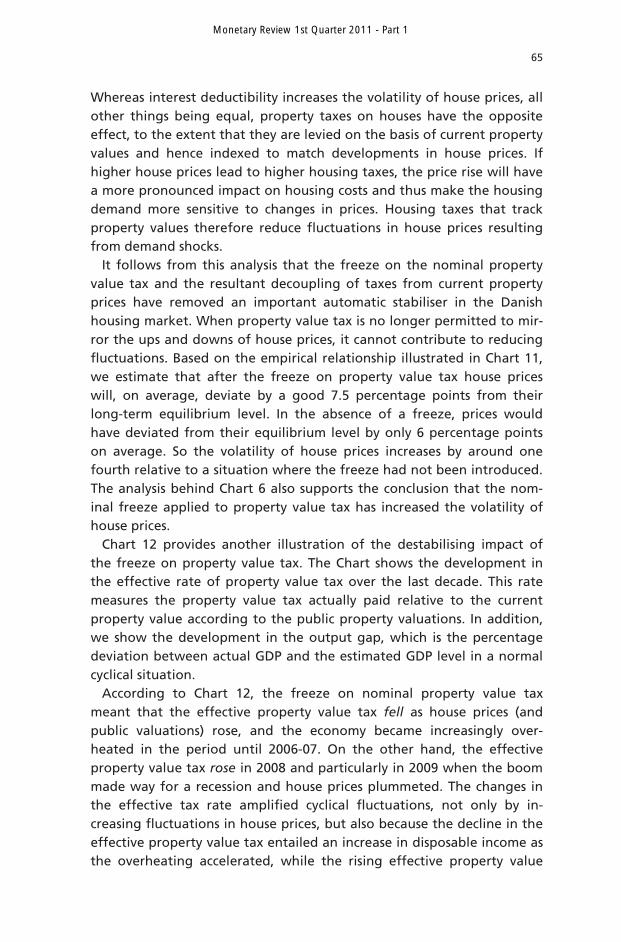
Chart 12 provides another illustration of the destabilising impact of the freeze on property value tax. The Chart shows the development in the effective rate of property value tax over the last decade. This rate measures the property value tax actually paid relative to the current property value according to the public property valuations. In addition, we show the development in the output gap, which is the percentage deviation between actual GDP and the estimated GDP level in a normal cyclical situation.
According to Chart 12, the freeze on nominal property value tax meant that the effective property value tax fell as house prices (and public valuations) rose, and the economy became increasingly over-heated in the period until 2006-07. On the other hand, the effective property value tax rose in 2008 and particularly in 2009 when the boom made way for a recession and house prices plummeted. The changes in the effective tax rate amplified cyclical fluctuations, not only by in-creasing fluctuations in house prices, but also because the decline in the effective property value tax entailed an increase in disposable income as the overheating accelerated, while the rising effective property value
Monetary Review 1st Quarter 2011 - Part 1
66
tax eroded disposable income when the economy went into reverse. Hence, our calculations show that the freeze on property value tax prevented an automatic tax increase, the shortfall growing during the upswing to a level of kr. 9 billion by 2007, while the households were deprived of automatic tax relief of kr. 4 billion from 2007 to 2009-10, compared with a situation in which the freeze had not been introduced. Like the less pronounced fluctuations in house prices, these automatic adjustments of disposable income would have contributed to stabilising the economy.
Overall, our analyses provide strong arguments for lifting the freeze and restoring the link between property value tax and current property valuations. This can be done without increasing the aggregate level of taxation in the short term if the property value tax rate is lowered at the same time. Recoupling property value tax and house prices will con-tribute to stabilising the housing market and the economy, while also preventing further weakening of public finances.
Deferred-amortisation loans and instability in the housing market As previously stated, our empirical analysis indicates that mortgage repayments are to some extent seen as a cost by home buyers, in line with interest and taxes. This means that the introduction of deferred-amortisation mortgage loans has amplified fluctuations in house prices.
EFFECTIVE PROPERTY VALUE TAX RATE AND OUTPUT GAP Chart 12
0.0
0.2
0.4
0.6
0.8
2001 2002 2003 2004 2005 2006 2007 2008 2009 2010
Per cent
-5.0
-2.5
0.0
2.5
5.0
Per cent of GDP
Effective property value tax rate Output gap (right-hand axis)
Note: Source:
The effective property value tax rate is calculated as revenue from property value tax as a ratio of the publicvaluation of the housing supply taxed in accordance with the "Law Model" of the Ministry of Finance. Theoutput gap is estimated by the Ministry of Finance. Ministry of Economic and Business Affairs and Ministry of Finance.
Monetary Review 1st Quarter 2011 - Part 1
67
If prices go up, loans with amortisation entail a larger increase in overall payments to service the loan compared with deferred-amortisation loans. The higher costs dampen the demand for housing and curb the price rise. Conversely, if house prices fall, loans with amortisation entail a larger decline in the payments compared with deferred-amortisation loans. This stimulates the demand for housing and helps to buoy up the market. In other words, loans with amortisation help to stabilise house prices. This desirable effect is lost as deferred-amortisation loans gain ground. Our quantitative analysis shows that deferred-amortisation loans have contributed even more to volatility in house prices than the freeze on property value tax.
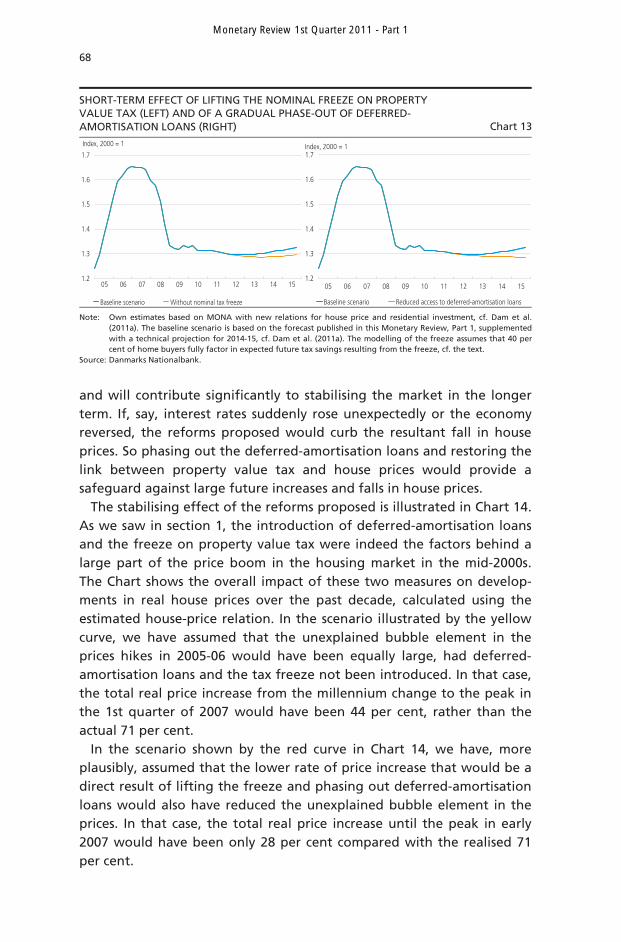
This calls for all future mortgage loans for owner-occupied housing being with amortisation. Like a repeal of the nominal tax freeze, such a reform would contribute to dampening fluctuations in the housing mar-ket. By ensuring accumulation of home equity, a phase-out of deferred-amortisation mortgage loans would also reduce the vulnerability of homeowners, and thus of the economy in general, to unexpected nega-tive shocks to the housing market. To avoid a negative impact on the housing market in the short term, access to deferred-amortisation loans should be phased out gently, e.g. by reducing the upper limit for new deferred-amortisation loans for owner-occupied housing by 10 percent-age points of the property value a year. How will the housing market be affected by the measures proposed? In Chart 13 we use the MONA model extended by the new relations for the housing market to estimate how the measures discussed above can be expected to affect the housing market in the short and medium term. We assess the effects by comparing with the same baseline scenario as shown in Chart 9 (left).
Chart 13 (left) shows the simulated effect on real house prices of restoring the link between property value tax and current property valu-ations. It is assumed that the property value tax rate is reduced at the same time so that total tax revenue remains unchanged in the short term, but will no longer be eroded by inflation. It is seen that this re-form would have only a very limited negative impact on house prices over the next few years.
Chart 13 (right) shows the model simulation of the effect of gradually phasing out deferred-amortisation loans for new home purchases by 10 percentage points of the property value a year. Again, the impact on house prices is seen to be relatively small.
In other words, the measures proposed can be introduced without serious negative consequences for the housing market in the short term
Monetary Review 1st Quarter 2011 - Part 1
68
and will contribute significantly to stabilising the market in the longer term. If, say, interest rates suddenly rose unexpectedly or the economy reversed, the reforms proposed would curb the resultant fall in house prices. So phasing out the deferred-amortisation loans and restoring the link between property value tax and house prices would provide a safeguard against large future increases and falls in house prices.
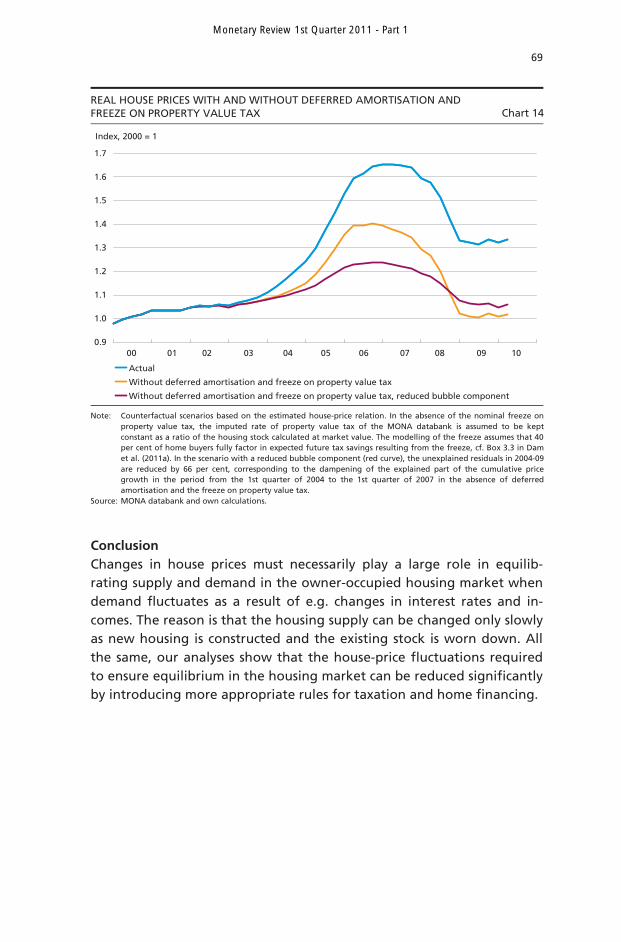
The stabilising effect of the reforms proposed is illustrated in Chart 14. As we saw in section 1, the introduction of deferred-amortisation loans and the freeze on property value tax were indeed the factors behind a large part of the price boom in the housing market in the mid-2000s. The Chart shows the overall impact of these two measures on develop-ments in real house prices over the past decade, calculated using the estimated house-price relation. In the scenario illustrated by the yellow curve, we have assumed that the unexplained bubble element in the prices hikes in 2005-06 would have been equally large, had deferred-amortisation loans and the tax freeze not been introduced. In that case, the total real price increase from the millennium change to the peak in the 1st quarter of 2007 would have been 44 per cent, rather than the actual 71 per cent.
In the scenario shown by the red curve in Chart 14, we have, more plausibly, assumed that the lower rate of price increase that would be a direct result of lifting the freeze and phasing out deferred-amortisation loans would also have reduced the unexplained bubble element in the prices. In that case, the total real price increase until the peak in early 2007 would have been only 28 per cent compared with the realised 71 per cent.
SHORT-TERM EFFECT OF LIFTING THE NOMINAL FREEZE ON PROPERTY VALUE TAX (LEFT) AND OF A GRADUAL PHASE-OUT OF DEFERRED-AMORTISATION LOANS (RIGHT) Chart 13
1.2
1.3
1.4
1.5
1.6
1.7
Baseline scenario Without nominal tax freeze
05 06 07 08 09 10 11 12 13 14 15
Index, 2000 = 1
1.2
1.3
1.4
1.5
1.6
1.7Index, 2000 = 1
Baseline scenario Reduced access to deferred-amortisation loans
05 06 07 08 09 10 11 12 13 14 15
Note: Source:
Own estimates based on MONA with new relations for house price and residential investment, cf. Dam et al. (2011a). The baseline scenario is based on the forecast published in this Monetary Review, Part 1, supplemented with a technical projection for 2014-15, cf. Dam et al. (2011a). The modelling of the freeze assumes that 40 per cent of home buyers fully factor in expected future tax savings resulting from the freeze, cf. the text. Danmarks Nationalbank.
Monetary Review 1st Quarter 2011 - Part 1
69
Conclusion Changes in house prices must necessarily play a large role in equilib-rating supply and demand in the owner-occupied housing market when demand fluctuates as a result of e.g. changes in interest rates and in-comes. The reason is that the housing supply can be changed only slowly as new housing is constructed and the existing stock is worn down. All the same, our analyses show that the house-price fluctuations required to ensure equilibrium in the housing market can be reduced significantly by introducing more appropriate rules for taxation and home financing.
REAL HOUSE PRICES WITH AND WITHOUT DEFERRED AMORTISATION AND FREEZE ON PROPERTY VALUE TAX Chart 14
0.9
1.0
1.1
1.2
1.3
1.4
1.5
1.6
1.7
Index, 2000 = 1
Actual
Without deferred amortisation and freeze on property value tax
Without deferred amortisation and freeze on property value tax, reduced bubble component
00 01 02 03 04 05 06 07 08 09 10
Note: Source:
Counterfactual scenarios based on the estimated house-price relation. In the absence of the nominal freeze onproperty value tax, the imputed rate of property value tax of the MONA databank is assumed to be keptconstant as a ratio of the housing stock calculated at market value. The modelling of the freeze assumes that 40per cent of home buyers fully factor in expected future tax savings resulting from the freeze, cf. Box 3.3 in Damet al. (2011a). In the scenario with a reduced bubble component (red curve), the unexplained residuals in 2004-09 are reduced by 66 per cent, corresponding to the dampening of the explained part of the cumulative pricegrowth in the period from the 1st quarter of 2004 to the 1st quarter of 2007 in the absence of deferredamortisation and the freeze on property value tax. MONA databank and own calculations.
Monetary Review 1st Quarter 2011 - Part 1
70
LITERATURE
Arce, Óscar and David López-Salido (2011), Housing bubbles. American Economic Journal: Macroeconomics, Vol. 3, No. 1. Case, Karl E. and Robert J. Shiller (2003), Is there a bubble in the housing market? Brookings Papers on Economic Activity, No. 2. Dam, Niels Arne, Tina Saaby Hvolbøl, Erik Haller Pedersen, Peter Birch Sørensen and Susanne Hougaard Thamsborg (2011a), Developments in the market for owner-occupied housing in recent years – can house prices be explained? Danmarks Nationalbank, Monetary Review, 1st Quarter, Part 2. Dam, Niels Arne, Tina Saaby Hvolbøl and Peter Birch Sørensen (2011b), Can house-price fluctuations be dampened? Danmarks Nationalbank, Monetary Review, 1st Quarter, Part 2.
Monetary Review 1st Quarter 2011 - Part 1