The Hospital Readmission Reduction Policy and Population ...The 30-Day Risk Standardized Readmission...
26
The Hospital Readmission Reduction Policy and Population Health in Heart Failure Gregg C. Fonarow, MD, FACC, FAHA, FHFSA The Eliot Corday Professor of Cardiovascular Medicine and Science UCLA Division of Cardiology Director, Ahmanson-UCLA Cardiomyopathy Center Co-Chief, UCLA Division of Cardiology Los Angeles, California Controversies and Advances in the Treatment of Cardiovascular Disease 2019 Keynote Lecture
Transcript of The Hospital Readmission Reduction Policy and Population ...The 30-Day Risk Standardized Readmission...
The Hospital Readmission Reduction Policy and Population Health in Heart Failure
Gregg C. Fonarow, MD, FACC, FAHA, FHFSA The Eliot Corday Professor of Cardiovascular Medicine and Science
UCLA Division of Cardiology Director, Ahmanson-UCLA Cardiomyopathy Center
Co-Chief, UCLA Division of Cardiology Los Angeles, California
Controversies and Advances in the Treatment of Cardiovascular Disease 2019
Keynote Lecture

Burden of Hospitalizations for Heart Failure
• Heart Failure (HF) is the leading medical cause of hospitalization among adults aged 65 years and older in the US and globally
• In US, 900,000 hospitalizations with HF as primary discharge diagnosis and 2-3 million hospitalizations with HF as secondary diagnosis
• HF hospitalization represents a period of very high risk for patients, during which their likelihood of death and rehospitalization is significantly greater than for a comparable period of chronic but stable HF
• Nearly 1 in 3 patients do not survive a full year after a hospitalization for HF
• Treatment of HF patients is highly variable and outcomes need to improve
Fonarow GC et al. JAMA 2005; 293:572-80. Gheorghiade et al. Circulation. 2005. 112:3958-3968.

The 30 Day Readmission Metric and Hospital Readmission Reduction Program (HRRP) in Hospitalized HF Patients
Healthcare Policy Approaches to Reduce Readmission Transparency: Public reporting of 30-Day RSRR metric
Financial incentives: Hospital Readmission Reduction Program (HRRP)
Public reporting on 30-Day Risk Standardized Readmission Rates (RSRR) 30 Day HF RSRR measure for HF released 2007/2008, CMS began public reporting in June 2009 (discharges 2007-2009) HRRP: Statutorily mandated by the ACA of 2010 Initial Target HF, Pneumonia, AMI (top 3 conditions with readmissions) 2 Phases: Penalty-free implementation phase (April 2010 to Sep 2012)
Penalty phase (Oct 2012 onwards) Up to 3% of a hospital’s total Medicare revenue is at stake if readmission rates for target conditions are higher than national average
In FY 2020, 83% of US acute care hospitals penalized by CMS under the HRRP with $563 million in penalty based revenue for CMS
Overall budgeted for $7.7 billion in revenue for CMS
In a 2007 report, MedPAC recommended CMS target readmissions

What CMS, Measure Developers, and Policymakers Have Told Clinicians
• The majority of 30-day readmissions could be easily prevented
• Effective strategies to prevent 30-day readmissions were readily available but were underutilized due to lack of financial incentives
• The 30-Day Risk Standardized Readmission Metric is an accurate, fair, reliable, and actionable measure suitable for accountability/penalties
• Any concerns about the 30 Day RSRR metric and HRRP penalties were unfounded and raised by those vested in maintaining the status quo
• The 30-Day RSRR metric and HRRP have been a tremendous success with readmissions falling substantially for targeted conditions the first time in decades. Billions of dollars saved for Medicare! (via penalties)
• There has been no credible evidence for harm

CMS 30 Day Risk Standardized Readmission Rate Measure
Age, years over 65
Male
Cardiovascular History of Percutaneous Transluminal Coronary Angioplasty (ICD9 V45.82)
History of Coronary Artery Bypass Graft Surgery (ICD9 V45.81)
History of heart failure (HCC 80)
History of Myocardial Infarction (HCC 81)
Unstable angina (HCC 82)
Chronic atherosclerosis (HCC 83-84)
Cardiopulmonary-respiratory failure and shock (HCC 79)
Valvular heart disease (HCC 86)
Comorbidity Hypertension (HCC 89-91)
Stroke (HCC 95-96)
Renal failure (HCC 131)
Chronic Obstructive Pulmonary Disease (HCC 108)
Pneumonia (HCC 111-113)
Diabetes (HCC 15-20, 120)
Protein-calorie malnutrition (HCC 21)
Dementia (HCC 49-50)
Hemiplegia, paraplegia, paralysis, functional disability (HCC 100-102, 68-69, 177-178)
Peripheral vascular disease (HCC 104-105)
Metastatic cancer (HCC 7-8)
Trauma in last year (HCC 154-156, 158-162)
Major psychiatric disorders (HCC 54-56)
Chronic liver disease (HCC 25-27)
Race/ethnicity Socioeconomic status SBP on admission HR on admission Body mass index BUN on admission Creatinine on admission Sodium on admission Hemoglobin on admission BNP or NT-BNP on admission LVEF LVEDD Functional status (NHYA Class) Mechanical ventilation (initial) Inotropic agent treatment
Krumholz HM, et al. Circulation 2006;113:1693-701.
C-Statistic 0.60 Indicating Poor Discrimination
Patient characteristics not included in Medicare’s risk-adjustment methods explained much of the difference in readmission risk between patients admitted to hospitals with higher vs. lower readmission rates Hospitals with high readmission rates are being penalized to a large extent based on the patients they serve rather than the quality of care provided
Administrative Codes Only Not Adjusted for in Model Hospital Profiling Not Reflective of Care Quality

CMS 30 Day Risk Standardized Readmission Rate Measure
Prediction models for hospitalization that do not account for the competing risk of death are predisposed to biased estimates
The readmission penalty is being unfairly and inappropriately applied to hospitals which provide higher quality care as a consequence of the lower mortality rates achieved by these hospitals
Hospitals with Lower 30 Day RSRR
Worse Process of Care Measures
Worse 30-Day Mortality
Worse 90-Day Mortality
Worse 1-Year Mortality
Worse 3-Year Mortality
Worse 5-Year Mortality
N Engl J. Med, July 15, 2010; 363(3): 297 - 298.
Metric Fails to Account for Competing Risk of Mortality
Lower 30 Day Readmission Higher 30 Day Mortality
Hospitals providing superior care quality and better survival are far more likely to perform poorly in the 30 Day RSRR Measure and be Penalized by Medicare under HRRP
Pandey A, et al. JACC HF 2016 Dec;4(12):935-946

CMS: Reporting and Financial Penalties
Maximum Penalty Amount HRRP: 30-Day Risk
Standardized Readmission HVBP: 30-Day Risk
Standardized Mortality
3.0% 0.2%
Is it patient-centered to prioritize reducing readmissions up to 10-15 fold greater than avoiding preventable deaths?
2007-9 Public Reporting of 30-
day Readmissions
2010-2 Hospital Readmission Reduction Program
2014 Value Based Purchasing
Program
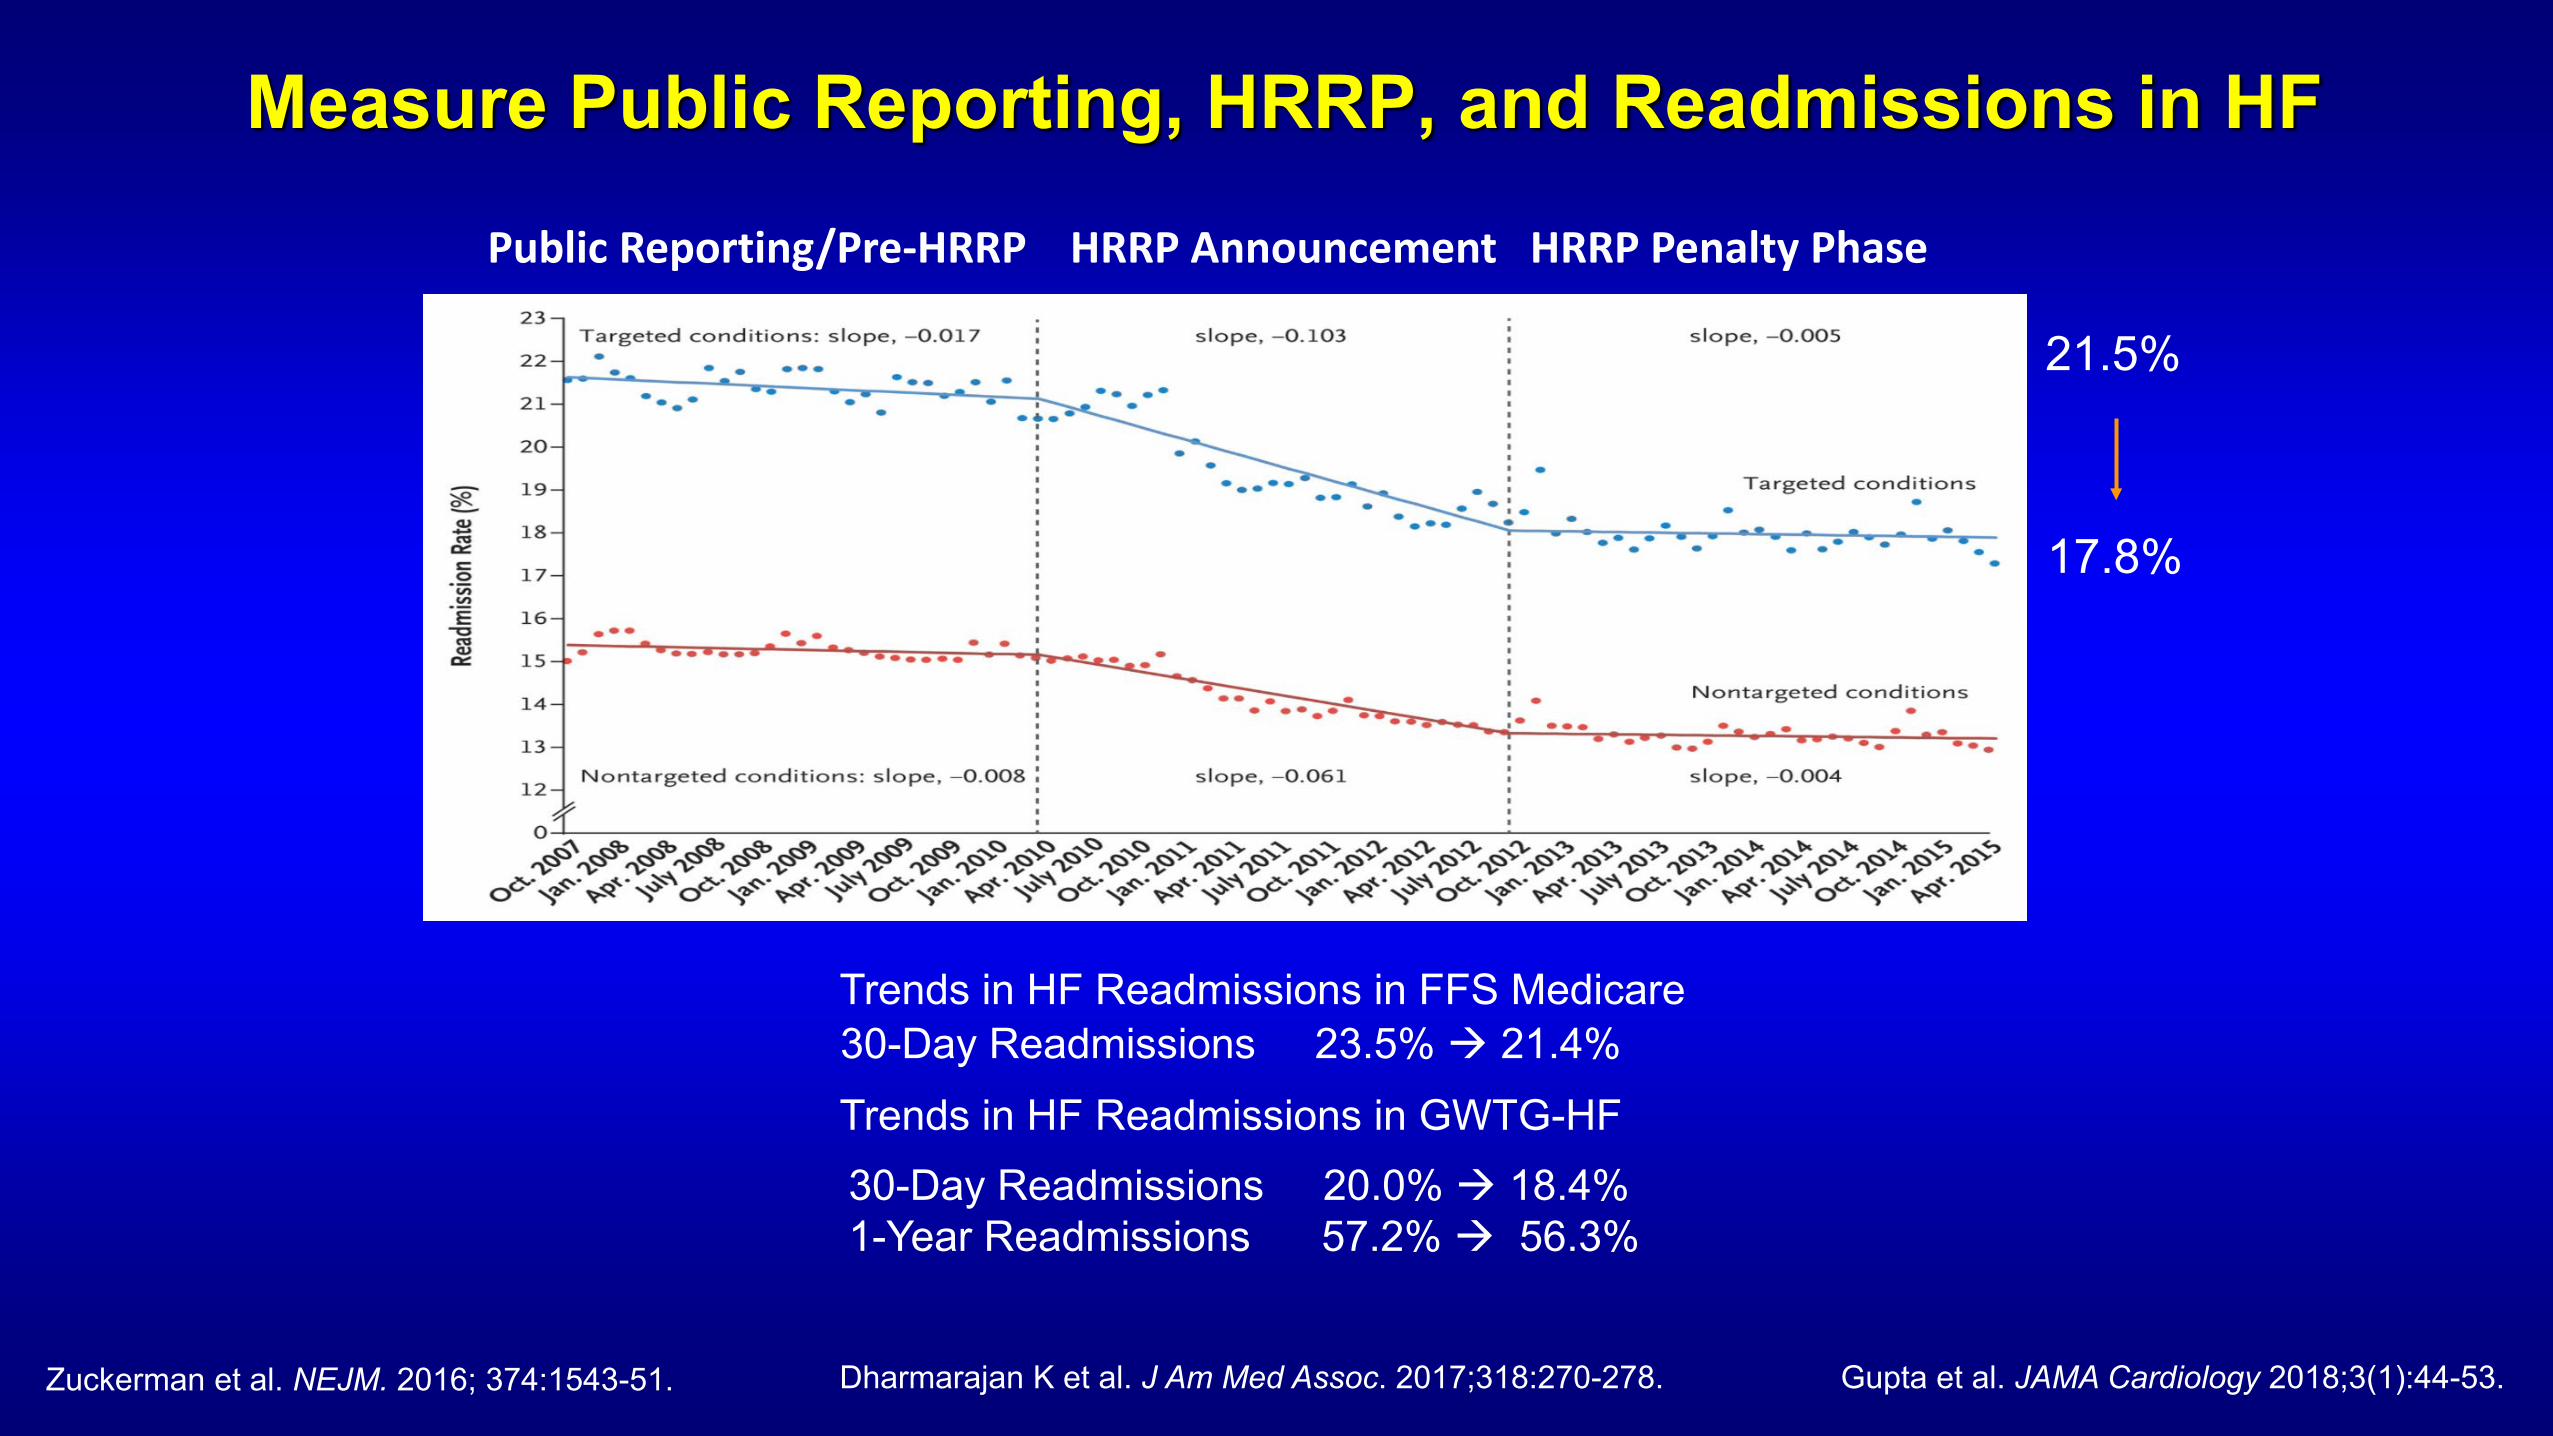
Measure Public Reporting, HRRP, and Readmissions in HF
Zuckerman et al. NEJM. 2016; 374:1543-51.
Public Reporting/Pre-HRRP HRRP Announcement HRRP Penalty Phase
21.5%
17.8%
30-Day Readmissions 20.0% 18.4% 1-Year Readmissions 57.2% 56.3%
Trends in HF Readmissions in GWTG-HF
Gupta et al. JAMA Cardiology 2018;3(1):44-53.
Trends in HF Readmissions in FFS Medicare 30-Day Readmissions 23.5% 21.4%
Dharmarajan K et al. J Am Med Assoc. 2017;318:270-278.

How did the 30-Day Metric and HRRP Impact Readmissions?
• Did hospitals respond in a way that they invested in and improved transitional care of HF patients, reducing readmission and potentially mortality?
• Or was there financially incentivized: Upcoding of severity Delaying admissions beyond 30 days, even if clinically needed Blocking patients from admission from ER, even if admission needed Diverting patients to outpatient observation stays, even if unsafe Pressure on physicians to try strategies that place patient at higher risk Shifting funding away from patient safety, disease management Delaying initiation of GDMT out of misconceptions Coercion into hospice Decrease funding to the most vulnerable hospitals and patients
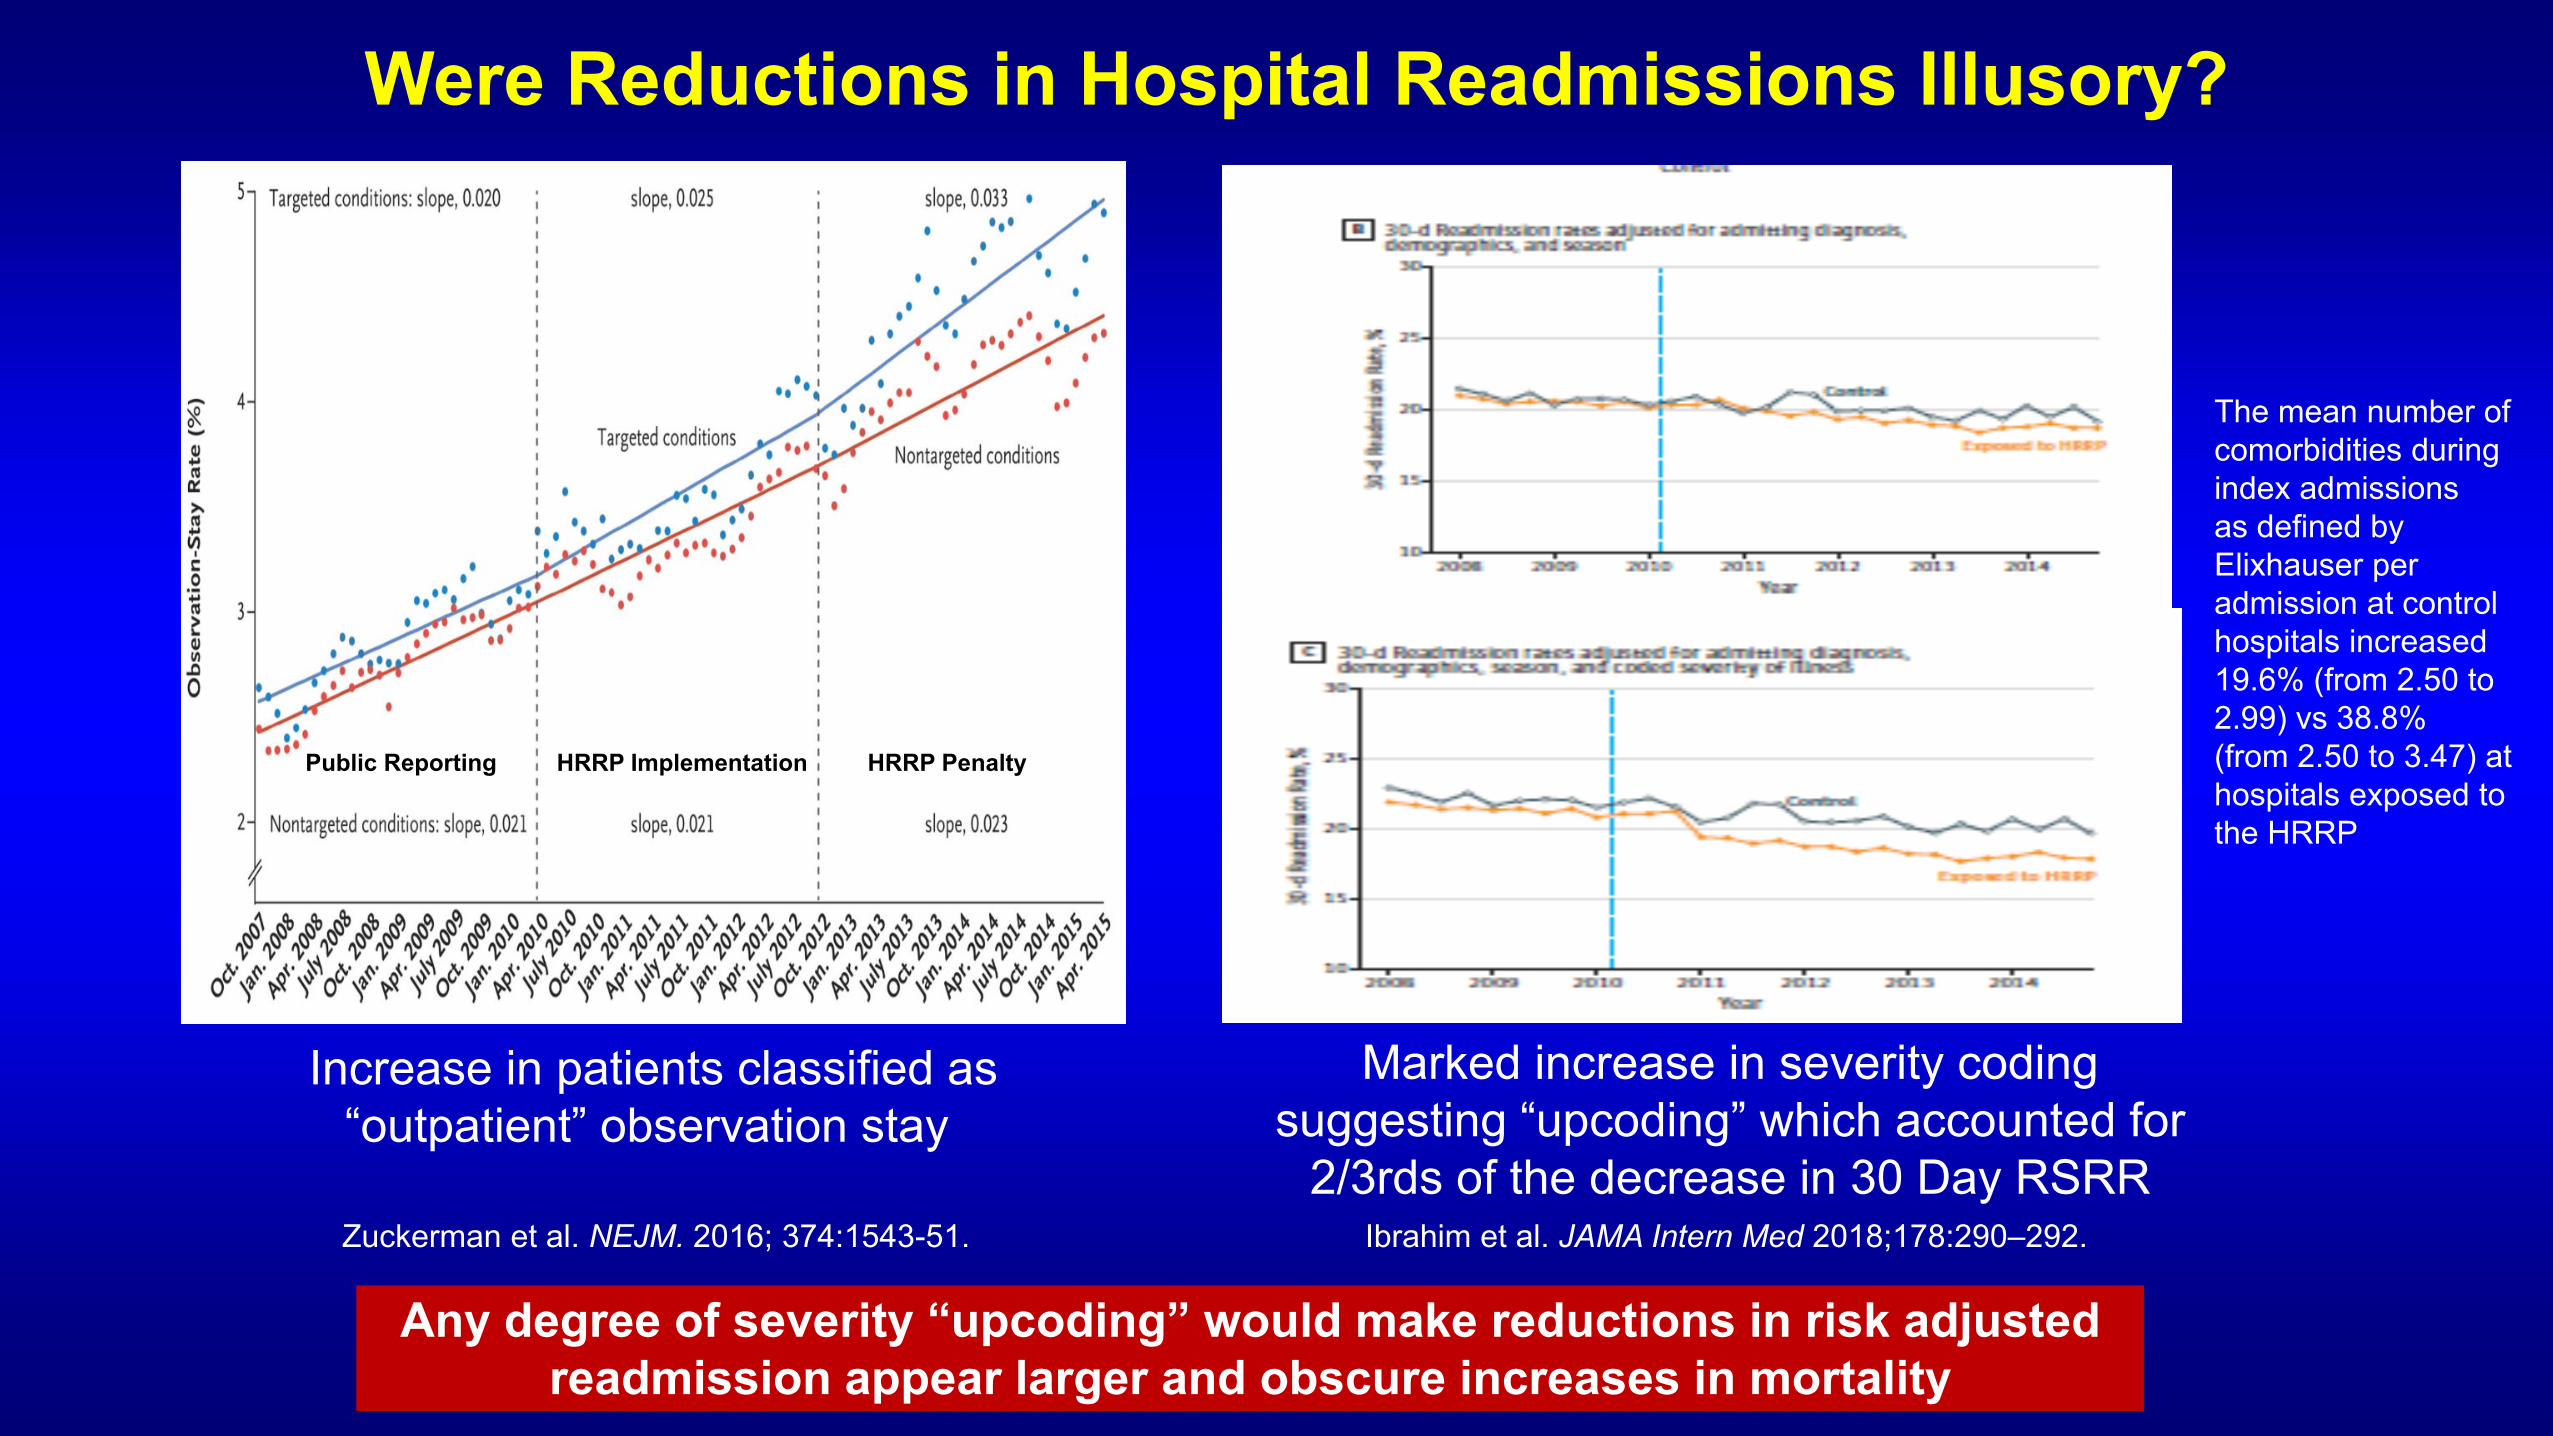
Were Reductions in Hospital Readmissions Illusory?
Increase in patients classified as “outpatient” observation stay
Marked increase in severity coding suggesting “upcoding” which accounted for
2/3rds of the decrease in 30 Day RSRR Zuckerman et al. NEJM. 2016; 374:1543-51. Ibrahim et al. JAMA Intern Med 2018;178:290–292.
Any degree of severity “upcoding” would make reductions in risk adjusted readmission appear larger and obscure increases in mortality
Public Reporting HRRP Implementation HRRP Penalty
The mean number of comorbidities during index admissions as defined by Elixhauser per admission at control hospitals increased 19.6% (from 2.50 to 2.99) vs 38.8% (from 2.50 to 3.47) at hospitals exposed to the HRRP

How Has Public Reporting of Hospital Readmission Rates and HRRP Affected Patient Outcomes?
Patient-Centered Strategies to Reduce Readmissions Increase use of evidence-based, guideline directed therapies Improved transitions of care Provision of early, high quality post discharge follow-up Enhanced post-discharge monitoring Increased access to HF disease management programs
Non-Patient-Centered Strategies to Reduce Readmissions (Gaming) Discourage patients with worsening symptom from being seen in ER Blocking patients in ER within 30-days of d/c from being readmitted Shunting patients to Observation Units (outpatient) Delaying use of evidence-based, guideline directed therapies
Readmits ↓ ER Visits ↓ OBS Visits ↓ Mortality ↓→
Readmits ↓ ER Visits ↑ OBS Visits ↑ Mortality ↑
Readmits within 30d
↓ 3.9%
ER Visits within 30d
↑ 2.0%
OBS Visits within 30d
↑ 1.2%
Net Returns within 30d
↓ 0.7%
Data from Medicare Payment Advisory Committee (MEDPAC) Report to Congress June 2018
Observed 30-Day Risk-Adjusted Readmission Rate
with HRRP R
isk-
Adj
uste
d Ra
te, %
Year
25
20
15
10
5
0 2008 2009 2010 2011 2012 2013 2014 2015
Observed 30-Day Risk-Adjusted Mortality Rate after Discharge
with HRRP
Expected 30-Day Risk-Adjusted Mortality Rate after Discharge
without HRRP
HRRP Implementation HRRP Penalties
Year
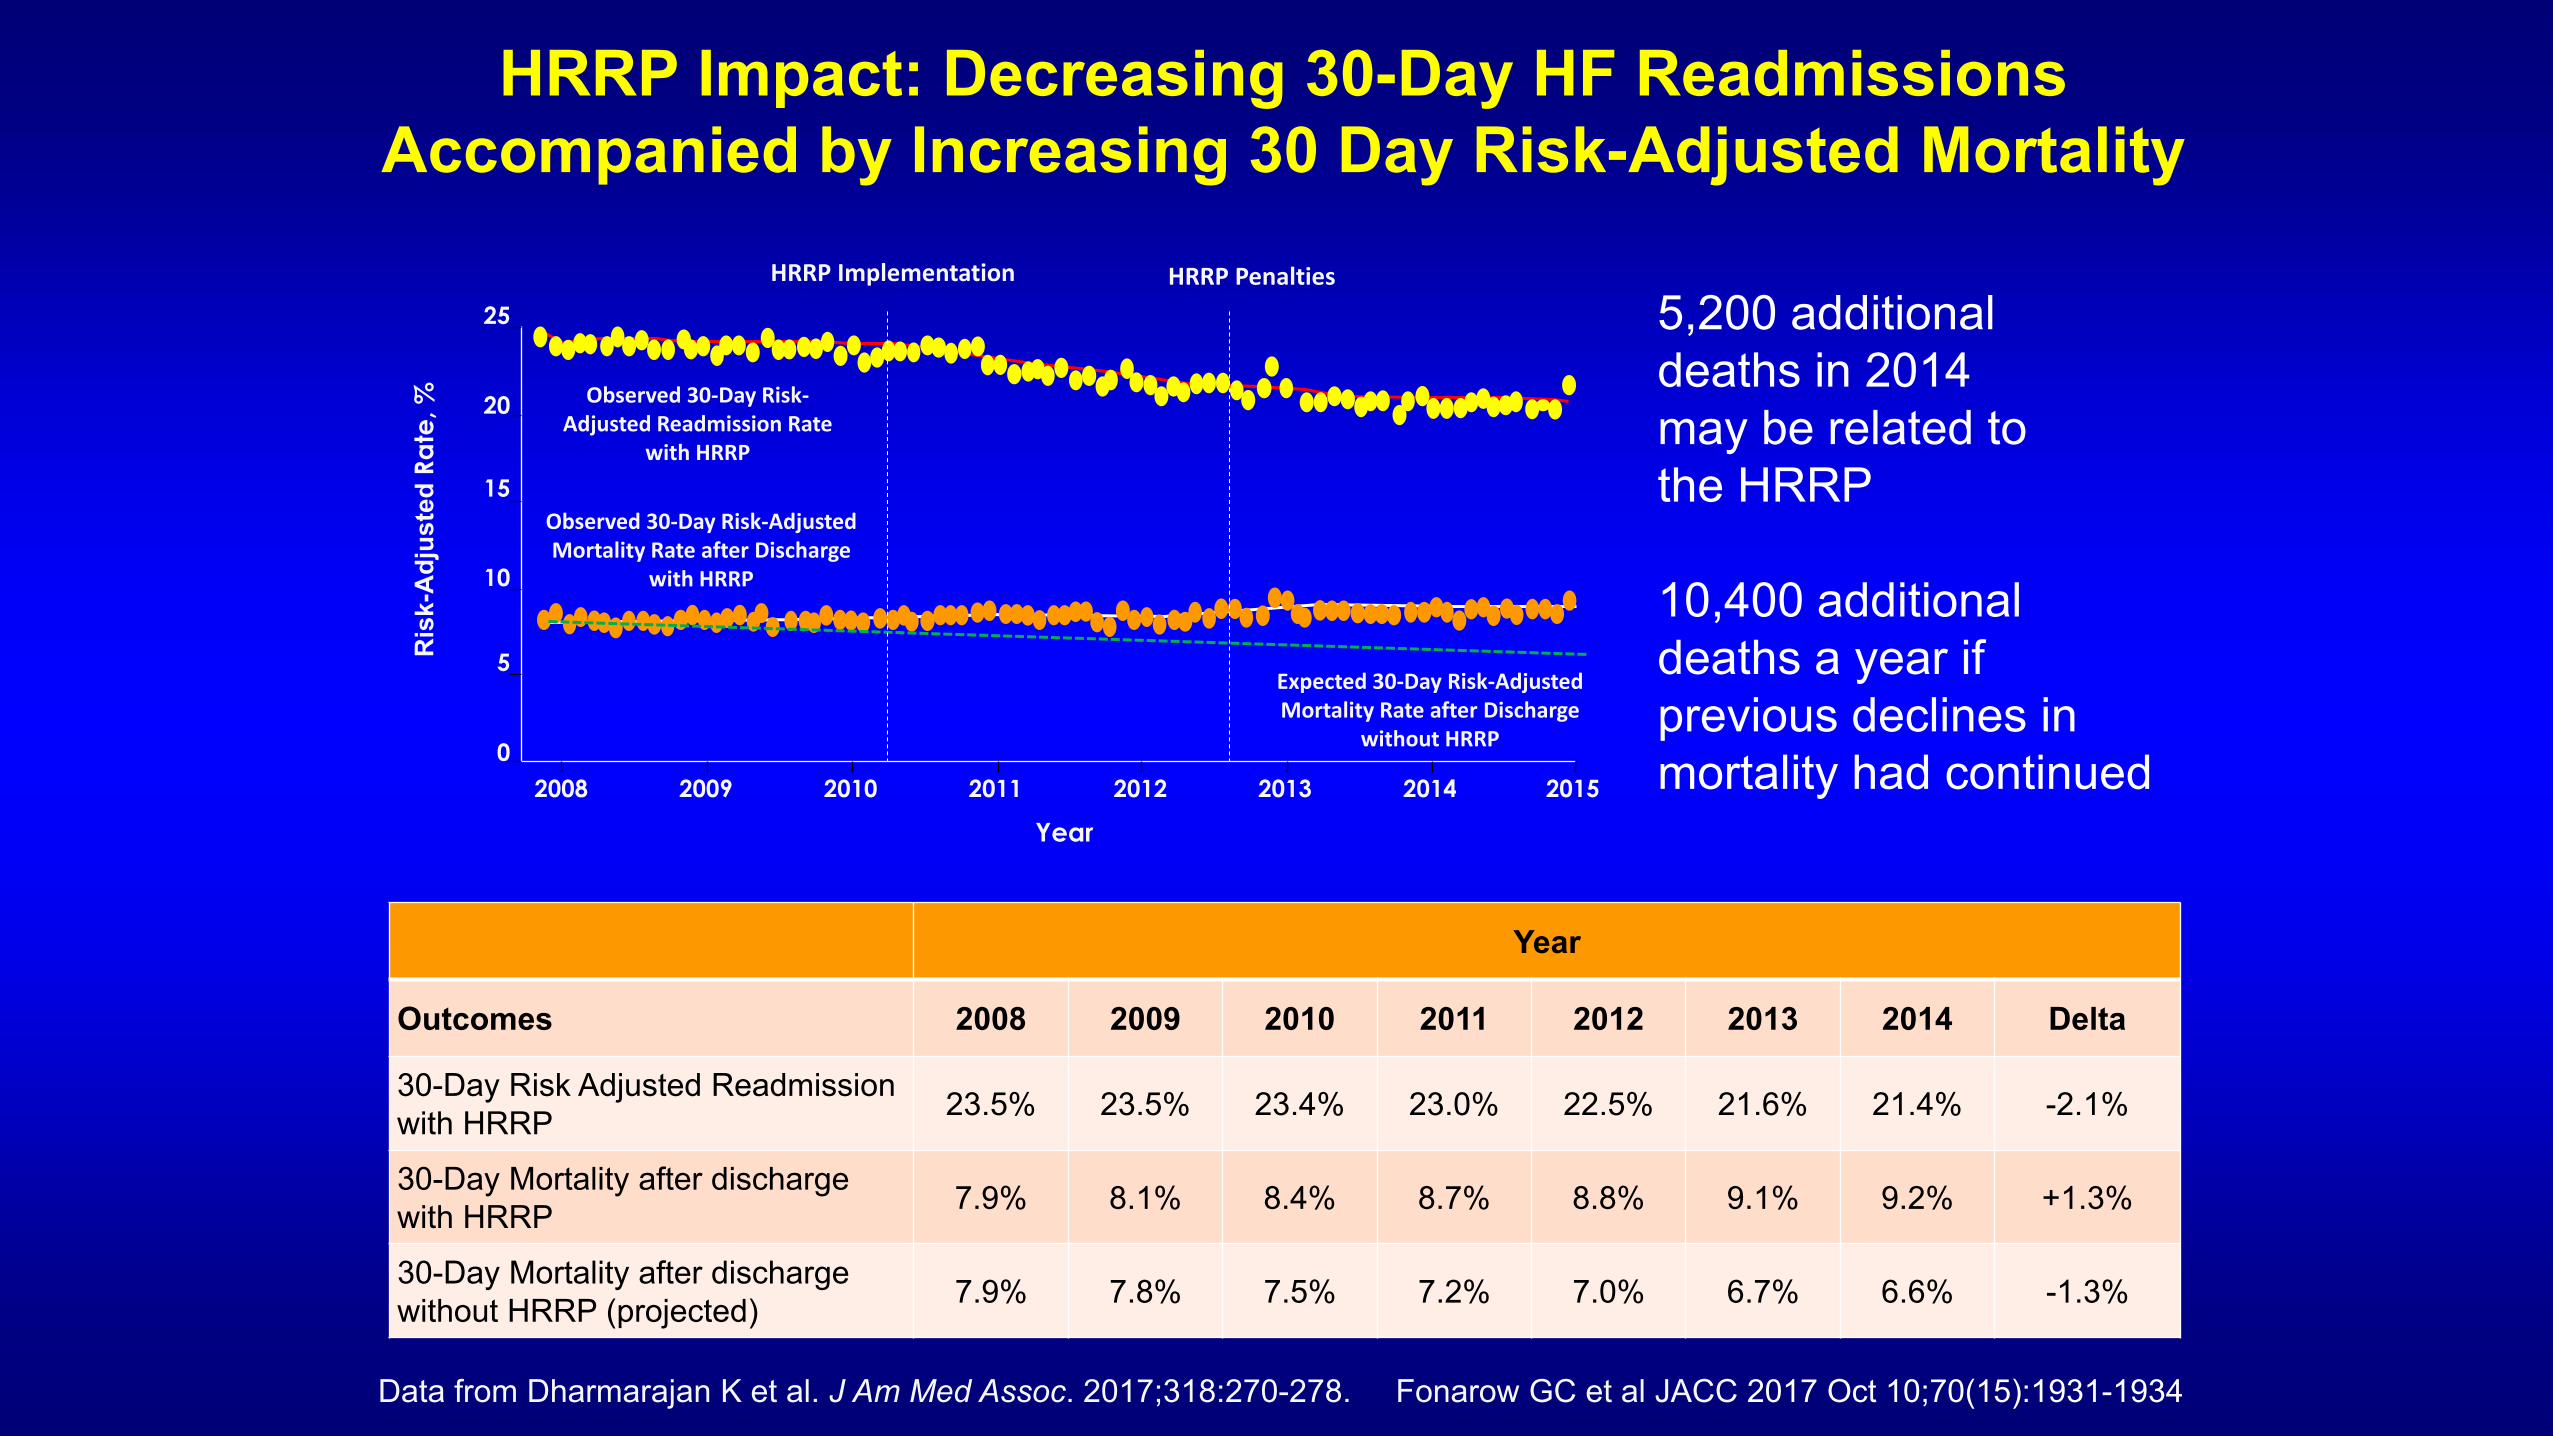
Outcomes 2008 2009 2010 2011 2012 2013 2014 Delta
30-Day Risk Adjusted Readmission with HRRP 23.5% 23.5% 23.4% 23.0% 22.5% 21.6% 21.4% -2.1%
30-Day Mortality after discharge with HRRP 7.9% 8.1% 8.4% 8.7% 8.8% 9.1% 9.2% +1.3%
30-Day Mortality after discharge without HRRP (projected) 7.9% 7.8% 7.5% 7.2% 7.0% 6.7% 6.6% -1.3%
HRRP Impact: Decreasing 30-Day HF Readmissions Accompanied by Increasing 30 Day Risk-Adjusted Mortality
Data from Dharmarajan K et al. J Am Med Assoc. 2017;318:270-278. Fonarow GC et al JACC 2017 Oct 10;70(15):1931-1934
5,200 additional deaths in 2014 may be related to the HRRP 10,400 additional deaths a year if previous declines in mortality had continued
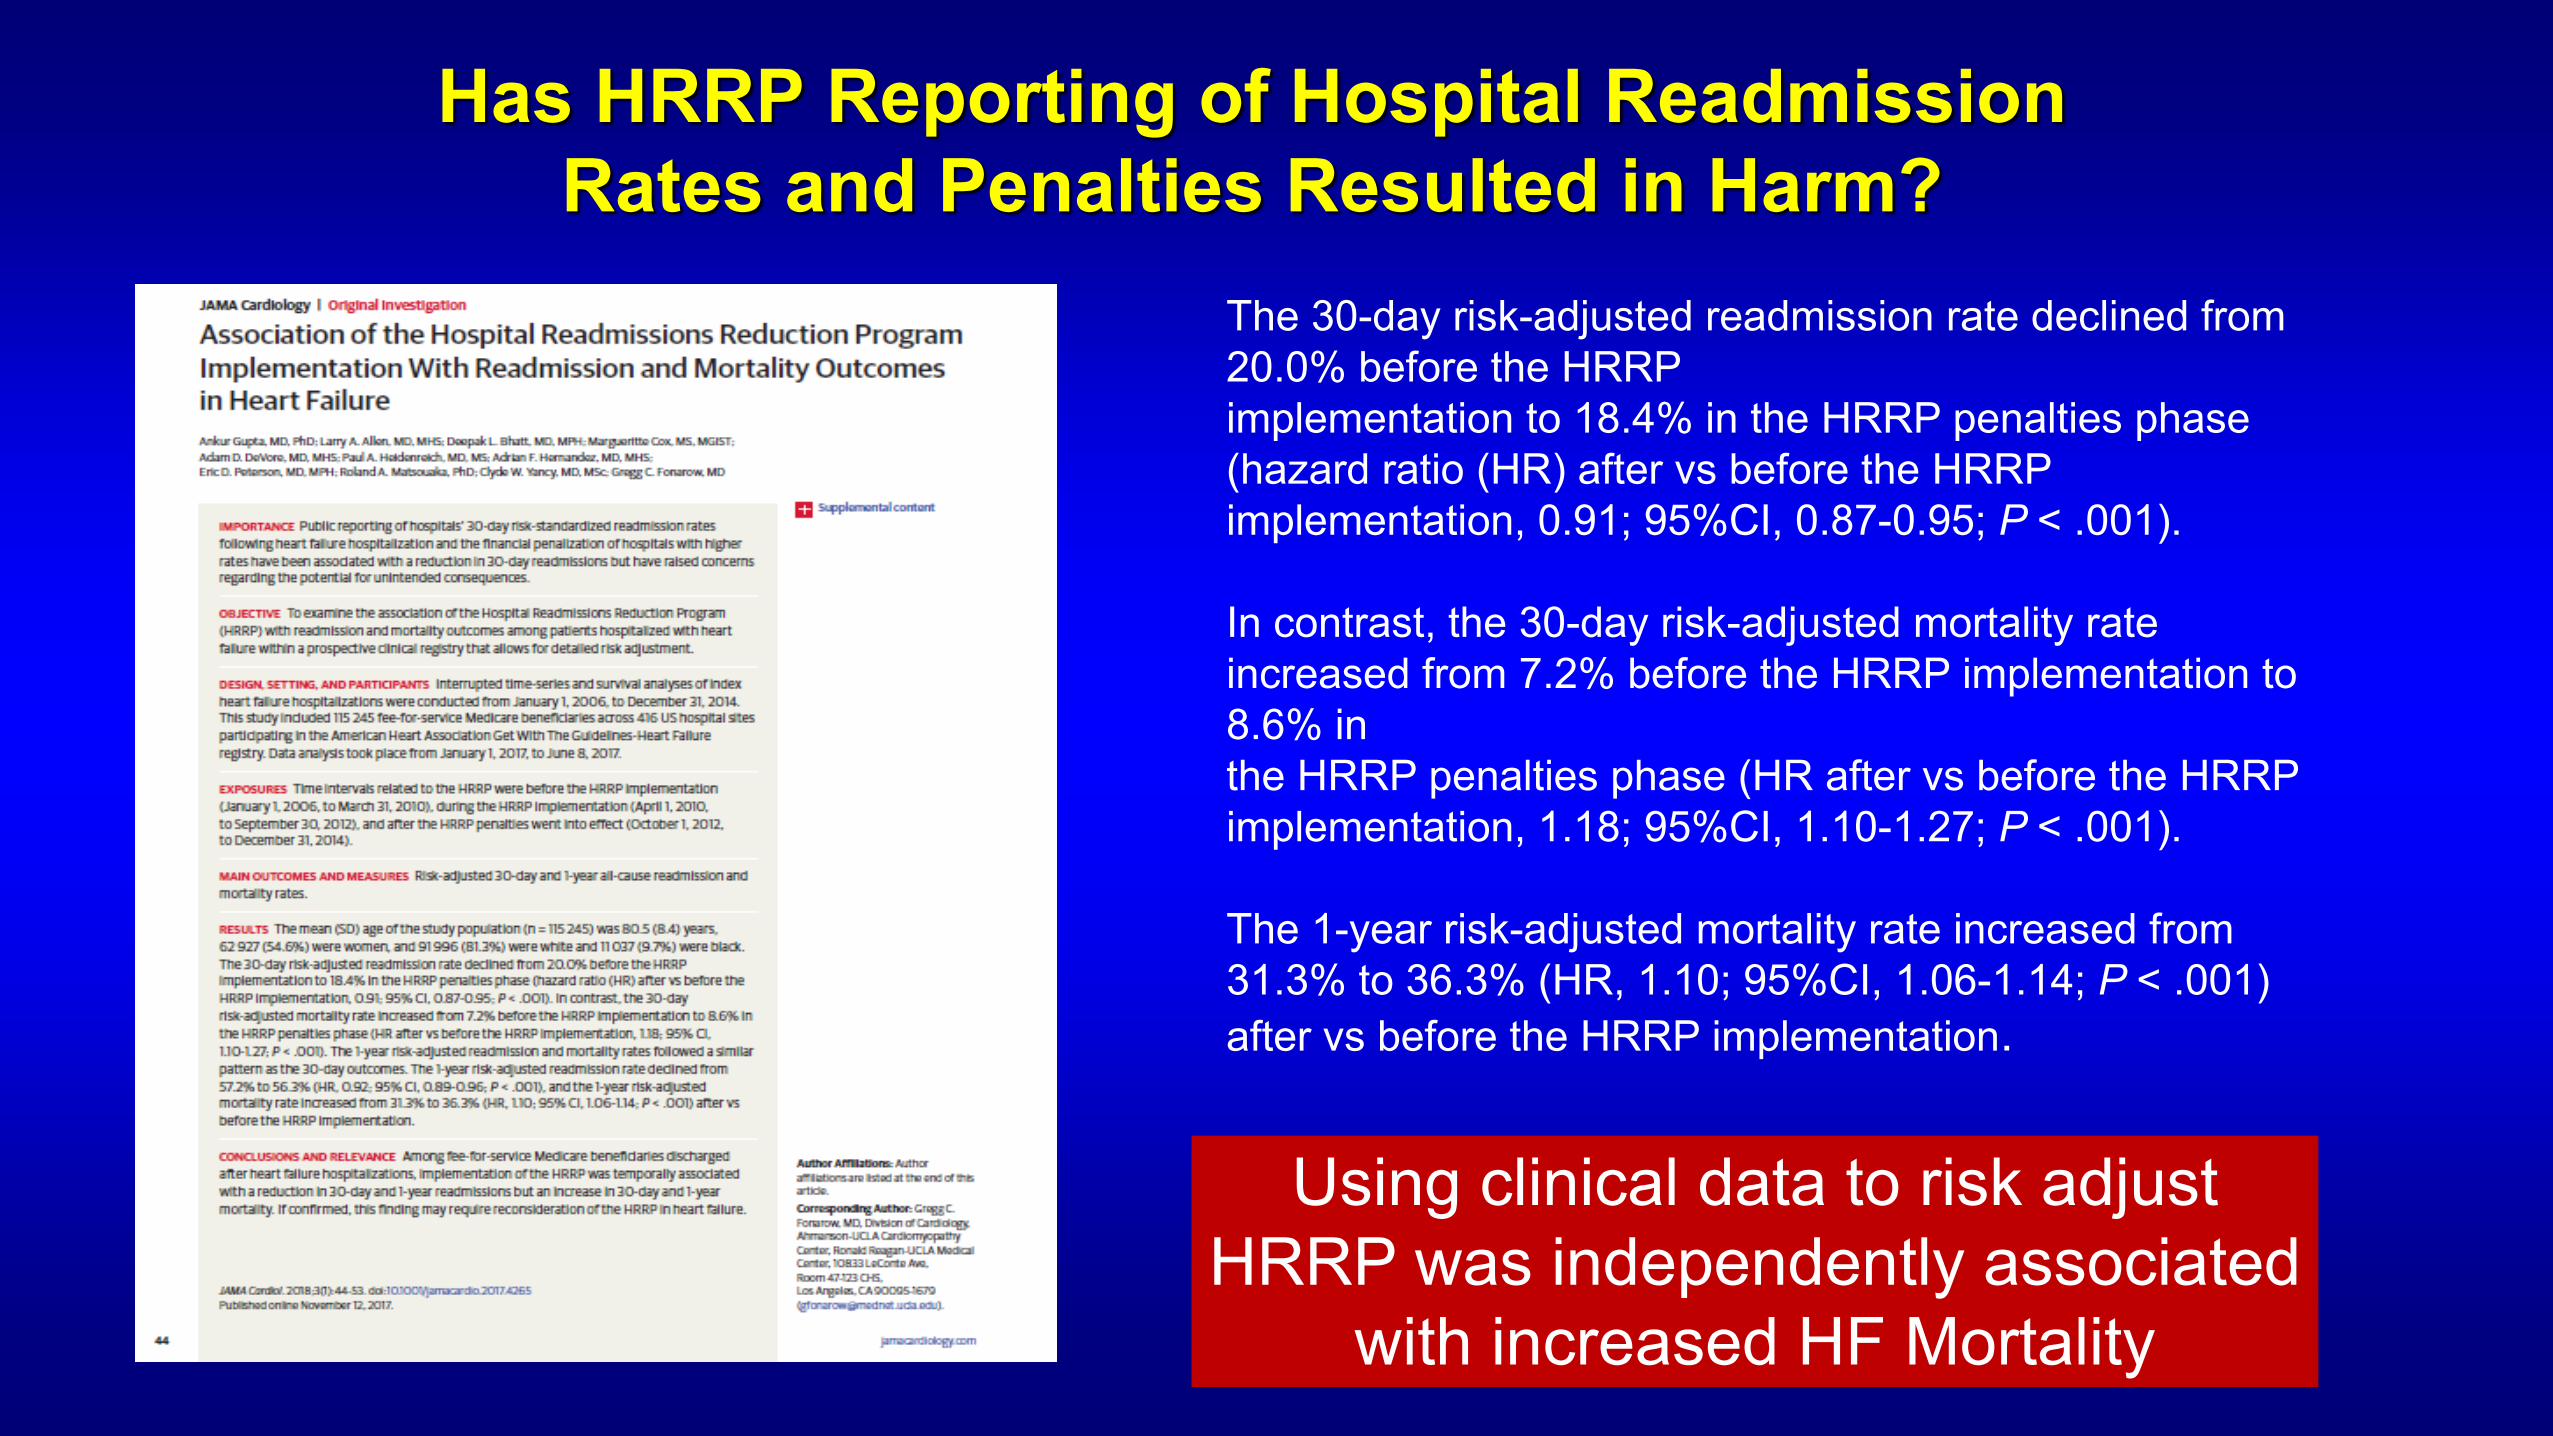
Has HRRP Reporting of Hospital Readmission Rates and Penalties Resulted in Harm?
The 30-day risk-adjusted readmission rate declined from 20.0% before the HRRP implementation to 18.4% in the HRRP penalties phase (hazard ratio (HR) after vs before the HRRP implementation, 0.91; 95%CI, 0.87-0.95; P < .001). In contrast, the 30-day risk-adjusted mortality rate increased from 7.2% before the HRRP implementation to 8.6% in the HRRP penalties phase (HR after vs before the HRRP implementation, 1.18; 95%CI, 1.10-1.27; P < .001). The 1-year risk-adjusted mortality rate increased from 31.3% to 36.3% (HR, 1.10; 95%CI, 1.06-1.14; P < .001) after vs before the HRRP implementation.
Using clinical data to risk adjust HRRP was independently associated
with increased HF Mortality
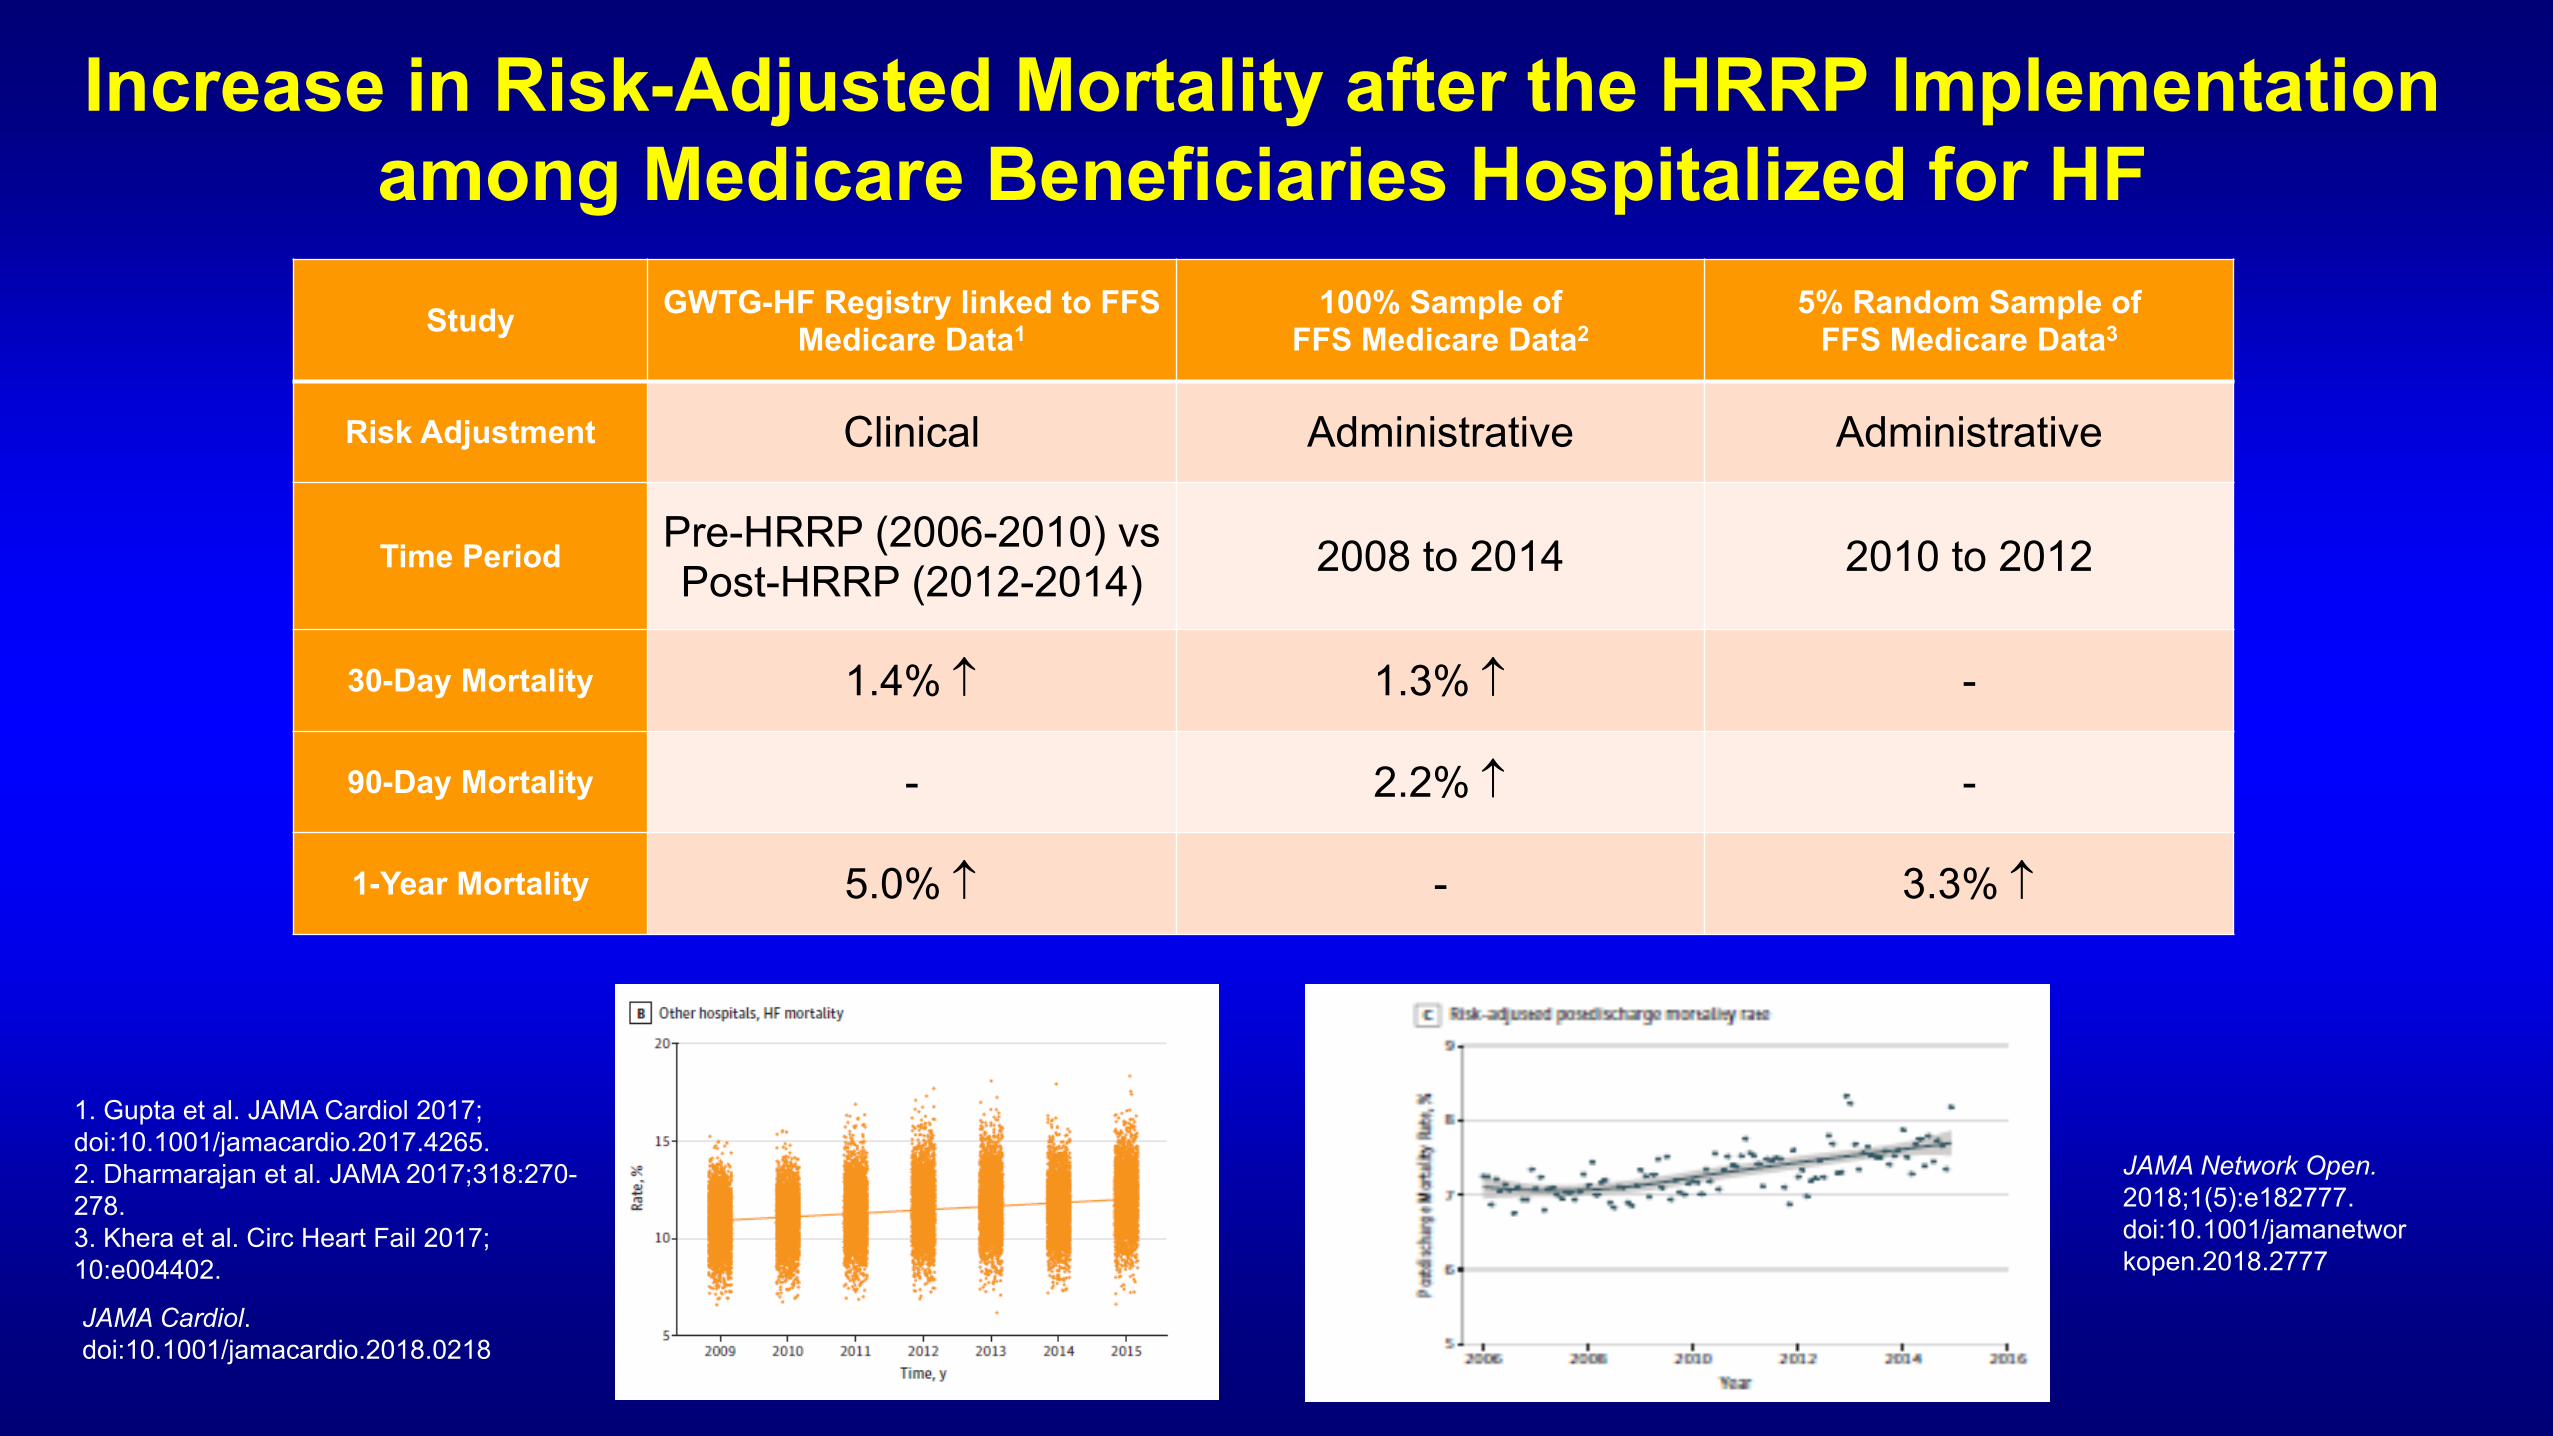
Increase in Risk-Adjusted Mortality after the HRRP Implementation among Medicare Beneficiaries Hospitalized for HF
Study GWTG-HF Registry linked to FFS Medicare Data1
100% Sample of FFS Medicare Data2
5% Random Sample of FFS Medicare Data3
Risk Adjustment Clinical Administrative Administrative
Time Period Pre-HRRP (2006-2010) vs Post-HRRP (2012-2014) 2008 to 2014 2010 to 2012
30-Day Mortality 1.4% ↑ 1.3% ↑ -
90-Day Mortality - 2.2% ↑ -
1-Year Mortality 5.0% ↑ - 3.3% ↑
1. Gupta et al. JAMA Cardiol 2017; doi:10.1001/jamacardio.2017.4265. 2. Dharmarajan et al. JAMA 2017;318:270-278. 3. Khera et al. Circ Heart Fail 2017; 10:e004402.
JAMA Cardiol. doi:10.1001/jamacardio.2018.0218
JAMA Network Open. 2018;1(5):e182777. doi:10.1001/jamanetworkopen.2018.2777
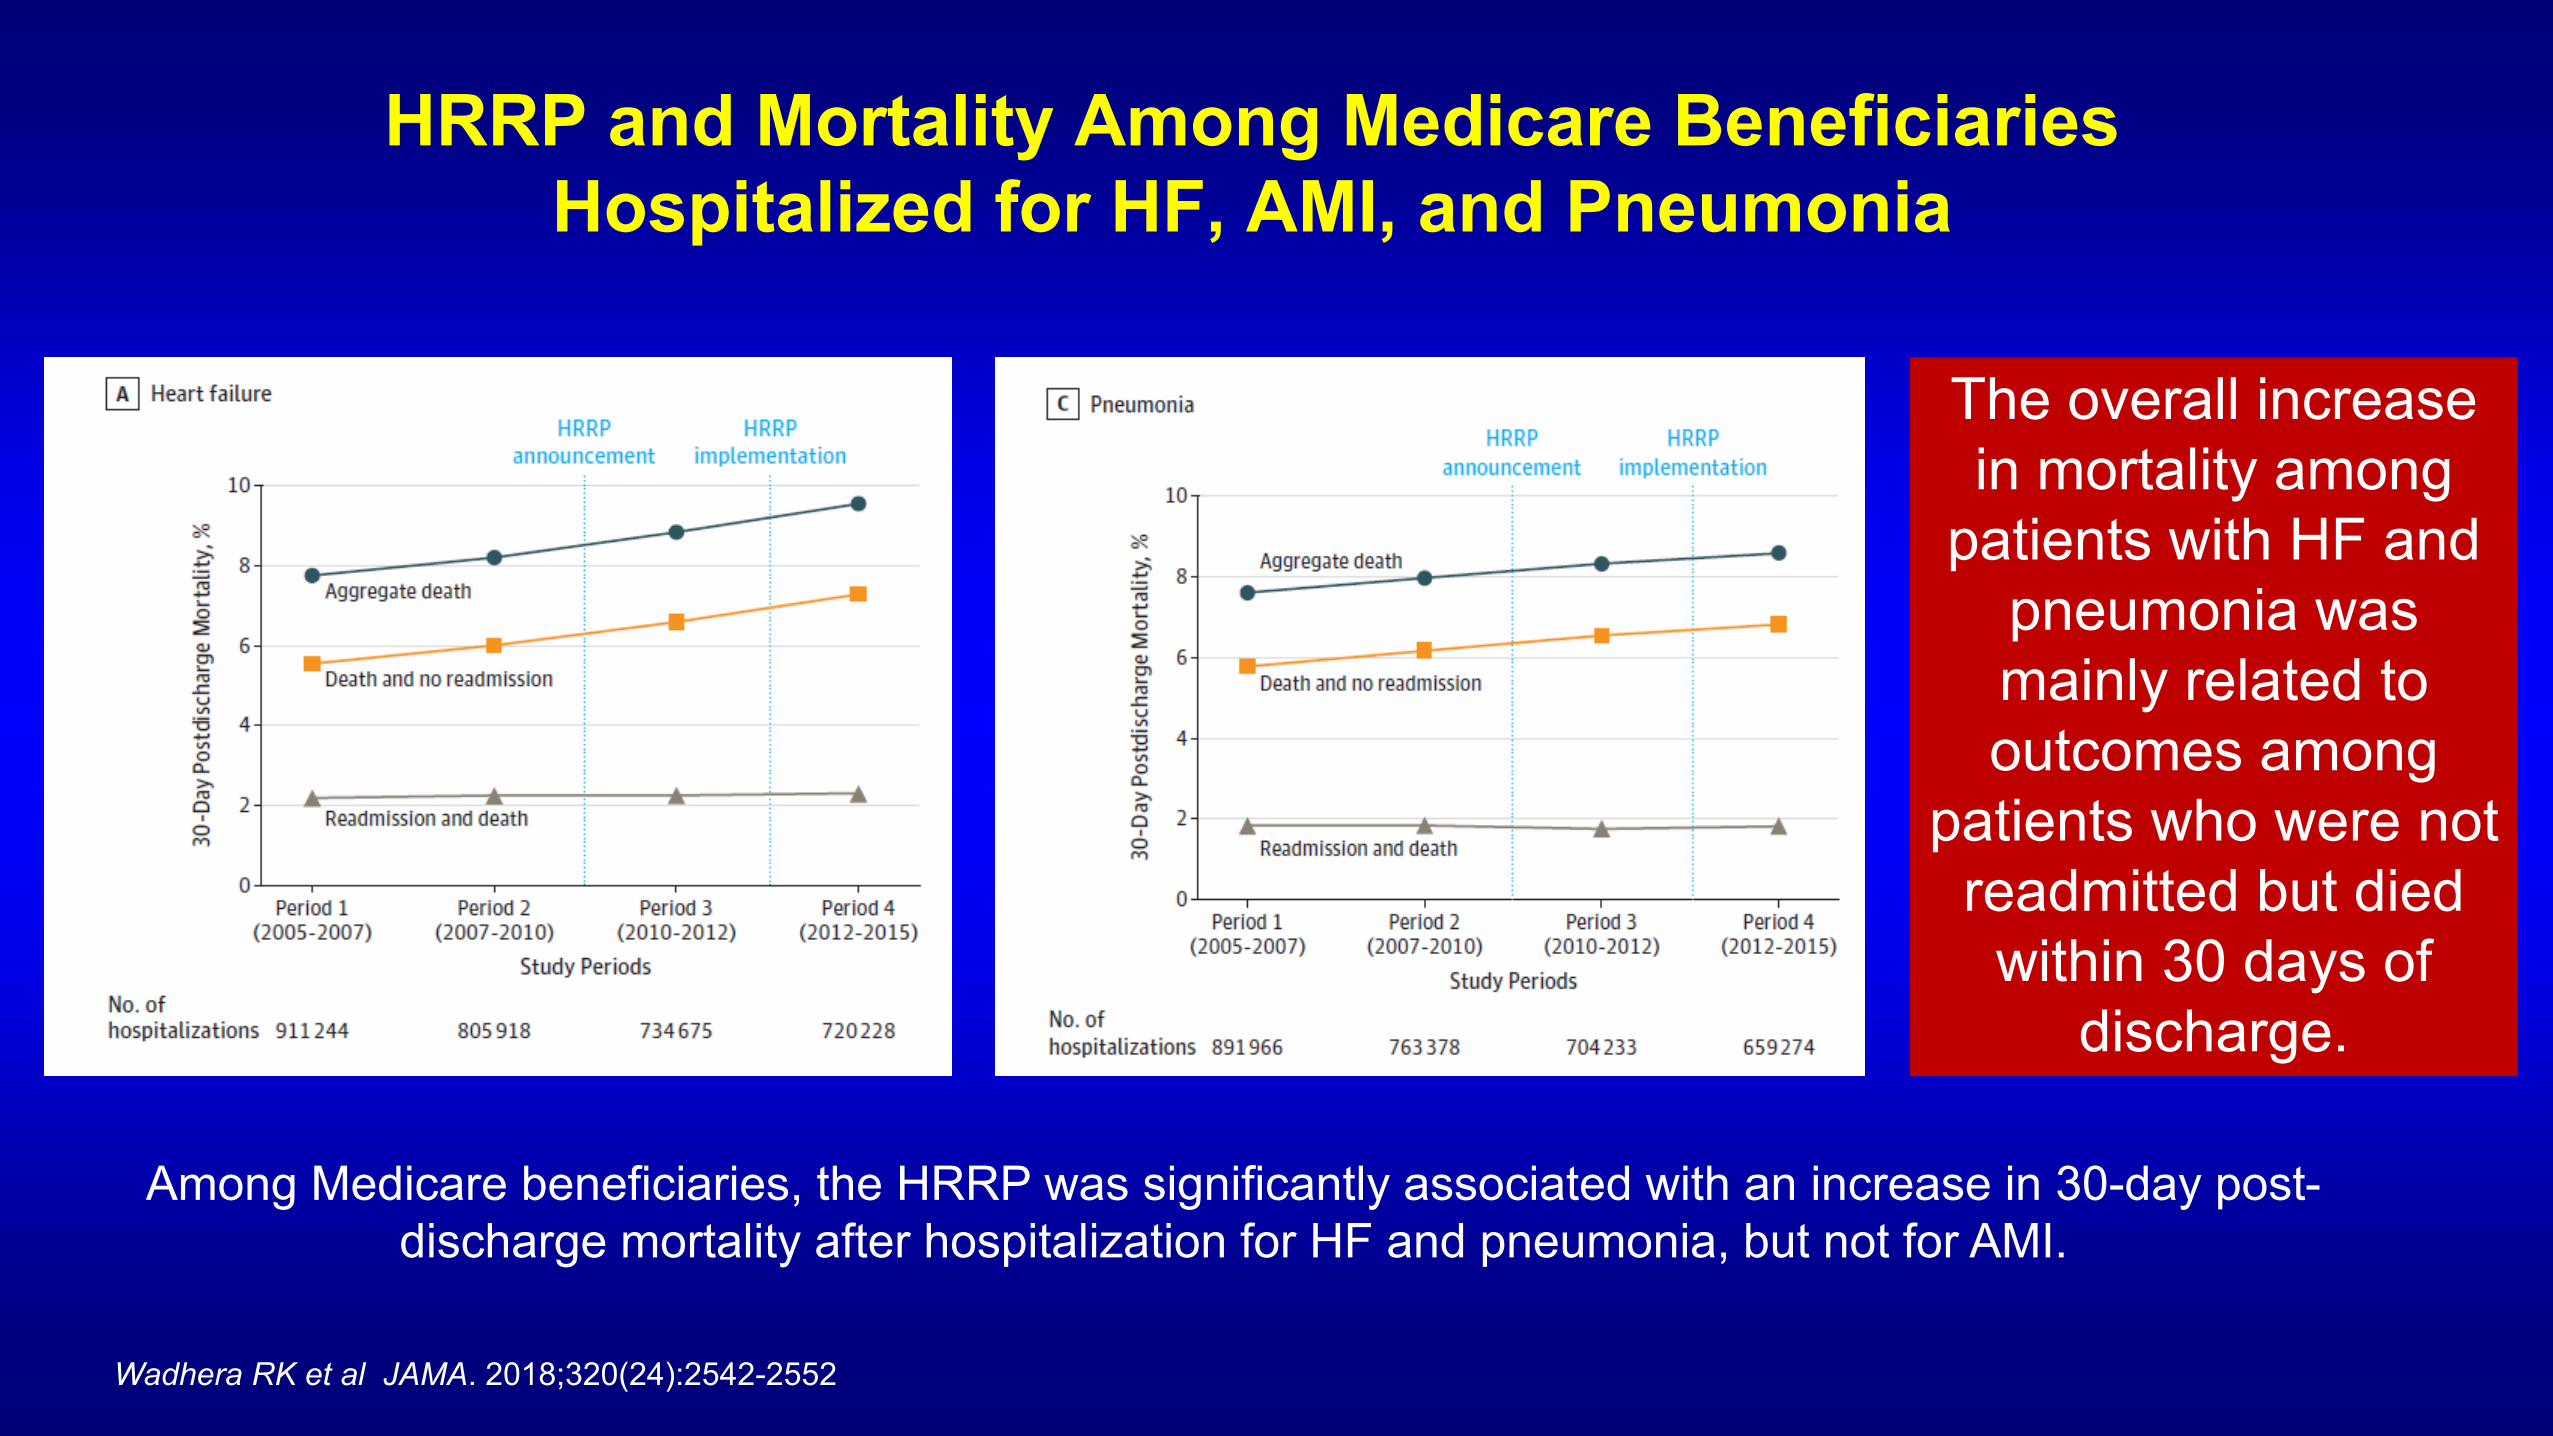
HRRP and Mortality Among Medicare Beneficiaries Hospitalized for HF, AMI, and Pneumonia
Among Medicare beneficiaries, the HRRP was significantly associated with an increase in 30-day post-discharge mortality after hospitalization for HF and pneumonia, but not for AMI.
Wadhera RK et al JAMA. 2018;320(24):2542-2552
The overall increase in mortality among
patients with HF and pneumonia was mainly related to outcomes among
patients who were not readmitted but died
within 30 days of discharge.

Khera et al. Circulation: Heart Failure. 2017;10:e004402
HRRP
Risk-Adjusted Mortality Trends for Medicare Beneficiaries: Was it Just “Sicker” Patients Now Being Hospitalized
Increase in the age-adjusted rate from 2012 through 2014 was significantly (P<0.05). Ni H, Xu JQ. Recent trends in heart failure-related mortality: United States, 2000–2014. NCHS data brief, no 231. Hyattsville, MD: National Center for Health Statistics. 2015.
HRRP
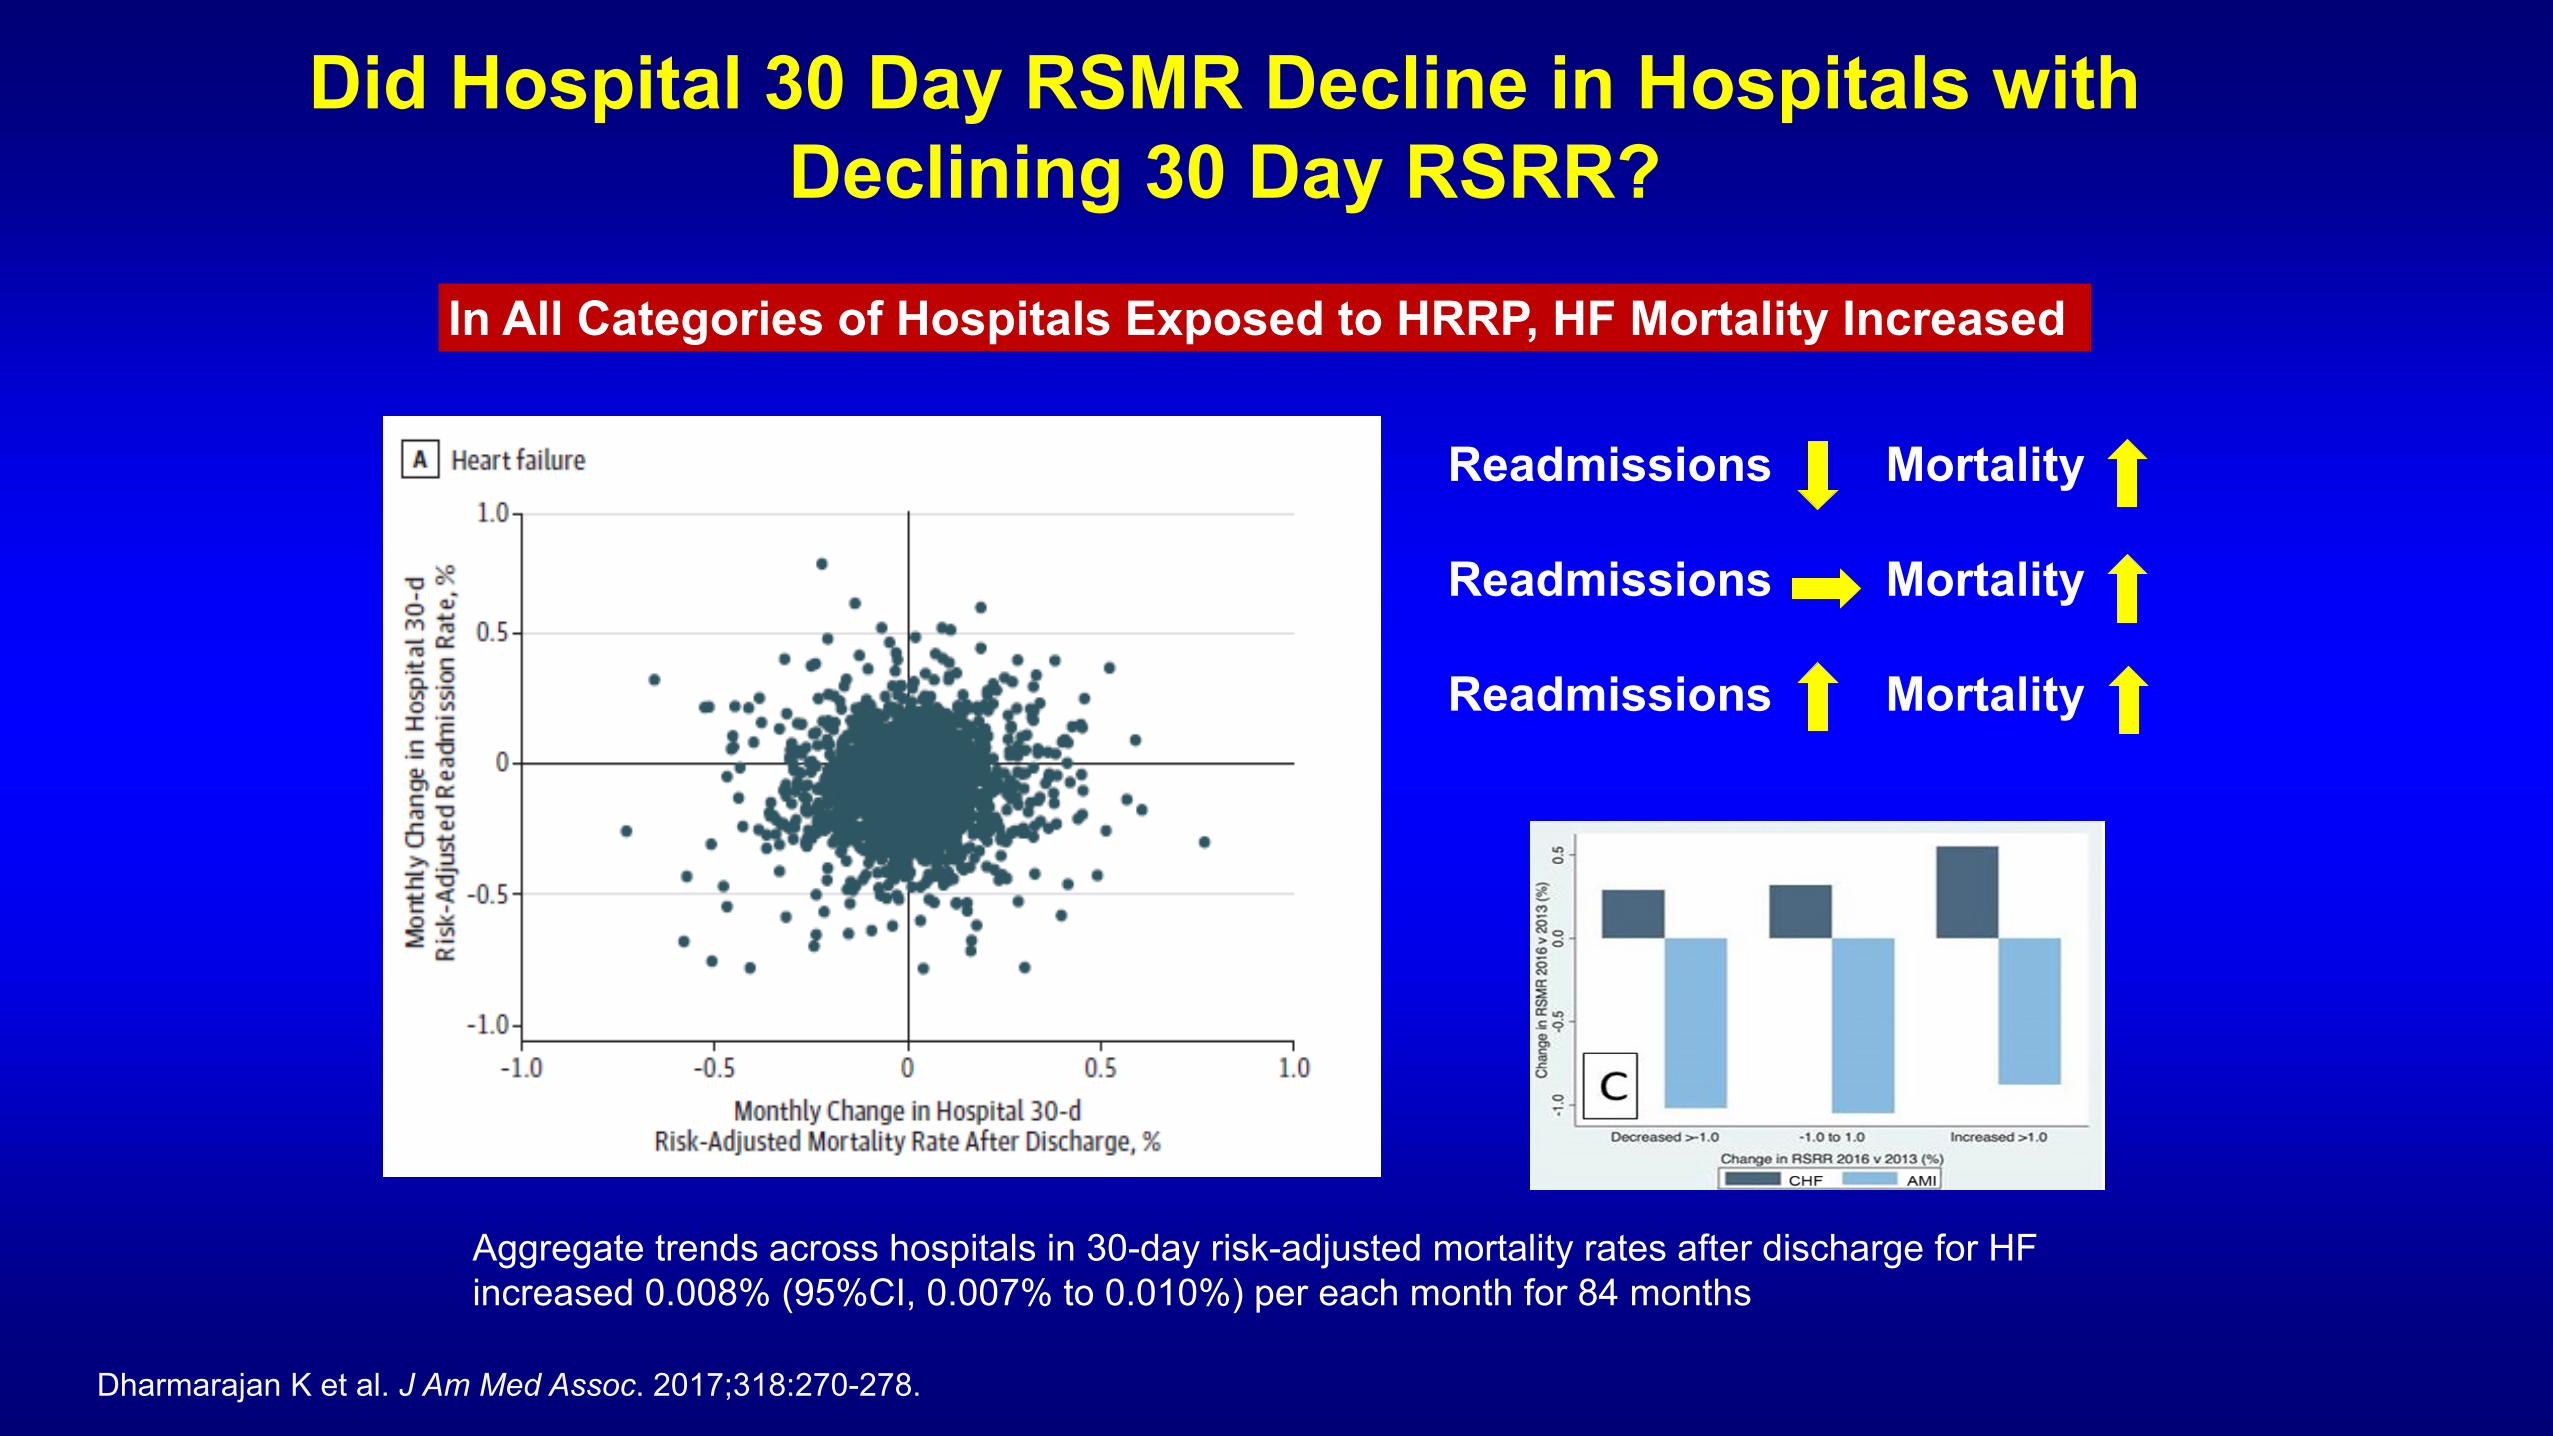
Did Hospital 30 Day RSMR Decline in Hospitals with Declining 30 Day RSRR?
Aggregate trends across hospitals in 30-day risk-adjusted mortality rates after discharge for HF increased 0.008% (95%CI, 0.007% to 0.010%) per each month for 84 months
Dharmarajan K et al. J Am Med Assoc. 2017;318:270-278.
Readmissions Readmissions Readmissions
Mortality Mortality Mortality
In All Categories of Hospitals Exposed to HRRP, HF Mortality Increased

MedPAC Report to Congress
Medicare Payment Advisory Commission. Report to the Congress: Medicare and the Health Care Delivery System. Available at: http://www.medpac.gov/docs/default-source/reports/ jun18_medpacreporttocongress_sec.pdf?sfvrsn¼0.
MedPAC found increased post HRRP mortality for HF patients but attributed this to dramatic increase in severity
Is it plausible that intrinsic mortality risk increased dramatically post HRRP, yet in-hospital unadjusted mortality did not increase, when no change in LOS/transfers out?

“The evidence that HRRP caused the decrease in readmissions is of comparable quality to the evidence that HRRP caused an increase in mortality. It is hard to accept one without accepting the other.”
Ashish K. Jha, MD, MPH JAMA Forum: To Fix the Hospital Readmissions Program, Prioritize What Matters, Dec 20, 2017.

Timing of the Mortality Increase in HF
Khera and Krumholz et al JAMA Network Open. 2018;1(5):e182777. doi:10.1001/jamanetworkopen.2018.2777
30D RSRR Public Reporting
HRRP
30D RSRR Public Reporting
30-day post-DC mortality increased from 7.4% to 9.2% for HF +1.8% (P for trend <.001)
Unadjusted in-hospital mortality not increasing with no change in LOS: no increase in severity
30 Day Mortality for Medicare HF Patients 1999-2010 Unadjusted: -8.1% Adjusted: -16.4%
Krumholz et al Circulation. 2014;130:966-975

30 Day Readmission Metric, HRRP, and HF Outcomes
• HRRP had no causal association with the increase in mortality: mortality still increased
• HRRP only indirectly influenced increased mortality by diverting attention/resources from efforts that could have reduced mortality: mortality still increased
• HRRP incentivized policies that directly resulted in the increased mortality: mortality increased
• No evidence of improved care quality
• No evidence for improved health status/quality of life
• No evidence for improvement in functional status
• No evidence of improved patient satisfaction
• No evidence for reduced financial toxicity for patients
• No evidence of reduced mortality

Patient-Centered Alternatives for HRRP
1. Composite measure of risk adjusted 30-day mortality/readmission as basis for penalties
2. Have penalties for 30-day risk adjusted mortality as large or larger as those for 30-day risk adjusted readmissions
3. Measure, report, and penalize based on HF patient health status (KCCQ) and other patient reported outcome measures (PROMs)
4. Measure, report, and penalize based on index HF admission rates and incident HF rates (prevention)

Long-term Outcomes Q1 High Performing Q2 Q3 Q4
Low Performing
Overall Population
Median Survival, days (95% CI)
717 (700 – 734)
685 (668 – 705)
654 (636 – 674)
579 (565 – 594)
5-year Mortality (%) 75.6 76.2 76.9 79.6
30-day Survivors
Median Survival, days (95% CI)
832 (815 – 852)
825 (805 – 843)
814 (794 – 831)
759 (742 – 779)
5-year Mortality (%) 73.7 73.7 74.3 76.8
A Patient-Centered, Actionable Metric: Hospital Performance by 30-day RSMR and Long-Term Survival in GWTG-HF
22% (95% CI, 18-26) higher relative adjusted hazards of 5-year mortality for patients admitted to Q4 vs Q1 hospitals with extensive risk adjustment for clinical variables
JAMA Cardiol. doi:10.1001/jamacardio.2018.0579
High Performing Hospitals (lower 30-day RSMR) had greater availability of advanced HF therapies, cardiac surgery, and PCI and provided higher care quality by process measures
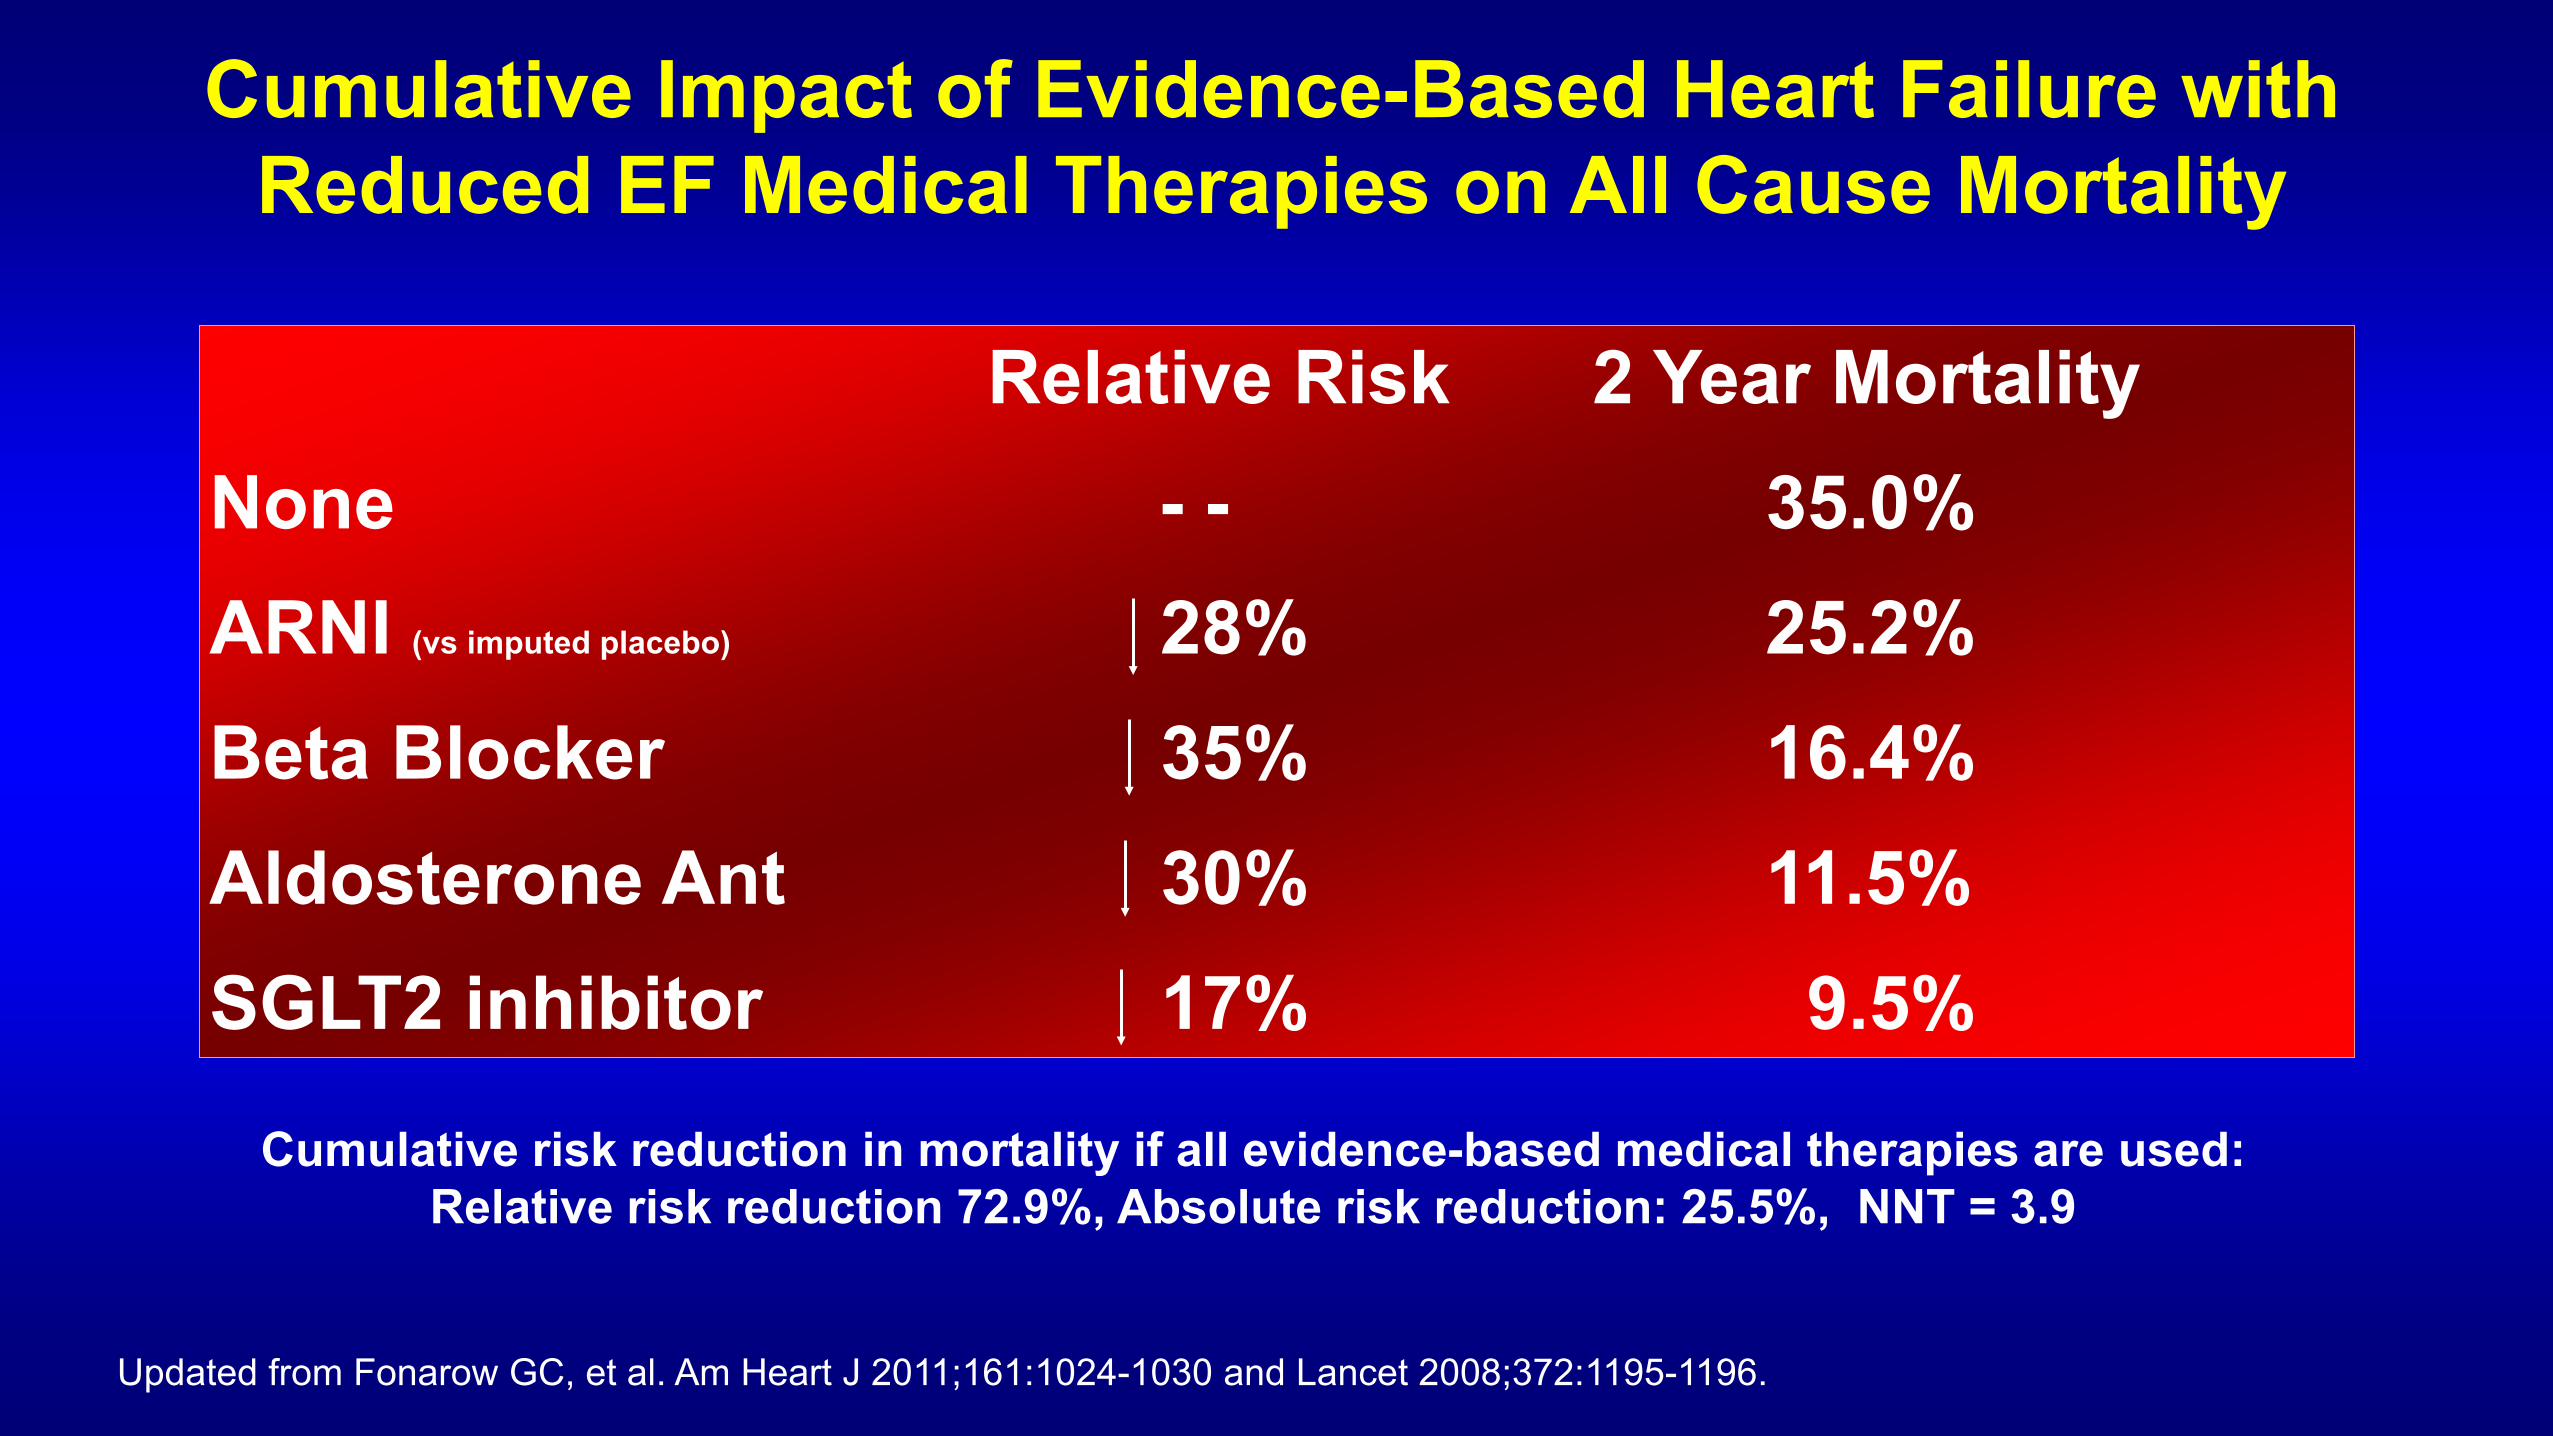
Cumulative Impact of Evidence-Based Heart Failure with Reduced EF Medical Therapies on All Cause Mortality
Cumulative risk reduction in mortality if all evidence-based medical therapies are used: Relative risk reduction 72.9%, Absolute risk reduction: 25.5%, NNT = 3.9
Relative Risk 2 Year Mortality None - - 35.0% ARNI (vs imputed placebo) 28% 25.2% Beta Blocker 35% 16.4% Aldosterone Ant 30% 11.5% SGLT2 inhibitor 17% 9.5%
Updated from Fonarow GC, et al. Am Heart J 2011;161:1024-1030 and Lancet 2008;372:1195-1196.

Potential Impact of Optimal Implementation of Evidence-Based HF Therapies on Mortality
Updated from Fonarow GC, et al. Am Heart J 2011;161:1024-1030.
Guideline Recommended
Therapy
HF Patient Population
Eligible for Treatment,
n*
Current HF
Population Eligible
and Untreated, n
(%)
Potential Lives
Saved per Year
Potential Lives Saved
per Year
(Sensitivity Range*)
ACEI/ARB 2,459,644 501,767 (20.4) 6516 (3336-11,260)
Beta-blocker 2,512,560 361,809 (14.4) 12,922 (6616-22,329)
Aldosterone Antagonist 603,014 385,326 (63.9) 21,407 (10,960-36,991)
Hydralazine/Nitrate 150,754 139,749 (92.7) 6655 (3407-11,500)
CRT 326,151 199,604 (61.2) 8317 (4258-14,372)
ICD 1,725,732 852,512 (49.4) 12,179 (6236-21,045)
Total - - 67,996 (34,813-117,497)
ARNI (replacing ACEI/ARB) 2,459,644 2,459,644 (100) 30,366 (15,183-45,549)

Conclusions • The 30 day readmission metric and HRRP have important flaws in measuring
quality and driving patient benefit
• The financial penalties surrounding this metric have created incentives for suboptimal care, by side-stepping the best interests of the patient, incentivizing denial of necessary care, eliminating or downplaying offsetting quality measures, and denying resources to the most vulnerable patients and hospitals
• HRRP has not only not improved outcomes in HF, it has been associated with the ultimate harm, increased mortality
• The HRRP as it involves HF patients should be revised or replaced
• It is critical to move away from artificial metrics and penalties and toward greater direct responsibility of health care systems for quality and efficiency, with rewards linked to longer-term patient benefit, through innovative approaches to care